Article

The Effect of Hot Wind on Needle and Stem Water Status: Response Strategies in Resprouting and Non-Resprouting Pine Species

1
Departamento de Sistemas y Recursos Naturales, Universidad Politécnica de Madrid, José Antonio Novais 10, 28040 Madrid, Spain
2
Research Group: Functioning of Forest Systems in a Changing Environment (FORESCENT), Universidad Politécnica de Madrid, José Antonio Novais 10, 28040 Madrid, Spain
*
Author to whom correspondence should be addressed.
Forests 2023, 14(11), 2174; https://doi.org/10.3390/f14112174
Submission received: 4 October 2023 / Revised: 27 October 2023 / Accepted: 30 October 2023 / Published: 1 November 2023
(This article belongs to the Special Issue Abiotic Stress in Tree Species)

Abstract

:
High temperatures threaten tree survival and regeneration. A few pine species, such as Pinus oocarpa and Pinus canariensis, resprout after complete defoliation, a likely consequence of evolving in volcanic environments. Pinus pinea and Pinus pinaster rely on other mechanisms to survive wildfires. We hypothesized that the needle water potential (Ψ) and needle osmotic potential (Ψs) would decrease more under hot wind in resprouting species, a strategy of needle sacrifice in accordance with the hydraulic segmentation hypothesis. We submitted two-year-old seedlings to a two-phase hot wind treatment, consisting of one hour at 39 °C followed by five minutes at 70 °C. Phase 2 killed all needles. In non-resprouting species, Ψ decreased steeply at the beginning of Phase 1 and remained between −2 MPa and −4 MPa afterward, maintaining the loss of stem hydraulic conductance below the 50% threshold. On average, resprouting species had 15% lower wood densities and kept 51% higher stem water contents than non-resprouting species after Phase 2. The loss of hydraulic conductance did not affect resprouting. The increase in hydraulic conductance toward the base of the stem was lowest in P. canariensis, suggesting a lower degree of conduit tapering in the only species that had not undergone heteroblastic change. We measured the lowest Ψ and highest Ψs in the most xeric P. canariensis and the opposite in the most mesic P. oocarpa, highlighting the roles of xylary and extra-xylary hydraulic resistances in compartmentalizing the needle to preserve the stem. The measurement of both Ψ and Ψs allowed us to characterize the strategies of response to hot wind in resprouting and non-resprouting pine species.

1. Introduction

The persistence of tree species after severe disturbances such as fire or under extreme climatic conditions depends on successful regeneration. At the early stages of development and during the first years after being established, seedlings have smaller thermal and hydraulic safety margins than adults [1,2], implying higher sensitivity to climate extremes. Although drought is often considered the most limiting factor for the survival of young seedlings, near the ground, the air can heat up to lethal temperatures under full sun, compromising seedling development and the survival of some species [3]. Land cover, soil moisture content, and albedo are key factors affecting soil surface temperatures [4,5]. Seedling survival is strongly impacted by high surface temperatures in many environments [6,7]. In particular, semi-arid environments, with low canopy cover and exposed to high levels of solar radiation, and forest stands after fires experience the highest surface temperatures [8]. In these environments, seedlings are extremely sensitive to high temperatures since they cannot access deep groundwater layers, unlike large trees, and have a thinner bark with limited isolation properties. Understanding the mechanisms underlying the resistance to extreme temperatures is important to predict the effects of more frequent wildfires and heat waves during the early stages of development.
Seedling tolerance to high temperatures increases with age, size, and previous exposure to high temperatures [7]. Temperature thresholds for tissue damage also differ among species and between organs and depend on the duration of exposure [9]. In Pinus ponderosa seedlings, this threshold was 63 °C [10], and spruce seedlings died at 55 °C [11]. In eight Australian species, leaf damage ranged from 47 °C to 54 °C, and it correlated with the temperature of the hottest month at the origin of the seedlings [12]. Growing tissues cannot survive extended periods with temperatures above 45 °C [11], and as the temperature rises, the duration of exposure is increasingly important. At 50 °C, the mortality threshold of Pseudotsuga menziesii was 200 min, at 55 °C 25 min, and only 1 min at 60 °C [3].
High temperatures affect seedlings via direct thermal damage [13] and increasing evaporative demand. According to Grossiord et al. [14], a typical temperature increase from 25 °C to 35 °C during extreme heat waves would result in an increase in vapor pressure deficit (VPD) of 2.0 kPa. Under temperatures close to 40 °C, as those reached during some of the worst heat waves in Europe [15], VPD would increase further. A higher VPD entails more water loss via transpiration, which helps to cool the leaves [10]. Evaporative cooling from high stomatal conductance can maintain the seedling temperature below damaging thresholds if water is available and the capacity of the hydraulic system is enough to maintain high levels of transpiration [16,17]. Seedlings with high stomatal conductance can maintain leaf temperatures of 10 °C below the ambient temperature, and even more, sap flow through the stem can absorb enough energy to reduce stem temperature by 30 °C [10]. If trees can access enough water, they are able to cope well with high temperatures, as shown in Eucalyptus parramattensis trees, which maintained a completely functional hydraulic system when subjected to 43 °C, thanks to their deep root system [18]. On the contrary, if water is scarce or temperatures exceed certain thresholds, cellular damage occurs, and long-distance water transport is impaired, increasing the risk of runaway embolism [14]. In this regard, the threshold for recovery failure in conifer species has been established at the water potential inducing a 50% loss in hydraulic conductance (P50), while angiosperms could tolerate up to 88% embolism in the stem [19].
Several studies highlight the relevance of tree hydraulics for survival after low-intensity fires (see [20,21] for further references). Fire heat plumes rapidly increase VPD far above normal conditions [21] and, consequently, create steep gradients of water potential within the plant to increase water uptake and maintain tissue hydration [22]. The decrease in xylem water potential caused by heat may result in a substantial xylem embolism of distal branches because of hydraulic segmentation [20] or earlier foliage mortality rather than xylem embolism formation in species less vulnerable to heat [23]. The hydraulic segmentation hypothesis is based on the premise that distal organs such as leaves are more expendable than trunks. In fact, the tendency to shed leaves during drought is considered evidence of hydraulic segmentation [24].
Resistance to high temperatures or hot and desiccant winds may depend on different mechanisms in resprouting and non-resprouting species. Resprouting species may survive total defoliation caused by different kinds of disturbances, including crown fires, since they can recover from vegetative tissues after severe injury, whereas non-resprouting species rely entirely on seeds to persist [25]. Mediterranean species are particularly well adapted to resist the combination of high summer temperatures, drought, and recurrent fires [26,27,28,29] and may be better adapted to withstand the effects of hot wind than trees native to humid regions. Although most pine species do not rely on resprouting but rather on other mechanisms to survive fire, such as serotiny, thick bark, and self-pruning, a few species extensively resprout after disturbances [30]. Pinus canariensis C.Sm. ex DC. and P. oocarpa Schiede ex Schltdl. can resprout from epicormic buds, probably as an adaptation to major trauma caused by lithic clast impacts and massive defoliation under high-temperature ash clouds generated during volcanic eruptions [31]. Epicormic buds are located near the bark surface and connected with the vascular system of the shoot. Thus, their survival may depend on the ability of the stem to transport and store water. After severe disturbances causing total defoliation, such as fire, these dormant buds can vigorously resprout to restore the canopy, as repeatedly shown by Pinus canariensis, a species endemic to the Canary Islands. In its natural habitat, P. canariensis can survive even on high-altitude volcanic soils with very little water-holding capacity [32] and places with an annual rainfall lower than 300 mm [32,33]. This species keeps primary needles for a longer time than most other pines [34], and the advantages of such delayed heteroblastic change remain to be fully elucidated. Pinus oocarpa has a large natural distribution area in the sub-tropical forests of Central America, where it covers a wide altitudinal range, with annual precipitations ranging from 500 to 2000 mm [35].
The objective of our study was to compare the functional strategies of seedlings of these two resprouting pines to cope with hot desiccant air with two other non-resprouting Mediterranean pines: Pinus pinea L. and Pinus pinaster Ait. Pinus pinea grows in low-nutrient sandy soils in stands with low tree density where understory vegetation is limited by water and nutrient deficit [36]. No changes in xylem structure or plant hydraulics after burning were observed in adult trees of this species after prescribed burning, highlighting its great resistance to surface fires [37]. Pinus pinaster grows in a wide range of ecological conditions and shows high intraspecific variability in drought resistance and fire resilience [38,39]. Stomatal closure in this species maintains needle water potential above critical values of hydraulic failure during drought or high VPD [40]. Mediterranean forests are expected to experience more frequent and severe fires and heatwaves in the coming decades [26,41,42], which may further accelerate landscape transformations. Predictions of future landscape conversion will require identifying the environmental conditions under which regeneration is possible.
In this present study, we aimed to assess the short-term response to hot wind of these four species, focusing on the dynamics of needle and stem water relations. We hypothesized that (i) the negative effect of hot wind on needle water status would be higher in resprouting species, allowing differentiation between a strategy of needle sacrifice in resprouting species and a strategy of needle preservation in non-resprouting species; (ii) needle sacrifice will contribute to keeping stem xylem embolism below the 50% threshold and a comparatively high stem water content to ensure resprouting after 100% leaf scorch; and (iii) seedlings from non-resprouting species will experience a limited decrease in needle water potential under moderately high temperatures to promote water transport for needle maintenance.

2. Materials and Methods

2.1. Plant Material and Experimental Design

Forty-eight 2-year-old plants of four pine species (P. canariensis, P. oocarpa, P. pinea, and P. pinaster) were grown in 5-liter pots filled with a mixture of peat (TKS2, Floragard Vertriebs GmbH, Oldenburg, Germany) and perlite (3:1; v/v). Plants were grown inside a greenhouse in Madrid, Spain, under natural sunlight (maximum PPFD around 1500 μmol m−2 s−1) from 3 November to 9 February. Air temperature was continuously recorded with a Lambrecht Thermo-Hygrograph and ranged between 10 °C and 28 °C. Plants were watered every four–five days in order to maintain a close-to-the-optimum water status. The latter was supported by the range of values of water potential and needle-relative water content measured before starting the hot wind treatment. At the end of the experiment, the basal stem diameter measured below the bark was higher in P. canariensis (4.7 ± 0.28 mm) and P. pinea (4.5 ± 0.29 mm) than in P. oocarpa (3.7 ± 0.21 mm) and P. pinaster (3.0 ± 0.11 mm).
From 19 January to 26 January, five plants per species (two to four plants per day) were submitted to a two-step hot wind treatment. During Phase 1, we applied hot wind with a heating fan tower placed at approximately 30 cm of the plant for one hour. Air temperature measured at the distance at which the plant was placed was t = 39 °C. We carried out these measurements inside the laboratory to avoid direct solar heating of the needles.
During Phase 2, we applied extremely hot wind (t = 70 °C) by keeping next to the needles a switched-on professional hairdryer, running from the apex to the base, by steps of five minutes, covering the whole length of the stem and whole length of the needles. We had previously run some preliminary trials to define the time of exposure and heating device best suited to guarantee a 100% leaf scorch after Phase 2.

2.2. Measurements

During Phase 1, we quantified needle water status by periodically measuring needle water potential, needle osmotic potential, and needle water content. Needles were always collected from the upper half of the plant and the side of the plant facing the heater. All measurements were carried out in primary and/or secondary needles for P. canariensis, as secondary needles were scarce in this species and only secondary needles for the rest of the species. Needles were taken from five different seedlings in all cases except for secondary needles in P. canariensis (n = 2–3 plants). Except when otherwise explicitly indicated, we collected fully developed non-tender needles.

2.3. Needle Water Potential and Needle Osmotic Potential

Needle water potential was measured with a Scholander-type pressure chamber (PMS Instrument Co., Albany, OR, USA) in needles cut at approximately 10 min time intervals. No water potentials below −5.6 MPa were measured, so we could keep the pace of 10 min between measurements in each plant. Thus, all values equal to −5.6 MPa in Figure 1 correspond to lower but unknown water potentials. We calculated the maximum rate of decrease in Ψ using linear equations fitted to data measured during the first 15 min of hot wind for all species except P. canariensis, the only one in which Ψ reached values below −5.6 MPa.
To determine needle osmotic potential (Ψs), a sub-sample of 6 needles per plant was taken at 0, 30, and 60 min after starting Phase 1. Needles were cut into small pieces, wrapped in aluminum foil, frozen in liquid nitrogen, and kept at −80 °C. After thawing, Ψs was measured with a psychrometer–hygrometer (C-52 sample chamber Wescor) connected to a dew point microvoltmeter (HR-33T, Wescor, Logan, UT, USA).

2.4. Needle Water Content

Needles used to determine relative water content (RWC), water content (WC), and leaf dry matter content (LDMC) were collected before starting Phase 1 and after 30 and 60 min of hot wind (n = 2–11 needles per plant). Needles were weighed (FW) and placed in the dark at room temperature (ca. 18–20 °C), with their base immersed in water for approximately 20 h, then re-weighed (SW) and oven dried at 60 °C up to constant weight (DW). The lapse of time to achieve full needle rehydration was determined in a preliminary trial. Relative water content was calculated as RWC = (FW − DW) × (SW − DW)−1. Needle water content (WC) was determined on a dry-weight basis as WC = (FW − DW) × (DW)−1. Leaf dry matter content (LDMC) was calculated after Paula and Pausas (2006) as LDMC = DW × SW−1.
After Phase 2, another sample of 2–6 needles per plant was taken, and needle water content was calculated, as explained before. We did not analyze RWC or LDMC at this time because Phase 2 resulted in needle irreversible turgor loss and thus hampered tissue rehydration.

2.5. Stem Water Status

Stem hydraulic conductance was measured with an XYL’EM embolism meter (Bronkhorst, Montigny les Cormeilles, France) after Phase 2 was completed. We cut five 4 cm long stem segments per plant, evenly spaced through the stem, avoiding the tender apical portions. Stem samples were defoliated, cut, and debarked under water before fitting them into a tubing system. The diameter in the middle of each stem portion was measured with a caliper. A filtered (0.2 μm) solution of 10 mM KCl and 1 mM CaCl2 in deionized, degassed water and a pressure head ≤ 4 kPa was used for all hydraulic measurements. Stem hydraulic conductance was calculated before (Ki) and after (KM) applying the same solution at 0.15 MPa for 15 min, which was sufficient to remove any embolism according to preliminary trials. We used these data to calculate the percentage loss of hydraulic conductance (PLC; %) from PLC = 100 × (KM − Ki) × KM−1. We grouped PLC values into five class intervals, drew a cumulative frequency curve for each species, and fitted logarithmic functions to each set of data points.
Wood density was measured on the same stem segments used for hydraulic measurements. The volume of each stem segment was measured via immersion in water [43], and the segment was then oven-dried at 60 °C for at least 72 h and weighed. Wood density was calculated for each segment from its volume and dry weight. Stem segments adjacent to those used for hydraulic measurements and of similar size were cut from the stem, weighed, and oven dried, as already explained for needles, to calculate stem water content on a dry weight basis.

2.6. Sprouting

The remaining seven plants per species were submitted to the same two-step hot wind treatment and kept inside the greenhouse for two weeks when epicormic resprouting was visually checked.

2.7. Statistical Analyses

We used secondary needles in P. oocarpa, P. pinea, and P. pinaster and fully developed primary needles in P. canariensis for all measurements. For this last species, secondary needles and the most apical newly grown primary needles were also collected when measuring some parameters. For the statistical analyses, data were grouped either into four categories (one per species) or up to six categories, one for each P. oocarpa, P. pinea, and P. pinaster and three for P. canariensis, depending on the parameter measured. For clarity, we will talk about differences between species, though we should strictly talk about groups since we analyzed up to three different types of needles in P. canariensis and only one in the others.
One-way ANOVA was used to analyze differences between species in needle relative water content (RWC), needle osmotic potential (Ψs), and needle water content expressed on a dry weight basis (WC) before starting Phase 1 and after 30 and 60 min of exposure to hot wind. Differences at the end of Phase 2 were analyzed in the same way in all the aforementioned parameters except for RWC because exposure to extremely hot wind led to tissue damage that hampered rehydration. One-way ANOVA was also used to analyze differences between species in stem water content measured at five different heights along the stem at the end of Phase 2.
The combined effect of the species and time of exposure to hot wind on leaf dry matter content (LDMC) and needle water content (WC) was analyzed using factorial ANOVA. Factorial ANOVA was also used to analyze the combined effect of species and height along the stem on the percentage loss of hydraulic conductance and stem density.
General linear models were used to analyze the differences in the slope of the linear relationships between Ψ values measured during the first 15 min of Phase 1 and time and the relationship between log-transformed values of maximum stem hydraulic conductance (KM) and stem diameter. Tukey’s HSD test was used to further analyze differences between groups. Data were checked for normality and homogeneity of variances, and percent values were log-transformed prior to analyses. All statistical analyses were performed using the 6.0 version of STATISTICA (StatSoft, Tulsa, OK, USA).

3. Results

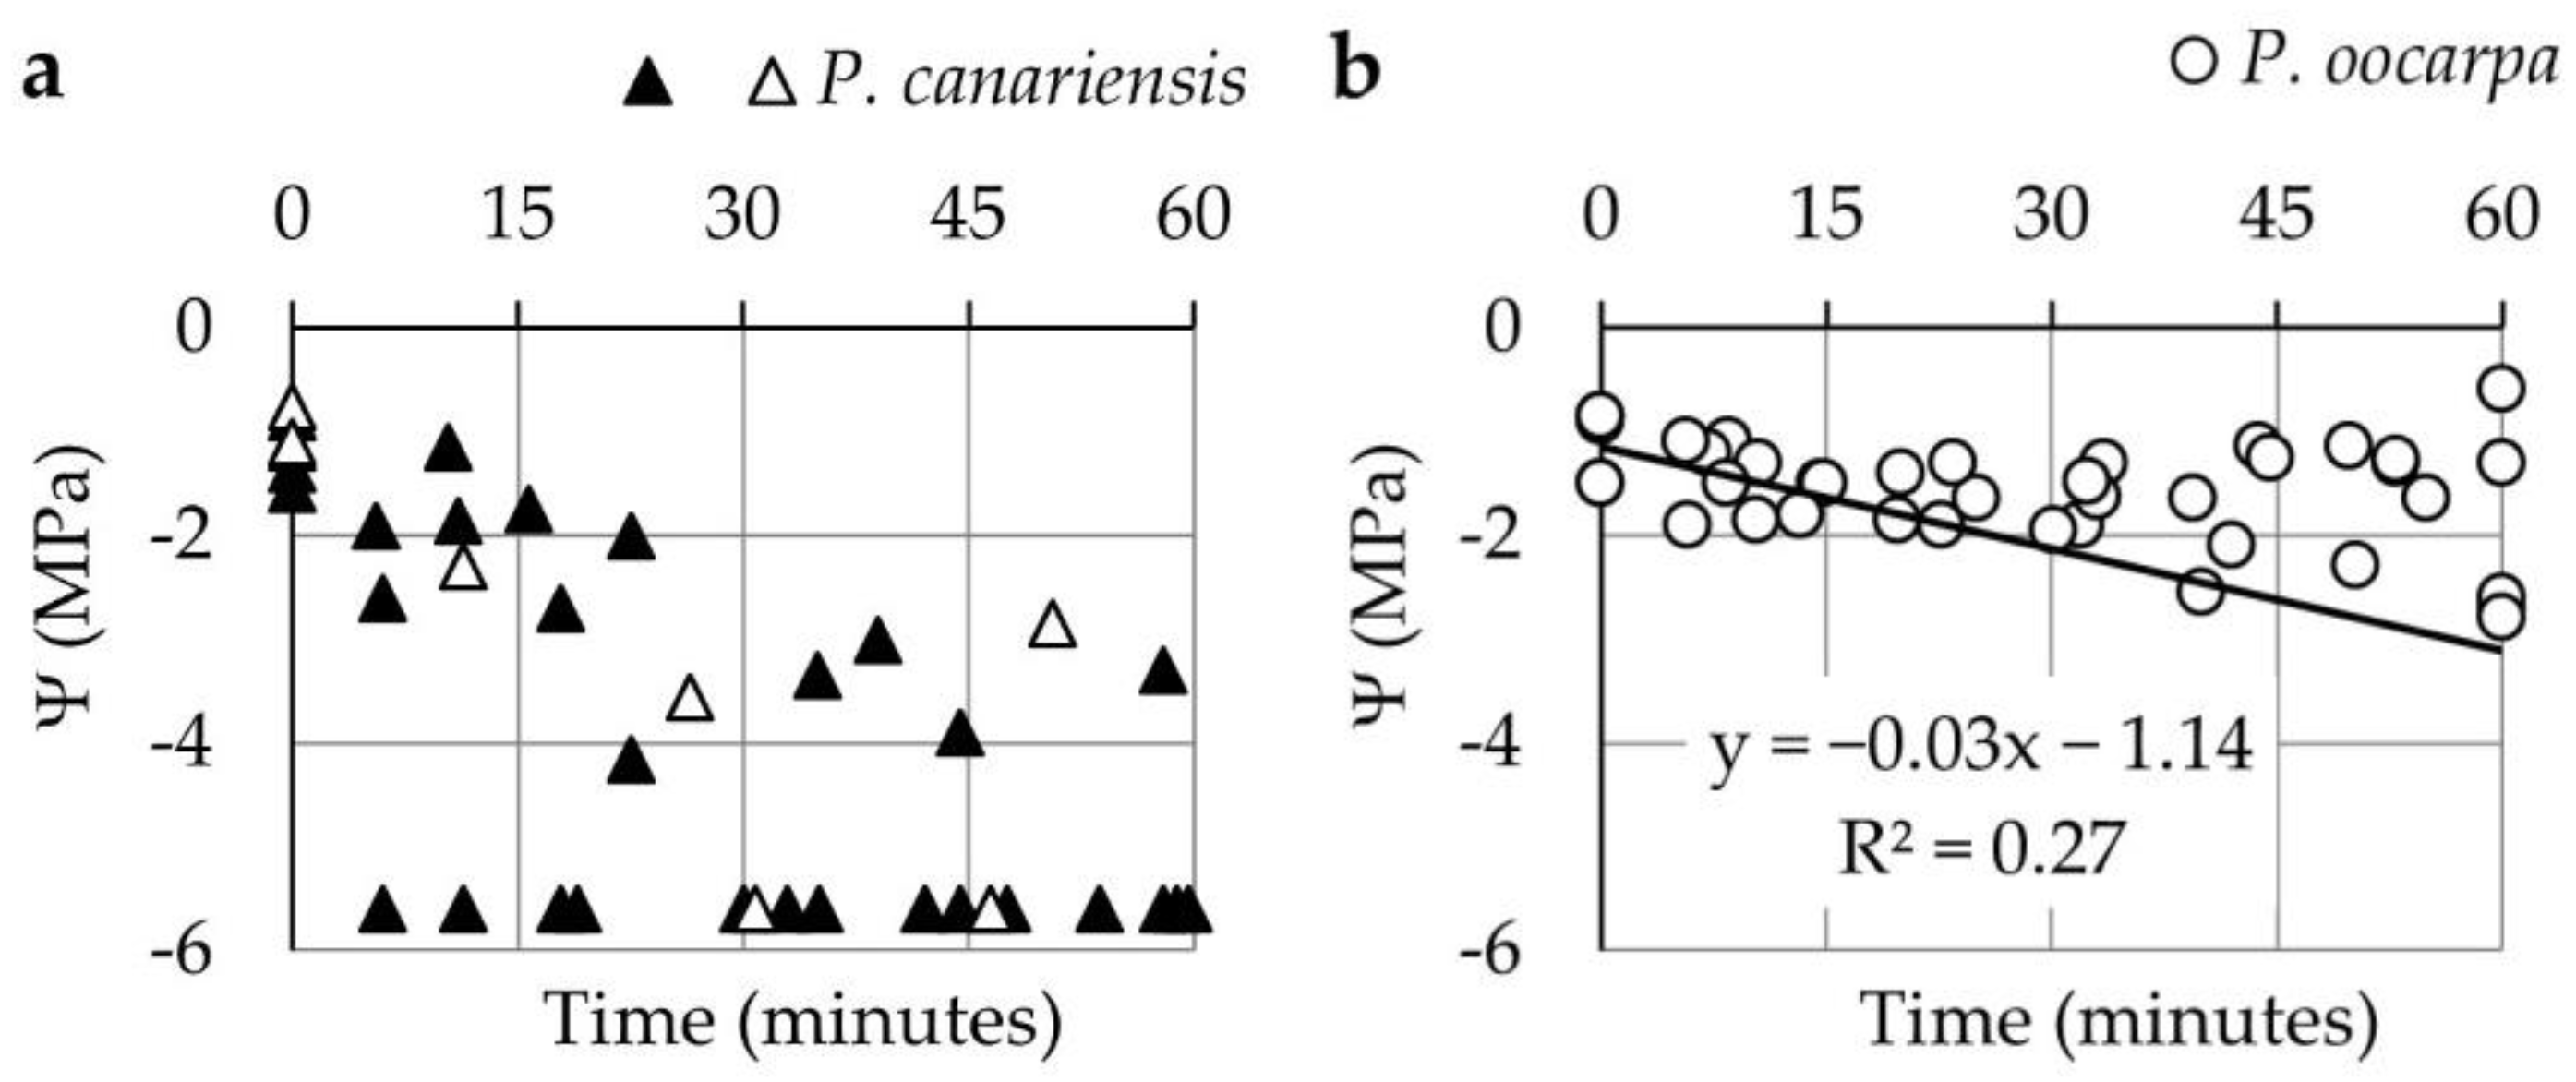
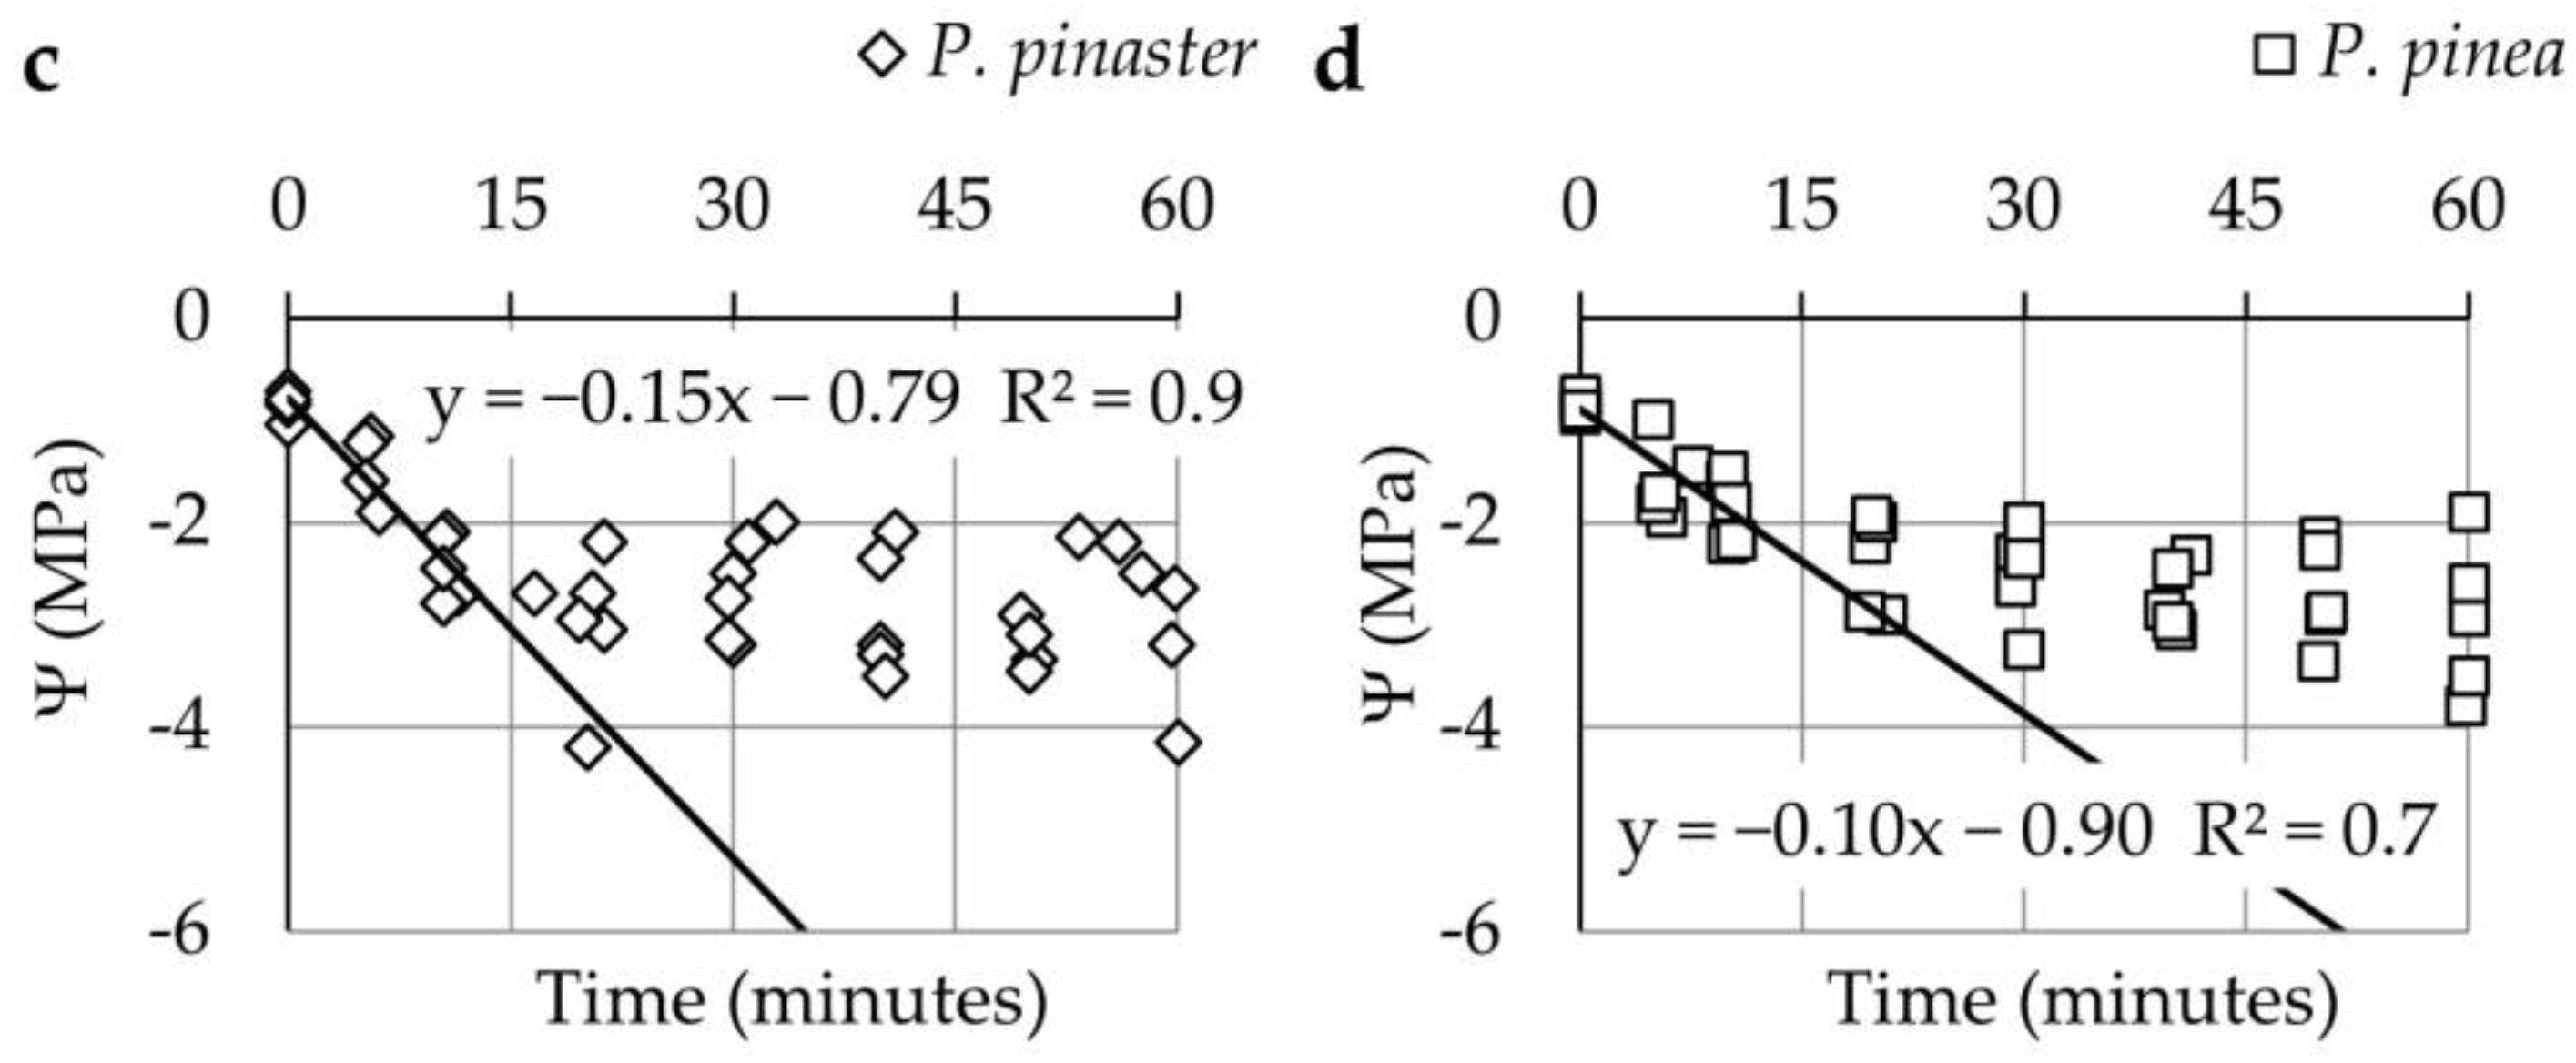
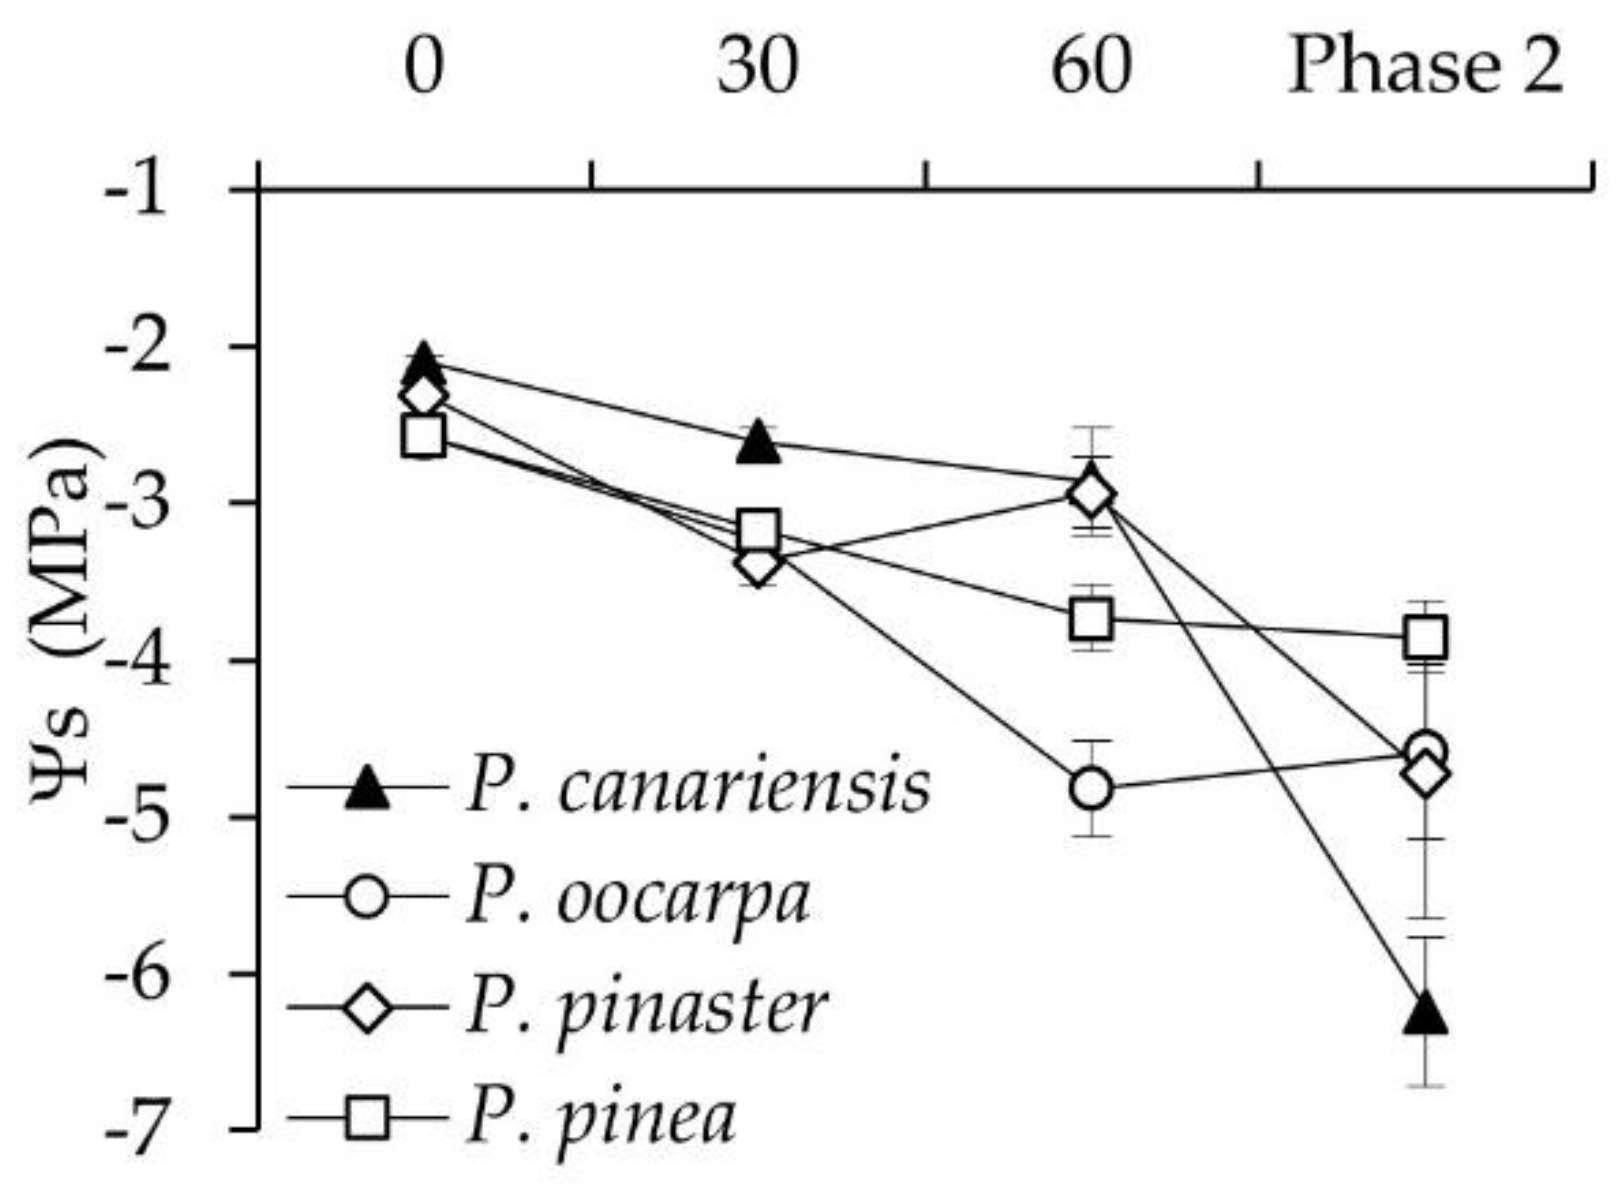
3.1. Changes in Ψ and Ψs during the First and Second Phase of Hot Wind

During the first phase of hot wind, we measured the lowest Ψ in P. canariensis primary and secondary needles (Figure 1a) and the highest in P. oocarpa, where Ψ remained above −2 MPa in 85% of the measured needles (Figure 1b). Both P. pinaster and P. pinea showed a similar response to the first phase of hot wind treatment, with an initial drop in Ψ followed by an almost stable response, where Ψ remained between −2 MPa and −4 MPa (Figure 1c,d).
The rate of decrease in Ψ during the first 15 min of treatment was almost negligible in P. oocarpa, in contrast with what was found for P. pinea and P. pinaster. In fact, the slope of the regression line was scarcely significant for P. oocarpa (p = 0.046) while being highly significant for P. pinaster and P. pinea (p < 0.0001). Differences between these three species in the slope of the regression line were highly significant (F2,38 = 14.8, p < 0.001). By the end of Phase 1, some mesophyll cells had collapsed. This effect was particularly noticeable in P. oocarpa, where the whole mesophyll appeared to have shrunk.
We found significant differences between the species in Ψs before starting Phase 1 (F3,16 = 9.76, p < 0.001) and after 30 (F3,16 = 4.24, p = 0.02) and 60 min (F3,16 = 12.3, p < 0.001) of hot wind. During Phase 1, the highest Ψs values were consistently measured in P. canariensis primary needles and the lowest in P. oocarpa (Figure 2). There were no significant differences between species in Ψs values measured after Phase 2 (F3,16 = 2.75, p = 0.08). Interestingly, we found a slight increase in Ψs between 30 and 60 min of hot wind in P. pinaster (Figure 2). Similar results were observed for RWC measured in different needles from the same plants (Figure 3a). The maximum decrease in Ψs after 60 min of hot wind was measured in P. oocarpa (87%). The decrease for the other three species ranged from 27% to 45% (Figure 2).

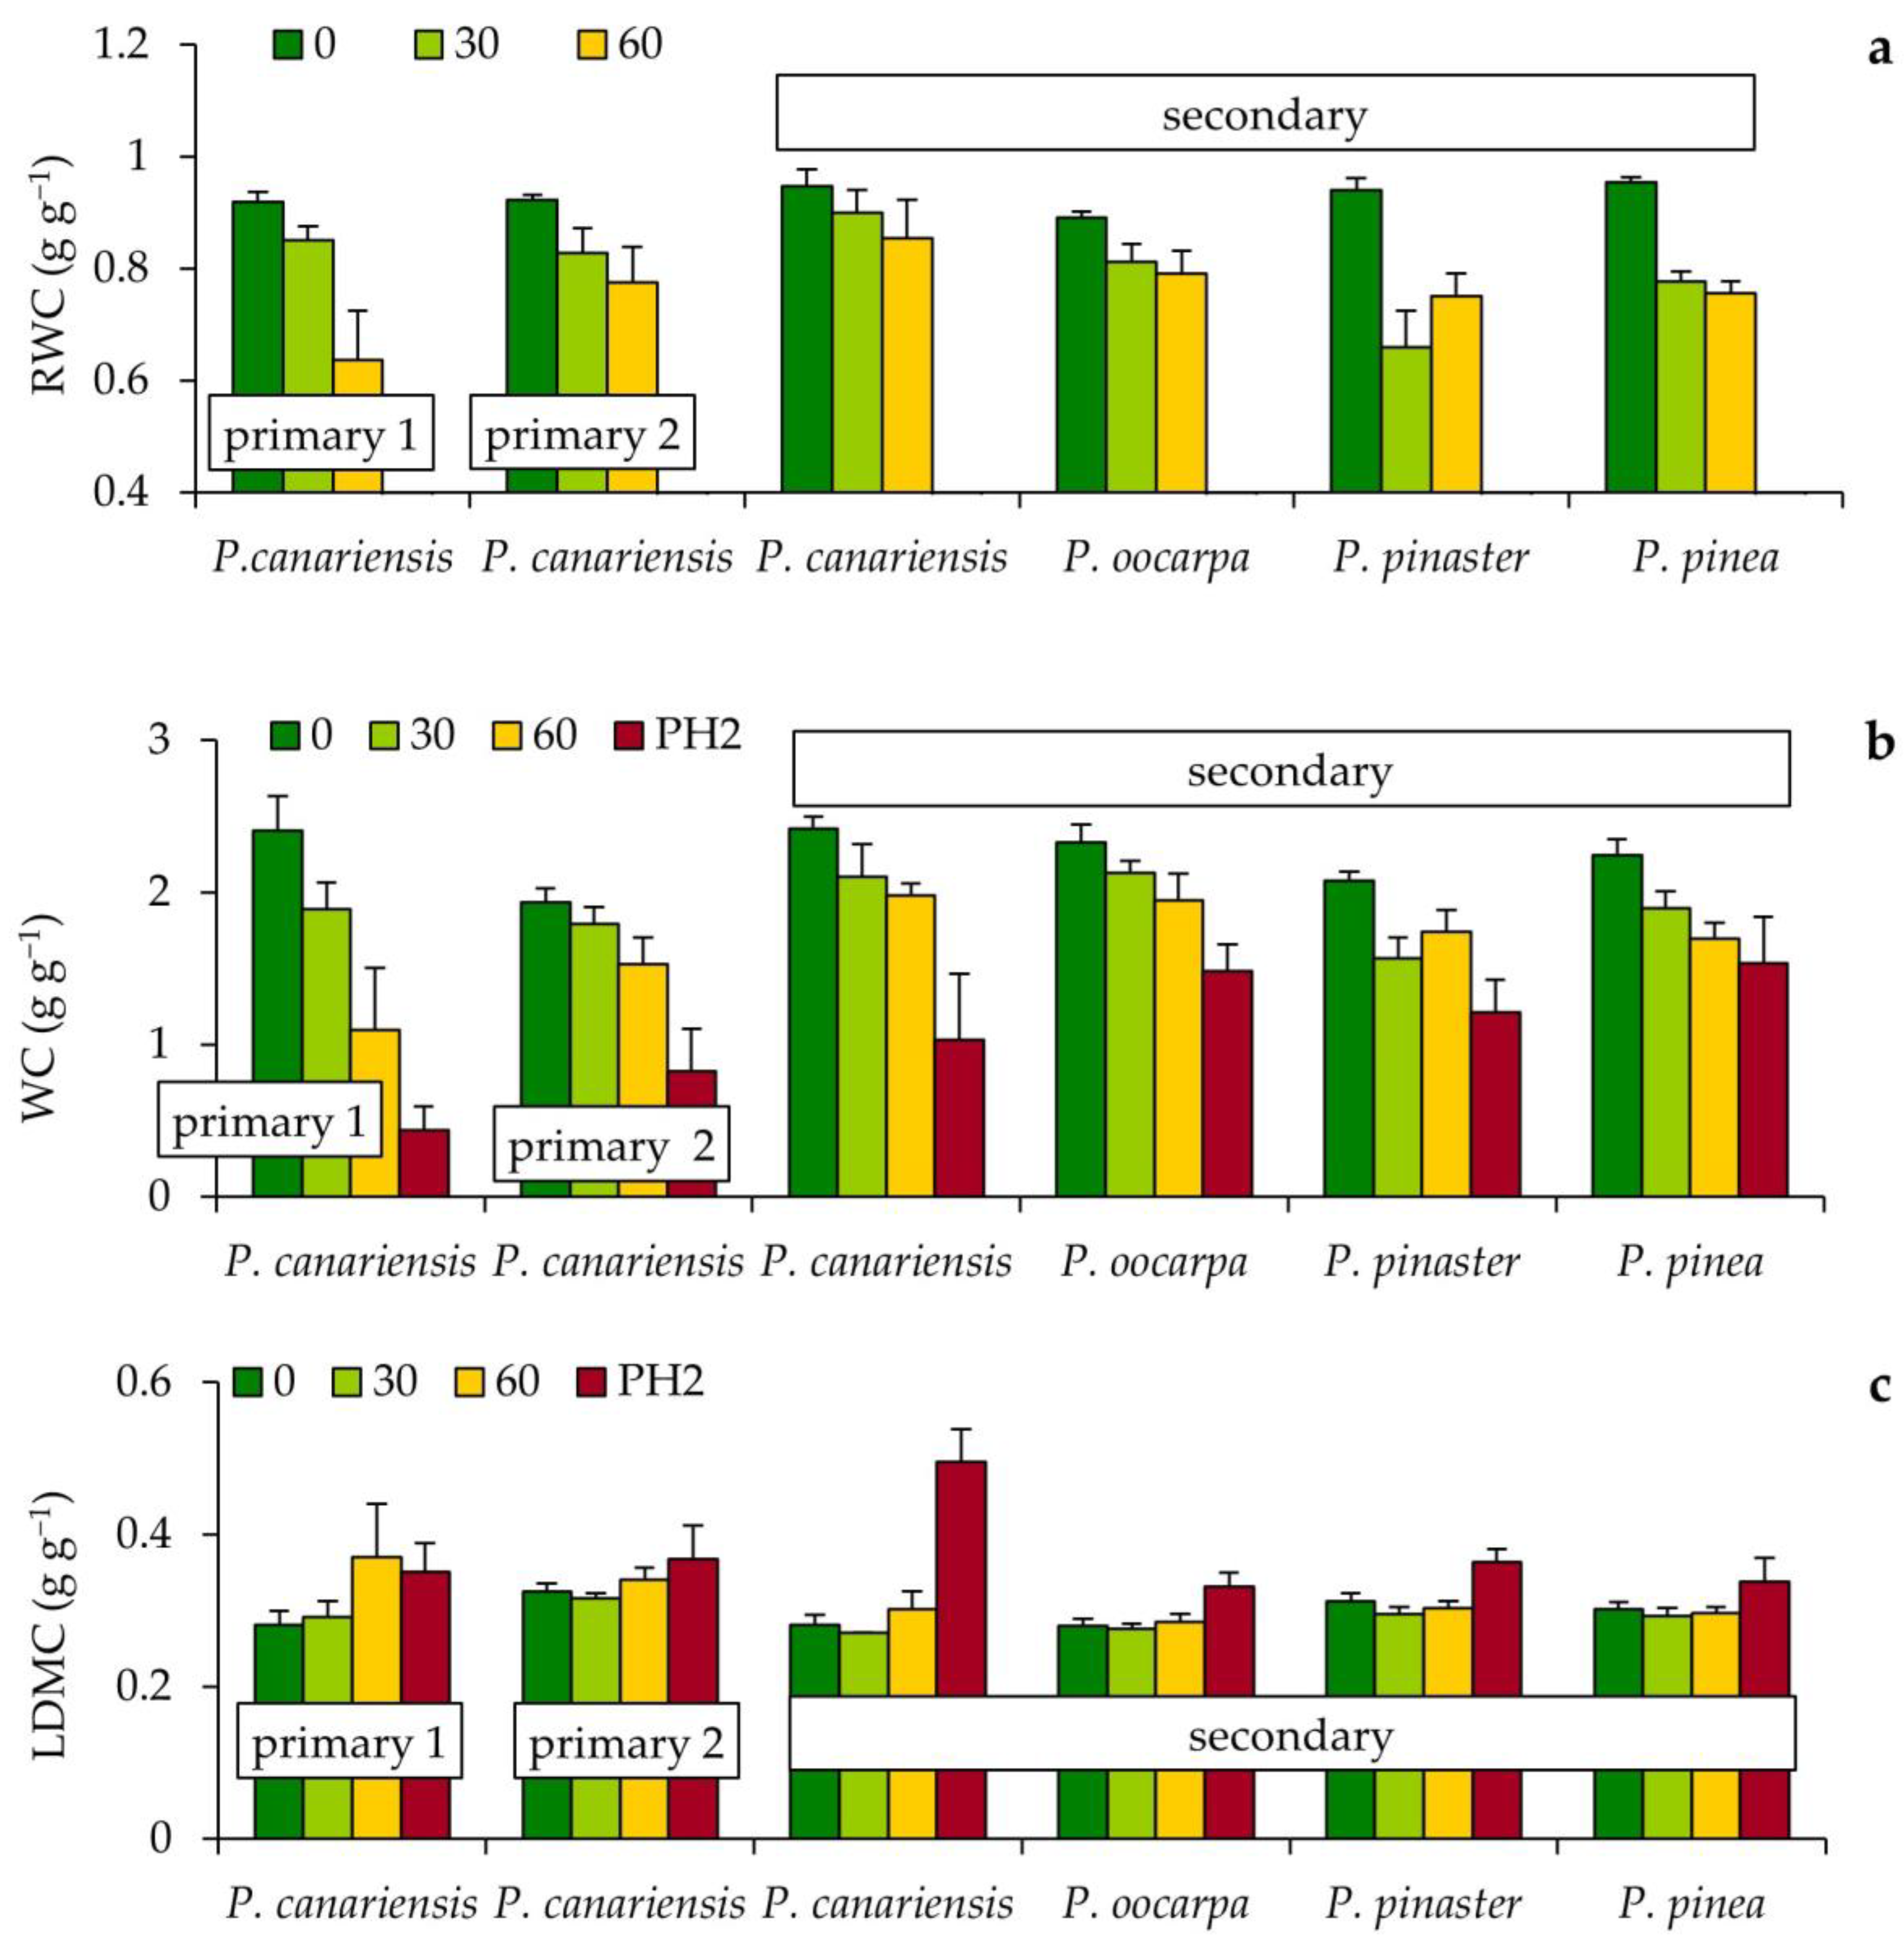
3.2. Changes in Needle Water Content during the First and Second Phases of Hot Wind

Differences between species in RWC were significant before starting the hot wind treatment when RWC was lower in P. oocarpa than in the other three species (F5,26 = 4.18, p = 0.006) and after 30 min of hot wind (F5,26 = 2.97, p = 0.03). The largest decrease in RWC after 30 min of hot wind was measured in P. pinaster (30%), followed by P. pinea (19%) and P. oocarpa (6%). The decrease ranged from 5% to 10% in P. canariensis, depending on the stage of development of the needle (Figure 3a). The rate of decrease in RWC was reduced by 86% during the last half-hour of hot wind in P. pinea, while RWC increased in P. pinaster at the same time (Figure 3a). After 60 min of hot wind, the differences between species in needle RWC were not significant (F5,26 = 1.47, p = 0.23).
When needle water content was expressed on a dry weight basis (WC), factorial ANOVA showed significant differences both between species (F5,101 = 5.6, p = 0.0001) and duration of the hot wind treatment (F3,101 = 32.7, p < 0.0001), with no significant interaction between factors (F15,101 = 1.55, p = 0.1). Contrary to what was found for RWC, there were no significant differences between species in WC before starting the hot wind treatment. Differences in WC between species were significant 30 min after starting Phase 1 when the highest values were measured in secondary needles from resprouting species (F5,25 = 3.19, p = 0.023) and at the end of Phase 2 (F5,25 = 2.93, p = 0.032) when the lowest values were measured in P. canariensis most apical primary needles (Figure 3b). Differences were not significant at the end of Phase 1, in agreement with what was found for RWC.
In two out of the five samples taken at the end of Phase 1 in P. canariensis, most apical primary needles had an abnormally high LDMC, suggesting that dehydration may have hampered the ability of some needles to fully rehydrate in the species. Using only data from fully developed P. canariensis primary needles, factorial ANOVA showed no significant differences between values measured after 0, 30, and 60 min of hot wind (F2,6 = 1.29, p = 0.28) and highly significant differences between species (F3,6 = 11.56, p < 0.0001) with no significant interaction between factors. According to Tukey’s HSD test, LDMC values measured in Pinus oocarpa were significantly lower than those measured in P. pinaster and P. canariensis.
The lack of differences between the LDMC values measured at 0, 30, and 60 min after starting Phase 1 strongly suggests that dehydration caused by the hot wind did not affect the capacity of detached needles to fully rehydrate in P. oocarpa, P. pinea, and P. pinaster. In other words, we can discard any undesirable effect of hot wind, which could have compromised the reliability of the saturated weights and derived parameters. The same holds for P. canariensis fully developed primary needles but not for P. canariensis most apical primary needles. On the other hand, data measured at the end of Phase 2 were consistently higher than mean values measured during Phase 1 (Figure 3c), most probably because severe damage in needle tissues hampered rehydration after Phase 2, leading to abnormally low values of needle saturated weight. For this reason, neither LDMC nor RWC values were analyzed at the end of Phase 2.

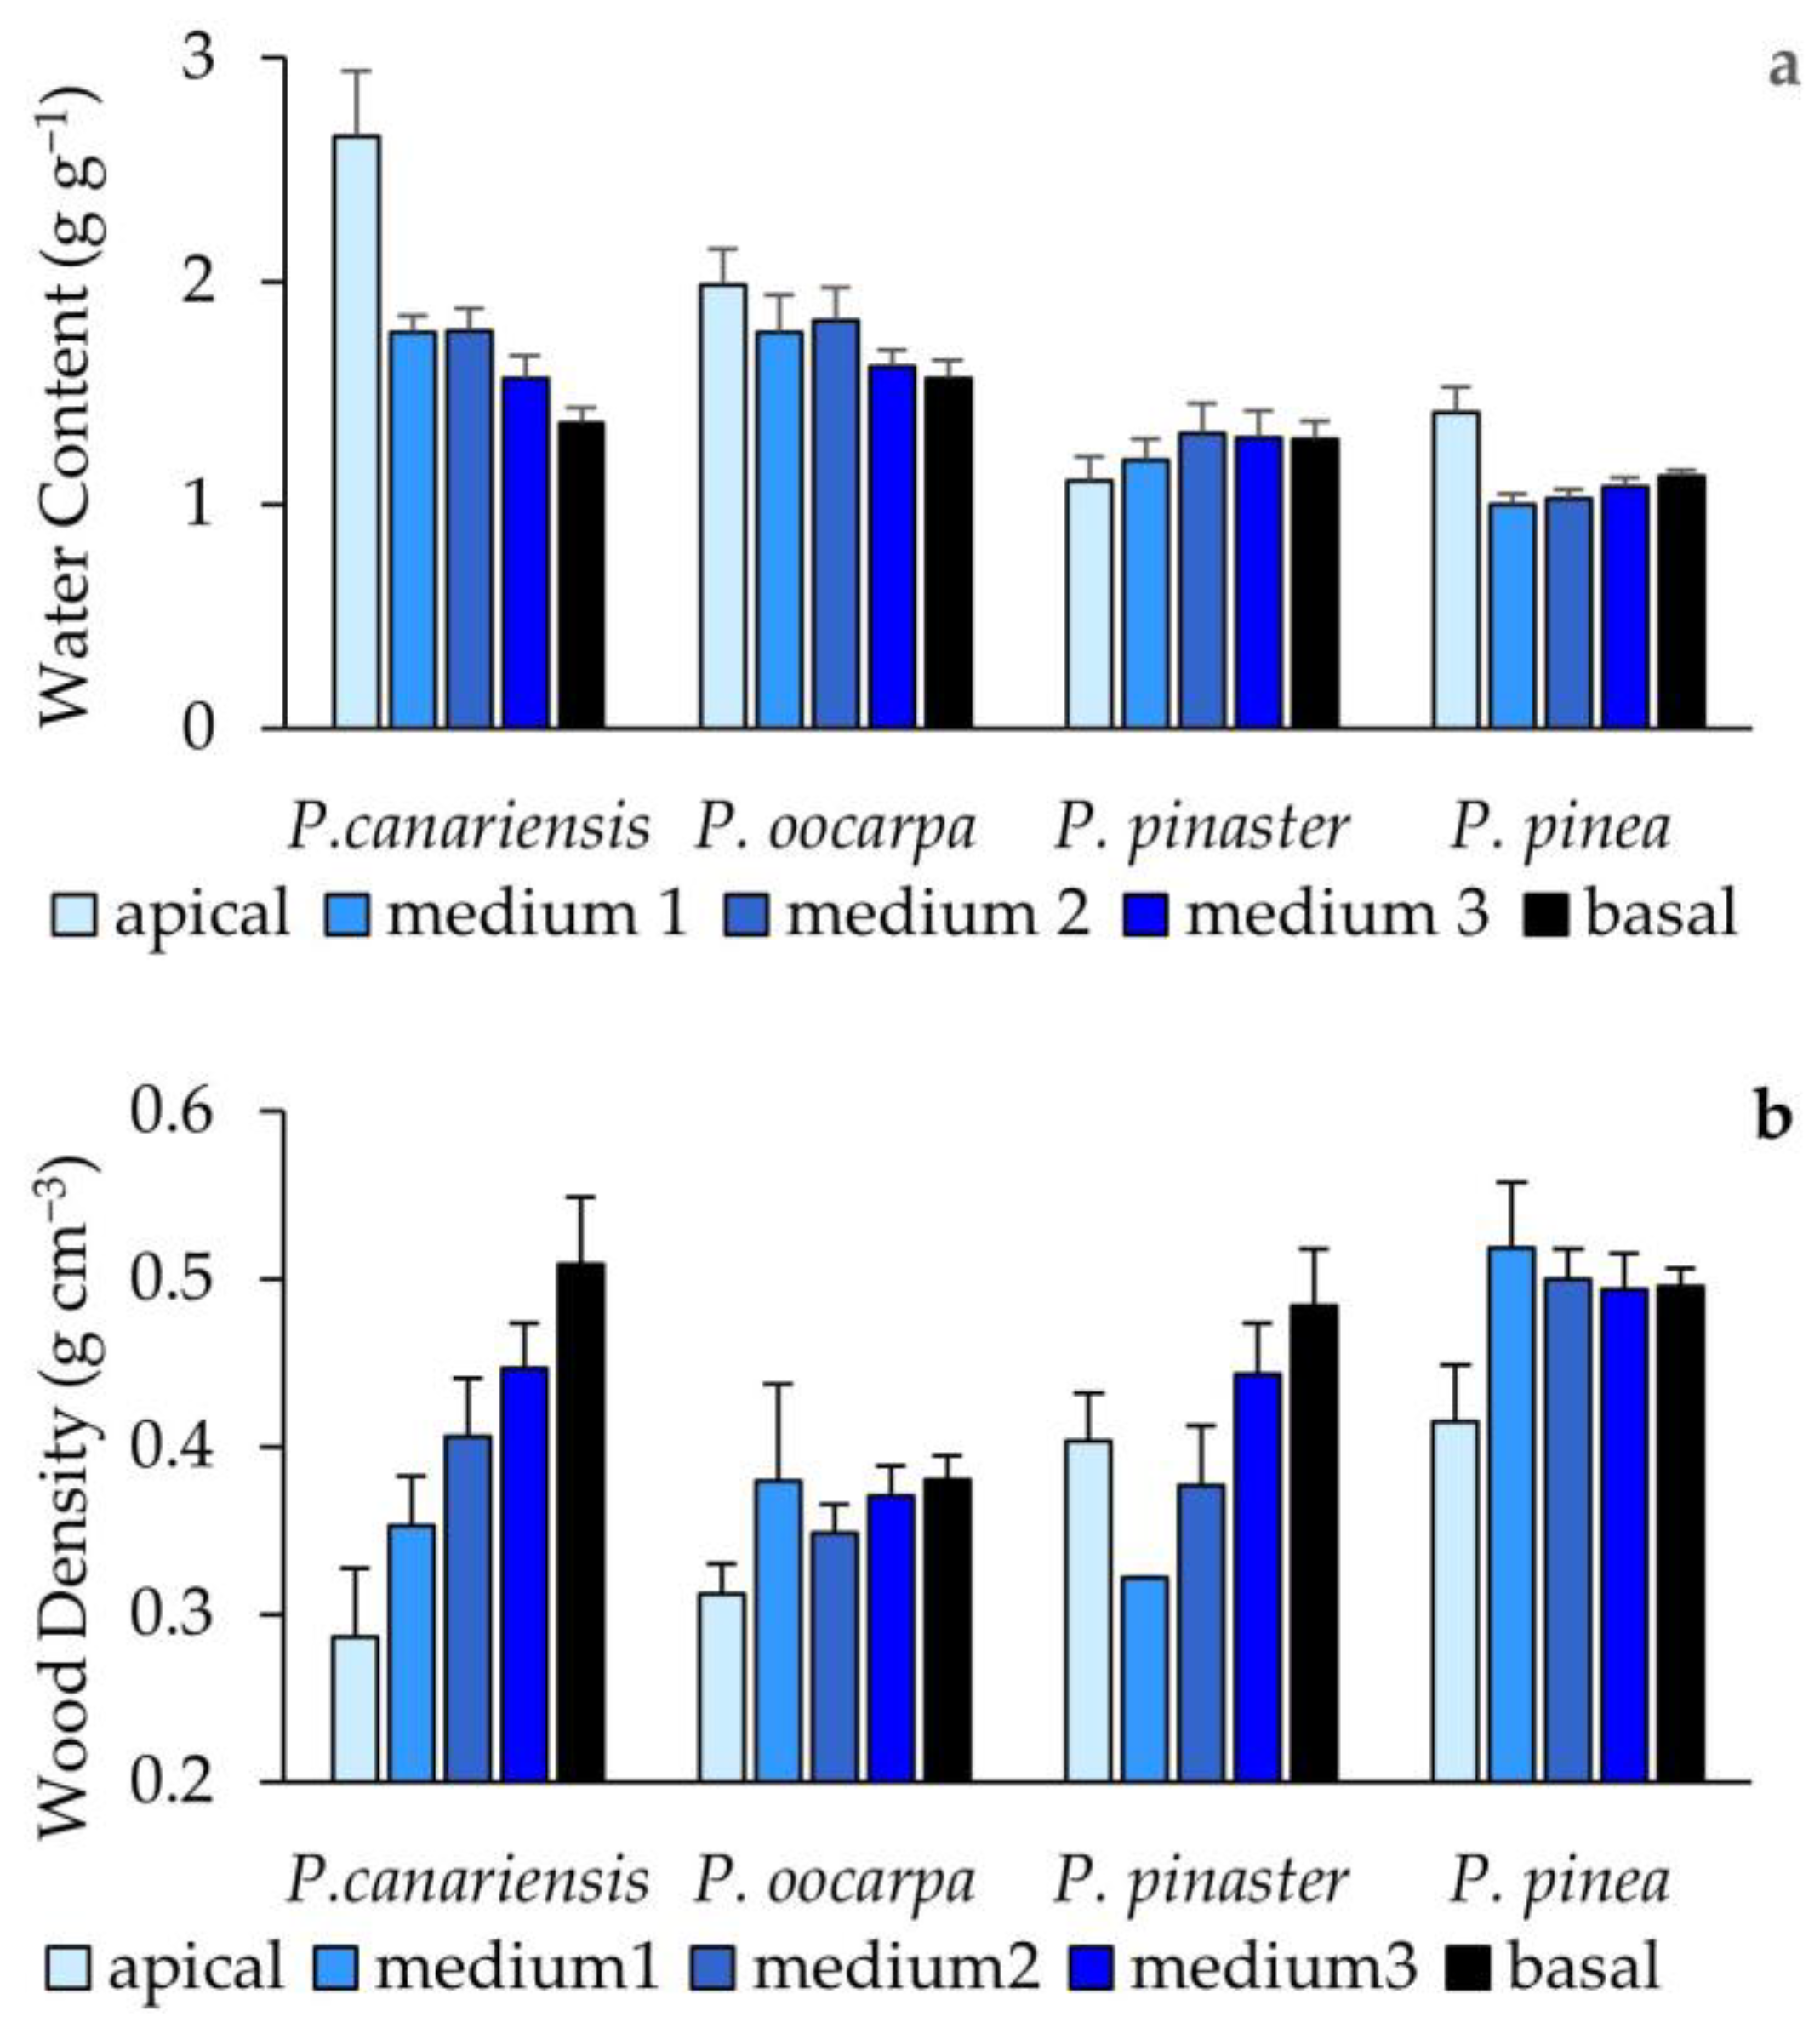
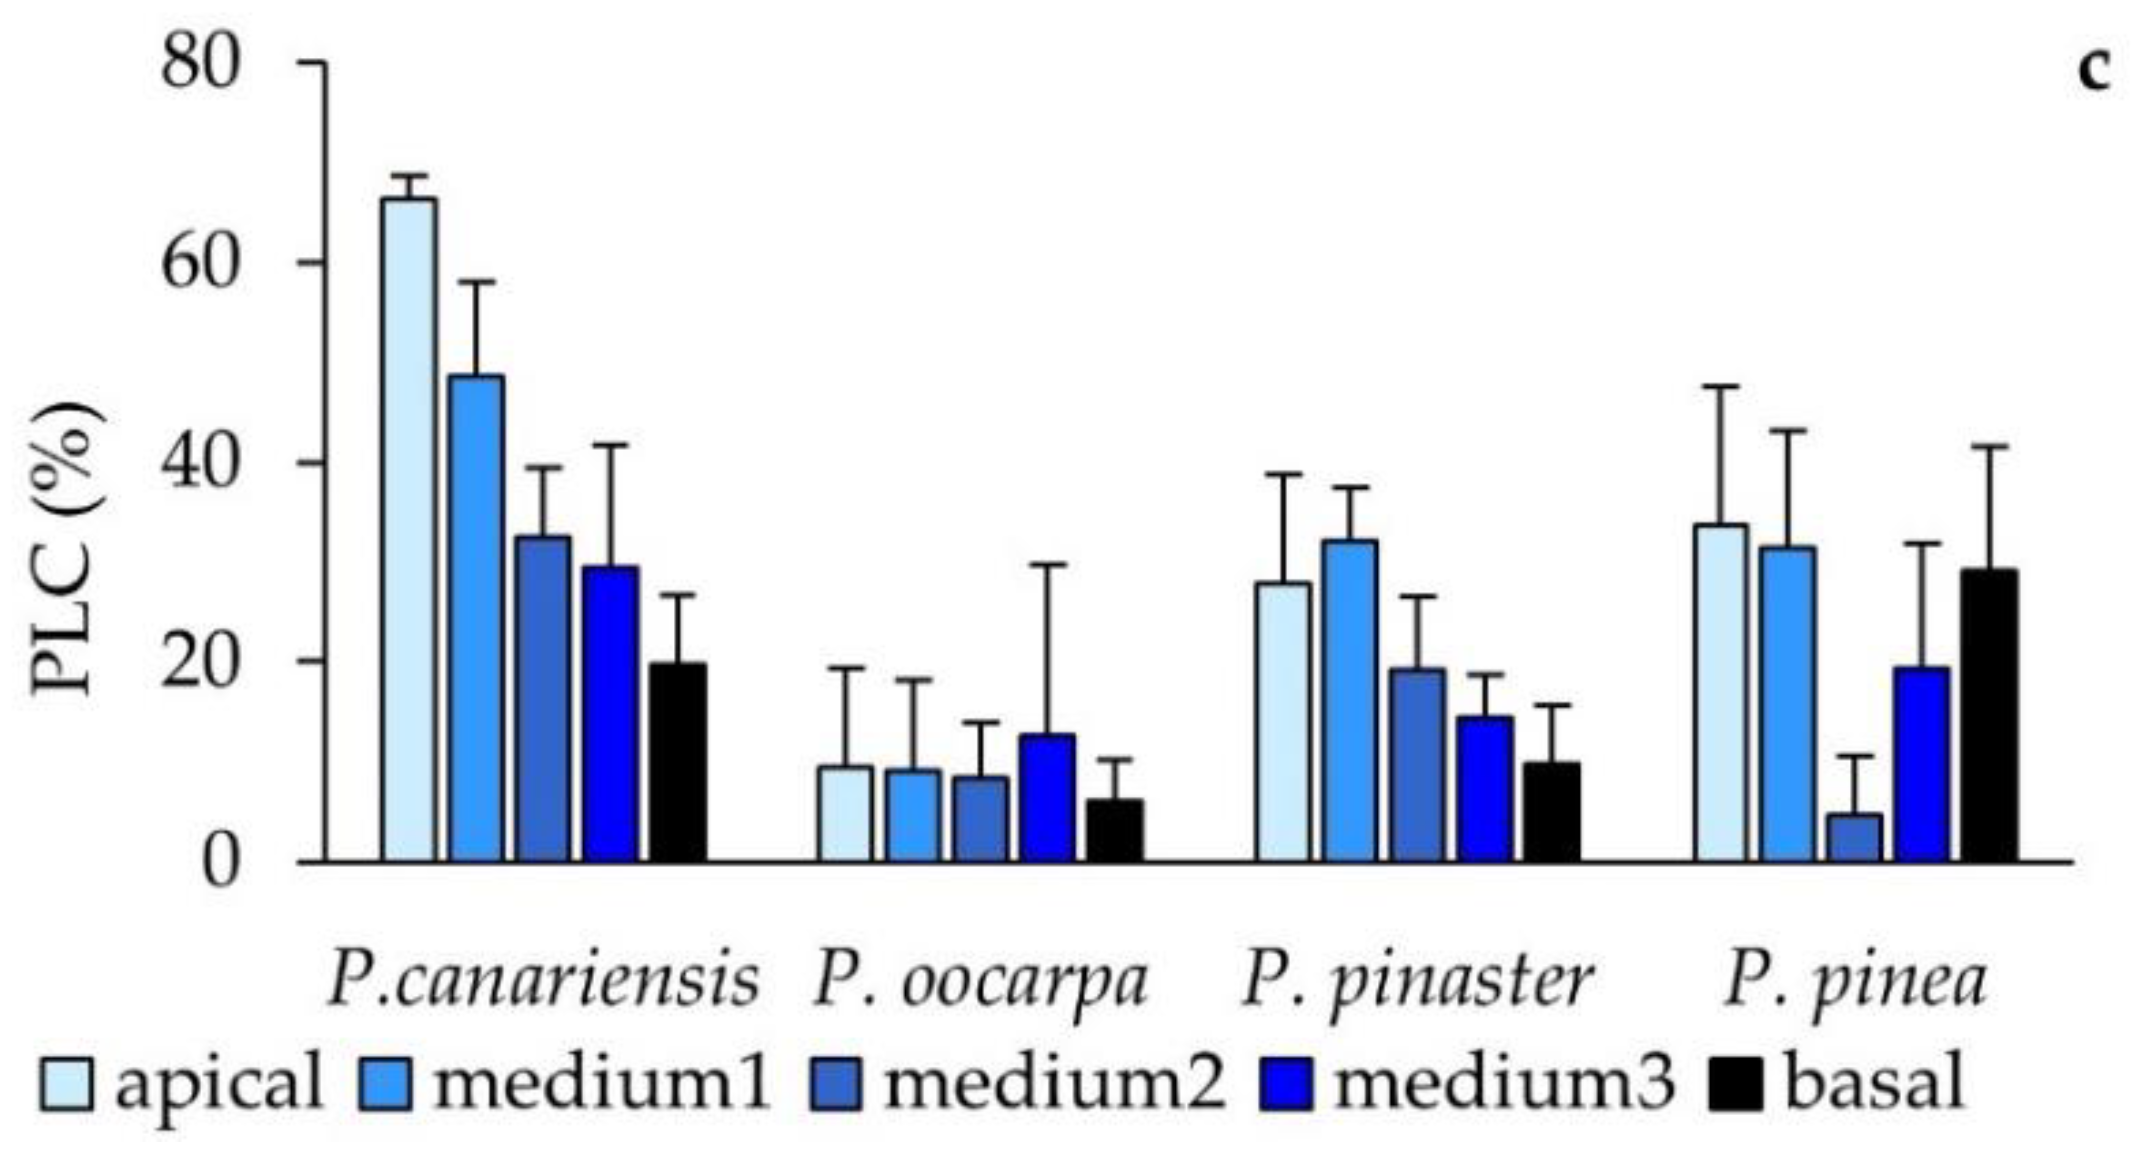
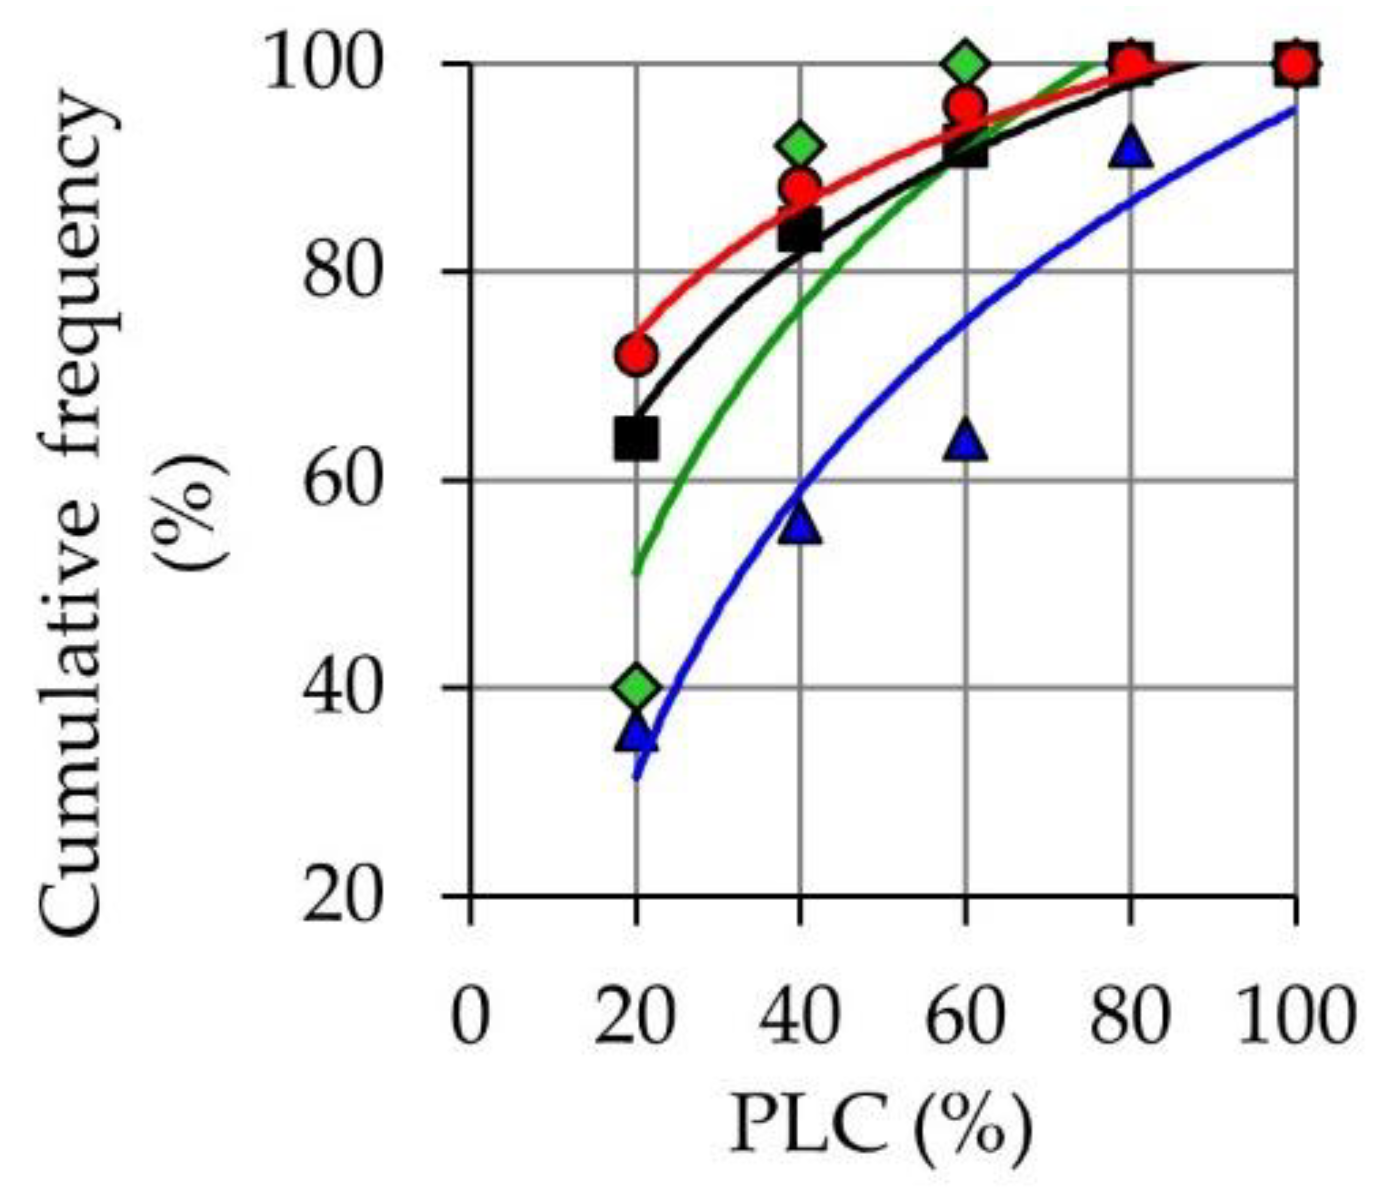
3.3. Stem Water Content, Hydraulic Conductance, and Stem Density Measured after the Second Phase of Hot Wind

Resprouting species kept higher values of stem water content than non-resprouting species, with the differences being the highest in stem sections close to the apex (Figure 4a). We found significant differences between species at every height: from the most apical (F3,16 = 14.13, p < 0.001), going through medium_1 (F3,16 = 13.82, p < 0.001), medium_2 (F3,16 = 11.66, p < 0.001), medium_3 (F3,16 = 7.64, p < 0.002), and up to the most basal (F3,16 = 7.3, p < 0.003). The highest values of stem WC were measured in the most apical stem segments of P. canariensis (Figure 4a).
The lowest values of stem density were measured in the most apical stem portions from resprouting species (Figure 4b). Both the effects of height (F4,74 = 7.8, p < 0.001) and species (F3,74 = 74, p < 0.001) were highly significant. The effect of the interaction between factors was also significant (F12,74 = 2.01, p = 0.030). Pinus canariensis was the only species in which stem density increased steadily from the apex to the base of the stem (Figure 4b) and the one in which the difference in density between basal and apical stem portions was the largest (44% vs. 16%–18%).
The average percentage loss of hydraulic conductance (PLC) measured at five heights along the stem ranged from 5% to 66%. The highest values were measured in the most apical stem segments of P. canariensis, while PLC was consistently lower than 13% throughout the stem in P. oocarpa (Figure 4c). Factorial ANOVA showed a significant effect of the species on PLC (F3,68 = 9.68, p < 0.001), a non-significant effect of the position of the segment along the stem (F4,68 = 1.66, p = 0.17), and non-significant interaction between factors (F12,68 = 0.97, p = 0.48).
Since there were no significant differences between values measured at different heights, we pooled all data together to draw the curve of cumulative frequencies for PLC values (Figure 5). For any value in the x-axis, these curves show the percentage of stem segments in which PLC was equal to or lower than that x-value. According to this, a PLC equal to or lower than 40% was measured in more than 80% of stem segments in P. oocarpa, P. pinea, and P. pinaster, and only in 56% of the segments in P. canariensis, showing a larger impact of embolism in the latter (Figure 5).
Maximum stem hydraulic conductance increased exponentially as the stem diameter increased from the apex toward the base of the stem (Figure 6). We found significant differences between species in the slope (F3,12 = 4.5, p = 0.025) and intercept (F3,12 = 4.2, p = 0.030) of the regression lines fitted to log-transformed data. Maximum hydraulic conductance was highest in P. oocarpa for any stem diameter. On the other hand, Pinus canariensis experienced the lowest increase in hydraulic conductance from the apex to the base of the stem (Figure 6).

3.4. Resprouting

All P. oocarpa and P. canariensis seedlings were able to resprout from formerly dormant epicormic buds after the treatment. Only two out of seven P. pinea plants resprouted, and no P. pinaster survived the two-phase treatment.

4. Discussion

4.1. Changes in Needle Water Potential under Hot Wind: Resprouting vs. Non-Resprouting Species

Exposure to hot wind (39 °C) resulted in a decrease in relative water content, needle water potential (Ψ), and needle osmotic potential (Ψs), as expected since high temperatures increase the VPD, and both wind and increased VPD promote the increase of water loss via transpiration. The initial rate of decrease in Ψ was higher in the non-resprouting species P. pinea and P. pinaster, which were able to maintain Ψ between −2 and −4 MPa from this moment onwards, keeping the loss of stem hydraulic conductance (PLC) below the 50% threshold. Our results show a slightly lower impact of cavitation than that reported by Bouche et al. [44] and Oliveras et al. [45] in P. pinaster and P. pinea. Since the above-mentioned Ψ values correspond to the first phase of the hot wind treatment and PLC values were measured after finishing the second phase, we could have expected even a larger impact of cavitation. The most plausible reason for this result is that, by rapidly killing the needles and, therefore, limiting needle transpiration, the second phase did not contribute significantly to dehydrating the stem. The similarity in the response of P. pinea and P. pinaster to Phase 1, despite the differences in basal stem diameter, suggests a limited effect of plant size on the leaf-level response to heat under our experimental conditions.
The decrease in Ψ at the beginning of Phase 1 would depend on the effectiveness of stomata in controlling transpiration. High stomatal sensitivity to environmental conditions that promote high rates of transpiration is characteristic of isohydric species, which typically have lower stem densities and higher hydraulic conductance than anisohydric species, as was the case of P. oocarpa in our study [46]. A more isohydric behavior, however, may not be associated with higher rates of VPD-induced stomatal closure [46]. According to Ohm’s law analogy [47], other factors, such as the efficiency of water transport in leaves and stems, can also buffer water potential under a suddenly imposed increase in VPD and transpiration.
Daily minimum Ψ tends to be higher in species with higher stem hydraulic conductance [48,49]. Tree species with lower stem hydraulic conductance may need to reach lower leaf water potentials to increase sap flow and sustain transpiration. By generating a steep water potential gradient, P. pinea and P. pinaster would promote water transport from the stem in order to limit further needle dehydration or even allow needle rehydration in a strategy of needle preservation. This effect was noticeable in P. pinaster, in which needle WC, RWC, and Ψs increased between 30 and 60 min of hot wind.
The release of stem-stored water can also contribute to buffer changes in Ψ [50,51,52]. According to our second hypothesis, stem water content remained higher in P. oocarpa and P. canariensis than in P. pinea and P. pinaster after the two-step hot wind treatment. However, while the highest values of needle water potential were measured in P. oocarpa during the first phase of hot wind, Ψ values lower than −5.6 MPa were only measured in P. canariensis at the same time. Not surprisingly, we measured the largest impact of cavitation in P. canariensis. The water potential causing a 50% PLC ranged from −3.13 to −4.61 MPa in P. canariensis trees growing in a common garden in Tenerife [33,53]. Thus, P. pinea and P. pinaster were able to keep Ψ above the 50% PLC threshold, but P. canariensis was not, in disagreement with our second hypothesis. Still, all P. canariensis and P. oocarpa seedlings were able to resprout independently of the different impacts of cavitation on each species.
Though several studies support the role of stem- or leaf-stored water in buffering Ψ, Zhang et al. [49] reported that both hydraulic conductivity and stem water storage contributed to maintaining high stem water potentials at midday, while the same did not hold for leaf water potentials. Hydraulic resistances may change along the sap pathway and are typically higher at the leaf level due to the impact of decreasing the diameter of the tracheary elements [54]. This effect could be particularly noticeable in P. canariensis due to a delayed heteroblastic change [34] and primary needles with a lesser-developed vascular tissue than secondary needles [55]. Thus, leaves can be considered ‘hydraulic bottlenecks’ [56,57]. According to the hydraulic segmentation hypothesis, increased hydraulic constraints at distal organs may help to avoid a catastrophic impact of cavitation in the main stem by sacrificing those distal organs [58]. Such low needle water potentials as those reached by P. canariensis in our study strongly suggest a strategy of sacrificing some needles, which could help to reduce a further loss of stem hydraulic conductance and preserve stem stored water for resprouting.

4.2. Changes in Needle Osmotic Potential under Hot Wind: P. canariensis vs. P. oocarpa

In agreement with our first hypothesis, we measured the lowest values of Ψ and Ψs in resprouting species. However, despite the low Ψ values measured in P. canariensis, the Ψs values were consistently high in this species during the first hour of hot wind. On the other hand, the lowest Ψs values were measured in P. oocarpa, in which Ψ was consistently high at the same time. We can expect both Ψs and Ψ to decrease with needle dehydration, but they may decrease differently depending on several factors. Leaf hydraulic resistances may result in large water potential gradients between the xylem and other tissues in transpiring leaves [59]. The presence of endodermis and transfusion tissue surrounding vascular tissues in needles [55,60,61] may contribute to generating and sustaining such water potential gradients together with an uneven water distribution over the leaf, as has been observed in other species [62]. In addition, increased vulnerability to cavitation in leaves could be driven by an early loss of hydraulic conductance in extra-xylary pathways rather than xylem embolism [63]. Thus, both high and low xylem water potentials may be compatible with different levels of water loss from living mesophyll cells.
Osmotic potential values measured with psychrometers are affected by two main factors other than symplast dehydration. First, the disruption of cell walls leads to the release of cell wall solutes. Second, the so-called dilution effect, which is a consequence of mixing water in cell walls and tracheid lumens with symplastic water [64,65,66]. Interestingly, the parameter LDMC proved worthy of accounting for both factors in a predictive model [65]. This parameter has been used as a surrogate for tissue density [67] and was lowest in P. oocarpa needles. Lower densities can be expected in needles having a comparatively large fraction of living cells with thin primary walls. Such needles would be able to store large amounts of water, or at least large amounts of readily available water [68], which could contribute to explaining why RWC was lowest in P. oocarpa needles before starting the hot wind treatment, with no differences in needle WC between species at the time. A low apoplastic fraction would also decrease the dilution effect, leading to comparatively lower Ψs values, as those observed in P. oocarpa before starting the treatment. The dilution effect may become less relevant as the tissue dehydrates [66]. For highly dehydrated tissues, the relationship between RWC and Ψs may no longer remain linear [66] if the solution becomes too concentrated and ceases to behave as an ideal solution [69]. This could explain the steepness of the decrease in Ψs measured after 60 min of hot wind in P. oocarpa, with no significant increase in the rate of needle dehydration. When observed under magnification, mesophyll cells in P. oocarpa needles looked as if collapsed after 60 min of hot wind. At this time, osmotic potential was –4.8 MPa in P. oocarpa, well below the −1.8 to −3 MPa range for osmotic potential at turgor loss measured in other pine species [70,71,72,73,74,75]. Given the mesic nature of P. oocarpa, it could be expected that such low osmotic potentials would critically compromise needle survival. Severe cell dehydration will lead to plasmolysis, which might be reverted in the short term if water becomes accessible [76] but not in the long term. Once more, needle sacrifice could be a suitable strategy to maintain sufficient water in the stem for resprouting. Further research would be necessary to investigate if this leaf-level response could also be found in non-resprouting gymnosperms showing poor adaptation to high temperatures. By jeopardizing needle rehydration even with a close to the optimum stem and soil water status, this response increases the risk of devastating forest fires after heat waves, which are becoming more frequent in northern latitudes.

4.3. Differences between Species in Stem Density and Stem Hydraulic Conductance

We measured the lowest increase in maximum stem hydraulic conductance (KM) from apex to base in P. canariensis, the only species in which most needles were still primary needles. For the other three pine species, KM increased exponentially toward the base of the stem, a result that agrees with the exponential increase in the diameter of xylem conducting elements reported in several studies [77,78]. Tapering has been reported to increase as the length of the sap pathway increases [79] because hydraulic resistances along the pathway become larger. We found striking differences between two-year-old seedlings, in which the length of the sap pathway is much smaller than in large trees. We hypothesize that such a response may be necessary for heteroblastic pine species in the absence of any significant increase in height but rather to cope with an increase in plant transpiration resulting from changing from juvenile to secondary needles. Heteroblastic change constitutes a major rearrangement of needle anatomical, morphological, and physiological traits [80] and may depend on environmental factors, including wildfires [81] and light and water availability [82]. In fact, the cost in needle biomass resulting from the change to secondary needles has been proposed as an explanation for delaying heteroblastic change in P. canariensis under unfavorable environmental conditions [34].
The observed differences in the pattern of change in stem density along the stem are compatible with the hypothesis of a higher degree of conduit tapering in species carrying mostly secondary needles. In young seedlings, stem density may typically increase toward the base of the stem, where the less dense pith tissue represents a smaller fraction of the stem cross-section. This pattern of response was observed in P. canariensis. In the other three species, an increase in newly grown tracheid diameters would decrease density toward the base of the stem. This could explain the inconsistent pattern of variation in stem density and the exponential increase in maximum hydraulic conductance from apex to base measured in these three species.

5. Conclusions

As hypothesized, non-resprouting species responded to hot wind with a rapid and limited decrease in needle water potential, presumably aimed at mobilizing stem water to preserve the needles, a strategy that would only be effective under moderately high temperatures. The lowest values of needle water potential and needle osmotic potential were measured in resprouting species, suggesting a strategy of needle sacrifice that successfully preserved stem water content and allowed all plants to resprout after 100% leaf scorch. This response is in accordance with the hydraulic segmentation hypothesis and shows two different ways for hydraulically compartmentalizing the needles, either by increasing the hydraulic resistances at the xylem (Pinus canariensis) or extra-xylary tissue (Pinus oocarpa).
Contrary to the hypothesis, stem xylem embolism surpassed the 50% threshold in P. canariensis, in which the lowest values of needle water potential were measured. Sprouting was not affected by the loss of hydraulic conductance in the species.

Author Contributions

Conceptualization, P.P. and R.L.; Data curation, P.P. and R.L.; Formal analysis, P.P.; Funding acquisition, P.P., R.L. and L.G.; Methodology, P.P. and R.L.; Project administration, L.G.; Resources, L.G.; Supervision, P.P.; Validation, P.P., R.L. and L.G.; Writing—original draft, P.P. and R.L.; Writing—review and editing, P.P. and R.L. All authors have read and agreed to the published version of the manuscript.

Funding

This work was supported by the Spanish Ministerio de Economía y Competitividad (Vulcan Project, AGL200910606).

Data Availability Statement

The datasets generated during and/or analyzed during this current study are available from the corresponding author upon reasonable request.

Acknowledgments

We are grateful to the Canary Islands Government and the Cabildos of Tenerife and Gran Canaria for their long-standing support in this study of Canary Island pine.

Conflicts of Interest

The authors declare no conflict of interest.

References

  1. Bell, D.M.; Bradford, J.B.; Lauenroth, W.K. Early indicators of change: Divergent climate envelopes between tree life stages imply range shifts in the western United States. Glob. Ecol. Biogeogr. 2014, 23, 168–180. [Google Scholar] [CrossRef]
  2. Cavender-Bares, J.; Bazzaz, F.A. Changes in drought response strategies with ontogeny in Quercus rubra: Implications for scaling from seedlings to mature trees. Oecologia 2000, 124, 8–18. [Google Scholar] [CrossRef] [PubMed]
  3. Rank, R.; Maneta, M.; Higuera, P.; Holden, Z.; Dobrowski, S. Conifer Seedling Survival in Response to High Surface Temperature Events of Varying Intensity and Duration. Front. For. Glob. Chang. 2022, 4, 731267. [Google Scholar] [CrossRef]
  4. Li, Y.; Zhao, M.; Mildrexler, D.J.; Motesharrei, S.; Mu, Q.; Kalnay, E.; Zhao, F.; Li, S.; Wang, K. Potential and Actual impacts of deforestation and afforestation on land surface temperature. J. Geophys. Res. Atmos. 2016, 121, 14–372. [Google Scholar] [CrossRef]
  5. Li, Y.; Zhao, M.; Motesharrei, S.; Mu, Q.; Kalnay, E.; Li, S. Local cooling and warming effects of forests based on satellite observations. Nat. Commun. 2015, 6, 6603. [Google Scholar] [CrossRef] [PubMed]
  6. Levitt, J. Responses of Plants to Environmental Stress, Volume 1: Chilling, Freezing, and High Temperature Stresses; Academic Press: Cambridge, MA, USA, 1980. [Google Scholar]
  7. Nobel, P.S. Extreme temperatures and thermal tolerances for seedlings of desert succulents. Oecologia 1984, 62, 310–317. [Google Scholar] [CrossRef] [PubMed]
  8. Liu, Z.; Ballantyne, A.P.; Cooper, L.A. Biophysical feedback of global forest fires on surface temperature. Nat. Commun. 2019, 10, 214. [Google Scholar] [CrossRef] [PubMed]
  9. Teskey, R.; Wertin, T.; Bauweraerts, I.; Ameye, M.; McGuire, M.A.; Steppe, K. Responses of tree species to heat waves and extreme heat events. Plant Cell Environ. 2015, 38, 1699–1712. [Google Scholar] [CrossRef]
  10. Kolb, P.F.; Robberecht, R. High temperature and drought stress effects on survival of Pinus ponderosa seedlings. Tree Physiol. 1996, 16, 665–672. [Google Scholar] [CrossRef]
  11. Taiz, L.; Zeiger, E.; Møller, I.M.; Murphy, A. Plant Physiology and Development; Sinauer Associates Incorporated. Oxford University Press: Oxfort, UK, 2015. [Google Scholar]
  12. Cunningham, S.C.; Read, J. Foliar temperature tolerance of temperate and tropical evergreen rain forest trees of Australia. Tree Physiol. 2006, 26, 1435–1443. [Google Scholar] [CrossRef]
  13. Hüve, K.; Bichele, I.; Rasulov, B.; Niinemets, U. When it is too hot for photosynthesis: Heat-induced instability of photosynthesis in relation to respiratory burst, cell permeability changes and H2O2 formation. Plant Cell Environ. 2011, 34, 113–126. [Google Scholar] [CrossRef] [PubMed]
  14. Grossiord, C.; Buckley, T.N.; Cernusak, L.A.; Novick, K.A.; Poulter, B.; Siegwolf, R.T.W.; Sperry, J.S.; McDowell, N.G. Plant responses to rising vapor pressure deficit. New Phytol. 2020, 226, 1550–1566. [Google Scholar] [CrossRef] [PubMed]
  15. Russo, S.; Sillmann, J.; Fischer, E.M. Top ten European heatwaves since 1950 and their occurrence in the coming decades. Environ. Res. Lett. 2015, 10, 124003. [Google Scholar] [CrossRef]
  16. López, R.; Ramírez-Valiente, J.A.; Pita, P. How plants cope with heatwaves in a drier environment. Flora 2022, 295, 152148. [Google Scholar] [CrossRef]
  17. Marchin, R.M.; Backes, D.; Ossola, A.; Leishman, M.R.; Tjoelker, M.G.; Ellsworth, D.S. Extreme heat increases stomatal conductance and drought-induced mortality risk in vulnerable plant species. Glob. Chang. Biol. 2022, 28, 1133–1146. [Google Scholar] [CrossRef] [PubMed]
  18. Drake, J.E.; Tjoelker, M.G.; Vårhammar, A.; Medlyn, B.E.; Reich, P.B.; Leigh, A.; Pfautsch, S.; Blackman, C.J.; López, R.; Aspinwall, M.J. Trees tolerate an extreme heatwave via sustained transpirational cooling and increased leaf thermal tolerance. Glob. Chang. Biol. 2018, 24, 2390–2402. [Google Scholar] [CrossRef]
  19. Urli, M.; Porte, A.J.; Cochard, H.; Guengant, Y.; Burlett, R.; Delzon, S. Xylem embolism threshold for catastrophic hydraulic failure in angiosperm trees. Tree Physiol. 2013, 33, 672–683. [Google Scholar] [CrossRef]
  20. West, A.G.; Nel, J.A.; Bond, W.J.; Midgley, J.J. Experimental evidence for heat plume-induced cavitation and xylem deformation as a mechanism of rapid post-fire tree mortality. New Phytol. 2016, 211, 828–838. [Google Scholar] [CrossRef]
  21. Mayr, S. Relevance of time and spatial scales in plant hydraulics. Tree Physiol. 2021, 41, 1781–1784. [Google Scholar] [CrossRef]
  22. Hoffmann, W.A.; Rodrigues, A.C.; Uncles, N.; Rossi, L. Hydraulic segmentation does not protect stems from acute water loss during fire. Tree Physiol. 2021, 41, 1785–1793. [Google Scholar] [CrossRef]
  23. Kavanagh, K.L.; Dickinson, M.B.; Bova, A.S. A way forward for fire-caused tree mortality prediction: Modeling a physiological consequence of fire. Fire Ecol. 2010, 6, 80–94. [Google Scholar] [CrossRef]
  24. Song, J.; Trueba, S.; Yin, X.-H.; Cao, K.-F.; Brodribb, T.J.; Hao, G.-Y. Hydraulic vulnerability segmentation in compound-leaved trees: Evidence from an embolism visualization technique. Plant Physiol. 2022, 189, 204–214. [Google Scholar] [CrossRef] [PubMed]
  25. Bond, W.J.; Midgley, J.J. The evolutionary ecology of sprouting in woody plants. Int. J. Plant Sci. 2003, 164, S103–S114. [Google Scholar] [CrossRef]
  26. Budde, K.B.; González-Martínez, S.C.; Navascués, M.; Burgarella, C.; Mosca, E.; Lorenzo, Z.; Zabal-Aguirre, M.; Vendramin, G.G.; Verdú, M.; Pausas, J.G. Increased fire frequency promotes stronger spatial genetic structure and natural selection at regional and local scales in Pinus halepensis Mill. Ann. Bot. 2017, 119, 1061–1072. [Google Scholar] [CrossRef] [PubMed]
  27. Karavani, A.; Boer, M.M.; Baudena, M.; Colinas, C.; Díaz-Sierra, R.; Pemán, J.; de Luis, M.; Enríquez-de-Salamanca, Á.; Resco de Dios, V. Fire-induced deforestation in drought-prone Mediterranean forests: Drivers and unknowns from leaves to communities. Ecol. Monogr. 2018, 88, 141–169. [Google Scholar] [CrossRef]
  28. Lombardi, E.; Shestakova, T.A.; Santini, F.; Resco de Dios, V.; Voltas, J. Harnessing tree-ring phenotypes to disentangle gene by environment interactions and their climate dependencies in a circum-Mediterranean pine. Ann. Bot. 2022, 130, 509–523. [Google Scholar] [CrossRef]
  29. Santini, F.; Climent, J.M.; Voltas, J. Phenotypic integration and life history strategies among populations of Pinus halepensis: An insight through structural equation modelling. Ann. Bot. 2019, 124, 1161–1171. [Google Scholar] [CrossRef]
  30. Burrows, G.E. Gymnosperm Resprouting—A Review. Plants 2021, 10, 2551. [Google Scholar] [CrossRef]
  31. Pensa, A.; Capra, L.; Giordano, G. Ash clouds temperature estimation. Implication on dilute and concentrated PDCs coupling and topography confinement. Sci. Rep. 2019, 9, 1–14. [Google Scholar] [CrossRef]
  32. Brito, P.; Lorenzo, J.R.; González-Rodríguez, Á.M.; Morales, D.; Wieser, G.; Jimenez, M.S. Canopy transpiration of a Pinus canariensis forest at the tree line: Implications for its distribution under predicted climate warming. Eur. J. For. Res. 2014, 133, 491–500. [Google Scholar] [CrossRef]
  33. López, R.; López de Heredia, U.; Collada, C.; Cano, F.J.; Emerson, B.C.; Cochard, H.; Gil, L. Vulnerability to cavitation, hydraulic efficiency, growth and survival in an insular pine (Pinus canariensis). Ann. Bot. 2013, 111, 1167–1179. [Google Scholar] [CrossRef] [PubMed]
  34. Climent, J.; Chambel, M.R.; López, R.; Mutke, S.; Alía, R.; Gil, L. Population divergence for heteroblasty in the Canary Island pine (Pinus canariensis, Pinaceae). Am. J. Bot. 2006, 93, 840–848. [Google Scholar] [CrossRef] [PubMed]
  35. Sáenz-Romero, C.; Guzmán-Reyna, R.R.; Rehfeldt, G.E. Altitudinal genetic variation among Pinus oocarpa populations in Michoacán, Mexico: Implications for seed zoning, conservation, tree breeding and global warming. For. Ecol. Manag. 2006, 229, 340–350. [Google Scholar] [CrossRef]
  36. Mutke, S.; Sánchez, J.G.; Chambel, M.R.; Prada, M.A.; Álvarez, D.; Iglesias, S.; Gil, L. Phenotypic plasticity is stronger than adaptative differentiation among Mediterranean stone pine provenances. For. Syst. 2010, 19, 354–366. [Google Scholar] [CrossRef]
  37. Battipaglia, G.; Savi, T.; Ascoli, D.; Castagneri, D.; Esposito, A.; Mayr, S.; Nardini, A. Effects of prescribed burning on ecophysiological, anatomical and stem hydraulic properties in Pinus pinea L. Tree Physiol. 2016, 36, 1019–1031. [Google Scholar] [CrossRef]
  38. Gil, L.; López, R.; García-Mateos, Á.; González-Doncel, I. Seed provenance and fire-related reproductive traits of Pinus pinaster in central Spain. Int. J. Wildland Fire 2010, 18, 1003–1009. [Google Scholar] [CrossRef]
  39. López, R.; Rodríguez-Calcerrada, J.; Gil, L. Physiological and morphological response to water deficit in seedlings of five provenances of Pinus canariensis: Potential to detect variation in drought-tolerance. Trees 2009, 23, 509–519. [Google Scholar] [CrossRef]
  40. Ripullone, F.; Guerrieri, M.R.; Nole’, A.; Magnani, F.; Borghetti, M. Stomatal conductance and leaf water potential responses to hydraulic conductance variation in Pinus pinaster seedlings. Trees 2007, 21, 371–378. [Google Scholar] [CrossRef]
  41. Fischer, E.; Sippel, S.; Knutti, R. Increasing probability of record-shattering climate extremes. Nat. Clim. Chang. 2021, 11, 689–695. [Google Scholar] [CrossRef]
  42. Matías, L.; Castro, J.; Villar-Salvador, P.; Quero, J.L.; Jump, A.S. Differential impact of hotter drought on seedling performance of five ecologically distinct pine species. Plant Ecol. 2017, 218, 201–212. [Google Scholar] [CrossRef]
  43. Hacke, U.G.; Sperry, J.S.; Pittermann, J. Drought experience and cavitation resistance in six shrubs from the Great Basin, Utah. Basic Appl. Ecol. 2000, 1, 31–41. [Google Scholar] [CrossRef]
  44. Bouche, P.S.; Jansen, S.; Cochard, H.; Burlett, R.; Capdeville, G.; Delzon, S. Embolism resistance of conifer roots can be accurately measured with the flow-centrifuge method. J. Plant Hydraul. 2015, 2, e002. [Google Scholar] [CrossRef]
  45. Oliveras, I.; Martínez-Vilalta, J.; Jimenez-Ortiz, T.; José Lledó, M.; Escarré, A.; Piñol, J. Hydraulic properties of Pinus halepensis, Pinus pinea and Tetraclinis articulata in a dune ecosystem of Eastern Spain. Plant Ecol. 2003, 169, 131–141. [Google Scholar] [CrossRef]
  46. Fu, X.; Meinzer, F.C.; Woodruff, D.R.; Liu, Y.Y.; Smith, D.D.; McCulloh, K.A.; Howard, A.R. Coordination and trade-offs between leaf and stem hydraulic traits and stomatal regulation along a spectrum of isohydry to anisohydry. Plant Cell Environ. 2019, 42, 2245–2258. [Google Scholar] [CrossRef] [PubMed]
  47. Tyree, M.T.; Ewers, F.W. The hydraulic architecture of trees and other woody plants. New Phytol. 1991, 119, 345–360. [Google Scholar] [CrossRef]
  48. Gleason, S.M.; Butler, D.W.; Ziemińska, K.; Waryszak, P.; Westoby, M. Stem xylem conductivity is key to plant water balance across Australian angiosperm species. Funct. Ecol. 2012, 26, 343–352. [Google Scholar] [CrossRef]
  49. Zhang, Y.J.; Meinzer, F.C.; Qi, J.H.; Goldstein, G.; Cao, K.F. Midday stomatal conductance is more related to stem rather than leaf water status in subtropical deciduous and evergreen broadleaf trees. Plant Cell Environ. 2013, 36, 149–158. [Google Scholar] [CrossRef]
  50. McCulloh, K.A.; Johnson, D.M.; Meinzer, F.C.; Woodruff, D.R. The dynamic pipeline: Hydraulic capacitance and xylem hydraulic safety in four tall conifer species. Plant Cell Environ. 2014, 37, 1171–1183. [Google Scholar] [CrossRef]
  51. Meinzer, F.C.; James, S.A.; Goldstein, G.; Woodruff, D. Whole-tree water transport scales with sapwood capacitance in tropical forest canopy trees. Plant Cell Environ. 2003, 26, 1147–1155. [Google Scholar] [CrossRef]
  52. Skelton, R. Of storage and stems: Examining the role of stem water storage in plant water balance. Plant Physiol. 2019, 179, 1433–1434. [Google Scholar] [CrossRef]
  53. López, R.; Cano, F.J.; Choat, B.; Cochard, H.; Gil, L. Plasticity in Vulnerability to Cavitation of Pinus canariensis Occurs Only at the Driest End of an Aridity Gradient. Front. Plant Sci. 2016, 7, 769. [Google Scholar] [CrossRef] [PubMed]
  54. Lechthaler, S.; Kiorapostolou, N.; Pitacco, A.; Anfodillo, T.; Petit, G. The total path length hydraulic resistance according to known anatomical patterns: What is the shape of the root-to-leaf tension gradient along the plant longitudinal axis? J. Theor. Biol. 2020, 502, 110369. [Google Scholar] [CrossRef] [PubMed]
  55. Fernández-Marín, B.; Ruiz-Medina, M.A.; Miranda, J.C.; González-Rodríguez, Á.M. Coexistent heteroblastic needles of adult Pinus canariensis C. Sm. ex DC. in buch trees differ structurally and physiologically. Forests 2021, 12, 341. [Google Scholar] [CrossRef]
  56. Sack, L.; Holbrook, N.M. Leaf hydraulics. Annu. Rev. Plant Biol. 2006, 57, 361–381. [Google Scholar] [CrossRef] [PubMed]
  57. Sack, L.; Scoffoni, C. Measurement of leaf hydraulic conductance and stomatal conductance and their responses to irradiance and dehydration using the Evaporative Flux Method (EFM). JoVE 2012, e4179. [Google Scholar]
  58. Pivovaroff, A.L.; Sack, L.; Santiago, L.S. Coordination of stem and leaf hydraulic conductance in southern California shrubs: A test of the hydraulic segmentation hypothesis. New Phytol. 2014, 203, 842–850. [Google Scholar] [CrossRef]
  59. Buckley, T.N.; John, G.P.; Scoffoni, C.; Sack, L. How Does Leaf Anatomy Influence Water Transport outside the Xylem? Plant Physiol. 2015, 168, 1616–1635. [Google Scholar] [CrossRef]
  60. Domec, J.-C.; Palmroth, S.; Oren, R. Effects of Pinus taeda leaf anatomy on vascular and extravascular leaf hydraulic conductance as influenced by N-fertilization and elevated CO2. J. Plant Hydraul. 2016, 3, e007. [Google Scholar] [CrossRef]
  61. López, R.; Climent, J.; Gil, L. From desert to cloud forest: The non-trivial phenotypic variation of Canary Island pine needles. Trees 2008, 22, 7. [Google Scholar] [CrossRef]
  62. Luo, Y.; Ho, C.L.; Helliker, B.R.; Katifori, E. Leaf water storage and robustness to intermittent drought: A spatially explicit capacitive model for leaf hydraulics. Front. Plant Sci. 2021, 12, 725995. [Google Scholar] [CrossRef]
  63. Li, X.; Delzon, S.; Torres-Ruiz, J.; Badel, E.; Burlett, R.; Cochard, H.; Jansen, S.; King, A.; Lamarque, L.J.; Lenoir, N. Lack of vulnerability segmentation in four angiosperm tree species: Evidence from direct X-ray microtomography observation. Ann. For. Sci. 2020, 77, 1–12. [Google Scholar] [CrossRef]
  64. Bartlett, M.K.; Scoffoni, C.; Sack, L. The determinants of leaf turgor loss point and prediction of drought tolerance of species and biomes: A global meta-analysis. Ecol. Lett. 2012, 15, 393–405. [Google Scholar] [CrossRef]
  65. Petruzzellis, F.; Savi, T.; Bacaro, G.; Nardini, A. A simplified framework for fast and reliable measurement of leaf turgor loss point. Plant Physiol. Biochem. 2019, 139, 395–399. [Google Scholar] [CrossRef] [PubMed]
  66. Yang, D.; Pan, S.; Tyree, M.T. The impact of xylem cavitation on water potential isotherms measured by the pressure chamber technique in Metasequoia glyptostroboides Hu & WC Cheng. J. Exp. Bot. 2016, 67, 4571–4580. [Google Scholar]
  67. Paula, S.; Pausas, J.G. Leaf traits and resprouting ability in the Mediterranean basin. Funct. Ecol. 2006, 20, 941–947. [Google Scholar] [CrossRef]
  68. Blackman, C.J.; Brodribb, T.J. Two measures of leaf capacitance: Insights into the water transport pathway and hydraulic conductance in leaves. Funct. Plant Biol. 2011, 38, 118–126. [Google Scholar] [CrossRef]
  69. Nobel, P.S. Chapter 2—Water. In Physicochemical and Environmental Plant Physiology (Fourth Edition); Nobel, P.S., Ed.; Academic Press: San Diego, CA, USA, 2009; pp. 44–99. [Google Scholar]
  70. Deligoz, A.; Gur, M. Morphological, physiological and biochemical responses to drought stress of Stone pine (Pinus pinea L.) seedlings. Acta Physiol. Plant. 2015, 37, 243. [Google Scholar] [CrossRef]
  71. Domec, J.C.; Palmroth, S.; Ward, E.; Maier, C.A.; Thérézien, M.; Oren, R. Acclimation of leaf hydraulic conductance and stomatal conductance of Pinus taeda (loblolly pine) to long-term growth in elevated CO2 (free-air CO2 enrichment) and N-fertilization. Plant Cell Environ. 2009, 32, 1500–1512. [Google Scholar] [CrossRef]
  72. Kunert, N.; Tomaskova, I. Leaf turgor loss point at full hydration for 41 native and introduced tree and shrub species from Central Europe. J. Plant Ecol. 2020, 13, 754–756. [Google Scholar] [CrossRef]
  73. Meinzer, F.C.; Woodruff, D.R.; Marias, D.E.; McCulloh, K.A.; Sevanto, S. Dynamics of leaf water relations components in co-occurring iso-and anisohydric conifer species. Plant Cell Environ. 2014, 37, 2577–2586. [Google Scholar] [CrossRef]
  74. Nguyen-Queyrens, A.; Bouchet-Lannat, F. Osmotic adjustment in three-year-old seedlings of five provenances of maritime pine (Pinus pinaster) in response to drought. Tree Physiol. 2003, 23, 397–404. [Google Scholar] [CrossRef] [PubMed]
  75. Samuelson, L.J.; Stokes, T.A.; Ramirez, M.R.; Mendonca, C.C. Drought tolerance of a Pinus palustris plantation. For. Ecol. Manag. 2019, 451, 117557. [Google Scholar] [CrossRef]
  76. Lang, I.; Sassmann, S.; Schmidt, B.; Komis, G. Plasmolysis: Loss of turgor and beyond. Plants 2014, 3, 583–593. [Google Scholar] [CrossRef] [PubMed]
  77. Echeverría, A.; Anfodillo, T.; Soriano, D.; Rosell, J.A.; Olson, M.E. Constant theoretical conductance via changes in vessel diameter and number with height growth in Moringa oleifera. J. Exp. Bot. 2019, 70, 5765–5772. [Google Scholar] [CrossRef]
  78. Lintunen, A.; Kalliokoski, T. The effect of tree architecture on conduit diameter and frequency from small distal roots to branch tips in Betula pendula, Picea abies and Pinus sylvestris. Tree Physiol. 2010, 30, 1433–1447. [Google Scholar] [CrossRef]
  79. Olson, M.E.; Rosell, J.A. Vessel diameter–stem diameter scaling across woody angiosperms and the ecological causes of xylem vessel diameter variation. New Phytol. 2013, 197, 1204–1213. [Google Scholar] [CrossRef]
  80. Kuusk, V.; Niinemets, Ü.; Valladares, F. A major trade-off between structural and photosynthetic investments operative across plant and needle ages in three Mediterranean pines. Tree Physiol. 2018, 38, 543–557. [Google Scholar] [CrossRef]
  81. Ehmig, M.; Coiro, M.; Linder, H.P. Ecophysiological strategy switch through development in heteroblastic species of mediterranean ecosystems—An example in the African Restionaceae. Ann. Bot. 2019, 123, 611–623. [Google Scholar] [CrossRef]
  82. Rose, K.M.; Mickelbart, M.V.; Jacobs, D.F. Plasticity of phenotype and heteroblasty in contrasting populations of Acacia koa. Ann. Bot. 2019, 124, 399–409. [Google Scholar] [CrossRef]
Figure 1. Values of needle water potential measured at approximately ten-minute intervals during the first phase of hot wind treatment in (a) Pinus canariensis, (b) Pinus oocarpa (c) Pinus pinaster and (d) Pinus pinea. Data were measured in primary (P. canariensis, filled triangles) or secondary (empty symbols) transpiring needles. The regression lines are adjusted to data measured in secondary needles during the first 15 min of hot wind. A fixed value of Ψ = −5.6 MPa was given to all those measurements in which needle water potential was below this threshold value.
Forests 14 02174 g001aForests 14 02174 g001b
Figure 2. Mean ± SE osmotic potentials measured in four pine species before starting the hot wind treatment (time 0), after 30 and 60 min of hot wind (Phase 1), and at the end of Phase 2, in which plants were submitted to extremely hot wind. Data were measured in primary (P. canariensis) or secondary (rest of species) needles.
Forests 14 02174 g002
Figure 3. Mean ± SE values of (a) needle relative water content, (b) needle water content expressed on a dry weight basis, and (c) leaf dry matter content, calculated as the quotient of needle dry weight to needle saturated weight. Values were measured in secondary (all species) and primary (P. canariensis) needles from five two-year-old seedlings belonging to four pine species. Primary needles were classified either as primary 1 (taken from the apex and tender) or primary 2 (fully developed). Values were measured before (0) and after exposing the seedlings to 30 and 60 min of hot wind (Phase 1) and after applying extremely hot wind (Phase 2, PH2). See text for further details.
Forests 14 02174 g003
Figure 4. Mean ± SE values of (a) stem water content expressed on a dry weight basis, (b) stem density, and (c) the percentage loss of stem hydraulic conductance measured in two-year-old plants from four pine species. Values were measured after completing a two-step hot wind treatment, at five heights along the stem. See text for further details.
Forests 14 02174 g004aForests 14 02174 g004b
Figure 5. Cumulative frequency curves for the percentage loss of hydraulic conductance (PLC) measured in stem segments taken from two-year-old seedlings belonging to four pine species. Data are grouped into five PLC classes (n = 25 for each species). For each class, the figure shows the percentage of data in which a PLC equal to or lower than the upper-class limit was measured in each species. Logarithmic functions were fitted to each set of data points (R2 > 0.8 for all the curves). Color code: P. oocarpa (red), P. canariensis (blue), P. pinaster (green), and P. pinea (black).
Forests 14 02174 g005
Figure 6. Mean ± SE values of maximum hydraulic conductance as a function of stem diameter, measured at five heights along the stem in five seedlings from four pine species. Data were fitted to exponential equations, which are given as an inset, from up to down the equations correspond to P. oocarpa (red circles), P. pinaster (green diamonds), P. pinea (black squares), and P. canariensis (blue triangles).
Forests 14 02174 g006
Disclaimer/Publisher’s Note: The statements, opinions and data contained in all publications are solely those of the individual author(s) and contributor(s) and not of MDPI and/or the editor(s). MDPI and/or the editor(s) disclaim responsibility for any injury to people or property resulting from any ideas, methods, instructions or products referred to in the content.

