Article

Future Carbon Sequestration and Timber Yields from Chinese Commercial Forests under Shared Socioeconomic Pathways

1
School of Environment, Tsinghua University, Beijing 100084, China
2
School of Economics and Management, Beijing Forestry University, Beijing 100083, China
3
Agriculture and Natural Resources Division, University of California, Sonora, CA 95370, USA
*
Author to whom correspondence should be addressed.
Forests 2023, 14(1), 153; https://doi.org/10.3390/f14010153
Submission received: 16 December 2022 / Revised: 5 January 2023 / Accepted: 9 January 2023 / Published: 13 January 2023
(This article belongs to the Section Forest Economics, Policy, and Social Science)

Abstract

:
Socio-economic status, technologies, and policies are key factors affecting forest management planning and forest ecosystem functions. This study applied shared socioeconomic pathways (SSPs) to a forest-management model framework. The potential timber yields and carbon sinks of spatially allocate alternatives were examined by quantifying their consequent changes at the regional tree species level in Chinese commercial forests (CFs) under the harvest and afforestation restrictions. The results indicate that the annual carbon sequestration rate of China’s CFs over the next 50 years is estimated to be 152.0–162.5 Tg/a, which can offset approximately 5% of the anthropogenic CO2 emissions identified in 2019. Newly planted and regenerated forests can contribute more than 80% of this offset. The annual timber supply capacity is estimated to be 119.2–142.4 million m3/a with current policy interventions, which is not enough to meet the demand for China’s timber market. Although most existing forests are managed as the primary source for forest goods and carbon service, the total commercial forest area changes are not as large as expected, resulting in only 2.0–10.6% differences. Our results also demonstrate that socioeconomic factors (e.g., social preference, carbon price, and forest logging and silvicultural practices) have a strong impact on carbon sinks but a minor impact on timber yields timber, except for improving harvesting and processing technologies. Establishing local long-term effective forest management systems and making afforestation and regeneration as a priority at the national level are suggested to comprehensively enhance the carbon sequestration and timber-supplying abilities of regional CFs.

1. Introduction

Forests play an important role in achieving the ambitious goal of carbon neutrality, as they are a major sink for climate-related greenhouse gases [1,2,3,4]. In 2015, China pledged to increase its forest stock by 4.5 billion cubic meters by 2030, as compared to 2005, and reduce carbon emissions by 60% in the Paris Climate Agreement [5]. Further, in 2019, China promised to be carbon neutral by 2060 [6]. With these carbon storage demands, China has proposed a series of forestry projects focusing on forest plantation and forest restoration over the past 30 years, such as the Natural Forest Protection Project, Grain for Green Program, and Timber Reserve Plan [7]. These policies aim to improve ecological conditions and raise forest stock. Through afforestation over the past few decades, China’s forest stock has reached 17.6 billion cubic meters, with a cover of 23.0% [8].
As the fundamental raw material for wood products, forests are the primary source of income for forest managers. China’s timber supply, which is intensely dependent on imported timber, accounting for 54% of the total supply [9], poses heightened challenges and risks in the context of the expanding domestic timber demand and the unpredictable international timber trade network. Diversified and rapid socioeconomic development as well as ecological conservation requirements have resulted in a more urgent and important demand for forest supplies. Previous studies have shown that effective forest management can concurrently enhance timber supplies and carbon sink capacities to meet the demand [10,11,12,13]. However, the trade-offs or synergies between the economic and ecological benefits of forests are not identical within countries [3,14,15,16,17], which is mainly due to variations in regional resources and climate conditions, and national socio-economic development stages and levels [18,19,20,21].
Socio-economic status, technologies, and policies are key factors affecting forest management planning and its ecosystem functions [22,23]. Previous studies have demonstrated that the Grain for Green program enhances forest carbon storage and offsets by about 3%–5% of China’s annual carbon emissions, while socio-economic factors such as population size and urbanization ratio have a negative impact on carbon sinks [7]. Changes in forest land area contribute most to timber production [24], and carbon and timber price changes affect forest goods supply as well [16,25,26,27]. These socioeconomic development factors have been summarized into five shared socioeconomic pathways (SSPs) by O’Neill et al. [28]. Nepal et al. [29] projected the forest area to the year 2100 for 168 countries under SSPs with an environmental Kuznets curve (EKC) model using variables including income, rural population density, and the size of the labor force. Daigneault et al. [30] designed specific indicators for SSPs involving the forestry sector based on detailed descriptions of Climate Mitigation International, including economic demand, population size, technology level, and land use policy. These SSP scenarios are applied to analyze the strong impact on the forestry sector by comparing economic and social factors through the global timber trade models [24,31,32]. Although the global models identified projected national ecosystem carbon sinks and timber market in aggregate, they failed to consider spatial patterns and sub-classifying forests.
Estoque et al. [33] conducted a forest transition potential model using remote sensing data to simulate the future of forest areas and carbon sinks in Southeast Asia at the national and provincial levels, considering five shared socioeconomic pathways. Yet, it is difficult to capture the fluctuation and direction of forest cover changes in every 10-year interval within the whole planning period. Moreover, spatial arrangement of long-term forest management activities and their implications for ecosystem service functions can only be addressed at small-scale regional and landscape levels [10,15,25]. Therefore, there are still substantial uncertainties about the carbon sink and timber production expectations in response to further economic and social development.
Considering the multiple uncertainties and the dynamics of socioeconomic systems, scenario-based analyses and optimization modeling are useful techniques for assessing the future trajectory of forests [34,35] and, thus, integral parts of planning and decision-making. In this study, we spatially allocated the projected future forest area changes and its goods and carbon service under five SSPs by using scenario analysis and optimization modeling methods based on the national forest inventory database. The regional narratives of five SSPs were set up and applied to examine the influences of these socio-economic elements on forest management dynamics. Given the core source of carbon sinks and timber supplies, we evaluated and quantified the service potential of China’s commercial forests (CFs) at the regional level across tree species. These explorative and evaluative alternatives are aimed at providing plausible insights regarding future CFs and their ecosystem service functions.

2. Materials and Methods

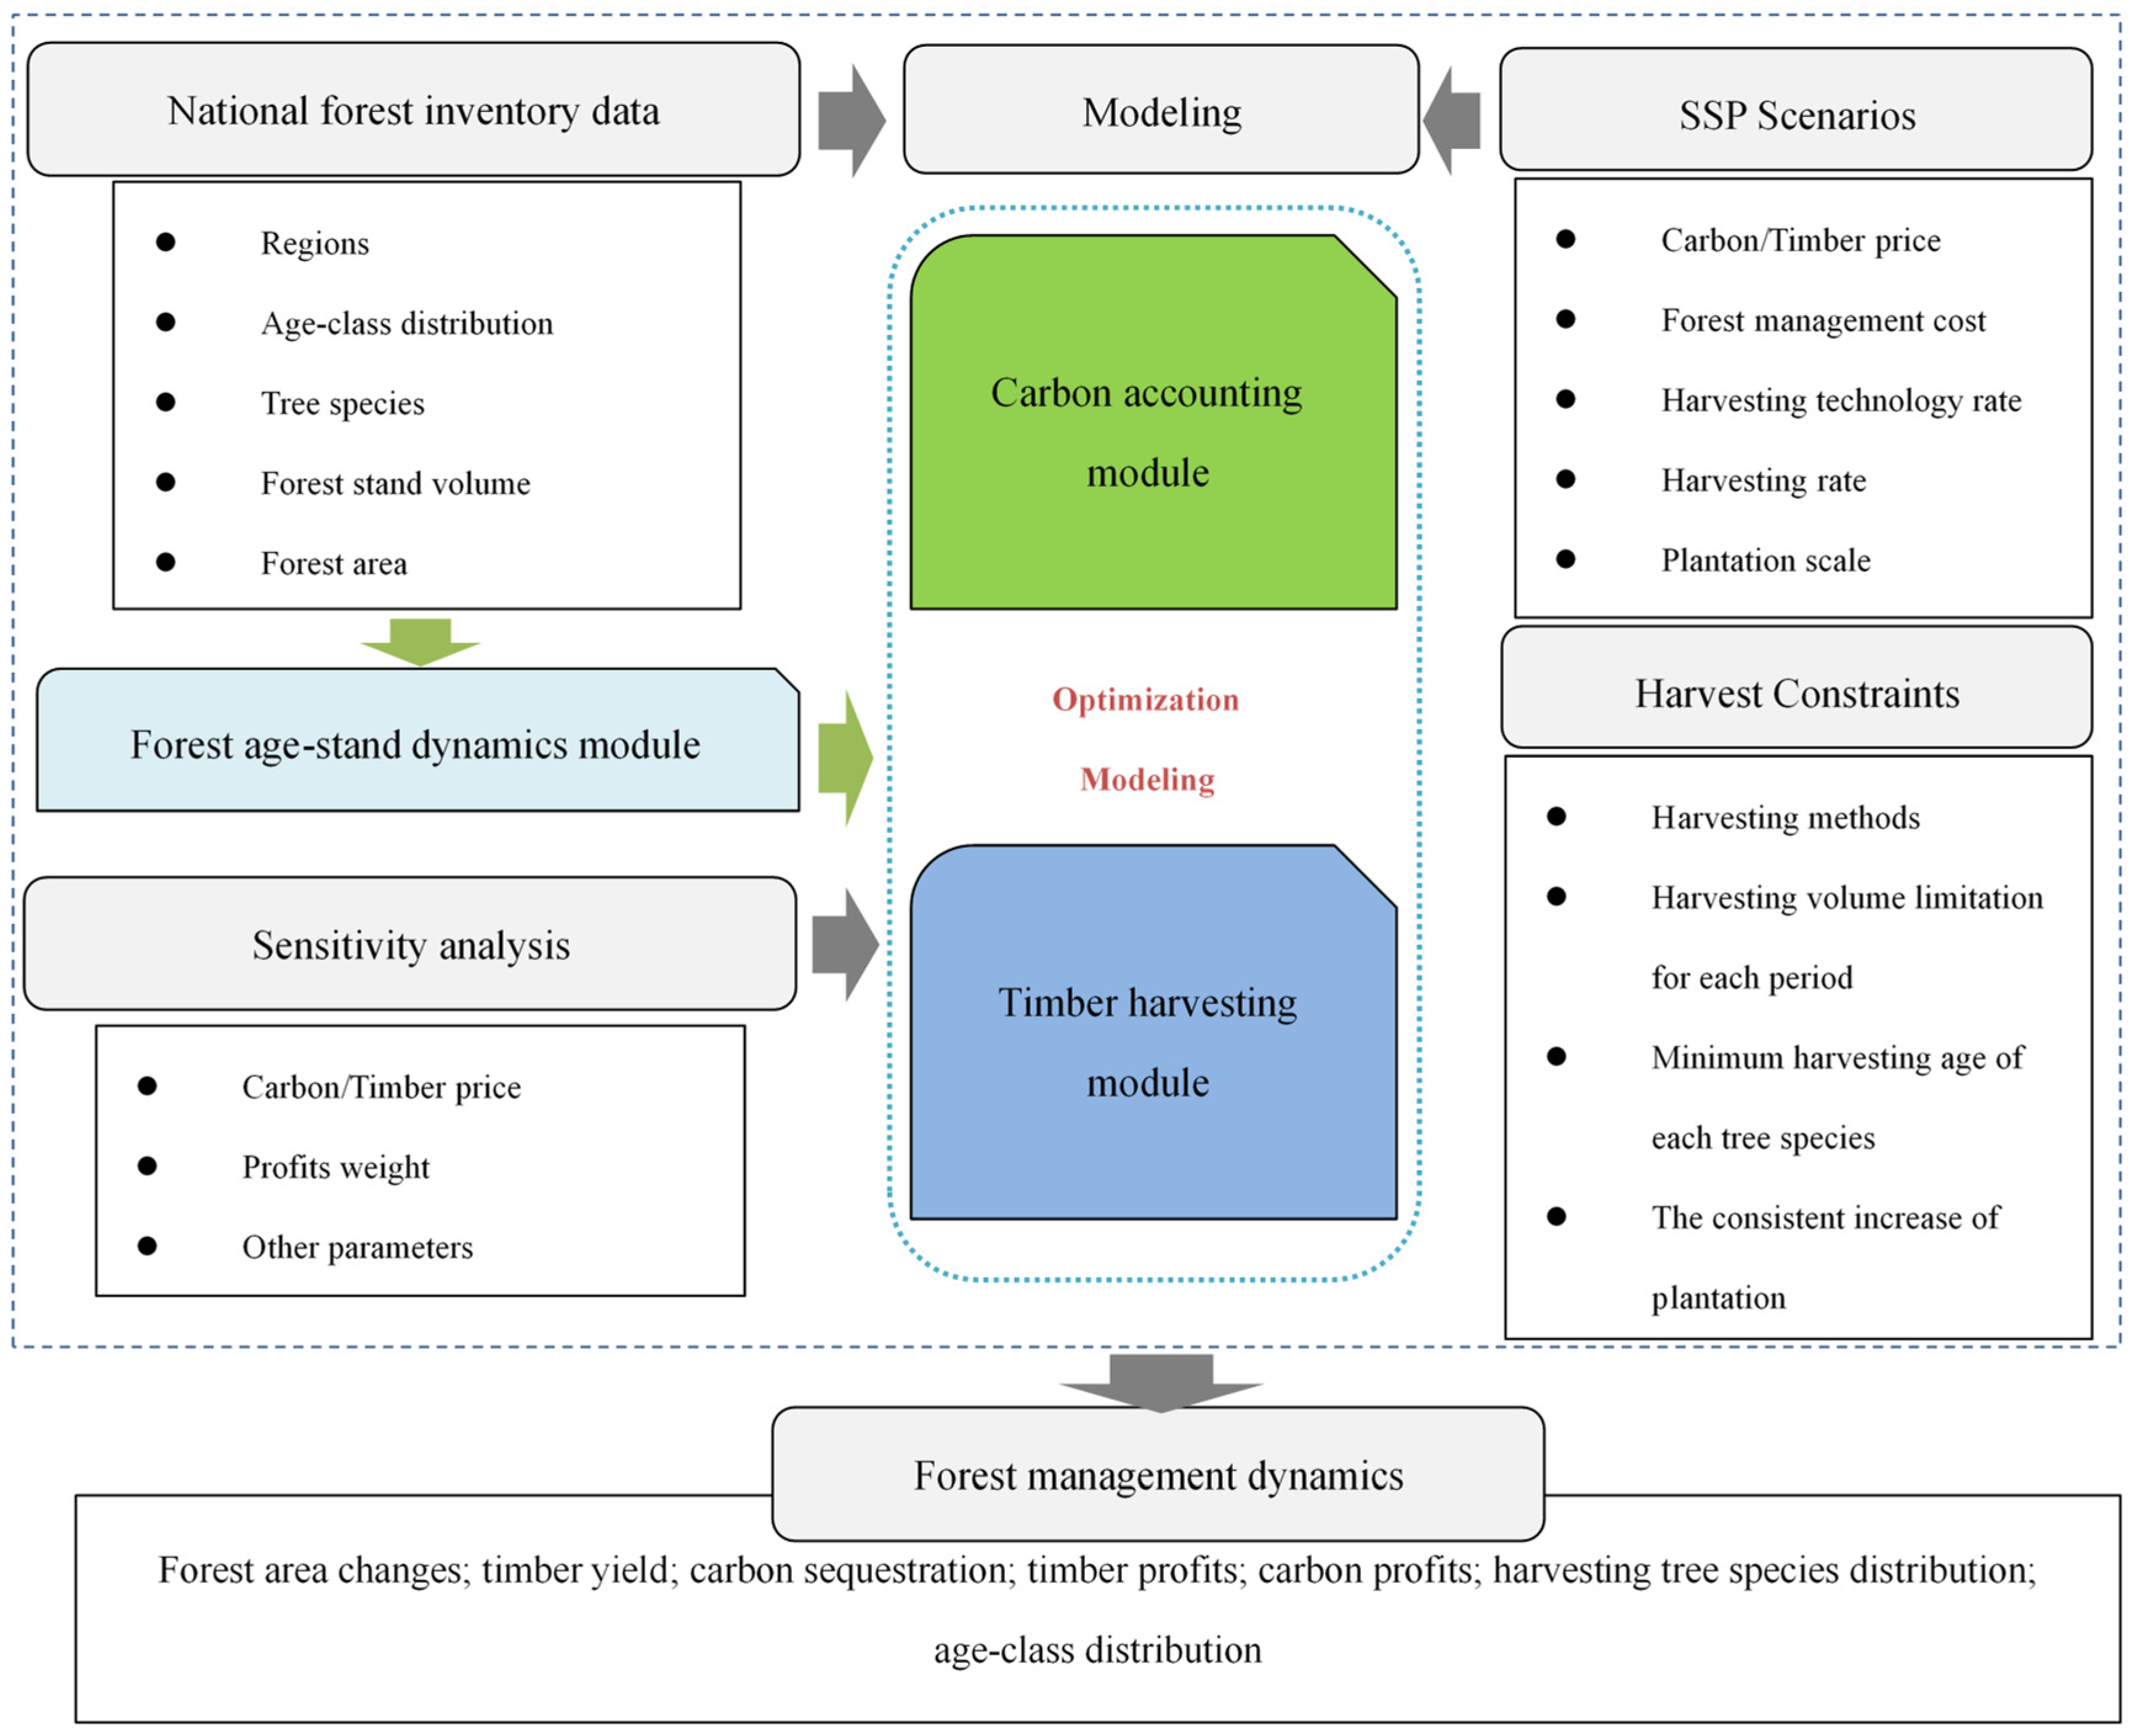
2.1. Research Design

In this study, we employed an optimization modeling approach and used the 9th National Forest Resources Inventory (NFRI) data as input data for projection. The potential timber yields and carbon sinks of these spatially allocate alternatives were examined by quantifying their consequent changes at the regional tree species level in Chinese commercial forests within the harvest and afforestation constraints. The optimal schemes satisfying the constraints under the management objectives are obtained by the OpenSolver tool [36]. According to the natural resources condition, climate condition, and economic and social status, 31 provinces and municipalities (excluding Hong Kong, Macao, and Taiwan) are divided into 7 regions, including Northeast, North, Northwest, Central, South, East, and Southwest. The regional tree stock growth process was simulated by forest age-stand dynamics models. The planning duration in this study was 50 years (2018–2068); this was divided into ten 5-year intervals to optimize forest management. We applied SSP scenarios to explore future carbon sequestration, timber yields, and forest area changes, then examined the effects of socio-economic factors on forest management dynamics. The research framework is shown in Figure 1.

2.2. Shared Socioeconomic Pathway (SSP) Scenarios in Forest Management

Shared socioeconomic pathways (SSPs), initially proposed by O’Neill et al. [28], are expressed as five future development paths involving sustainability, regional rivalry, inequality, and fossil fuel development, as well as intermediate paths. The narratives of these paths describe possible future changes in demographics, human development, economics, institutions, technology, and the environment. SSPs are designed at the global level and are currently being used as the basis for integrated scenarios for the analysis of carbon emissions, land use, and climate change impacts. Many scholars and research institutions have developed and projected key elements and parameters based on specific narratives of SSPs [37,38,39]. Narratives of SSPs for the global forestry sector have also been developed [24]. Elements of the forestry sector include economic and population growth, international trade, technological change, wood product demand, land use regulations, and forest management intensity, with the assumption that each SSP varies. This study will further downscale the narrative of SSPs from the forestry sector to forest resource management based on the above studies. We build off specific aspects of the five SSP narratives by expanding on how the forest management dynamics could be affected by each pathway. The elements that are important to the management dynamics include technological change, plantation regulations, forest management cost, and felling regulations are assumed to vary across each SSP. The key elements described in each scenario of this study are shown in Table 1.
SSP1 represents a “sustainable” pathway that is highly adaptive and faces relatively low socioeconomic challenges. Following the sustainable management of forests, afforestation continues to grow due to better management, and the demand for forest-based facilities and processing technologies is constantly increasing. In contrast, SSP3, in which its links and institutions are relatively weak, has less technological progress and slow productive growth, as well as land designated for other uses at the expense of commercial forest areas. SSP4 assumes growing inequalities in regional development, with forest-rich areas encouraging forest management and forest-poor areas receiving strict controls. The rapid development that characterizes SSP5 is driven by fossil fuels and technological change. This scenario assumes the market demand rises, plantation and reforestation grow rapidly, and resource and energy consumption increase at a faster pace than the historical trend. A fifth narrative (SSP2) describes moderate challenges of both adaptation and mitigation with the intent to describe a future pathway where development trends are not extreme in any dimension and hence follow a middle-of-the-road pathway relative to the other SSPs. Timber prices and carbon prices are also key elements influenced by socioeconomic development, and changes are heavily reflected by factors such as population size and economic development. Therefore, we converted the projected timber and carbon prices generated by existing studies and institutions, based on the global SSP development path, into annual percentage changes that represent future market changes, as shown in Table A1. This study analyzed forest management alternatives and project future timber supply capacity and carbon sink potential through these narrative elements of five SSPs.

2.3. Forest Age-Stand Module

Considering that the forest resource endowment, climate, and soil conditions in each region vary, dominant tree species in each region were selected to manage and optimize ecosystem service functions in this study. We merged the smaller area of partial tree species into the corresponding similar growth characteristics of broadleaf and coniferous forest groups. Differences in forest types were not considered because past-to-present harvesting and afforestation of commercial forests in China were dominated by plantation forests. Six theoretical age-stand models [40,41,42] were employed in this study (Table A2) and fitted based on the regional forest resources dynamics from the 7th–9th NFRI database. We selected the best-fitted model as the age-stand model for each tree species, and the results of parameters estimation were shown in Table A3. Stand volumes in the unit area of each tree species were estimated by forest age-stand models.

2.4. Timber Production Module

We converted all revenues and costs to net present value (NPV) using the discount rate of 4% per annum based on the Faustmann model [43,44]. Volumes of various timber products as a result of harvesting were determined based on harvestable age and area requirements for national harvesting technical specifications. Given the complicated nature of selective logging in regional forest, we considered clear-cutting only. Our management cost ratio was calculated as 10% through the cost and revenue values of related literature [15,25,45], which included plantation, logging and transportation cost. The calculations of the timber production module can be expressed as:
N P V t i m b e r = i = 1 m j = 1 n k = 1 T h i j k d x i j k P i 1 + r 5 k 1
h i j k = S i j k + y i j k 1 + s i j k 1 v i j k t A i j k
A i j k = 0 ,     t i j k < T i m i n 1 ,     t i j k T i m i n  
where x i j k is the decision variable that represents the harvesting ratio of forest areas of tree i in region j in period k ; h i j k is the harvest volume of tree i in region j in period k ; P i is the net price without total management cost T C for the timber of tree i ; d is the harvest and processing technology rate; r is the discount rate in percentage; N P V t i m b e r is the total discounted NPV of timber during the entire planning horizon; k is the length of each 5-year period; S i j k is the initial area of tree i in region j in the specific period k ; s i j k 1 is the harvesting existing forest area of tree i in region j in period k 1 , the harvested area will be reforested in the following year according to the original tree species and then be classified as an available area for felling; y i j k 1 is another decision variable, which refers to the plantation area; v i j k t is the age-stand function of tree i at age t in region j ; A i j k is a binary variable indicating whether management unit is harvested or not when the tree age t i j k reaches the minimum harvest age T i m i n ; m is the number of tree species; n is the number of regions; and T is the total numbers of periods for the 50-year time frame.

2.5. Carbon Sequestration Module

Forest carbon sequestration in this study was mainly composed of the aboveground and underground biomass carbon of living trees considering the data available. We calculated the forest carbon sequestration for each type using volume–biomass method from Intergovernmental Panel on Climate Change (IPCC). This method translated the unit area volume into unit area biomass using parameters such as wood density, biomass conversion coefficient, and under-ground and above-ground biomass ratios. The parameters differed for varying tree species and age classes and were achieved in the literature [46] and the IPCC database [47]. The carbon content was assumed to account for 50% of the total mass of the trees [15,48,49]. Carbon sequestration was calculated based on the forest area and carbon density. When calculating the NPV of carbon sequestration, the net sequestration for successive time periods was estimated as the difference between the total remaining carbon in one period and the previous period. The carbon price was set to China’s 2018 carbon trade market average price, which was 50 CNY/ton [50]. The formulas for the carbon sequestration module can be expressed as follows:
N P V c a r b o n = i = 1 m j = 1 n k = 1 T C i j k P c 1 + r 5 k 1
C i j k = D c i j k S i j k s i j k + y i j k
D c i j k = Δ v i j k t D i B E F i 1 + R i
Δ v i j t = v i j t v i j 1 t 1
where C i j k is the residual aboveground and underground carbon sequestration of tree i in region j in period k ; D c i j k represents the carbon density which calculated by volume–biomass method; D i is wood density of tree i ; B E F i indicates the ratio of aboveground biomass to stem biomass; R i denotes the ratio of underground biomass to aboveground biomass of tree i ; Δ v i j represents the net forest volume from time period t − 1 to time period t ; P c is the price of carbon sequestration per ton; and N P V c a r b o n is the total discounted NPV of net carbon sequestration.

2.6. Management Objective, Constraints, and Assumptions

To analyze the forest management dynamics: forest areas, carbon sequestration, and timber yields, we maximize the total profit of NPV timber and NPV carbon for all SSPs. Given the social preference for carbon neutrality and timber security in China, we set the weight of NPV timber as 0.5 and the NPV carbon as 0.5 in the objective function and then optimized the forest management benefits. In the planning model, we adopted a clear-cutting method for Chinese commercial forests and set the same management units where clear-cutting areas were reforested within 1 year after harvest. To promote forest regeneration and afforestation, we placed the requirements on harvesting age, felling limitation or felling volume growth, and afforestation area expansion based on the Forest Harvesting and Renewal Technical Regulations in China [8], National Forest Management Plan (2016–2050), and China Forestry Statistical Yearbook. Hence, the constraints in the model included minimum harvesting age, regional felling volume growth ratio, relatively consistent afforestation scale for each period, and no harvesting activities in clear-cutting with areas greater than 50% of the total plantation area. Moreover, this study set the following assumptions: (i) the effects of unexpected events such as wildfires or illegal harvest were not considered; (ii) forest land transition and forest rights change were not included due to the uncertainties in related policies; (iii) the same tree species were regenerated in the original harvesting area as a result of the land-appropriate characteristics of tree species. Based on the above explanation and assumption, the management objective is defined as follows:
max Z = w e i g h t N P V t i m b e r + 1 w e i g h t N P V c a r b o n
s.t.:
b 0 i = 1 m y i j k S j k * 1
i = 1 m h i j k H j k 1
H j k = f H j k 1
x i j k 0.5
where Z is the total profit of timber and carbon profit with their weight of 0.5; S j k * is the area available for afforestation of region j in period k ; b 0 is the plantation ratio of commercial forest; H j k is the felling volume of region j in period k ; f is the felling growth rate; and x i j k is the harvesting area percentage of the total area for each tree species.
In this model, Equation (8) maximizes the discounted NPV from timber and carbon during the planning horizon. Equation (9) concerns the afforestation rate constraint, meaning that the afforestation area at each key time must be no less than b 0 and no higher than 1 of the total plantation areas during the same period. Meanwhile, Equation (10) indicates that the harvesting volume at period k would not be allowed to exceed the maximum felling volume in period k. Equation (11) defines the felling volume growth trend. In addition, Equation (12) indicates that the harvest area of each target age class of forest types should be within 50% of the total area for that tree species.

2.7. Data

Commercial forests (CFs), which account for 30.9% of the forest area in China according to NFRI, are the domestic source of timber supply. We obtained the age group, stand volume, and area for each dominant tree species in all regions from the NFRI database. With these data, we modeled the age-stand dynamics, timber harvesting, and carbon accounting and carried out the optimization process. According to the age group and age classification standards of the dominant tree species from the State Forestry Administration, each species was divided into five age classes and the median age in each age group was applied for each tree species in this study. The five age classes are: young, middle-aged, near-mature, mature, and over-mature. The age range of each age group was derived from the National Forest Resources Continuous Inventory Technical Regulations 2014. Most CFs in China are still young, and the government has adopted the felling ban policy and harvesting technology regulation. Hence, we established the constraints based on the harvesting and planting requirements according to the national and regional regulations [8]. The initial regional felling volume limitation in 2018 was sourced from National Summary of Annual Forest Harvesting Limits for the Thirteenth Five-Year Plan Period. The proportion of commercial forest plantation was defined according to the National Forest Management Plan (2016–2050) and the 9th forest resources inventory data. Harvesting and processing technology rates were set based on the average of the input and output ratios of all diameter classes of trees [15]. Social and economic parameters, including the carbon prices and timber prices, were sourced from the China Carbon Emission Trading [50] and other official websites (www.yuzhuprice.com and http://www.chinatimber.org/ (accessed on 10 August 2022)). The data sources of other relevant parameters in this model were provided in the previous sections.

3. Results

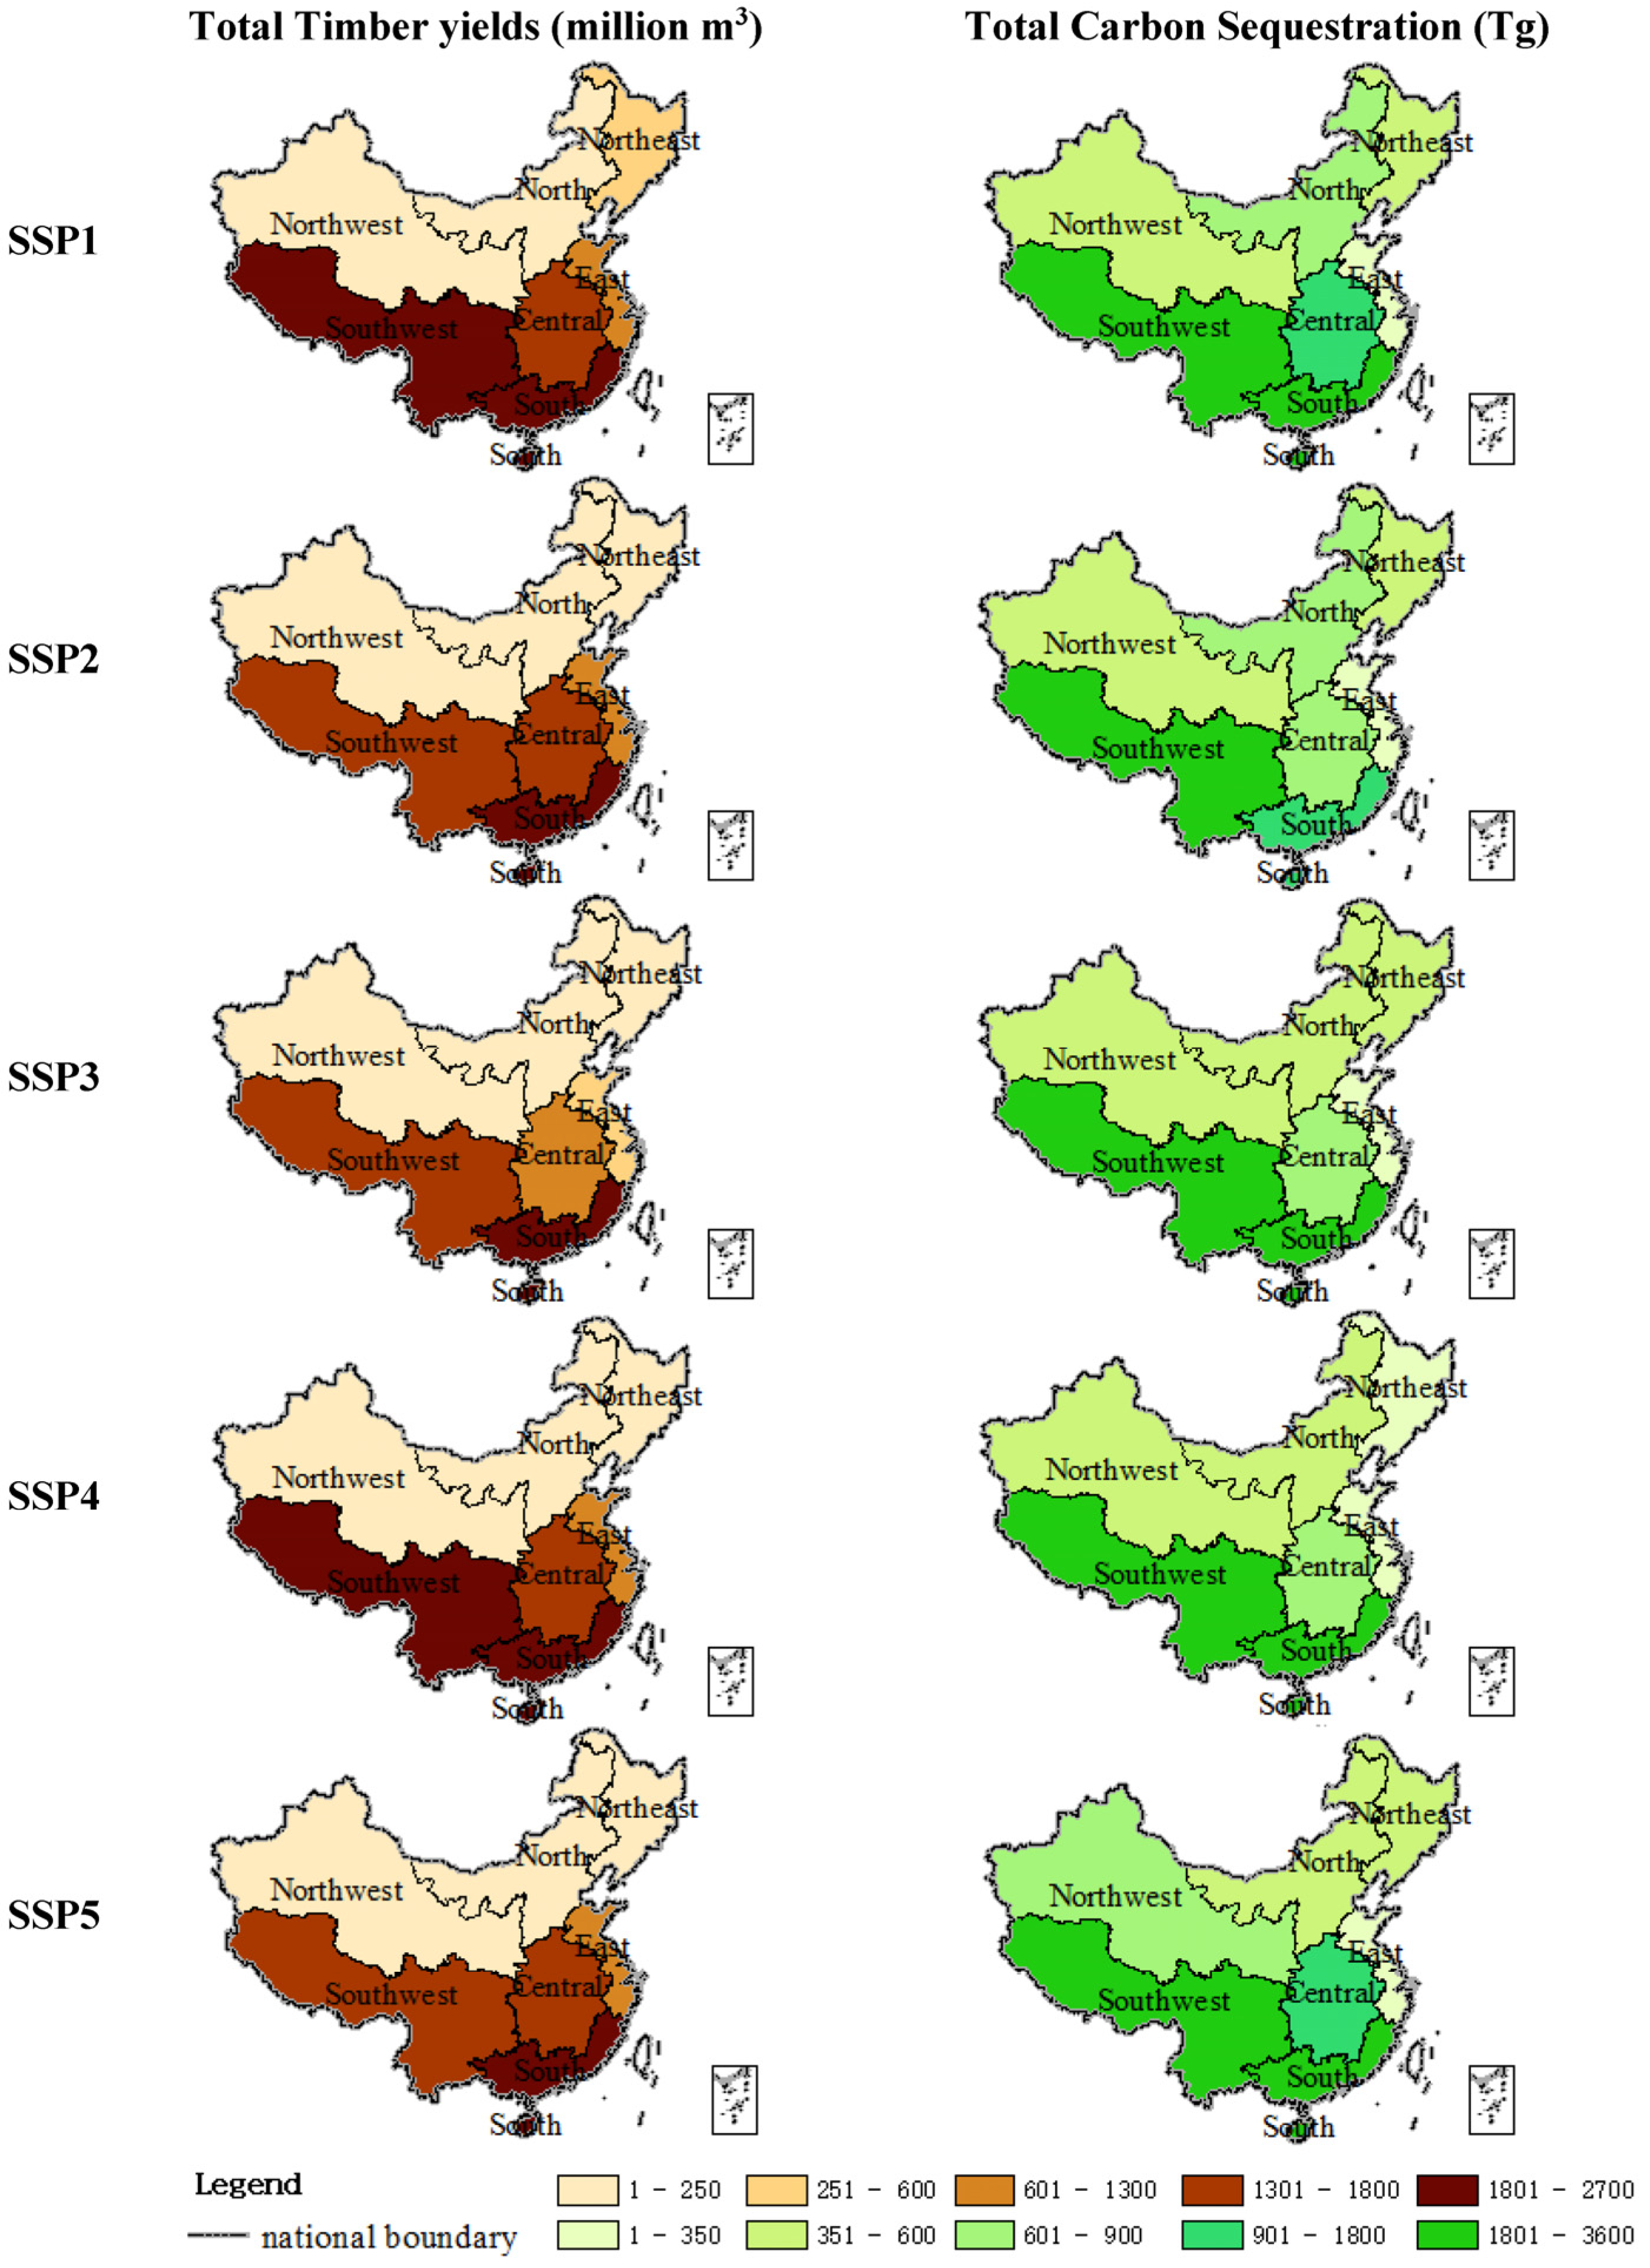
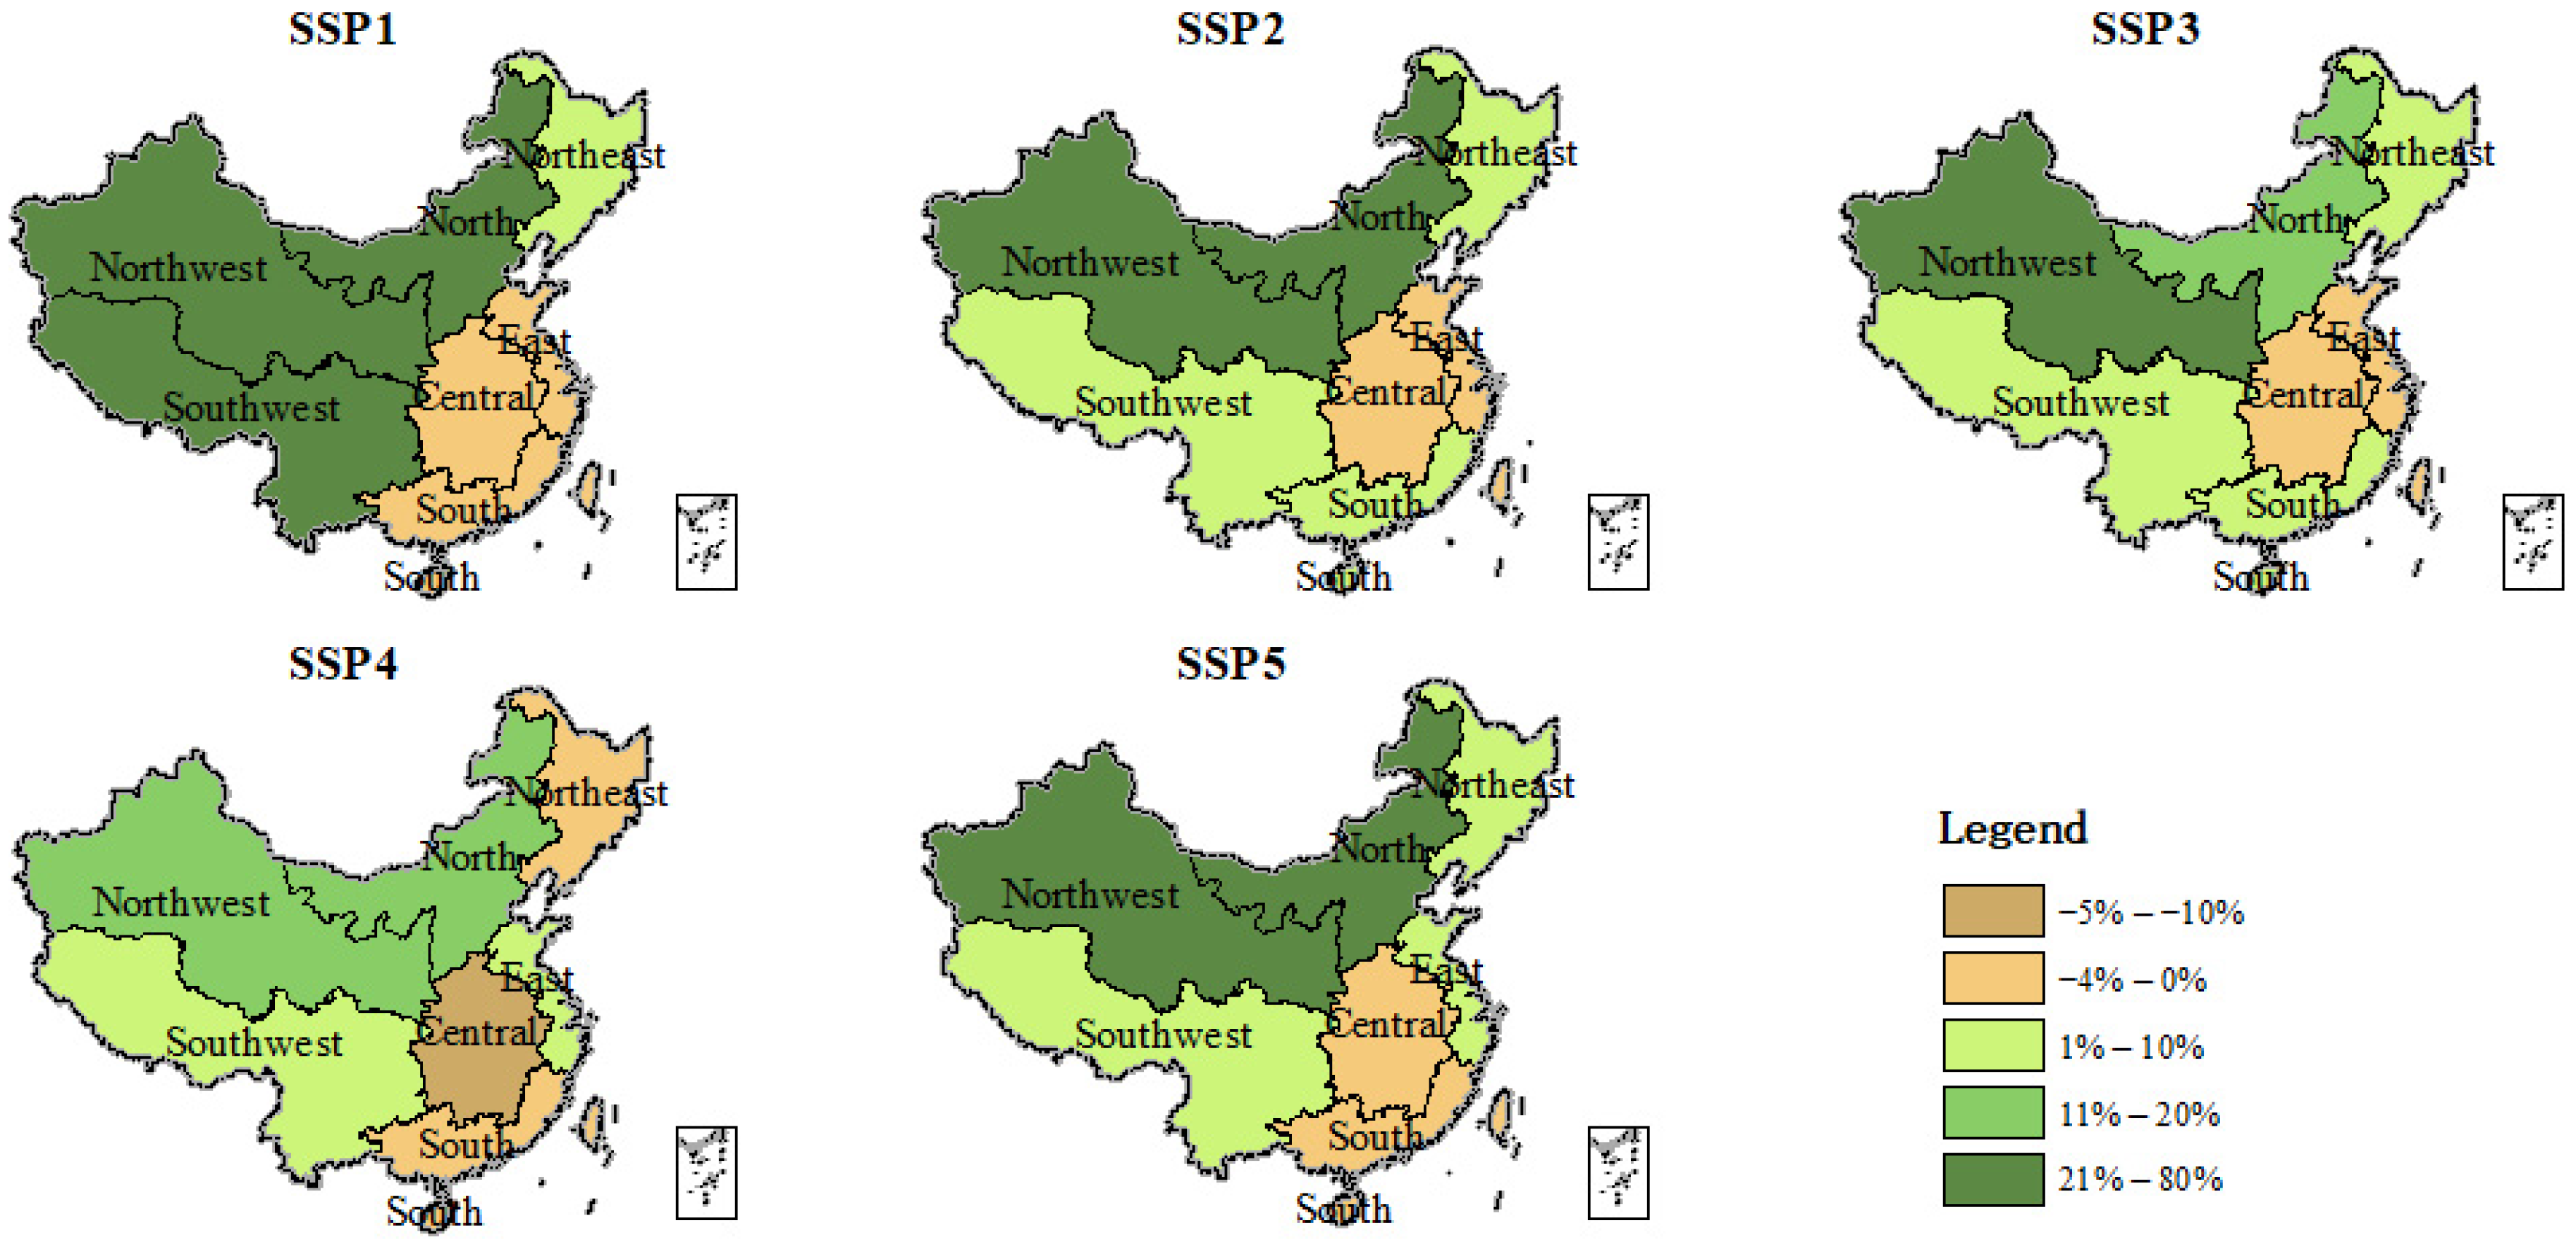
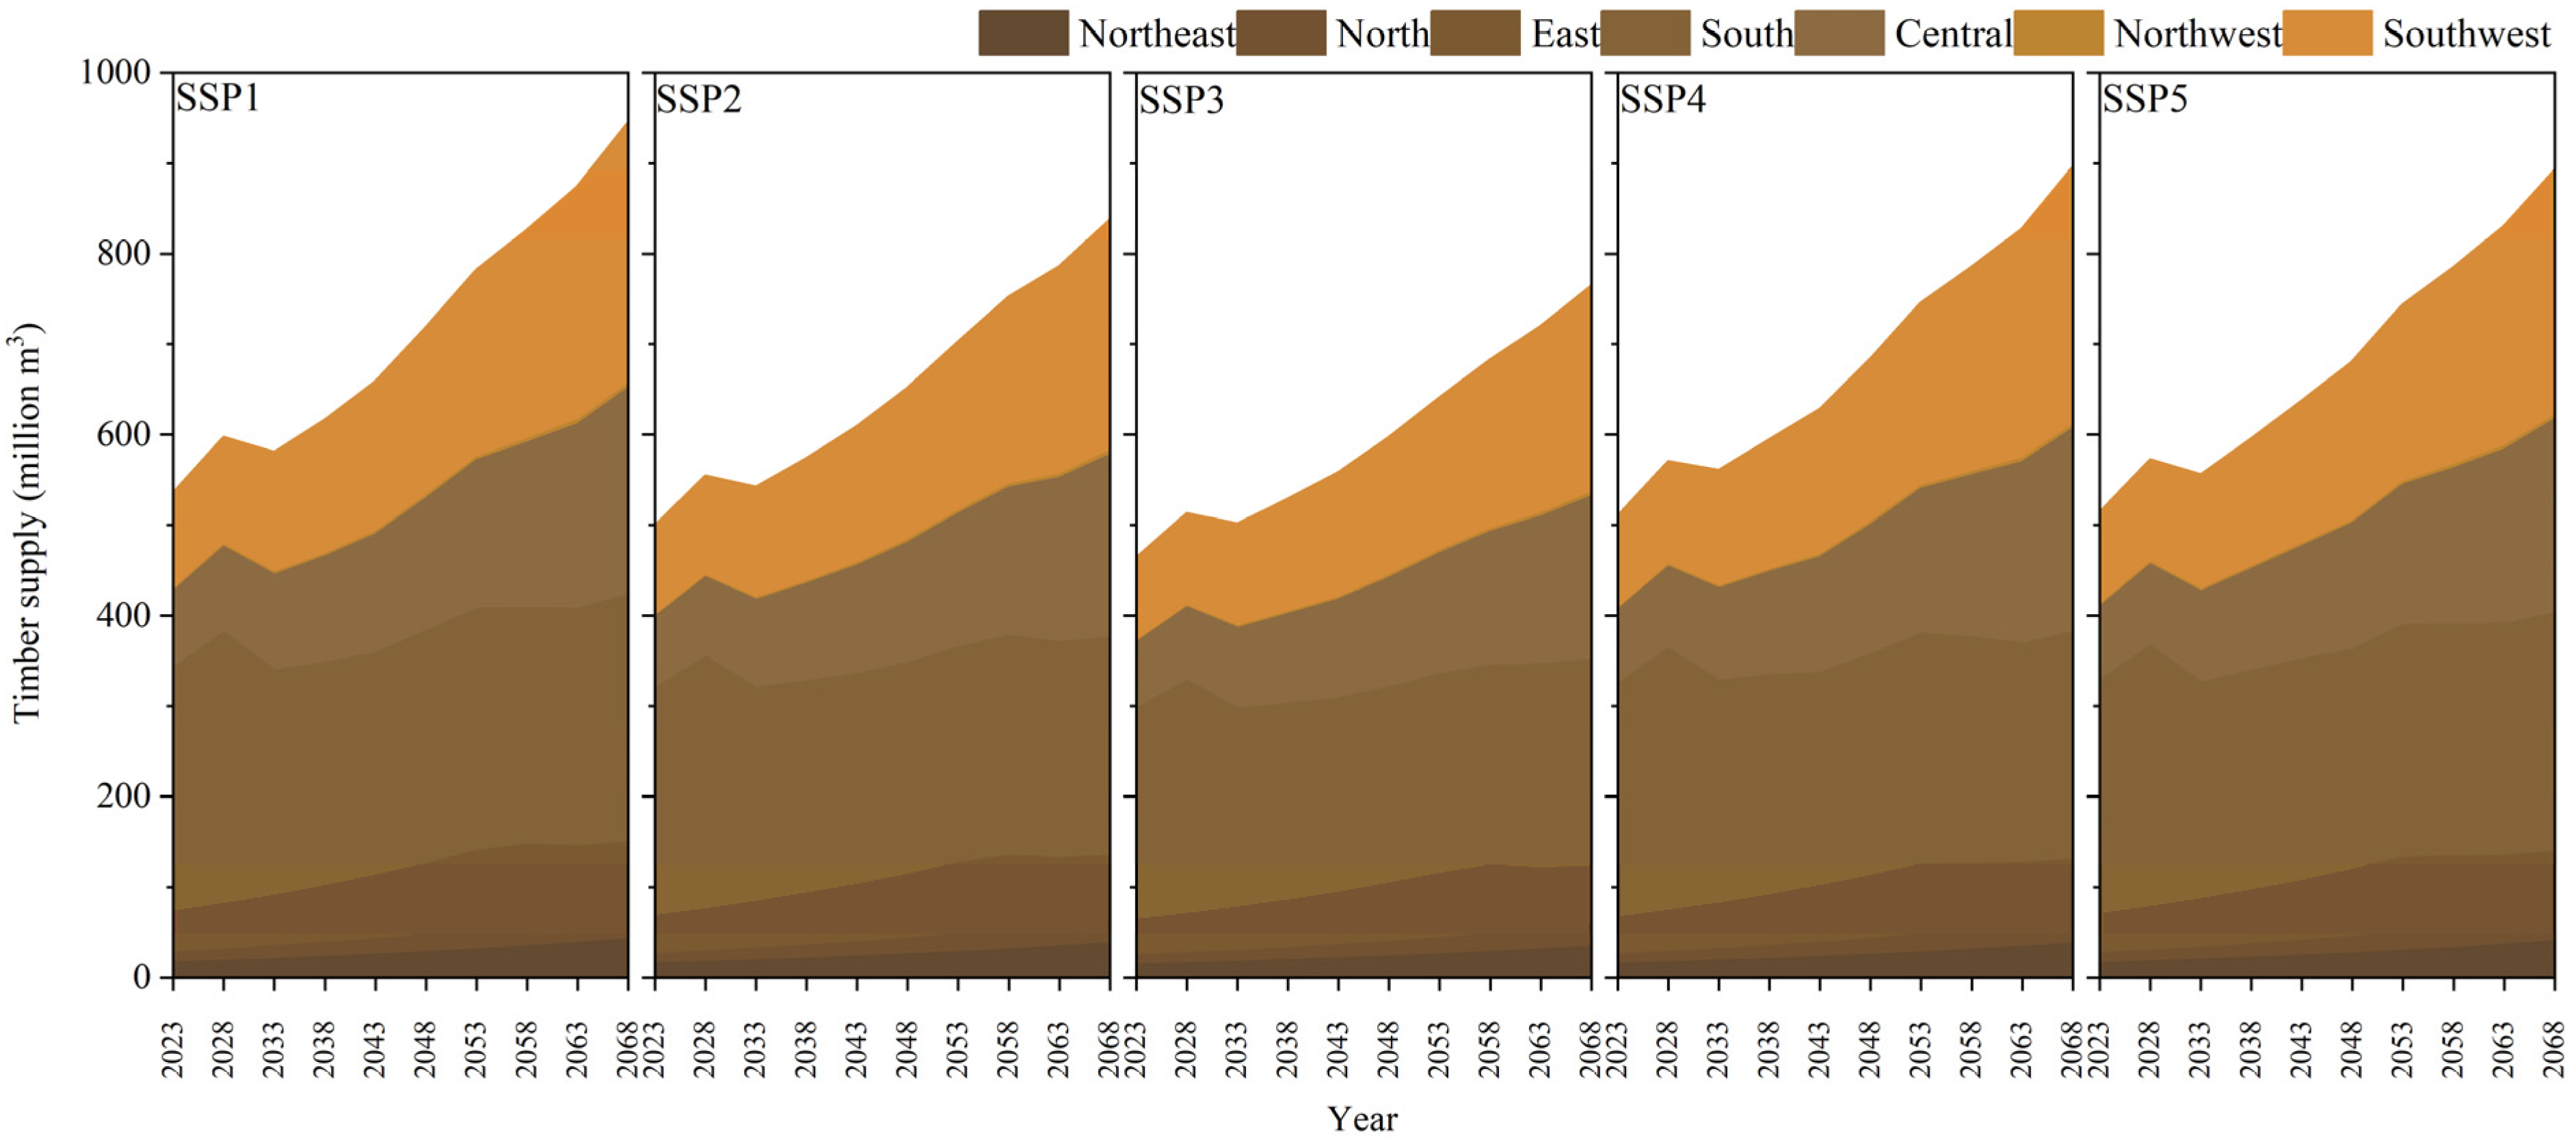
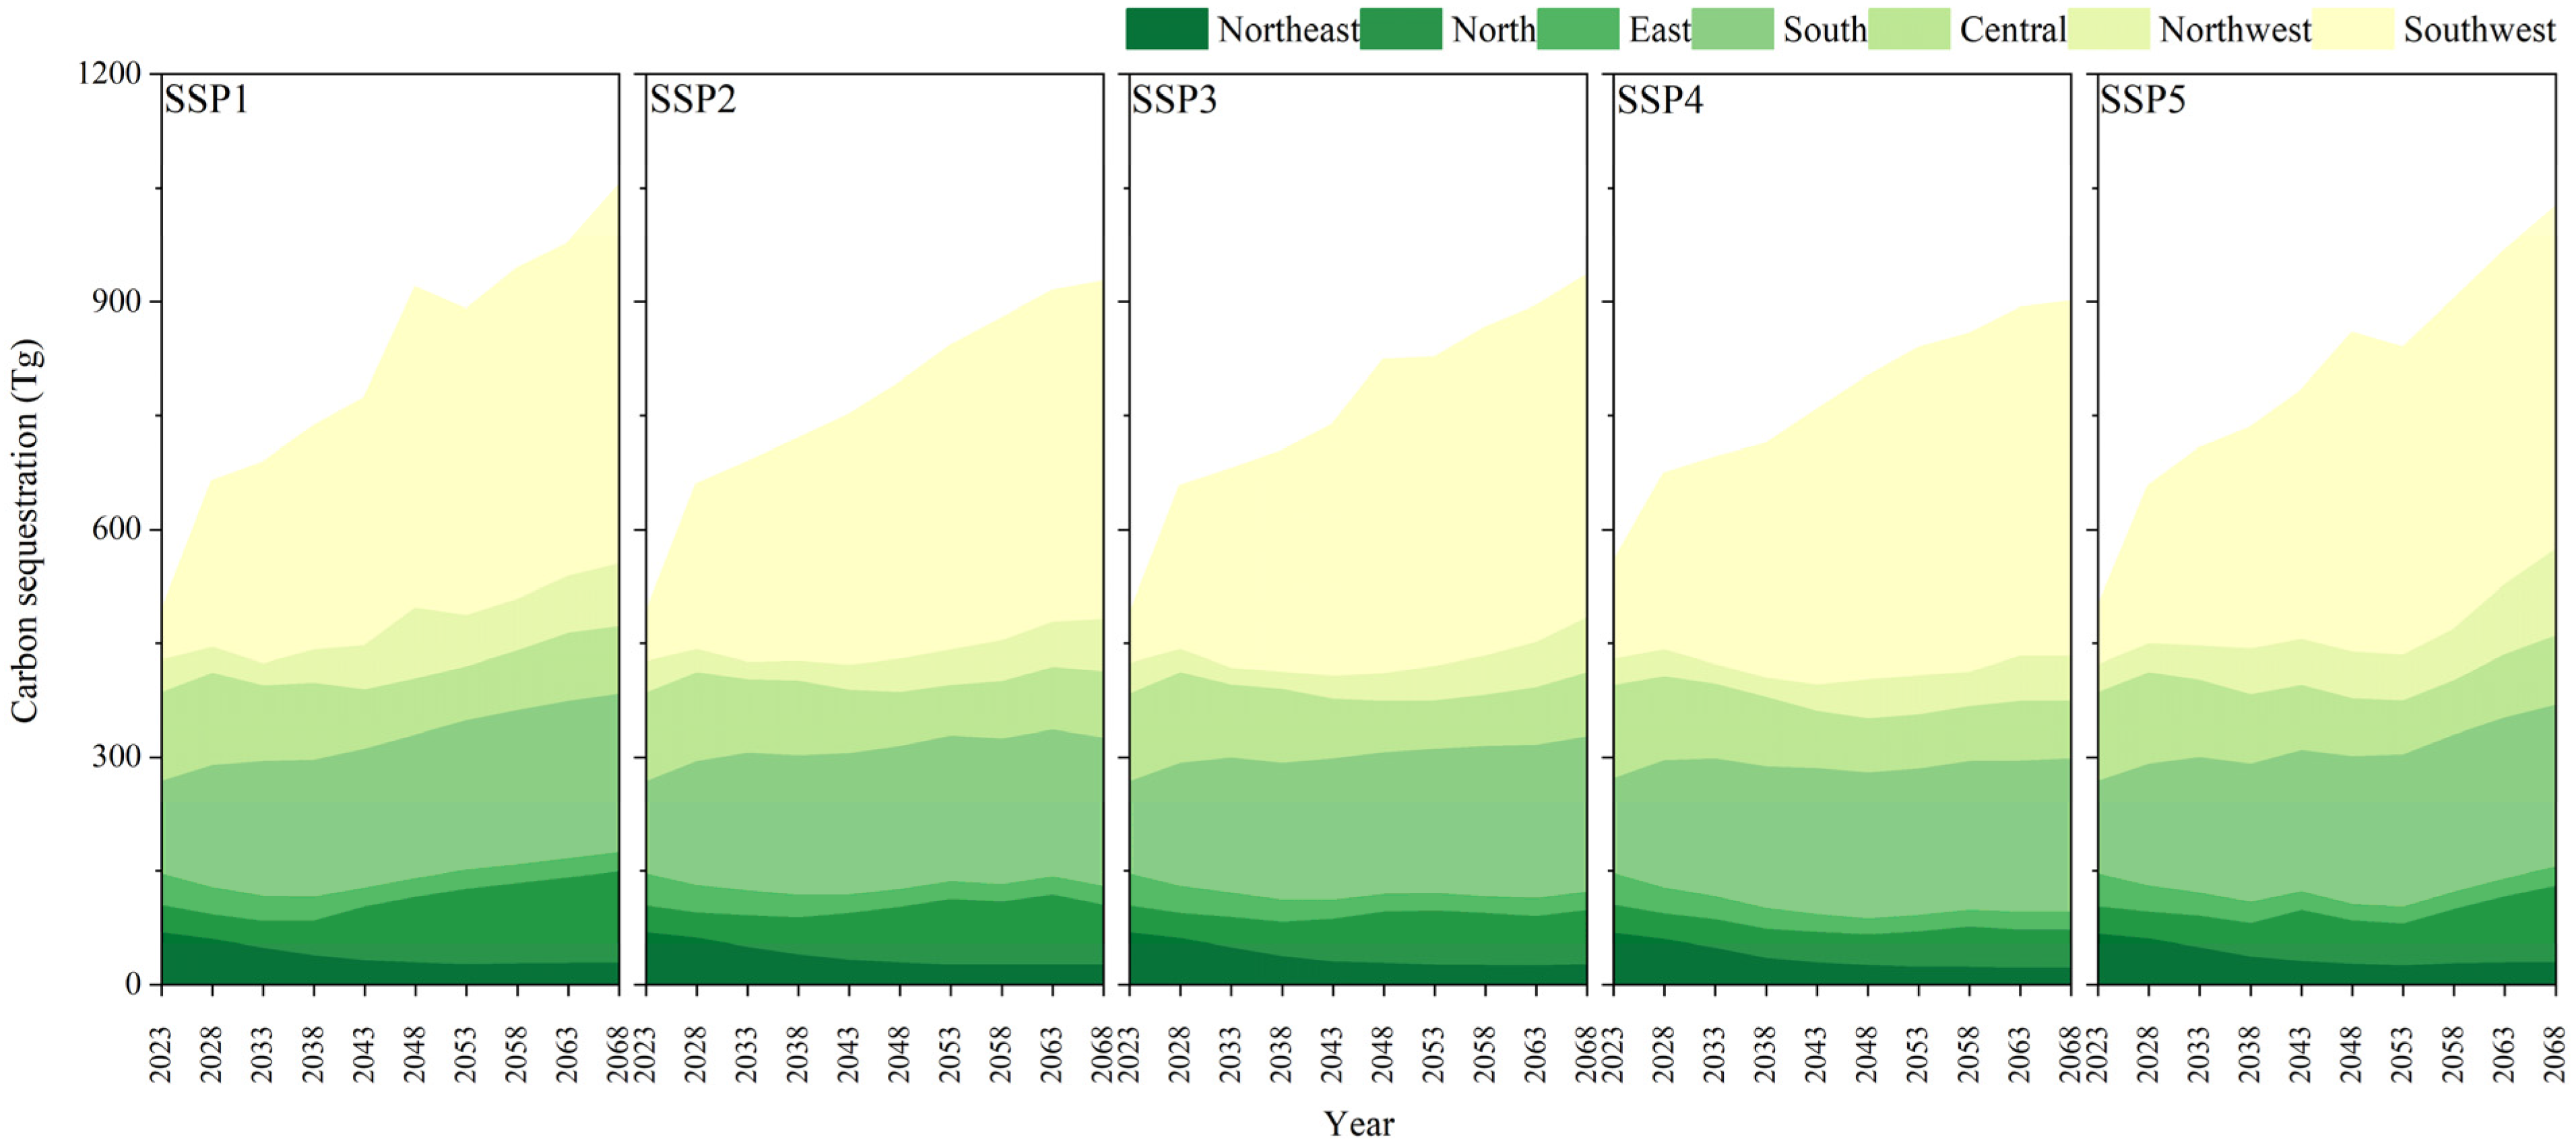
3.1. Projected Regional Timber Yields and Carbon Sequestration

Commercial forests (CFs) in China can provide substantial forest carbon sequestration and guarantee timber security. All regions in the SSP scenarios experience increasing forest supply and carbon sequestration, albeit at varying capabilities, as shown in Figure 2, Figure A1 and Figure A2. By the end of the 50-year study timeframe, China will yield 6.0–7.1 billion m3 of timber, cumulatively creating a 7600.9–8126.1 Tg carbon sink. Among the five SSPs, SSP1 will be the highest accumulated gainer, with 7.1 billion m3 of timber yields and 8126.1 Tg of carbon sequestered, followed by SSP5 (6.8 billion m3 in timber yields and 7961.5 Tg in carbon sequestration) and SSP4 (6.8 billion m3 in timber yields and 7675.7 Tg in carbon sequestration). Under SSP3, conversely, China is projected to experience the least timber yield and carbon sequestration, which amounts to 6.0 billion m3 and 7600.9 Tg, respectively. At the region level, the Southern Region, including southwest China and south China, is the largest contributor to both carbon sequestration (i.e., 59.0% of the total) and timber yields (i.e., 63.8% of the total). Under the best-case scenario, SSP1, the southwest region has the highest percentage of carbon sequestration at 41.6%, while the top timber supplier, with a 37.0% share of the total timber yields, is south China. The southern region is also the most implication region by scenarios. For example, the southern region experiences a difference of 0.4 billion m3 in timber supply and 306.8 Tg in carbon sink between the base-case scenario and the worst-case scenario. The forest-deficient regions (i.e., Northwest and North China) are not expected to be major contributors to the timber supply and carbon sequestration after the next few decades due to their climatic conditions and the large proportion of young forests. This demonstrates the geographical advantages that certain regions can cultivate fast-growing and high-carbon storage trees. The projected forest services would not be uniformly distributed spatially.

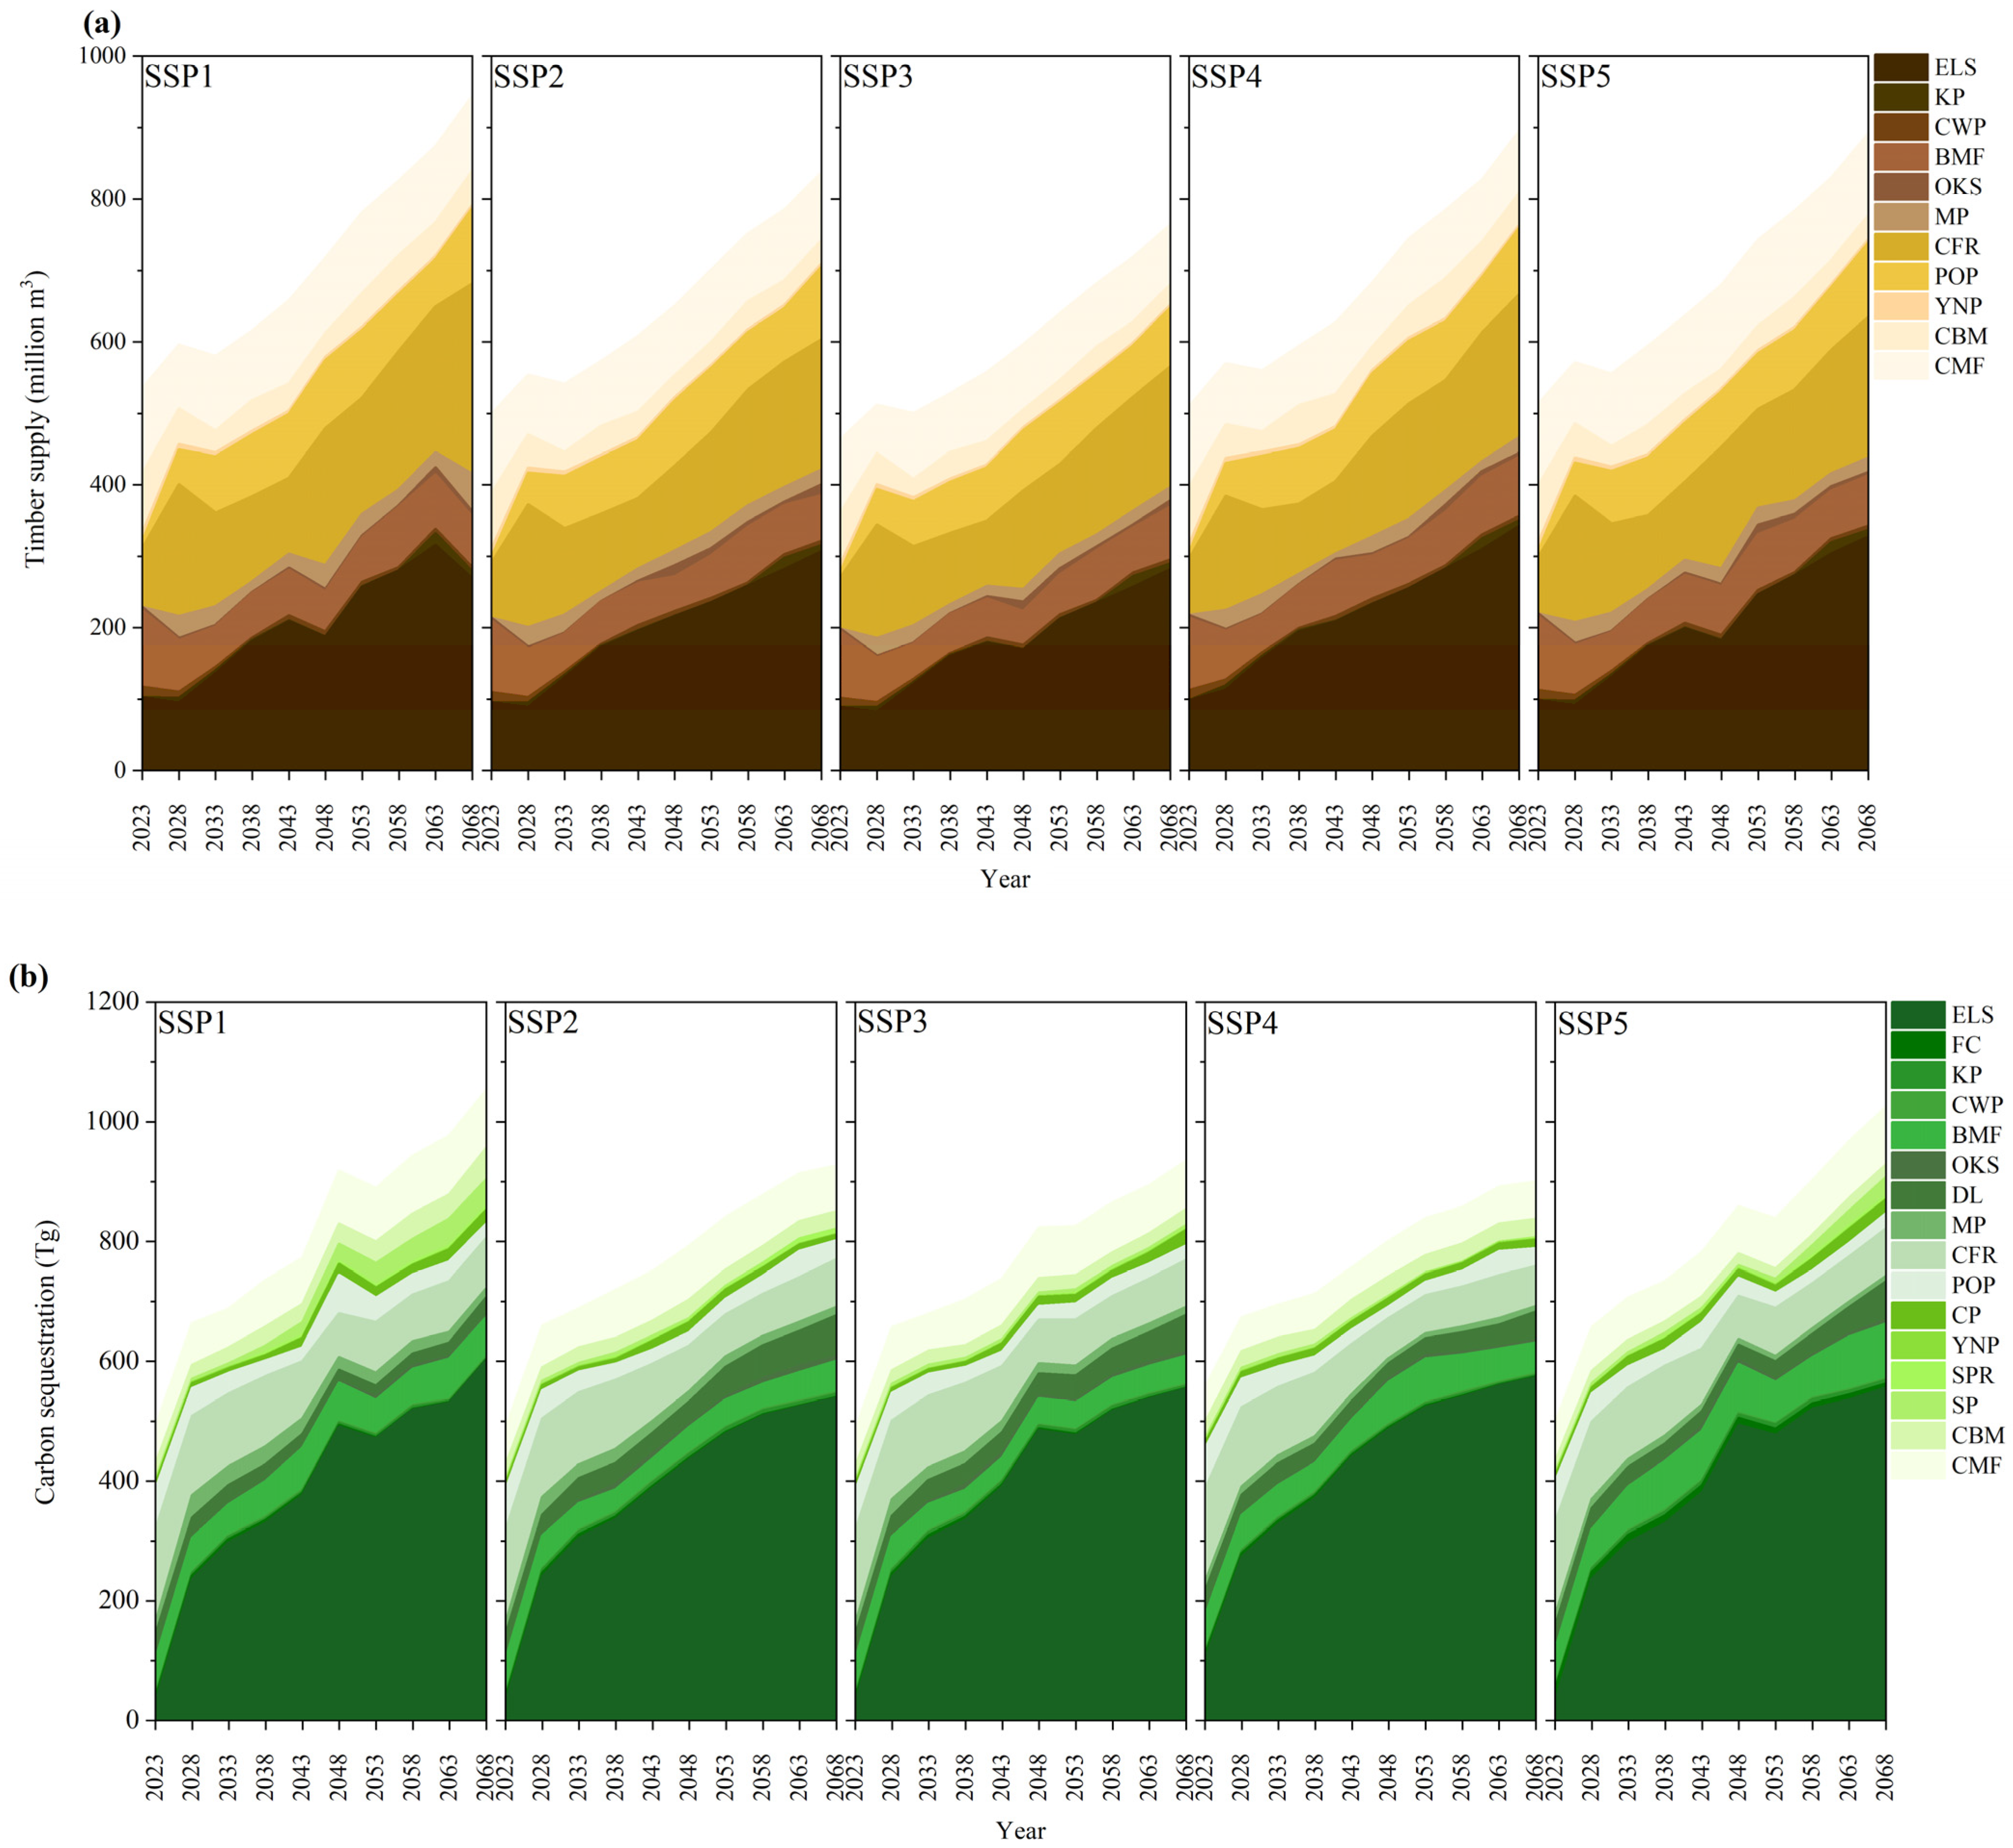
3.2. Projected Timber Yields and Carbon Sequestration by Tree Species

Our projections reveal that timber yield shows an upward trend among all SSPs, which supply 119.2–142.4 million m3 annually when translating to the yield capacity, as shown in Figure 3a. With a 5.9% growth per 5-year interval, SSP1 has the highest accumulated timber yields, while SSP3 has the lowest yield of 5.1% growth per 5-year interval. We estimated that China can experience a timber yield increase of about 70% or more over 50 years. About 30% of China’s total timber supply is eucalyptus, and its supply is estimated to grow from an average of 96.1 million m3 per 5-year interval in the beginning of the study timeframe to 305.0 million m3 by the end of the 50-year timeframe. The production of Chinese fir and poplar show the same increasing trend and will at least double the initial production after 50 years. In contrast, other tree species present fluctuating downward trends, such as Yunnan pine, Coniferous and broad-leaved mixed forest, and Broadleaf mixed forest. Under SSP4, Eucalyptus remains the largest cumulative supplier of timber and the yielding contribution rises threefold in the tenth period, which accounts for 38% of the total. Across the two aggregate forest types, coniferous and non-coniferous, we estimated that the non-coniferous timber supply would be approximately 47%–55% of the total among SSPs, after 50 years. In 2018, however, China mainly supplied non-coniferous timber, which accounted for 82% of the total domestic supply, and imported coniferous timber [9]. Further policy intervention or subsidy incentives are needed to optimize the domestic timber supply structure in China. In addition, our projections indicate that newly planted forests are the main source of timber supply, accounting for over 60% of the total. It can be stated that forest management activities can bring sufficient forest stock and provide high outputs.
For carbon sequestration, SSPs 1 and 3 demonstrate the highest and lowest carbon sink capacities, sequestering 162.5 Tg/a and 152.0 Tg/a, respectively (Figure 3b). The growth ratio of forest carbon sequestration could be 4.9%–8.0% per 5-year period during the next 50 years. The highest percentage of carbon sequestration comes from eucalyptus (48% of the total), followed by Chinese fir (12%), Coniferous mixed forest (9%), and Broadleaf mixed forest (7%). Combining with forest type changes, a consistent trend within each SSP is presented over next 50 years. The carbon sink contribution of broadleaf forests in China increases from 42% in the first period to 48% in the tenth period under the best-case scenario, and the contribution of coniferous forests increases from 40% to 48%. This is because newly planted forests and regenerated forests play an important role in forest carbon sinks, with an aggregate carbon sink that accounts for 80% of the total carbon sequestration. Moreover, forest outputs and services are highly associated with large-scale afforestation and regional ecological restoration efforts. For example, China’s Fast-growing and Productive Forestry Project has brought an amount of environmental and economic benefits, choosing eucalyptus and broadleaf forests as the main tree species by virtue of their fast-growing biomass stock and high-quality carbon service.

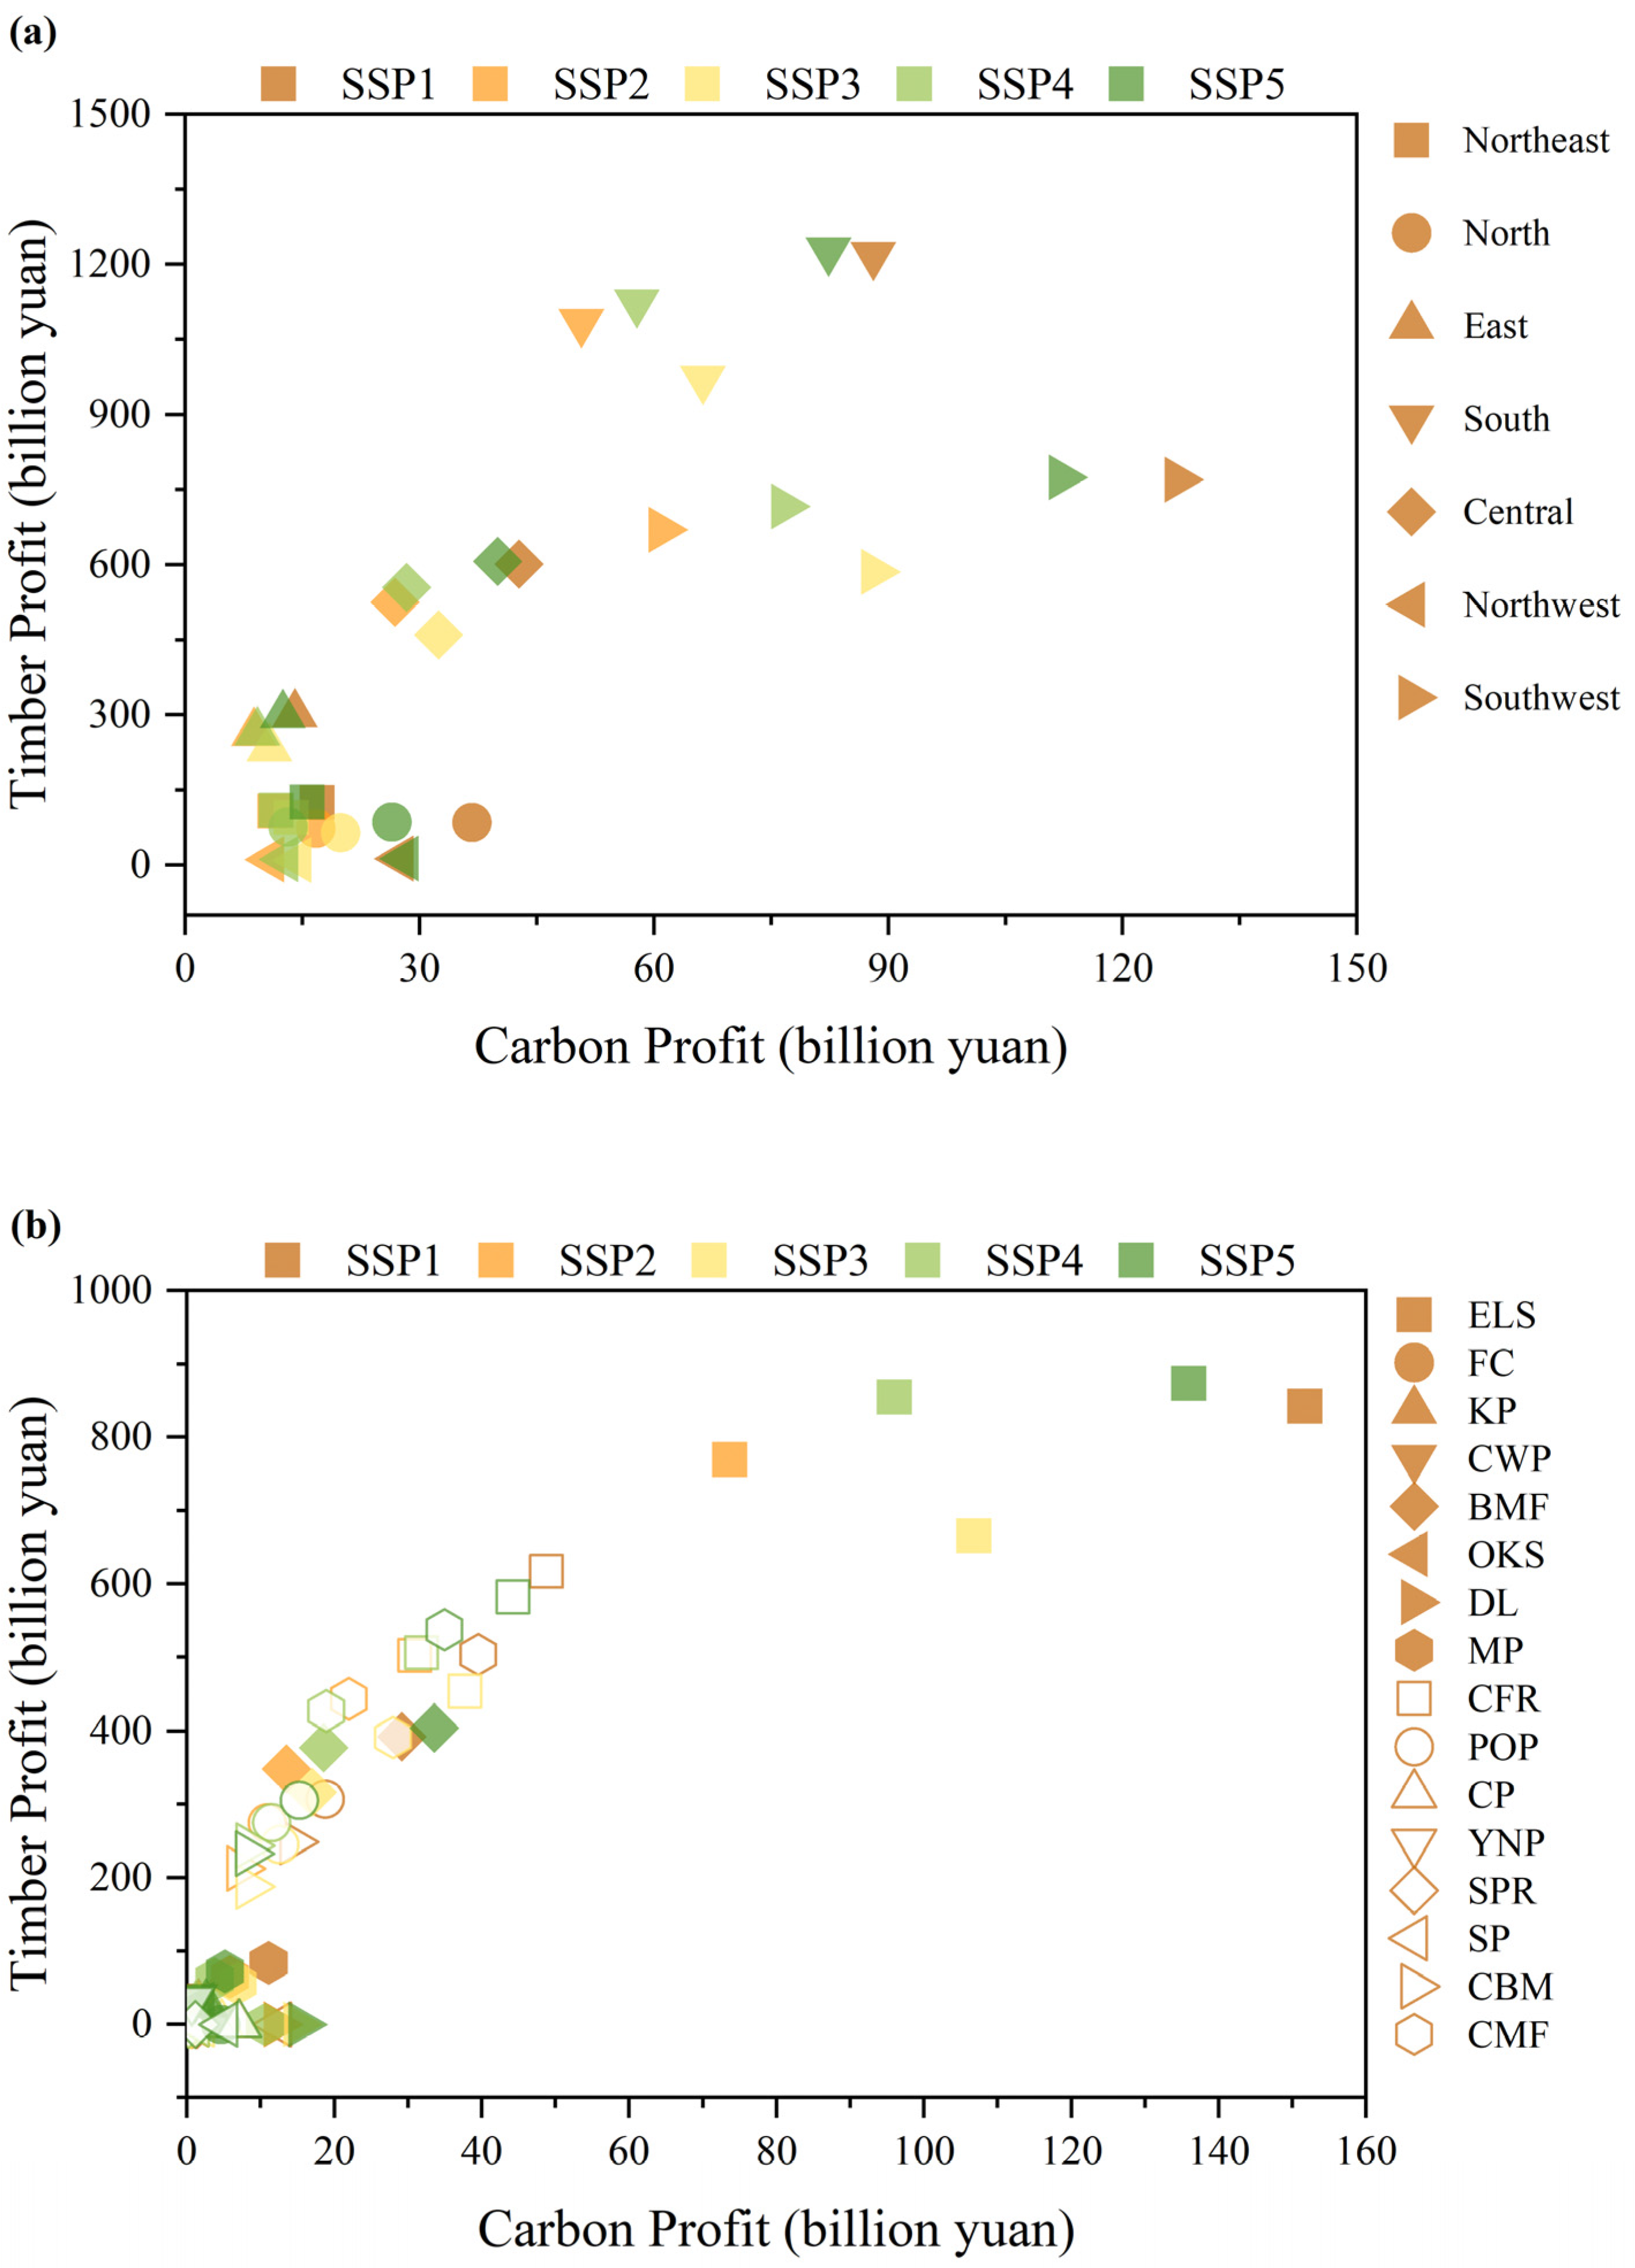
3.3. Total Timber Profits and Total Carbon Profits

Figure 4 shows the total forest carbon profits and total timber profits by tree species and by region under all scenarios. The largest total profit of CNY 3468.7 billion is achieved under SSP1 and the smallest profit of CNY 2666.6 billion under SSP3. In terms of regional impacts, South China’s CF yields the largest timber profit (CNY 1227.7 billion in SSP5) and carbon profit (CNY 127.0 billion in SSP1) in the analysis. In most parts of China, the carbon profit varies considerably under all scenarios, but the timber profit is relatively stable. Southwest China is the most diverse region of carbon gains under all scenarios, ranging from CNY 61.0 to 127.0 billion, which is mainly due to forest regeneration and afforestation. In terms of tree species, heavy influence by economic and social development pathways can drive eucalyptus to achieve the largest carbon profit (CNY 151.6 billion) and timber profit (CNY 842.6 billion) under SSP1. A significant variation under all scenarios is also found in Chinese fir, Coniferous mixed forest, and Broadleaf mixed forest’s timber profits and carbon profit, with differences of more than 25% between the highest benefits and the lowest benefits. Coniferous and broad-leaved mixed forest is the species with variations in timber gains but similarities in carbon gains under all scenarios. Due to the small forest area of other tree species, the variation of carbon gains and timber gains between scenarios is not obvious. In summary, carbon profits and timber gains vary widely among regions and tree species, so strengthening regional regulation and planning rational forest management can enhance forest carbon sequestration and timber supply capacities.

3.4. Sensitivity Analysis

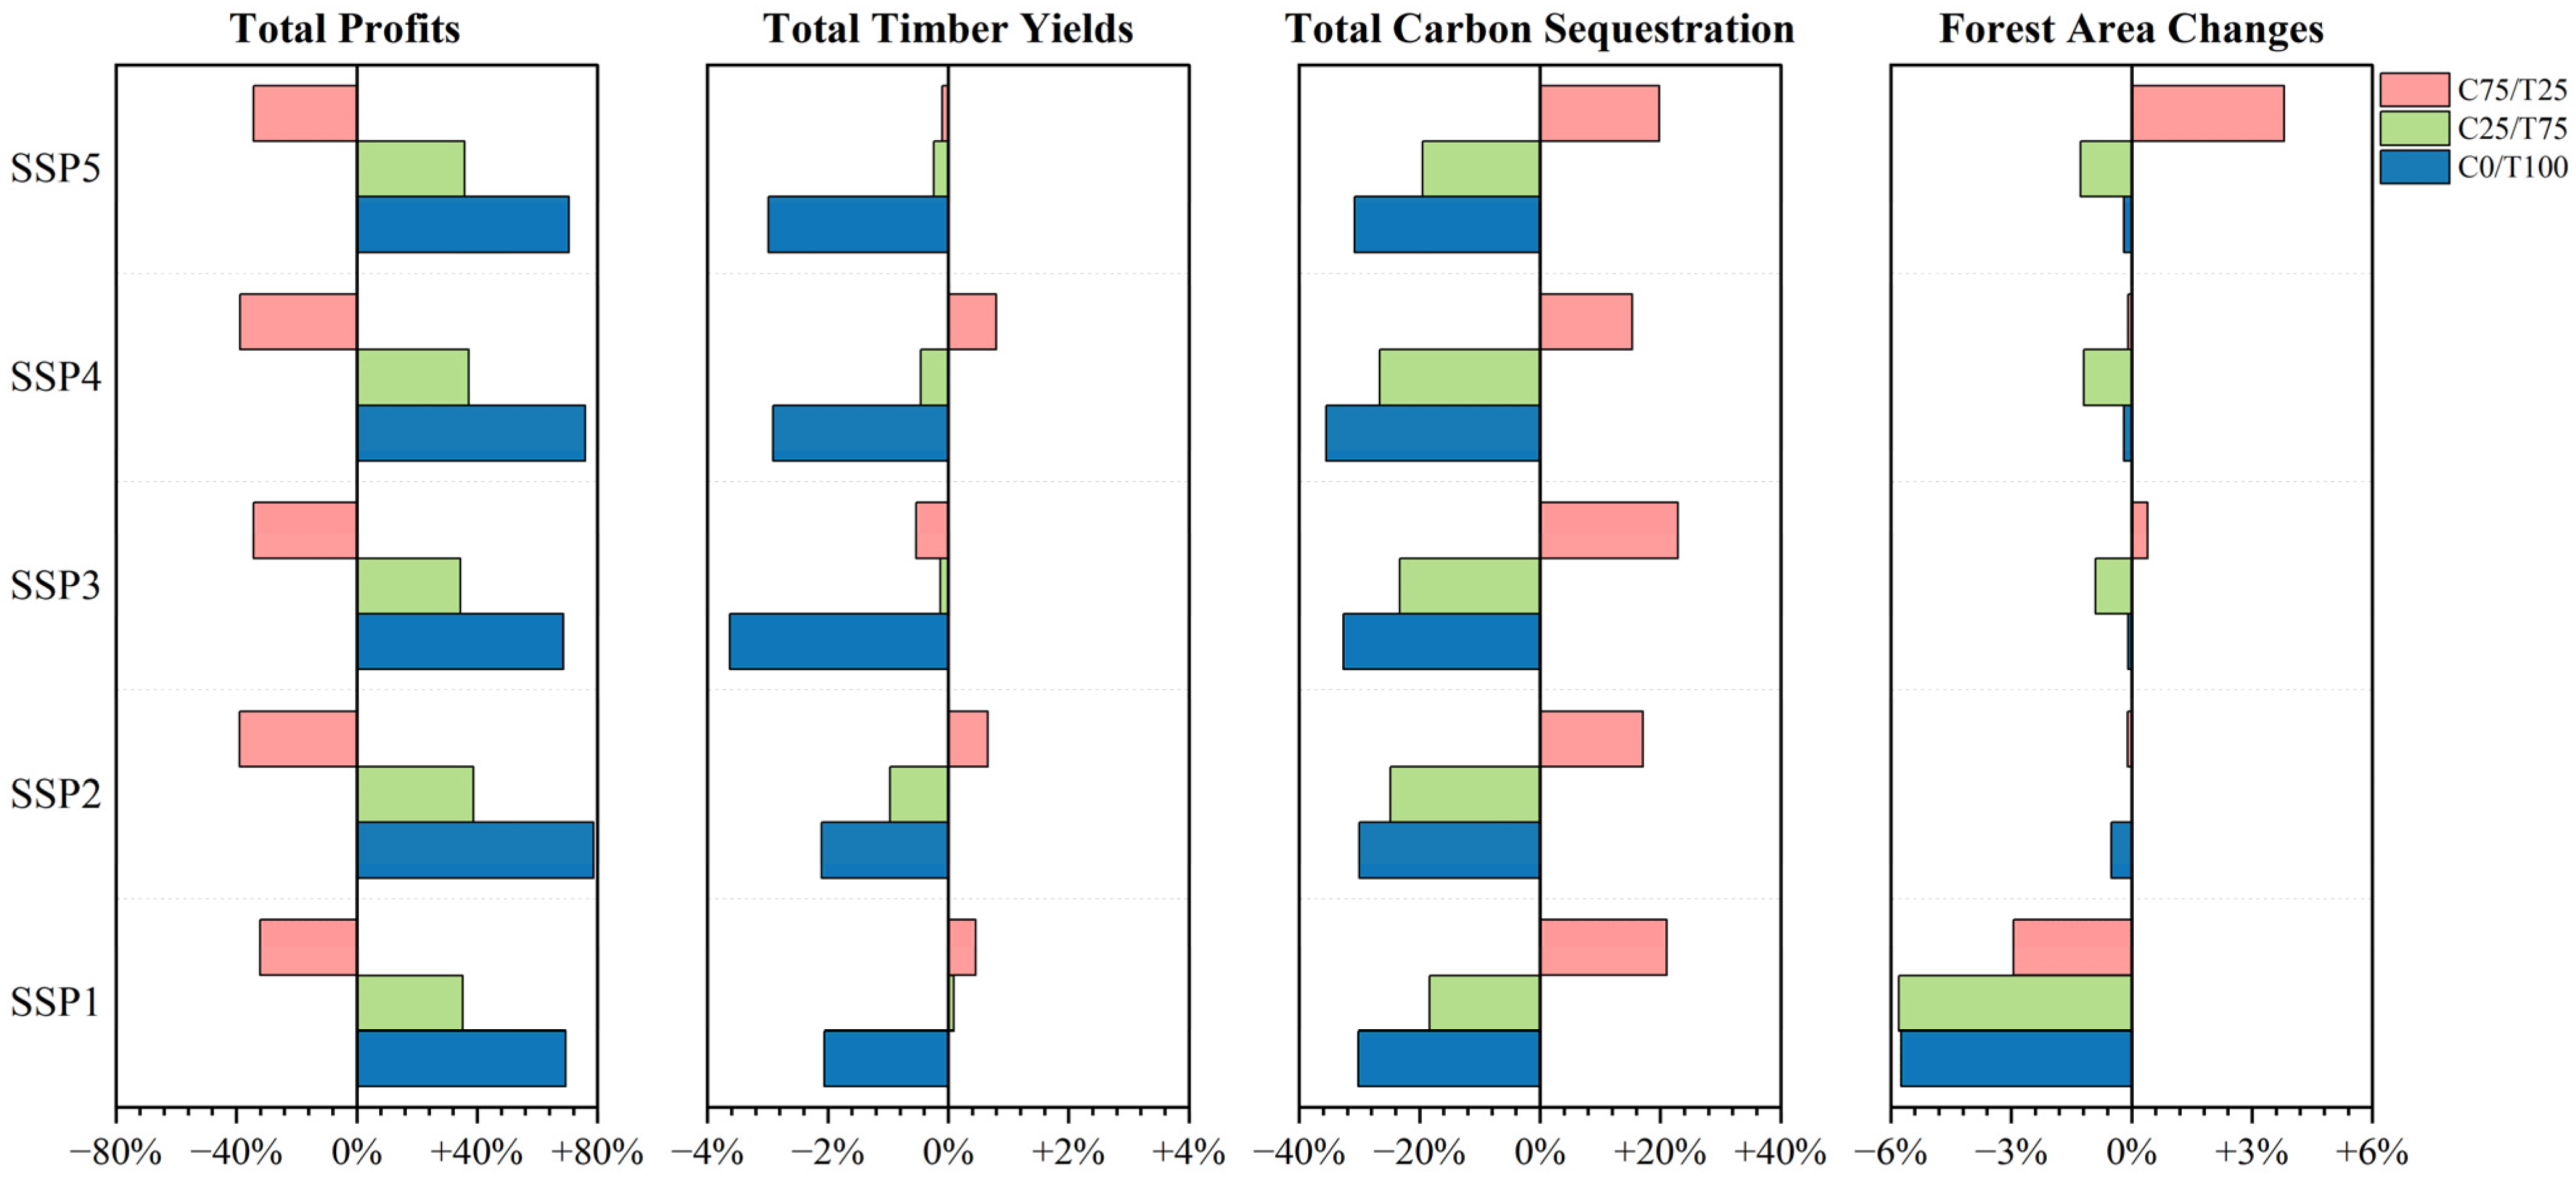
3.4.1. Social Preferences Sensitivity

In this study, we conducted a sensitivity analysis of total profits, total timber yields, total carbon sequestration, and forest area by adjusting profit weights that represent social preferences. The weight of carbon profit was shifted from 0, 0.25 to 0.75, and the corresponding weights of timber profit were set at 1, 0.75, and 0.25, respectively. Total profits and total carbon sequestration are sensitive to adjustments to the weight preference, but total timber yields and forest areas are not significantly impacted (Figure 5). Compared with the above results, an increase in the total profits occurred with the increase in timber profit weight, while the total carbon sequestration decreased. The current carbon price in China is much lower than the timber price, and thus, the changing of timber weights dominated the differences in total profits in all scenarios. It is also shown that carbon sequestration increased as the weight of carbon profit increased. Surprisingly, due to the harvesting limitation policy and low return, CFs experienced about a 30% reduction in carbon sequestration and a 3% decrease in the total timber supplies when timber weight increased to 1. Minor increases in timber yields only occurred under SSPs 1, 2, and 4 with a timber profit weight of 0.25, and under SSP1 with a timber profit weight of 0.75. Moreover, insignificant changes in the forest areas appeared in all scenarios except SSP1, indicating that forest area is only relatively sensitive under SSP1.

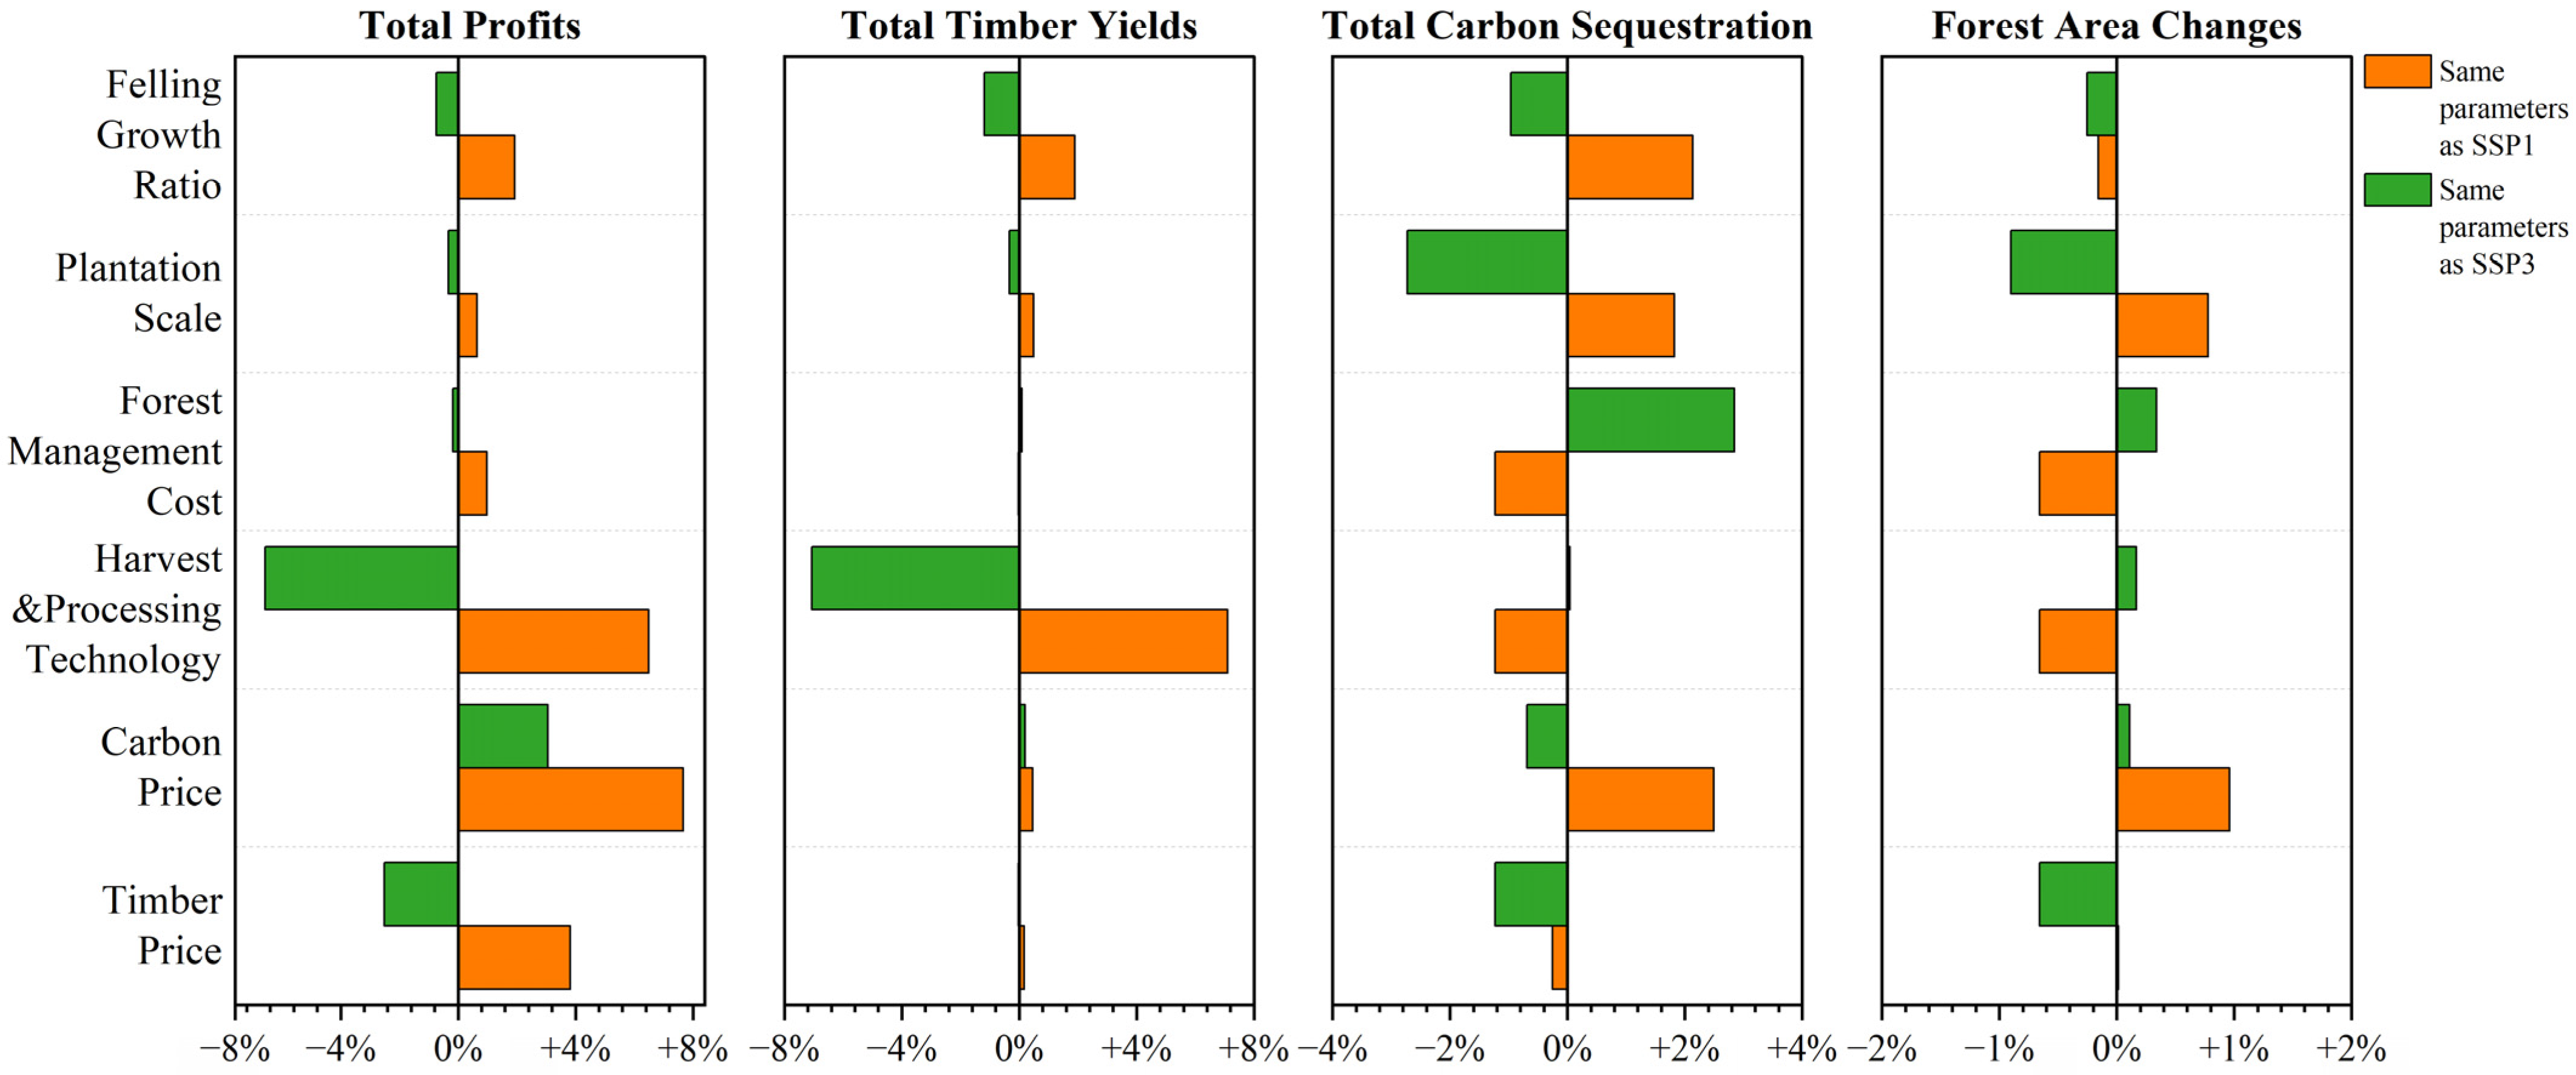
3.4.2. Other Socioeconomic Parameters Sensitivity

We analyzed the sensitivity of socioeconomic parameters using SSP2 as a benchmark and adjusting the single parameter to the same levels as SSP1 and SSP3. Felling growth ratio, planation scale, forest management cost, harvest and processing technology rate, carbon price, and timber price were considered as key socioeconomic parameters to analyze their sensitivity. This is because these parameters are the main parameters in the model, and they are also important instruments in mitigating greenhouse gas emissions, spatial reallocation, and boosting timber supplies. The results illustrated that improving technologies and optimizing the carbon or timber price were the primary instrument for maximizing the total gain (Figure 6). Since the average timber price is currently 20 times higher than the carbon price, an increase in timber yield leads to an increase in total profits and offsets the loss of carbon gains. Simultaneously, raising the felling growth rate, increasing the proportion of commercial forest plantations, and reducing forest management costs would increase the total profits, but this would have little influence on the timber yield. Upgrading timber harvesting and processing technologies is an essential factor in improving timber yields, and the sensitivity of this parameter is much stronger than that of other parameters. Forest management dynamics, including silviculture and harvesting activities, and carbon prices would be the key drivers for both carbon sequestration and timber yields. The large increase in carbon and timber gains reflects the enhanced pace and quality in forest harvesting, regeneration, and afforestation response of the SSP pathway. In addition, the plantation has a positive impact on forest area changes. If the outputs of CFs and their forest ecological service are to be optimized and enhanced, an emphasis on forest carbon sequestration markets and plantation activities is needed in China.
Overall, social preferences have a strong effect on carbon sinks and total profits, but a weak effect on timber supply and forest area changes. Improving timber harvesting and processing technologies is an essential instrument to maximize timber supplies, while carbon sequestration is relatively more sensitive to carbon price and forest logging and silvicultural practices.

4. Discussion

4.1. CFs Could Potentially Sequester Substantial Carbon but Yield Limited Timber

The results for carbon sequestration rates suggest that China would be able to sequester carbon at rates ranging from 152.0 Tg/a (SSP3) to 162.5 Tg/a (SSP1) (Figure 3b). To understand these projections better, we converted the projected carbon sequestration to CO2 emissions by a ratio of 1 Mg C to 3.67 Mg CO2 [33]. In 2019, China’s anthropogenic emissions were 11.7 billion tons of CO2 [51]. This indicates that the projected forest area changes and volume growth under SSP1 would be able to absorb 596.4 million tons of CO2 annually, which is about 5.0% of the above-mentioned 2019 CO2 emissions, in China. On the other hand, the projected forest supplies under SSP3 would absorb 557.8 billion tons of CO2 per year, which is about 4.8% of China’s 2019 CO2 emissions. With the growing carbon sequestration rate, the carbon sink of CFs could reach a maximum of 210.5 Tg/a under SSP1 in 50 years, equivalent to 772.5 million tons of CO2 emissions, which is about 6.6% of China’s CO2 emissions in 2019.
China would supply wooden material at a capacity of 119.2 million m3/a (SSP3) to 142.4 million m3/a (SSP1) on average (Figure 3a). In 2019, FAO’s statistics indicated that China’s industrial roundwood demand was 243.9 million m3, and the projected average annual domestic timber supply was about 48.9%–58.4% of the demand. In the tenth 5-year period, CFs would supply 152.7–188.7 million m3/a of wood, which accounts for 62.6%–77.4% of China’s timber demand in 2019. If timber demand remains unchanged, China’s future timber supply will gradually meet timber demand and lower the imports from the international timber market. In fact, China’s timber demand continues to increase with economic development and urbanization. In addition, restrictive forest management policies have limited forest outputs and returns. China still needs to import a certain amount of timber and optimize forest management to improve the timber supply in the long term.

4.2. The Total Commercial Forest Area Changes Are Unexpectedly Larger in the Next 50 Years

The total commercial forest area changes in China are not as large as expected, accounting for 2.0% (SSP4) to 10.6% (SSP1) compared to the original CF areas. Higher expansions of forest area are found in the SSP1 and SSP5 as a result of competitive revenue and productivity development. Slow price increases and high management costs (i.e., SSP3 and SSP4), combined with inactive afforestation activities, would result in a slight increase in the commercial forest area. Although the total commercial forest area is expanding across SSP scenarios, the variation in regional forest area changes is relatively apparent, as shown in Figure 7. With a percentage increase ranging from 15.3% to 77.3%, Northwest China is estimated to achieve the largest expansion of forest area, followed by North and Southwest China. However, Central China is estimated to lose 0.2%–5.2% of its commercial forest area over the next 50 years. The changes in forest area in North China, East China, and South China are comparatively small, ranging from −0.3% to 2.2% in all scenarios. The loss of forest area, namely deforestation, mainly comes from existing forests, accounting for 74.2%–78.4% of the total loss. This is because existing forests are the main source of timber supply, accounting for 83.2% of the total timber harvest. These existing forest area losses translate to a loss rate ranging from 761.5 thousand ha/a (SSP4) to 805.3 thousand ha/a (SSP1). Meanwhile, new plantation rate is 479.4–489.2 thousand ha/a, which is about half of the existing forest area loss. The rest of forest area changes are due to forest regeneration, which remains the key factor affecting the supply of forest ecological services and goods. Therefore, forest regeneration and new plantation can play an integral role in forest area gains, thereby contributing considerably to forest stocks and carbon sinks. Motivation and willingness among forest managers and owners toward regular monitoring, cultivation and harvesting are likewise needed, considering that, according to our results, over 80% of existing forests are managed as a primary source for forest goods and ecosystem service.

4.3. Socioeconomic Alternatives Have a Strong Impact on Forest Goods and Service Supply

In this study, forest management activities (including forest silviculture and harvesting) were strongly regulated under all SSPs. SSP1 was shown to be the best-case scenario for future forest carbon service and timber supply, but its timber gain was lower than that of SSP5, mainly due to forest activities being stimulated by lower management costs and higher timber prices. SSP2 roughly tracks the historical pattern and presents respectable data in terms of carbon sequestration, which would absorb 561.9 million tons of CO2 annually. Our results suggested that existing forest management methods made good progress toward carbon neutrality goals, but can post pressure on timber supply. An average of 130.0 million m3/a of timber was produced to satisfy about half of the timber demand. On the other hand, a scenario such as SSP3 is less financially profitable. Inactive forest management policies and restrictive felling policies may lower the motivation for forest activities and negatively impact future climate mitigations and the financial potential of forests. It will therefore result in relatively greater stress on forest goods and ecosystem services. Although inequitable regional development orientations enable forest ecosystem service under SSP4, the regional estimates become increasingly divergent. Regions with comparatively strong support, high-woodland valuation, and technological superiority (e.g., Southwest and South China) are likely to maintain a high proportion of forests and implement management practices to increase forest outputs.
Our results showed a similar scenario ranking to that in previous studies [24,29,31,52], but the difference between the best-case scenario and the worst-case scenario of timber yields was not expected to be significant. As the Chinese government has set strong restrictions on forest resource management, it is difficult to evade harvesting constraints. Hence, reasonable harvesting regulation is an element for the sustainable supply of CFs. Socioeconomic parameters, such as social preference (i.e., profit weight) and plantation scale, play an important role in both forest carbon sinks and timber yields, which is consistent with the findings of previous studies [7,15]. However, different data sources and methods are key drivers for the different results of these studies, and the projected results are not comparable.
In addition, forest managers’ and owners’ plantation and harvesting behaviors are affected by socioeconomic macro factors, resulting in gains or losses of forest land area which in turn influence forest carbon sequestration capacity and wood productivity. Therefore, policy mechanisms may be required to change the activities of forest management participants, through increasing timber yields and carbon sinks by changes in government forest afforestation plans and logging policies and by raising the carbon price in the trading market. With dynamic forest management practices, China’s commercial forests could sequester a significant amount of forest carbon and yield sustainable timber supplies in the future.

4.4. Uncertainty and Limitations

The results provided an outlook of China’s forest carbon sequestration and timber supply capacities at the regional level; nonetheless, there were some limitations and uncertainties to this study. We applied the median age of each age group of tree species to simulate the forest age-stand models that may lead to a slight deviation from the actual forest. With continuous socioeconomic development and public awareness improvements, the forest area and biomass stock may experience greater shifts than expected due to factors such as climate change and sudden disasters [2,53]. However, the effects of these factors were not considered in this study, which may result in underestimations or overestimations. Moreover, we considered vegetation carbon sinks only so that carbon sequestration contribution is slightly lower than the fact. Although the options for assessing carbon sinks and forest growth process in our model were not exhaustive due to data and parameter limitations, trends in regional forest area, carbon stocks, and timber productivity demonstrated in this study can help policymakers prioritize regional forest plantation, conservation, and management plans associated with climate mitigation and timber security strategies. Meanwhile, we used an economic model to provide a more realistic and detailed assessment of sustainable forest supply, which facilitates socioeconomic factor impacts of different policy designs. Further studies can be carried out to optimizing model parameters, enhancing optimization algorithms, and improving spatial data quality to implement more realistic and accurate adaptive management strategies and to better understand forest output dynamics.

5. Conclusions

The annual carbon sequestration rate of China’s CFs during the next 50 years is estimated to be 152.0–162.5 Tg/a, which can offset approximately 5% of the anthropogenic CO2 emissions identified in 2019. Newly planted and regenerated forests can contribute more than 80% of this offset. The annual timber supply capacity is estimated to be 119.2–142.4 million m3/a with current policy interventions, which is still not enough to meet the demand for China’s timber market. Although most existing forests are managed as the primary source for forest goods and carbon service, the total commercial forest area changes are not as large as expected, resulting in only 2.0%–10.6% differences. Our results also demonstrate that socioeconomic factors (e.g., social preference, carbon price, and forest logging and silvicultural practices) have a strong impact on carbon sinks, while timber harvesting and processing technologies considerably affect timber yields. Large regional discrepancies in timber supply exists in all SSPs in China, but carbon sequestration show a relatively minor variation. In addition, about 30% of China’s total timber supply and nearly 50% of carbon sequestration come from eucalyptus, which indicates that its fast-growing and high-yield characteristics can potentially make it the dominant tree species in recent ecological environment programs. For follow-up policy design and forest management, China should build long-term and effective forest management systems, such as reasonable harvesting restriction policy mechanisms and regional afforestation planning, as well as improve the national and inter-regional forest carbon sink policies, such as ecological subsidies. China must also focus on regional imbalance in terms of forest carbon sink potentials, timber supply capacities, and socioeconomic development level, and design innovative socioeconomic policies that are appropriate for the local social and ecological environments. To comprehensively enhance the carbon sequestration and timber supplying abilities of regional CFs, local governments should clarify the functional position and area division of local forests and effectively perform the forest ecological service functions. To summarize, China’s commercial forests have the potential of offsetting significant anthropogenic carbon emissions and providing limited timber over the next 50 years; however, achieving this potential requires proper management of commercial forests, as well as making afforestation and regeneration a priority at the national level.

Author Contributions

Conceptualization, F.L. and M.H.; methodology, F.L. and M.H.; software, F.L.; data curation, F.L.; writing—original draft preparation, F.L.; writing—review and editing, M.H., C.X.C., J.L. and W.H; visualization, W.H. and F.L.; supervision, J.L. All authors have read and agreed to the published version of the manuscript.

Funding

This research was funded by the fellowship of China Postdoctoral Science Foundation, grant number 2021M701910.

Institutional Review Board Statement

Not applicable.

Informed Consent Statement

Not applicable.

Data Availability Statement

Not applicable.

Acknowledgments

We are grateful to Quanyin Tan for the valuable discussion. We also acknowledge anonymous reviewers for constructive comments on the original manuscript.

Conflicts of Interest

The authors declare no conflict of interest.

Appendix A

Table A1. Timber price and carbon price changes across SSPs.
ElementsSSP1SSP2SSP3SSP4SSP4Data Source
Timber price annual average growth [%]4%3%2%2%5%[24,31]
Carbon price annual average growth [%]25%11%18%14%23%[54]
Table A2. Six theoretical forest age-stand models.
No.ModelFunction
1Logistic Model y = a 1 + b e c x
2Single Molecule Model y = a 1 e b x
3Gompertz Model y = ae b c x
4Korf Model y = ae b x c
5Richards Model y = a 1 e b x c
6S Curve y = ae b x
Table A3. Results of forest age-stand models.
RegionsTree SpeciesabcR2Observations *Theoretical Model **
NortheastKorean pine4.840.888−0.3450.87817Model 4
Dahurian larch131.30114.5490.1520.73638Model 1
Scots pine116.7060.0792.6710.69333Model 5
Coniferous mixed forest8.4330.598−0.3330.92113Model 4
Poplar123.4318.2910.2460.89215Model 1
Broadleaf mixed forest164.97730.044-0.87215Model 6
Coniferous and
broad-leaved mixed forest
185.6760.0191.0460.88712Model 5
NorthDahurian larch296.1060.0161.3530.6846Model 5
Scots pine258.22710.3470.0920.70517Model 3
Chinese pine115.40926.172-0.66466Model 6
Coniferous mixed forest137.2550.0554.3780.86411Model 5
Poplar53.2084.886-0.67915Model 6
Broadleaf mixed forest59.53923.8690.1610.79715Model 1
EastChinese fir147.3770.0561.7370.92814Model 5
Coniferous mixed forest10.2680.361−0.4820.94813Model 4
Poplar269.7970.0210.7080.69642Model 5
Broadleaf mixed forest97.1280.0341.2650.7515Model 5
Coniferous and
broad-leaved mixed forest
2.1911.573−0.1970.83714Model 4
SouthMasson pine116.9382.5630.1020.69515Model 3
Chinese fir152.01412.3950.2170.83715Model 1
Coniferous mixed forest72.84117.6290.3960.62814Model 1
Eucalyptus93.1490.0871.1370.62658Model 5
Broadleaf mixed forest119.9850.0391.3890.91515Model 5
Coniferous and
broad-leaved mixed forest
2.281.913−0.1830.96214Model 4
CentralMasson pine80.70112.6390.1580.67257Model 1
Chinese fir131.38611.3170.1540.73267Model 1
Coniferous mixed forest412.1790.0050.830.90313Model 5
Oaks140.39122.448-0.78821Model 6
Poplar117.8560.0881.1190.62721Model 5
Broadleaf mixed forest396.5860.0020.7870.83415Model 5
Coniferous and
broad-leaved mixed forest
140.7198.5810.0730.68521Model 1
NorthwestDahurian larch2.4770.374−0.6670.83123Model 4
Chinese pine833.8630.0111.7880.65228Model 5
Poplar172.5864.929-0.07071Model 6
Spruce4.4840.317−0.5490.81825Model 4
Coniferous mixed forest74.8590.073.6960.61214Model 5
Broadleaf mixed forest122.89250.4220.2920.64414Model 1
Coniferous and
broad-leaved mixed forest
140.19613.6350.0590.69519Model 1
SouthwestChinese white pine110.4926.7680.1790.67745Model 1
Masson pine157.0230.0411.4390.88740Model 5
Yunnan pine129.0743.1290.0630.76540Model 3
Chinese fir121.180.1021.2230.74738Model 5
Coniferous mixed forest10.940.522−0.4350.6752Model 4
Eucalyptus1.9391.926−0.1840.66715Model 4
Funereal cypress96.5086.8240.0780.6912Model 1
Broadleaf mixed forest132.04130.527-0.84315Model 6
Coniferous and
broad-leaved mixed forest
130.1166.2590.0620.65443Model 1
*: the number of observations used for estimating the model parameters; **: According to the six theoretical models in Table A2, the non-parametric model is applied for model parameter estimation, and the best-fitting model and parameters are given in the table.
Table A4. Abbreviations of tree species.
NoTree SpeciesLatin NameAbb.
1EucalyptusEucalyptus spp.ELS
2Funereal cypressCupressus funebrisFC
3Korean pinePinus koraiensisKP
4Chinese white pinePinus armandiiCWP
5Broadleaf mixed forest-BMF
6OaksQuercus spp.OKS
7Dahurian larchLarix spp.DL
8Masson pinePinus massonianaMP
9Chinese firCunninghamia lanceolateCFR
10PoplarPopulus spp.POP
11Chinese pinePinus tabulaeformisCP
12Yunnan pineP. yunnanensisYNP
13Scots pinePinus sylvestris var. mongholicaSP
14Coniferous and broad-leaved mixed forest-CBM
15Coniferous mixed forest-CMF
Figure A1. Regional projected timber production by SSPs in ten five-year rotation periods.
Forests 14 00153 g0a1
Figure A2. Regional projected carbon sequestration by SSPs in ten five-year rotation periods.
Forests 14 00153 g0a2

References

  1. Wang, S.; Chen, J.M.; Ju, W.M.; Feng, X.; Chen, M.; Chen, P.; Yu, G. Carbon Sinks and Sources in China’s Forests during 1901–2001. J. Environ. Manag. 2007, 85, 524–537. [Google Scholar] [CrossRef] [PubMed]
  2. Pan, Y.; Birdsey, R.A.; Fang, J.; Houghton, R.; Kauppi, P.E.; Kurz, W.A.; Phillips, O.L.; Shvidenko, A.; Lewis, S.L.; Canadell, J.G.; et al. A Large and Persistent Carbon Sink in the World’s Forests. Science 2011, 333, 988–993. [Google Scholar] [CrossRef] [PubMed] [Green Version]
  3. Brienen, R.J.W.; Caldwell, L.; Duchesne, L.; Voelker, S.; Barichivich, J.; Baliva, M.; Ceccantini, G.; Di Filippo, A.; Helama, S.; Locosselli, G.M.; et al. Forest Carbon Sink Neutralized by Pervasive Growth-Lifespan Trade-Offs. Nat. Commun. 2020, 11, 4241. [Google Scholar] [CrossRef] [PubMed]
  4. Cai, W.; He, N.; Li, M.; Xu, L.; Wang, L.; Zhu, J.; Zeng, N.; Yan, P.; Si, G.; Zhang, X.; et al. Carbon Sequestration of Chinese Forests from 2010 to 2060: Spatiotemporal Dynamics and Its Regulatory Strategies. Sci. Bull. 2022, 67, 836–843. [Google Scholar] [CrossRef]
  5. den Elzen, M.; Fekete, H.; Höhne, N.; Admiraal, A.; Forsell, N.; Hof, A.F.; Olivier, J.G.J.; Roelfsema, M.; van Soest, H. Greenhouse Gas Emissions from Current and Enhanced Policies of China until 2030: Can Emissions Peak before 2030? Energy Policy 2016, 89, 224–236. [Google Scholar] [CrossRef] [Green Version]
  6. Mallapaty, S. How China Could Be Carbon Neutral by Mid-Century. Nature 2020, 586, 482–483. [Google Scholar] [CrossRef]
  7. Xia, F.; Yang, Y.; Zhang, S.; Yang, Y.; Li, D.; Sun, W.; Xie, Y. Influencing Factors of the Supply-Demand Relationships of Carbon Sequestration and Grain Provision in China: Does Land Use Matter the Most? Sci. Total Environ. 2022, 832, 154979. [Google Scholar] [CrossRef]
  8. National Forestry and Grassland Administration. Available online: https://www.forestry.gov.cn/ (accessed on 4 November 2022).
  9. Food and Agriculture Organization. Available online: https://www.fao.org/home/en (accessed on 4 November 2022).
  10. Bottalico, F.; Pesola, L.; Vizzarri, M.; Antonello, L.; Barbati, A.; Chirici, G.; Corona, P.; Cullotta, S.; Garfì, V.; Giannico, V.; et al. Modeling the Influence of Alternative Forest Management Scenarios on Wood Production and Carbon Storage: A Case Study in the Mediterranean Region. Environ. Res. 2016, 144, 72–87. [Google Scholar] [CrossRef] [Green Version]
  11. Chen, S.; Lu, N.; Fu, B.; Wang, S.; Deng, L.; Wang, L. Current and Future Carbon Stocks of Natural Forests in China. For. Ecol. Manag. 2022, 511, 120137. [Google Scholar] [CrossRef]
  12. Lin, B.; Ge, J. To Harvest or Not to Harvest? Forest Management as a Trade-off between Bioenergy Production and Carbon Sink. J. Clean. Prod. 2020, 268, 122219. [Google Scholar] [CrossRef]
  13. Kauppi, P.E.; Stål, G.; Arnesson-Ceder, L.; Hallberg Sramek, I.; Hoen, H.F.; Svensson, A.; Wernick, I.K.; Högberg, P.; Lundmark, T.; Nordin, A. Managing Existing Forests Can Mitigate Climate Change. For. Ecol. Manag. 2022, 513, 120186. [Google Scholar] [CrossRef]
  14. Luyssaert, S.; Marie, G.; Valade, A.; Chen, Y.-Y.; Njakou Djomo, S.; Ryder, J.; Otto, J.; Naudts, K.; Lansø, A.S.; Ghattas, J.; et al. Trade-Offs in Using European Forests to Meet Climate Objectives. Nature 2018, 562, 259–262. [Google Scholar] [CrossRef] [PubMed] [Green Version]
  15. Deng, W.; Xiang, W.; Ouyang, S.; Hu, Y.; Chen, L.; Zeng, Y.; Deng, X.; Zhao, Z.; Forrester, D.I. Spatially Explicit Optimization of the Forest Management Tradeoff between Timber Production and Carbon Sequestration. Ecol. Indic. 2022, 142, 109193. [Google Scholar] [CrossRef]
  16. Qin, H.; Dong, L.; Huang, Y. Evaluating the Effects of Carbon Prices on Trade-Offs between Carbon and Timber Management Objectives in Forest Spatial Harvest Scheduling Problems: A Case Study from Northeast China. Forests 2017, 8, 43. [Google Scholar] [CrossRef] [Green Version]
  17. Li, Z.; Cheng, X.; Han, H. Analyzing Land-Use Change Scenarios for Ecosystem Services and Their Trade-Offs in the Ecological Conservation Area in Beijing, China. Int. J. Environ. Res. Public Health 2020, 17, 8632. [Google Scholar] [CrossRef] [PubMed]
  18. Zhao, J.; Liu, D.; Cao, Y.; Zhang, L.; Peng, H.; Wang, K.; Xie, H.; Wang, C. An Integrated Remote Sensing and Model Approach for Assessing Forest Carbon Fluxes in China. Sci. Total Environ. 2022, 811, 152480. [Google Scholar] [CrossRef] [PubMed]
  19. Anderegg, W.R.L.; Wu, C.; Acil, N.; Carvalhais, N.; Pugh, T.A.M.; Sadler, J.P.; Seidl, R. A Climate Risk Analysis of Earth’s Forests in the 21st Century. Science 2022, 377, 1099–1103. [Google Scholar] [CrossRef]
  20. Zhang, H.; Feng, Z.; Shen, C.; Li, Y.; Feng, Z.; Zeng, W.; Huang, G. Relationship between the Geographical Environment and the Forest Carbon Sink Capacity in China Based on an Individual-Tree Growth-Rate Model. Ecol. Indic. 2022, 138, 108814. [Google Scholar] [CrossRef]
  21. Zhang, A.; Deng, R. Spatial-Temporal Evolution and Influencing Factors of Net Carbon Sink Efficiency in Chinese Cities under the Background of Carbon Neutrality. J. Clean. Prod. 2022, 365, 132547. [Google Scholar] [CrossRef]
  22. He, G.; Zhang, Z.; Zhu, Q.; Wang, W.; Peng, W.; Cai, Y. Estimating Carbon Sequestration Potential of Forest and Its Influencing Factors at Fine Spatial-Scales: A Case Study of Lushan City in Southern China. Int. J. Environ. Res. Public Health 2022, 19, 9184. [Google Scholar] [CrossRef]
  23. Macintosh, A.; Keith, H.; Lindenmayer, D. Rethinking Forest Carbon Assessments to Account for Policy Institutions. Nat. Clim Chang. 2015, 5, 946–949. [Google Scholar] [CrossRef]
  24. Daigneault, A.; Favero, A. Global Forest Management, Carbon Sequestration and Bioenergy Supply under Alternative Shared Socioeconomic Pathways. Land Use Policy 2021, 103, 105302. [Google Scholar] [CrossRef]
  25. Dong, L.; Bettinger, P.; Liu, Z.; Qin, H. Spatial Forest Harvest Scheduling for Areas Involving Carbon and Timber Management Goals. Forests 2015, 6, 1362–1379. [Google Scholar] [CrossRef] [Green Version]
  26. Dong, L.; Bettinger, P.; Liu, Z. Estimating the Optimal Internal Carbon Prices for Balancing Forest Wood Production and Carbon Sequestration: The Case of Northeast China. J. Clean. Prod. 2021, 281, 125342. [Google Scholar] [CrossRef]
  27. Dong, L.; Lu, W.; Liu, Z. Developing Alternative Forest Spatial Management Plans When Carbon and Timber Values Are Considered: A Real Case from Northeastern China. Ecol. Model. 2018, 385, 45–57. [Google Scholar] [CrossRef]
  28. O’Neill, B.C.; Kriegler, E.; Ebi, K.L.; Kemp-Benedict, E.; Riahi, K.; Rothman, D.S.; van Ruijven, B.J.; van Vuuren, D.P.; Birkmann, J.; Kok, K.; et al. The Roads Ahead: Narratives for Shared Socioeconomic Pathways Describing World Futures in the 21st Century. Glob. Environ. Chang. 2017, 42, 169–180. [Google Scholar] [CrossRef] [Green Version]
  29. Nepal, P.; Korhonen, J.; Prestemon, J.P.; Cubbage, F.W. Projecting Global Planted Forest Area Developments and the Associated Impacts on Global Forest Product Markets. J. Environ. Manag. 2019, 240, 421–430. [Google Scholar] [CrossRef] [Green Version]
  30. Daigneault, A.; Johnston, C.; Korosuo, A.; Baker, J.S.; Forsell, N.; Prestemon, J.P.; Abt, R.C. Developing Detailed SharedSocioeconomic Pathway (SSP)Narratives for the Global Forest Sector. J. For. Econ. 2019, 34, 7–45. [Google Scholar] [CrossRef]
  31. Daigneault, A.; Baker, J.S.; Guo, J.; Lauri, P.; Favero, A.; Forsell, N.; Johnston, C.; Ohrel, S.B.; Sohngen, B. How the Future of the Global Forest Sink Depends on Timber Demand, Forest Management, and Carbon Policies. Glob. Environ. Chang. 2022, 76, 102582. [Google Scholar] [CrossRef]
  32. Eriksson, L.O.; Forsell, N.; Eggers, J.; Snäll, T. Downscaling of Long-Term Global Scenarios to Regions with a Forest Sector Model. Forests 2020, 11, 500. [Google Scholar] [CrossRef]
  33. Estoque, R.C.; Ooba, M.; Avitabile, V.; Hijioka, Y.; DasGupta, R.; Togawa, T.; Murayama, Y. The Future of Southeast Asia’s Forests. Nat. Commun. 2019, 10, 1829. [Google Scholar] [CrossRef] [Green Version]
  34. Blattert, C.; Lemm, R.; Thürig, E.; Stadelmann, G.; Brändli, U.-B.; Temperli, C. Long-Term Impacts of Increased Timber Harvests on Ecosystem Services and Biodiversity: A Scenario Study Based on National Forest Inventory Data. Ecosyst. Serv. 2020, 45, 101150. [Google Scholar] [CrossRef]
  35. Hirigoyen, A.; Acuna, M.; Rachid-Casnati, C.; Franco, J.; Navarro-Cerrillo, R. Use of Optimization Modeling to Assess the Effect of Timber and Carbon Pricing on Harvest Scheduling, Carbon Sequestration, and Net Present Value of Eucalyptus Plantations. Forests 2021, 12, 651. [Google Scholar] [CrossRef]
  36. OpenSolver for Excel. Available online: https://opensolver.org/ (accessed on 11 December 2022).
  37. Jiang, L.; O’Neill, B.C. Global Urbanization Projections for the Shared Socioeconomic Pathways. Glob. Environ. Chang. 2017, 42, 193–199. [Google Scholar] [CrossRef] [Green Version]
  38. Riahi, K.; van Vuuren, D.P.; Kriegler, E.; Edmonds, J.; O’Neill, B.C.; Fujimori, S.; Bauer, N.; Calvin, K.; Dellink, R.; Fricko, O.; et al. The Shared Socioeconomic Pathways and Their Energy, Land Use, and Greenhouse Gas Emissions Implications: An Overview. Glob. Environ. Chang. 2017, 42, 153–168. [Google Scholar] [CrossRef] [Green Version]
  39. Jing, C.; Tao, H.; Jiang, T.; Wang, Y.; Zhai, J.; Cao, L.; Su, B. Population, Urbanization and Economic Scenarios over the Belt and Road Region under the Shared Socioeconomic Pathways. J. Geogr. Sci. 2020, 30, 68–84. [Google Scholar] [CrossRef] [Green Version]
  40. Xu, B.; Guo, Z.; Piao, S.; Fang, J. Forest biomass carbon pool in China from 2000 to 2050: Projections based on the relationship between biomass density and forest age. Sci. China Life Sci. 2010, 40, 587–594. [Google Scholar]
  41. Zhu, J.; Dai, E.; Zheng, D.; Wang, X. Characteristic of tradeoffs between timber production and carbon storage for plantation under harvesting impact: A case study of Huitong National Research Station of Forest Ecosystem. J. Geogr. Sci. 2018, 28, 1085–1098. [Google Scholar] [CrossRef] [Green Version]
  42. Fang, J.; Wang, G.G.; Liu, G.; Xu, S. Forest Biomass of China: An Estimate Based on the Biomass–Volume Relationship. Ecol. Appl. 1998, 8, 1084–1091. [Google Scholar] [CrossRef]
  43. Faustmann, M. Calculation of the Value Which Forest Land and Immature Stands Possess for Forestry. J. Forest Econ. 1995, 1, 7–14. [Google Scholar]
  44. The Central Bank of the People’s Republic of China. Available online: http://www.pbc.gov.cn/en/3688006/index.html (accessed on 1 December 2022).
  45. Dong, L.; Bettinger, P.; Qin, H.; Liu, Z. Optimizing Rotation Lengths for Maximizing Carbon Balance of Larch Plantations in Northeast China. J. Clean. Prod. 2022, 343, 131025. [Google Scholar] [CrossRef]
  46. Li, Q. Forest Carbon Storage and Carbon Sequestration Potential during 2010–2050 in China; Chinese Academy of Forestry: Beijing, China, 2016. [Google Scholar]
  47. IPCC-TFI. Available online: https://www.ipcc-nggip.iges.or.jp/software/ (accessed on 4 November 2022).
  48. Wen, D.; He, N. Forest Carbon Storage along the North-South Transect of Eastern China: Spatial Patterns, Allocation, and Influencing Factors. Ecol. Indic. 2016, 61, 960–967. [Google Scholar] [CrossRef]
  49. Lin, B.; Ge, J. Carbon Sinks and Output of China’s Forestry Sector: An Ecological Economic Development Perspective. Sci. Total Environ. 2019, 655, 1169–1180. [Google Scholar] [CrossRef] [PubMed]
  50. China Carbon Emissions Trading. Available online: http://www.tanpaifang.com/tanhangqing/ (accessed on 11 December 2022).
  51. World Resource Institute Climate Watch. Available online: https://www.climatewatchdata.org/ghg-emissions?end_year=2019&start_year=1990 (accessed on 17 August 2022).
  52. Hu, X.; Iordan, C.M.; Cherubini, F. Estimating Future Wood Outtakes in the Norwegian Forestry Sector under the Shared Socioeconomic Pathways. Glob. Environ. Chang. 2018, 50, 15–24. [Google Scholar] [CrossRef]
  53. Zhu, K.; Zhang, J.; Niu, S.; Chu, C.; Luo, Y. Limits to Growth of Forest Biomass Carbon Sink under Climate Change. Nat. Commun. 2018, 9, 2709. [Google Scholar] [CrossRef]
  54. IIASA SSP Database. Available online: https://tntcat.iiasa.ac.at/SspDb/dsd?Action=htmlpage&page=40 (accessed on 11 December 2022).
Figure 1. Research framework.
Forests 14 00153 g001
Figure 2. Region distribution of the projected forest total timber yields and carbon sequestration in China, by SSPs.
Forests 14 00153 g002
Figure 3. Tree species of projected timber yields (a) and carbon sequestration (b) by SSPs in ten five-year periods. An explanation of each tree name abbreviation is shown in Table A4.
Forests 14 00153 g003
Figure 4. Relationship between timber yields and carbon sequestration by regions (a) and by tree species (b) under all SSPs.
Forests 14 00153 g004
Figure 5. Key model estimates for weight parameter sensitivity in all SSPs. Forest area, total carbon sequestration, total timber yield, and total profits are selected in this study and listed above. The bars in pink, green, and blue colors represent the changes in percentage between weight sensitivity analysis and the SSP2. C75/T25, C25/T75, C0/T100 represent that the carbon weights are 75%, 25%, and 0%, while the timber weights are 25%, 75%, and 100%, respectively.
Forests 14 00153 g005
Figure 6. Key model estimates for other socioeconomic parameter sensitivity in all SSPs. The bars in green and orange colors represent the changes in percentage between sensitivity analysis result and the SSP2 result.
Forests 14 00153 g006
Figure 7. Commercial forest area changes across SSPs, from 2018 to 2068.
Forests 14 00153 g007
Table 1. Narratives for shared socioeconomic pathway scenarios in forest management.
ElementsParametersSSP1SSP2SSP3SSP4SSP5
Harvest and Processing technology d 75%70%65%RFR 72%
PFR 68%
72%
Forest management cost T C 90%unchanged110%RFR 93%
PFR 110%
93%
Plantation for
commerce
b 0 40%35%30%RFR 37%
PFR 20%
37%
Felling growth rate f j k 1.5%0.9%0.5%RFR 1.2%
PFR 0.6%
1.25%
Note: Rich-forest regions (RFR) include Central China, South China, and Southwest China; Poor-Forest regions (PFR) include Northeast China, North China, Northwest China, and East China.
Disclaimer/Publisher’s Note: The statements, opinions and data contained in all publications are solely those of the individual author(s) and contributor(s) and not of MDPI and/or the editor(s). MDPI and/or the editor(s) disclaim responsibility for any injury to people or property resulting from any ideas, methods, instructions or products referred to in the content.

