
COVID-19 and the Mystery of Lumber Price Movements

Abstract
:1. Introduction

2. Materials and Methods
2.1. Modeling Price Volatility as a Stochastic Process
2.2. Price Impact Model Specification
3. Results
4. Discussion
Author Contributions
Funding
Data Availability Statement
Acknowledgments
Conflicts of Interest
Appendix A

| Regressor | (1981) | (1981) | (2001) | (2001) |
|---|---|---|---|---|
| Excht | 0.444 *** | 0.246 *** | 0.131 | 0.133 |
| (0.093) | (0.080) | (0.119) | (0.113) | |
| HSt | 0.0002 *** | 0.0002 *** | 0.0003 *** | 0.0003 *** |
| (0.00003) | (0.00003) | (0.0001) | (0.0001) | |
| ADCVDt | −0.014 *** | −0.007 *** | ||
| (0.001) | (0.002) | |||
| PREt | −0.478 *** | −0.546 *** | ||
| (0.035) | (0.030) | |||
| MOUt | −0.327 *** | −0.191 *** | ||
| (0.037) | (0.034) | |||
| L2t | 0.007 | 0.055 | ||
| (0.048) | (0.041) | |||
| Wt | 0.033 *** | 0.024 *** | ||
| (0.006) | (0.006) | |||
| TRQt | 0.086 ** | 0.152 *** | 0.173 *** | 0.195 *** |
| (0.035) | (0.030) | (0.063) | (0.061) | |
| SLA06t | −0.016 | 0.011 | 0.043 | 0.010 |
| (0.041) | (0.035) | (0.079) | (0.076) | |
| POSTt | 0.380 *** | 0.622 *** | 0.352 *** | 0.457 *** |
| (0.041) | (0.039) | (0.081) | (0.084) | |
| FCt | −0.335 *** | −0.233 *** | −0.192 *** | −0.182 *** |
| (0.046) | (0.040) | (0.054) | (0.051) | |
| Covidt | 0.345 *** | 0.321 *** | 0.267 *** | 0.268 *** |
| (0.048) | (0.040) | (0.050) | (0.048) | |
| PNFt | 0.659 *** | 0.614 *** | 0.427 *** | 0.463 *** |
| (0.071) | (0.060) | (0.080) | (0.077) | |
| Constant | 5.059 *** | 5.343 *** | 4.403 *** | 4.770 *** |
| (0.125) | (0.108) | (0.192) | (0.214) | |
| Observations | 501 | 501 | 255 | 255 |
References
- Van Kooten, G.C.; Nelson, H.; Mokhtarzadeh, F. Canada-U.S. Softwood Lumber Dispute: Background. Chapter 2 in International Trade in Forest Products: Lumber Trade Disputes, Models and Examples; van Kooten, G.C., Voss, L., Eds.; CAB International: Wallingford, UK, 2021; pp. 10–26. [Google Scholar]
- Van Kooten, G.C.; Schmitz, A. COVID-19 Impacts on U.S. Lumber Markets. For. Policy Econ. 2022, 135, 102665. [Google Scholar] [CrossRef]
- Van Kooten, G.C.; Zanello, R.; Schmitz, A. Explaining Post-Pandemic Lumber Price Volatility and its Welfare Effects. J. Agric. Food Ind. Organ. 2022, 18. [Google Scholar] [CrossRef]
- Statista. Monthly Price of Lumber in the United States from January 2019 to March 2022. 2022. Available online: https://www.statista.com/statistics/1239728/monthly-lumber-price-usa/ (accessed on 25 November 2022).
- Anderson, J.; West, N.; Fitzgerald, A.; Guzman, D. Random Lengths. Various Issues. Forest Product Market Prices and Statistics Yearbook; Random Lengths Publications Ltd.: Eugene, OR, USA, 2021. [Google Scholar]
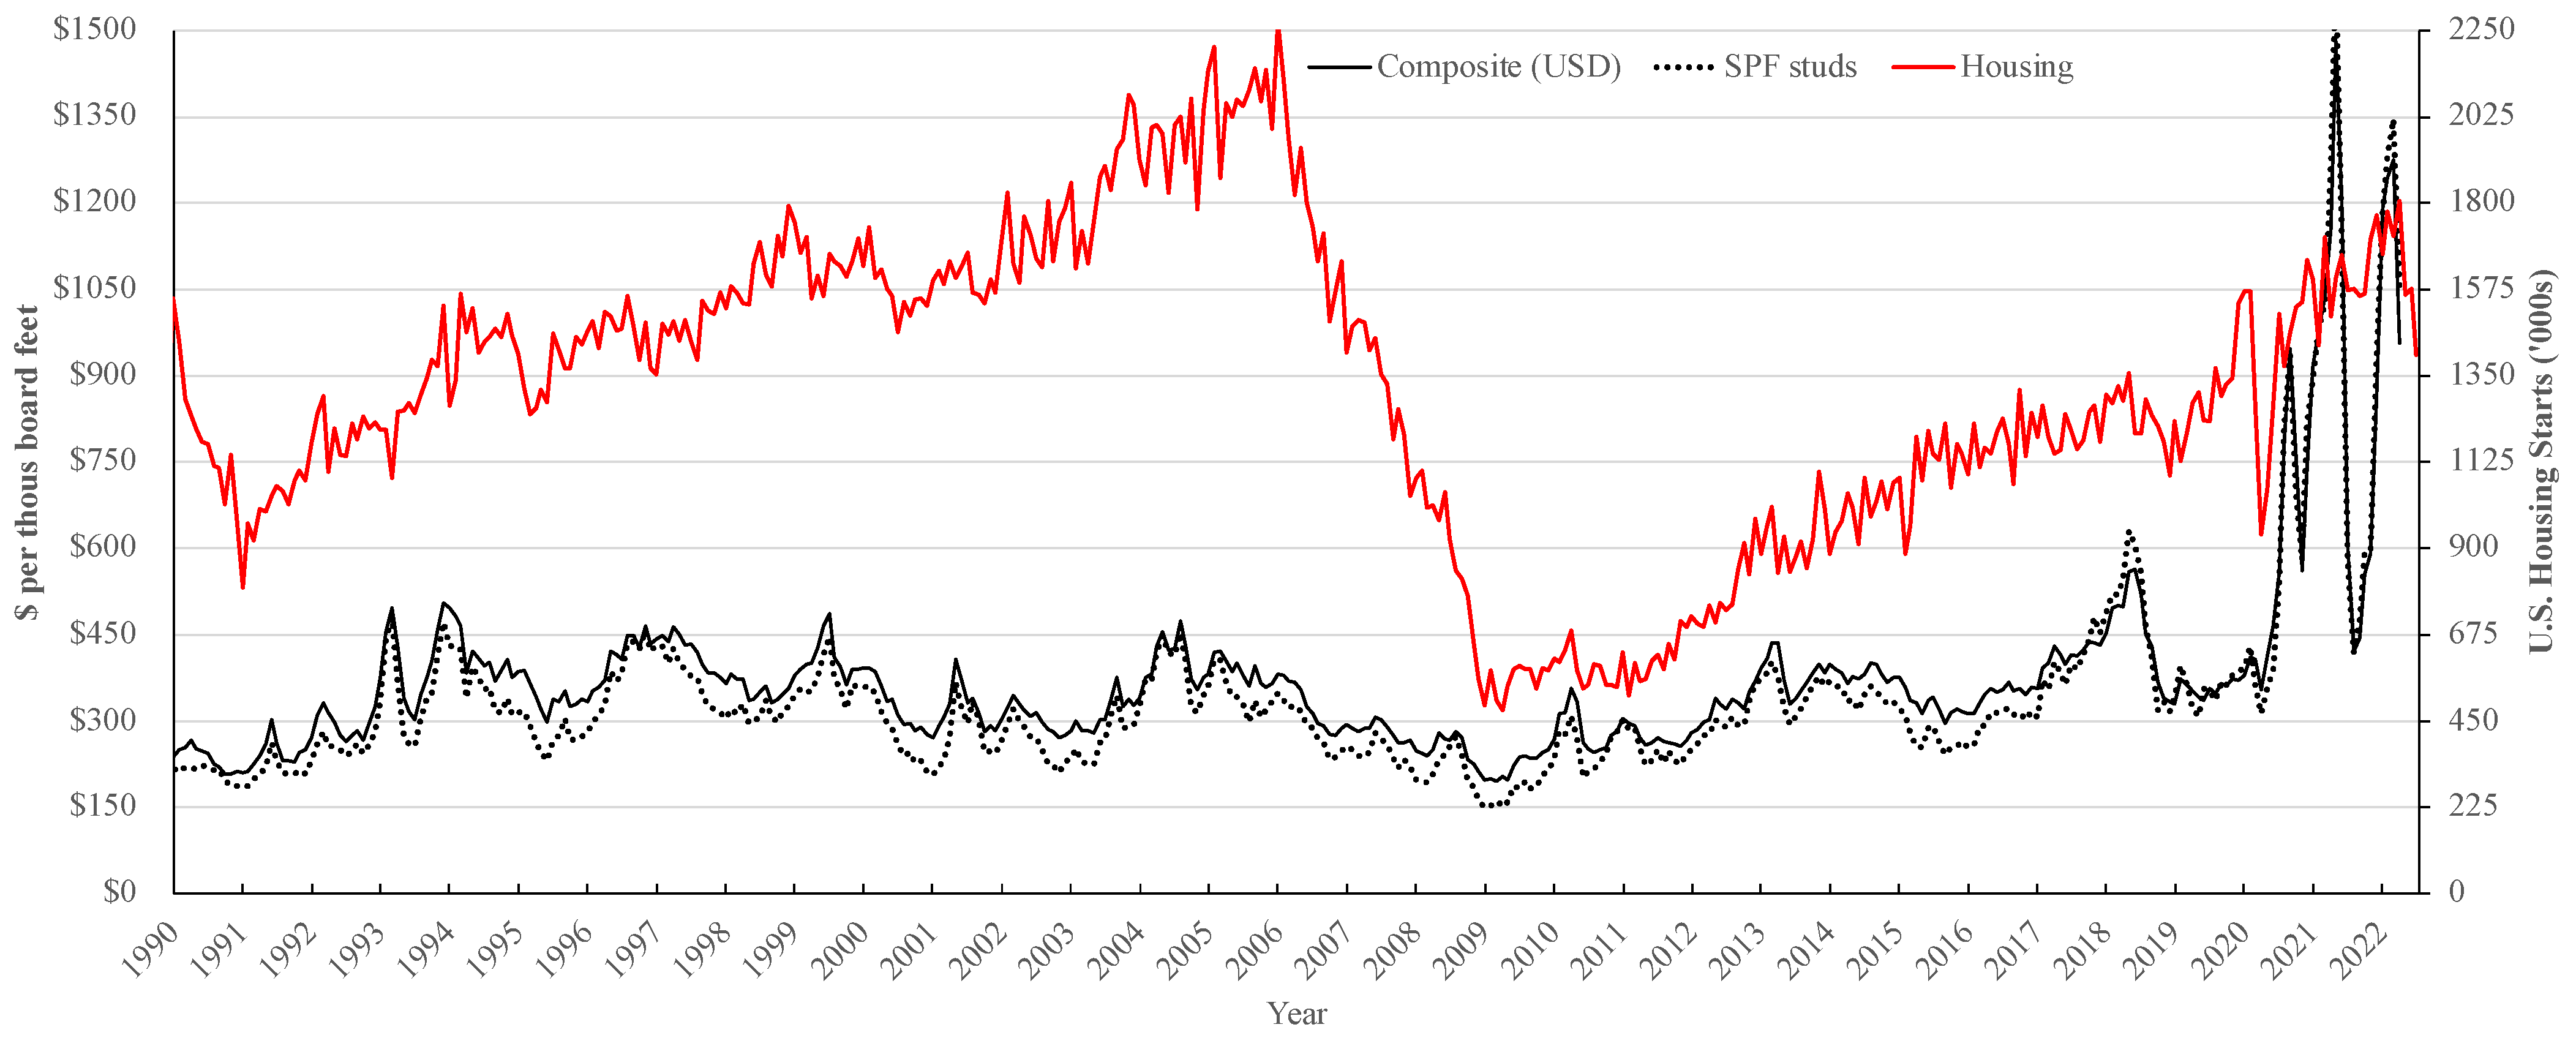
- Federal Reserve Bank of St. Louis (FRED). U.S. Census Bureau and U.S. Department of Housing and Urban Development, New Privately-Owned Housing Units Started: Total Units [HOUST]. 2022. Available online: https://fred.stlouisfed.org/series/HOUST (accessed on 29 November 2022).
- World Trade Organization (WTO). (n.d.). Anti-Dumping, Subsidies, Safeguards: Contingenties, etc. Available online: https://www.wto.org/english/thewto_e/whatis_e/tif_e/agrm8_e.htm (accessed on 25 November 2022).
- Global Affairs Canada. Softwood Lumber. 2022. Available online: https://www.international.gc.ca/controls-controles/softwood-bois_oeuvre/index.aspx?lang=eng (accessed on 25 November 2022).
- Zhang, D. The Softwood Lumber War: Politics, Economics, and the Long U.S.-Canadian Trade Dispute, 1st ed.; Routledge: London, UK, 2007. [Google Scholar]
- Insurance Bureau of Canada (IBC). Insured Losses of 2021 Floods Now $675 Million. 2022. Available online: http://www.ibc.ca/bc/resources/media-centre/media-releases/insured-losses-from-2021-floods-in-bc-now-675-million (accessed on 11 November 2022).
- COFI; BC Council of Forest Industries, Vancouver, BC, Canada. Personal Communication, 20 September 2022.
- Lawler, G.F. Introduction to Stochastic Processes, 2nd ed.; Taylor & Francis Group: Boca Raton, FL, USA, 2006. [Google Scholar]
- Dixit, R.K.; Pindyck, R.S. Investment under Uncertainty; Princeton University Press: Princeton, NJ, USA, 1994; p. 74. [Google Scholar]
- Dias, M.A.G. Stochastic Processes with Focus in Petroleum Applications. April 2008. Available online: http://marcoagd.usuarios.rdc.puc-rio.br/stochast.html (accessed on 20 May 2022).
- Zhang, D. Welfare impacts of the 1996 United States—Canada Softwood Lumber (trade) Agreement. Can. J. For. Res. 2001, 31, 1958–1967. [Google Scholar] [CrossRef]
- Zhang, D. Welfare impacts of the 1996 United States—Canada softwood lumber agreement: An update. Can. J. For. Res. 2006, 36, 255–261. [Google Scholar] [CrossRef]
- Statistics Canada. Table 14100306: Average Hourly Earnings for Employees Paid by the Hour, by Industry. Monthly, Unadjusted for Seasonality. 2022. Available online: http://dc.chass.utoronto.ca.ezproxy.library.uvic.ca/cansimdim/English/ (accessed on 25 November 2022).
- Adams, D.M.; McCarl, B.A.; Homayounfarrokh, L. The role of exchange rates in Canadian—United States lumber trade. For. Sci. 1986, 32, 973–988. [Google Scholar]


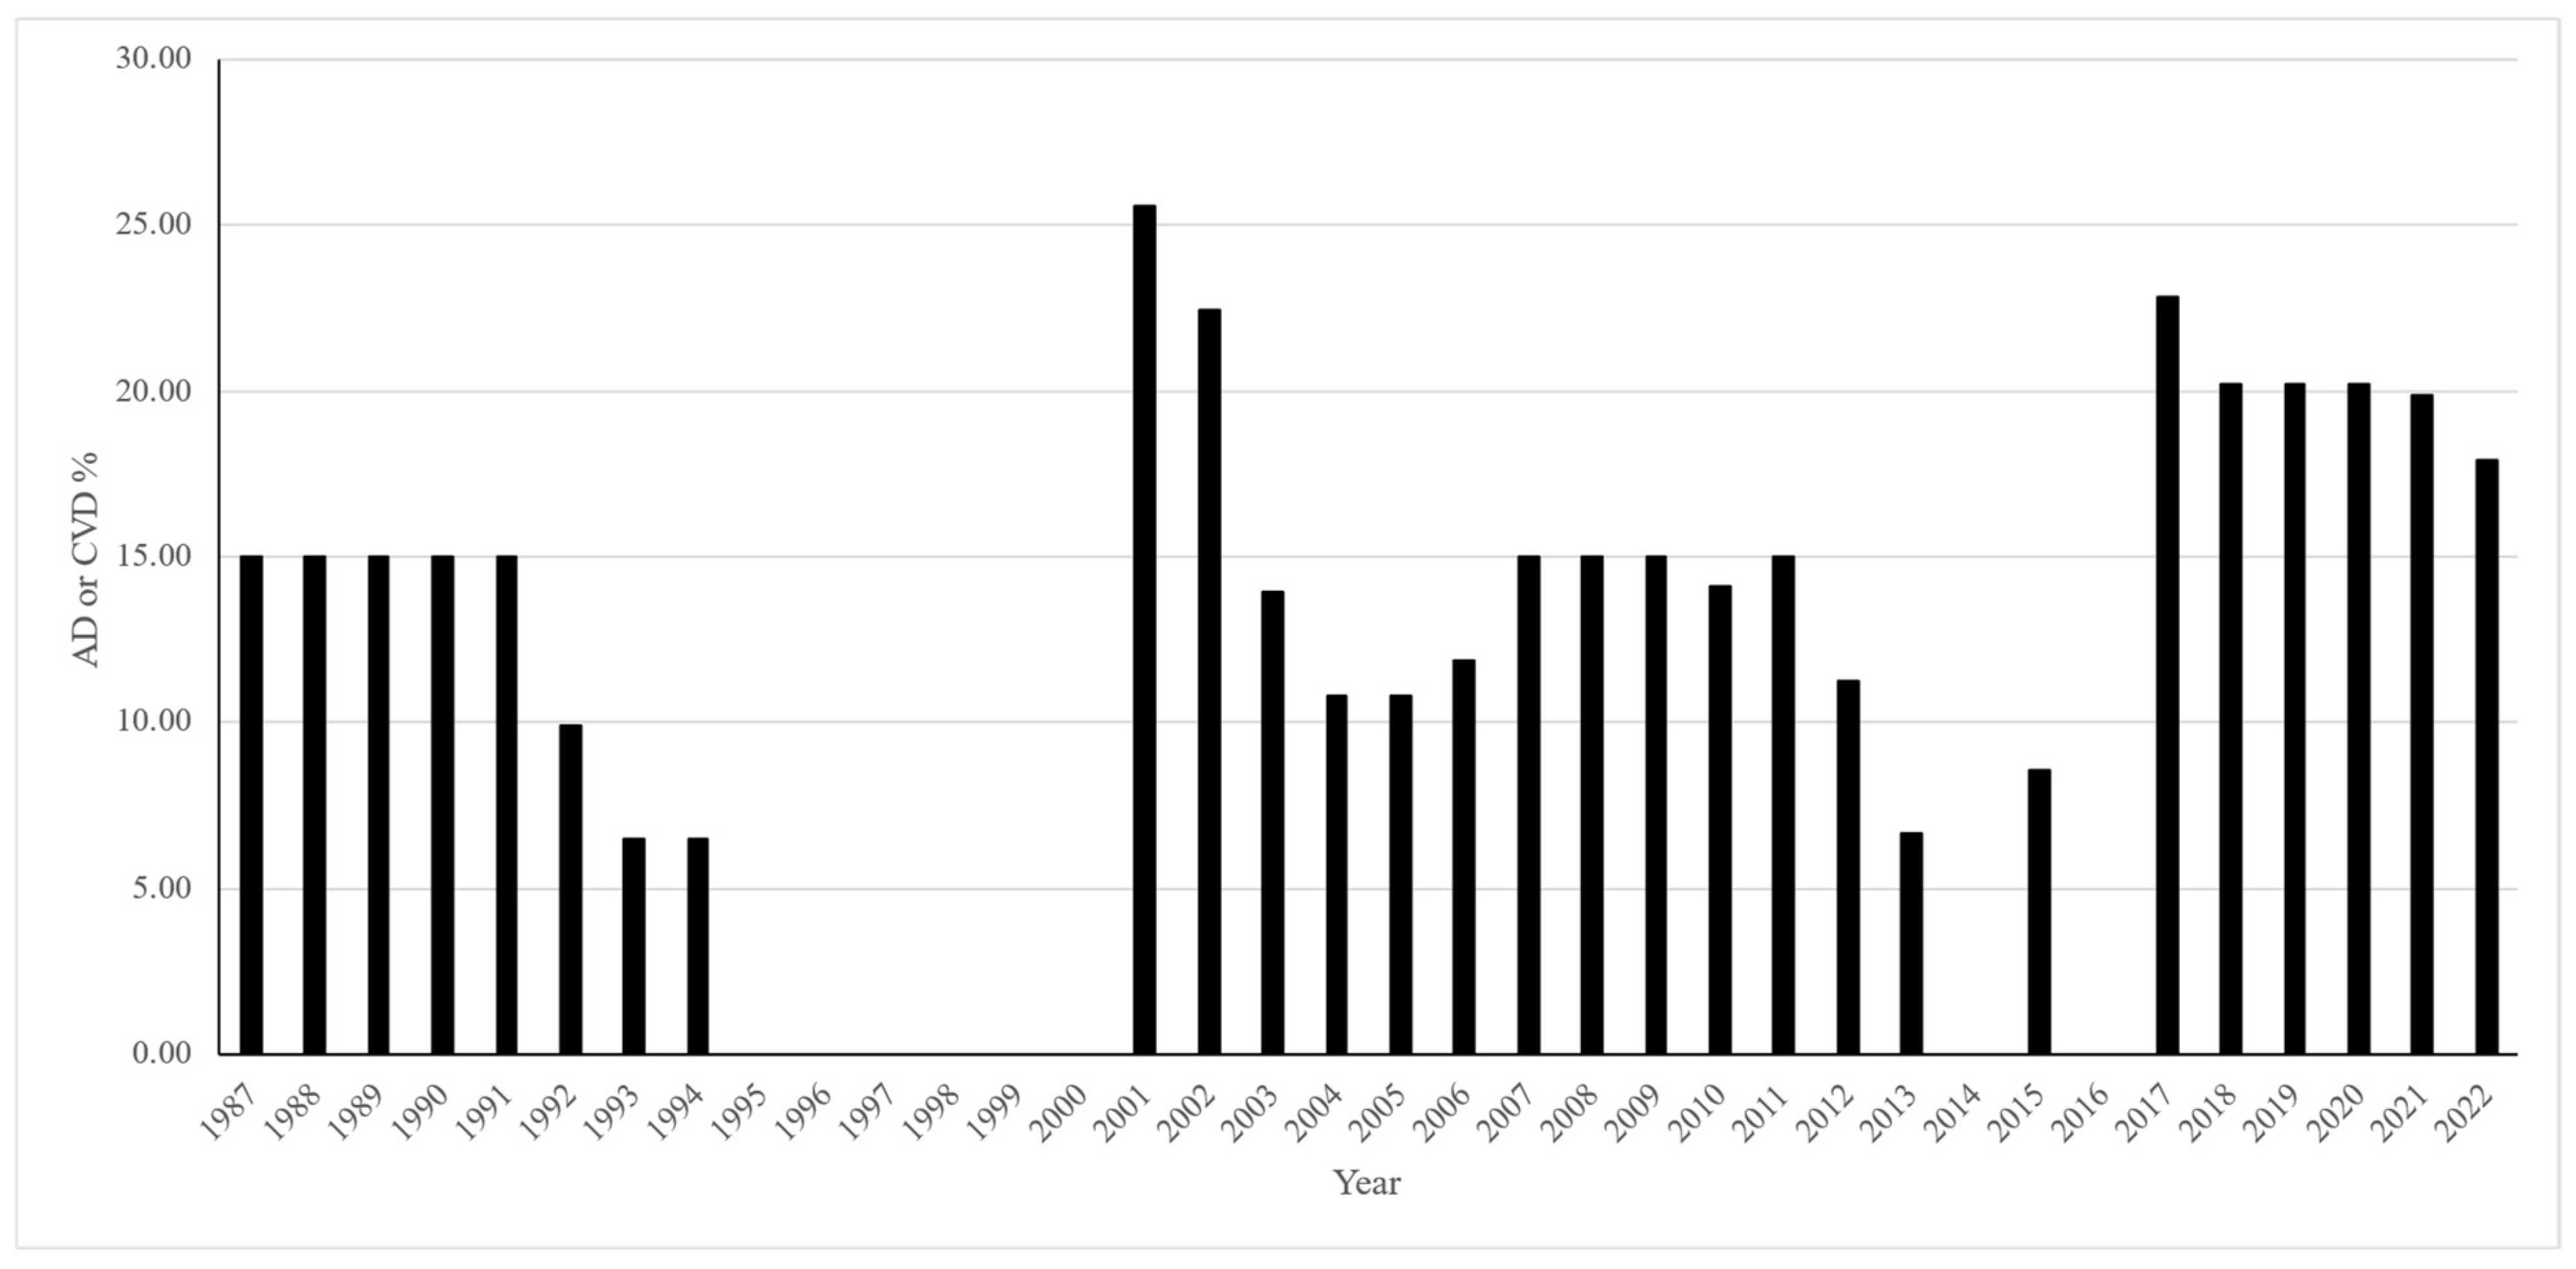
| Year a | Average of AD or CVD (%) |
|---|---|
| 1987–1991 | 15.00 |
| 1992 | 9.92 |
| 1993–1994 | 6.51 |
| 2001 | 25.60 |
| 2002 | 22.42 |
| 2003 | 13.92 |
| 2004–2005 | 10.81 |
| 2006 | 11.86 |
| 2007–2009 | 15.00 |
| 2010 | 14.09 |
| 2011 | 15.00 |
| 2012 | 11.25 |
| 2013 | 6.67 |
| 2015 | 8.57 |
| 2017 | 22.85 |
| 2018–2020 | 20.23 |
| 2021 | 19.84 |
| 2022 | 17.91 |
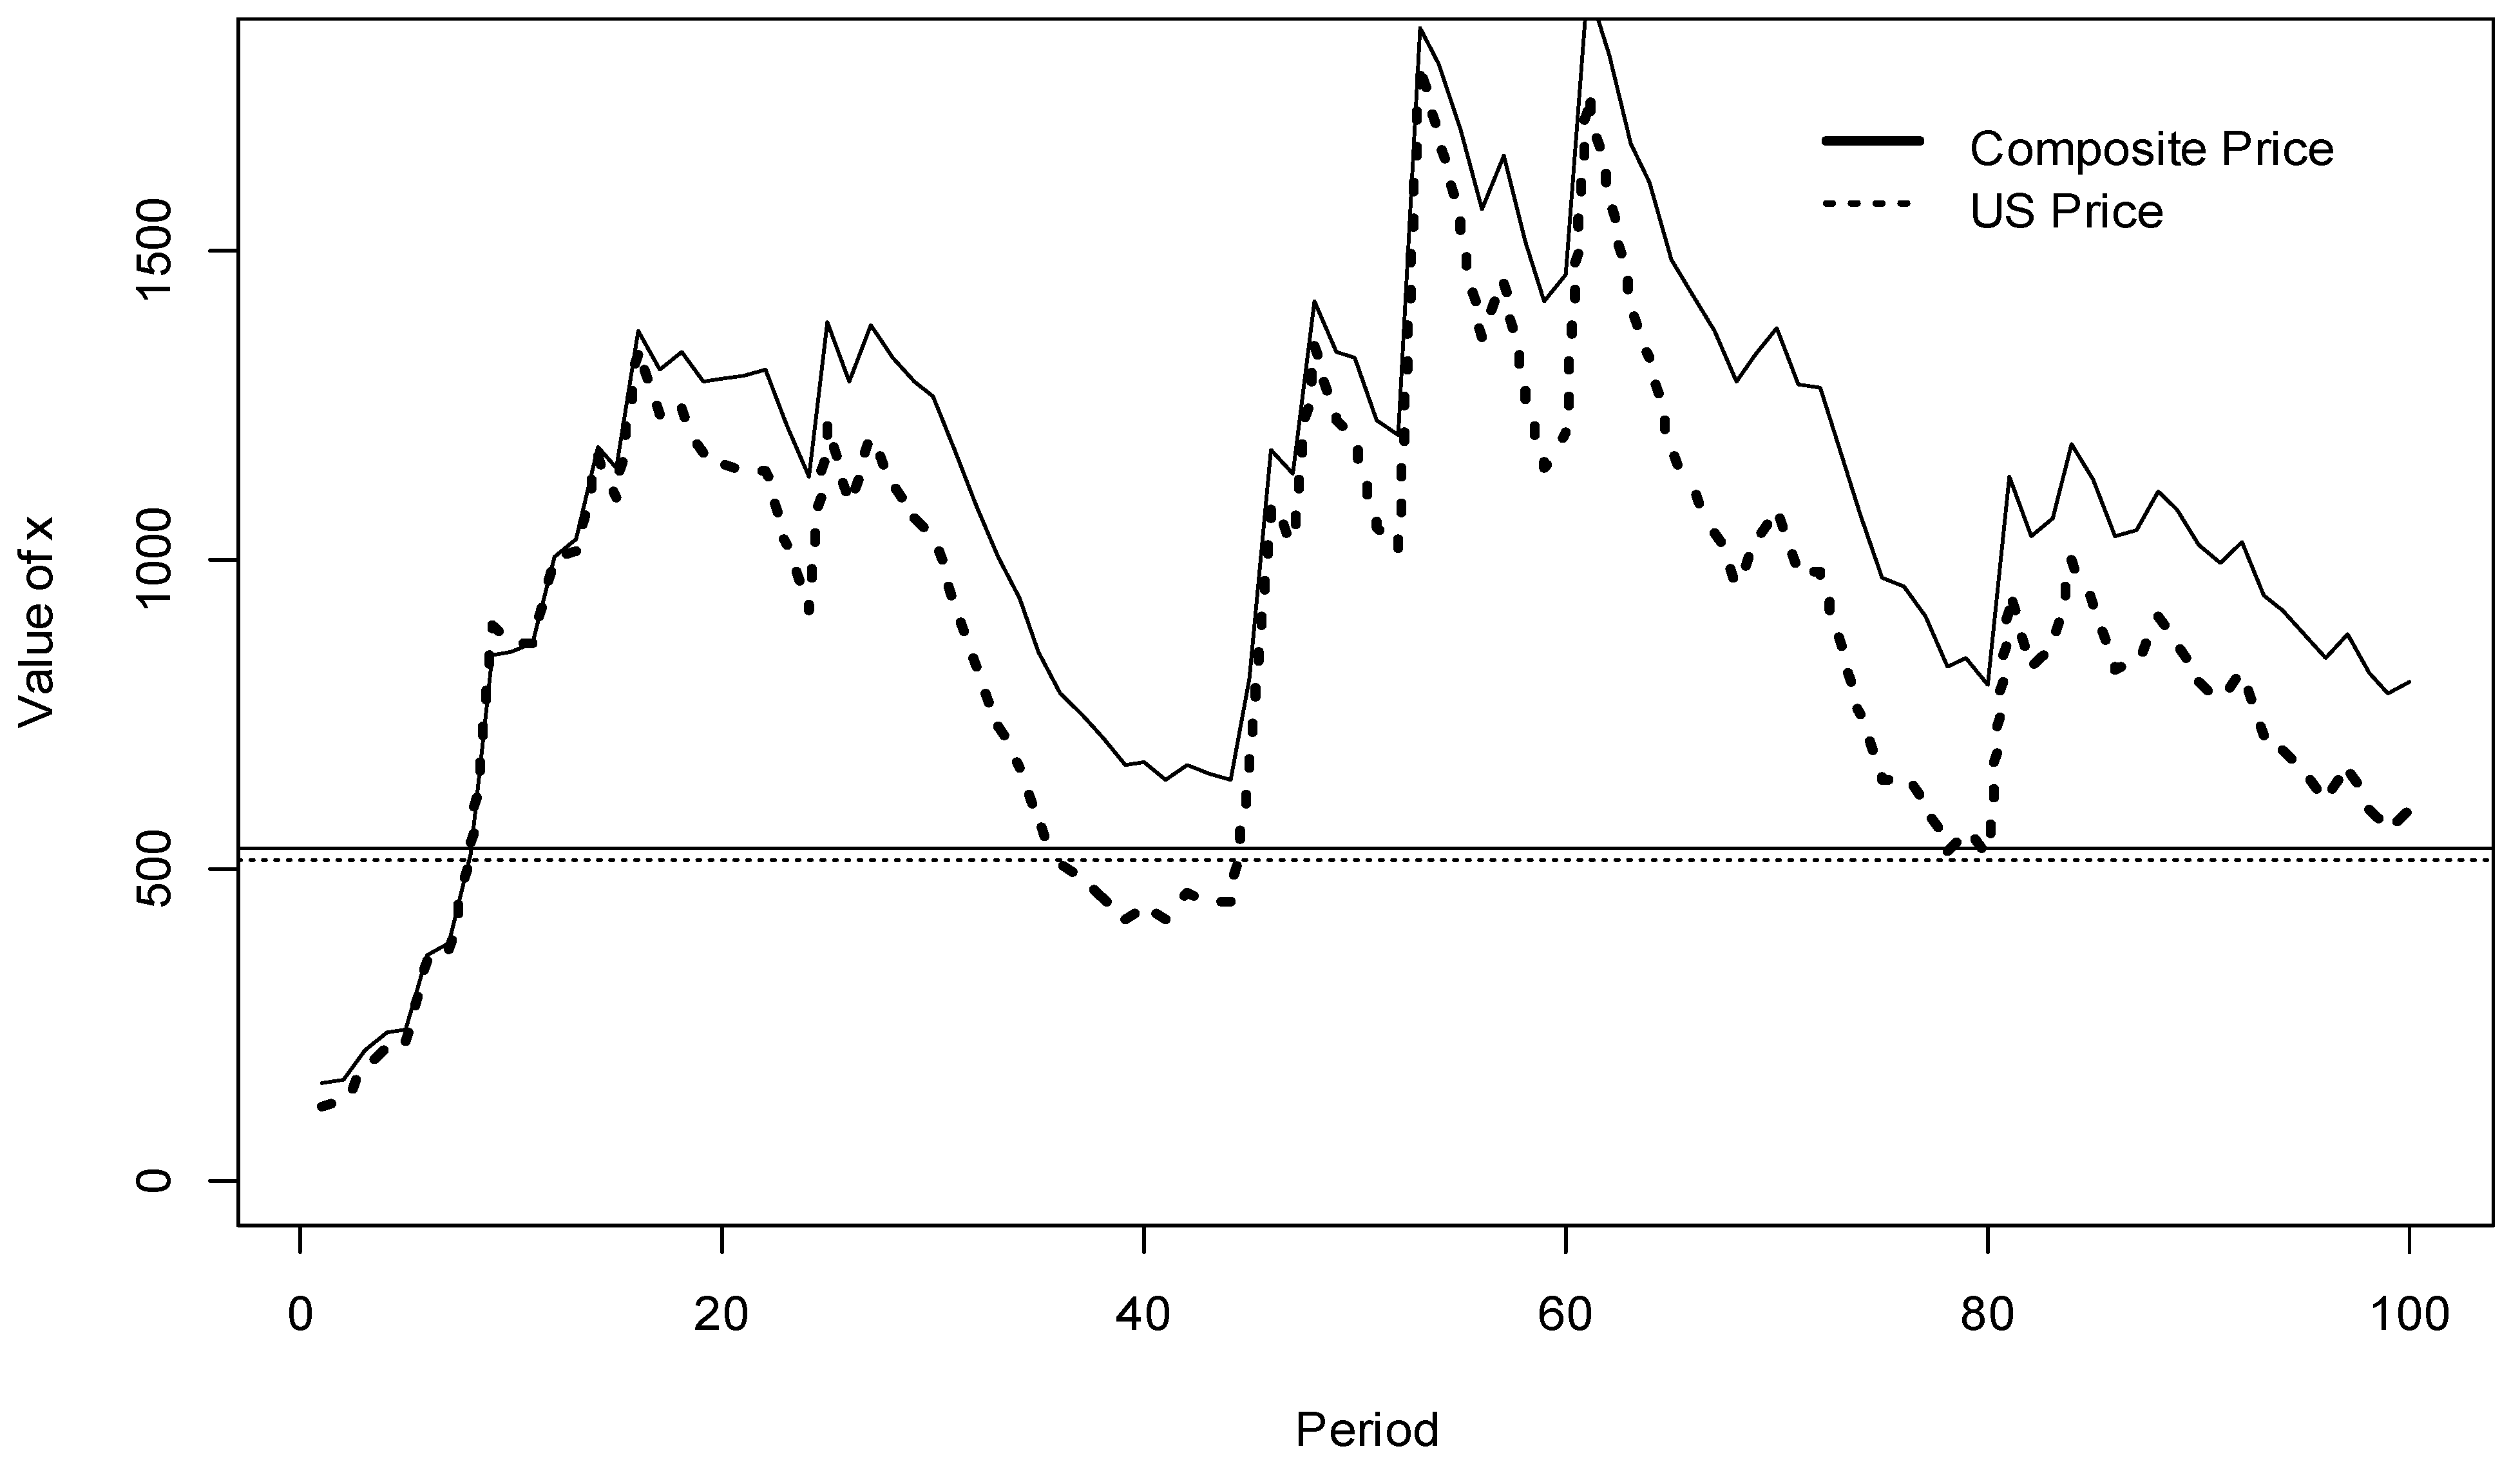
| Item | Composite Price | U.S. Price |
|---|---|---|
| Intercept α | 57.6332 | 78.0546 |
| (1.851) | (2.198) | |
| Slope β | 0.9072 | 0.8658 |
| (17.300) | (14.013) | |
| Residual standard error | 123.1 | 142.5 |
| Monthly σ | 13.41 | 16.00 |
| R2 | 0.8039 | 0.7317 |
| F-statistic | 299.3 | 196.4 |
| Number of observations | 75 | 74 |
| Variable | Description | Unit | Source | Model 1 | Model 2 | Model 3 | Model 4 |
|---|---|---|---|---|---|---|---|
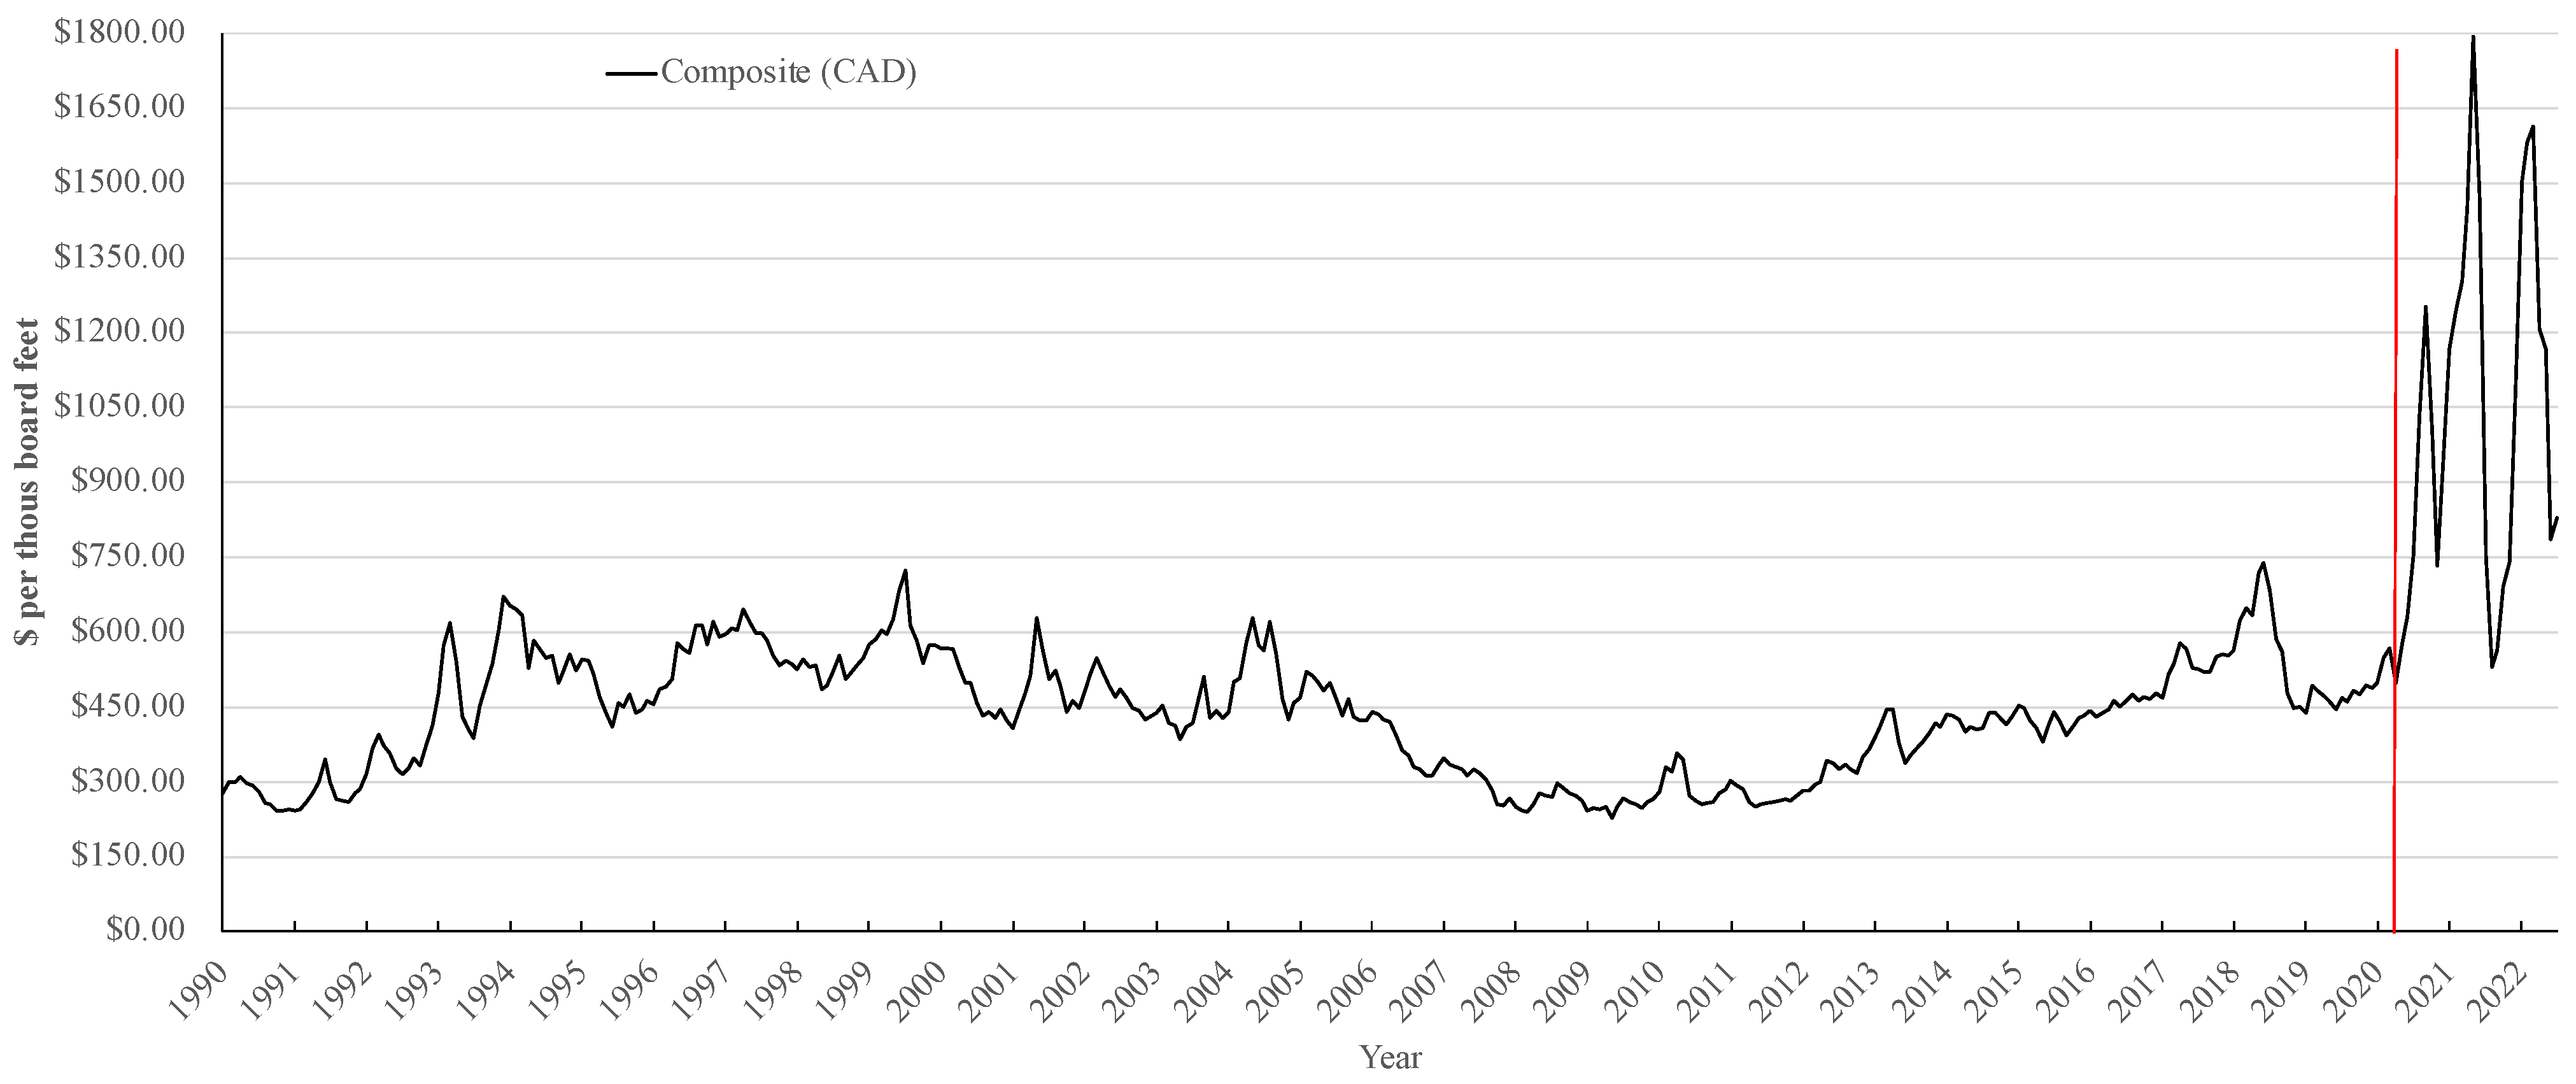
| Composite Lumber Price | $CAD | Random Lengths | X | X | X | X | |
| Excht | $CAD to $USD Exchange Rate | C$/US$ | FRED Economic Data | X | X | X | X |
| HSt | New Privately Owned Housing Units Started in the United States | 1000s | FRED Economic Data | X | X | X | X |
| ADCVDta | Anti-Dumping and Countervailing Duty Rates by the USA on Canadian Softwood Lumber | % | Various sources | X | X | ||
| Wt | Average Hourly Wage of Canadian’s Employed in Forestry and Logging | $CAD | Statistics Canada | X | X | ||
| PREt | Pre—Softwood Lumber Agreements | 0 or 1 | January 1981–December 1986 | X | X | ||
| MOUt | Memorandum of Understanding | 0 or 1 | January 1987–September 1991 | X | X | ||
| L2t | Period in between MOU and TRQ | 0 or 1 | January 1992–December 1993 | X | X | ||
| TRQt | Tariff Rate Quota Periods | 0 or 1 | April 1996–March 2005 | X | X | X b | X b |
| SLA06t | Softwood Lumber Agreement of 2006 | 0 or 1 | October 2006–December 2015 | X | X | X | X |
| POSTt | Post Softwood Lumber Agreement of 2006 | 0 or 1 | January 2017–July 2022 | X | X | X | X |
| FCt | Great Financial Crisis | 0 or 1 | December 2007–June 2009 | X | X | X | X |
| Covidt | COVID-19 Pandemic | 0 or 1 | January 2020–January 2022 | X | X | X | X |
| PNFt | Pacific Northwest Floods | 0 or 1 | November 2022–June 2022 | X | X | X | X |
| Regressor | (1981) | (1981) | (2001) | (2001) |
|---|---|---|---|---|
| Excht | 0.647 *** | 0.486 *** | 0.438 *** | 0.435 *** |
| (0.079) | (0.066) | (0.095) | (0.087) | |
| HSt | 0.0002 *** | 0.0002 *** | 0.0003 *** | 0.0002 *** |
| (0.00003) | (0.00002) | (0.00004) | (0.00004) | |
| ADCVDt | −0.013 *** | −0.008 *** | ||
| (0.001) | (0.002) | |||
| (0.030) | (0.025) | |||
| MOUt | −0.349 *** | −0.223 *** | ||
| (0.032) | (0.028) | |||
| L2t | −0.014 | 0.040 | ||
| (0.041) | (0.034) | |||
| Wt | 0.028 *** | 0.018 *** | ||
| (0.004) | (0.005) | |||
| TRQt | 0.003 | 0.066 *** | 0.081 | 0.108 ** |
| (0.030) | (0.025) | (0.051) | (0.046) | |
| SLA06t | −0.031 | −0.002 | 0.045 | 0.010 |
| (0.035) | (0.029) | (0.063) | (0.058) | |
| POSTt | 0.216 *** | 0.436 *** | 0.201 *** | 0.324 *** |
| (0.035) | (0.033) | (0.065) | (0.064) | |
| FCt | −0.263 *** | −0.170 *** | −0.146 *** | −0.133 *** |
| (0.040) | (0.033) | (0.043) | (0.039) | |
| Covidt | 0.351 *** | 0.326 *** | 0.283 *** | 0.286 *** |
| (0.041) | (0.033) | (0.040) | (0.036) | |
| PNFt | 0.626 *** | 0.594 *** | 0.443 *** | 0.472 *** |
| (0.061) | (0.050) | (0.065) | (0.059) | |
| Constant | 4.983 *** | 5.220 *** | 4.345 *** | 4.755 *** |
| (0.107) | (0.089) | (0.154) | (0.164) | |
| Observations | 501 | 501 | 255 | 255 |
Disclaimer/Publisher’s Note: The statements, opinions and data contained in all publications are solely those of the individual author(s) and contributor(s) and not of MDPI and/or the editor(s). MDPI and/or the editor(s) disclaim responsibility for any injury to people or property resulting from any ideas, methods, instructions or products referred to in the content. |
© 2023 by the authors. Licensee MDPI, Basel, Switzerland. This article is an open access article distributed under the terms and conditions of the Creative Commons Attribution (CC BY) license (https://creativecommons.org/licenses/by/4.0/).
Share and Cite
Zanello, R.; Shi, Y.; Zeinolebadi, A.; Kooten, G.C.v. COVID-19 and the Mystery of Lumber Price Movements. Forests 2023, 14, 152. https://doi.org/10.3390/f14010152
Zanello R, Shi Y, Zeinolebadi A, Kooten GCv. COVID-19 and the Mystery of Lumber Price Movements. Forests. 2023; 14(1):152. https://doi.org/10.3390/f14010152
Chicago/Turabian StyleZanello, Rebecca, Yin Shi, Atefeh Zeinolebadi, and G. Cornelis van Kooten. 2023. "COVID-19 and the Mystery of Lumber Price Movements" Forests 14, no. 1: 152. https://doi.org/10.3390/f14010152