Article

Effects of Biological and Chemical Degradation on the Properties of Scots Pine—Part II: Wood-Moisture Relations and Viscoelastic Behaviour

by
Magdalena Broda
1,*,
Morwenna J. Spear
2,
Simon F. Curling
2 and
Athanasios Dimitriou
2
1
Department of Wood Science and Thermal Techniques, Faculty of Forestry and Wood Technology, Poznań University of Life Sciences, ul. Wojska Polskiego 38/42, 60-637 Poznan, Poland
2
BioComposites Centre, Bangor University, Deiniol Road, Bangor LL57 2UW, UK
*
Author to whom correspondence should be addressed.
Forests 2022, 13(9), 1390; https://doi.org/10.3390/f13091390
Submission received: 3 August 2022 / Revised: 26 August 2022 / Accepted: 29 August 2022 / Published: 31 August 2022
(This article belongs to the Special Issue Physical Properties of Wood)

Abstract

:
The present research aimed to assess the moisture properties and viscoelastic behaviour of artificially degraded pine wood, intended to serve as a model material for ongoing studies on new conservation treatments for waterlogged archaeological wood. Sorption isotherms and hydroxyl accessibility were measured using a Dynamic Vapour Sorption (DVS) system, while the investigation of the selected wood rheological properties was performed using Dynamic Mechanical Analysis (DMA). Fungal decomposition of pine by Coniophora puteana decreased the maximum equilibrium moisture content (EMC) from 20.3% to 17.7% in the first and from 19.9% to 17.1% in the second DVS run compared to undegraded pine, while chemical degradation using 50% NaOH solution increased the wood EMC to 24.6% in the first and 24.2% in the second run. The number of free hydroxyls measured for the biologically degraded sample was similar to sound wood, while chemical degradation reduced their number from 11.3 mmol g−1 to 7.9 mmol g−1. The alterations in the wood chemical composition due to different degradation processes translated into changes in viscoelastic behaviour. For biologically degraded wood, a reduction in the loss modulus and storage modulus at the temperature of 25 °C was observed compared to undegraded pine. Surprisingly, for chemically degraded pine, the values were more similar to sound wood due to the considerable densification of the material resulting from shrinkage during drying. The loss factor values for both degraded wood types were higher than for undegraded ones, indicating an increase in damping properties compared to sound pine. Distinct changes were visible in the storage modulus and loss factor graphs for DMA of chemically and biologically degraded pine. The degradation processes used in the study produced wood types with different moisture and viscoelastic properties. However, both seem useful as model materials in the research on the new conservation agents for waterlogged archaeological wood.

1. Introduction

Fulfilling the obligation to protect and save our wooden cultural heritage for future generations requires the development of new proper conservation methods. In order to achieve this, broad research is needed, which demands large amounts of material. It is impossible to obtain enough archaeological wood with similar properties for extensive studies on new conservation agents, hence the idea to use artificially (biologically and chemically) degraded wood that mimics naturally degraded archaeological one [1,2,3,4]. However, detailed knowledge about the material’s properties is necessary to interpret the results of further research on new conservation agents correctly.
Wood is a hygroscopic material that constantly exchanges moisture with the surrounding environment. Moisture in wood plays a crucial role in its dimensional stability, mechanical properties and susceptibility to fungal degradation—thus, the moisture content is crucial for wood’s performance [5,6,7,8,9]. Moisture properties depend on many factors, including the microstructure of the cell wall (surface area, number and size of pores) and the number of active sorption sites on the cell wall polymers [8,9,10]. Since degradation processes change the wood chemical composition by decomposing selected cell wall polymers (entirely or to some extent), they inevitably alter the wood moisture behaviour [11,12,13]. That, in turn, directly affects the rheological properties of wood that concurrently depend on the cell wall structure [14,15,16].
In the first step of the research (Part I [4]), the changes in the chemical composition and cell wall microstructure produced by biological and chemical degradation were investigated. The present research aimed to determine how those changes affected the wood moisture and rheological properties in order to supplement the characteristics of degraded wooden material. A Dynamic Vapour Sorption method was used to analyse wood moisture properties, while Dynamic Mechanical Analysis was involved in characterising its viscoelastic behaviour in a broad temperature range (from −150 to +150 °C) by identifying relaxation events for degraded pine in comparison with sound pine wood. This type of data is useful when considering the storage and display of artefacts, as the humidity/water uptake profile is key. Moreover, mechanical testing gives important information on the stress forming within the material during treatment, handling and storage.

2. Materials and Methods

2.1. Materials

The research material was contemporary Scots pine (Pinus sylvestris L.) sapwood—sound and artificially degraded under laboratory conditions to mimic degraded archaeological wood. For biological wood decay, a brown-rot fungus Coniophora puteana (Shum.: Fr.) P. Karst BAM 112 (BAM Ebw. 15) was used (resulted in about 38.5% mass loss), while chemical degradation was performed by soaking wood samples in 50% NaOH solution (mass loss of about 17%), as described in Part I [4].

2.2. Methods

2.2.1. Sample Preparation

Air-dried sound and degraded wood specimens of original dimensions about 20 × 20 × 10 mm (in the radial, tangential and longitudinal direction, respectively) were cut across the annual rings to obtain specimens with dimensions appropriate for Dynamic Mechanical Analysis (DMA), approximately 20 × 10 × 3 mm (in the radial, longitudinal and tangential direction). Before the measurements, they were conditioned at room temperature (21 ± 1 °C) and ambient air relative humidity (40 ± 5%) until equilibrium moisture content was achieved. Five specimens of each wood type cut from the same wooden block were analysed.

2.2.2. Dynamic Mechanical Analysis

The wood viscoelastic behaviour was analysed with a Triton Technology DMA analyser (Grantham, UK). A single cantilever deformation mode was used, where the bending moment was applied to the sample in the radial direction. The dynamic force was 0.2 N and oscillated with a frequency of 1 Hz; the static force was 2 N. The measurement was conducted over the temperature range from −150 °C to 150 °C with a heating rate of 5 °C/min to observe the wood relaxation behaviour. The dynamic storage modulus (the ratio of stress to strain under vibratory conditions, E′), the loss modulus (a measure of the energy dissipated or lost per cycle of sinusoidal deformation, E″) and the loss factor (the energy dissipation potential of the material, tan δ = E″/E′) were determined.
Bulk density at the time of the test (ρ) was calculated for all conditioned wood samples as the ratio of the specimen weight (prior to test) to its volume (prior to test).

2.2.3. Moisture Sorption Analyses

To better understand the effect of the degradation processes on the wood viscoelastic behaviour, moisture properties were also analysed in parallel with the DMA tests. The measurements were performed at a constant temperature of 21 ± 0.2 °C on powdered sound and biologically and chemically degraded wood (about 10 mg of each type) using a Dynamic Vapour Sorption (DVS) system (DVS Advantage, Surface Measurement Systems, London, UK) [17]. Since the analysis aimed to compare the moisture properties of sound and degraded wood and not to determine the most precise values, the criterion for the end of each stage was set at 0.002% for 10 min. Whilst longer hold times may yield slightly different results, in this case, as long as conditions were exact for each sample, comparisons between samples would be representative [17,18]. Two sorption cycles were run for each specimen to allow more detailed moisture sorption characteristics of sound and degraded wood.

2.2.4. Hydroxyls Accessibility Measurements

The accessibility of the hydroxyl groups was analysed with the method that utilises deuterium exchange in the DVS apparatus, where instead of water, deuterium oxide (D2O) was used during the measurements [10,19]. About 10 mg of wood powder was first preconditioned in the sample pan at a temperature of 21 °C and 0% RH of D2O and nitrogen (flow rate 200 cm3 s−1) to remove any adsorbed water molecules until mass stability of less than 0.002% change in 10 min was achieved. Then, six adsorption–desorption (RH 0%–90%) cycles per sample were conducted, and the increase of wood dry mass due to deuterium exchange was calculated. In a similar manner to standard moisture sorption analysis, the period for which the sample was maintained at a constant relative humidity until its moisture content change was less than 0.002% per minute was adjusted to 10 min to ensure reaching the equilibrium in each RH step. Finally, hydroxyls accessibility was calculated from the difference between the initial dry mass of the sample and the dry mass after the final cycle when the mass remained constant.

3. Results and Discussion

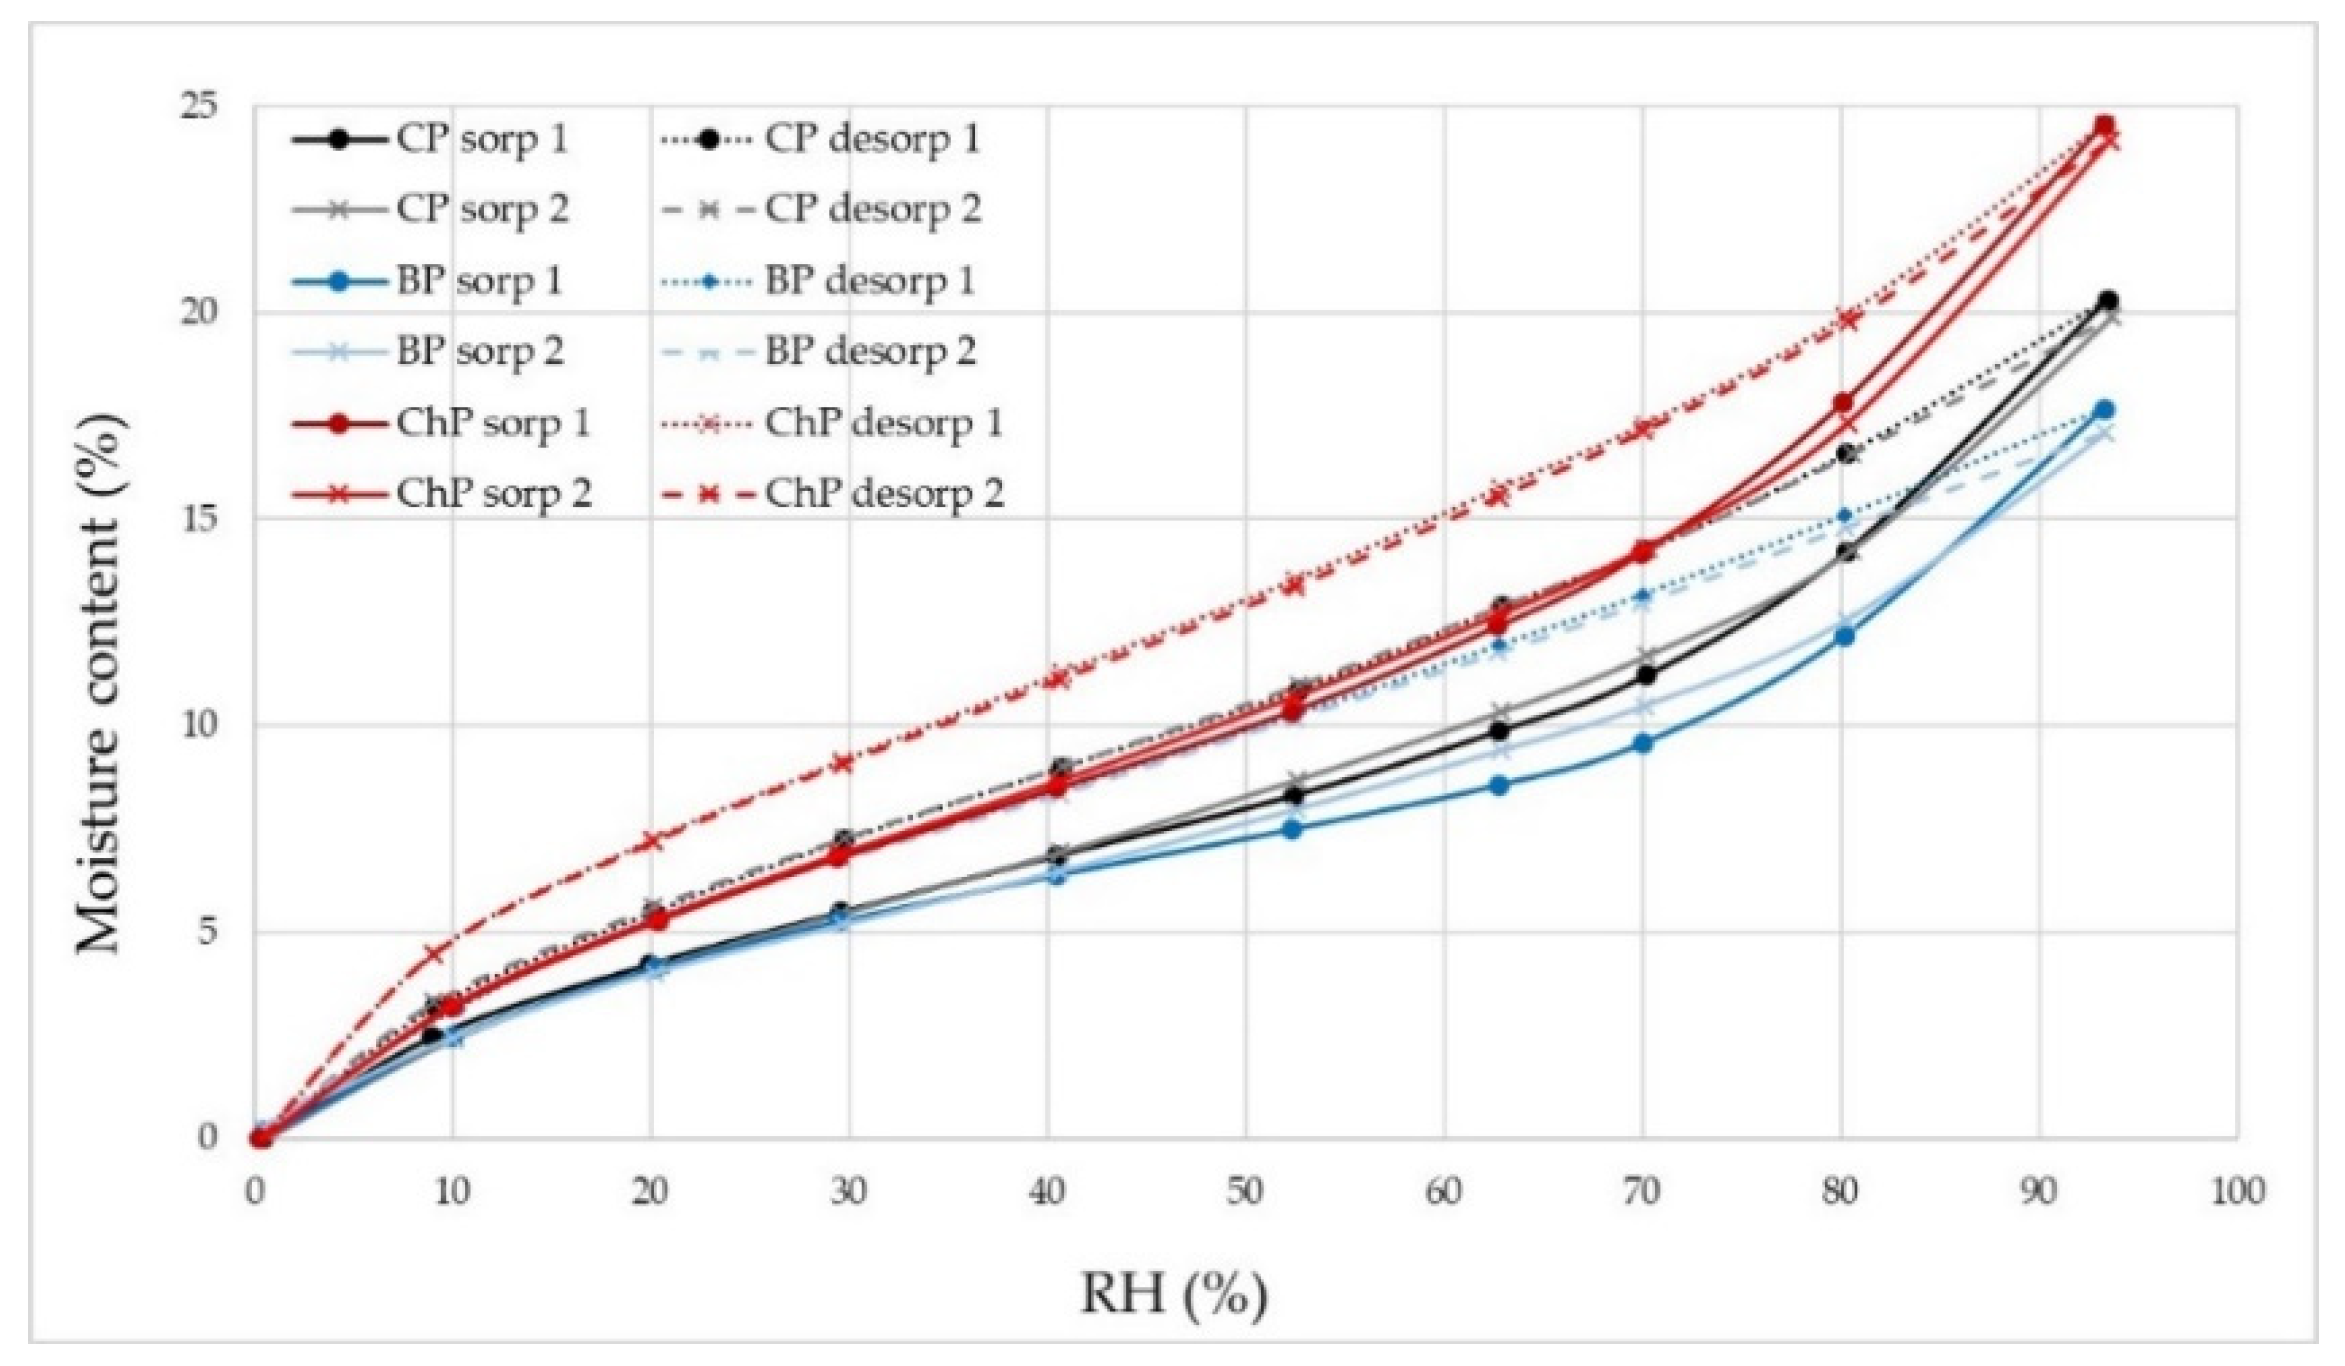
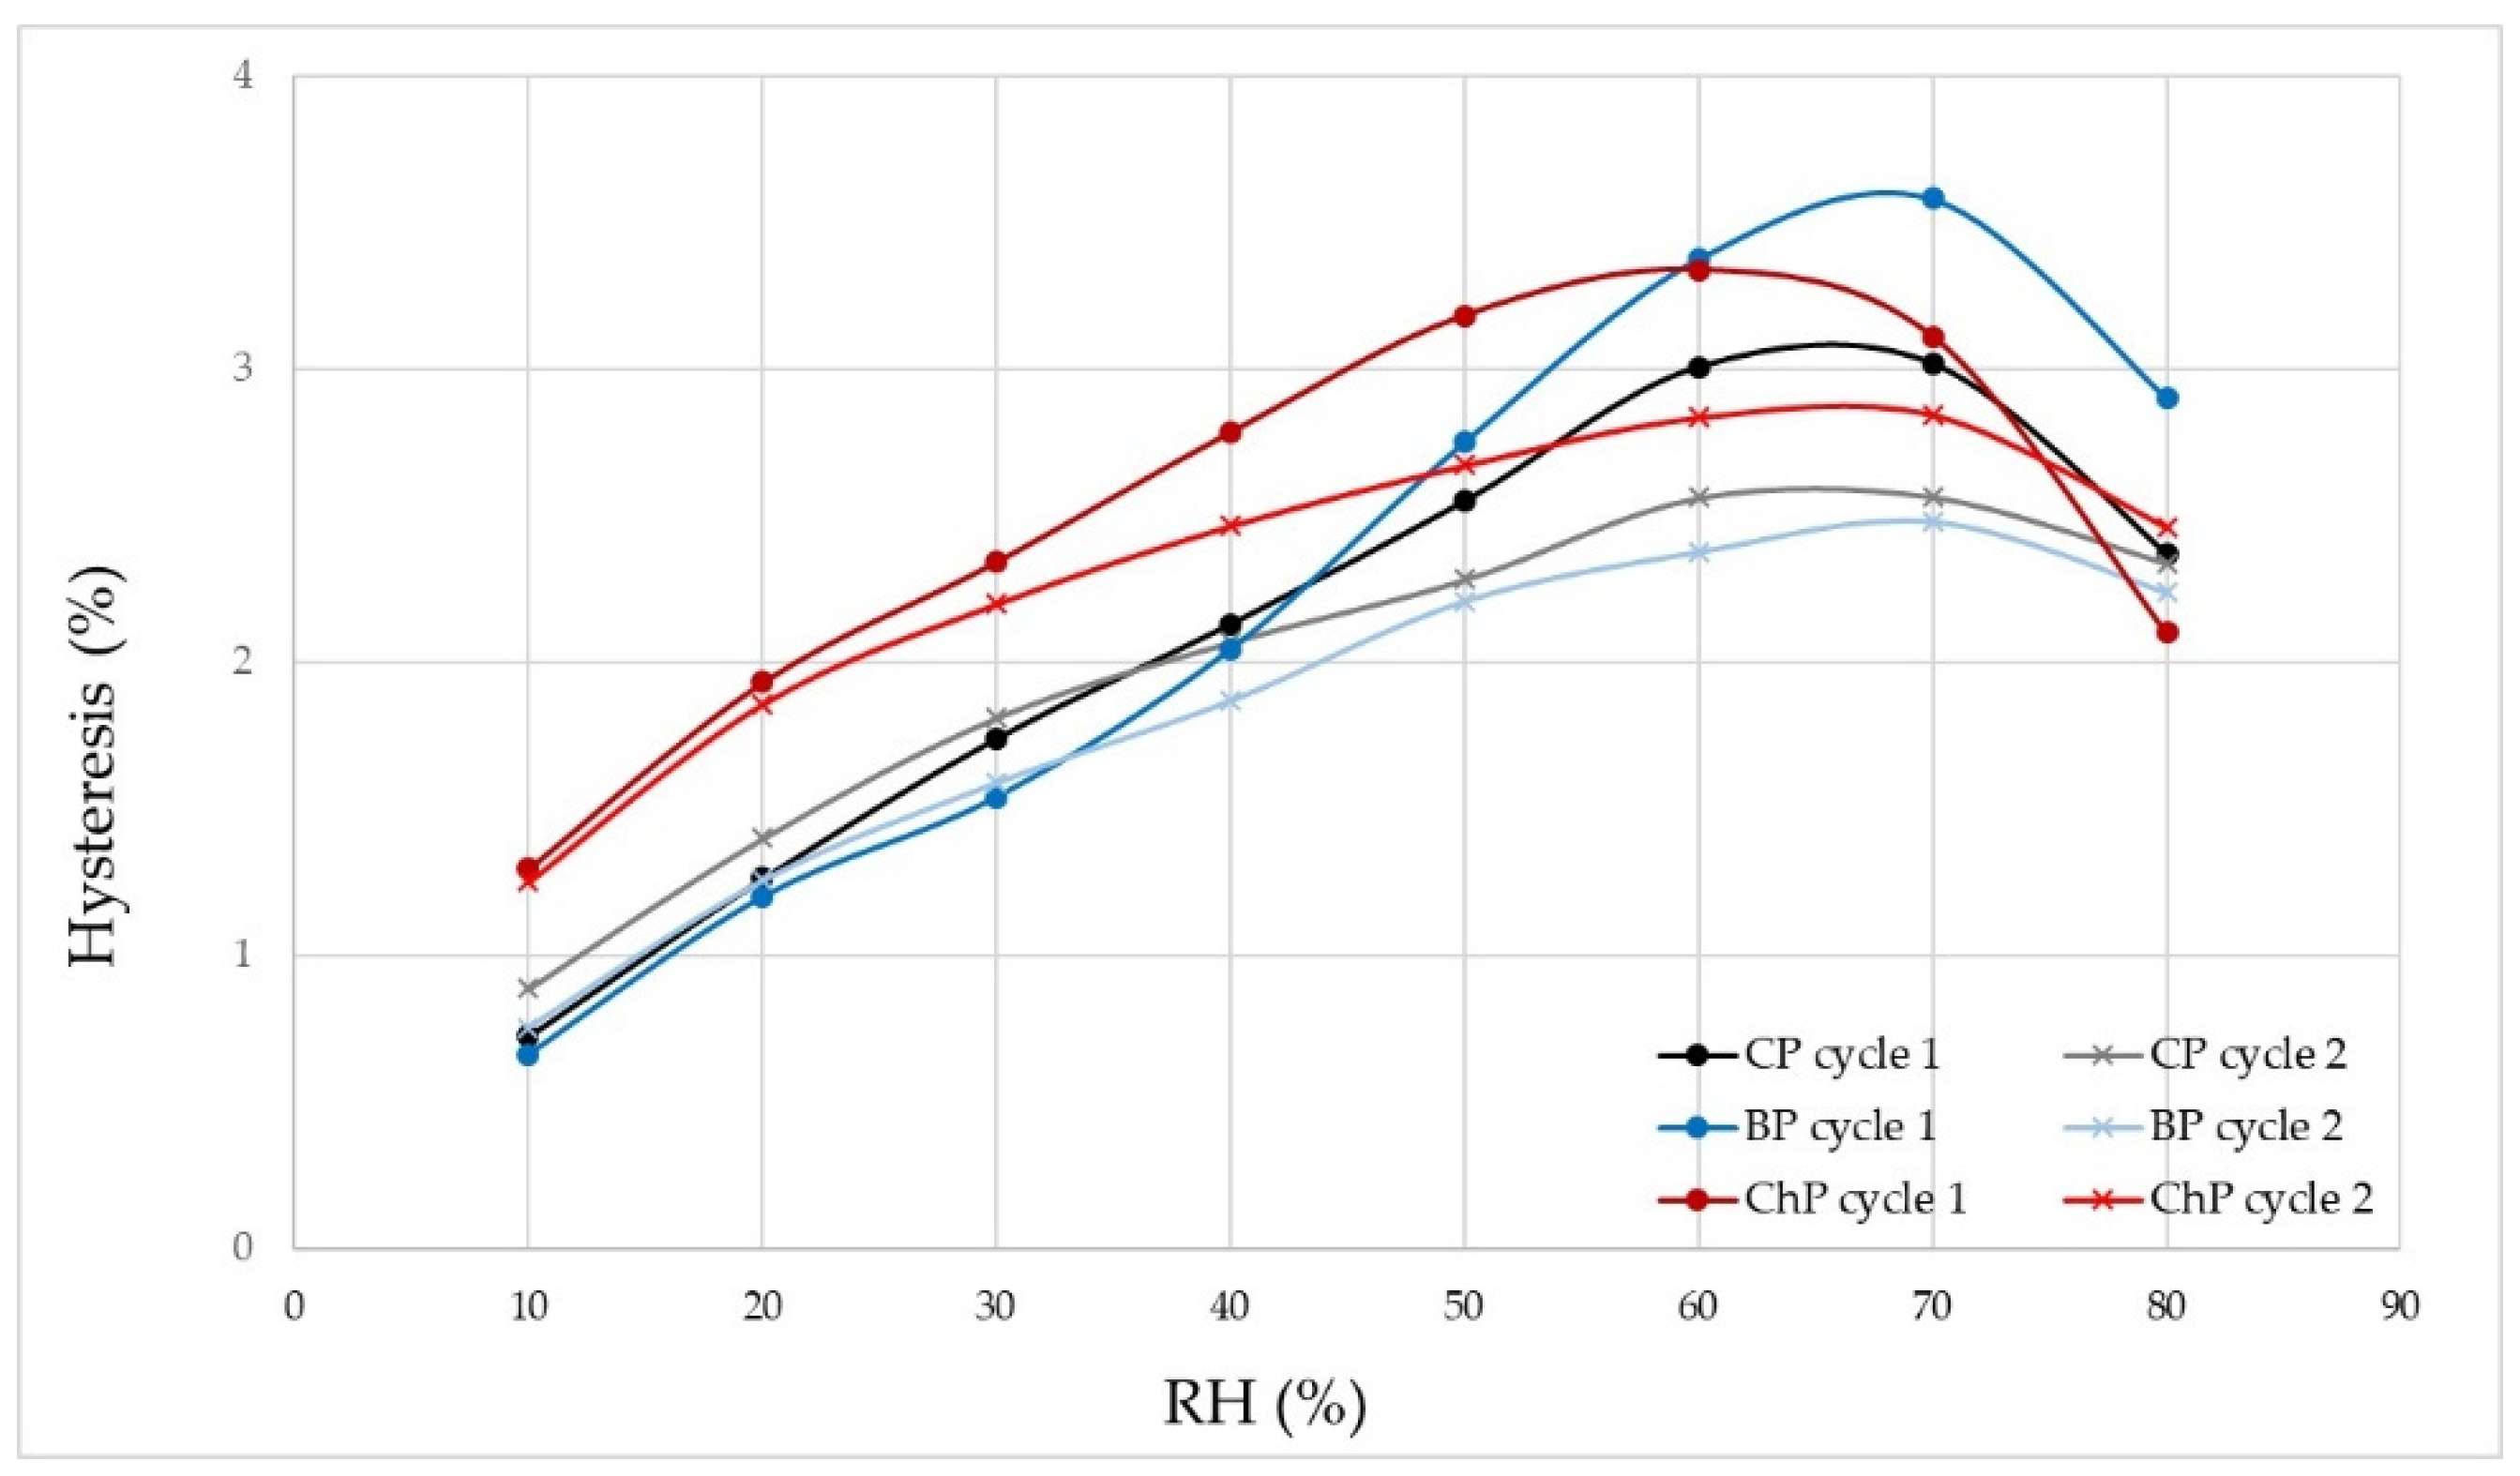
3.1. Moisture Properties of Sound and Degraded Pine

Presented as sorption isotherms and hysteresis in Figure 1 and Figure 2 and data in Table 1, the results of the DVS analysis show that both degradation processes—biological and chemical—changed the moisture properties of wood, but in a different way.
For all samples, sorption isotherms show the characteristic sigmoidal shape for both the adsorption and desorption processes (Figure 1), and the differences between the first and the second run, typical for wood, can be seen [20,21]. However, some alterations between the samples can be seen depending on the degradation procedure applied.
Fungal decomposition of pine by C. puteana decreased the maximum observed equilibrium moisture content (EMC) from 20.3% to 17.7% in the first and from 19.9% to 17.1% in the second DVS run compared to undegraded pine. Adsorption curves for two cycles are similar up to 40% RH, and desorption curves—up to 70% RH. Above these values, the variations between the cycles can be seen, and they are more pronounced than for undegraded wood.
The reduction of moisture sorption for brown-rot-decayed wood is a consequence of significant changes in the wood chemical composition [22,23,24,25]. In the very early stages of fungal decay, when only depolymerisation of the cell wall components occurs, the number of sorption sites (free hydroxyl groups) increases. However, as the decomposition proceeds, the resulting decrease in the amount of individual wood polymers reduces the number of sorption sites. Most free hydroxyl groups in the wood cell wall are provided by hemicelluloses, followed by amorphous cellulose. Since brown-rot decomposes hemicelluloses and cellulose selectively, the reduction of sorption for heavily decayed wood is evident. The reduction was shown to become more pronounced with the increasing wood mass loss [22,23,25,26].
The number of free hydroxyls measured for the biologically degraded (BP) sample was similar to sound wood (CP) (Table 1). However, at the same time, the standard deviation for BP was higher, indicating less uniformity, presumably due to uneven degradation. Despite an increase in the cell wall surface area and total pore volume, the fungal decomposition of hemicelluloses and cellulose (which led to a relative increase in lignin with only limited numbers of hydroxyl groups) was advanced enough to reduce wood moisture sorption (wood mass loss of 38.5%) [4,27].
In contrast, chemical degradation using 50% NaOH increased the wood EMC at a maximum relative humidity in the DVS run, from 20.3% (for untreated pine) to 24.6% (ChP) in the first and 19.9% (CP) to 24.2% (ChP) in the second run, along with an increase in the number of free hydroxyls (11.3 mmol g−1 vs. 7.9 mmol g−1 compared to undegraded wood). Adsorption and desorption curves for two cycles are similar up to 70% RH. Above these values, the variations between the cycles are visible and different compared to undegraded wood.
The results for chemically degraded wood reflect the changes in the wood chemical composition—this treatment reduced both the hemicellulose and lignin content [4], so although decreasing the hydroxyl-rich hemicelluloses did, removing lignin increased the relative concentration of hydroxyl-rich carbohydrates in the cell wall. One possibility is the degradation of cellulose, or the interaction between hydroxide ions and the crystalline cellulose, which is known to alter crystalline conformation in processes such as mercerization, increasing accessibility of previously inaccessible cellulose crystalline regions. Loss of lignin has been shown to result in higher EMC and greater hygroexpansion [28]. Reducing crosslinks between lignin and hemicelluloses with cellulose resulted in the cellulose microfibrils being surrounded by an increasingly loose and elastic network, which facilitates their interactions with water molecules [29]. The NaOH treatment also reduced cellulose crystallinity, increasing free hydroxyls on this polymer [4]. Barman et al. [30] and Ishikura et al. [31] observed similar phenomena. Interestingly, Ishikura et al. [31] reported a decrease of active sorption sites in wood treated with NaOH concentration up to 5% and their increase when 20% NaOH was used, while Barman et al. [30] observed that although NaOH of concentration of 10% increased the number of active sorption sites (due to hemicelluloses dissolution and removal of fat, pectin and lignin) and relatively increased cellulose crystallinity (due to decomposition of both hemicelluloses and lignin), higher alkali concentration (20%) caused the opposite effect and reduced the number of free -OH because of further degradation of cellulose fibrils. The difference between the reports may result from different wood species used in the studies. Nevertheless, both research groups confirmed increased wood hygroscopicity after alkali treatment.
All isotherms recorded for degraded and undegraded wood (Figure 1) present sorption hysteresis (Figure 2) typical for porous materials (including wood) where equilibrium moisture content under the same conditions is higher during desorption than during adsorption. This results from incomplete rehydration of active sorption sites during adsorption, the effects of compressive stresses during swelling and the relaxation of matrix polymers of the cell wall upon changeable moisture conditions [9,21,32,33]. However, the hysteresis is different for each sample, and significant disparities in the values and shape of hysteresis curves between undegraded, biologically and chemically degraded specimens can be seen (Figure 2).
With undegraded (CP) and biologically degraded (BP) pine, the maximum observed hysteresis could be seen at close to 70% RH. However, the maximum observed hysteresis of BP has a much greater value in the first cycle, while in the second run, the value is lower compared to CP (Table 1). There is a large difference between the two cycles for BP (ΔHmax of 1.1%), while for CP, it is much smaller (ΔHmax of 0.45%). In the first run, the shape of the BP hysteresis curve is similar to CP (Figure 2). The curves almost overlap up to 20% RH, then BP goes below the CP, and finally, it overtops CP from about 43% RH up to the highest RH values registered during the measurement. Interestingly, in the second cycle, the BP hysteresis is lower than CP over the whole RH range, and the shape of both curves is uneven.
With chemically degraded pine (ChP), the hysteresis looks utterly different from BP and CP. First of all, the shape of hysteresis curves is different, being broadened and flatter (Figure 2). The maximum hysteresis for ChP is higher than CP in both cycles (Table 1) and is shifted towards lower RH in the first run (about 60%). The difference between ΔHmax for both wood types is smaller (0.49% for ChP and 0.45% for CP) than for BP and CP. In the first run, the ChP hysteresis curve overtops CP up to about 72%, where it rapidly slopes, while in the second cycle, it overtops CP in the entire RH range and is flatter and more regular in shape than CP.
The width of the hysteresis loop in wood depends on internal bonding between individual cell wall polymers. The loop grows as the number of bonds increases [26]. For biologically degraded pine, the wide hysteresis loop observed suggests advanced degradation due to the formation of new inter-structural bonds after decomposition of individual wood polymers, which is in line with the mass loss of 38.5% calculated for this wood [4] and with the observations by Irbe et al. [26]. On the other hand, a narrower loop of ChP hysteresis reflects the early stage of degradation with the decomposition of hemicelluloses that typically form numerous bonds with cellulose and lignin, confirmed with a lower mass loss of about 18%.
The difference in hysteresis between the first and the second DVS cycle is typical for wood. It has been suggested to result from the phenomenon known as hornification [10], though this is subject to discussion. The first drying from the native state appears to cause structural changes in the cell walls, which could affect their access to water [10,34]. It is usually explained as an effect of the annealing process of amorphous cell wall polymers induced by drying. The resulting energy or stress required to re-open ‘closed’ pores between these cell wall polymers typically exceeds the energy available for sorbing water, limiting their ability to absorb water. However, when the wood is exposed to high humidity, the high moisture content plasticises the polymers, thus facilitating their relaxation for many temporarily closed sites. This leads to the partial recovery of their initial conformation and changes in the moisture behaviour in the second sorption cycle, but in the following cycles, the hystereses are mostly reproducible [34,35,36].
The proposed mechanisms behind moisture uptake differ depending on the water’s location within the wood structure. For water in the cell lumina (macro voids), the pore blocking or ink-bottle effects with pits acting as bottlenecks during desorption seem the most plausible [9,37]. For water in the cell walls, the possible mechanisms related to the alterations in the hydrogen bonding arrangement during dimensional changes due to moisture content changes or the mechanical properties of the cell wall [32,33,38]. The data detailed in Part 1 [4] shows that CP produces more small mesopores within the wood, whilst BP also produces mesopores and some macropores and thus has a more complicated and varied structural change. It is clear that a simple explanation of increasing surface area or volume of pores does not correlate to higher moisture content. Therefore, questions remain on the effect of the complex changes in the chemical and geometric structure of the cell walls.
The behaviour of wood in the moisture content range between dry and saturated states is complex and subject to much research, and as such, exact explanations of the mechanisms involved are beyond the scope of this paper. However, as a comparison of the behaviour of the treated samples with respect to moisture is of key importance, then an attempt at some explanation of observations has been made.
So, to summarise, if the moisture properties of degraded wood are considered, the behaviour of chemically degraded pine seems to be the most similar to the majority of wooden archaeological artefacts [11,39,40]. However, there were also archaeological findings with properties similar to biologically degraded pine [20]. Since moisture behaviour depends on several factors, including the degree of degradation and related chemical composition and microstructure, as well as the drying/wetting history of the sample, every wooden artefact should be considered individually. From this perspective, both degradation treatments applied seem to produce research material relevant for further study on new conservation treatments for waterlogged archaeological wood.

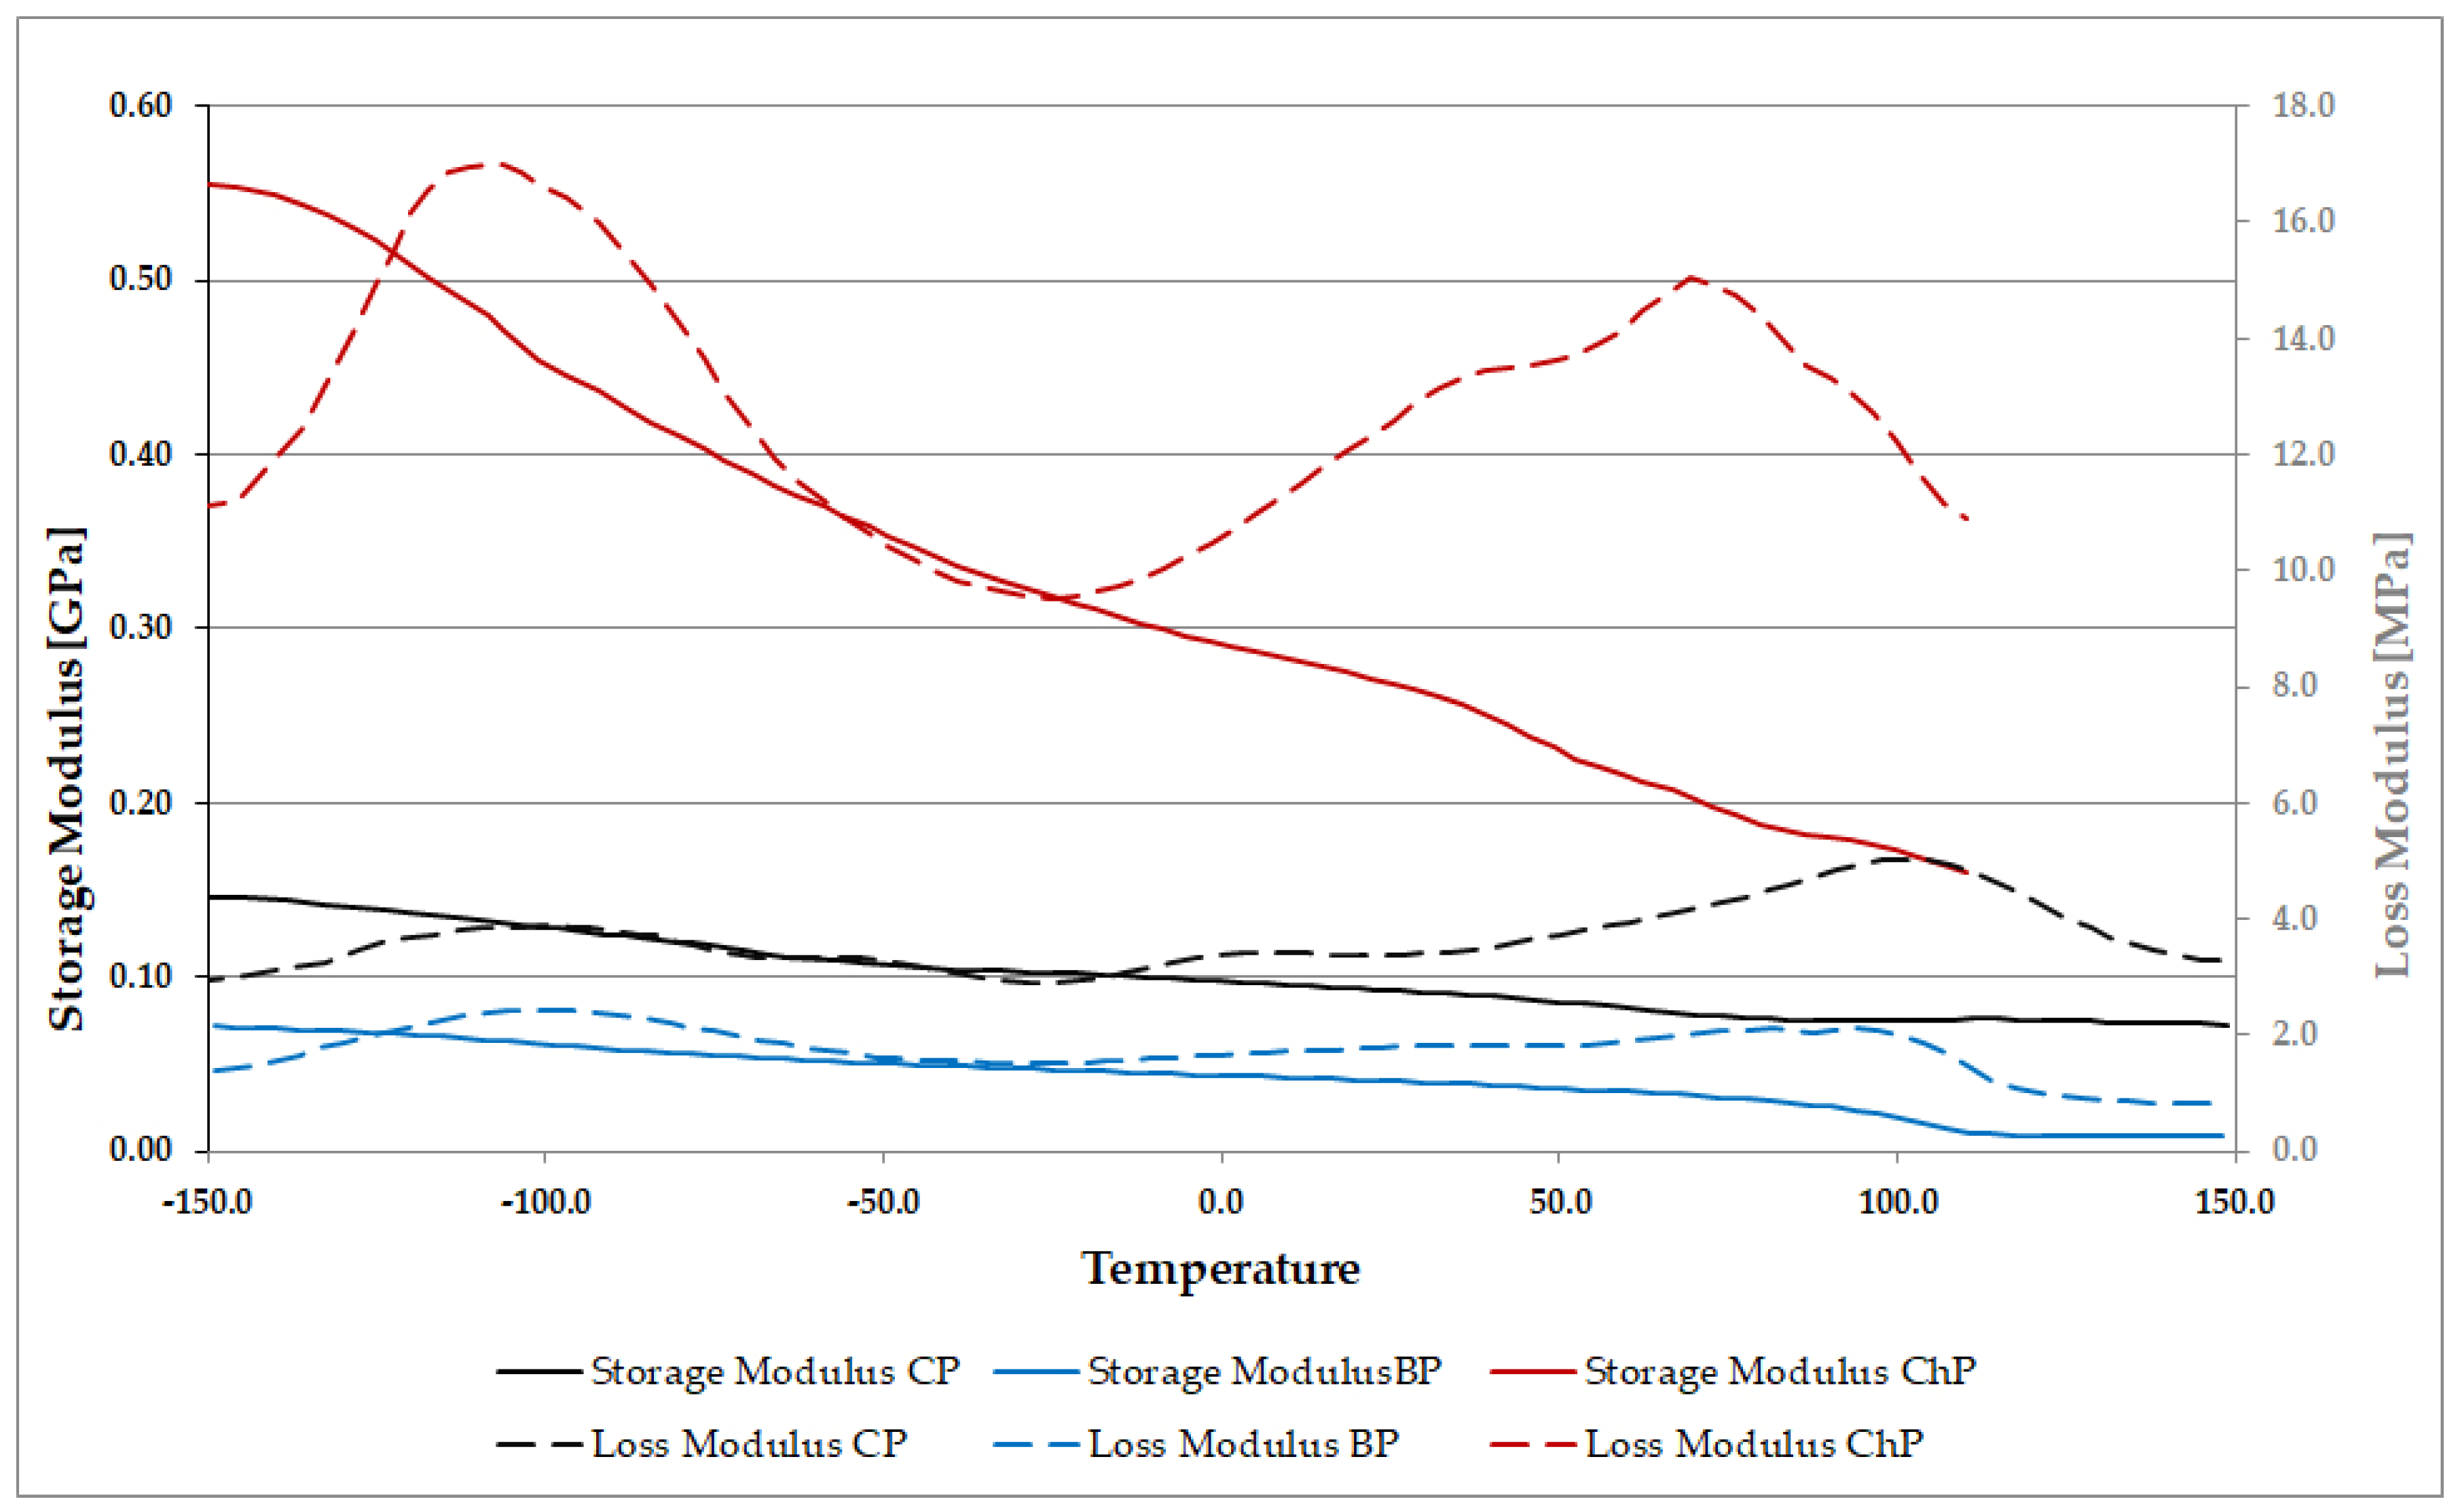
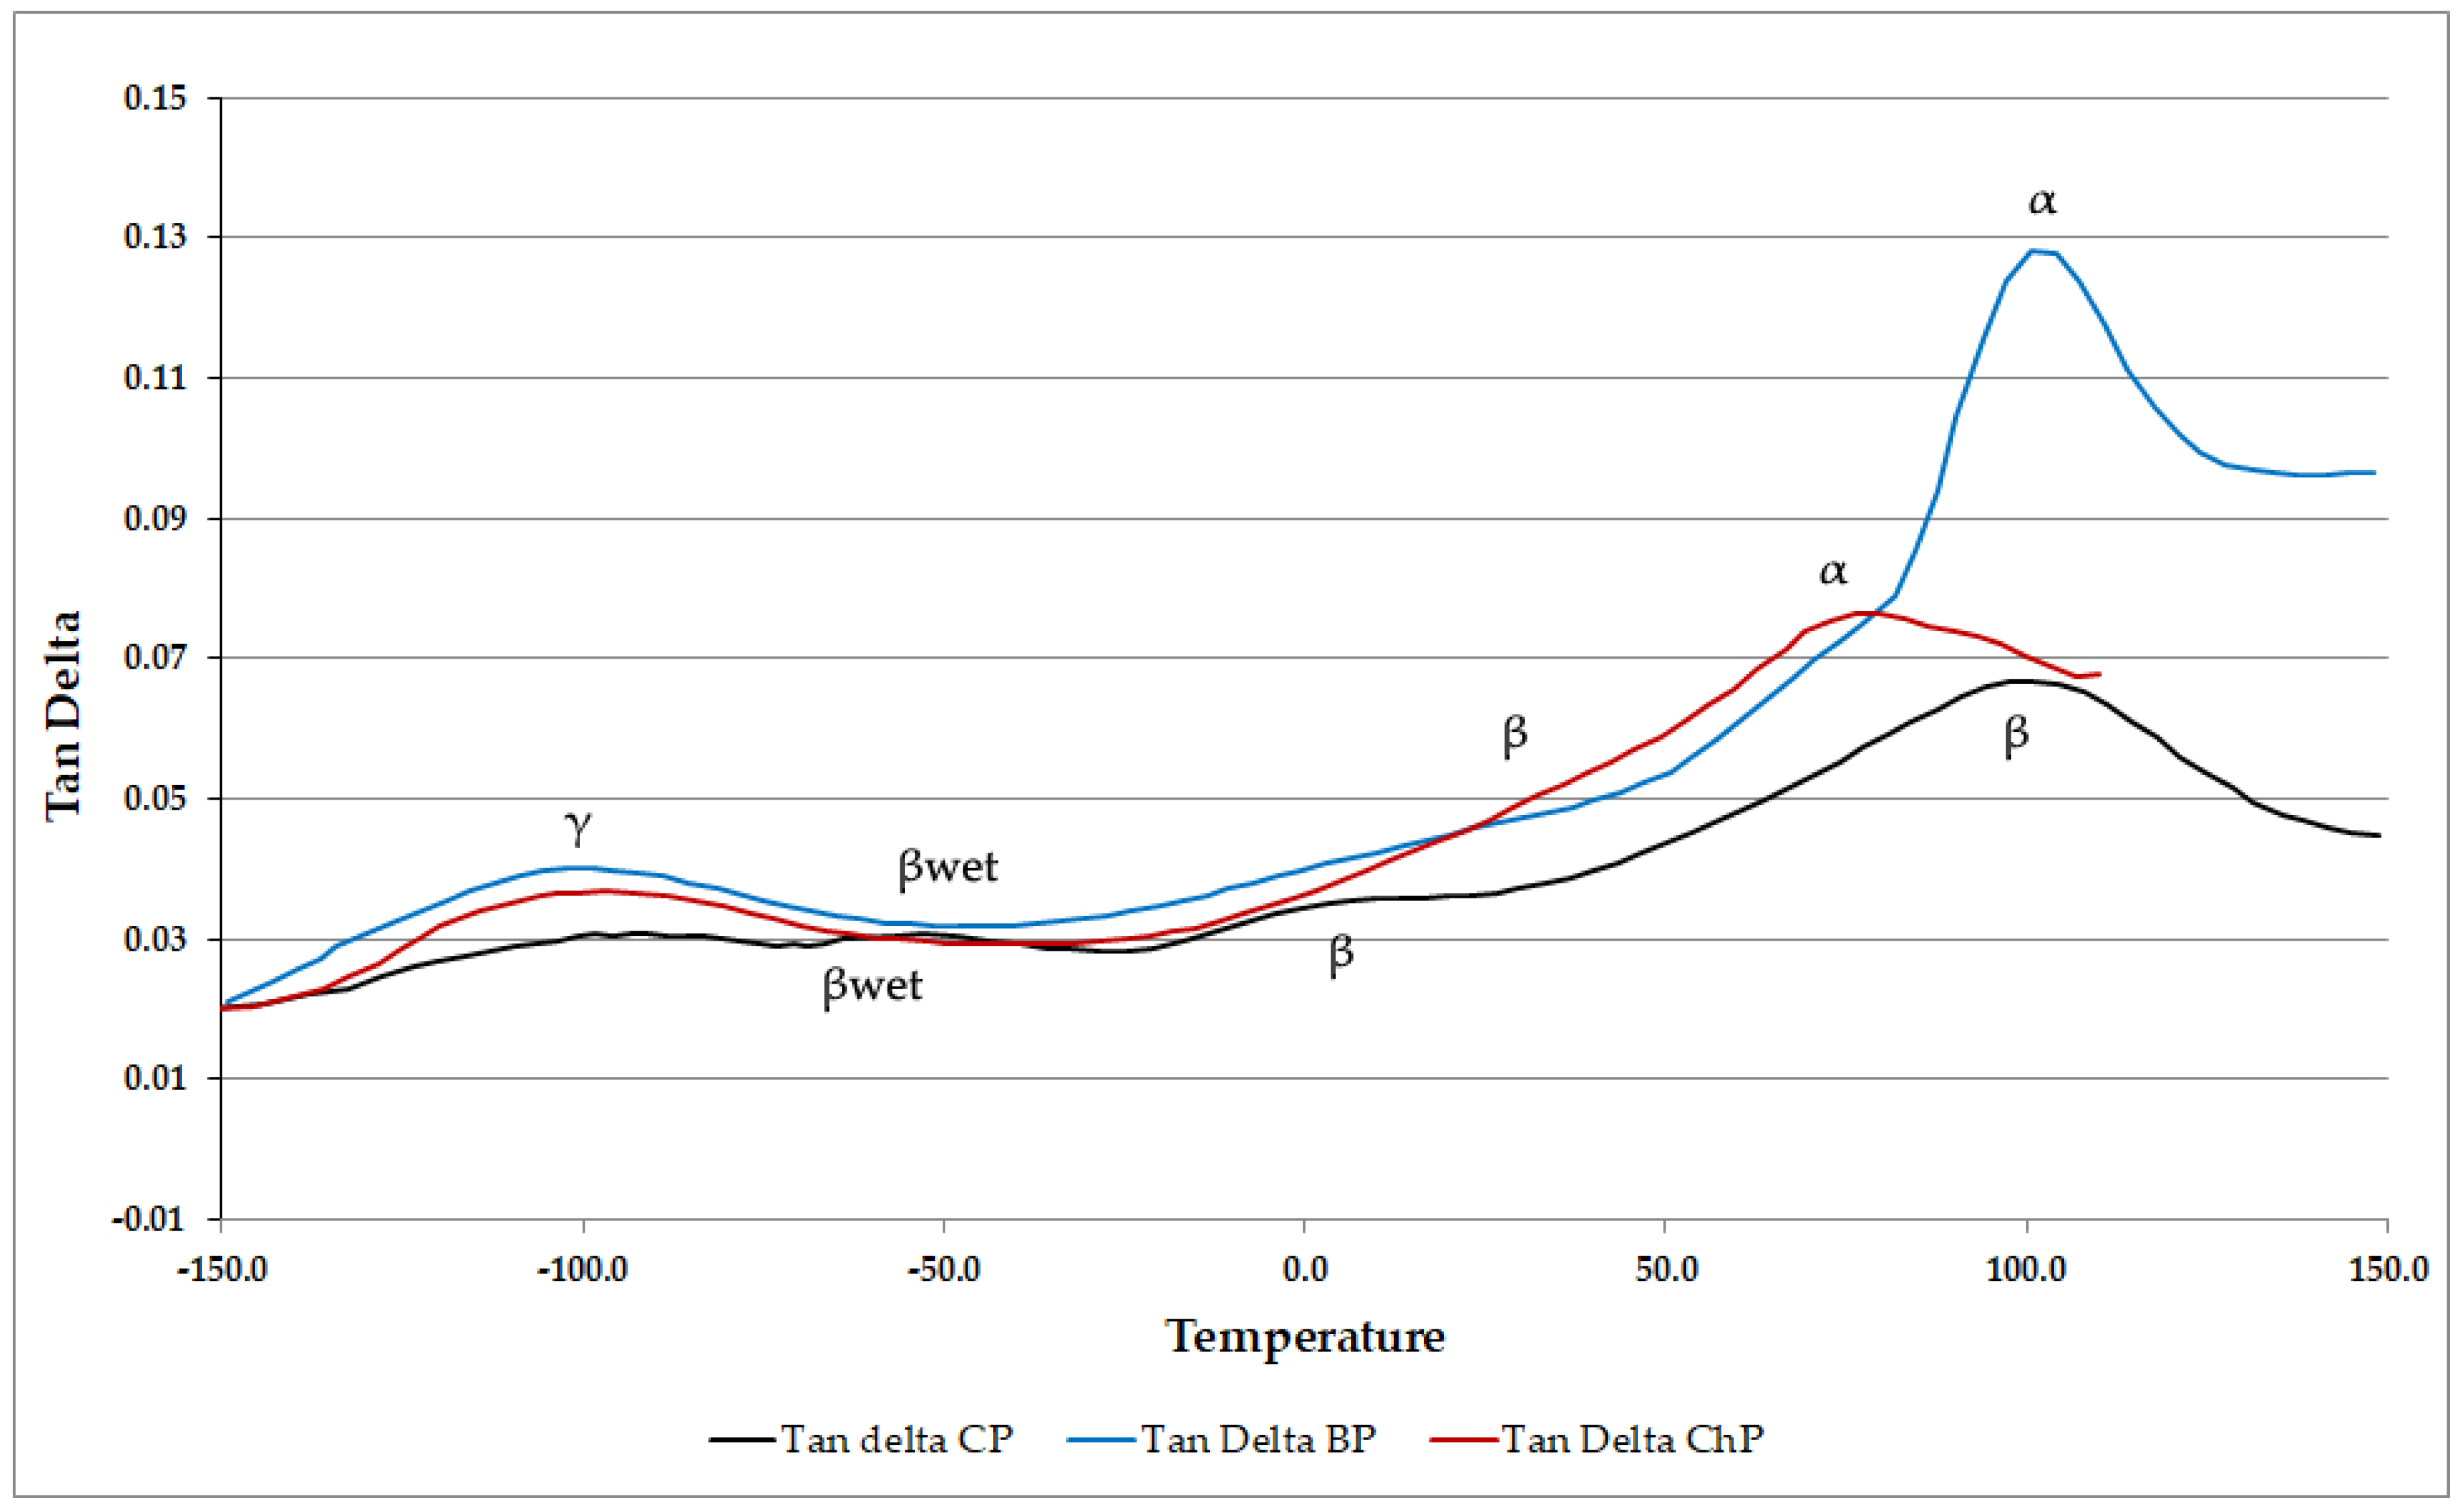
3.2. Viscoelastic Behaviour of Sound and Degraded Pine Wood

Degradation processes alter the chemical composition and affect wood moisture properties, both of which result in changes in its mechanical properties, primarily through a reduction in polymer chain length but also through changes in the proportion of amorphous and crystalline regions and other parameters that influence viscoelasticity. The storage modulus, loss modulus and the calculated loss factor values for sound and degraded wood at 25 °C obtained using a DMA technique are presented in Table 2.
The highest value of storage modulus was recorded for undegraded pine (about 95 MPa), while for biologically (BP) and chemically (ChP) degraded wood, the values were lower—52 MPa and 91 MPa, respectively.
Note that the relatively low E′ value for undegraded pine results from the fact that the bending moment was applied on a sample in the radial direction, not longitudinal as in typical mechanical tests. The reduced stiffness of BP reflects the calculated mass loss of about 39% due to the exposure to C. puteana and the resulting reduction in the cellulose content and crystallinity [4], which are known to affect wood stiffness strongly [41]. In the case of chemically degraded wood (ChP), it may seem surprising that despite its degradation and the resulting mass loss of about 17%, the E′ value is close to that of the undegraded CP. The reason is likely to relate to the increase in the density of degraded wood after air drying due to shrinkage [4] after the action of sodium hydroxide to degrade hemicellulose and permit rearrangement of amorphous polymers within the cell wall during re-drying after chemical action. It could also relate to the greater proportion of crystalline cellulose remaining after the degradation of the accessible hemicellulose and amorphous cellulose regions [4]. High shrinkage was previously also observed for naturally degraded waterlogged archaeological elm in our previous research [42]. However, in that case, the density was not increased, and the stiffness (E′) decreased. In the archaeological wood, the degradation mechanism was a combination of soft rot and bacterial decay, which did not lead to increased crystallinity.
The mass loss of about 39% for BP wood and shrinkage of 22% resulted in the wood density of BP being similar to undegraded CP wood (Table 2). In the case of ChP, however, the densification was much more pronounced due to the higher shrinkage level (25%), even though the mass loss due to degradation was lower [4]. The increased ChP density after drying altered wood stiffness, making it similar to undegraded wood. The higher ChP stiffness also results from the changes in its chemical composition that were different than for BP. As shown in the previous study [4], the alkali treatment reduced the amount of lignin, hemicelluloses and amorphous cellulose in the cell wall, increasing the relative content of crystalline cellulose responsible for wood stiffness, thus making the material stiffer in comparison with biologically degraded wood despite its mass loss.
For BP wood, not only was there a reduction in E′ but also a reduction in the loss modulus (E″ value) compared to undegraded CP (Table 2). This indicates a loss of the wood ‘rubberiness’ and reflects the degradation of hemicelluloses in the cell wall, which, together with water bound to their molecules, are known to contribute to wood viscoelastic behaviour [43,44]. Interestingly, for degraded ChP wood, the value of loss modulus is similar/slightly increased compared to undegraded CP (considering the value of standard deviation). In this case, it seems that the potential reduction in damping behaviour caused by loss of hemicelluloses is compensated by the increased hygroscopicity of chemically degraded wood (as described above in the Section 3.1).
The loss factor (tan δ) values for both degraded wood types were higher than for undegraded CP (Table 2). This indicates that the chemical and structural changes in degraded wood cell wall polymers resulted in a relatively larger reduction in E′ than E″. This made it a less elastic (more dissipative) material than undegraded pine.
Since DMA is a method that distinguishes the response of amorphous components of individual wood polymers, it is useful to analyse wood samples differing in chemical composition [42,45]. Example graphs of storage modulus, loss modulus and loss factor for sound and degraded contemporary pine are presented in Figure 3 and Figure 4. The E′, E″ and tan δ graphs for biologically degraded BP and chemically degraded ChP show significant differences compared to unmodified pine. The change in both the position and the intensity of individual tan δ peaks compared to undegraded CP reflects changes in their chemical composition caused by the degradation processes.
We are aware that the DMA information in the upper portion of the temperature range used in this experiment is subject to the influence of transient moisture effects when air dry samples are used, making complete interpretation of the graphs difficult. Therefore, as in our previous article [46], the results obtained from this upper range are presented only as examples to enable qualitative comments comparing the biologically and chemically degraded wood with undegraded pine samples (for example, where the effects of changes in the wood chemical composition had a noticeable effect on the viscoelastic behaviour). In addition, the brittleness of the degraded samples meant that several sample outputs were truncated at mid-range temperatures (as ChP graphs in Figure 3 and Figure 4), rejected if they exceeded the linear viscoelastic limit, or underwent cracking during testing.
In tan δ graphs, individual secondary relaxation peaks can be recognised for wood polymers (for example, Figure 4). Although different nomenclature can be found for those peaks in the literature, we continue naming them the same way we did in our previous papers [42,46]. For sound wood, the γ-relaxation peak usually occurs at about −100 °C and is associated with rotations of methylol groups in hemicelluloses and amorphous regions of cellulose [47,48]. In the higher temperature range, the tan δ peaks are often identified as the β-peak and the α-peak (or glass transition temperature). The β-peak is a secondary relaxation of short segments of the polymer chain. It is observed at different temperatures depending on the moisture content of the wood, where a shift to lower values can be seen with increasing quantities of moisture [49]. Typically it can be observed between −7 and +34 °C for wood with low or moderate moisture content [50]. However, it has also been registered over a wider temperature range (−53 to +53 °C [51]) and at much higher temperatures of 70 °C [52], 83 °C [45], or even up to 118 °C for oven-dried wood [53]. Additionally, a separate βwet-peak has also been reported by some researchers, relating specifically to moisture [54]. Further, it should be noted that both the polysaccharides (hemicellulose and amorphous cellulose) and lignin are capable of demonstrating β-relaxations for short segments of their respective polymer chains, but in unmodified wood, it is difficult to distinguish which polymer has contributed to the β-peaks observed. The α-peak or glass transition temperature relates to micro-Brownian motions within the polymer chain when it transforms from a glassy to viscous state. It usually occurs at higher temperatures (from 150 to 250 °C) for air- and oven-dried wood [51,53,55].
For both undegraded (CP) and degraded (BP and ChP) pine samples, the γ-peak can be seen at similar temperatures of about −90 °C to −80 °C (Figure 4, Table 2). It may seem surprising because in highly degraded wood with significantly reduced carbohydrates, the γ-peak is usually shifted towards higher temperatures [42,46,48]. However, many methylol groups remain present on undegraded segments of the polysaccharide chains; for example, alkali leads to a peeling reaction of sequential sugar monomers but does not cleave the OCH3 moieties from the sugars. Thus, it appears that the amounts of methylol groups on amorphous cellulose and hemicelluloses in degraded samples are still high enough to participate in the γ-relaxation motions and be visible at a similar position as for sound wood. This observation is in line with the results of wood mass loss and FT-IR analysis of sound and degraded pine described in our previous article [4].
A β-peak for sound CP occurred at about 12 °C, which is within the temperature range typical for glassy motions of short segments of wood carbohydrate or lignin chains [42,48]. For the degraded samples, however, weak β-peaks were divided (β1 and β2) and have been shifted to higher temperatures: 30 °C and 77 °C for BP and −7 °C and 48 °C for ChP. In addition, these were greatly suppressed, becoming poorly visible. It is possible that chain degradation has left very few segments that are suitable for crankshaft motions or similar rotations intact—these are the typical motions for β-relaxations in polymers [56], or that the physico-chemical environment surrounding any pendant oligosaccharide groups from the hemicellulose chains have also been altered. The upper of these values are on the edge of the temperature range which can be commented on due to transient moisture effects, so that no further comment can be made.
It is more difficult to draw conclusions about the α peaks in an experiment of this nature where transient moisture effects may have occurred. Provisionally, however, it should be noted that a strong peak, which could be of the glass transition type, was seen for ChP at approx. 83 °C. This was accompanied by a large decrease in storage modulus, further indicating it may be a glass transition event. The shift of this strong peak to lower temperature may result from significant degradation of the polymer chains, allowing glass transition to occur at lower temperatures than unmodified wood. In BP, a broad peak was seen near 100 °C, which coincides with a decrease in E′, again indicating that it may be a glass transition event. If so, then both the chemical degradation and the biological degradation processes have permitted detection of this effect at a lower temperature than is usually reported for air dry samples. In the case of the unmodified pine (CP), there is also a broad peak present near 100 °C, which may be a β-relaxation as there is no decrease in E′. Further work is required to comment in any greater depth on these thermal events. The differences between the chemical and biological degradation clearly lead to interesting differences in phenomena at the higher temperature range.
It is interesting that generally, the magnitude of tan δ is increased for both degraded wood types throughout the whole temperature range, with the graph for ChP exceeding that of BP between 26 °C and 78 °C. This indicates the loss of stiffness due to the degradation of the wood polymers, mainly cellulose (in particular, its crystalline fraction, as in BP).
It should be noted that the analysed samples differed significantly in the content of individual cell wall polymers. Therefore, the DMA output for biologically degraded pine (BP) was dominated by molecular relaxations of lignin with a minor contribution of polysaccharides. In contrast, for chemically degraded wood (ChP), it was dominated by relaxations within cellulose chains with only a small contribution of lignin and hemicelluloses.
Additionally, some small internal cracks were observed in several BP and ChP samples after the DMA analysis (those samples were rejected and the data excluded from the study), which confirmed their substantial degradation. This may explain higher standard deviations for all the values obtained from the measurements of degraded specimens compared to undegraded wood and demonstrates the difficulties in analysing decayed wood with the DMA method, despite using a small dynamic force of only 0.2 N. Apparently, even a relatively small sample size (about 20 × 10 × 3 mm) used in this technique seems to be too large to be free from internal micro-imperfections caused by degradation processes that prevent obtaining reproducible results. Therefore, although the results obtained from the DMA analysis seem reasonable, are in line with the wood properties known based on other analyses and explain the viscoelastic behaviour of degraded wood to some extent, we plan to study the mechanical properties of the wood cell wall on the nanoscale to understand better the effect of different degradation processes on the material.

4. Conclusions

This study used two laboratory-induced degradation techniques on contemporary sound pine to investigate its suitability as a substrate for developing new conservation treatments for archaeological wood. Fungal decomposition decreased the EMC of the wood, while alkali treatment with NaOH increased it, meaning that the biological degradation was more typical of archaeological degradation in this respect. However, hydroxyl accessibility of the biologically degraded material remained similar to the untreated pine, whereas the chemical treatment reduced it significantly. Both treatments were selected mainly for their action on the polysaccharide component of the wood, although alteration of the lignin component in chemically degraded pine was observed using FTIR in our previous work. Using DMA, both degraded samples showed a reduction in storage modulus and an increase in loss factor, indicating the wood had become more dissipative than undegraded pine. Changes in the storage modulus graphs at higher temperatures were of particular interest in interpreting differences in the tan δ peaks at 100 °C for the degraded woods; however, further experiments are required to overcome method limitations. Although the two different degradation methods produced woods differing in moisture and viscoelastic properties, both types seem useful as model materials in the research on the new conservation agents for waterlogged archaeological wood.

Author Contributions

Conceptualisation, M.B., M.J.S. and S.F.C.; methodology, M.J.S., S.F.C. and M.B.; investigation, M.B., M.J.S., S.F.C. and A.D.; visualisation, M.B.; writing—original draft preparation, M.B., M.J.S. and S.F.C.; writing—review and editing, M.B., M.J.S., S.F.C. and A.D. All authors have read and agreed to the published version of the manuscript.

Funding

The research was supported by the STSM Grant from COST Action FP1407 [COST STSM reference number: COST-STSM-FP1407-39990 granted to M.B.].

Institutional Review Board Statement

Not applicable.

Data Availability Statement

The data presented in this study are available on request from the corresponding author. Further research is in progress.

Conflicts of Interest

The authors declare no conflict of interest.

References

  1. Tahira, A.; Howard, W.; Pennington, E.R.; Kennedy, A. Mechanical strength studies on degraded waterlogged wood treated with sugars. Stud. Conserv. 2016, 62, 223–228. [Google Scholar] [CrossRef]
  2. Liu, L.; Zhang, L.; Zhang, B.; Hu, Y. A comparative study of reinforcement materials for waterlogged wood relics in laboratory. J. Cult. Heritage 2018, 36, 94–102. [Google Scholar] [CrossRef]
  3. Kennedy, A.; Pennington, E.R. Conservation of chemically degraded waterlogged wood with sugars. Stud. Conserv. 2014, 59, 194–201. [Google Scholar] [CrossRef]
  4. Broda, M.; Popescu, C.-M.; Curling, S.F.; Timpu, D.I.; Ormondroyd, G.A. Effects of Biological and Chemical Degradation on the Properties of Scots Pine Wood—Part I: Chemical Composition and Microstructure of the Cell Wall. Materials 2022, 15, 2348. [Google Scholar] [CrossRef] [PubMed]
  5. Brischke, C.; Alfredsen, G. Wood-water relationships and their role for wood susceptibility to fungal decay. Appl. Microbiol. Biotechnol. 2020, 104, 3781–3795. [Google Scholar] [CrossRef] [PubMed]
  6. Obataya, E.; Norimoto, M.; Gril, J. The effects of adsorbed water on dynamic mechanical properties of wood. Polymer 1998, 39, 3059–3064. [Google Scholar] [CrossRef]
  7. Trechsel, H.; Sherwood, G. Chapter 5—Moisture-Related Properties of Wood and the Effect of Moisture on Wood and Wood Products. Moisture Control. Build. 2008, 72–83. [Google Scholar] [CrossRef]
  8. Glass, S.; Zelinka, S. Moisture Relations and Physical Properties of Wood. Chapter 4 in Wood Handbook: Wood as an Engineering Material, General Technical Report FPL-GTR-282; Forest Products Laboratory: Madison, WI, USA, 2021; pp. 4–22. [Google Scholar]
  9. Fredriksson, M.; Thybring, E.E. On sorption hysteresis in wood: Separating hysteresis in cell wall water and capillary water in the full moisture range. PLoS ONE 2019, 14, e0225111. [Google Scholar] [CrossRef] [PubMed]
  10. Thybring, E.E.; Thygesen, L.G.; Burgert, I. Hydroxyl accessibility in wood cell walls as affected by drying and re-wetting procedures. Cellulose 2017, 24, 2375–2384. [Google Scholar] [CrossRef]
  11. Broda, M.; Curling, S.F.; Spear, M.J.; Hill, C.A.S. Effect of methyltrimethoxysilane impregnation on the cell wall porosity and water vapour sorption of archaeological waterlogged oak. Wood Sci. Technol. 2019, 53, 703–726. [Google Scholar] [CrossRef] [Green Version]
  12. Han, L.; Guo, J.; Wang, K.; Grönquist, P.; Li, R.; Tian, X.; Yin, Y. Hygroscopicity of Waterlogged Archaeological Wood from Xiaobaijiao No.1 Shipwreck Related to Its Deterioration State. Polymers 2020, 12, 834. [Google Scholar] [CrossRef] [PubMed]
  13. Guo, J.; Zhou, H.; Stevanic, J.S.; Dong, M.; Yu, M.; Salmén, L.; Yin, Y. Effects of ageing on the cell wall and its hygroscopicity of wood in ancient timber construction. Wood Sci. Technol. 2017, 52, 131–147. [Google Scholar] [CrossRef]
  14. Pizzo, B.; Pecoraro, E.; Lazzeri, S. Dynamic mechanical analysis (DMA) of waterlogged archaeological wood at room temperature. Holzforschung 2018, 72, 421–431. [Google Scholar] [CrossRef]
  15. Pizzo, B.; Pecoraro, E.; Sozzi, L.; Salvini, A. Collapsed and re-swollen archaeological wood: Efficiency and effects on the chemical and viscoelastic characteristics of wood. J. Cult. Heritage 2021, 51, 79–88. [Google Scholar] [CrossRef]
  16. Wu, M.; Han, X.; Qin, Z.; Zhang, Z.; Xi, G.; Han, L. A Quasi-Nondestructive Evaluation Method for Physical-Mechanical Properties of Fragile Archaeological Wood with TMA: A Case Study of an 800-Year-Old Shipwreck. Forests 2022, 13, 38. [Google Scholar] [CrossRef]
  17. Broda, M.; Curling, S.F.; Frankowski, M. The effect of the drying method on the cell wall structure and sorption properties of waterlogged archaeological wood. Wood Sci. Technol. 2021, 55, 971–989. [Google Scholar] [CrossRef]
  18. Glass, S.; Boardman, C.; Zelinka, S.L. Short hold times in dynamic vapor sorption measurements mischaracterize the equilibrium moisture content of wood. Wood Sci. Technol. 2016, 51, 243–260. [Google Scholar] [CrossRef]
  19. Kyyrö, S.; Altgen, M.; Seppäläinen, H.; Belt, T.; Rautkari, L. Effect of drying on the hydroxyl accessibility and sorption properties of pressurized hot water extracted wood. Wood Sci. Technol. 2021, 55, 1203–1220. [Google Scholar] [CrossRef]
  20. Popescu, C.-M.; Hill, C.A. The water vapour adsorption–desorption behaviour of naturally aged Tilia cordata Mill. wood. Polym. Degrad. Stab. 2013, 98, 1804–1813. [Google Scholar] [CrossRef]
  21. Hill, C.A.S.; Ramsay, J.; Keating, B.; Laine, K.; Rautkari, L.; Hughes, M.; Constant, B. The water vapour sorption properties of thermally modified and densified wood. J. Mater. Sci. 2011, 47, 3191–3197. [Google Scholar] [CrossRef]
  22. Brischke, C.; Stricker, S.; Meyer-Veltrup, L.; Emmerich, L. Changes in sorption and electrical properties of wood caused by fungal decay. Holzforschung 2018, 73, 445–455. [Google Scholar] [CrossRef]
  23. Zabel, R.A.; Morrell, J.J. Wood Microbiology: Decay and Its Prevention; Academic Press: Cambridge, MA, USA, 1992. [Google Scholar]
  24. Cowling, E.B. Comparative Biochemistry of the Decay of Sweetgum Sapwood by White-Rot and Brown-Rot Fungi; US Department of Agriculture: Washington, DC, USA, 1961.
  25. Thybring, E.E. Water relations in untreated and modified wood under brown-rot and white-rot decay. Int. Biodeterior. Biodegradation 2017, 118, 134–142. [Google Scholar] [CrossRef]
  26. Irbe, I.; Andersons, B.; Chirkova, J.; Kallavus, U.; Andersone, I.; Faix, O. On the changes of pinewood (Pinus sylvestris L.) Chemical composition and ultrastructure during the attack by brown-rot fungi Postia placenta and Coniophora puteana. Int. Biodeterior. Biodegrad. 2006, 57, 99–106. [Google Scholar] [CrossRef]
  27. Elder, T.; Houtman, C. Time-domain NMR study of the drying of hemicellulose extracted aspen (Populus tremuloides Michx.). Holzforschung 2013, 67, 405–411. [Google Scholar] [CrossRef]
  28. Yang, T.; Ma, E.; Cao, J. Effects of lignin in wood on moisture sorption and hygroexpansion tested under dynamic conditions. Holzforschung 2018, 72, 943–950. [Google Scholar] [CrossRef]
  29. Geng, X.; Henderson, W.A. Pretreatment of corn stover by combining ionic liquid dissolution with alkali extraction. Biotechnol. Bioeng. 2011, 109, 84–91. [Google Scholar] [CrossRef]
  30. Barman, D.N.; Haque, A.; Hossain, M.; Paul, S.K.; Yun, H.D. Deconstruction of Pine Wood (Pinus sylvestris) Recalcitrant Structure Using Alkali Treatment for Enhancing Enzymatic Saccharification Evaluated by Congo Red. Waste Biomass-Valorization 2018, 11, 1755–1764. [Google Scholar] [CrossRef]
  31. Ishikura, Y.; Nakano, T. Adsorption Properties and Structural Features of Alkali Treated Wood. J. Jpn. Wood Res. Soc. (Japan) 2005, 51, 364–371. [Google Scholar] [CrossRef]
  32. Hill, C.A.; Keating, B.A.; Jalaludin, Z.; Mahrdt, E. A rheological description of the water vapour sorption kinetics behaviour of wood invoking a model using a canonical assembly of Kelvin-Voigt elements and a possible link with sorption hysteresis. Holzforschung 2012, 66, 35–47. [Google Scholar] [CrossRef]
  33. Engelund, E.T.; Thygesen, L.G.; Svensson, S.; Hill, C.A.S. A critical discussion of the physics of wood–water interactions. Wood Sci. Technol. 2012, 47, 141–161. [Google Scholar] [CrossRef] [Green Version]
  34. Shi, J.; Avramidis, S. Water sorption hysteresis in wood: I review and experimental patterns—Geometric characteristics of scanning curves. Holzforschung 2017, 71, 307–316. [Google Scholar] [CrossRef]
  35. Lillqvist, K.; Källbom, S.; Altgen, M.; Belt, T.; Rautkari, L. Water vapour sorption properties of thermally modified and pressurised hot-water-extracted wood powder. Holzforschung 2019, 73, 1059–1068. [Google Scholar] [CrossRef]
  36. Endo, K.; Obataya, E.; Zeniya, N.; Matsuo, M. Effects of heating humidity on the physical properties of hydrothermally treated spruce wood. Wood Sci. Technol. 2016, 50, 1161–1179. [Google Scholar] [CrossRef]
  37. Salin, J.-G. Drying of Liquid Water in Wood as Influenced by the Capillary Fiber Network. Dry. Technol. 2008, 26, 560–567. [Google Scholar] [CrossRef]
  38. Chen, M.; Coasne, B.; Guyer, R.; Derome, D.; Carmeliet, J. Role of hydrogen bonding in hysteresis observed in sorption-induced swelling of soft nanoporous polymers. Nat. Commun. 2018, 9, 3507. [Google Scholar] [CrossRef]
  39. Esteban, L.; de Palacios, P.; Fernandez, F.G.; García-Amorena, I. Effects of burial of Quercus spp. wood aged 5910±250BP on sorption and thermodynamic properties. Int. Biodeterior. Biodegradation 2010, 64, 371–377. [Google Scholar] [CrossRef]
  40. Guo, J.; Xiao, L.; Han, L.; Wu, H.; Yang, T.; Wu, S.; Yin, Y. Deterioration of the cell wall in waterlogged wooden archeological artifacts, 2400 years old. IAWA J. 2019, 40, 820–844. [Google Scholar] [CrossRef]
  41. Jakob, M.; Mahendran, A.R.; Gindl-Altmutter, W.; Bliem, P.; Konnerth, J.; Müller, U.; Veigel, S. The strength and stiffness of oriented wood and cellulose-fibre materials: A review. Prog. Mater. Sci. 2021, 125, 100916. [Google Scholar] [CrossRef]
  42. Spear, M.; Broda, M. Comparison of Contemporary Elm (Ulmus spp.) and Degraded Archaeological Elm: The Use of Dynamic Mechanical Analysis Under Ambient Moisture Conditions. Materials 2020, 13, 5026. [Google Scholar] [CrossRef]
  43. Kulasinski, K.; Salmén, L.; Derome, D.; Carmeliet, J. Moisture adsorption of glucomannan and xylan hemicelluloses. Cellulose 2016, 23, 1629–1637. [Google Scholar] [CrossRef]
  44. Navi, P.; Stanzl-Tschegg, S. Micromechanics of creep and relaxation of wood. A review COST Action E35 2004–2008: Wood machining–micromechanics and fracture. Holzforschung 2009, 63, 186–195. [Google Scholar] [CrossRef]
  45. Ashaduzzaman; Hale, M.D.; Ormondroyd, G.A.; Spear, M.J. Dynamic mechanical analysis of Scots pine and three tropical hardwoods. Int. Wood Prod. J. 2020, 11, 189–203. [Google Scholar] [CrossRef]
  46. Broda, M.; Spear, M.J.; Curling, S.F.; Ormondroyd, G.A. The Viscoelastic Behaviour of Waterlogged Archaeological Wood Treated with Methyltrimethoxysilane. Materials 2021, 14, 5150. [Google Scholar] [CrossRef]
  47. Obataya, E. Mechanical and Dielectric Relaxations of Wood in a Low Temperature Range. I. Relaxations Due to Methylol Groups and Adsorbed Water. Mokuzai Gakkaishi 1996, 42, 243–249. [Google Scholar]
  48. Obataya, E.; Norimoto, M.; Tomita, B. Mechanical relaxation processes of wood in the low-temperature range. J. Appl. Polym. Sci. 2001, 81, 3338–3347. [Google Scholar] [CrossRef]
  49. Li, Z.; Jiang, J.; Lyu, J. Moisture-dependent orthotropic viscoelastic properties of Chinese fir wood during quenching in the temperature range of 20 to −120 °C. Holzforschung 2019, 74, 10–19. [Google Scholar] [CrossRef]
  50. Backman, A.C.; Lindberg, K.A.H. Differences in wood material responses for radial and tangential direction as measured by dynamic mechanical thermal analysis. J. Mater. Sci. 2001, 36, 3777–3783. [Google Scholar] [CrossRef]
  51. Havimo, M. A literature-based study on the loss tangent of wood in connection with mechanical pulping. Wood Sci. Technol. 2009, 43, 627–642. [Google Scholar] [CrossRef]
  52. Kelley, S.S.; Rials, T.G.; Glasser, W.G. Relaxation behaviour of the amorphous components of wood. J. Mater. Sci. 1987, 22, 617–624. [Google Scholar] [CrossRef]
  53. Jiang, J.; Lu, J.; Yan, H. Dynamic Viscoelastic Properties of Wood Treated by Three Drying Methods Measured at High-Temperature Range. Wood Fiber Sci. 2008, 40, 72–79. [Google Scholar]
  54. Einfeldt, J.; Meißner, D.; Kwasniewski, A. Polymerdynamics of cellulose and other polysaccharides in solid state-secondary dielectric relaxation processes. Prog. Polym. Sci. 2001, 26, 1419–1472. [Google Scholar] [CrossRef]
  55. Sugiyama, M.; Obataya, E.; Norimoto, M. Viscoelastic properties of the matrix substance of chemically treated wood. J. Mater. Sci. 1998, 33, 3505–3510. [Google Scholar] [CrossRef]
  56. Heijboer, J. Secondary Loss Peaks in Glassy Amorphous Polymers. Int. J. Polym. Mater. Polym. Biomater. 1977, 6, 11–37. [Google Scholar] [CrossRef]
Figure 1. Water sorption isotherms for undegraded and degraded pine wood; sorp—adsorption, desorp—desorption, CP—sound wood, BP—biologically-degraded wood, ChP—chemically-degraded wood.
Forests 13 01390 g001
Figure 2. Water sorption hysteresis (for undegraded and degraded pine wood); ads—adsorption, des—desorption, CP—sound wood, BP—biologically degraded wood, ChP—chemically degraded.
Forests 13 01390 g002
Figure 3. Comparison of storage modulus (E′) and loss modulus (E″) exemplary graphs for contemporary pine: undegraded (CP), biologically degraded (BP) and chemically degraded (ChP).
Forests 13 01390 g003
Figure 4. Comparison of loss factor (tan delta) exemplary graphs for contemporary pine: undegraded (CP), biologically degraded (BP) and chemically degraded (ChP) with specific tan delta peaks marked.
Forests 13 01390 g004
Table 1. Mean values of free hydroxyls, values of maximum hysteresis (maximum difference of EMC between desorption and adsorption) in the first run (H1max), maximum hysteresis in the second run (H2max), the difference in max hysteresis between the two runs (ΔHmax), maximum EMC in the first (EMC1) and the second (EMC2) run, respectively, and the difference in maximum EMC between the first and the second run (ΔEMC) for sound (CP), biologically (B) and chemically degraded (ChP) contemporary pine.
Wood
ID
Hydroxyls
[mmol g−1]
H1max
[%]
H2max
[%]
ΔHmax
[%]
EMC1
[%]
EMC2
[%]
ΔEMC
[%]
CP7.90 ± 0.143.022.570.4520.319.90.4
BP8.04 ± 0.993.582.481.117.717.10.6
ChP11.32 ± 0.343.342.850.4924.624.20.4
Table 2. Mean values of MC for pine samples at the start of the DMA measurement, bulk density of wood samples (ρ), temperature of tan δ responses, and E′, E″ and tan δ measured at 25 °C and a frequency of 1 Hz; contemporary pine samples: sound (CP), biologically degraded (BP) and chemically degraded (ChP); ±standard deviation; the value given in brackets refer to tiny, hardly distinguishable peaks.
Wood IDMC
[%]
ρ
[g cm−3]
Tan δ Response [°C]E′ at 25 °C
[MPa]
E″ at 25 °C
[MPa]
Tan δ
at 25 °C
γβwetβ3β2β1α
CP6.3 ± 0.10.44 ± 0.02−90 ± 5−65 ± 3 12 ± 192.8105.4-95.4 ± 14.13.5 ± 0.40.0367 ± 0.0012
BP6.2 ± 0.20.44 ± 0.03−86.6(−34)-30 ± 676.7101.452.3 ± 10.82.2 ± 0.30.0429 ± 0.0038
ChP6.9 ± 0.10.65 ± 0.02−79.9-(−7)48.6 83.190.8 ± 17.04.2 ± 1.00.0475 ± 0.0116
Publisher’s Note: MDPI stays neutral with regard to jurisdictional claims in published maps and institutional affiliations.

