Article

Compressive Strength Characteristic Values of Nine Structural Sized Malaysian Tropical Hardwoods

1
School of Civil Engineering, College of Engineering, Universiti Teknologi MARA Malaysia, Shah Alam 40450, Selangor, Malaysia
2
Institute for Infrastructure Engineering and Sustainable Management, Universiti Teknologi MARA Malaysia, Shah Alam 40450, Selangor, Malaysia
3
Civil Engineering Department, School of Engineering and Computing, Manipal International University (MIU), Nilai 71800, Negeri Sembilan, Malaysia
4
Institute of Tropical Forestry and Forest Products, Universiti Putra Malaysia, Serdang 43400, Selangor, Malaysia
*
Author to whom correspondence should be addressed.
Forests 2022, 13(8), 1172; https://doi.org/10.3390/f13081172
Submission received: 19 June 2022 / Revised: 3 July 2022 / Accepted: 21 July 2022 / Published: 24 July 2022
(This article belongs to the Special Issue Frontiers in Modification of Wood and Wood-Based Composites)

Abstract

:
The design practice of timber structures in Malaysia is still based on permissible stress codes as stated in Malaysian Standard (MS) 544: Part 2 and MS 544: Part 3, which was adopted from the British Standard (BS) 5268. The British Standard was later completely replaced by Eurocode 5 (EC5) in 2009. Therefore, to preserve the continuity of design concepts specified in the British code of practice, local designers should adopt an EC5 limit state design to generate safe and economical designs. However, new strength data based on characteristic values which comply with EC5 for Malaysian tropical hardwoods are still lacking. The aim of this study was to investigate the compressive strength properties of nine structural-sized Malaysian tropical hardwood species namely Balau, Kempas, Kelat, Resak, Kapur, Keruing, Mengkulang, Light Red Meranti and Geronggang tested according to European Standard (EN) 408. A compression test was performed to measure the compressive strength and modulus of elasticity of the timbers and were used to derive characteristic values. The equation for determining characteristic compressive strength given in EN 384 was also assessed to verify that whether it is suitable for high density Malaysian hardwoods, as this equation was derived from softwood and European hardwoods. The results revealed that the derived characteristic values are higher than the values given in EN 338 for the relevant strength classes, particularly for heavy and medium hardwood with densities greater than 700 kg/m3. A verification of the equation used in EN 384 to determine compressive strength characteristic value yields a different equation, f c , 0 , k = 2.2   f m , k 0.7 . This shows that the EN 384 equation is not suitable to be used with hardwood timber with a density more than 700 kg/m3, since it will underestimate the strength value.

1. Introduction

Compressive strength properties are critical when designing vertical load-bearing elements for structural members such as columns, posts, and props that will be subjected to loads that reduce their length [1,2,3]. It is critical to consider where compression resistance perpendicular to the grain is required when designing a few specific end uses such as railway sleepers, wedges, bolted timber, and bearing blocks, but it should also be considered in building construction, particularly at various types of supports between the beam and column [4]. The bending, compression, and tension properties of timber are specified in a variety of international standards. In Malaysia, many standards are available for designing structural timber elements, including Malaysian Standard (MS) 544: Part 2 [5] and MS 544: Part 3 [6], which cover both solid and glue laminated timber designs based on permissible stress design. While the structural strength data from the British Standard (BS) 5268: Part 2 [7] were adopted in MS 544: Part 3 [6] for five Southeast Asian tropical timbers and two additional Malaysian species, but the data in MS 544: Part 2 [5] were still based on small clear specimens, where the mechanical properties from clear wood cannot provide accurate values to be used in structural timber design. Small clear specimens are practical to be used in testing but are often devoid of defects. Structural size specimens on the other hand may contain natural growth defects that will considerably weaken the strength of lumber, such as knots, slope of grain, oblique fibre and many others [8].
As the world rapidly moves toward globalisation with the advancement of knowledge, the old design approach of permissible stress design is giving way to limit state design as this method is more reliable in terms of safety and economic values, allowing engineers to fully utilise the strength of the material. The values of grade stresses utilised in permissible stress design had already been reduced by the incorporation of coefficients for long-term load duration and relevant safety factor. On the other hand, the characteristic value was developed from statistical analysis of laboratory experimental results and therefore is often higher than grade stresses values. With the introduction of Eurocode 5 (EC5) [9], which is widely used in European countries and the United Kingdom and is based on limit state design with strength data derived from structural size specimens, the timber construction industry gains the ability to produce safe and cost-effective structural timber designs similar to other load-bearing building materials such as concrete, steel, and composite. Studies on the physical and mechanical properties of Malaysian timber specimens have progressed from small clear specimens to structural-sized specimens, as stated in MS 544: Part 3 [6], where the majority of the design process and modification factor was based on BS 5268: Part 2 [5]. However, EC5 [9] completely replaced BS 5268: Part 2 [7] in 2009.
The fundamental difference between BS 5268: Part 2 [7] and EC5 [9] lies on their design approaches. The former uses permissible stress design while the latter uses limit state design. Although the old British Standards may still be used for private projects, and will continue to meet building regulation requirements, they will not be maintained or updated. The design of new public timber structure projects is required to follow the rules and requirements stated in EC5 [9]. Should an alternative design standard be proposed, it will have to be proven that it is of ‘technical equivalence’ to a Eurocode solution. Therefore, there is no reason why Malaysian engineers should continue to use the antiquated permissible stress structural timber design now that the international engineering community has begun to embrace limit state design. As a result, local engineers must embrace EC5 [9] in order to preserve the continuity of design concepts defined in the British code of practise [10]. The mechanical strength data used in EC5 [9], such as bending, tensile, and compression properties, were provided in a separate standard, the European Standard (EN) 338 [11], with the characteristic values derived from structural-sized specimens rather than traditional grade stresses based on European softwood and a few hardwood species, with no Malaysian hardwood timber.
According to the literatures, no study has been undertaken in the derivation of characteristic values of compressive strength properties and a strength class system for Malaysian tropical hardwoods. Several previous researchers that evaluated the mechanical properties of structural size specimens from Malaysian hardwood timbers have been identified [2,3,12,13,14]; however, these investigations fall short of the requirements stipulated in EN 384 [15]. To provide fresh strength data in terms of characteristic values, timber specimens must be sampled from distinct growth areas with varying sizes, with a minimum of 40 specimens from each growth area [15]. Hassan et al. [2] and Puaad and Ahmad [3] investigated the compressive strength qualities of structural-sized wood from Malaysian tropical hardwood timbers such as Keruing, Kapur, Sesendok, and other species, but only worked with restricted samples gathered from a single source and no diverse sizes. As a result, nine Malaysian tropical hardwood timber species were chosen for this study: Balau (Shorea Roxb.), Kempas (Koompassia malaccensis Maingay), Kelat (Syzygium Gaertn.), Resak (Vatica L.), Kapur (Dryobalanops C.F.Gaertn.), Keruing (Dipterocarpus C.F.Gaertn.), Mengkulang (Heritiera J.F.Gmel.), Light Red Meranti (Shorea Roxb.) and Geronggang (Cratoxylum Blume). A compression test was performed to measure the compressive strength and modulus of elasticity (MOE), as well as to derive the characteristic values. The verification of the equation for determining the characteristic compressive strength in EN 384 [15] was also carried out to see if it is suitable for high density Malaysian hardwoods, as this equation was derived from softwood and European hardwoods.

2. Materials and Methods

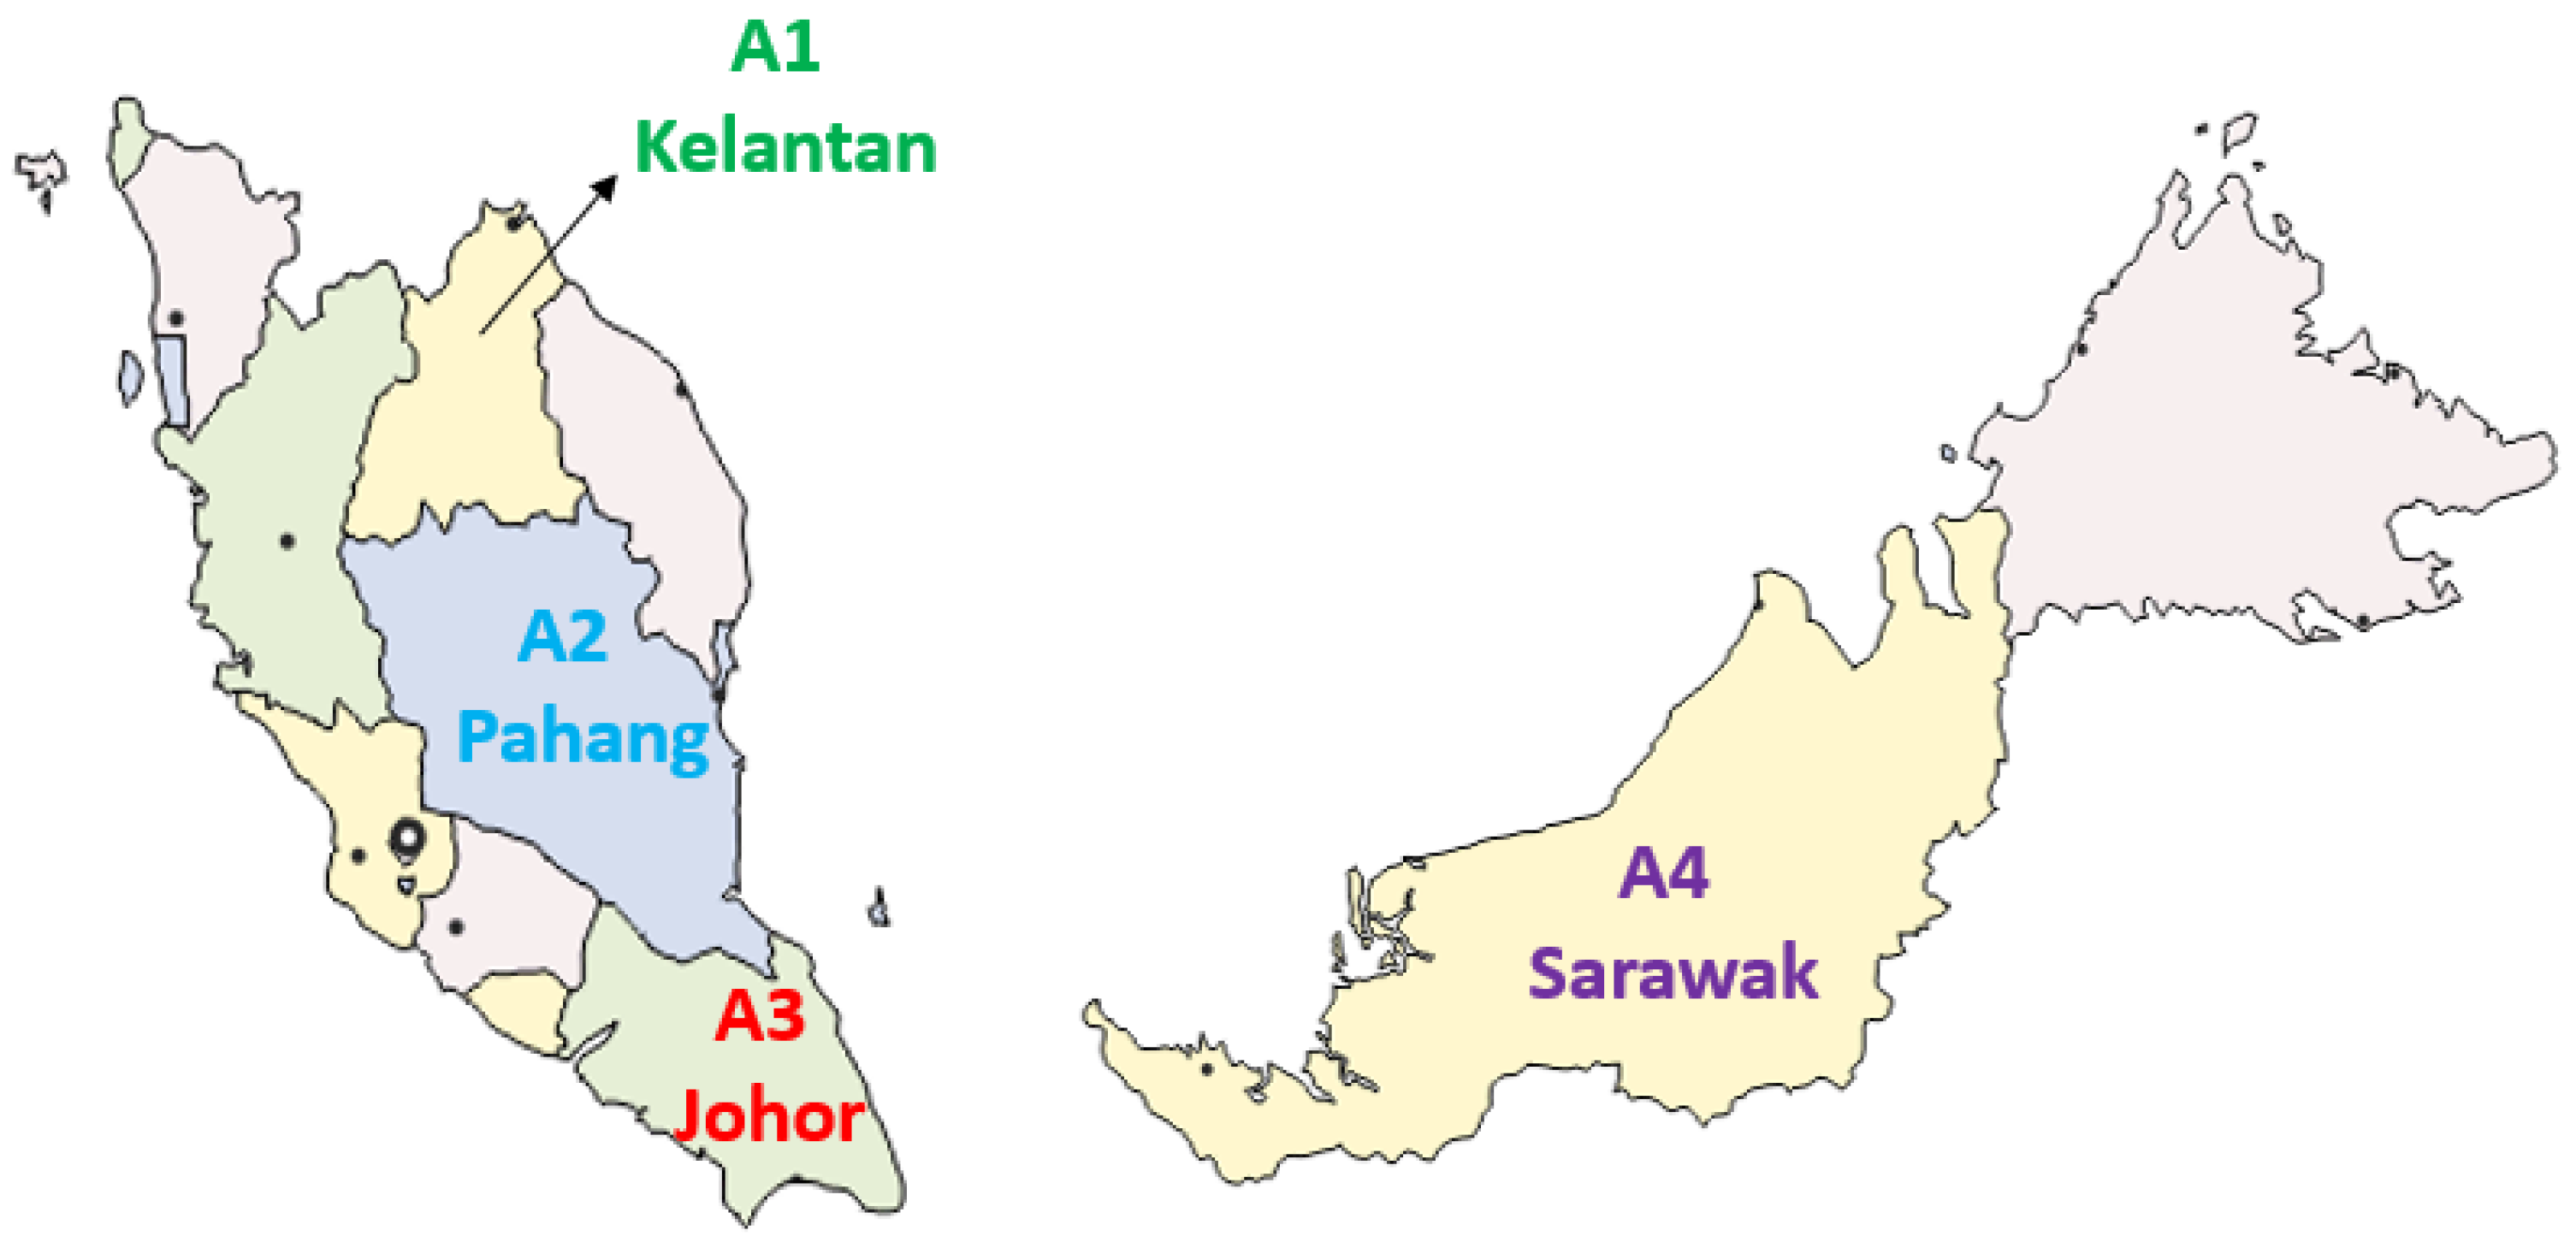
2.1. Materials Preparation

Nine (9) timber species of Malaysian tropical hardwood composed of light, medium and heavy hardwood were selected in this study. The selected timber species including Balau, Kempas, Kelat), Resak, Kapur, Keruing, Mengkulang, Light Red Meranti and Geronggang were selected to represent each strength group (SG) from SG1 to SG7 in accordance with MS 544: Part 2 [5]. The SG is classified based on the similar strength and stiffness properties of the timber species, where SG1 has the highest strength and stiffness and SG7 has the lowest. The sampling method was adhered to the principle scheme outlined in EN 384 [15], which states that timber specimens must be obtained from different growth areas and that the minimum number of specimens from one growth area must not be less than 40 in order to ensure a representative sampling. This study included four (4) distinct sampling areas, including Kelantan (A1), Pahang (A2), Johor (A3), and Sarawak (A4), which reflect different regions of Malaysia, namely West Malaysia and East Malaysia (Figure 1). The number of specimens taken from each growth areas A1, A2, A3 and A4 were 50, 45, 50 and 55 respectively for compression parallel to the grain whereas 50 number of specimens for each area were used for compression perpendicular to the grain, which consisted of 200 specimens for each grain direction. Three (3) separate areas from West Malaysia were chosen from four (4) sampling areas to represent the north, middle, and south regions. All lumber samples must be accompanied by a chain of custody certificate (PEFC).
The timber logs were sourced from four separate places and then cut into rough sawn timber before being kiln dried. The dried timbers were planned and cut into specified dimensions and grain directions in accordance with EN 408 [16]. The test pieces for compression parallel to the grain had a full cross-section with a length six times the smaller cross-sectional dimension, whereas specimens for compression perpendicular to the grain had the dimensions defined in EN 408 [16]. A total of 3600 specimens of various areas and sizes were prepared for compression parallel and perpendicular to the grain. Table 1 shows the densities, strength groups, dimensions, and number of specimens used. All the specimens were subjected to a visual grading process performed by professional graders from the Malaysia Timber Industry Board (MTIB) in line with BS 5756 [17] and MS 1714 [18]. The structural timber specimens were assessed using the Hardwood Structural (HS) grading. BS 5756 [17] has been revised to comply with the requirements given in Annex A of EN 14081: Part 1 [19]. It is therefore suitable to be used as the grading standard for the visual grading of tropical hardwoods for which the characteristic values are to be classified as in EN 338 [11]. For defects of tropical hardwood, which are not given in BS 5756 [17], such as included phloem, MS 1714 [18], which was adopted from BS 5756 [17], was referred to instead.

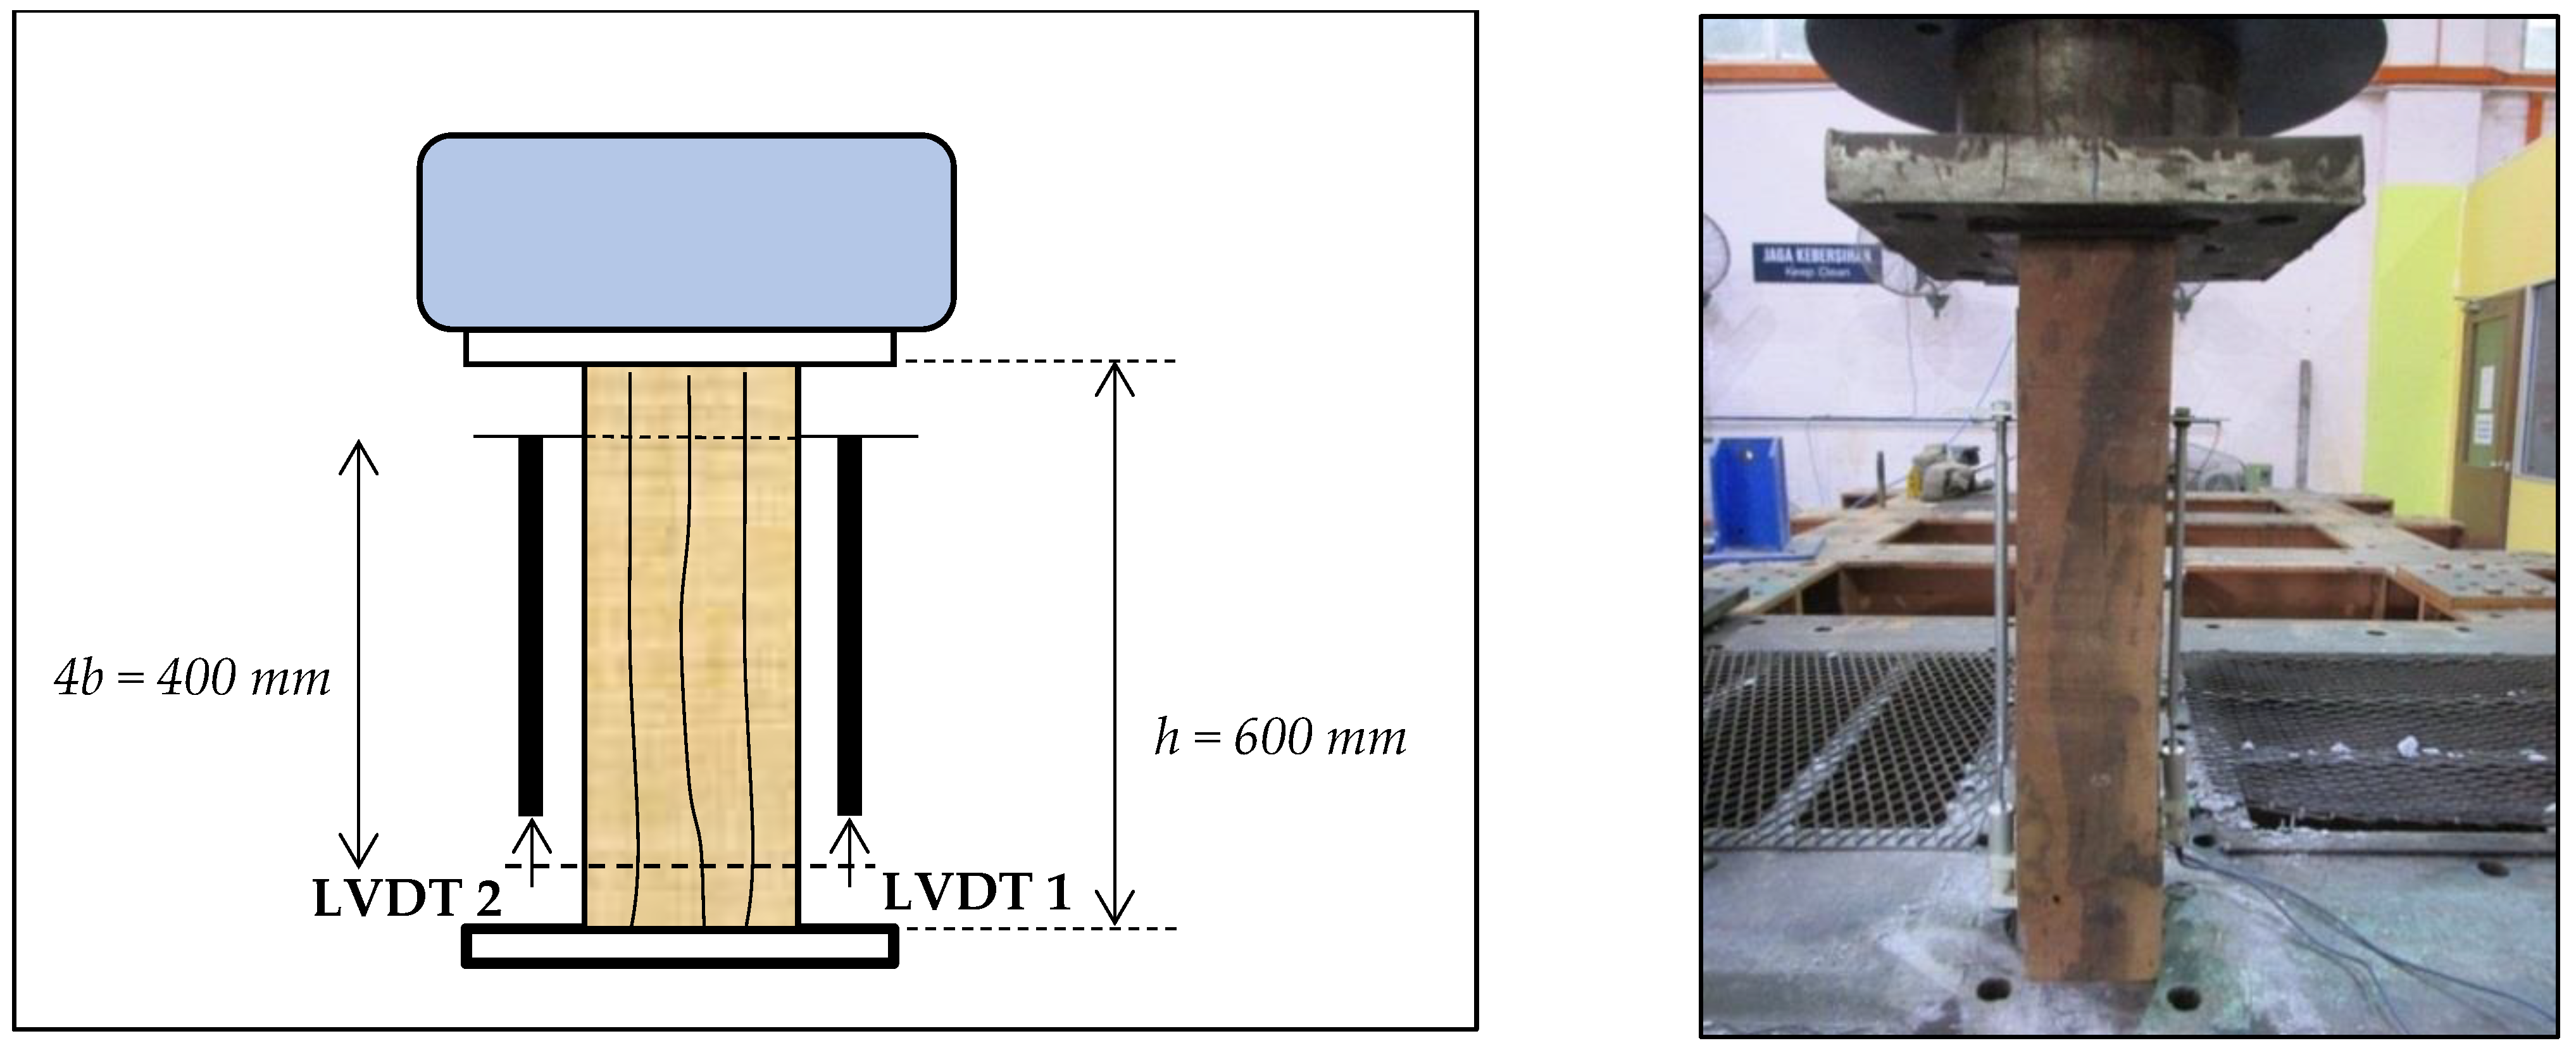
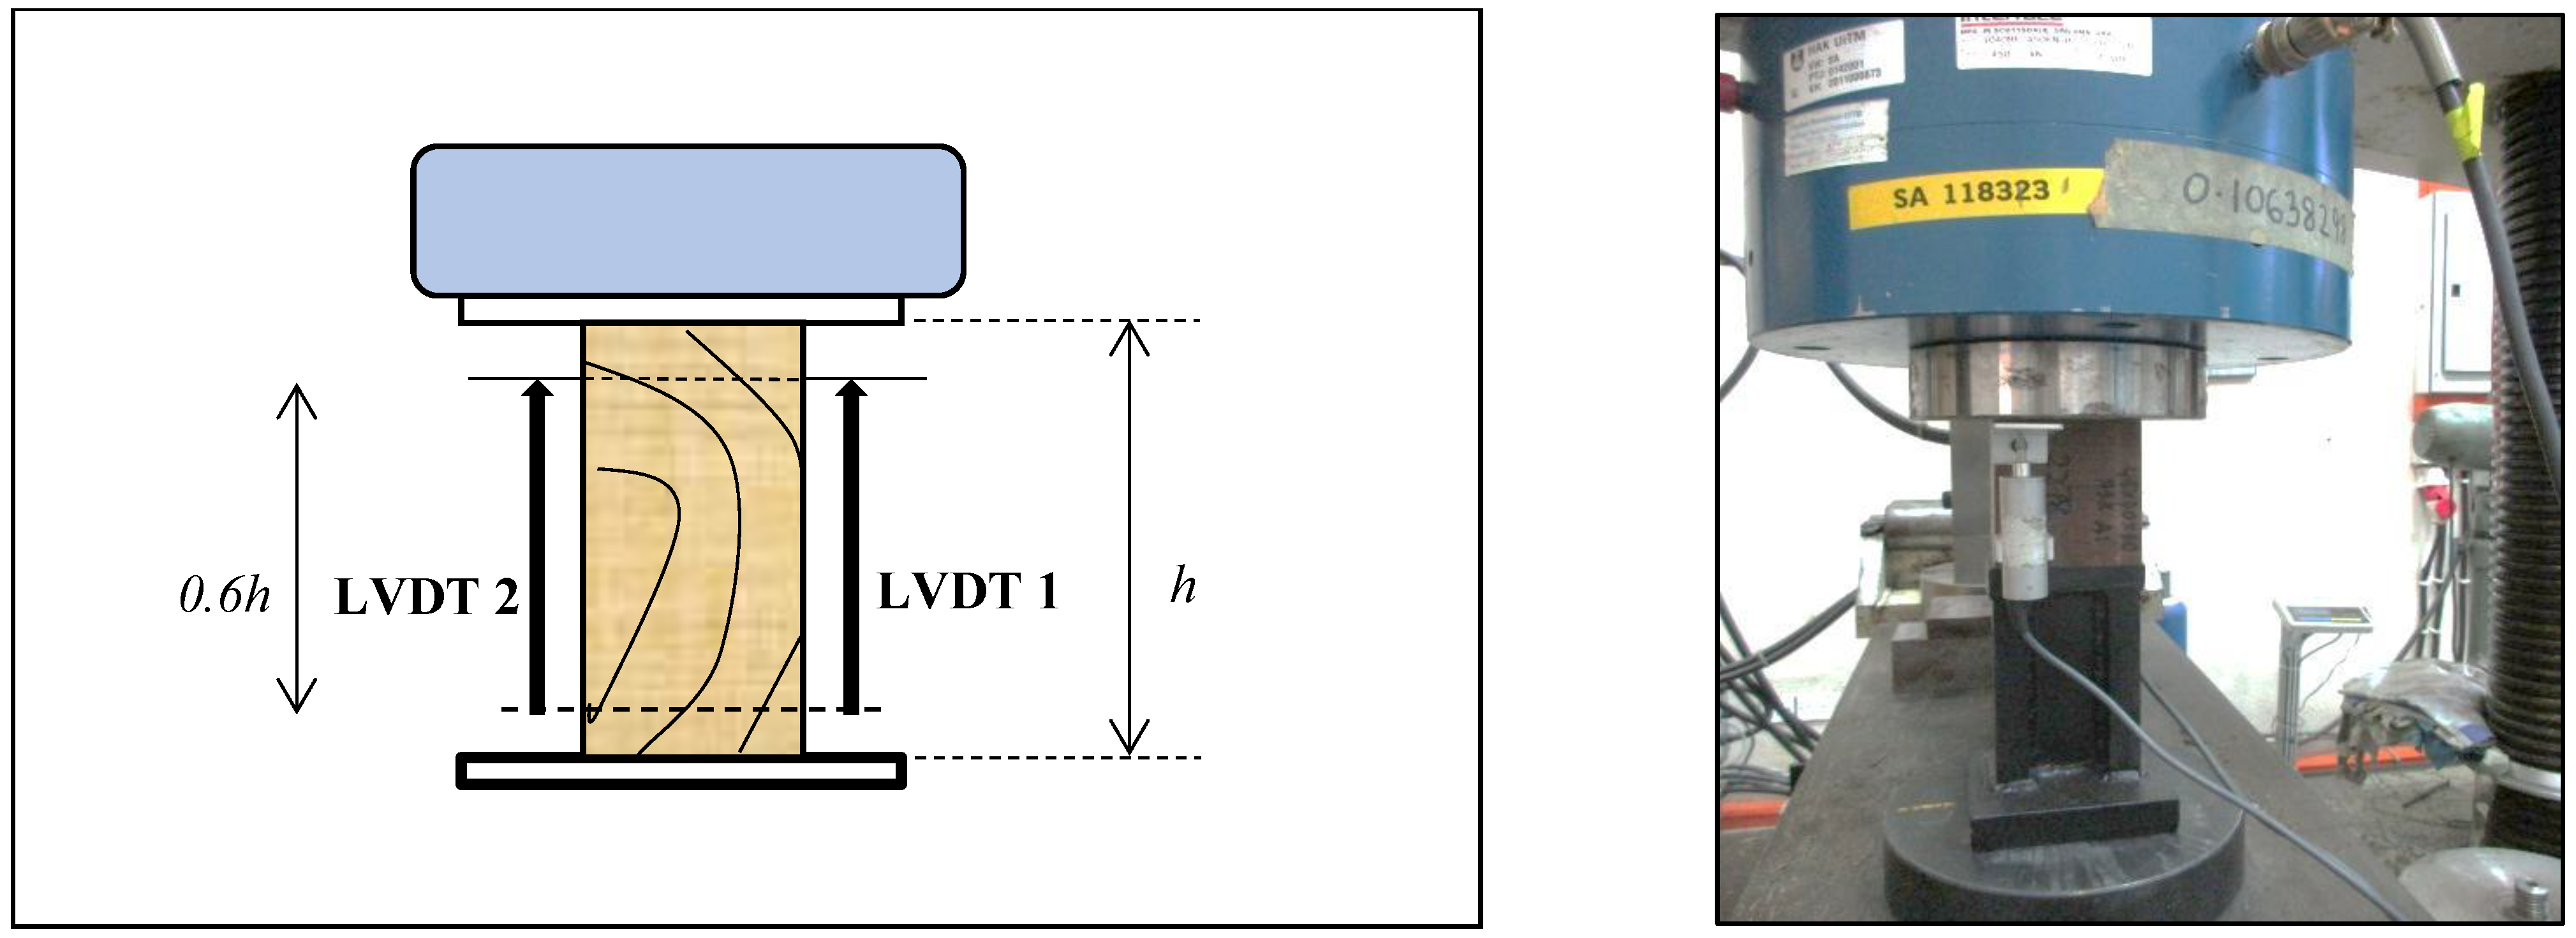
2.2. Compressive Strength Properties Evaluation for Parallel and Perpendicular to the Grain

The test procedures for determining the compressive strength properties of structural size specimens parallel and perpendicular to the grain were carried out in line with EN 408 [16]. A preliminary test was carried out to identify the loading rate for each configuration (i.e., density of the species, loading grain direction and dimension of the samples) so that the maximum load, Fmax, was reached within 300 ± 120 s. Each configuration’s time to failure was documented and reported. To measure the deformation, two (2) Linear Variable Displacement Transducers (LVDT) were placed at a central gauge length four times the smaller cross-sectional dimension for specimen parallel to the grain, and at the 0.6 h gauge length located centrally in the specimen’s height for specimen perpendicular to the grain. Universal Testing Machine (UTM) (AUTOMAX-T, CONTROLS, Milan, Italy) with a capacity of 2500 and 450 kN was utilised to evaluate structural size specimens parallel and perpendicular to the grain, respectively. Figure 2 and Figure 3 illustrate the test setup’s specifications to evaluate the compressive strength properties for samples both parallel and perpendicular to the grain.
The compressive strength and MOE for parallel to the grain tests were calculated using the following equations:
Compressive   strength ,   f c , 0   ( MPa ) = F m a x A
where Fmax = maximum load (N), A = cross sectional area (mm2).
MOE ,   E c , 0   ( MPa ) = 1 f 2 f 1 A w 2 w 1
where 1 = Gauge length for the determination of MOE, f2 − f1 = Increment of load on the straight-line portion of the load-deformation curve (N), w2 − w1 = Increment of deformation corresponding to f2 − f1 (mm).
The compressive strength and MOE for perpendicular to the grain tests were calculated using the following equations:
Compressive   strength ,   f c , 90   ( MPa ) = F c , 90 , m a x b
where Fc,90,max = maximum compressive strength determined using the iterative process, b = Width of the cross section or smaller dimension of specimen (mm), = Length of cross section or larger dimension of specimen (mm).
MOE ,   E c , 90   ( MPa ) = f 40 f 10   h 0 w 2 w 1 b
where f40 − f10 = Increment of load on the straight-line portion of the load deformation curve (N). f10 is the 10% and f40 is the 40% of fc,90,max,est, w40 –w10 = The increment of deformation corresponding to f40 − f10 (mm), h0 = gauge length (mm), b = Width of the cross section or smaller dimension of specimen (mm), = Length of cross section or larger dimension of specimen (mm).

2.3. Evaluation of Compressive Strength Characteristic Value

Each species’ compressive strength, MOE, and density were further derived into characteristic values using the processes outlined in EN 14358 [21] and EN 384 [15]. The characteristic value is defined as the 5th percentile value of strength, mean MOE, and density. Prior to the evaluation of characteristic values, the compressive strength, MOE, and density values for each test piece that were not tested at the reference moisture content (12%) were adjusted to achieve the specific moisture content of 12% using the appropriate adjustment factor specified in EN384 [15]. The moisture content was determined in accordance with EN 13183-1 [22] using the oven-dry method. Before determining the characteristic values, the 5th percentile value for each sub-sample (A1, A2, A3, and A4) represented by the four (4) sampling areas was calculated. The EN 14358 [21] parametric calculation was used to determine the 5th percentile value for strength, MOE, and density, with the data assumed to be normally distributed. The characteristic values for each species were calculated using the sub-minimum sample’s 5th percentile value.

2.4. Statistical Analysis

All data from this investigation were analysed using IBM SPSS Statistic version 23 for analysis of variance (ANOVA) at a 95% confidence level (p ≤ 0.05) to identify the interaction between species, size, grain orientation, and compression strength features. The Duncan Multiple Range Test (DMRT) was used to establish the significance level of average values for each variable tested.

3. Results and Discussion

3.1. Compressive Strength Properties

Table 2 shows the timber species, sample grain orientation, sample size, compressive strength at 12% moisture content, and compressive modulus of MOE of all specimens. A post-hoc Duncan Multiple Range test was used to investigate the effect of species, size, and grain direction on compressive strength and MOE, which are represented by the letters in Table 2.
The moisture content of all compression specimens tested ranged from 10 to 40%. Although this range might seem a bit too large, it does not affect the credibility of the compressive results. According to EN 384 [15], the modification factor of moisture content (0.03) was to apply to each specimen with moisture content ranged from 8 to 18%. Dinwoodie [23] and Porteons and Kermani [24] also attested that the compressive strength beyond the fibre saturation point is already in a plateau state and no significant difference in the strength with moisture content will appear around 20%. Since after 18%, there is no increment in the compressive strength, it can be assumed that the moisture content of more than 18% exerts a negligible effect to the compressive strength and can be treated as 18%, which follows the same rule as stated in EN 384 [15]. According to Ravenshorst [25], generally structural-sized specimens of tropical hardwood are supplied and used with a high moisture content since they do not dry as quickly as softwood, especially when the dimension is greater than 100 mm, resulting in tests with high moisture content. Heavy and medium hardwood timber species from the higher strength group (SG1 to SG4), such as Balau, Kempas, Kelat, and Resak, demonstrated higher compressive strength than timber species from the lower strength group (SG5 to SG7). Significant differences (p ≤ 0.05) were identified in both the compressive strength and MOE, according to the Duncan multiple range test results presented in Table 2. In general, compressive strength and MOE parallel to the grain are stronger than compressive strength perpendicular to the grain. This finding is consistent with the findings of Hamid et al. [26], who investigated the compressive strength parameters of two Malaysian hardwood timber species, Kapur (Dryobalanops aromatica C.F.Gaertn) and Kelat loaded in different grain directions. The scientists discovered that longitudinal compression had the highest compressive strength and MOE for both species, followed by radial and then tangential compression. Similar findings were published by Hallai [27], who discovered that the three MOEs of timber are modulus along the longitudinal (EL), radial (ER), and tangential (ET) axes in the order EL > ER > ET.
Kempas (SG2) loaded under longitudinal compression has the maximum compressive strength and MOE, which are 63.35 and 22,580 MPa, respectively, as shown in Table 2. Light Red Meranti (SG6) exhibits the lowest compressive strength and MOE when loaded under transverse compression, with values of 3.3 and 251 MPa for compressive strength and MOE, respectively. According to Md Ali [28], when comparing the compressive strength parallel and perpendicular to the grain, timber in parallel or longitudinal to the grain has a superior strength that is 40 times greater than timber perpendicular to the grain, with the value of compressive strength perpendicular to the grain being about 10 to 30% of the compressive strength parallel to the grain. According to the results, compressive strength parallel to the grain ranged from 26.12 to 63.35 MPa, whereas compressive strength perpendicular to the grain ranged from 3.3 to 17.7 MPa. According to Taragon [29], compressive strength parallel to the grain ranges from 25 to 95 MPa, while compressive strength perpendicular to the grain ranges from 1 to 20 MPa. The compressive strength loaded in the parallel direction is 205 to 849% greater than the compressive strength loaded in the perpendicular direction. In the range of 1071 to 4305%, the compressive modulus parallel to the grain is greater than the compressive modulus perpendicular to the grain. The results demonstrate that the specimens perform significantly better in terms of stiffness and strength when loaded parallel to the grain. This phenomenon could be attributed to the fact that, when loaded parallelly, the whole length of the fibre can resist the stress. Meanwhile, when loaded perpendicularly, the fibres are orientated in a way that the widths, which are much shorter than the length of the fibre, resist the stress. Also, it might due to the fact that wood consists of cellulosic fibres bonded by lignin, and it is much harder to separate the bonding within the fibre by the compression effect when the samples were loaded parallelly than when we separated the bonding between lignin and the wood fibres by a rolling effect, when the samples were loaded perpendicularly.
Figure 4 and Figure 5 show that there is a high correlation between compressive strength and stiffness for the selected nine species of Malaysian hardwoods. This finding is consistent with the findings of Hanhijärvi and Ranta-Maunus [30], who discovered that the mechanical strength of Pine (Pinus L.) timber species was closely connected with its equivalent stiffness. This is most likely owing to the considerable variability in the material as a result of the good sampling. The compressive modulus parallel to the grain ranged from 10,180 to 22,580 MPa, while the compressive modulus perpendicular to the grain ranged from 251 to 1638 MPa. Zziwa [31] found a considerable association between MOE and MOR in her study, which validated the positive high correlation between the two parameters analysed. Gruznova [32] and Divos and Tanaka [33] likewise concluded that wood stiffness predicts strength better than knots, density, and annual ring width. According to the results in Table 2, the coefficient of variation for compressive modulus perpendicular to the grain is significantly higher, indicating a greater dispersion of the MOE value. However, Gerhards [34] indicated that the MOE perpendicular to the grain has a significantly larger range in findings than the MOE parallel to the grain, which is to be expected for an anisotropic timber material.
Table 2 also shows that the size of the specimens has a considerable effect on compressive strength, and the Duncan’s multiple range test results in distinct groupings. When two different sizes for compressive strength parallel to grain were compared, it was discovered that compression strength decreases with increasing member size for Kempas (SG2), Resak (SG4), Kapur (SG4), and Keruing (SG5). This result is consistent with Weibull’s (1939) weakest link theory, which predicts a decrease in strength with increasing strained volume due to stochastically developing weak places in the timber. The findings by Fryer et al. [35] showed a similar trend when they investigated the size effect of stocky and slender columns with six different dimensions loaded in compression parallel to the grain in visually graded softwood structural timber. The compressive strength parallel to the grain of the column was observed to decrease as member size increased. This is because larger members are weaker since they are more likely to contain a weaker material constituent in severely strained places. However, the compressive strength for other species in this study contradicts Weibull’s theory [36], as indicated by Schlotzhauer et al. [37], who discovered that the compressive strength of various European hardwoods i.e., Beech (Fagus L.), Oak (Quercus L.), and Lime (Tilia L.) increases with specimen volume. With the passage of time, several researchers discovered a new hypothesis that the size effect can also be explained by the (cylindrical orthotropic) anisotropic structure of wood, which is a deterministic rather than stochastic explanation of Weibull’s theory [38,39]. In terms of the MOE, the results reveal that, in most situations, the MOE value is unaffected by dimension modifications, a finding echoed by Schlotzhauer et al. [37] and Ravenshorst [25]. The authors discovered that, in most situations, various sizes have no effect on the value of MOE of compression and bending since MOE is measured in the elastic range of the test rather than at failure. More varied sizes must be examined in order to see a more pronounced influence of the size effect and changes in a single dimension (e.g., width) on compression strength.
Figure 6 and Figure 7 show the relationship between compressive strength parallel to the grain and compressive strength perpendicular to the grain and density for structural specimen sizes. Wood density is the best predictor of wood strength [40,41]. In general, the relationship between the density and compressive strength of wood can be expressed by a power function, though a linear function is also said to be sufficient in some cases [42]. In this study, a power function was used to express the relationship between wood density and compressive strength (R2 = 0.62 and R2 = 0.78 for compressive strength parallel and perpendicular to the grain, respectively). According to the findings, the relationship between density and compressive strength perpendicular to the grain is stronger than the relationship between density and compressive strength parallel to the grain. As the density of the wood increased from 400 to 1200 kg/m3, the compressive strength parallel and perpendicular to the grain increased three-fold and nine-fold, respectively. The results show that compressive strength perpendicular to the grain is more sensitive to the changes in wood density, which is likely due to its inherent low value when compared to compressive strength parallel to the grain. As a result, even minor changes in density have a significant impact on compressive strength.

3.2. Characteristic Value of Compressive Strength Properties

In order for solid timber to be used in structural design using the limit state method, which is in accordance with EC5 [9], the mean compressive strength properties parallel to the grain and density were further derived into characteristic values, which were then used to assign the timber samples to the specific strength classes where the variation of the mechanical properties was reflected. The characteristic value is defined as the fifth percentile value of strength, mean MOE, and density computed in accordance with EN 384 [15] and EN 14358 [21]. Table 3 shows the characteristic and mean values of compressive strength, MOE, and density for all species as adjusted to 12% moisture content in accordance with EN 384 [15]. Based on the results, Kempas has the highest characteristic value for compressive strength, fc,0,k and MOE, Ec,0,k which are 43.9 and 22,647 MPa, respectively, even though Kempas does not possess the highest characteristic density (716 kg/m3). This was followed by Balau (38.9 MPa), Resak (37.6 MPa), Kapur (32.3 MPa), Kelat (32.2 MPa), Keruing (28.1 MPa), Mengkulang (26.9 MPa), Light Red Meranti (19.7 MPa) and Geronggang (18.2 MPa). The characteristic value of MOE varies between 10,795 to 22,647 MPa with the highest MOE for Kempas and the lowest for Geronggang. For characteristic density, Resak shows the highest value while Light Red Meranti has the lowest, which are 813 and 361 kg/m3 respectively.
Table 4 compares the experimental characteristic values of compressive strength, fc,0,k, MOE, Ec,0,k and density, ρk of the timber species with those specified in EN 338 [11] and MS544: Part 3 [6] for the strength classes assigned to each timber species. Strength classes for timbers from many parts of the world, including five species of tropical hardwood from Southeast Asia, namely Balau, Kempas, Kapur, Merbau, and Keruing, are provided in EN 1912 [43], but the strength properties are provided in EN 338 [11], with compressive strength properties in this standard derived from the equation provided in EN 384 [15]. These test results were also compared to the values provided in MS544: Part 3 [6], which provides structural strength data for many Malaysian hardwood timber species, including Mengkulang and Light Red Meranti. Because the strength data in MS544: Part 3 [6] are in grade stresses that adopt the data of tropical hardwoods accessible in BS 5268: Part 2 [5], hence the characteristic values were taken from EN338 [11] but followed the similar strength class in MS544: Part 3 [6]. MS 544: Part 3 [6] strength data for Balau, Kempas, Kapur, and Keruing are equivalent to EN 338 [11], which was preceded by BS 5268: Part 2 [7]. Due to lacking of published data, the comparison can only be done on six of the nine species: Balau, Kempas, Kapur, Keruing, Mengkulang, and Light Red Meranti. The properties of the other 3 species are not available in the standards. Therefore, only the six available timber species are listed for comparison purposes and to show the discrepancy among of strength values. It is to highlight the importance to derive the characteristic compressive strength value of other Malaysian hardwoods from experimental results.
According to the tabulated data, the experimental compressive strength characteristic values for Balau and Kempas are greater than the published values in EN 338 [11]. The experimental characteristics of compressive strength, MOE, and density for Kempas (D60) are 43.9 MPa, 22.2 MPa, and 716 kg/m3, respectively, which are 33, 36, and 2% greater than the published values in EN 338 [11], and these values are the highest among the five species. The typical compressive strength, MOE, and density of Balau, which is categorised as D50, are 27, 17, and 30% greater than EN 338 [11]. This finding is consistent with Hannouz et al. [44], who investigated the mechanical properties of European hardwood ash wood (Fraxinus excelsior L.) and discovered that the value obtained through experimental work is greater than the value obtained using the formula in EN 338 [11]. Obinna Osuji and Inerhunwa [45] and Gamper [46] similarly stated that the test value is bigger than the values derived using the EN 338 [6] calculation. The typical strength (32.3 MPa) and MOE (17.4 GPa) for Kapur demonstrate no significant difference with EN 338 [11] values of 33 MPa and 17 GPa, respectively. Keruing’s characteristic strength of 28.1 MPa is somewhat lower than the 30 MPa stated in EN 338 [11], although it has 19% and 9% higher values in the EN 338 [11] for its characteristic MOE and density, respectively.
Mengkulang and Light Red Meranti have no strength class classification in EN 338 [11], although they are classed as D40 and C22 in MS 544: Part 3 [6]. Mengkulang (26.9 MPa) and Light Red Meranti (19.7 MPa) exhibit no significant difference in experimental characteristic strength when compared to MS 544: Part 3 [2], which outlines values of 27 and 20, respectively. It can be inferred that the compressive strength properties of Malaysian tropical hardwoods with densities greater than 700 kg/m3 were significantly understated in EN 338 [11]. As a result, the data acquired in this study are more relevant to be used in order to build safer and more economical timber structures, as this strength data are derived from actual structural size specimens rather than an approximated value using an equation. The compressive strength properties of the species with densities less than 700 kg/m3 indicate no significant difference.

3.3. Verification of Equation in EN338

According to EN 384 [15], if there are no available data from actual testing for compressive strength properties from structural size, the characteristic strength of compression, fc,k can be calculated using the Equation in Table 2 [15] using the bending strength properties, fm,k which are called the “basic values” in determining the characteristic values of other mechanical properties and the strength class of timber given in EN 338 [11]. The equation given in EN 384 [15] to derive the characteristic compressive strength parallel to the grain is f c , 0 , k = 4.3   f m , k 0.5 . However, this equation might not be appropriate to be used for tropical hardwoods, specifically Malaysian timbers, as it is derived from softwoods and some European hardwoods which are temperate timbers with their densities ranging from 200 to 1000 kg/m3, while the densities of Malaysian hardwoods ranged from 300 kg/m3 to more than 1200 kg/m3. Due to limited data of hardwood timbers from other countries, this standard has limitations for hardwoods where some clauses specially mention that the modification is only applicable for softwoods and European hardwood timbers. According to the results in Table 4, the compressive strength characteristic values obtained from the experimental work for timbers with a density of 700 kg/m3 are higher than the values given in EN 338 [11]. As a result, the equation supplied in EN 384 [15] must be tested to determine if it is suitable to be used with tropical timbers, particularly high-density timbers. In order to determine the relationship with the compression characteristic, this equation must be verified using the characteristic bending strength. Thus, the typical bending strength was adapted from Baharin [47], who investigated the bending strength attributes of the same Malaysian tropical hardwood species.
Table 5 shows the compressive strength parallel to the grain, bending strength, and strength classes for nine Malaysian tropical hardwoods derived from structural-sized specimens. According to the results, the characteristic compressive strength for all species except Keruing was higher than the figure in EN 338 [11] for the relevant strength class, which was obtained from the bending properties and was adopted from Baharin [47], who conducted the structural bending test where the specimens were taken from the same sources and had the same number of specimens. The experimental characteristic value for Keruing is 3% lower, whereas Kempas has the greatest difference, which is 46% greater when compared to the values specified in EN 338 [11]. With the exception of Keruing, the changes in characteristic values were substantial and more pronounced for species with densities more than 700 kg/m3. On the other hand, the experimental characteristic values for the species with densities of less than 700 kg/m3, namely, Mengkulang, Light Red Meranti, and Geronggang, demonstrate an insignificant difference between their values and the EN 338 [11] of 7, 3, and 7%, respectively.
Figure 8 shows the relationship of characteristic experimental values and prediction values using the equation in EN 384 [15] between compressive and bending strength. Based on the regression analysis, the relationship of experimental value gives the equation f c , 0 , k = 2.2   f m , k 0.7 which is different from the equation in EN 384 [15]. It can be noticed that the characteristic values for Balau, Kempas, Kelat, Resak, and Kapur do not fulfil the equation in EN 384 [15] where the experimental values are higher, whereas it is in line with the predicted values for Keruing, Mengkulang, Light Red Meranti, and Geronggang. It may be concluded that the equation in EN 384 [15] is unsuitable for tropical timber species with densities greater than 700 kg/m3 because it underestimates the strength of the timber, making structural timber design uneconomical.

4. Conclusions

The compressive characteristics of structural-sized specimens of nine Malaysian tropical hardwood timbers were investigated, and characteristic values were established. The following are the key findings of this study:
  • The compressive strength of the timber specimens was influenced by their size. In some cases, the compressive strength of the specimens decreased as the size of the samples increased from 75 × 150 × 450 to 100 × 150 × 600 mm.
  • The grain direction has a substantial influence on compressive characteristics, with all specimens examined parallel to the grain having a higher compressive strength and MOE than specimens tested perpendicular to the grain. The compressive performance of Kempas (SG2) is the highest than the other species studied in this study.
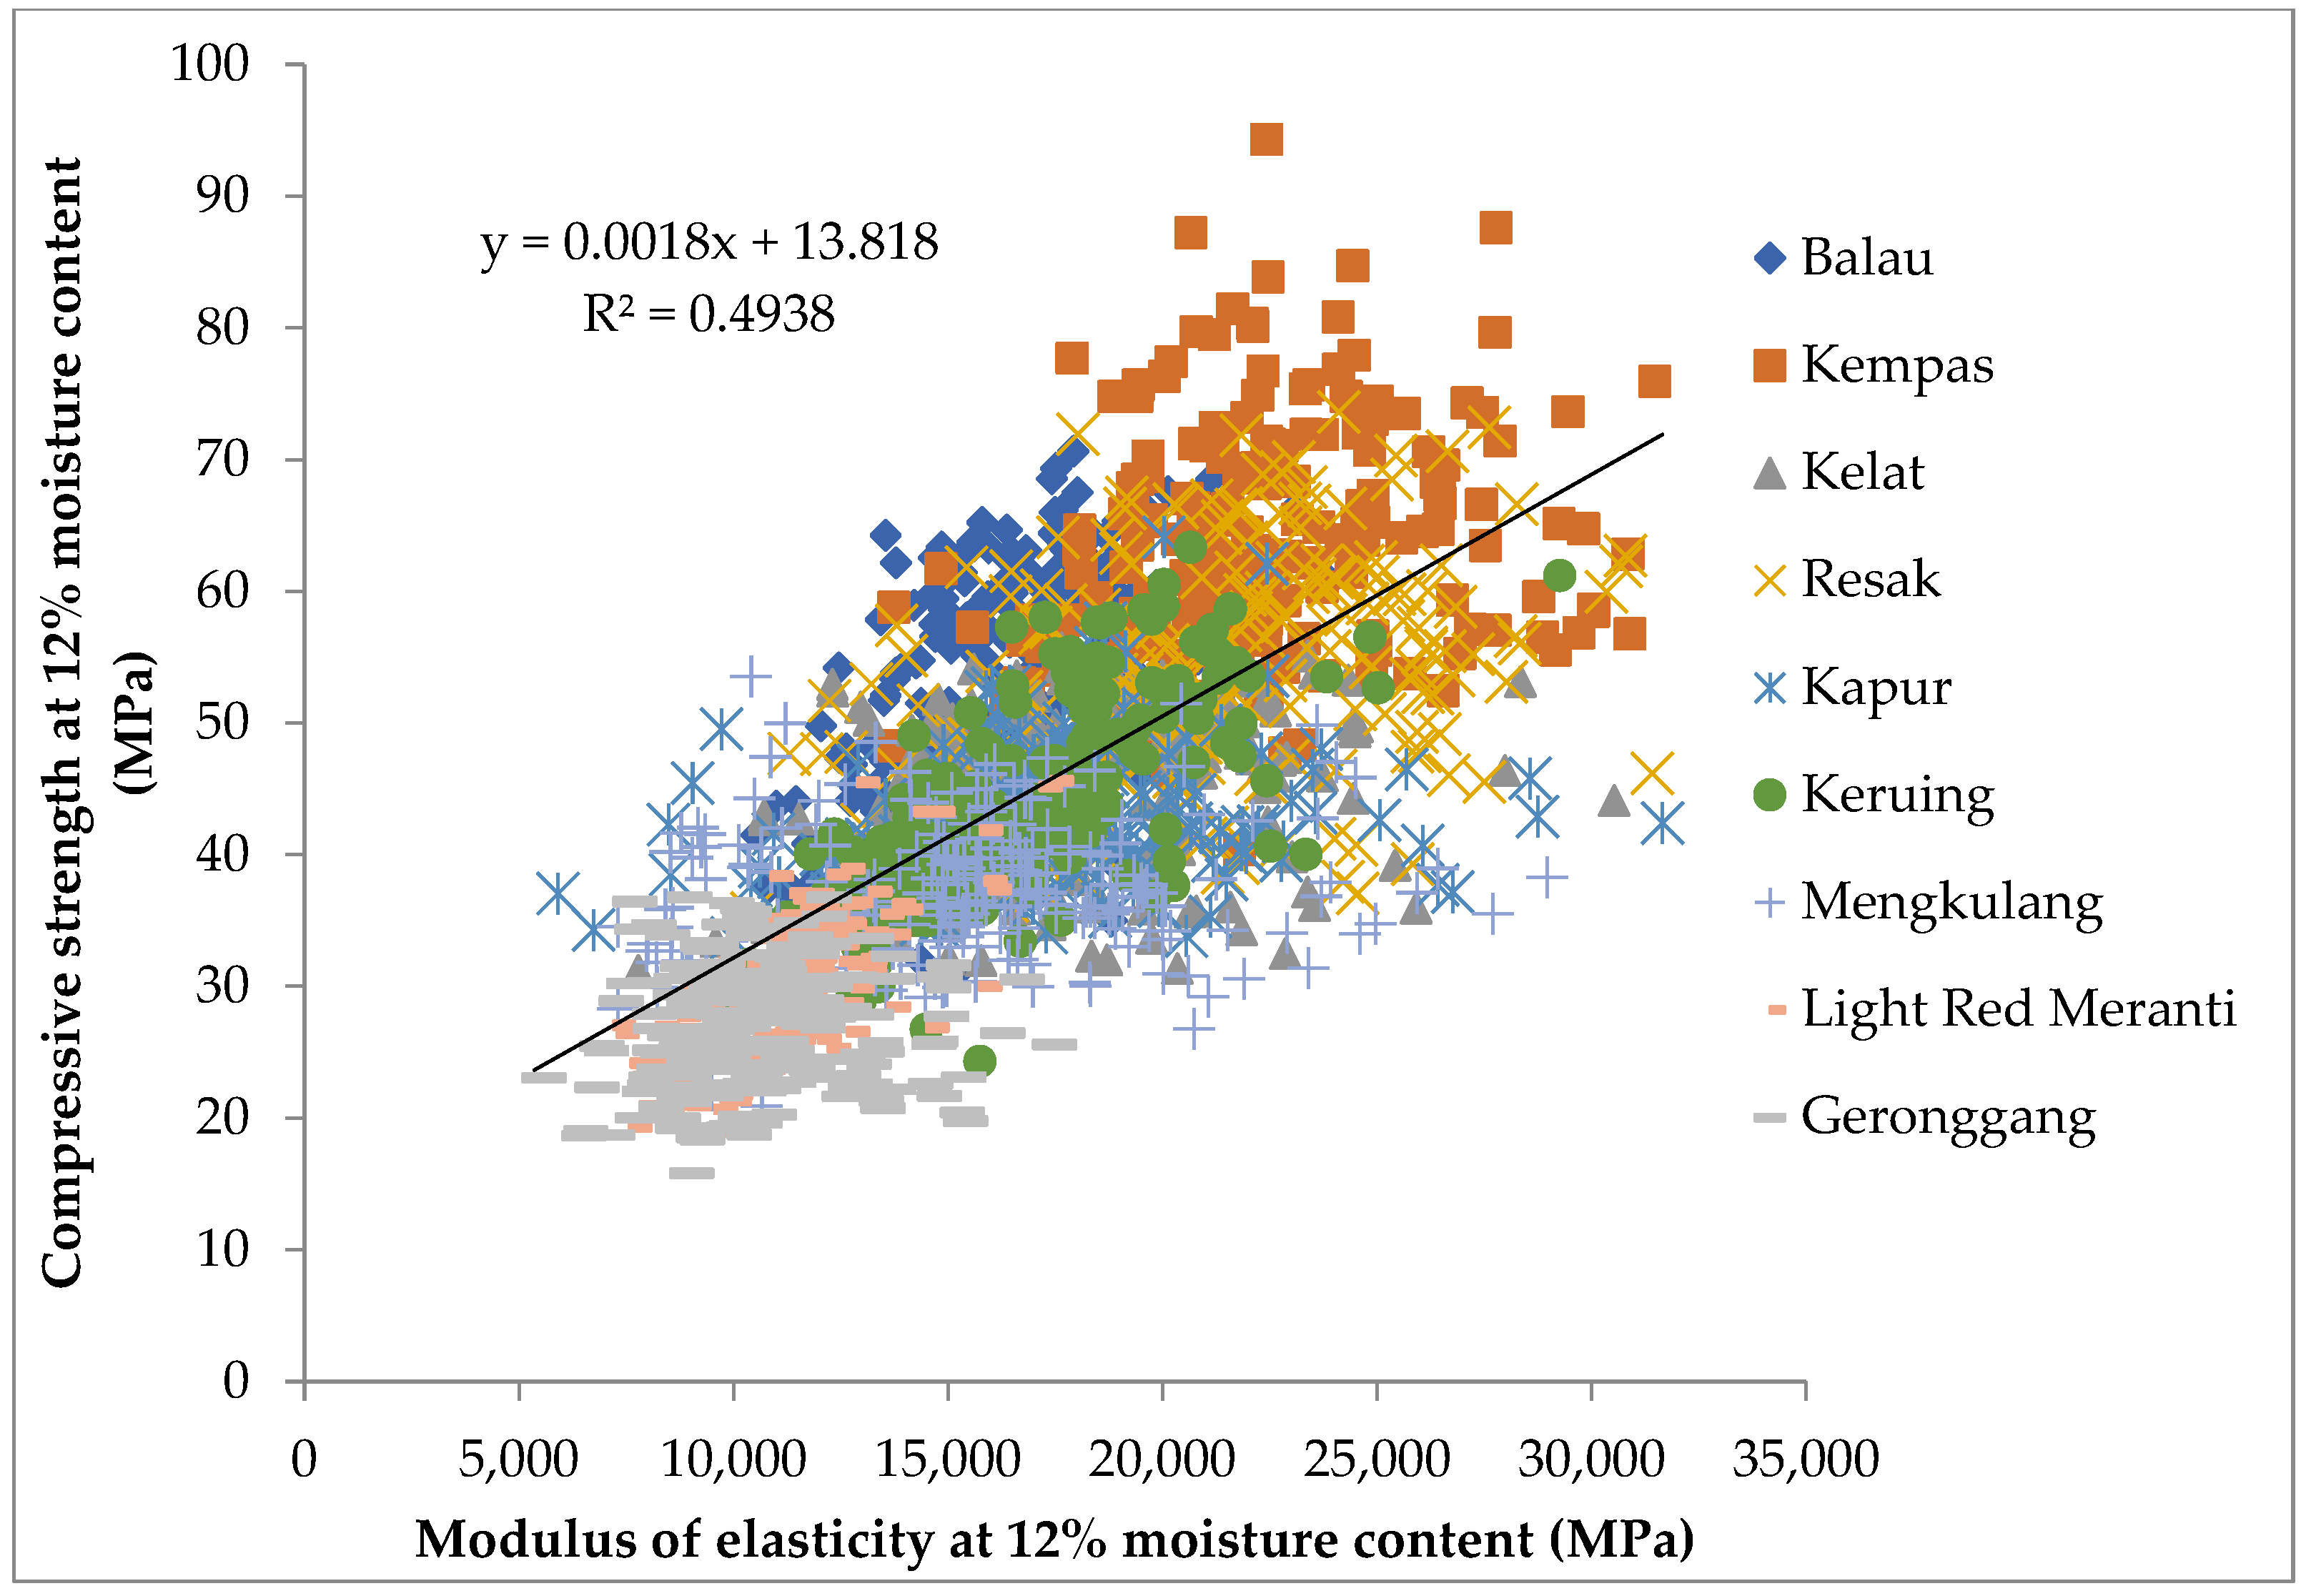
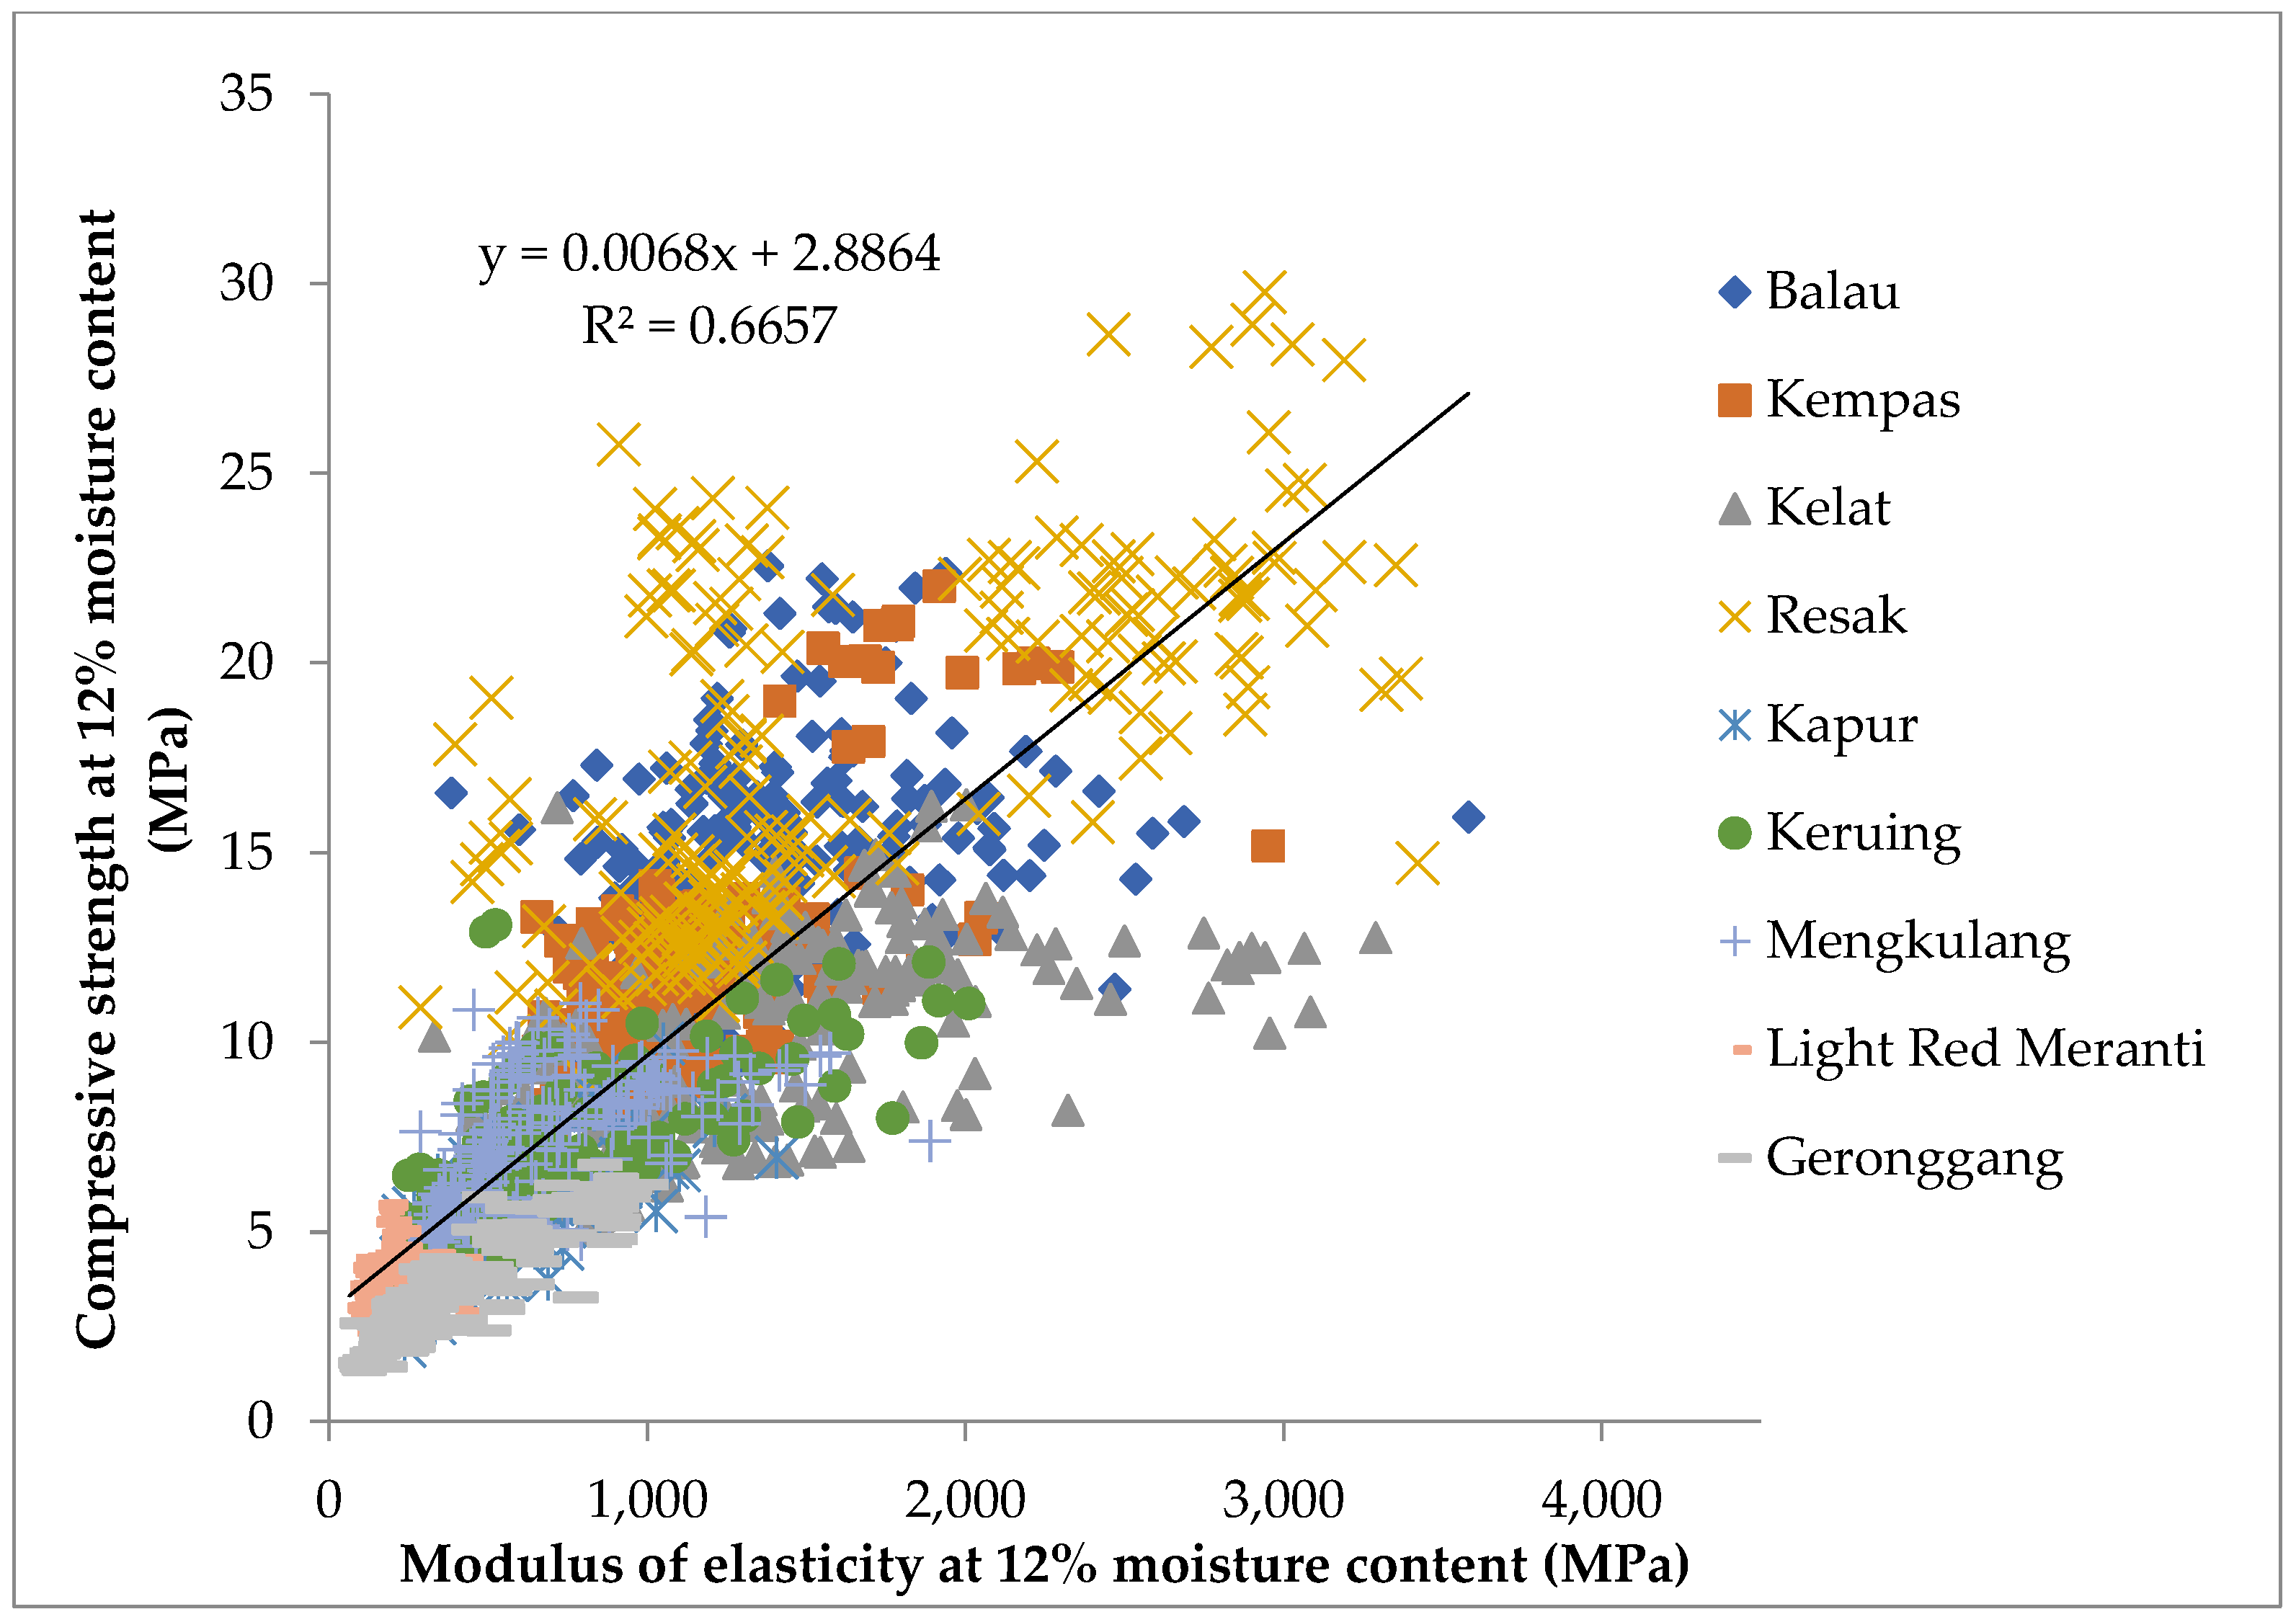
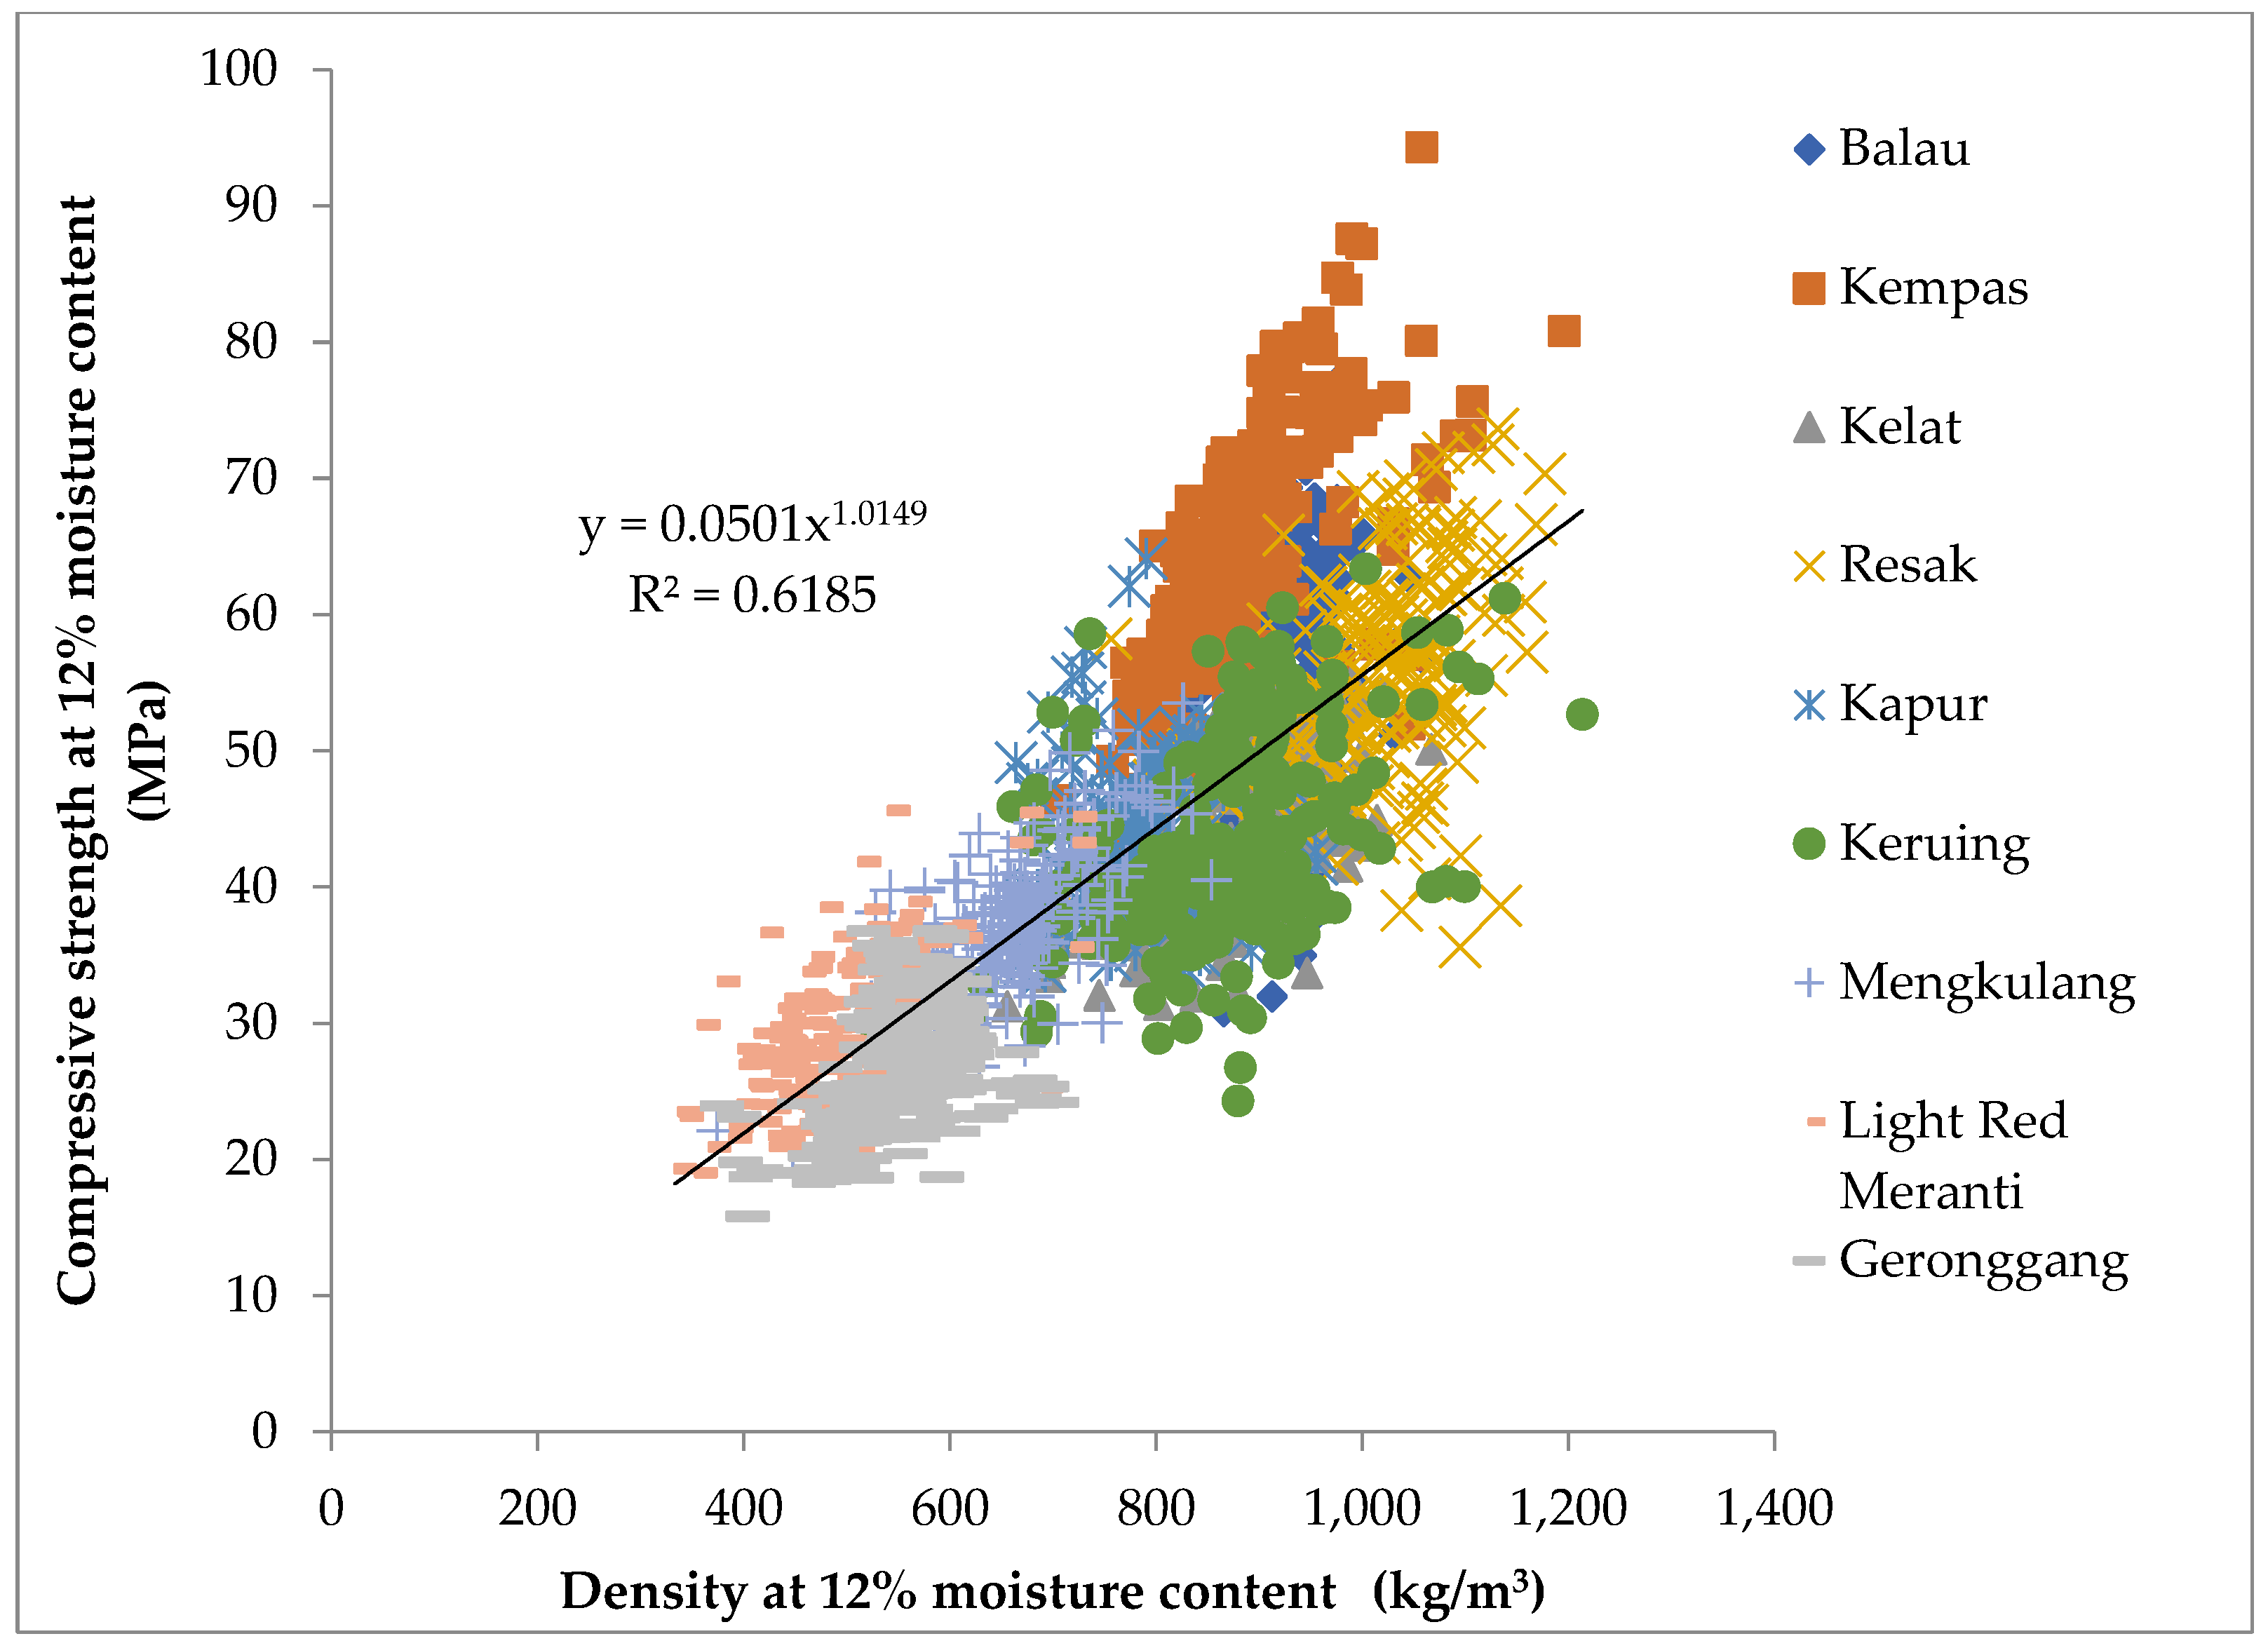
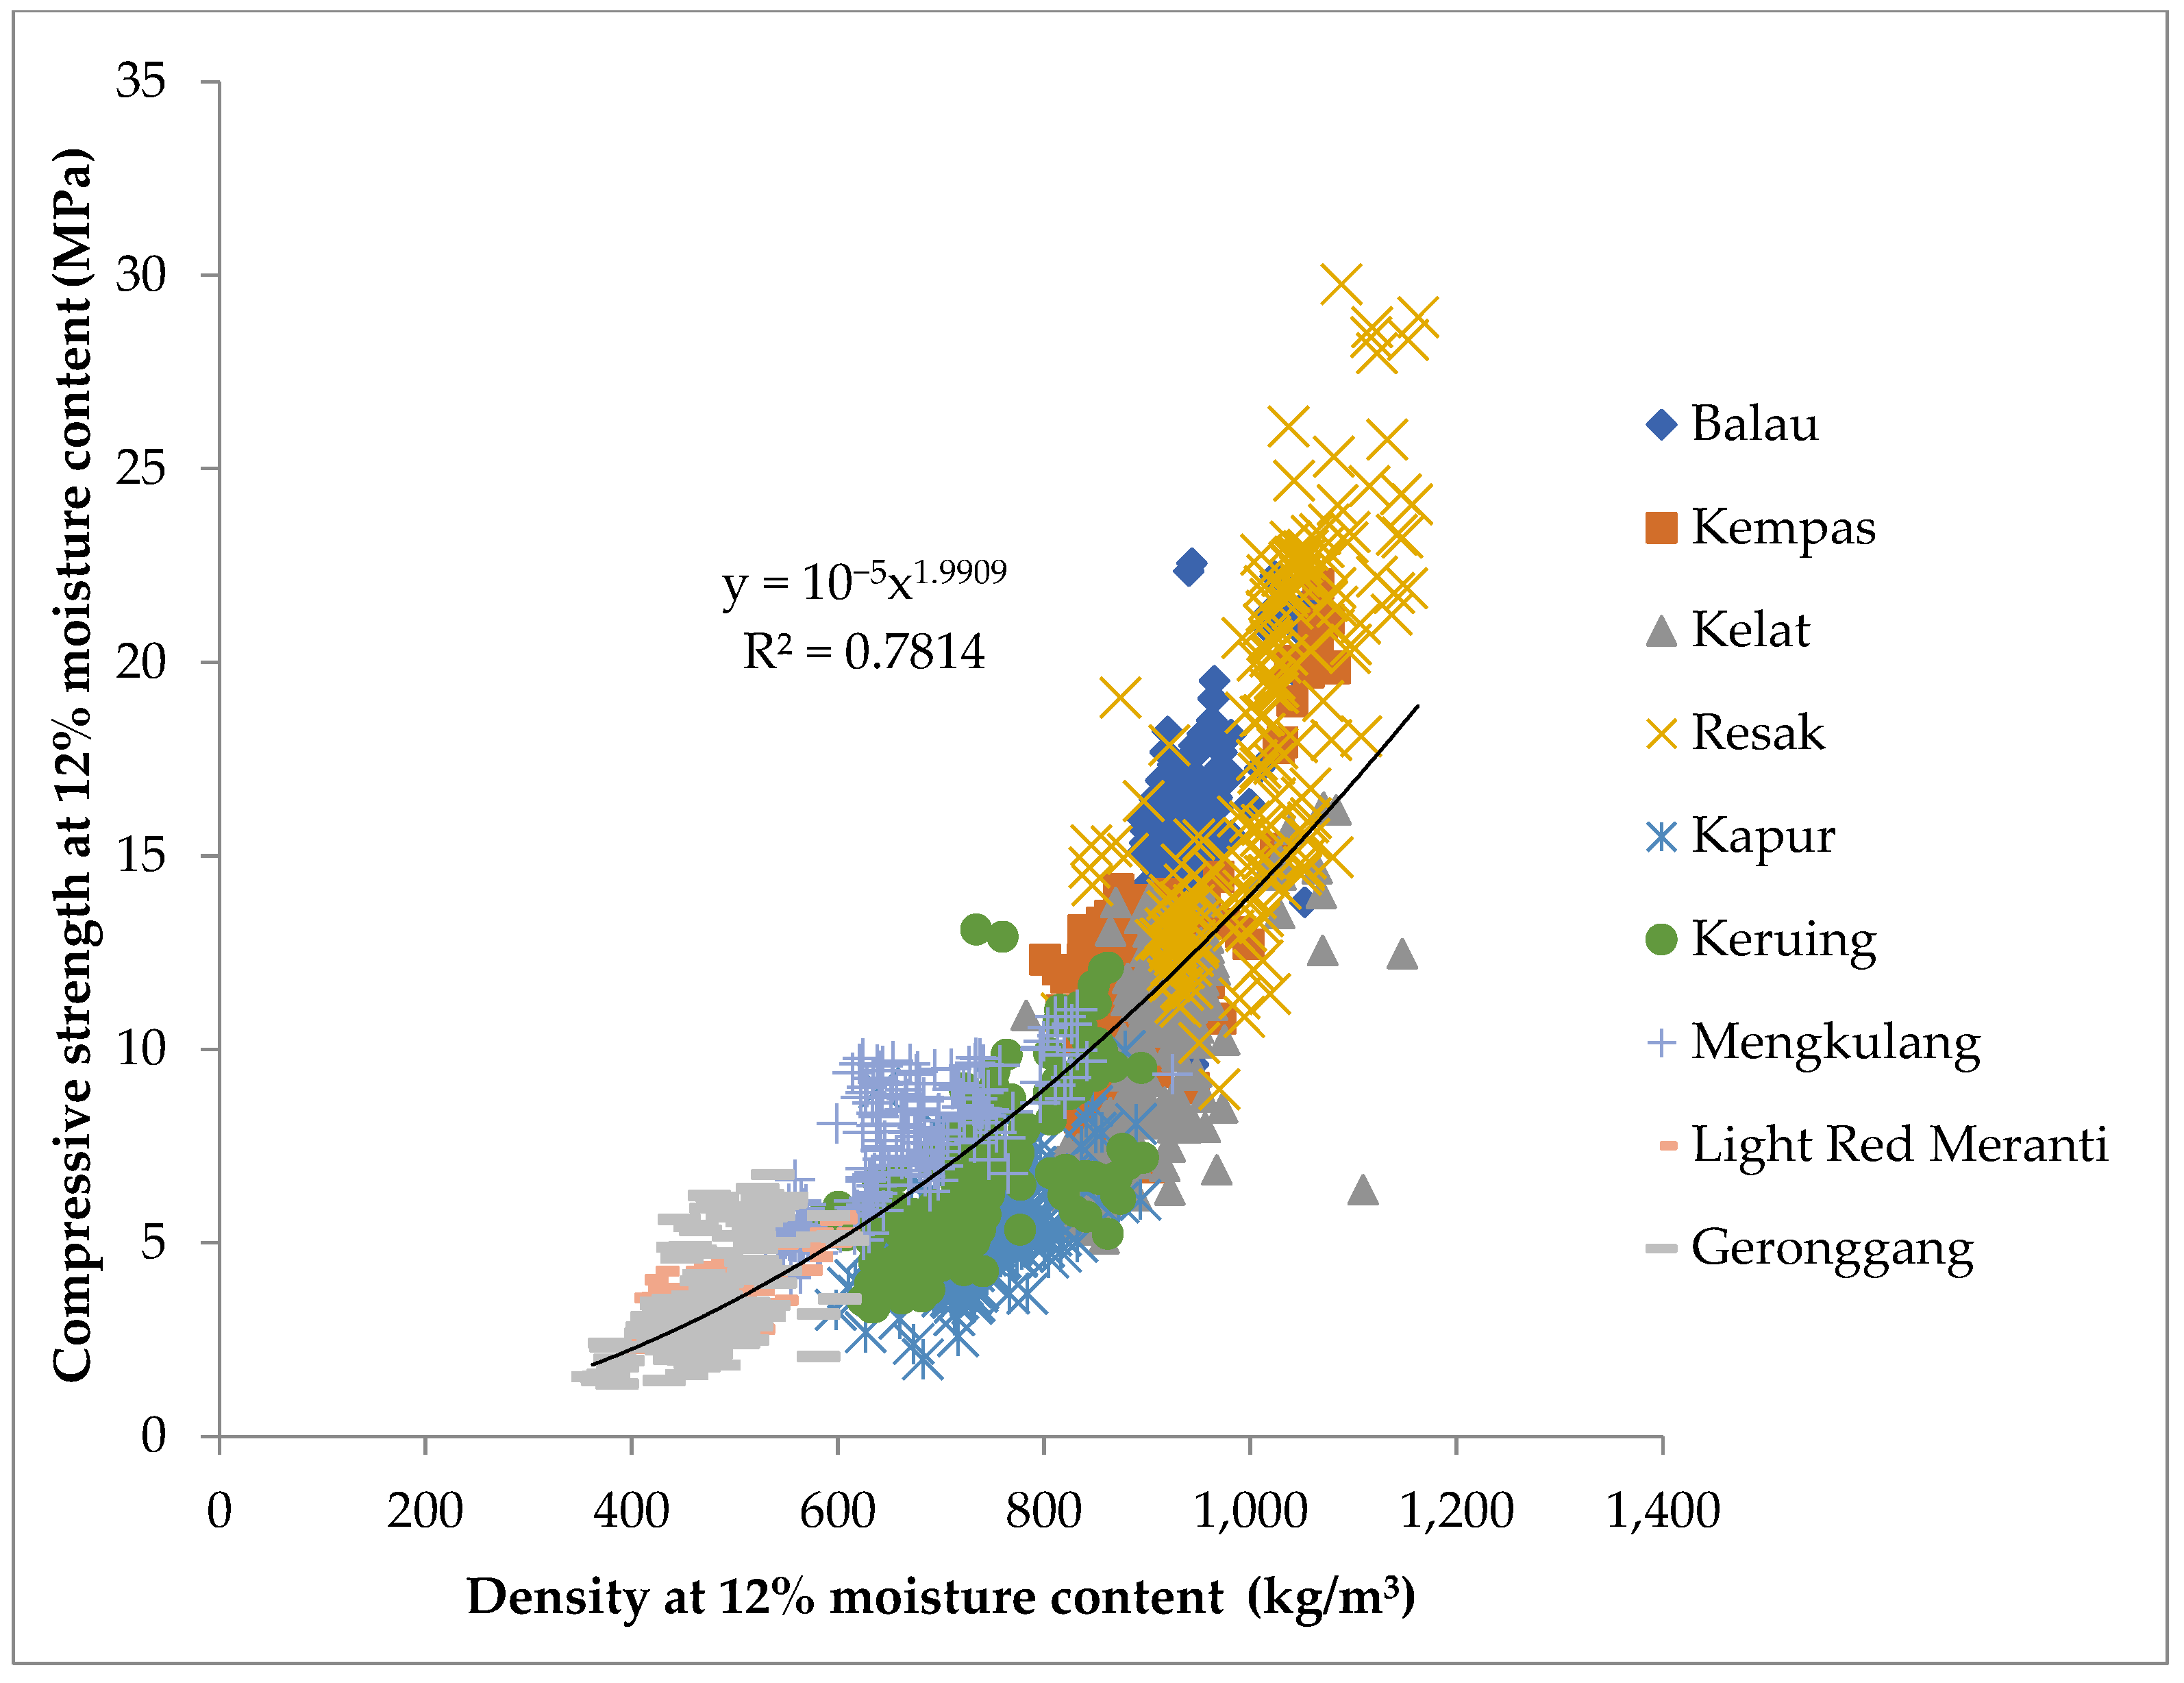
  • Compressive strength and stiffness were positively correlated. Meanwhile, density also exerts substantial effect on the compressive strength of the timber specimens.
  • With exception of Keruing, the compressive characteristic values for other species are higher than the values stipulated in EN 338 [6] for corresponding strength classes, notably for hardwood timber, with a density greater than 700 kg/m3.
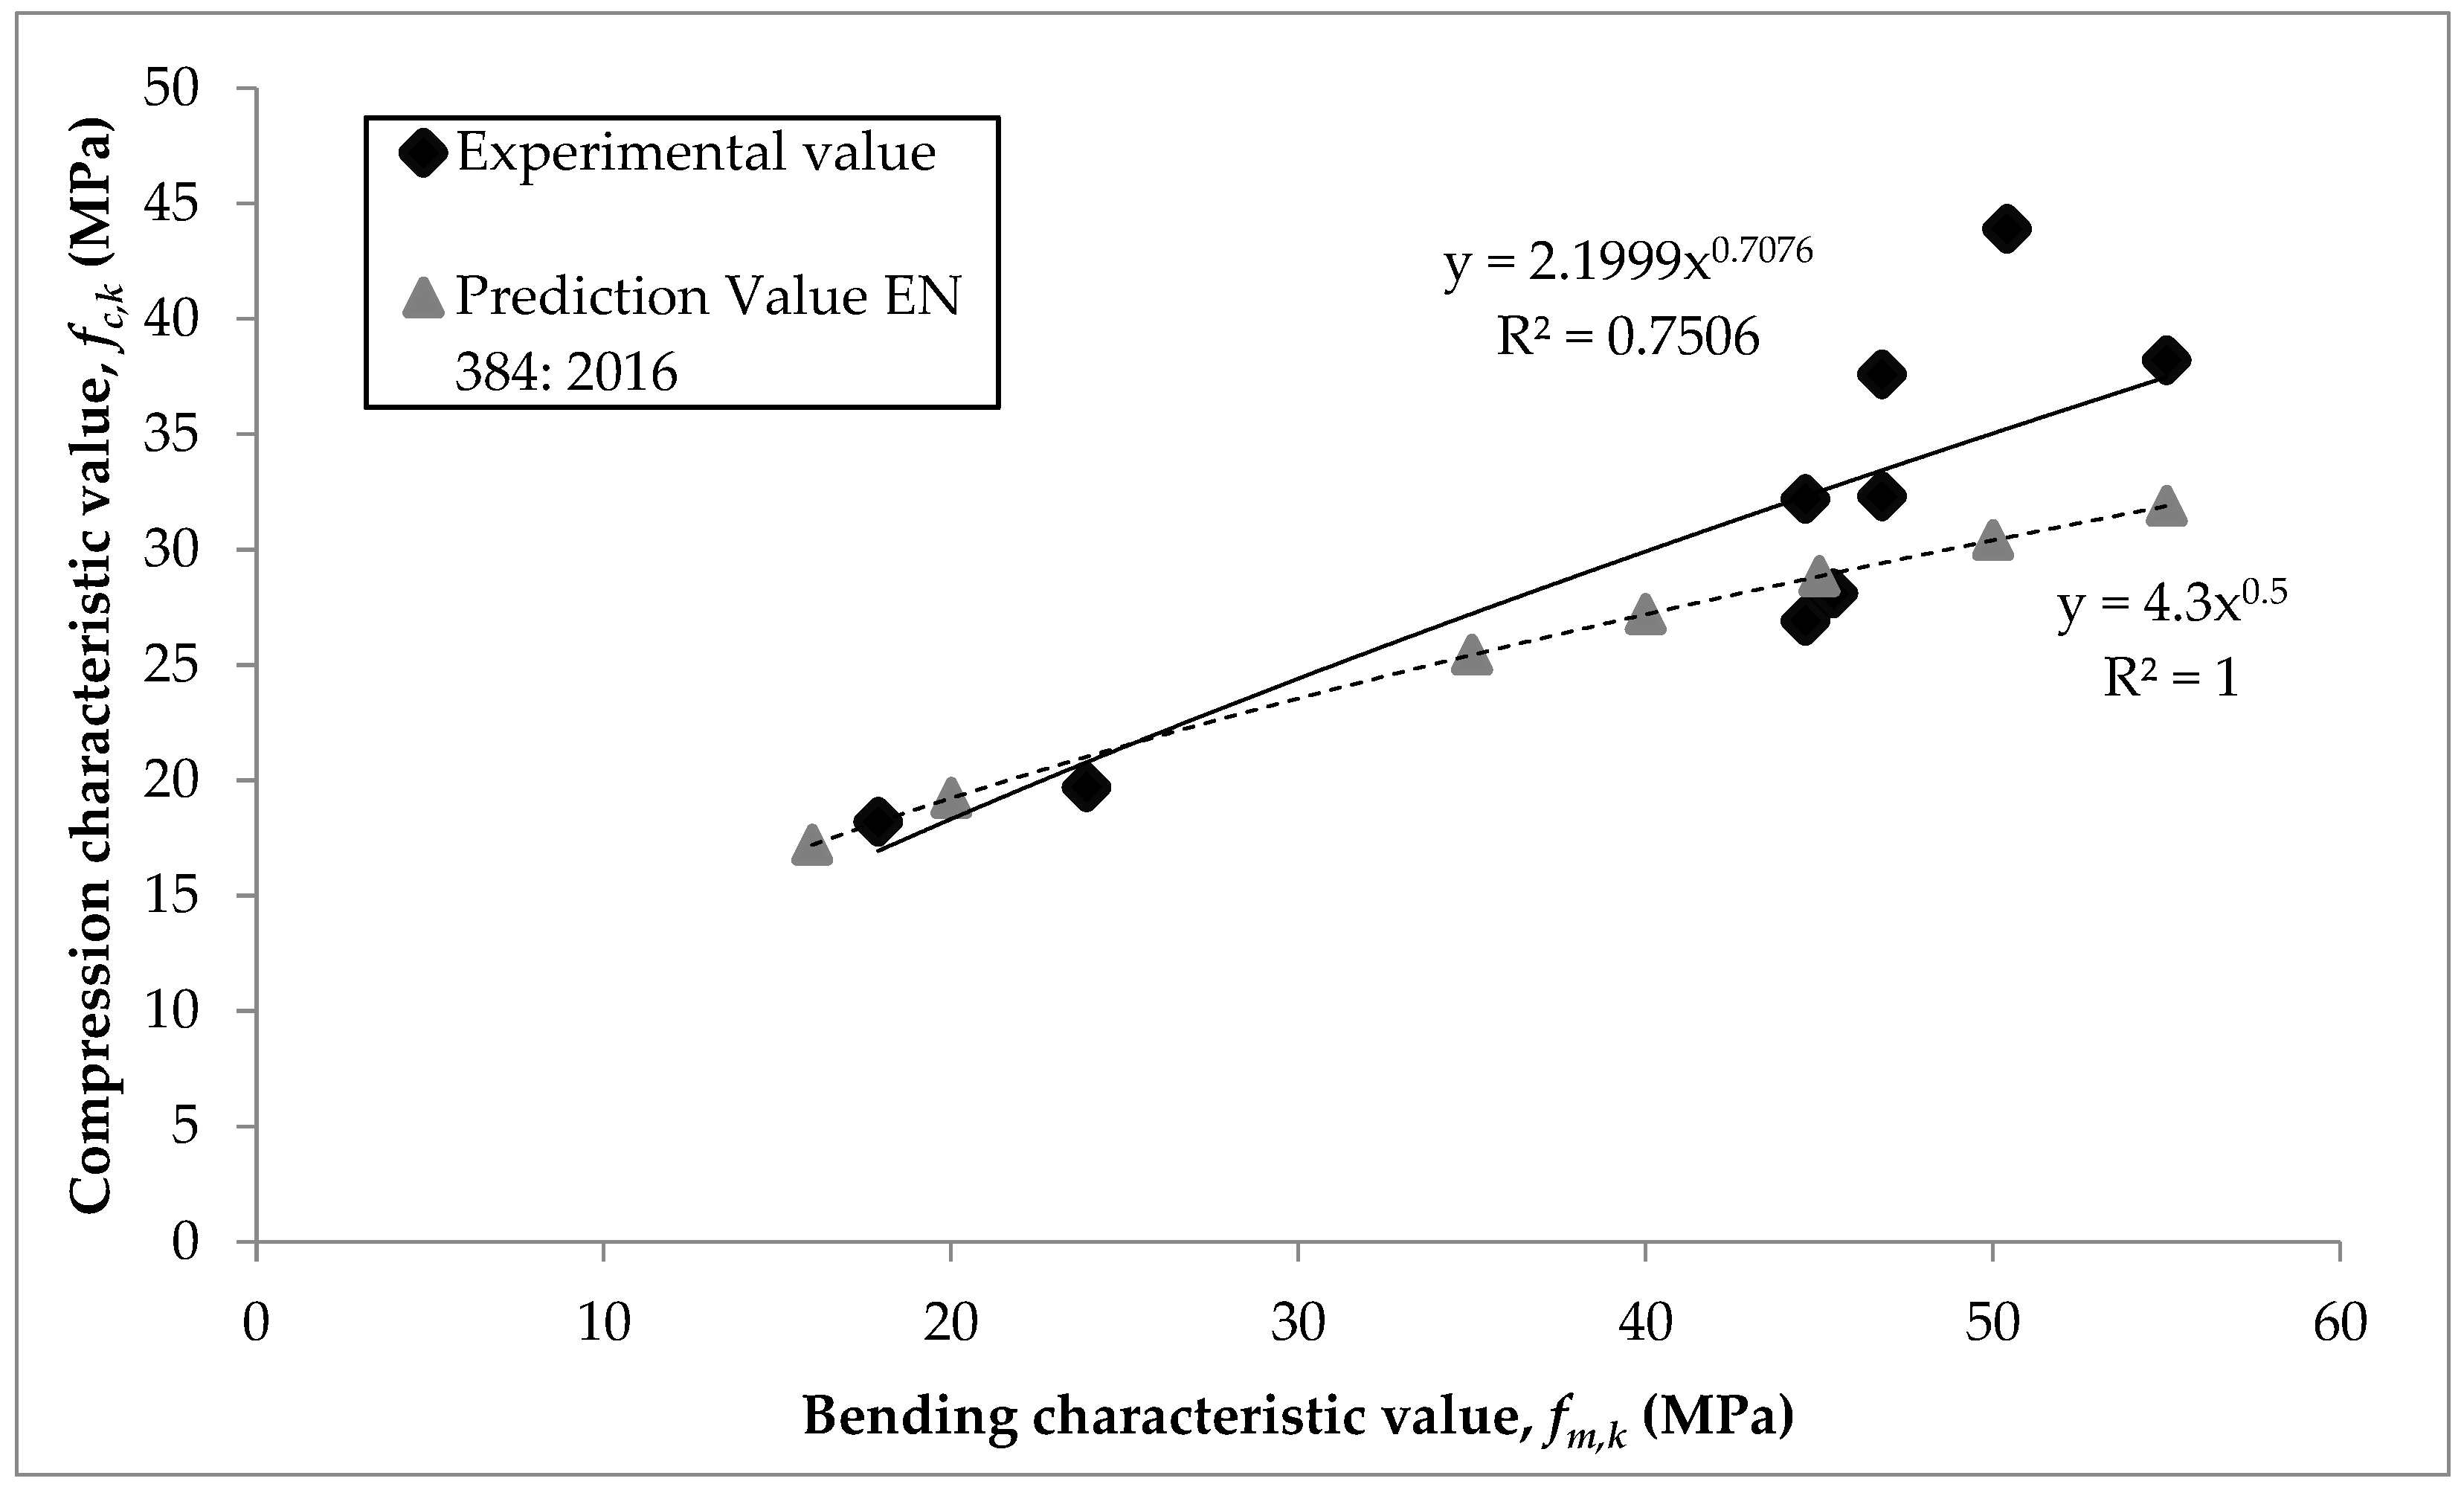
  • An equation that differed than the one given in EN 384 [15] was developed in this study for the determination of compressive strength characteristic values. The equation developed was f c , 0 , k = 2.2   f m , k 0.7 . Based on this equation, it was revealed that the equation in EN 384 [15] is only suitable for low-density timber such as Mengkulang, Light Red Meranti, and Geronggang. The equation stipulated in EN 384 [15] is unsuitable for timber with densities higher than 700 kg/m3 because it underestimates the strength of the timber, making structural timber design uneconomical.

Author Contributions

Conceptualization, Z.A. and W.C.L.; methodology, A.A.; software, W.C.L. and N.M.B.; validation, A.A., A.B. and N.I.L.Z.; formal analysis, A.A.; investigation, A.A. and A.B.; resources, N.M.B.; data curation, A.A.; writing—original draft preparation, A.A. and N.I.L.Z.; writing—review and editing, W.C.L. and S.H.L.; visualization, W.C.L. and S.H.L.; supervision, Z.A.; project administration, Z.A.; funding acquisition, Z.A. All authors have read and agreed to the published version of the manuscript.

Funding

This research was funded by the Malaysian Timber Industry Board (MTIB), Grant number: 100-RMI/GOV 16/6/2 (13/2014).

Data Availability Statement

Not applicable.

Acknowledgments

The authors would like to express special appreciation to Malaysian Timber Industry Board (MTIB) for the funding of the research grant and School of Civil Engineering, Universiti Teknologi MARA (UiTM) for providing the experimental facilities. The authors express their gratitude to all who made this research possible.

Conflicts of Interest

The authors declare no conflict of interest.

References

  1. Bodig, J.; Jayne, B.A. Mechanics of Wood and Wood Composite; Van Norstrand Reinhold Company Inc.: New York, NY, USA, 1982. [Google Scholar]
  2. Hassan, R.; Ahmad, Z.; Ibrahim, A.; Mohd Nor, M.S. Compressive Strength Properties of Structural Size Timber Made from Selected Malaysian Tropical Timber; Institut Penyelidikan, Pembangunan dan Pengkomersilan, Universiti Teknologi MARA: Shah Alam, Malaysia, 2004. [Google Scholar]
  3. Puaad, M.B.F.M.; Ahmad, Z. Comparing the Compressive Strength Properties of Structural Size and small Clear Specimens for Malaysian Tropical Timber. Sci. Int. 2017, 29, 25–29. [Google Scholar]
  4. Ali, K.H.; Hussain, T.; Kamali, A. Compression Perpendicular to Grain in Timber-Bearing Strength for a Sill Plate. Master’s Thesis, Linnaeus University, Växjö, Sweden, 2014. [Google Scholar]
  5. MS 544: Part 2: 2017; Code of Timber Practice for Structural Use of Timber: Part 2: Permissible Stress Design of Solid Timber. Department of Standards Malaysia: Cyberjaya, Malaysia, 2017.
  6. MS 544: Part 3: 2001; Permissible Stress Design of Glued Laminated Timber. Department of Standards Malaysia: Cyberjaya, Malaysia, 2001.
  7. BS 5268-2:2002; Structural use of timber: Part 2: Code of Practice for Permissible Stress Design, Materials and Workmanship. The British Standards Institution: London, UK, 2002.
  8. Wahab, M.J.A.; Jumaat, M.Z.; Khaidzir, M.O.M. Statistical Technique for Grouping Tropical Timbers into Similar Strength Groups. Mod. Appl. Sci. 2012, 6, 73–80. [Google Scholar]
  9. EN 1995-1-1; Eurocode 5: Design of Timber Structures. European Committee for Standardization: Geneva, Switzerland, 1995.
  10. Sheikh, S.; Ahmad, Y. Flexural Timber Design to Eurocode 5 And the Malaysian Timber Code MS 544: 2001. Malays. J. Civ. Eng. 2015, 27, 207–223. [Google Scholar]
  11. EN 338:2016; Structural Timber-Strength Classes. European Committee for Standardization: Geneva, Switzerland, 2016.
  12. Ahmad, Z.; Bon, Y.C.; Abd Wahab, E.S. Tensile Strength Properties of Tropical Hardwoods in Structural Size Testing. Int. J. Basic Appl. Sci. 2010, 10, 1–6. [Google Scholar]
  13. Wahab, M.J.A.; Jumaat, M.Z. Investigation of Linearity between Mechanical Properties of Wood Using Graphical Method. Sains Malays. 2014, 43, 211–218. [Google Scholar]
  14. Mohd Jamil, A.W.; Mohd Zamin, J.; Mohamad Omar, M.K. Relationship between Mechanical Properties of Structural Size and Small Clear Specimens of Timber. J. Trop. For. Sci. 2013, 25, 12–21. [Google Scholar]
  15. EN 384:2016; Determination of Characteristic Values of Mechanical Properties and Density. European Committee for Standardization: Geneva, Switzerland, 2016.
  16. EN 408:2010; Timber Structures-Structural Timber and Glued Laminated Timber—Determination of Some Physical and Mechanical Properties. European Committee for Standardization: Geneva, Switzerland, 2010.
  17. BS 5756:2007+A1:2011; Visual Strength Grading of Hardwood. Specification. The British Standards Institution: London, UK, 2011.
  18. MS 1714:2003; Specification for Visual Strength Grading of Tropical Hardwood Timber. Department of Standards Malaysia: Cyberjaya, Malaysia, 2003.
  19. EN 14081-1:2005; Timber Structures—Strength Graded Structural Timber with Rectangular cross Section. General Requirements (+A1:2011). European Committee for Standardization (CEN): Brussels, Belgium, 2005.
  20. Anon. 100 Malaysian Timbers: 2010 Edition; Malaysian Timber Industry Board: Kuala Lumpur, Malaysia, 2010.
  21. EN 14358:2016; Timber Structures—Calculation and Verification of Characteristic Values. European Committee for Standardization: Geneva, Switzerland, 2016.
  22. EN 13183-1 (2002); Moisture Content of a Piece of Sawn Timber–Part 1: Determination by Oven Dry Method. European Committee for Standardization (CEN): Brussels, Belgium, 2002.
  23. Dinwoodie, J.M. Timber-A Review of the Structure-Mechanical Property Relationship. J. Microsc. 1975, 104, 3–32. [Google Scholar] [CrossRef]
  24. Porteons, J.; Kermani, A. Structural Timber Design Eurocode 5, 2nd ed.; Wiley-Blackwell: Oxford, UK, 2013. [Google Scholar]
  25. Ravenshorst, G.J.P. Species Independent Strength Grading of Structural Timber. Ph.D. Thesis, Faculty of Civil Engineering, Delft University of Technology, Delft, The Netherlands, 2015. [Google Scholar]
  26. Hamid, N.H.A.; Ahmad, M.; Suratman, M.N. Bending and Compression Properties of Malaysian Medium Hardwood in Orthotropic Directions Kelat (Syzygium spp.). Appl. Mech. Mater. 2013, 330, 938–941. [Google Scholar] [CrossRef]
  27. Hallai, J. Fracture of Orthotropic Materials under Mixed Mode Loading; Department of Aerospace Engineering and Engineering Mechanic, The University of Texas at Austin: Austin, TX, USA, 2008. [Google Scholar]
  28. Md Ali, E.S.S. Bending behavior of Timber Beams Strengthened with Glass Fibre Reinforced Polymer (GFRP). Bachelor’s Thesis, Universiti Malaysia Pahang, Gambang, Malaysia, 2014. [Google Scholar]
  29. Taragon, J.K. Determination of Stuctural Properties of Naturally Dried Kabete Blue-Gum Timber. Master’s Thesis, Department of Agricultural Engineering, University of Nairobi, Nairobi, Kenya, 2000. [Google Scholar]
  30. Hanhijärvi, A.; Ranta-Maunus, A. Development of Strength Grading of Timber Using Combined Measurement Techniques. Report of the Combigrade-Project, Phase 2; VTT Publications: Espoo, Finland, 2008; p. 55. [Google Scholar]
  31. Zziwa, A.; Ziraba, Y.N.; Mwakali, J.A. Inferring Strength of Structural Timbers from Small Clear Specimen Strength Test Data. Int. J. Res. Eng. Technol. Sci. 2016, 2, 142–152. [Google Scholar]
  32. Gruznova, A. Comparison of Timber Strength Classification Systems in Finland and in Russia. Bachelor’s Thesis, Saimaa University of Applied Sciences, Lappeenranta, Finland, 2012. [Google Scholar]
  33. Divos, F.; Tanaka, T. Relation Between Static and Dynamic Modulus of Elasticity of Wood. Acta Silv. Lignaria Hung. 2005, 1, 105–110. [Google Scholar]
  34. Gerhards, C.C. Effect of Moisture Content and Temperature on Mechanical Properties of Wood: An Analysis of Immediate Effect. Wood Fiber Sci. 1982, 14, 4–36. [Google Scholar]
  35. Fryer, B.K.; Foster, R.M.; Ramage, M.H. Size Effect of Large Scale Timber Columns. In Proceedings of the World Conference on Timber Engineering 2018, Seoul, Korea, 20–23 August 2018; pp. 20–23. [Google Scholar]
  36. Weibull, W. A Statistical Theory of the Strength of Material; Proceedings No. 151; The Royal Swedish Institute for Engineering Research: Stockholm, Sweden, 1939; pp. 1–45.
  37. Schlotzhauer, P.; Nelis, P.A.; Bollmus, S.; Gellerich, A.; Militz, H.; Seim, W. Effect of Size and Geometry on Strength Values and MOE of Selected Hardwood Species. Wood Mater. Sci. Eng. 2015, 12, 149–157. [Google Scholar] [CrossRef]
  38. Astrup, T.; Clorius, C.O.; Damkilde, L.; Hoffmeyer, P. Size Effect of Glulam Beams in Tension Perpendicular to Grain. Wood Sci. Technol. 2007, 41, 361–372. [Google Scholar] [CrossRef]
  39. Pedersen, M.U.; Clorius, C.O.; Damkilde, L.; Hoffmeyer, P. A Simple Size Effect Model for Tension Perpendicular to The Grain. Wood Sci. Technol. 2003, 37, 125–140. [Google Scholar] [CrossRef]
  40. Ashaari, Z.; Lee, S.H.; Mustamel, M.N.; Salleh, N.F.M. Strength Improvement of Jelutong (Dyera costulata) Wood Via Phenolic Resin Treatments. J. Indian Acad. Wood Sci. 2015, 12, 132–136. [Google Scholar] [CrossRef]
  41. Ahmad, Z.; Lum, W.C.; Lee, S.H.; Razlan, M.A.; Mohamad, W.H.W. Mechanical Properties of Finger Jointed Beams Fabricated from Eight Malaysian Hardwood Species. Constr. Build. Mater. 2017, 145, 464–473. [Google Scholar] [CrossRef]
  42. Horáček, P.; Fajstavr, M.; Stojanović, M. The Variability of Wood Density and Compression Strength of Norway Spruce (Picea abies/L./Karst.) within The Stem. Beskydy 2018, 10, 17–26. [Google Scholar] [CrossRef] [Green Version]
  43. EN 1912: 2012; Structural Timber—Strength Classes—Assignment of Visual Grades and Species. European Committee for Standardization: Geneva, Switzerland, 2012.
  44. Hannouz, S.; Collet, R.; Butaud, J.; Bléron, L.; Candelier, K. Mechanical Characterization of Heat-Treated Ash Wood in Relation with Structural Timber Standards. Sci. J. Field Wood Eng. 2015, 11, 3–10. [Google Scholar]
  45. ObinnaOsuji, S.; Inerhunwa, I. Characterization and Strength Classification of Timber Species in Akwa Ibom State, Nigeria for Structural Engineering Applications. Int. J. Eng. Res. Appl. 2017, 7, 1–9. [Google Scholar]
  46. Ravenshorst, G.; Gamper, N.; Vries, P.D.; Van de Kuilen, J.W.G. Determination of the shear strength of tropical hardwood timber. In Proceedings of the 14th World Conference on Timber Engineering (WCTE 2016), Vienna, Austria, 22–25 August 2016; pp. 23–25. [Google Scholar]
  47. Baharin, A. Development of Characteristic Value for Bending Strength Properties of Selected Malaysian Tropical Hardwood Timber in Accordance with Eurocode 5. Ph.D. Thesis, Universiti Teknologi MARA, Selangor, Malaysia, 2020. [Google Scholar]
Figure 1. Location of the growth areas of the samples in Malaysia.
Forests 13 01172 g001
Figure 2. Test setup for determining compressive strength properties parallel to the grain.
Forests 13 01172 g002
Figure 3. Test setup for determining compressive strength properties perpendicular to the grain.
Forests 13 01172 g003
Figure 4. Relationship between compressive strength parallel to the grain and modulus of elasticity for selected Malaysian tropical hardwood timber.
Forests 13 01172 g004
Figure 5. Relationship between compressive strength perpendicular to the grain and the modulus of elasticity for selected Malaysian tropical hardwood timber.
Forests 13 01172 g005
Figure 6. Relationship between compressive strength parallel to the grain and density for selected Malaysian tropical hardwood timbers.
Forests 13 01172 g006
Figure 7. Relationship between compressive strength perpendicular to the grain and density for selected Malaysian tropical hardwood timbers.
Forests 13 01172 g007
Figure 8. Relationship between experimental and derivative compressive and bending strength characteristic values.
Forests 13 01172 g008
Table 1. Densities, strength group, dimension and number of specimens used.
SpeciesAir-Dry Density (kg/m3) 1Strength Group (SG) 2Grain DirectionDimension (mm)Number of SpecimensLoading Rate
(mm/s)
Balau850–1155SG 1Parallel100 × 150 × 6001000.023
75 × 150 × 4501000.02
Perpendicular45 × 70 × 902000.009
Kempas770–1120SG 2Parallel100 × 150 × 6001000.023
75 × 150 × 4501000.02
Perpendicular45 × 70 × 902000.009
Kelat495–1010SG 3Parallel100 × 150 × 6001000.022
75 × 150 × 4501000.023
Perpendicular45 × 70 × 902000.008
Resak655–1155SG 4Parallel100 × 150 × 6001000.023
75 × 150 × 4501000.02
Perpendicular45 × 70 × 902000.008
Kapur575–815SG 4Parallel100 × 150 × 6001000.023
75 × 150 × 4501000.019
Perpendicular45 × 70 × 902000.008
Keruing690–945SG 5Parallel100 × 150 × 6001000.022
75 × 150 × 4501000.018
Perpendicular45 × 70 × 902000.009
Mengkulang625–895SG 5Parallel100 × 150 × 6001000.022
75 × 150 × 4501000.018
Perpendicular45 × 70 × 902000.009
Light Red Meranti385–755SG 6Parallel100 × 150 × 6001000.02
75 × 150 × 4501000.016
Perpendicular45 × 70 × 902000.01
Geronggang350–610SG 7Parallel75 × 125 × 4501000.02
50 × 125 × 3001000.016
Perpendicular45 × 70 × 902000.008
Total number specimens 3600
Source: 1 Air-dry densities obtained from 100 Malaysian Timbers: 2010 Edition [20]; 2 MS 544: Part 2 [5].
Table 2. Compressive strength properties at 12% moisture content of selected Malaysian tropical hardwood timber with different sizes loaded under different grain directions.
SpeciesGrain DirectionSize (mm)nCompressive Strength (MPa)MOE (MPa)
Balau (SG1)100 × 150 × 60010055.3 (15.2) c16,809 (14.2) f,g
75 × 150 × 45010054.4 (13.7) d,e16,118 (15.7) h,i
45 × 70 × 9020014.7 (20.3) n1377 (31.6) l
Kempas (SG2)100 × 150 × 60010062.6 (14.7) b21,985 (12.4) b
75 × 150 × 45010063.4 (14.0) a22,580 (17.8) a
45 × 70 × 9020012.1 (23.3) o1167 (30.8) l,m
Kelat (SG3)100 × 150 × 60010046.4 (11.0) f18,388 (15.9) d
75 × 150 × 45010043.3 (14.8) g,h17,853 (24.0) e
45 × 70 × 9020010.1 (26.0) p1371 (45.1) l
Resak (SG4)100 × 150 × 60010054.1 (15.2) e22,300 (17.2) a,b
75 × 150 × 45010055.8 (14.0) c,d20,422 (19.2) c
45 × 70 × 9020017.7 (26.7) m1638 (47.5) l
Kapur (SG4)100 × 150 × 60010041.4 (8.8) i17,646 (22.1) e
75 × 150 × 45010043.9 (12.6) g16,953 (19.1) e,f
45 × 70 × 902005.3 (24.3) r532 (40.4) m,n
Keruing (SG5)100 × 150 × 60010042.5 (17.1) h.i16,401 (16.5) g,h
75 × 150 × 45010044.5 (16.9) g,h16,791 (19.7) f,g
45 × 70 × 902006.3 (31.9) q,r615 (61.0) m.n
Mengkulang (SG5)100 × 150 × 60010039.1 (11.1) i16,401 (21.3) i
75 × 150 × 45010037.4 (14.4) j16,791 (25.6) h,i
45 × 70 × 902007.5 (22.5) q691 (43.3) m,n
Light Red Meranti (SG6)100 × 150 × 60010031.3 (16.6) k11,057 (15.6) j
75 × 150 × 45010028.1 (12.4) l10,768 (13.5) j,k
45 × 70 × 902003.3 (21.9) s251 (34.0) n
Geronggang (SG7)75 × 125 × 45010028.1 (11.1) l10,180 (20.2) k
50 × 125 × 30010026.1 (14.1) l11,013 (15.6) j,k
45 × 70 × 902003.4 (36.9) s377 (60.1) n
Note: ∥ = Parallel to grain; ⊥ = perpendicular to grain; n (Table header) = number of replicates; Means followed by the different superscript letters in the same column are significantly different according to the Duncan’s Multiple Range Test at p ≤ 0.05; Values in parentheses are coefficient of variation (%).
Table 3. Characteristic values of compressive strength parallel to the grain, modulus of elasticity and density for nine species of selected Malaysian Hardwood timber.
Compressive Strength (MPa)Modulus of Elasticity (MPa)Density (kg/m3)
Speciesfc,0,12fc,0,kEc,0,meanEc,0,kρmeanρk
Balau54.738.216,43916,786912805
Kempas62.943.922,18022,647879716
Kelat44.932.218,10918,491887731
Resak54.137.621,13221,567992813
Kapur43.032.317,38317,749782655
Keruing43.528.116,58816,937868674
Mengkulang37.526.915,69815,563663541
Light Red Meranti29.519.710,91311,143488361
Geronggang26.918.210,57210,795557445
Note: fc,0,12 = Mean compressive strength at 12% moisture content; fc,0,k = Characteristic value of compressive strength, Ec,0,mean = Mean modulus of elasticity at 12% moisture content; Ec,0,k= Characteristic value of modulus of elasticity; ρmean = Mean density at 12% moisture content; ρk= Characteristic value of density.
Table 4. Comparison of strength classes specified in EN 338, MS 544: Part 3 with experimental characteristic values.
Strength Classfc,0,k (MPa)Ec,0,k (GPa)ρk (kg/m3)
EN 338 [11]
BalauD5030.014.0620
KempasD6033.017.0700
KapurD6033.017.0700
KeruingD5030.014.0620
MS 544: Part 3 [6]
MengkulangD4027.013.0550
Light Red MerantiC2220.010.0340
Experimental Value
Balau 38.216.4805
Kempas 43.922.2716
Kapur 32.317.4655
Keruing 28.116.6674
Mengkulang 26.915.7541
Light Red Meranti 19.710.9361
Note: fc,0,k = Characteristic value of compressive strength; Ec,0,k = Characteristic value of modulus of elasticity; ρk= Characteristic value of density.
Table 5. Experimental characteristic values of compressive and bending strength with the values in EN 338 [11] for the respective strength class.
SpeciesStrength Classfm,k (MPa)EN 338: 2016fc,0,k (MPa)ρmean (kg/m3)
BalauD5555.03238.2912
KempasD5050.43043.9879
KelatD4044.62732.2887
ResakD4546.82937.6992
KapurD4546.82932.3782
KeruingD4545.42928.1868
MengkulangD3544.62526.9663
Light Red MerantiC2023.91919.7488
GeronggangC1617.91718.2557
Note: fm,k = Experimental bending characteristic strength; fc,0,k = Experimental compressive characteristic strength; ρmean = Experimental mean density.
Publisher’s Note: MDPI stays neutral with regard to jurisdictional claims in published maps and institutional affiliations.

