Article

Suitability Evaluation and Dominant Function Model for Multifunctional Forest Management

1
School of Information Science and Technology, Beijing Forestry University, Beijing 100083, China
2
Engineering Research Center for Forestry-Oriented Intelligent Information Processing, National Forestry and Grassland Administration, Beijing 100083, China
3
Forestry Information Research Institute, Beijing Forestry University, Beijing 100083, China
*
Author to whom correspondence should be addressed.
Forests 2020, 11(12), 1368; https://doi.org/10.3390/f11121368
Submission received: 21 November 2020 / Revised: 17 December 2020 / Accepted: 19 December 2020 / Published: 21 December 2020

Abstract

:
Multifunctional forest management is a common topic and hotspot of forestry research in recent years. Evaluating the suitability of forest land for multifunctional management is the first and most important step for realizing sustainable and multifunctional forest management. This research aims to explore the suitability and forest dominant function evaluation model for multifunctional forestry management in Guangxi Zhuang Autonomous Region of China. Using the model proposed in the paper, we expect to provide decision-making information for forest multifunctional management. The study incorporated the distance of the ridge lines extracted by the Digital Elevation Model (DEM) data into the evaluation index, and established the ecological status index (IE) and the forest productivity index (IF). Moreover, a nonlinear multifunctional site quality evaluation model (MSQEM) was constructed to evaluate the suitability of multifunctional forest management. A multifunctional management dominant function orientation model (MDFOM) was constructed by Principal Component Analysis, and divided each subcompartment into one of the four resource subgroups, such as timber production function, water conservation function, water and soil conservation function, and other functions. The MDFOM model was used for Rongshui County’s forest resource by 11 factors, which were selected because of their easy availability. The factors contain slope, soil thickness, altitude, average age, etc. The results showed that the number of small classes with multifunctional site index larger than 0.5 was 20,841 (56.87%), and the multifunctional suitable area was in clustered distribution, which was consistent with the reality. The result of subcompartment dominant function evaluated by MDFOM was compared with the planning forest species, the overall accuracy was 61%, and the accuracy rate of timber production function was 94.2%. The number of subcompartments with good and above multifunctional management status was 9174 (44.20%), with an area of 48,963.41 hm2 (51.24%). The multifunctional management status of subcompartments in the study area is at the middle and lower level. Thus, it is urgent to further improve the multi-functional management level of each subcompartment in this area and formulate scientific reasonable and multifunctional forestation measures.

1. Introduction

Forest management should be directed towards multifunctional management and utilization of forest services in order to achieve maximum utilization and minimum degradation [1]. The implementation of forest multifunctional management can enable the forest in a certain area to produce wood and perform two or more functions, such as water conservation, water and soil conservation, carbon fixation and oxygen release, and biodiversity protection [2]. Giving full play to the multifunctional role of forests is of great significance to the sustainable development of forests [3,4,5]. Currently, how to develop the multiple functional values of forests through precise and scientific forest management, and construct multifunctional forestry that integrates multiple functions has become the mainstream of forestry development research [5,6]. At the same time, research on the multifunction evaluation index, evaluation method, and the relationship between forest multifunction and selected indexes have become hot topics.
The basic principle of forest management is “suitable for trees in the right place”, and the first step is suitability evaluation. The basis of the suitability evaluation of forest management is to comprehensively consider the production potential of a given forest or stand under a certain site condition. It is an evaluation of the suitability and use value of the main tree species, which is usually called site quality evaluation [7,8]. Traditional site quality evaluation methods include multiple linear regression methods [9], quantitative methods [10], etc. In recent years, with the development of machine learning technology, neural networks [11,12], Random Forest [10], and other machine learning algorithms have been gradually applied to site quality evaluation. In terms of site quality evaluation, there have been a lot of studies done by scholars at home and abroad, and the techniques are relatively mature. For the evaluation of forest multifunctional sites, Guo Hong, Lu Yuanchang et al. [13] realized classification and mapping of ecological land type and ecological land type phase at two levels by using contour line of Guangxi Zhuang Autonomous Region and attribute data from forest resource inventory. Naser, Sasan combined RS, GIS, and MCDA to construct a method to assess land suitability and address the complex land allocation problem in forest areas [14]. Kärkkäinen [15] explored the impact of land use zoning decisions on forest timber production, carbon sinks, scenic recreation and recreation, and other forest functions. The research in this aspect mainly focuses on the study of the influence of site division on a certain function of forest multifunction, and there are few qualitative and quantitative studies on the suitability of multifunction management.
Many scientists have given more and more focus on forest multifunctional evaluation in recent years, and their researches related to the concept, theory, and evaluation of forest multifunction. For example, forest water conservation function evaluation [16,17,18,19,20], forest productivity evaluation [21], forest biodiversity evaluation [22,23,24], forest ecotourism function evaluation [25], and carbon sequestration and oxygen release function evaluation [26,27]. The method of forest multifunctional evaluation mainly adopts qualitative or a combination of quantitative and qualitative methods, combined with techniques such as mathematics and geographic information systems. Moreover, the comprehensive evaluations are conducted through the application of several evaluation methods or multidisciplinary methods. For example, Lopinski and Lukasz [28,29] proposed a set of reliable evaluation standards for stand status to meet the needs of pro ecological and multifunctional forest management, and classified and verified the stand types of Ostrow mazowiecka forest region according to the demand of multifunctional forest conversion. Zhang Mengya, Wang Xinjie [30], Huang Yao [31], Zhao Jing [32], and other scholars used the analytic hierarchy process (AHP) based on expert scoring to evaluate the multifunction of plantation. Some scholars have carried out forest multifunction evaluation through economic analysis method and mathematical model method [16]. For example, Wang Rongxin and Kong Qingyun [33] used the principal component analysis method to evaluate the multifunctional status of Platycladus orientalis (L.) Franco Plantation in the Mentougou District of Beijing. In general, the current research on the evaluation of forest multifunctional functions is still in its infancy, and the dominant functional division of forest land classification and function recognition still needs to be further developed.
The single function evaluation method at present fails to meet the needs of multifunctional management. Moreover, the evaluation of forest management adaptability should focus more on its multifunctions instead of a certain function. Therefore, this article will focus on the multifunctional management of forests. By studying the relationship between forest multifunctional and forest resource investigation factors, and selecting appropriate factors, we constructed a multifunctional management evaluation system, and studied the forest multifunctional management evaluation model based on principal component analysis. Taking the forest resource group in Rongshui County of Guangxi as an example, we carried out the evaluation of the adaptability of multifunctional management and used the evaluation results to explore the dominant functions, which would provide a scientific basis for quantitative analysis and evaluation of the status of multifunctional forest management. The model we constructed can not only satisfy the demand for multifunctional and sustainable development of forests, but also provide scientific management advice for specific forest managers such as those of forest farms, which has both scientific management (theoretical) value and easy to obtain (practical) significance of indicators.

2. Materials and Methods

Forest multifunctions have been divided into six functions: water conservation function, carbon fixation and oxygen release function, biodiversity function, soil and water conservation function, forest recreation function, and wood production function by most research scholars. Through the multifunctional forest management research related literature, the factors of forest multifunction research are shown in Table 1. This study combined previous studies with forest resources survey data in the study area to screen out relevant factors, and construct the following research methods, please refer to Figure A1 for detailed method flow.
(1) Based on Forest Resource Class II survey data of two periods and Digital Elevation Model (DEM) data, a multifunctional forest suitability evaluation model was constructed. DEM data was used to extract the ridge lines of the study area and obtain the distance between the subcompartment and the ridge line; the slope, altitude, age, and average height of dominant trees in the second-category survey data were selected to construct the multifunctional suitability evaluation model for the management unit level subcompartments in the study area and obtain the subcompartments set suitable for multifunctional management.
(2) On the basis of the evaluation results of multifunctional management suitability, 11 factors including slope, soil thickness, canopy density, altitude, average age, average tree height, average tree diameter at breast height(DBH), number of plants per hectare, volume per hectare, distance from ridge lines, and distance from river were selected as indicators to establish structure and function evaluation system model, which was used to evaluate the dominant function of subcompartments.
a. Principal component analysis: analysis and extraction of those principal components, then factor score to determine the principal component, and several leading functions. R language was used for principal component analysis.
b. Based on the principal component analysis, a multifunctional comprehensive evaluation model was constructed to evaluate the multifunctional operation of small classes in the study area.

2.1. Data Source and Processing

2.1.1. Research Area

Rongshui Miao Autonomous County is a county under the jurisdiction of Liuzhou Prefecture of Guangxi Zhuang Autonomous Region. It is located in the northern part of the autonomous region and adjacent to Guizhou Province (Figure 1), and located at latitude 24°47′–25°42′ north and longitude 108°32′–109°27′ east. The forest coverage rate is as high as 80.85%. The main tree species of the plantation are fir (Cunninghamia lanceolata (Lamb.)Hook) and Masson pine (Pinus massoniana Lamb), and it is one of the key forestry counties in Guangxi. The terrain of the county is high in the middle part and low in the surrounding areas. The central and western parts of the county are in the middle of the mountain area, and the southeast and northeast part are low mountain areas. The southern end is hilly karst area, which is relatively gentle and is called the County Plain. Melt-water is located in the north of the Tropic of cancer, belonging to the typical subtropical monsoon climate. The climate here is mild and rainfall is abundant, but the distribution is uneven. The average annual fall is 2100–2500 mm, and the temperature difference between North and South is large in winter and small in summer with the annual value between 18.6–19.8 °C.

2.1.2. Data Processing

In this study, the data collection of Rongshui County mainly includes attribute data and graphic data. The data sources include the second-category survey data and DEM data of Rongshui County.
The attribute data include: the second-category survey data of Rongshui County in 2017. The subcompartment survey data include: subcompartment area, landform, altitude, aspect, slope position, slope, parent rock, soil type, soil layer thickness, soil texture, land type, forest type, management type, canopy density, age group, age class, average age, average DBH, average tree height, average sectional area, number of plants per hectare, volume per hectare, etc.
The graphic data includes: Rongshui County’s 2017 forest resource subcompartment vector diagram, and Rongshui County’s 12.5 M resolution DEM digital elevation data in 2020, which was obtained from the website of ASF Data Search [37].
(1) According to the selected forest structure factors such as slope, canopy closure, average diameter at breast height, number of plants per hectare, accumulation per hectare, age group, altitude, average age, average tree height, age class and other forest structure factors, subcompartment data were screened, and some abnormal data and missing data were eliminated; the four tree species that are commonly used in Rongshui County: fir, eucalyptus (Eucalyptus robusta Smith), Masson pine, and other tree species are selected as the basic data for the research. Finally, 36,656 subcompartments were selected. The statistical table of small class tree species after screening is shown in Table 2.
(2) Due to the inconsistency of projection coordinate system between DEM data and subcompartment vector data, the study converted them into GCS_ In china2000 coordinate system. By using hydrological analysis in ArcGIS and DEM data of 12.5 m, the ridge line and the nearest distance between geometric center of subcompartment and ridge line were extracted.

2.2. Methods

2.2.1. Multifunctional Site Quality Evaluation Model (MSQEM)

For the division of multifunctional forest, the principle is suitable for the site and trees. The woodland with important ecological status, ecologically fragile area, and relatively barren land is classified as ecological forest, while the forest land with unimportant ecological status, relatively high soil fertility, and the ecological environment is not easy to be damaged by logging is classified as timber forest, and a multifunctional forest is between ecological forest and timber forest. Those forests with general ecological status and soil fertility should be divided out and put into multifunctional management to make them exert ecological and economic benefits, because if these areas simply carry out wood production and management, it is easy to destroy the ecological environment, and if ecological protection and closed mountains for forest cultivation are carried out simply, the productivity of forest land will be limited.
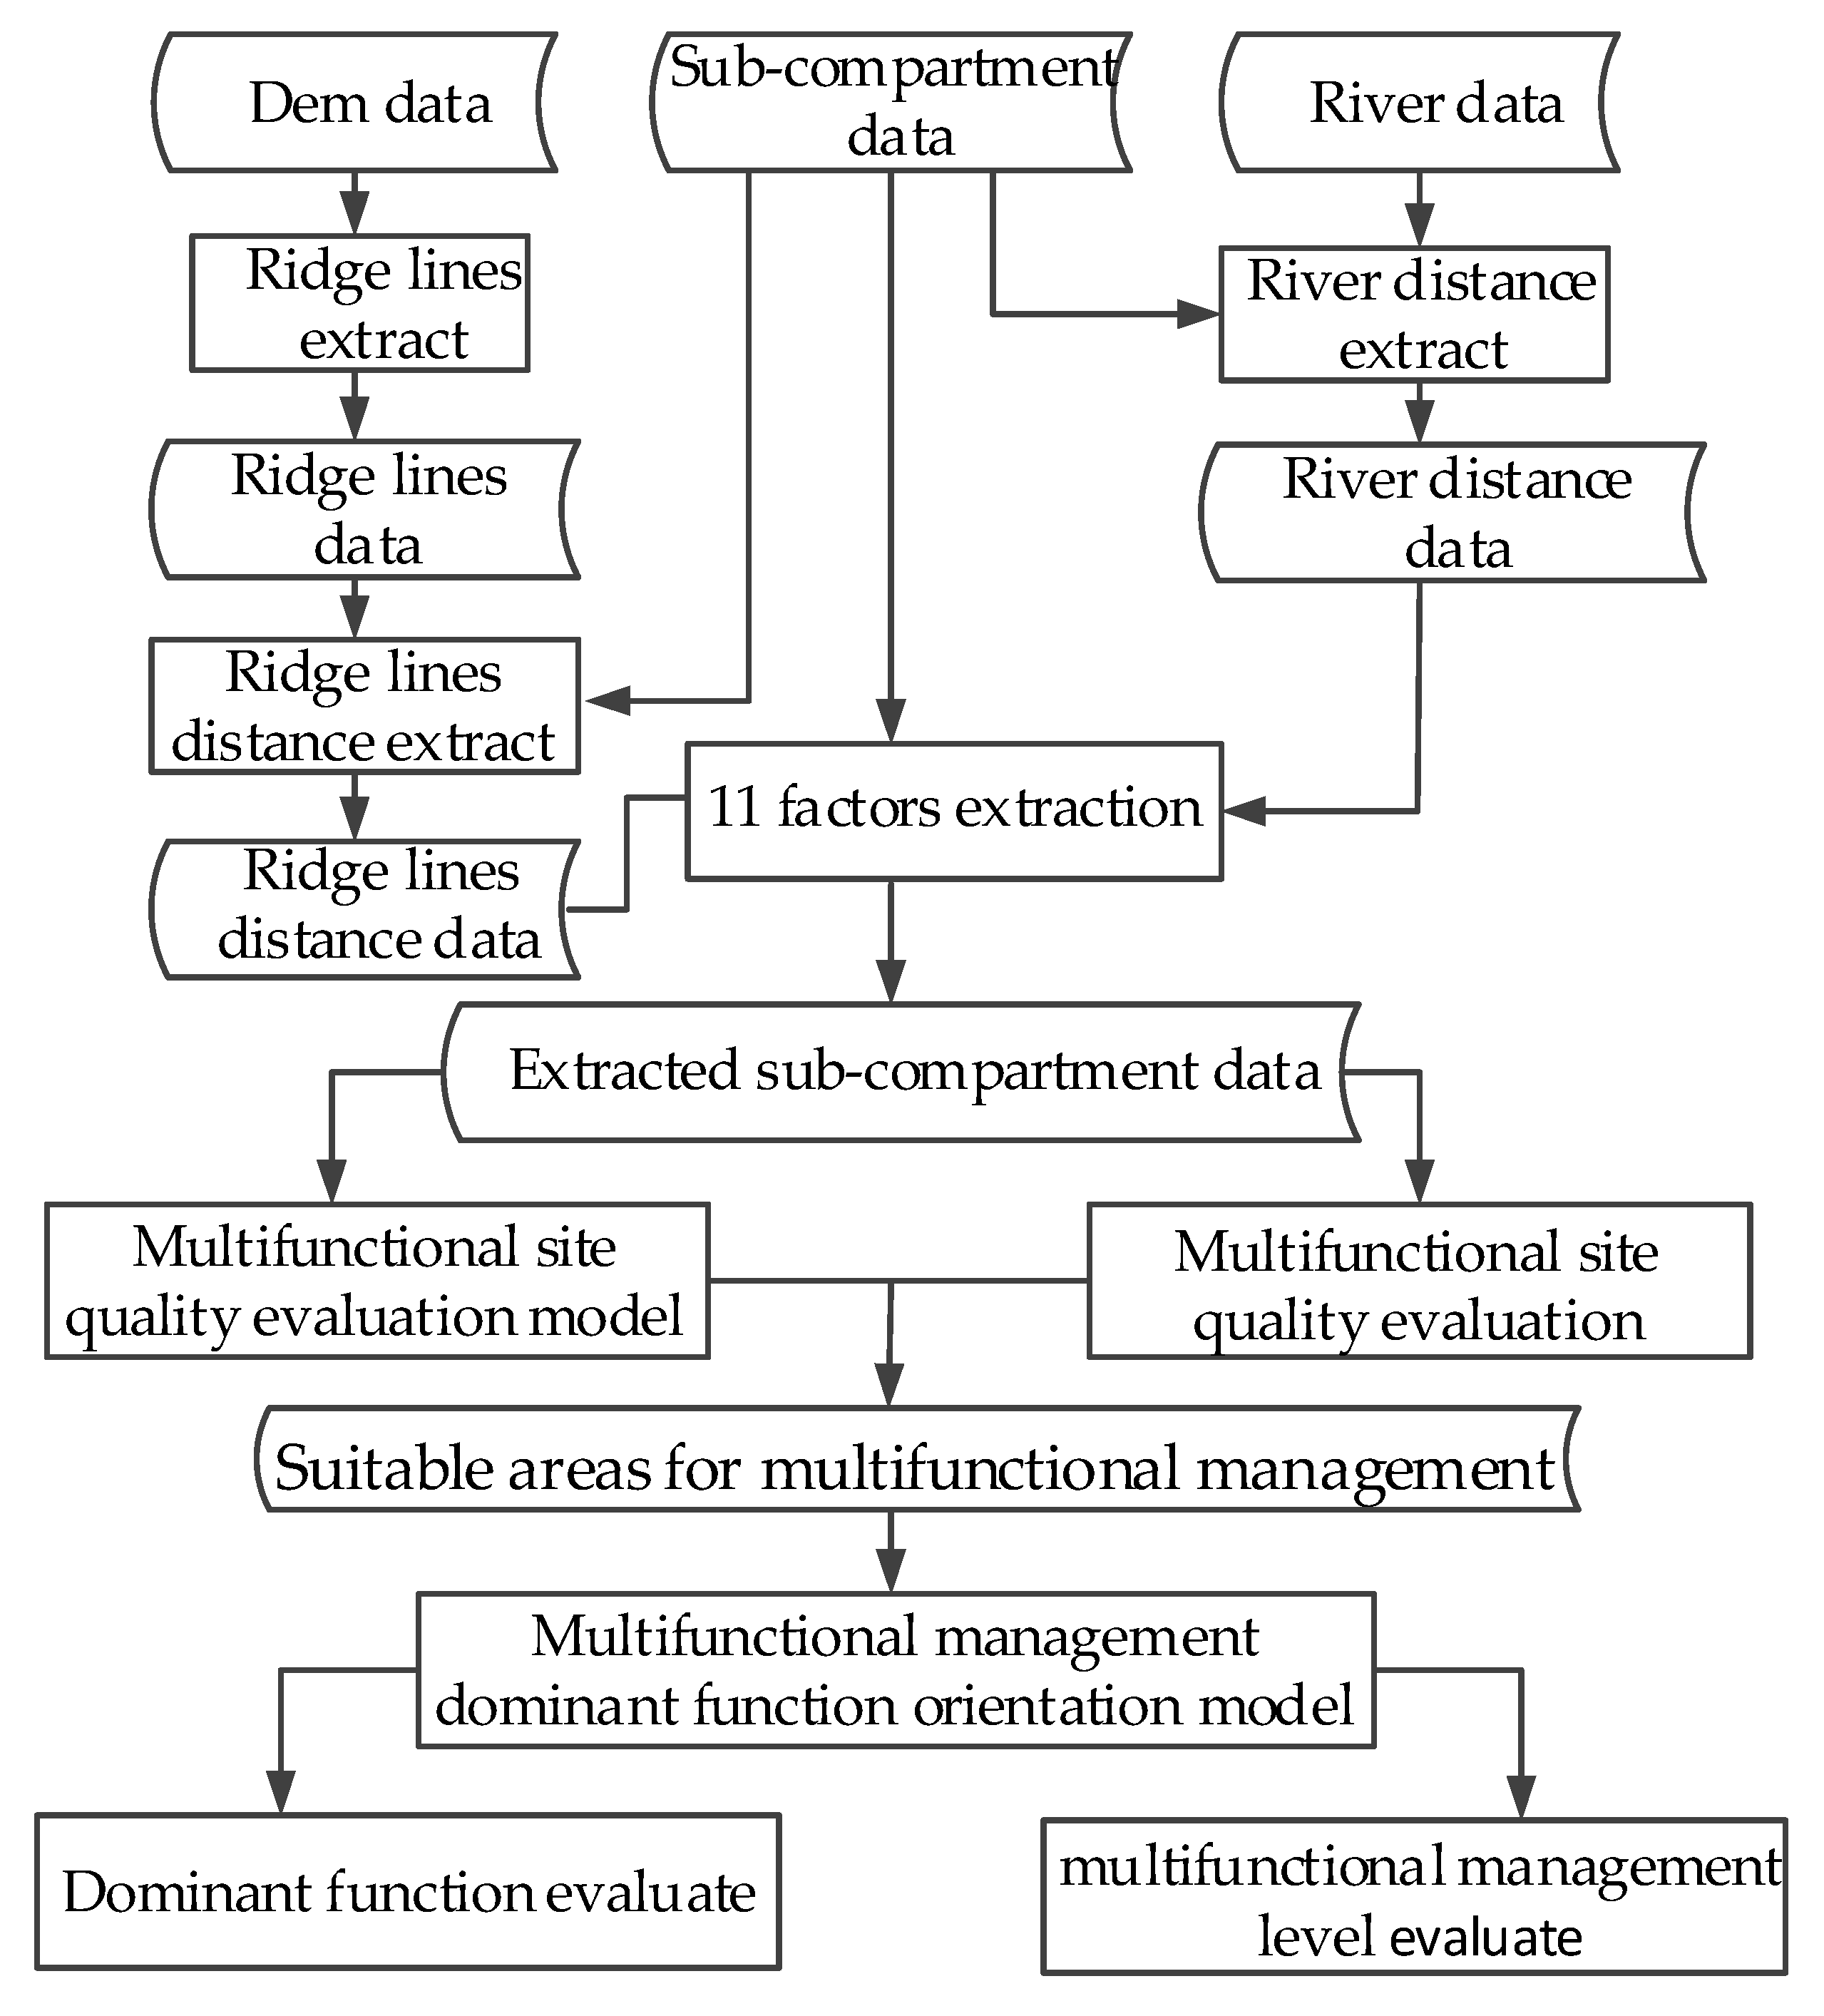
For ecological vulnerability analysis, environmental factors are generally used for indexing calculations. The methods for evaluating sites based on environmental factors are usually climatic index method, geological landform method, geographical land classification method, and soil site evaluation method. Slope is an important index to judge the ecological vulnerability, and the higher the slope is, the easier the soil is to be eroded. The thinner the soil layer is, the more difficult it is for forest restoration. Therefore, a high slope is generally used as an indicator for the ecological forest. The higher the relative elevation is, the more important the water conservation function is. In the high altitude forest land, the cost of afforestation is high, and the disturbance is small, and the biodiversity is rich. Therefore, it is the key area of biodiversity protection. Ridge lines, also known as watershed, can determine the basin of a river. The closer it is to the ridge line, the more important the function of soil and water conservation is, and the more easily the ecological environment is destroyed. The slope (SL), relative elevation (HM), and distance from ridge lines (RD) were selected as evaluation indexes to construct the important index of ecological status.
IEi is an important index of ecological status, ranging from 0–1, which is calculated by Equation (1).
I E i = S L i S L m a x + H M i H M m a x + R D m a x R D i R D m a x R D m i n 3
SLmax is the maximum slope of the forest in the forest area, with an extreme value of 90, HMmax is the maximum relative altitude of the forest in the forest area, and RDmax and RDmin are the maximum and minimum distances from the ridge lines. The maximum value of IE of 1 indicates that the ecological environment is extremely fragile and the importance of ecological status is the strongest, and the minimum value of IE of 0 means that the ecological environment is extremely invulnerable and the importance of ecological status is extremely low.
IFi is the productivity index of the stand of i, which is calculated by Equation (2), which represents the quality of the site. Site quality can be evaluated by site index, which refers to the average tree height of dominant trees at a specific base age [38]. In the paper, the ratio of average height of stand age i to average height of dominant trees under current tree age i was taken as productivity index. Hi is the average height of tree species in stand i, and Himax is the simulated value of the optimal site index guide curve at the age of the tree species planted in stand i. In the growth curve cluster of dominant height, there is an average height growth curve called guide curve, which represents the change of dominant height with stand age under medium site conditions. The optimal site index guide curve and the guide curve have the same shape curve type, which can be solved by translating the guide curve in a certain proportion [38]. The basic assumption of site evaluation: There will be similar high growth and volume growth process under the same site conditions and stand types, structure, and density [39]. Chen Yuling used quantile regression to quantify the theoretical hypothesis and extract suitable forest land rules [40]. Quantile regression can explore the complete distribution of the predicted variables, so it can be used to solve the optimal site index guidance curve. Chen Yuling [40] used the growth equation of one-third and two-thirds quantile regression theory to divide the suitable stand into the most suitable, suitable, and unsuitable. The relative advantage height method is one of the methods to solve the site index guide curve, which is solved by adjusting coefficient translation [41]. The model of relative advantage height method is similar to quantile regression theory. The 0.9 quantile regression can contain 90% data points under the regression curve, which can represent the best site index guidance curve. Because the dominant tree height is rarely investigated in forest resource survey, the site index guidance curve is constructed by using the 0.9 quantile of stand average tree height.
I F i = H i H i m a x
The tree height and age growth relationship curve model has common model forms in Table 3. The Mitscherlich model was proposed by Mitscherlich in 1919 to describe the response of plant growth to environmental factors, which is suitable for describing the growth process of broad-leaved trees or conifers that grow faster at the beginning and have no inflection points. The logistic equation was first constructed by Verhulst to describe population growth, and became the most commonly used model to simulate population dynamics. It is more suitable for describing the growth of slow-growing tree species than other tree species with faster growth. Gompertz equation was first constructed by Gompertz in 1825. It is a typical “s” shape growth curve with initial value, which is suitable for describing tree growth. The Korf equation was proposed by Czechoslovak forestry worker Korf in 1939. At present, it is mostly used to describe the growth of tree height and DBH. Richards equation was extended by Richards based on von Bertalanffy growth theory in 1959, which has a wide range of adaptability to tree growth [38]. The study used the models in Table 3 as candidate models for regression analysis and constructed the research tree species-oriented index equation. There are many researches on the site quality of timber forests, while the sites of ecological forests are mostly artificially demarcated in accordance with national policies, and there is no scientific basis for the classification of multifunctional forests. The multifunctional forest divides the interval between the ecological forest and the timber forest. Therefore, the compromise site conditions of the ecological forest and the timber forest are taken. The principle of multifunctional site selection is to choose the forest land with general ecological fragility and general forest productivity. Important Index of Ecological Status (IEi) and Productivity Index (IFi) were introduced to construct a multifunctional forest site quality, as shown in Formula (3). The model can distinguish ecological forests, multifunctional forests, and timber forests according to its classification standards. IMi is the multifunctional forest site quality of i stand, between 0–1. When its value is 0, it means the most unsuitable condition for multifunctional forest management, and when its value is 1, the site index of functional forest is the highest, which means the most suitable multifunctional forest management, namely multifunctional forest has the highest site index. When IMi is greater than 0.5, the ecological forest and timber forest sites are both at a medium level and suitable for multifunctional forest management; if IMi is less than 0.5 and IF is greater than IE, timber forest management is suitable; when IMi is less than 0.5, IF is less than IE, ecological forest management is suitable.
I M i = 1 | I E i I F i | | I E i 0.5 + ( I F i 0.5 ) 2 |

2.2.2. Multifunctional Management Dominant Function Orientation Model (MDFOM)

Construct a multifunctional evaluation model based on the principal component analysis. The formula is as follows (5). The linear combination of the original indicators is used to calculate the score of each principal component, corresponding to the evaluation score of each function. In the formula, Y is the functional variable of the forest stand, xi is the structural variable, and ai is the variable coefficient.
Y = a 1 x 1 + a 2 x 2 + + a n x n
{ Y 1 = a 11 x 1 + a 12 x 2 + + a 1 n x n Y 2 = a 21 x 1 + a 22 x 2 + + a 2 n x n Y m = a m 1 x 1 + a m 2 x 2 + + a m n x n
Construction of Comprehensive Evaluation Model for Multifunctional Management of Plantation. For each subcompartment, the comprehensive evaluation score of the multifunctional management status is the product of the corresponding eigenvalue of each single function divided by the sum of each eigenvalue, and the model is constructed as Formula (6). In the formula, λi represents the i-th eigenvalue, and Y1 represents the i-th function.
F = i = 1 q Y i λ i i = 1 q λ i = Y 1 λ 1 + Y 2 λ 2 + + Y q λ q λ 1 + λ 2 + + λ q
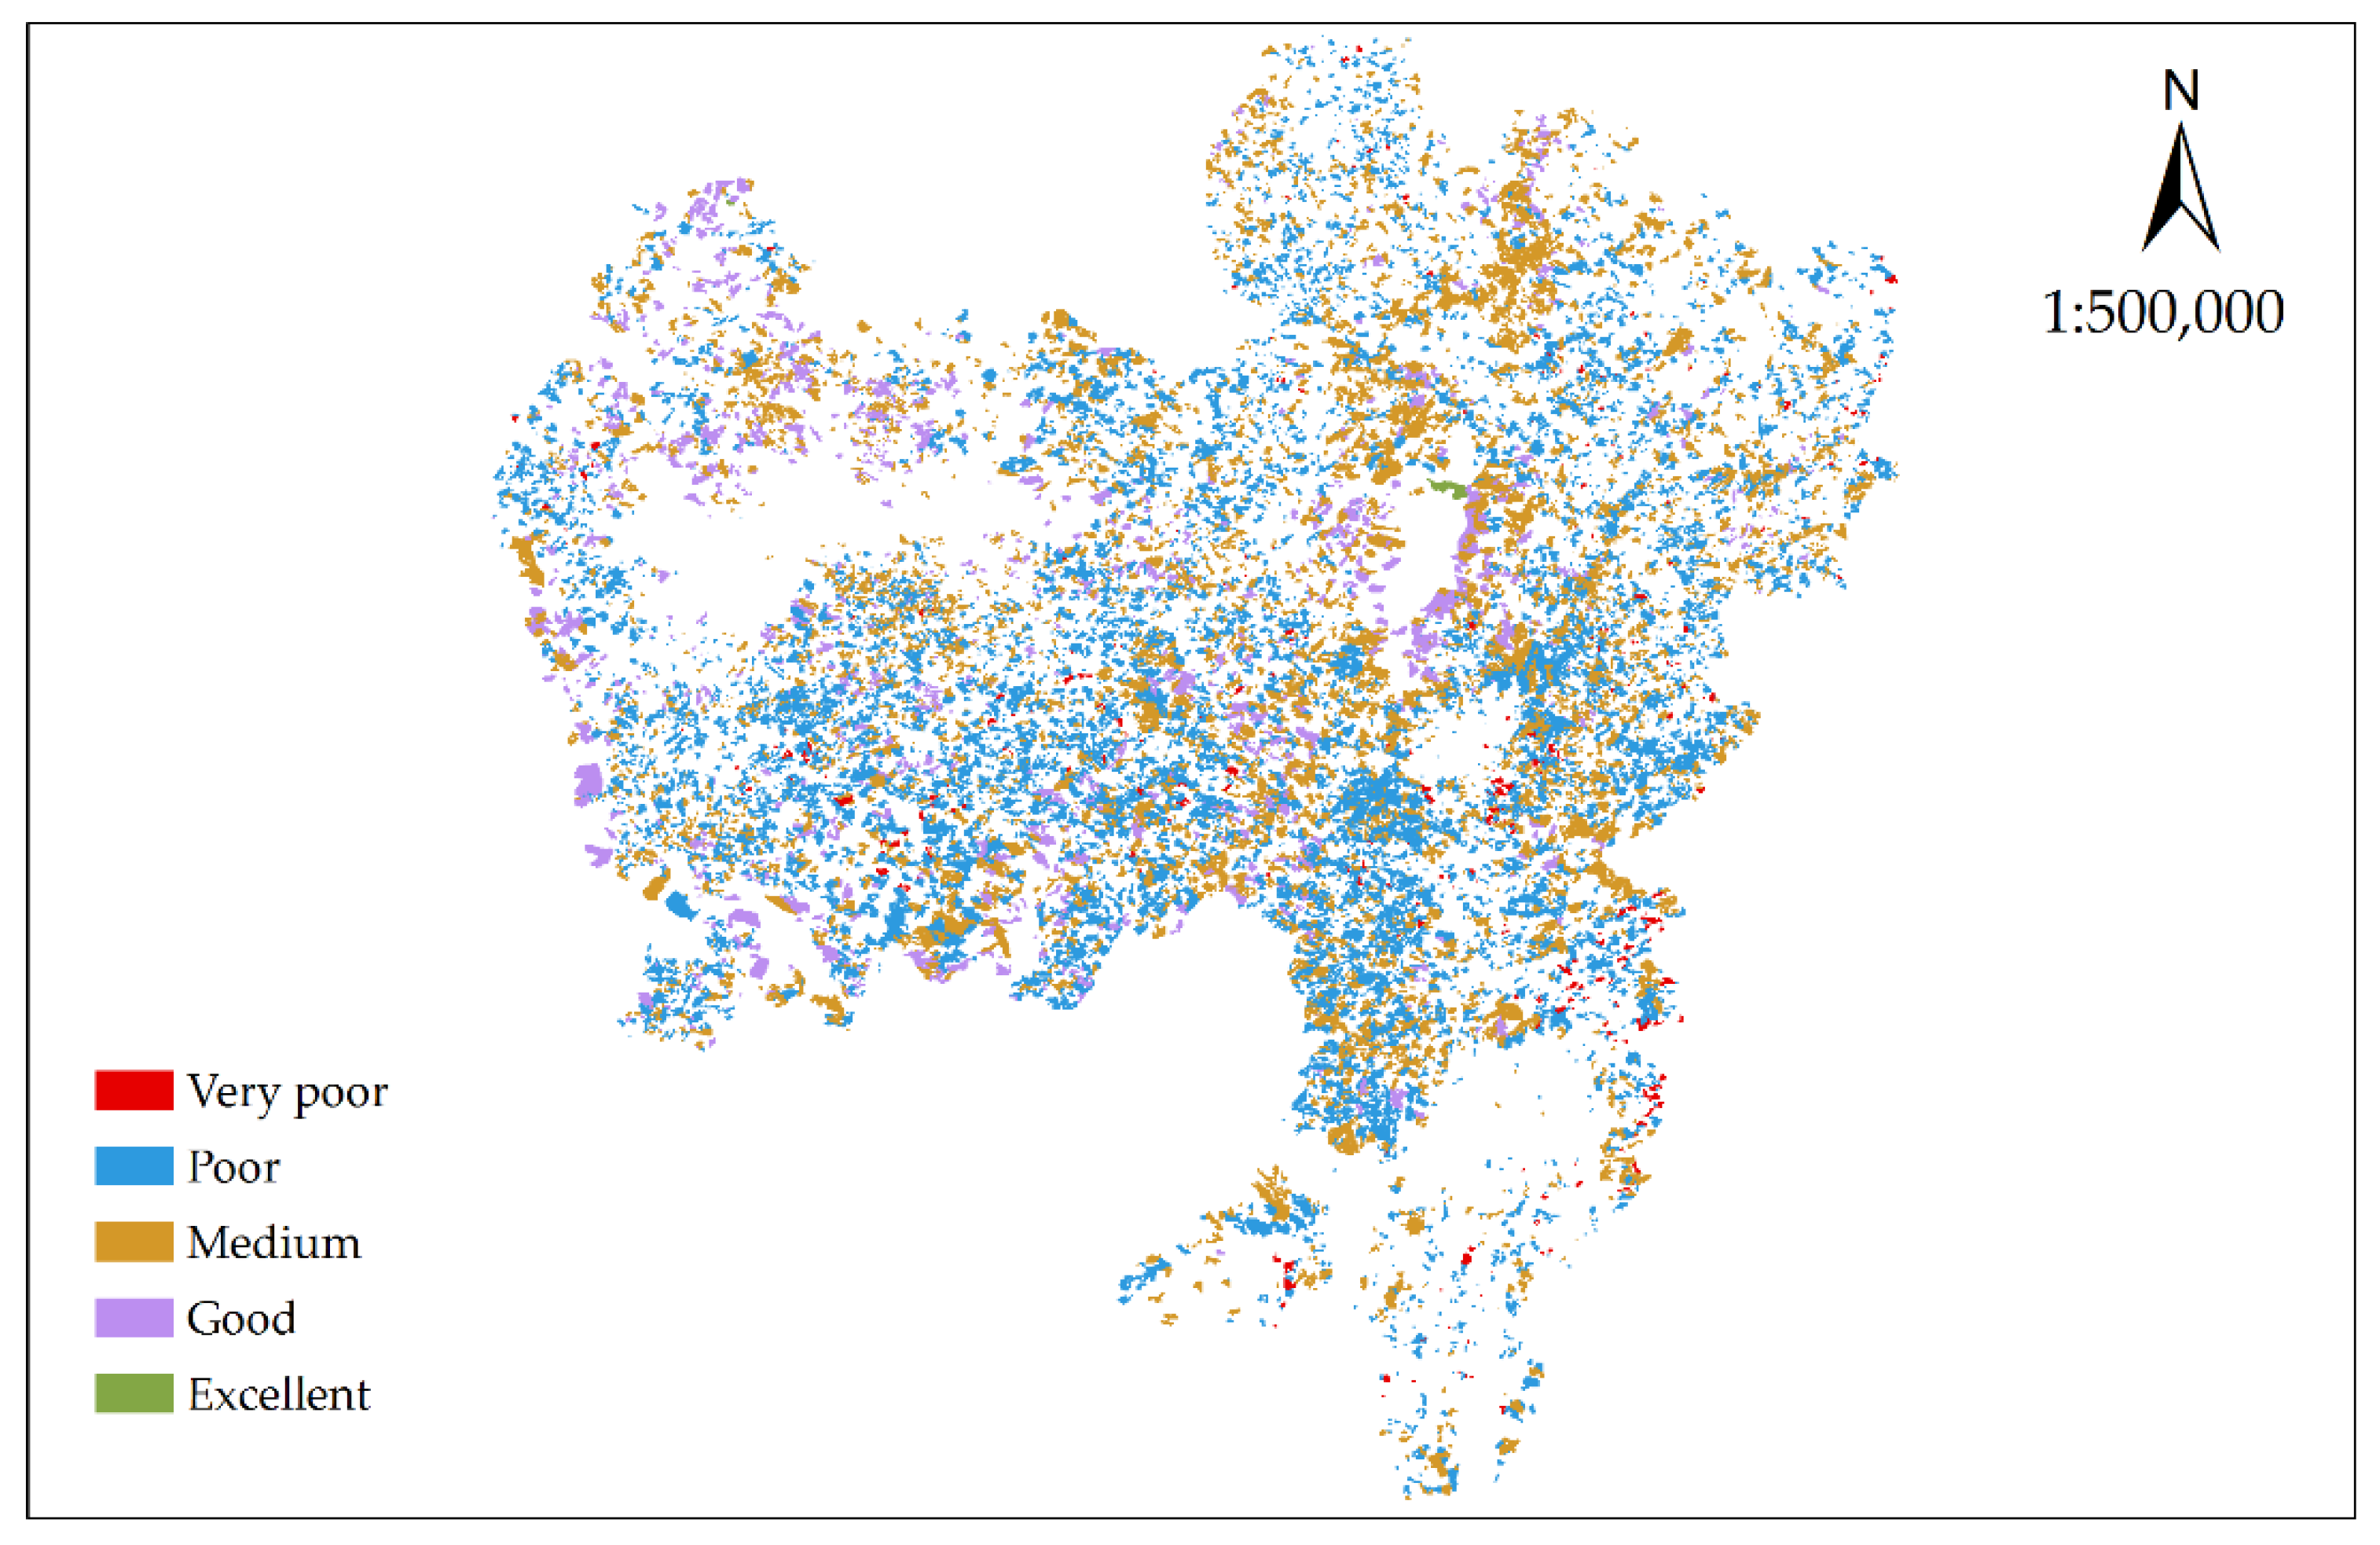
Count comprehensive evaluation score value of multifunctional operation status of each subcompartment was counted. In order to grade division, the value was normalized by Formula (7). According to the comprehensive evaluation score of multifunctional operation status F i * , the forest multifunctional comprehensive evaluation index was used to divide five grades of extreme poor, poor, medium, good, and excellent. In the Formula (7), F i * is the multifunctional comprehensive evaluation value of the i-th sub-compartment after normalization, Fi is the multifunctional comprehensive evaluation value of the i-th subcompartment, Fmin represents the minimum value of the multifunctional comprehensive evaluation of subcompartments, Fmax means the maximum value of multifunctional comprehensive evaluation of subcompartments.
F i * = F i F m i n F m a x F m i n × 100

3. Results

3.1. Multifunctional Site Quality Evaluation

Based on the survey data, the candidate model of site index guidance curve was established for Chinese fir, Masson pine, eucalyptus, and other tree species with average age and average tree height. After estimating the parameters, fitting statistics and comparing the fit statistics of each model, we chose the minimum Root Mean squared Error (RMSE) to get the best regression model, optimal model was selected as the site index guidance curve of the tree species, the candidate models of site index guidance curve are shown in Table A1.
According to the literature, the reference age of Chinese fir, Masson pine, eucalyptus, and other tree species are determined as 20 years, 20 years, 6 years, and 20 years, respectively, and the site index grade distance is 2 m. The site index curve of the same type is constructed by proportion method, and the simulated value of the site index curve was compared with the actual maximum value to determine the optimal site index curve. The stand productivity index was calculated with the actual average tree height and the simulated optimal value, and the multifunctional forest site quality was calculated with the important index of ecological status to evaluate the suitability of multifunctional management. Some evaluation results were shown in Table A2.
The 36,656 subcompartments (with an area of 167,288.18 hectares) obtained after processing the forest resource subcompartment data in Rongshui County of Guangxi were evaluated for the suitability of multifunctional management, the evaluation results were shown in Figure 2. Among them, 20,754 subcompartments (56.61%), with an area of 95,541.39 hectares (57.11%), had a multifunctional site index that was larger than 0.5. The evaluation results indicated that the forest resources subcompartments of Rongshui County are suitable for multi-objective management, and the base of subcompartment is large enough, which can be used for multifunctional management demonstration.

3.2. Evaluation of Dominant Function of Multifunctional Forest Management

3.2.1. Principal Component Analysis

Using expert consultation method and common forest multifunctional constraint factors, the evaluation index system of forest multifunctional management in Rongshui County was constructed. Finally, 11 factors including slope (X1), soil thickness (X2), altitude (X3), average age (X4), canopy density (X5), average tree diameter at breast height (average DBH) (X6), number of plants per hectare (X7), volume per hectare (X8), average tree height (X9), ridge distance (X10), and river distance (X11) were selected as indicators to establish structure and function evaluation system model to evaluate the dominant function of subcompartments.
We used the Forest Resource Class II survey data of Rongshui County to conduct the principal component analysis on 11 structural factors. Through principal component analysis, we obtain the eigenvalue and variance contribution rate of each component. There is information loss in the process of dimension reduction by principal component analysis, so we used variance contribution rate to extract principal component and carry out correlation analysis. The first principal component explained 29.69% of the variance of the data, and the second principal component explained 14.02%, the third principal component explained 10.66%, the fourth principal component explained 9.98%, and the first, second, third, and fourth principal components explained 64.35% in total. Therefore, in overall consideration (Table 4), the eigenvalues of the first four principal components are larger than 1, which indicated that the four principal components can represent the overall functional level of the forest in the study area. So, finally we selected the four principal components to represent the multifunctional level of the plantation in the study area.
As shown in Figure 3, the contribution of the first component in average age, average DBH, volume per hectare, and average tree height was greater; the second principal component was more important in slope, altitude, ridge line distance, and distance from river; the third principal component was more important in canopy density and volume per hectare; the fourth was more important in slope and soil thickness. According to the factor load matrix in Table 5, the first principal component was related to the site conditions, such as average age, average tree height, average DBH, and volume per hectare; therefore, the first component was defined as wood production function; the second principal component had larger load on slope, altitude, distance from ridge line, and distance from river, which are related to water conservation, so the second was defined as water conservation. The third principal component had larger load in canopy density, number of plants per hectare, accumulation per hectare, and distance from ridge line; these factors are related to forest social and cultural functions such as landscape recreation; so the third was defined as other functions. The fourth principal component had larger factor load in slope, soil layer thickness, and distance from river, which are related to soil and water conservation function, so the forth one was temporarily defined as the function of soil and water conservation.

3.2.2. Expression of Multifunctional Evaluation Model

The coupling relationship model between stand structure and function of forest resources subcompartment in Rongshui County was established by setting timber production function as Y1, water conservation function as Y2, soil and water conservation function as Y3, and other functions as Y4. The dominant functions of forest resource subcompartments in Rongshui County were evaluated by the forest structure function coupling model. The scores of wood production function, water conservation function, soil and water conservation function, and other functions of each sub-compartment were calculated respectively. According to the factor loading matrix of the four principal components in Table 5, the dominant function relationship model was established, and the model expression was shown in Formula (8)–(11).
Y 1 = 0.036 x 1 0.051 x 2 + 0.116 x 3 + 0.384 x 4 + 0.298 x 5 + 0.512 x 6 0.273 x 7   + 0.424 x 8 + 0.472 x 9   0.034 x 10   + 0.078 x 11
Y 2 = 0.297 x 1 0.097 x 2 + 0.594 x 3 + 0.098 x 4 + 0.041 x 5 0.090 x 6 0.161 x 7   0.209 x 8 0.206 x 9   0.386 x 10   + 0.519 x 11
Y 3 = 0.527 x 1 + 0.710 x 2 0.053 x 3 + 0.047 x 4 + 0.273 x 5 0.044 x 6 + 0.055 x 7   + 0.010 x 8 0.056 x 9   0.203 x 10   0.298 x 11
Y 4 = 0.118 x 1 + 0.064 x 2 + 0.109 x 3 0.085 x 4 0.480 x 5 0.066 x 6 + 0.650 x 7   + 371 x 8 + 0.272 x 9   0.272 x 10   + 0.143 x 11
Table A3 showed the partial results of leading function division of forest resource subcompartments in Rongshui County, Guangxi. Compared the four functions of subcompartments after taking absolute value of data, and used the function with the highest score to determine the dominant utilization function of each subcompartment, the spatial distribution of each dominant function was shown in Figure 4. The confusion matrix (Table 6) was constructed based on the forest species of Rongshui County’s forest resources subcompartment and the dominant function evaluation results of the model construction. Through the confusion matrix, among the 20,754 subcompartment in the evaluation, there were 12,060 subcompartments whose dominant function was wood production (58.11%), 4511 subcompartments (21.74%) for water conservation function, 2298 subcompartments (11.07%) for water and soil conservation function, and 1885 (9.08%) for other functions. The accuracy rate of the main function evaluation model was 61%, and the wood production function was 94.2%. The recall rates of the four main functions were 62.6%, 51.6%, 37.6%, and 21.6%, respectively. The forest resource subcompartment in Rongshui County of Guangxi was mainly for timber production, which was suitable for multifunctional forest management with dominant function as the main body. According to the accuracy of the overall model and the recall rate of the leading function, the results of the evaluation model based on principal component analysis were consistent with the actual situation, and can be used to evaluate the dominant function.

3.2.3. Comprehensive Evaluation Model for Multifunctional Forest Management

Based on the four principal components determined by principal component analysis, the four eigenvalues λ1 = 1.807, λ2 = 1.242, λ3 = 1.048, λ4 = 1.083 were substituted into Formula (6) to obtain a comprehensive evaluation model for the multifunctional management status of the plantation (Formula (12)). In the formula, F was multifunctional comprehensive score, Y1, Y2, Y3, and Y4 were the scores of wood production function, water conservation function, water and soil conservation function, and other functions, respectively.
F = 1.807 Y 1 + 1.242 Y 2 + 1.048 Y 3 + 1.083 Y 4 5.180
The comprehensive score of the multifunctional comprehensive evaluation model was standardized, whose range is [0,100]. According to the equidistant classification, 0–20 is extremely poor, 20–40 is poor, 40–60 is medium, 60–80 is good, 80–100 is excellent, which was divided into five grades. According to a comprehensive analysis, the number of forest resource subcompartments in Rongshui County with the grade of good and above was 9174, covering an area of 48,963.41 hm2, accounting for 44.20% and 51.24%, respectively (Table 7). The artificial forest subcompartments in the study area had multifunctional management, whose situations were at the middle and lower level. The result indicated that it is urgent to improve the multifunctional management level of small classes in the area, formulate scientific and reasonable multifunctional forestry measures, and improve the management technology of multifunctional plantations. The spatial distribution of multifunctional management level in the study area was shown in Figure 5.

4. Discussion

4.1. Spatial Analysis of Multifunctional Management

There are corresponding relations among geographical things, among which the closer things are closer than the ones far away. As a spatial statistical method, spatial autocorrelation can better describe the relationship between geographical objects and measure the degree of aggregation or dispersion among spatial attributes of things. Global spatial autocorrelation is used to describe the spatial characteristics of spatial feature attribute values in the whole region, and to reflect the similarity of their neighborhood attribute values. Local spatial autocorrelation is to analyze the spatial correlation degree between each spatial object and its neighborhood object in the region, as well as the local feature differences in the distribution of spatial objects. Moran’s I can be used to measure the size of this autocorrelation, the range is from −1 to 1. When it is less than 0, it means negative correlation, equal to 0 means no correlation, and greater than 0 means positive correlation. In this study, we used the Moran index to estimate whether there is spatial clustering correlation.
As shown in Figure 2, the suitable regions for multifunctional management were mainly distributed in the north and the west, and the multifunctional suitable areas had a spatial clustering distribution trend. So we carried out the spatial clustering pattern analysis (Moran’s I) of the multi-objective suitability by ArcGIS, and the trend was shown in Figure 6a. The Moran’s index value is 0.155959 greater than 0, which indicated that the multifunctional management suitability area had the spatial clustering tendency. Based on the statistical analysis on the relevant factors of 20,754 subcompartments suitable for multifunctional management, the results showed that the altitude was mainly distributed in 260–860 m, and the slope distributed in 15–36 degrees, the distance from the ridge line was mainly distributed in 150–600 m, the important index of ecological status was 0.4–0.7, and the productivity index was 0.5–0.8, which indicates that the suitable area for multifunctional management was mainly distributed in the place where the ecological status was not particularly important but the wood production capacity is relatively strong.
Through the thematic map of dominant functions (Figure 4), in the spatial distribution of the dominant functions of Rongshui County, the dominant functions of wood production, water conservation, and water and soil conservation were more evenly distributed in space, but there is a trend of spatial aggregation and distribution locally. Through spatial clustering analysis on its dominant functions, the Moran’s coefficient was calculated, and the result was shown in Figure 6b. Its Moran’s index value was 0.071806 greater than 0, which suggested that there is a spatial clustering trend for the dominant functions of multifunctional management.

4.2. Spatial Analysis of Dominant Function

According to the confusion matrix of dominant function classification in Table 6, in the evaluation of dominant function division model, 3231 subcompartments were classified as water conservation function, whose the original forest type was timber forest, 2062 subcompartments were classified as soil and water conservation forest, 1492 subcompartments as other functions, besides there were 639 subcompartments classified as timber forest in the former water conservation forest. In order to analyze the classification differences, the ridge layer, river layer, and subcompartment layer were superimposed and analyzed. The results were shown in Figure 7.
As shown in Figure 7a, the forest species of the 21,238th and 21,356th subcompartments was other ecological function, whose IF values were 0.86, 0.83, and IE values were 0.81 and 0.80, respectively. The dominant function of the subcompartments was converted to wood production function. Although they were relatively close to the ridge line, the subcompartments showed higher wood production capacity (IF > IE) and were far away from rivers, so their dominant functions were converted to wood production functions. Although the 36,190th subcompartment in Figure 7b had a certain wood production capacity (IF = 0.66), it was close to the ridge line and the wood production capacity was not high. Therefore, its dominant function was transformed into a soil and water conservation function. In Figure 7c, the 24,706th, 24,707th, and 24,589th subcompartments were close to the river, and their IF indexes were not high, especially for the 24,706th subcompartment, whose IF(0.31) < IE(0.53). Hence, in the dominant function evaluation process, they were converted to water conservation function. There was unreasonable phenomenon in the division of management types of these subcompartments in the early stage. So in the classification management, water conservation and soil and water conservation management types should be adopted rather than the management types with dominant function of wood production. In Figure 7d, the subcompartments of 22,225th, 22,211th, 22,212th, 22,234th, and 22,206th were relatively far away from the ridge line and the river in spatial location, and the productivity index IF > 0.75, IE < 0.6. The subcompartments showed a strong function of wood production, but the important index of ecological status was not high, so the dominant functions were converted from water conservation function to wood production function. Wood harvesting can be carried out in the type of follow-up management measures, and the type of selective cutting management measures can also be used for management to play the leading function of wood production.

5. Conclusions

The result evaluated by MSQEM showed that the number of subcompartments with multifunctional site index larger than 0.5 was 20,841 (56.87%), which is consistent with the actual situation, and can provide theoretical and technical support for forest multifunctional management zoning in Rongshui County, Guangxi Zhuang Autonomous Region of China. We compared the result of subcompartment dominant function evaluated by MDFOM with the planning forest species in Rongshui County, the overall accuracy was 61%, and accuracy rate of timber production functions was 94.2%. Compared with traditional methods, which are mostly based on expert scoring, the MDFOM model has the advantages of easy access to index factors and scientific, objective, and reasonable evaluation results. Using GIS technology to analyze the suitability of multifunctional management and the spatial pattern of dominant functions can provide a scientific basis for realizing the reasonable spatial allocation of forest resources and promote the rapid development of forest multifunctional management. Therefore, the MSQEM model and MDFOM model proposed in this study can meet the needs of forest multifunctionality and sustainable development. The subcompartment with wood production function as the main function, through tending and thinning, achieves the maximum timber income, it carries out the timber forest management mode. It can realize the maximum ecological benefit, when the subcompartment with water conservation or soil and water conservation as the dominant function, adopts the ecological forest management mode in the management design. Another important significance of obtained models is that they can provide assistant decision-making for business designers, when it is necessary to adjust the operation type of subcompartment due to the needs of annual business objectives. For example, when the area of timber forest subcompartment is insufficient, the subcompartment with timber production dominant function of evaluation can be preferentially selected from water conservation forest and soil and water conservation forest subcompartment according to MDFOM model, and then it can be transformed into timber forest subcompartment.

Author Contributions

Conceptualization, Z.M. and X.S.; methodology, Z.M., X.S., B.W.; validation, Z.M.; formal analysis, Z.M.; investigation, Z.M., Y.T., Y.C.; data curation, Z.M.; writing—original draft preparation, Z.M.; writing—review and editing, Z.M., X.S. and B.W.; visualization, Z.M. All authors have read and agreed to the published version of the manuscript.

Funding

This study was funded by the Key National Research and Development Program of China (Project No. 2017YFD0600906).

Acknowledgments

We are grateful to Mr. Lu of Forestry College of Guangxi University for Forestry-oriented Intelligent Information Processing for supplying valuable modeling data. We thank Yan Qi for her useful advice to improve the paper’s English grammar. The authors would also like to thank the reviewers for their comments, which were helpful in improving the manuscript.

Conflicts of Interest

The authors declare no conflict of interest.

Appendix A

Table A1. Site index guidance curve model and regression coefficients.
Tree Species Regression ModelRegression Coefficients1 R22 RMSE
abc
Masson pine H = a ( 1 e b A ) 16.360150.09720 0.71841.8175
Chinese fir H = a ( 1 e b A ) 15.024640.98126 0.74751.8101
eucalyptus H = a e b e C A 22.891290.998950.396070.79511.5424
other tree H = a e b A C 69.077622.713350.146990.86520.3700
1 R2 is R-Square or coefficient of determination. 2 RMSE is Root Mean squared Error. a, b, c are fitting parameters, A is age variable, and H is tree height.
Figure A1. Methodology flow chart.
Forests 11 01368 g0a1
Table A2. Results of multifunctional suitability assessment. (IE—important index of ecological status; IF—Forest productivity index; IM—multifunctional forest site quality). Suitability is a binary type of data, 1 indicates suitability and 0-unsuitability for multifunctional operation.
SubcompartmentIEIFIMSuitability
5,000,0210.62188 0.70431 0.75448 1
5,000,0190.54378 0.72632 0.68241 1
7,000,0060.39729 0.84017 0.43839 0
5,000,0060.65104 0.68833 0.79302 1
6,000,0260.38954 0.60594 0.78134 1
6,000,0200.36379 0.79380 0.49120 0
6,000,0110.46523 0.74290 0.61826 1
6,000,0070.45881 0.97984 0.25965 0
6,000,0040.48209 0.74290 0.62669 1
2,000,0280.51074 0.60907 0.84176 1
Table A3. Evaluation table of dominant function of subcompartment (Y1, Y2, Y3, and Y4 are the scores of wood production function, water conservation function, water and soil conservation function, and other functions, respectively).
SubcompartmentY1Y2Y3Y4Dominant Function
6,000,0770.3961.1221.5892.778Y4
6,000,0780.3531.6530.4130.345Y2
6,000,0791.3530.2062.6840.993Y3
6,000,0810.0542.1750.7870.694Y2
6,000,0830.5811.1460.1721.160Y4
6,000,0861.6900.1340.9040.730Y1
6,000,0871.7640.9481.2320.294Y1
6,000,0920.2891.5351.0970.040Y2
7,000,0951.6610.9930.3951.521Y1

References

  1. Jahani, A.; Rayegani, B. Forest landscape visual quality evaluation using artificial intelligence techniques as a decision support system. Stoch. Environ. Res. Risk Assess. 2020. [Google Scholar] [CrossRef]
  2. Zhang, D.C.; Li, Z.Y.; Wang, D.J.; Fan, B.M. Analysis on Two Systems of Multi-use Forest Management. World For. Res. 2011, 24, 1–6. [Google Scholar]
  3. Benz, J.P.; Chen, S.; Dang, S.; Dieter, M.; Labelle, E.R.; Hou, L.; Mosandl, R.M.; Pretzsch, H.; Pukall, K.; Richter, K.; et al. Multifunctionality of Forests: A White Paper on Challenges and Opportunities in China and Germany. Forests 2020, 11, 266. [Google Scholar] [CrossRef] [Green Version]
  4. Hou, Y.Z.; Zeng, X.W. Discussion on Multifunctional Forest. World For. Res. 2010, 23, 7–12. [Google Scholar]
  5. Huiru, Z.; Xiangdong, L.; Chunyu, Z.; Xiuhai, Z.; Xuefan, H. Research on theory and technology of forest quality evaluation and precision improvement. J. Beijing For. Univ. 2019, 41, 1–18. [Google Scholar]
  6. Lovell, S.T.; Mendez, V.E.; Erickson, D.L.; Nathan, C. Extent, pattern, and multifunctionality of treed habitats on farms in Vermont, USA. Agrofor. Syst. 2010, 80, 153–171. [Google Scholar] [CrossRef]
  7. Kleinn, C.; Fernández, B.H.; Campos, J.J. Site productivity estimation using height-diameter relationships in Costa Rican secondary forests. Investigación Agraria Sistemas y Recursos Forestales 2004, 13, 295–304. [Google Scholar]
  8. Zhang, C.; Peng, D.L.; Huang, G.S.; Ma, W. Site quality evaluation inThree Gorges Reservoir region based on forest inventory data. J. Northeast For. Univ. 2015, 43, 56–61. [Google Scholar]
  9. Ahmadi, K.; Alavi, S.J.; Kouchaksaraei, M.T. Constructing site quality curves and productivity assessment for uneven-aged and mixed stands of oriental beech (Fagus oriental Lipsky) in Hyrcanian forest, Iran. For. Sci. Technol. 2017, 13. [Google Scholar] [CrossRef]
  10. Ruonan, G.; Yangsheng, X.; Xiangdong, L.; Yuanchang, L.; Xiyou, S. Study on prediction of natural forest productivity based on random forest model. J. Cent. South Univ. For. Technol. 2019, 39, 39–46. [Google Scholar]
  11. Jiarong, H.; Tianxiao, M.; Yanmei, W.; Tiejun, S.; Xinzhen, Z.; Guangqin, G. Forest site evaluation model studies on the basis of BP Neural Network. J. Mt. Agric. Biol. 2006, 6, 479–483. [Google Scholar]
  12. Jianbo, S.; Yingkuan, W.; Xiangdong, L.; Yuancai, L.; Qiulai, W.; Jinsheng, Y. Site quality evaluation of uneven-aged mixed coniferous and broadleaved stands in Guangdong Province of southern China based on BP neural network. J. Beijing For. Univ. 2019, 41, 38–47. [Google Scholar]
  13. Hong, G.; Yuanchang, L.; Xiangdong, L.; Lingxia, H. GIS-based Ecological Classification System of Forest Landscape in Qingshan Forest Farm. For. Resour. Manag. 2013, 4, 128–132. [Google Scholar]
  14. Sani, N.A.; Kafaky, S.B.; Pukkala, T.; Mataji, A. Integrated use of GIS, remote sensing and multi-criteria decision analysis to assess ecological land suitability in multi-functional forestry. J. For. Res. 2016. [Google Scholar] [CrossRef]
  15. Kärkkäinen, L.; Haakana, H.; Hirvelä, H.; Lempinen, R.; Packalen, T. Assessing the Impacts of Land-Use Zoning Decisions on the Supply of Forest Ecosystem Services. Forests 2020, 11, 931. [Google Scholar] [CrossRef]
  16. Lu, L.; Hongcheng, Q. Summary for the Forest-Functional Evaluation Reserch in China. Inner Mong. For. Investig. Des. 2015, 38, 128–129. [Google Scholar]
  17. Yonghong, D.; Feng, X. Dynamic Evaluation of Water Conservation Function of Forest Ecosystem in Yunnan Province Based on Continuous Forest Inventory Data. For. Invent. Plan. 2020, 45, 90–95. [Google Scholar]
  18. Hongzhen, L.; Fengri, L.; Weiwei, J.; Shufang, W. Water Conservation of Litterfall in Different Mixed Forest Types of White Birch and Larch in Daxing’an Mountain. J. Northeast For. Univ. 2014, 6, 43–46. [Google Scholar]
  19. Jiawen, Z.; Jixi, G.; Zhiqiu, G.; Weichao, Y. Analyzing the water conservation service function of the forest ecosystem. Acta Ecol. Sin. 2018, 38, 1679–1686. [Google Scholar]
  20. Julieta, J.; Margarita, G.T.; Arturo, C.E.; Lucia, A. Assessment of water supply as an ecosystem service in a rural-urban watershed in southwestern Mexico City. Environ. Manag. 2012, 49. [Google Scholar] [CrossRef]
  21. Jiemin, Z.; Wenzheng, K. The discussion on evaluation of the regional forest productivity. J. Nanjing For. Univ. (Nat. Sci. Ed.) 2011, 35, 1–5. [Google Scholar]
  22. Gundersen, P.; Laurén, A.; Finér, L.; Ring, E.; Koivusalo, H.; Sætersdal, M.; Weslien, J.-O.; Sigurdsson, B.D.; Högbom, L.; Laine, J.; et al. Environmental Services Provided from Riparian Forests in the Nordic Countries. Ambio 2010, 39, 555–566. [Google Scholar] [CrossRef] [Green Version]
  23. Calderon-Aguilera, L.E.; Rivera-Monroy, V.H.; Porter-Bolland, L.; Martínez-Yrízar, A.; Ladah, L.B.; Martínez-Ramos, M.; Alcocer, J.; Santiago-Pérez, A.L.; Hernandez-Arana, H.A.; Reyes-Gómez, V.M.; et al. An assessment of natural and human disturbance effects on Mexican ecosystems: Current trends and research gaps. Biodivers. Conserv. 2012, 21, 589–617. [Google Scholar] [CrossRef]
  24. Jinliang, L.; Xiaoxian, Z.; Xin, W. Study on forest biodiversity index system of northeast over-cutting forest region based on forestry bureau level. J. Beijing For. Univ. 2003, 25, 48–52. [Google Scholar]
  25. Rong, Z.; Mingpu, Z.; Haiping, Y. Advances of scenic recreational forest tending at home and Abroad. J. Beijing For. Univ. 2004, 26, 109–113. [Google Scholar]
  26. Zixuan, Q. Measurement Method and Application of Carbon Sink of Terrestrial Forest Vegetation in China. Ph.D. Thesis, Beijing Forestry University, Beijing, China, 2019. [Google Scholar]
  27. Litynski, J.T.; Klara, S.M.; Mcilvried, H.G.; Srivastava, R.D. An Overview of Terrestrial Sequestration of Carbon Dioxide: The United States Department of Energy’s Fossil Energy R&D Program. Clim. Chang. 2006, 74, 81–95. [Google Scholar] [CrossRef]
  28. Lopinski, L. Evaluation of stand conversion needs depending on the dominant function of forest. Sylwan 2008, 152, 17–24. [Google Scholar]
  29. Lopinski, L. A concept of stand condition assessment based on selected taxation characteristics. Sylwan 2008, 152, 14–21. [Google Scholar]
  30. Mengya, Z.; Xinjie, W.; Xuelei, X.; Houlin, H.; Xiaojie, Z.; Ya’nan, C. A Multi-function Evaluation of Different Thinning Intensities on Cunninghamia lanceolata Plantation. J. Northeast For. Univ. 2017, 45, 29–33. [Google Scholar]
  31. Yao, H.; Naijiang, W.; Qiao, P.; Manxue, X. Assessment of multi-function of Pinus tabulaeformis plantation in Qingyang area. J. South China Agric. Univ. 2017, 38, 109–115. [Google Scholar]
  32. Boyun, L.; Jing, Z.; Donglan, L.; Xiaoxian, Z. Construction of multi-functional evaluation system for Jingouling Forest Farm. J. Cent. South Univ. For. Technol. 2012, 32, 158–161. [Google Scholar]
  33. Rongxin, W.; Qingyun, K.; Hai, Y. Research and evaluation on multi-function of Platycladus orientalis plantation in Mentougou district of Beijing. J. Cent. South Univ. For. Technol. 2016, 36, 58–62. [Google Scholar]
  34. Osovi, M.; Bugalho, M.N.; Thom, D.; Borges, J.G. Stand Structural Characteristics Are the Most Practical Biodiversity Indicators for Forest Management Planning in Europe. Forests 2020, 11, 343. [Google Scholar] [CrossRef] [Green Version]
  35. Xiaohui, W.; Yujun, S.; Guangyi, M.; Yifu, W. Comprehensive evaluation of forest resources based on multi-function management. J. Cent. South Univ. For. Technol. 2013, 33, 103–108. [Google Scholar]
  36. Jing, W. Study on Decision Support System of multi-Functional Management of Chinese Fir Plantation. M.D. Thesis, Beijing Forestry University, Beijing, China, 2016. [Google Scholar]
  37. ASF Data Search. Available online: https://search.asf.alaska.edu/#/.html (accessed on 25 August 2020).
  38. Xianyu, M. Forest Mensuration; China Forestry Publishing House: Beijing, China, 2006. [Google Scholar]
  39. Xiangdong, L.; Liyong, F.; Haikui, L. Methodology and Applications of Site Quality Assessment Based on Potential Mean Annual Increment. Sci. Silvae Sin. 2018, 54, 116–126. [Google Scholar]
  40. Chen, Y.; Wu, B.; Qi, Y. Using Machine Learning to Assess Site Suitability for Afforestation with Particular Species. Forests 2019, 10, 739. [Google Scholar] [CrossRef] [Green Version]
  41. Jie, D.; Luyi, M.; Liming, J. Establishment and Application of Site Index Table for Pinus tabulaeformis Plantation in the Low Elevation Area of Beijing. Sci. Silvae Sin. 2009, 45, 7–12. [Google Scholar]
Figure 1. Location of the study area. Geographical Spatial Distribution of Rongshui County, Guangxi Zhuang Autonomous Region. Notes: the elevations are graded in the figure.
Forests 11 01368 g001
Figure 2. Suitable areas for multifunctional management. In the figure, the “unfit” indicates that this type of forest area is not suitable for multifunctional forest management, and the “fit“ means that the regional forest stand is suitable for multifunctional forest management.
Forests 11 01368 g002
Figure 3. The principal component factor contribution graph. Dim1, DIM2, Dim3, and Dim4 represent four principal components. The larger circle area in the graph, the greater factor interpretation. Slope (X1), soil thickness (X2), altitude (X3), average age (X4), canopy (X5), average DBH (X6), number of plants per hectare (X7), volume per hectare (X8), average tree height (X9), ridge distance (X10), and river distance (X11).
Forests 11 01368 g003
Figure 4. Spatial distribution of dominant function evaluation of forest resources in Rongshui County, Guangxi Zhuang Autonomous Region.
Forests 11 01368 g004
Figure 5. Spatial distribution of multifunctional management level in Rongshui County of Guangxi Zhuang Autonomous Region. Excellent, Good, Moderate, Poor and Very Poor mean multifunctional forest management level.
Forests 11 01368 g005
Figure 6. Clustering mode of multifunctional business space. (a) shows Moran index of spatial distribution of multifunctional forest management suitability, and (b) shows Moran index of spatial distribution of dominant functions in the study area.
Forests 11 01368 g006
Figure 7. Spatial distribution of oriented functions of subcompartments. (a) indicates that the dominant function of the subcompartment is transformed from other ecological functions to wood functions, (b) indicates that the dominant functions of subcompartments are transformed from wood production functions to water and soil conservation functions, that of (c) subcompartments changes from wood production functions to water conservation functions, and (d) indicates that the dominant functions of sub-compartments transform from water conservation to wood production.
Forests 11 01368 g007
Table 1. Forest multifunctional types, geographical distribution of each function, and related site influence factors.
Multifunction TypeDefinitionSpatial Geographical CharacteristicsCorrelation Factor
Water conservationForests, trees, and shrubs whose main purpose is to conserve water sources, improve hydrological conditions, regulate regional water circulation, prevent rivers, lakes, and reservoirs from being blocked, and protect drinking water sources.In the catchment area where rivers originate, forests, trees, and shrubs that protect drinking water sources in cities and towns within the first layer of ridge in the mountainous natural terrain on both sides of the main stream and primary and secondary tributaries.Canopy closure, humus layer, soil thickness, slope, [19] etc.
Carbon fixation and oxygen releaseThe carbon fixation and oxygen release service come from vegetation assimilating atmospheric CO2 through photosynthesis, and the carbon budget process of decomposing organic matter through respiration and releasing it into the atmosphere is closely related to the forest carbon source/sink status.The carbon storage of the forest in the carbon sequestration function is calculated from the biomass of the tree layer, shrub layer, herb layer and litter layer of forest vegetation.Forest age, hectare volume, sub-compartments area, tree diameter at breast height(DBH), tree height [31] etc.
BiodiversityBiodiversity is an effective indicator reflecting the structure and functional characteristics of communities, and a measure of the stability of ecosystems.The diversity index, species richness index, and evenness index are usually used to analyze the level of species diversity.Tree species composition [34], types of understory vegetation, coverage, etc. [24].
Soil and water conservationForests, trees and shrubs whose main purpose is to slow down surface runoff, reduce erosion, prevent soil erosion, maintain and restore land fertility.The slope is ≥45°, which will cause serious soil erosion after forest logging. Difficult to renew after felling or the ecological environment is difficult to restore. Forests, trees and shrubs within 300 m on each side of the main ridge lines.Tree species composition, soil, forest layer structure, slope, canopy closure, forest density, etc. [24,35,36]
Forest recreationThe forest whose main purpose is to meet the needs of human ecology and beautify the environment. Tree species composition [24], forest density, forest age, [33] undergrowth and ground cover [35] etc.
Wood productionThe forest that cultivates and provides wood can also be used as building materials, household goods and paper products.Forest land with slope <35°, deep soil layer, good site conditions, convenient transportation and not easy to cause soil erosion and ecological environment damage.Hectare volume, sub-compartments area, slope, forest age, Status level, hectare volume, DBH 1 [35,36]
1 DBH in Table 1 means tree diameter at breast height.
Table 2. Statistics of basic stand factors of forest resource sub-compartment in Rongshui County, Guangxi Zhuang Autonomous Region Statistics of subcompartment tree species.
Tree SpeciesNumber 1Area(hm2)Min AgeMax AgeMin Tree HeightMax Tree Height
fir28,686116,310.184680.328.8
Masson pine10836273.707771.131.2
eucalyptus7774036.691320.628.3
others611040,667.625680.528.9
1 Number in Table 2 means the number of subcompartments for each tree species.
Table 3. Candidate model of site index guidance curve. Mitscherlich, Logistic, Gompertz, Korf, and Richards common growth curve model. a. b, c are fitting parameters, A is age variable, and H is tree height.
Model NameModel Expression
Mitscherlich H = a ( 1 e b A )
Logistic H = a ( 1 + e b A ) 1
Gompertz H = a e b e C A
Korf H = a e b A C
Richards H = a ( 1 e b A ) C
Table 4. Principal component variance contribution rate.
IngredientExplanatory Factor
EigenvaluesContribution Rate (%)Cumulative Contribution Rate (%)Eigenvalues
11.80729.6929.691.807
21.24214.0243.721.242
31.08310.6654.371.083
41.0489.9864.351.048
50.9598.3672.71
60.9468.1380.85
70.8466.5087.35
80.7795.5292.87
90.7004.4697.33
100.3971.4398.76
110.3691.24100.00
Table 5. Score coefficient matrix of principal component analysis.
Evaluation IndexIngredient
Comp.1Comp.2Comp.3Comp.4
X1 10.0360.2970.1180.527
X2−0.051−0.0970.0640.710
X30.1160.5940.109−0.053
X40.3840.098−0.0850.047
X50.2980.041−0.4800.273
X60.512−0.0900.066−0.044
X7−0.273−0.1610.6500.055
X80.424−0.2090.3710.010
X90.472−0.2060.272−0.056
X10−0.034−0.386−0.272−0.203
X110.0780.5190.143−0.298
1 In Table 5, the meaning of each evaluation index is as follows: slope (X1), soil thickness (X2), altitude (X3), average age (X4), canopy (X5), average DBH (X6), number of plants per hectare (X7), volume per hectare (X8), average tree height (X9), ridge distance (X10), river distance (X11).
Table 6. Classification confusion matrix of dominant function. Y1, Y2, Y3, and Y4 are the scores of wood production function, water conservation function, water and soil conservation function, and other functions, respectively. The row in the figure represents the subcompartment planning forest species, and the dominant function evaluation of the subcompartment that was shown in the list.
Forest SpeciesY1Y2Y3Y4Summation
Y111,35932312062149218,144
Y263912321853332389
Y321215041133
Y4412711988
Summation12,06045112298188520,754
Table 7. Evaluation and statistics of multifunctional forest management level in Rongshui County of Guangxi Zhuang Autonomous Region. Excellent, Good, Moderate, Poor, and Very Poor mean multifunctional forest management level.
Multifunctional Management LevelExcellent GoodModeratePoorVery Poor
Number41742742811,158422
Quantity percentage (%)0.028.3935.7953.762.03
Area (ha)153.4411,619.81537,190.1645,163.961414.02
Area percentage (%)0.1612.1638.9347.271.48
Publisher’s Note: MDPI stays neutral with regard to jurisdictional claims in published maps and institutional affiliations.

