
Economic Analysis of Cedar Plantation Management and Mega-Solar Replacement


Faculty of Science and Technology, Tokyo University of Science, Noda 278-8510, Japan
Forests 2021, 12(3), 361; https://doi.org/10.3390/f12030361
Submission received: 4 February 2021
/
Revised: 15 March 2021
/
Accepted: 15 March 2021
/
Published: 18 March 2021
(This article belongs to the Special Issue Forest Management and Economics: Integrating Objectives Using Harvest Scheduling and Operations Research)
Abstract
:Technology related to solar power as a renewable energy resource has increased in recent years. However, in Japan, forestland has been converted into mega-solar power plants with more than 1 MW photovoltaic capacity and such conversions raise significant concerns as they degrade forest ecosystem services. In this study, the profit and power supplies generated by a mega-solar power plant and a cedar (Cryptomeria japonica) plantation were evaluated. The profit for the cedar plantation was estimated from saw log and wood chip production, and its power supply was estimated from wood chip production alone. These figures were based on an optimal forest management strategy that was generated using a dynamic programming model. In this numerical simulation, it was found that the power supply from the mega-solar power plant was 50–150 times more than that from the cedar plantation. Regarding profit, it was found that the simulated mega-solar power plant provided NPV (net present value) of 8.5–90.6 MM JPY (Japanese Yen)/1–3 ha (0.1–3.0 MM JPY/ha/year), while the forest management simulation generated an NPV of 29,863 JPY/ha/year (for one timber rotation) and SEV (soil expectation value) of 3.6 MM JPY/ha at most. To avoid the conversion of forests into mega-solar power plants, this difference provides a basis for the cost of maintaining forests for ecosystem services and potential economic incentives.
1. Introduction
Mega-solar power plants are large-scale, ground-based, solar power generation systems with a photovoltaic (PV) capacity of more than 1 MW. The large amount of land required by mega-solar power plants has recently been provided by underdeveloped, low-cost forested areas. This land conversion can have negative consequences on the environment, including loss of natural landscape, problems because of increased albedo, adverse ecosystem impacts, sediment runoff, decreased watershed services, and a decrease in carbon sequestration sources. Conversely, solar power generation is expected to be an alternative energy source with minimal greenhouse gas emissions.
There has been increased interest in the introduction of mega-solar power plants following the 2012 implementation of feed-in tariffs (FIT) for renewable energy in Japan. As of March 2020, 7275 mega-solar power plants had been developed [1]. From April 2020, environmental impact assessments were required to build solar power plants with PV capacities greater than 30 MW in site areas of approximately 100 ha [2]. Since 90% of the mega-solar power plants in Japan have less than 2 MW PV capacity and only 1–3 ha of land is generally needed per 1 MW PV capacity, this regulation is not applicable to many mega-solar power plants. Although some municipalities regulate themselves, such regulations are mainly aimed at large facilities of 10 ha or more and are rarely applied to typical mega-solar power plants [3]. If investments in mega-solar power plants continue unabated, we may no longer be able to profit sustainably from the many resources and processes of forest ecosystems (i.e., “forest ecosystem services”) that are lost to the solar power plants. When deciding whether forestland should be converted to mega-solar power plants, evaluating and comparing the costs of both the solar power plant and forest management activities—including forest ecosystem services—are important.
Ecosystem services are difficult to quantify. One of the existing methods to quantify ecosystem services is on the basis of “opportunity cost,” which takes the highest value option among all possible trade-offs, evaluates the hypothetical profits that would have been gained if this option had not been chosen, and then provides the price of that option in terms of the “cost of choosing that option.” This is an important concept in the field of forest development, where there are a wide range of benefits to consider when promoting the prevention of forest degradation [4]. It has been speculated that the opportunity cost estimates of ecosystem service conservation—that is, the profit that would have been gained from development—would be sufficient to determine the monetary value that could be paid as an incentive to conserve ecosystem services. For example, the costs of legislation and management necessary to maintain forest ecosystem services could be offset by environmental taxes, and these costs can be estimated. Existing studies have simulated the opportunity cost to manage the old-growth forest and endangered species instead of timber production-focused forest management [5], while other studies have calculated forest operation cost and the opportunity cost of forest habitats with a model for optimizing harvesting costs using a high-resolution map generated from airborne laser scanning data [6].
There are many variables to consider when forestland development is undertaken instead of forest management. In this study, the profits from the mega-solar power plant were considered as an opportunity cost for the maintenance of an artificially managed cedar (Cryptomeria japonica) forest. The net present value (NPV) and soil expectation value (SEV) of profits from saw log production and wood chip production used for energy generation were compared with the profits from the mega-solar power plant. The NPV was calculated for one timber rotation to know short-term profit because the motivation of the forest owner converting the forestland to the mega-solar power plant might be to secure revenue in short-term. The SEV calculates the value of bare land that produces timber perpetuity and is often used to value even-aged plantations [7]. In addition, the amount of electricity generated by using chips from cedar plantation as woody biomass and the amount generated by mega-solar power plants were compared.
Dynamic programming was used to find an optimal management plan that could most effectively produce wood chips for woody biomass power generation and saw log production. Mathematical optimization techniques allow for a quantitative evaluation of trade-offs from a wide range of management objectives. As demands for the maintenance of forest ecosystem services have increased in society, mathematical optimization methods that consider forest functions separately from timber production—in addition to economic efficiency—have been developed [8,9,10,11]. Among these methods, dynamic programming and forest growth prediction models have been used to optimize the amount, time period, and frequency of management actions (e.g., thinning and harvesting) that influence forest growth rates and devise effective management systems for timber production [12,13,14,15]. Dynamic programming research has also been conducted on forest functions other than timber production, including carbon sequestration [16,17], woody biomass production [18,19], and biodiversity preservation [20,21].
Once the optimal forest management plan was determined, it was compared with profits gained from the mega-solar power plant. In addition, electric power supply produced from woody biomass from the cedar forest was calculated, and this value was compared with the electric power supply from the mega-solar power plant. It is speculated that the differences in profit and amount of power supplied will be fundamental in estimating the costs associated with the maintenance of forest ecosystem services.
2. Materials and Methods
2.1. Searching for Optimal Forest Resource Management
The Multi-Stage Projection Alternative Technique (MSPATH) algorithm [22] used in this study is a dynamic programming algorithm that considers the profit dynamics gained from thinning and harvesting to create a dynamic programming network using the thinning amount as a control and state variable. The algorithm can search for an optimal thinning regime that maximizes the total profits gained from thinning and harvesting as well as the felling volume. MSPATH can incorporate both the short- and long-term effects of thinning. It has been previously used to evaluate the influence of logging residue collection in forest management [23], the effectiveness of low-density planting [24], carbon sequestration amounts in optimal felling regimes [17], and carbon sequestration amounts in optimal felling regimes that factor in subsidies as well as the trade-offs between timber production and woody biomass energy utilization [25,26].
Numerical simulations were conducted on an artificial forest of Japanese cedar trees (Cryptomeria japonica) based on the Dynamic Programming Model for Kyushu Stand Simulator [27]. MSPATH dynamic programming algorithm was used to determine a forest management plan that maximizes volume of wood chip production for power generation. And also MSPATH was used to determine NPV and SEV from wood chip and saw log production. NPV is the sum of the cash flow produced by a property, discounted to the present value. SEV is the NPV of an infinite series of identical, even-aged forest rotations, starting from bare land. The equation of SEV is shown as follows [28];
where is net revenue of the final harvest, is net revenue of the thinning in year n, c is planting expense, p is discount rate, and u is rotation length.
MSPATH Algorithm
A formula of the MSPATH algorithm is shown below, which was used to conduct NPV, SEV, and harvest volume maximization. The equation below is shown as the maximization of NPV. To identify the maximum NPV (), time interval of for thinning timing at time () and thinning amount targeting time is optimized by the following equation:
The NPV when thinning is done at time targeting time is identified by the following equation:
where is the NPV of the harvesting (clear cutting) at time after a thinning was done at time . is the NPV of the thinning when thinning amount was conducted at time . is identified by the following equation:
is the NPV of the harvesting at time following the optimal thinning amount at optimal time interval , which is targeting time . in Equation (3) is subtracted from previous maximum NPV (), because harvesting is conducted only at the last phase.
Growth Model and Site Quality
A forest stand growth model that incorporates the thinning amount is needed if an optimal forest management plan is to be determined. Numerical calculations were used from stand density control diagrams of Japanese cedar [29]. If the total number of trees and tree heights can be determined using the density control diagram, timber volume can be calculated using that information. Regarding tree height, the tree height growth model created by the Richard growth function was used [30]. The equation of Richard growth function is shown as follows:
Parameters a, b, and c for the Richard growth function as calculated by Yoshimoto et al. [25] on the forests in Hoshino village in Yame city, Fukuoka Prefecture that have not been thinned for 23 years were used. Yoshimoto et al. [25] used 30 thinned trees for the stem analysis and estimated the parameters for Richards function by a generalized nonlinear mixed-effects model. The estimated parameters are 24.9506, 0.06438, and 1.97360 for a, b, and c, respectively.
Tarusaki et al. [31] calculated the site index curve by applying the Logistic function from 552 cedar stand in Fukuoka Prefecture. It can be seen that there is a large variation in the 552 stands. The site index was categorized into seven levels, and the site in this research is equivalent to the second from the top.
Simulation Environment Setup
The following parameters were used to determine the optimal management plan with the MSPATH algorithm based on Yoshimoto et al. [17]. To determine differences in harvest amounts, analyses were conducted at various plantation densities ranging from 1000 to 10,000 trees/ha. The maximum planning period was set at 100 years.
- Stand age (years): 0.
- Plantation density (trees/ha): 1000–10,000.
- Discount rate (%): 1%.
- Felling costs (clear cutting): 8000 JPY (Japanese Yen)/.
- Thinning costs: 11,000 JPY/.
- Log yield rate (%): 65% (saw log production), 100% (wood chip production).
- Minimum thinning age (year): 10.
- Algorithm: MSPATH algorithm.
- Thinning interval (trees): 5.
- Stage interval (years): 5.
- Planning period (years): 100.
The Annual Report on Forest and Forestry for the 2010 fiscal year [32] was used as a reference to estimate the clear cutting and thinning costs. Simulations were conducted where all thinned wood was used, in other words, it was not truncation thinning. The saw log and wood chip prices outlined by the Japanese Ministry of Agriculture, Forestry, and Fisheries [33] were used as a reference for timber prices. For the saw log prices, the average diameter at breast height (DBH) was determined from the average tree height and planting density that had been calculated using Equation (4). Inoue and Kurokawa [34] and Nakama et al. [23] were used as a reference to estimate tree trunk shape. The price of timber with crosscuts every 2 m was calculated, and the calculated value was applied to the saw log prices based on the two variables of tree height and DBH (Table 1). The wood chip price was set at 6000 JPY/, regardless of diameter class.
Additionally, because Fukuoka Prefecture does not publish their planting expenses, the standard afforestation prices set by the neighboring Oita prefecture were used [35]. Subsidies were not considered in this research. The following regression formula based on 1000–3000 trees/ha was used to calculate the planting expenses of 4000–10,000 trees/ha:
where is planting costs (JPY/ha) and N is number of trees planted (trees/ha). Based on the aforementioned conditions, the optimal thinning regime was determined, while varying the number of trees planted from 1000 to 10,000 trees/ha. Simulations were conducted with the objective of maximizing NPV and SEV for saw log and wood chip production as well as maximizing harvesting volume for wood chip production. Although this simulation used an annual discount rate of 1%, the same simulations with 0% and 3% annual discount rates were conducted to confirm the influence of this variable as the annual discount rate influences strategies for optimal forest management. Additionally, according to the Japanese Forest Agency [36], Japanese cedar prices have been trending downward since their peak at 39,600 JPY in 1980, with price values at around 13,000 JPY in recent years, ranging between −20% and +7% during 2000–2018. Thus, the same simulations with material prices set at −20%, −10%, and +10% were conducted.
The Power Generated with Woody Biomass Chips
Using Noda [37] as a reference for woody biomass power plant setup, the amount of power generation for of timber volume (kWh/), facility power generation amount (kWh/year), and round-wood conversion for the felled volume used for wood chips (/year) were determined using the following equations:
where is PV capacity which was set at 1000 kW (1 MW), 24 is daily hours, 365 is the number of days per year, and a is facility utilization rate which was set at 80%. is round-wood conversion for the felled weight of wood chips (ton/year) and b is round-wood conversion rate that was set at 1.3 based on the Japan Woodchip Manufacturer’s Association [38]. was calculated using the following equation:
where is the lower heating value and c is residue. Based on the Japan Woodchip Manufacturer’s Association [38], and c were set at 13.0 MJ/kg and 0.03%, respectively. is the total amount of power generation (GJ/year), and was calculated using the following equation:
where d is thermal efficiency which was set at 10%, 1 kWh = 860 kcal and 1 kcal = 4.1865 kJ. Using this formula, the power generation amount was calculated from the harvest volume.
2.2. Mega-Solar Power Plant
Solar power systems have gained attention as a renewable energy source, with increased expectations of it becoming an alternative to thermal and nuclear power. Additionally, clear and rapid improvements have been seen in solar power system technologies, particularly in its generating capacity and energy payback time. In this simulation, the lifespan at 30 years was set and the annual power generation amount (MWh/year) was calculated using the following equation:
where I is average annual insolation amount on the solar panel surface. Here, published data from the New Energy and Industrial Technology Development Organization [39] were used for the average annual insolation amount on solar panel surface. A value of 3.81 (kWh//day) was used, with inclination and azimuth angles both at for Yame city, Fukuoka Prefecture. k is the loss rate, which was set at 0.7 [40]. P is system capacity, which was set at 1000 kW (1 MW). e is deterioration rate, which was set at 0.005/year [41], and 365 is the number of days per year. According to the Procurement Price Calculation Committee [42], the overload rate is on the rise, with an overload rate of 133% for power outputs of 1 MW and above. As overloading is expected to increase power generation by 1–2%, the solar power generation with an increase of 2% was calculated.
It was assumed that mega-solar power plants with less than 2 MW PV capacity were installed in 2018 and 2019 to calculate their profits. The installation costs obtained from the Procurement Price Calculation Committee [42] are outlined in Table 2. The system costs include solar panels, power conditioners, stands, and construction. Disposal costs were specified as “5% of the capital costs” by the Cost Verification Commission, chaired by the Senior Vice Minister of Cabinet Office in 2011 [43]. However, the cost of solar power generation is expected to decrease further in the future. In such a case, the absolute amount of 5% capital costs would be small, although whether the cost of disposal would be reduced as rapidly as the capital cost is unclear. Therefore, based on the results of the survey and the current assumptions, Procurement Price Calculation Committee set the disposal costs for 10,000 JPY/kWh regardless of the amount of capital expenses [42]. Therefore, the disposal costs at 10,000 JPY/kWh was set.
The pretax solar power purchase price in 2018 for output capacities of more than 10 and less than 2000 kW was 18 JPY/kWh [44]. From 2019, the solar power purchase price for 500 kW output and above were decided during the bidding process because the bidding system encourages cost reductions and makes the solar power generation business independent from the FIT system [42]. Outside Japan, the cost of solar power generation is falling rapidly. Japan’s solar power generation costs are not falling as rapidly, although it is considered to have the capacity to reduce costs more in the future [45]. The lowest bid price is set based on the previous year’s prices from the top providers with low implementation costs. The pretax bid price for September 2019 was 10.50–13.99 JPY/kWh, and the weighted pretax average was 12.98 JPY/kWh [46]. Because the purchase price will be fixed for 20 years, a pretax rate of 8.50 JPY/kWh was used for the remaining 10 years of this simulation, which is the price target for 2022 [47]. The discount rate was set as 1% because the deterioration rate was already considered in this calculation and solar-panel investment is relatively low risk with the fixed solar power purchase price for the next 20 years. Additionally, the internal rate of return (IRR) was calculated, which is the expected future annual rate of return.
3. Results
The calculated profit NPV and the amount of electric power were converted into the amount of per year, which is divided with total operating years because the number of operating years for managed forests and mega-solar power plants are different. Since SEV showed the same trend as NPV, the graph of SEV is omitted. In total, 0.28 MWh of electricity could be generated from the wood chips produced from of timber.
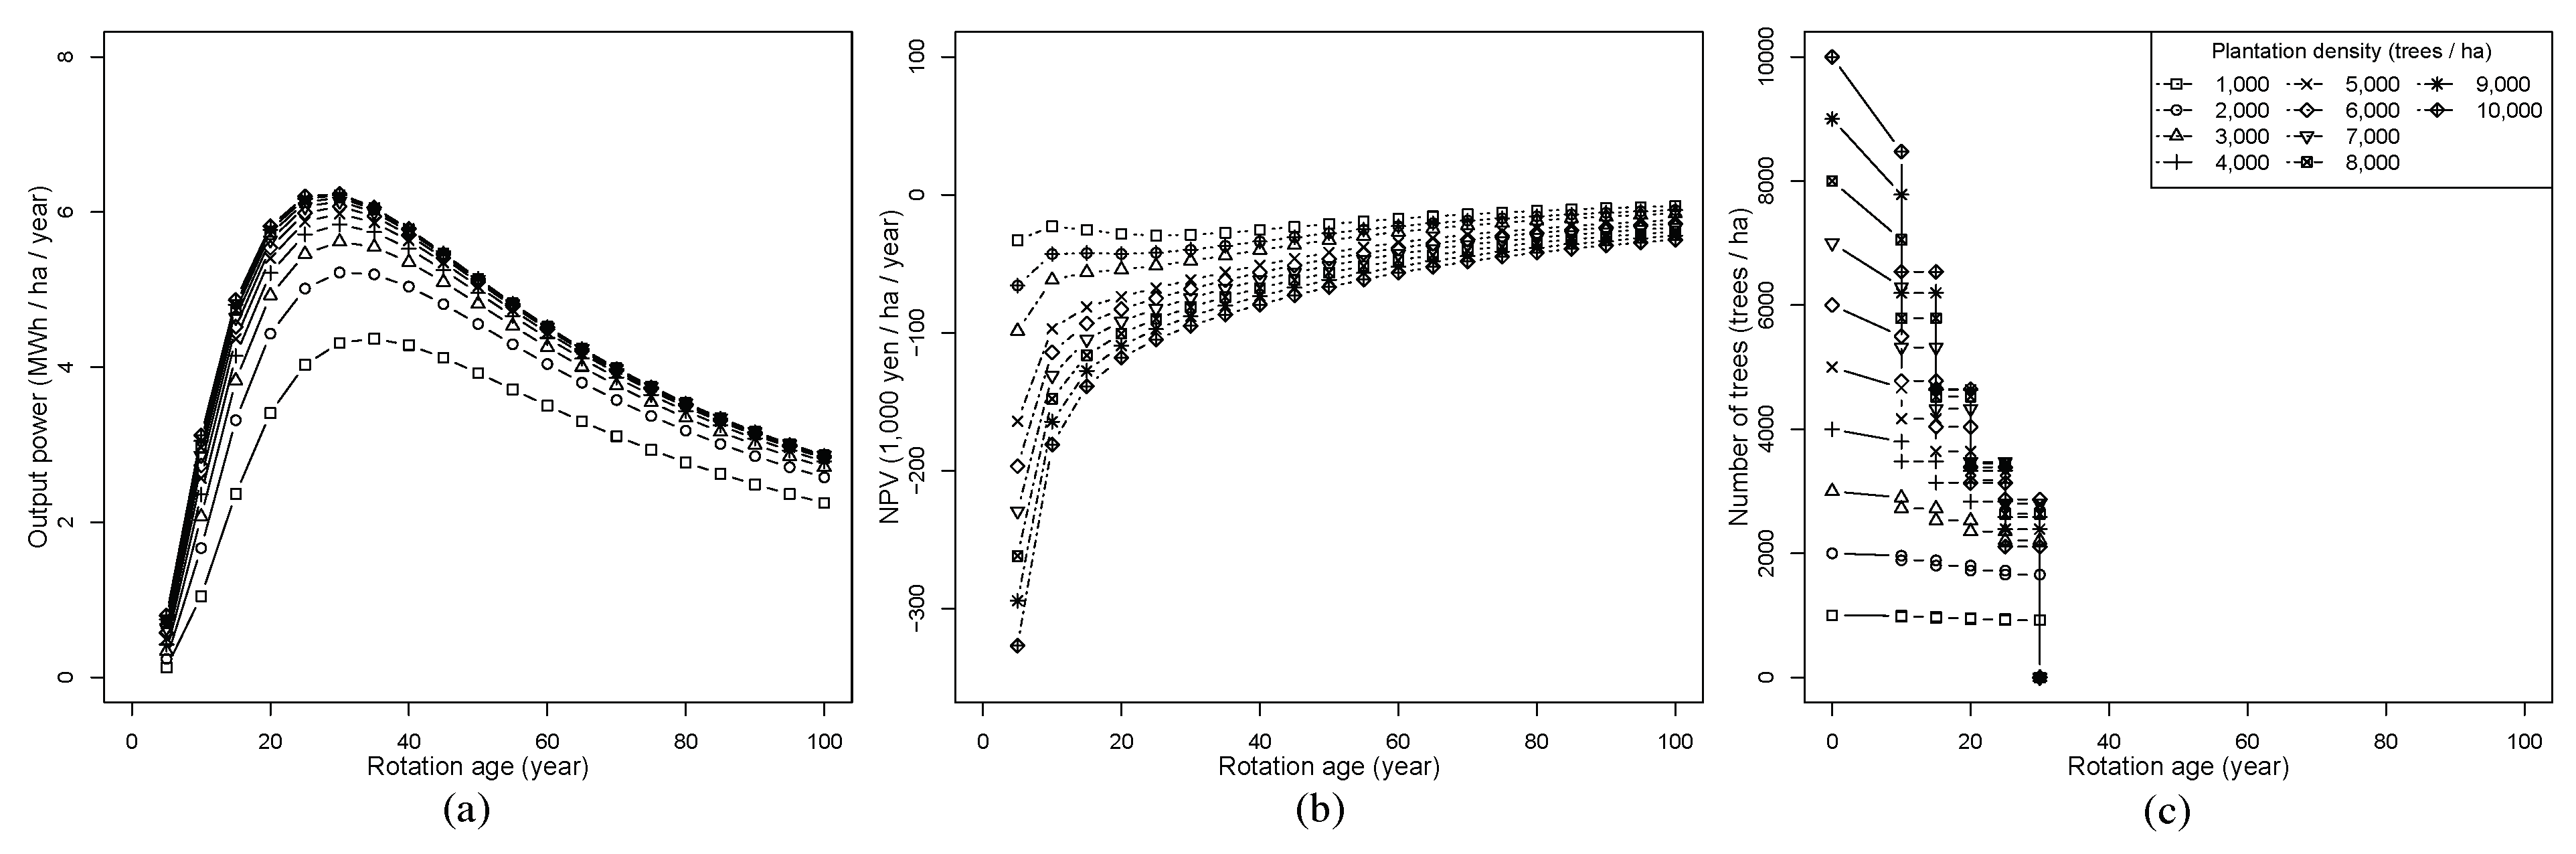
In cases where the production of wood chips for electric power generation was maximized, the amount of power generated increased proportionately to increases in plantation density, with a maximum of 6.2 MWh/year electric output power observed at 10,000 trees/ha at a rotation age of 30 years (Figure 1a). The NPV in cases where the harvest was maximized was negative at all planting densities and rotation ages (Figure 1b). In this scenario, the maximum value was NPV of −8130 JPY/year and SEV of −1.3 MM JPY for 1000 trees/ha at a rotation age of 100 years, with values decreasing as planting density increased. Figure 1c shows the thinning regime with rotation age of 30 years, which is the peak of electric output power when wood chip production was maximized. The thinning regimes were identical for maximizing NPV and SEV. Here, the thinning regime was chosen, and its amount of thinning was identical to that of self-thinning.
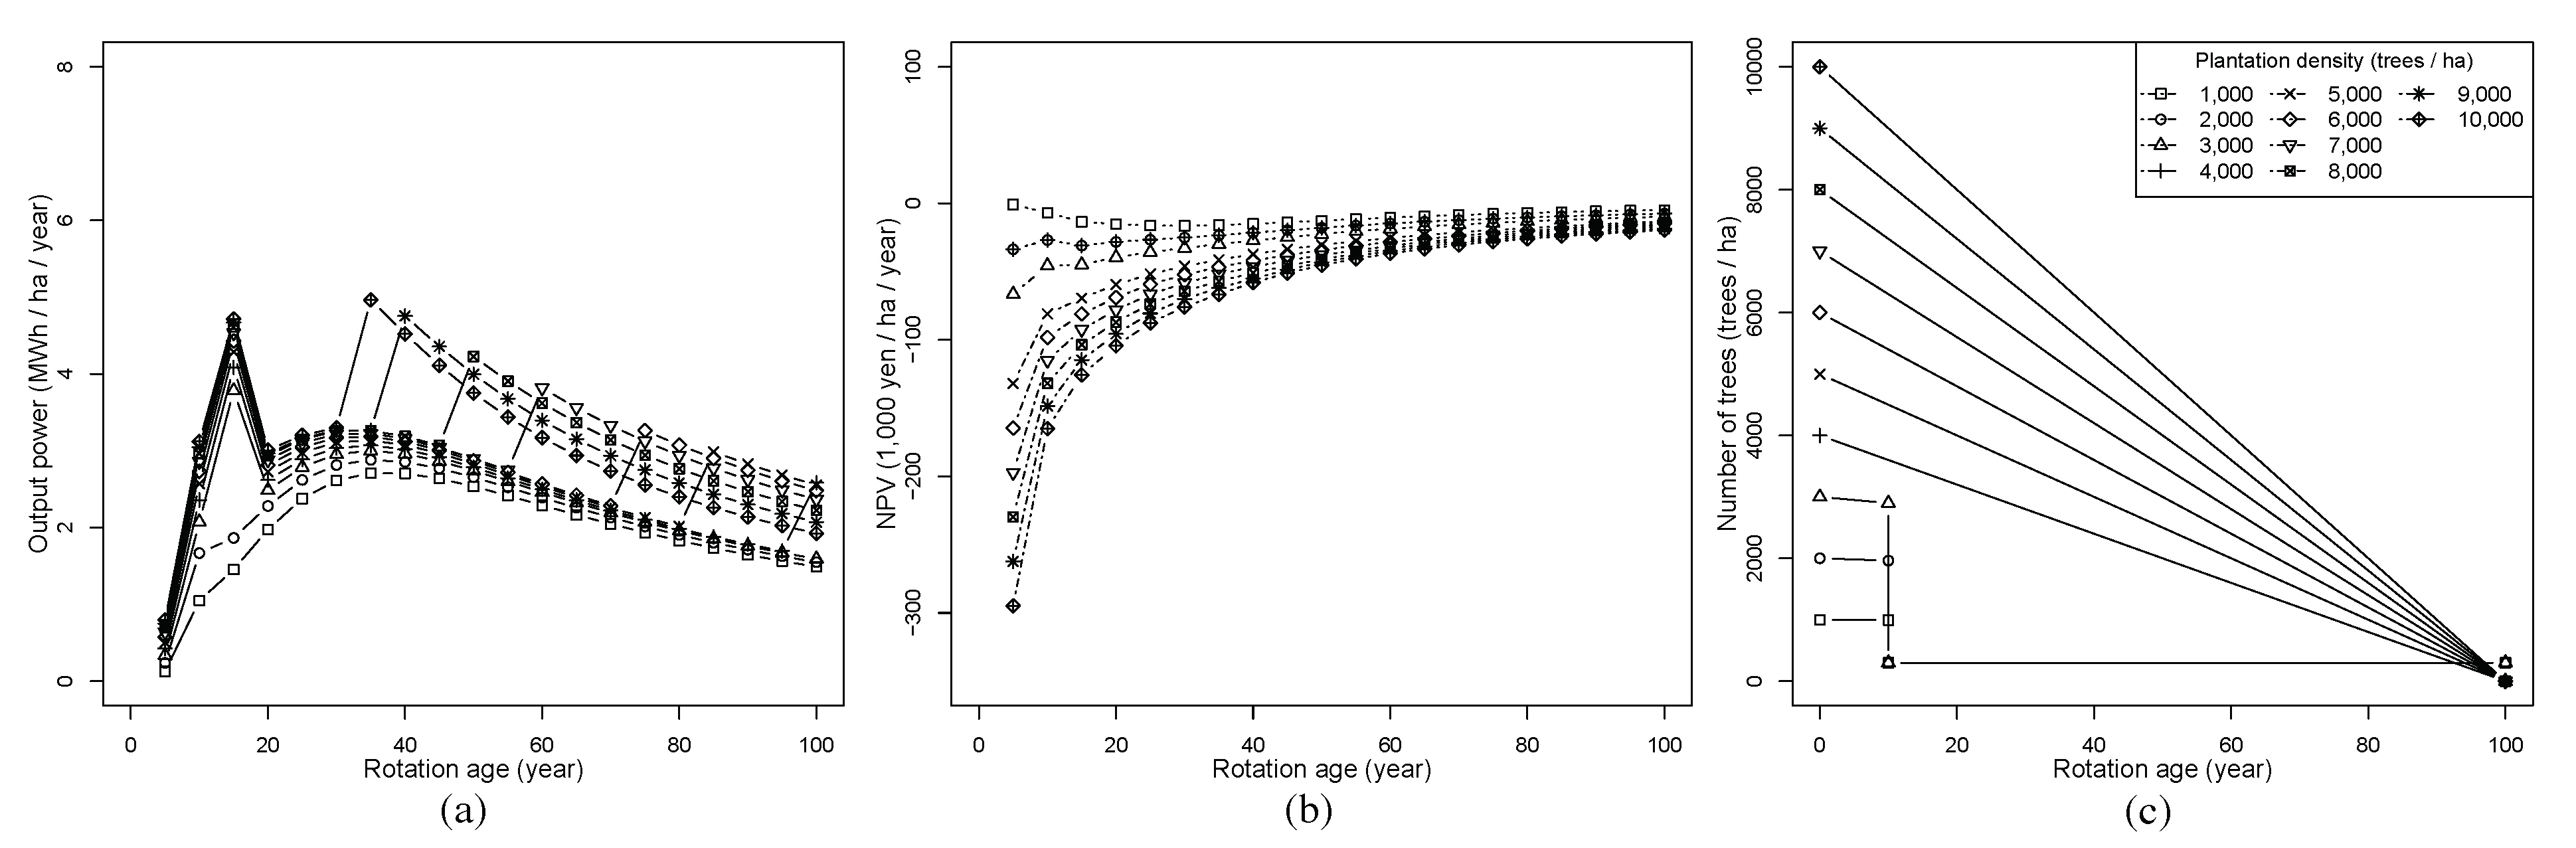
In cases where the NPV or SEV of wood chip production was maximized, high planting densities generated high power until rotation age of 35 years, with a maximum of 4.96 MWh/year observed at 10,000 trees/ha (Figure 2a). Additionally, the NPV and SEV of wood chip production that were maximized showed a negative value at all plantation densities and rotation ages (Figure 2b). In this scenario, the maximum value was NPV of −6480 JPY/ha/year and SEV of −1.0 MM JPY/ha observed at 1000 trees/ha at a rotation age of 5 years, with values decreasing as planting density increased. Figure 2c shows the thinning regime with a rotation age of 100 years, as an example of the thinning regime. The thinning regimes were identical for maximizing NPV and SEV. At planting densities between 1000 and 3000 trees/ha, a thinning strategy that left 298–299 trees at tree age of 10 years, and for which nothing was done during a tree age of 100 years, was chosen. Furthermore, for planting densities between 4000 and 10,000 trees/ha, thinning was not conducted in the strategy chosen; instead, the trees were clear cut at tree age of 100 years.
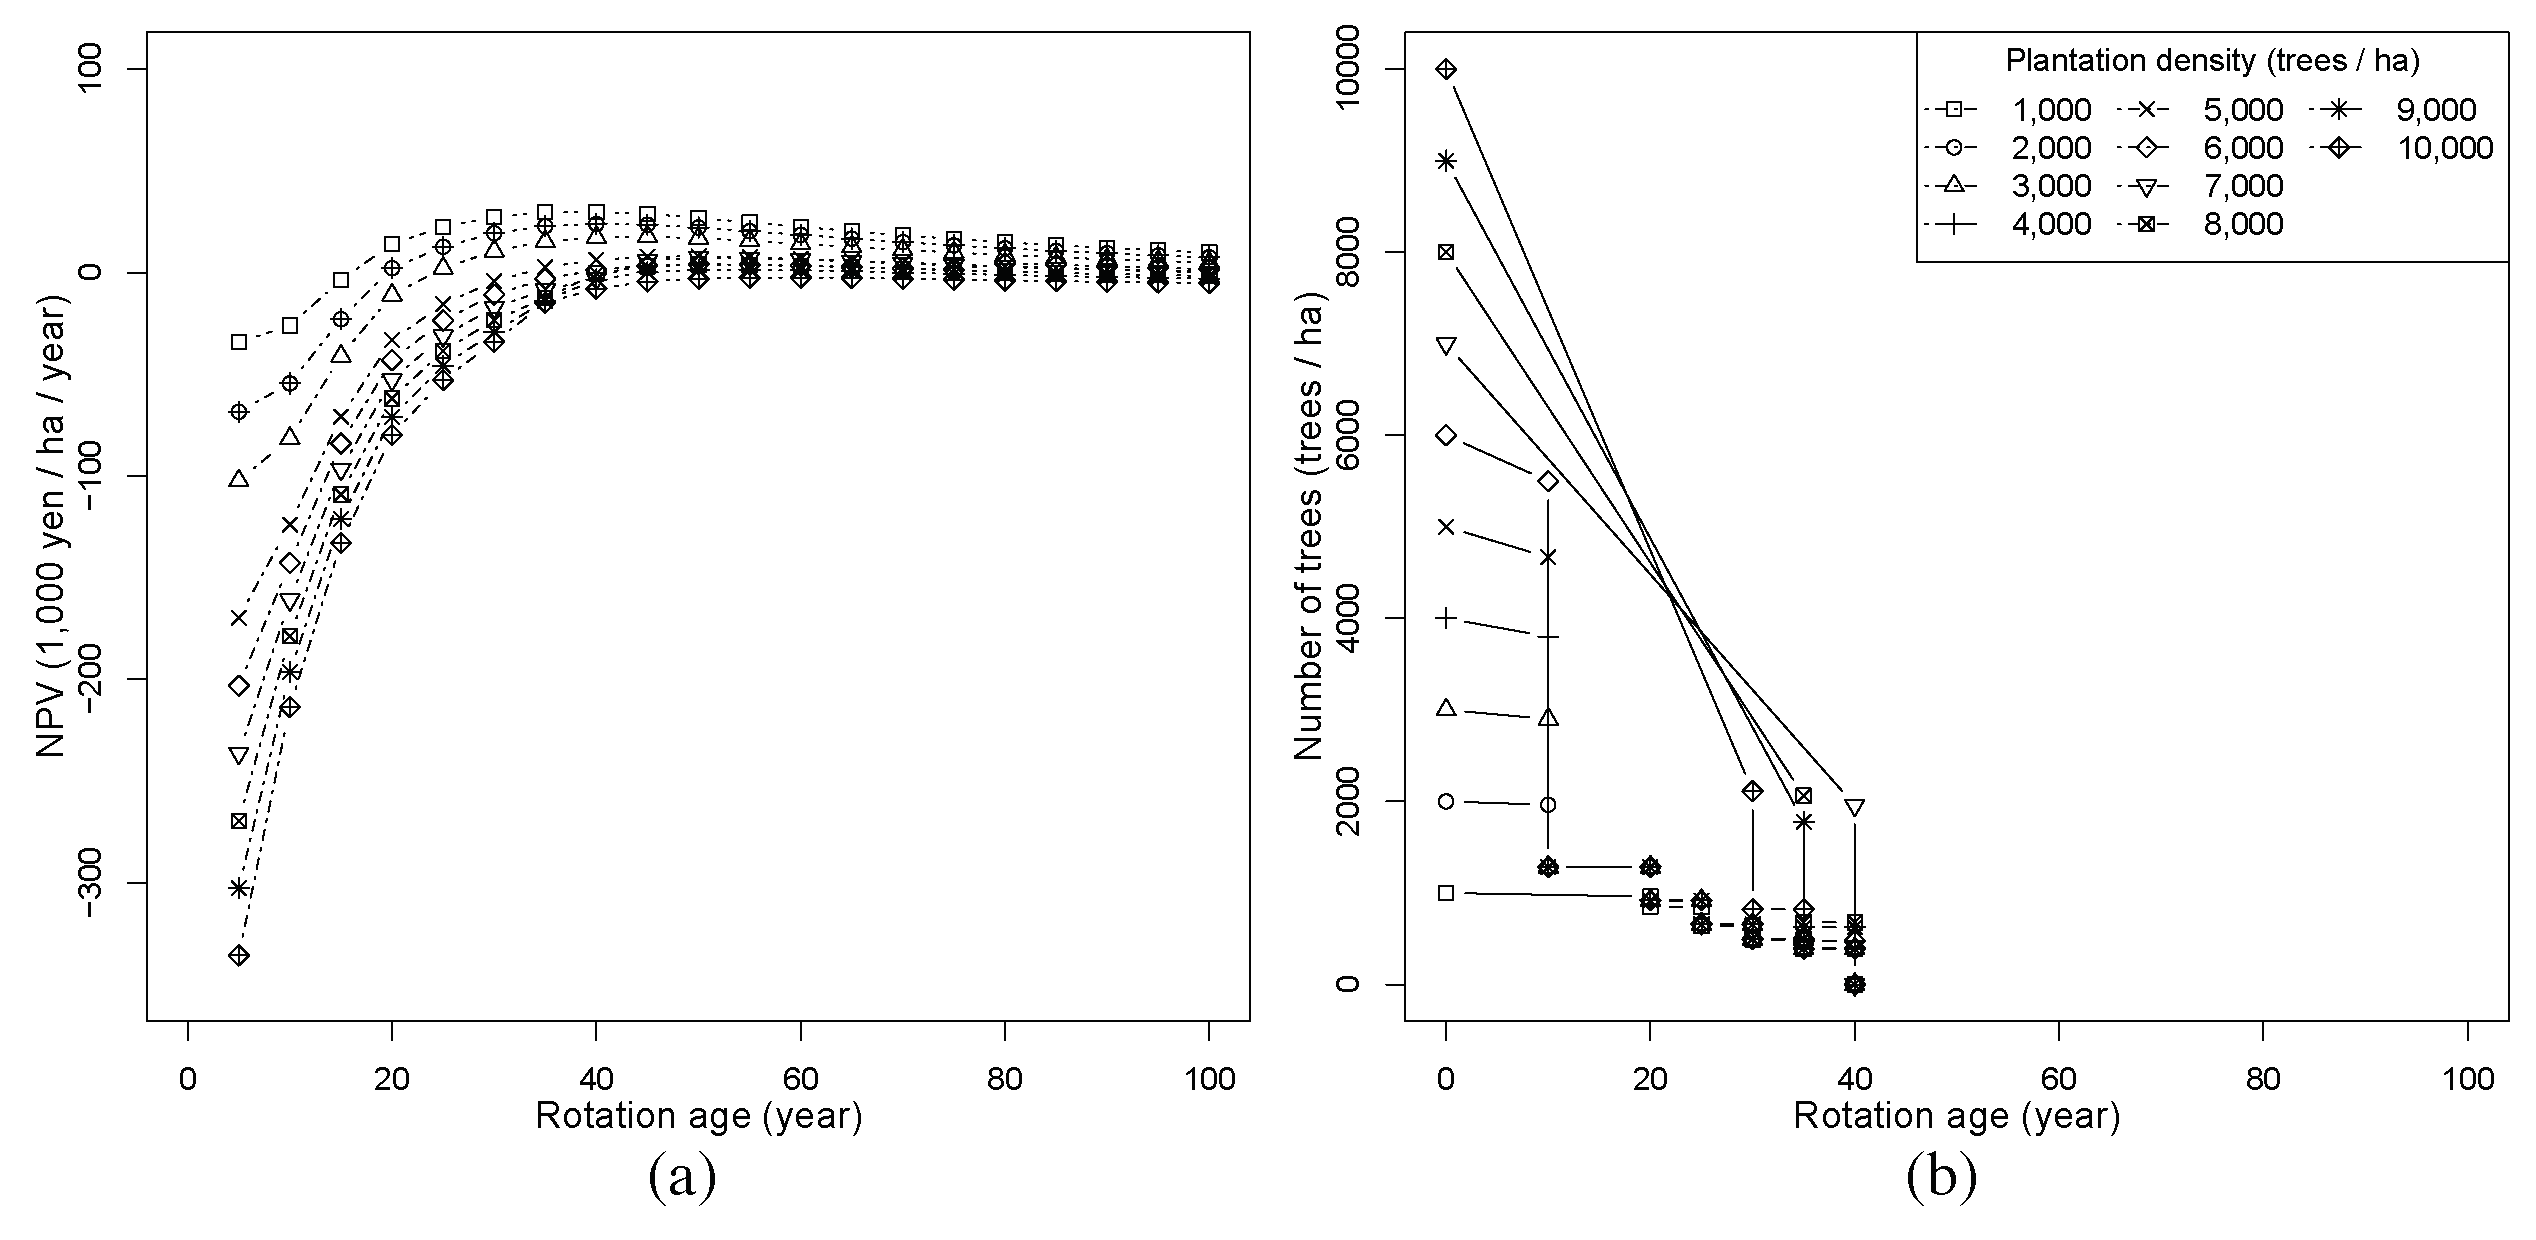
The maximum value of NPV and SEV for saw log production were 29,863 JPY/ha/year and 3.6 MM JPY/ha, respectively, for 1000 trees/ha at a rotation age of 40 years (Figure 3a), the values of which decreased with the increase in planting density. Figure 3b shows the thinning regime with rotation age of 40 years, which is the rotation age of the maximum NPV or SEV value. The thinning regimes were identical for maximizing NPV and SEV. For planting densities with 1000 trees/ha, a strategy of thinning 100–200 trees for every 5 years from a tree age of 20 years was chosen. For planting densities of 2000–6000 trees/ha, a thinning strategy that left nearly 1280 trees at a tree age of 10 years, then 100–350 trees (approximately in volume) are thinned every 5 years. For planting densities with 7000 trees/ha, thinning was not conducted in the strategy chosen; instead, the trees were clear cut at a tree age of 40 years. Furthermore, for planting densities of 8000–10,000 trees/ha, thinning was conducted first at tree age of 30–35 years for approximately 1200–1400 trees.
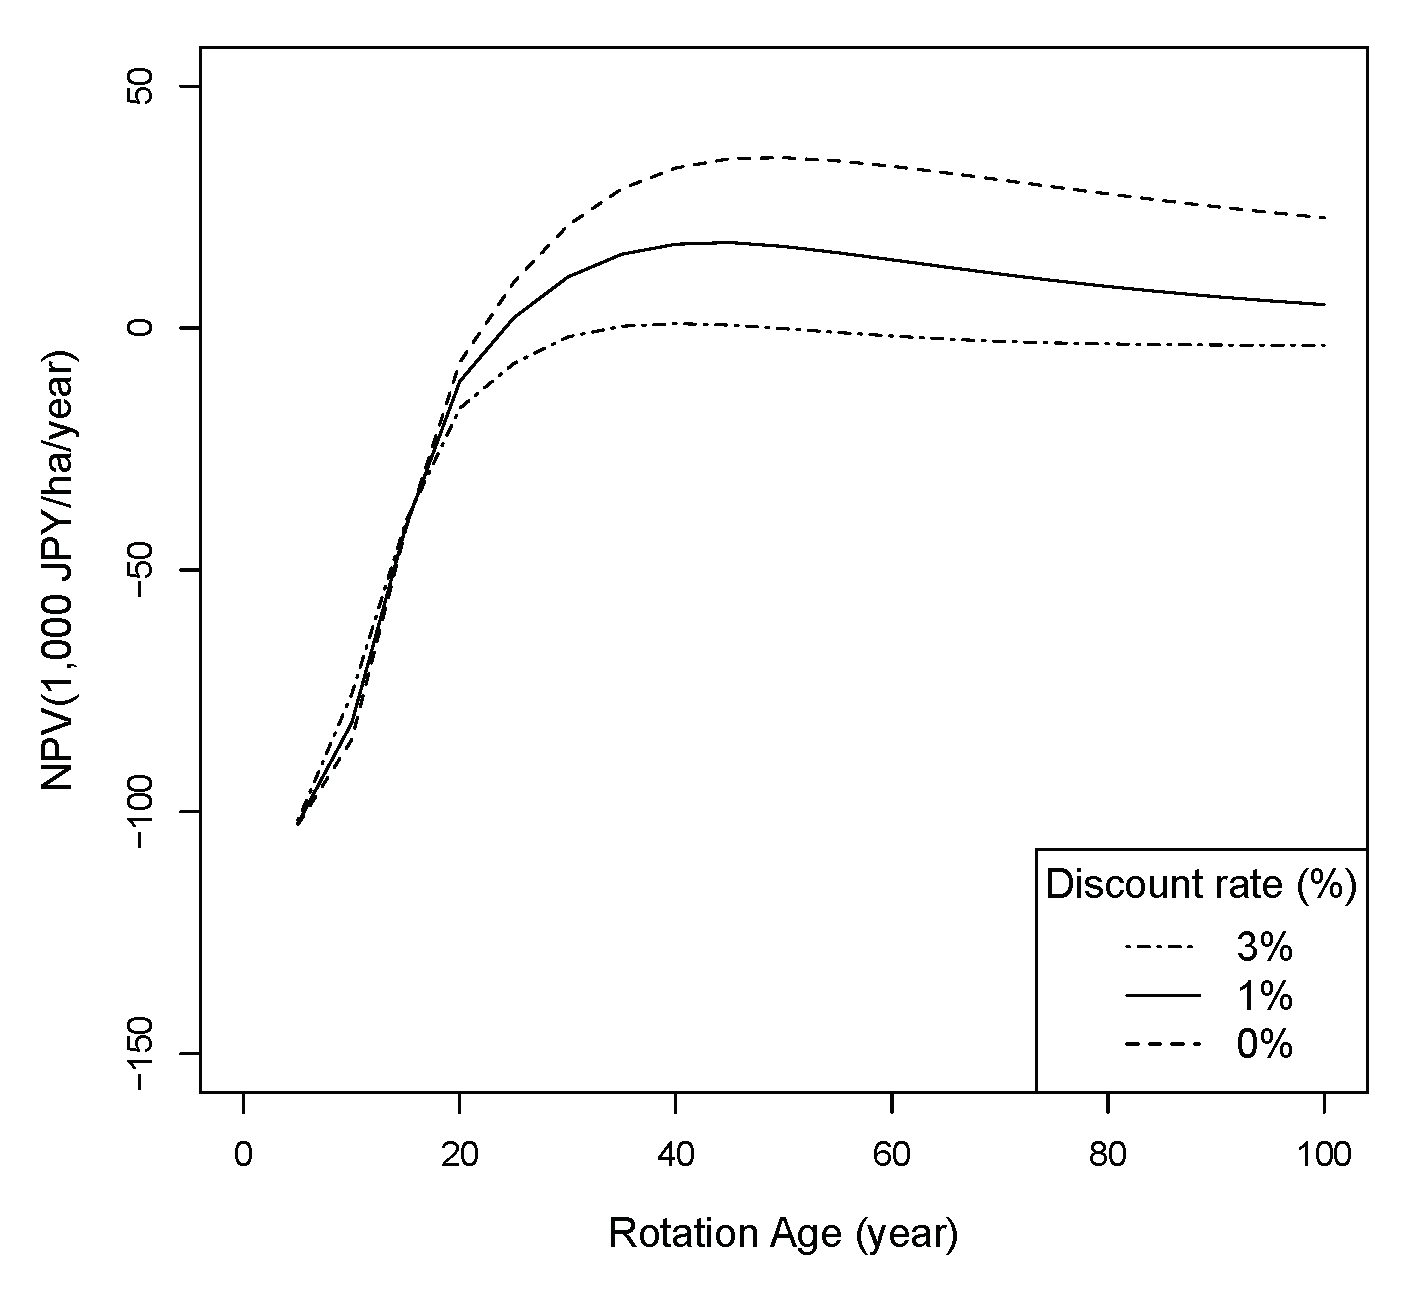
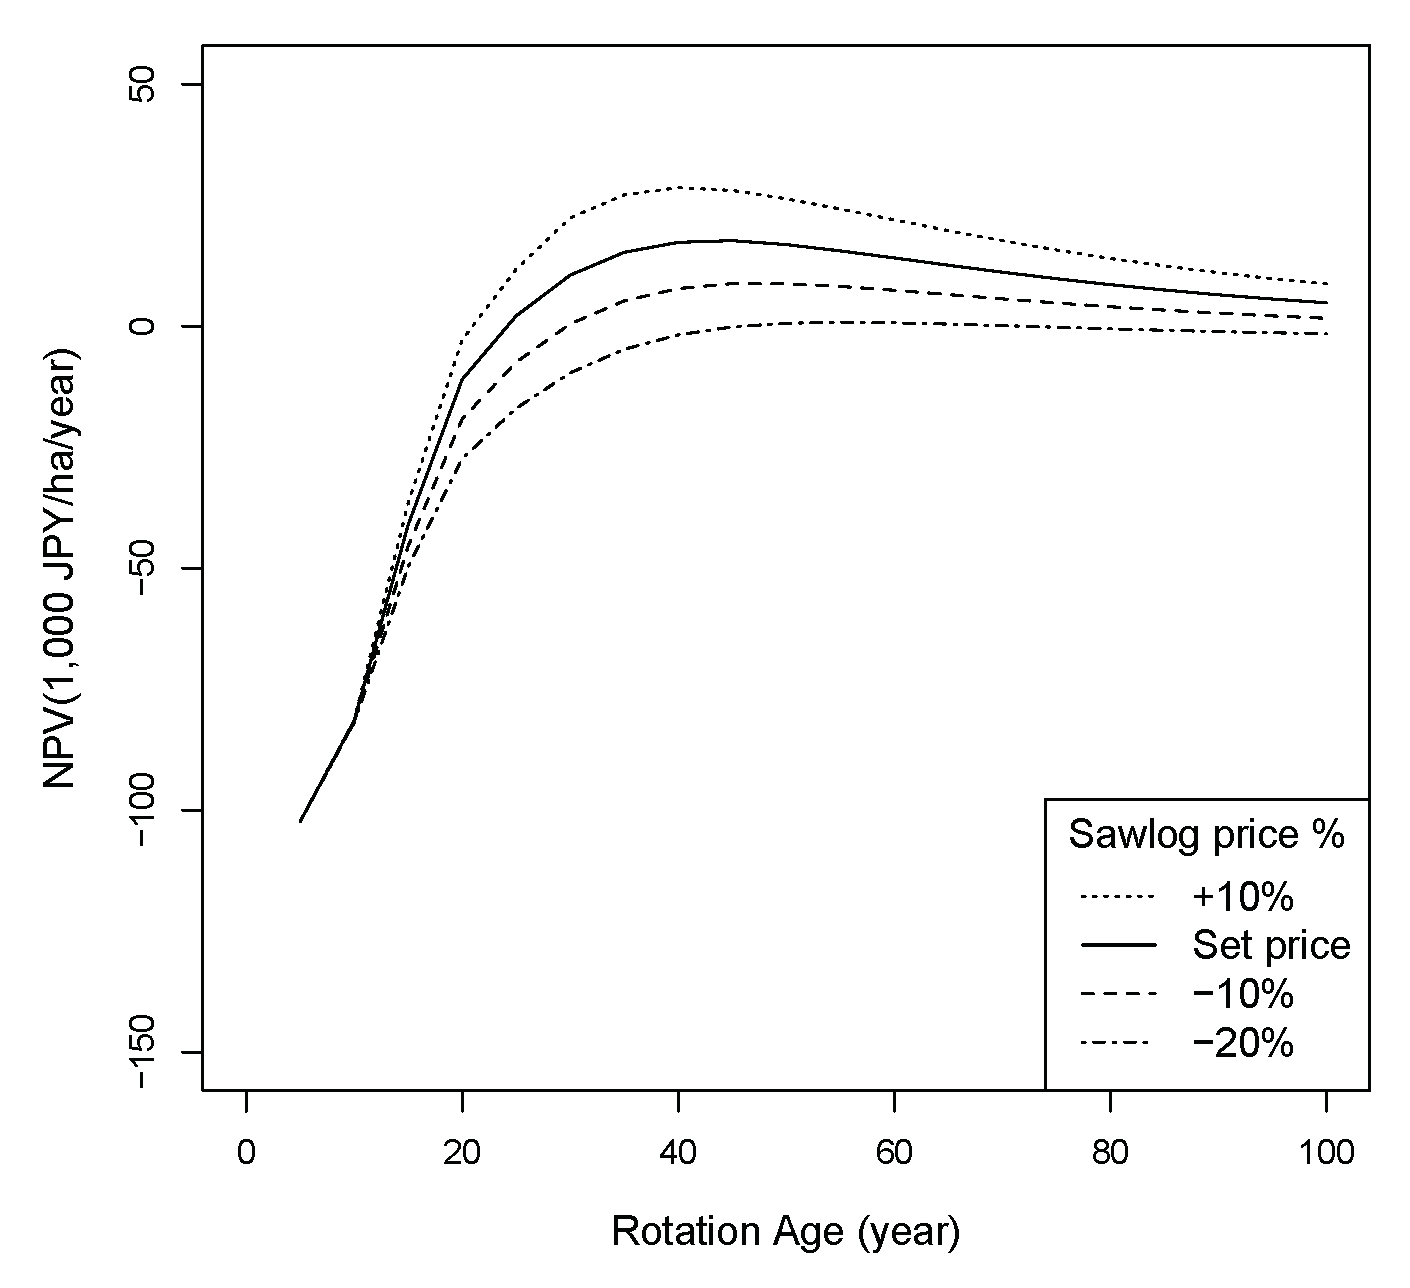
Similar trends were observed when the discount rate was changed between 0%, 1%, and 3%. When planting density was set at 3000 trees/ha, which is the common planting density for cedar in Japan, peaks were observed at 35,203 JPY for a discount rate of 0% and a rotation age of 50 years, 17,668 JPY for 1% and 45 years, and 916 JPY for 3% and 40 years (Figure 4). Additionally, increases in discount rates resulted in decreases in annual NPV. When saw log price was varied between −20%, −10%, and +10%, peaks were observed at 785 JPY for a price of −20% and a rotation age of 55 years, 8789 JPY for −10% and 45 years, and 28,619 JPY for +10% and 40 years, with a decrease in rotation age as saw log prices increased (Figure 5).
The amount of power generated from mega-solar power plants was 924.2 MWh/year for 1 MW PV capacity. Generally the 1 MW PV requires 1–3 ha of land, the generated power is approximately 50–150 times greater than that from woody biomass. The estimated expenditures because of mega-solar power plant introduction for 2018 and 2019 were 311.6 and 252.7 MM JPY, respectively, at a PV capacity of 1 MW. The calculated net profits earned from mega-solar power plants were 90.6 MM JPY and IRR was 3% if the power plant was introduced in 2018 at the pretax solar power purchase price of 18 JPY/kWh. The pretax solar power purchase price for 2019 was 10.5–13.99 JPY/kWh, the calculated net profits were 8.5–8.7 MM JPY, and IRR was 1%.
4. Discussion
In the present study, the profits and electric power generation from managed forests and mega-solar power plants were compared.
The highest amount of electricity generated was 6.2 MWh/year when wood biomass chip production was maximized, with the scenario of 10,000 trees/ha at a rotation age of 30 years and the amount of thinning was identical to that of self-thinning (Figure 1a,c). The amount of electricity generated from mega-solar power plants was 924.2/year for 1 MW PV capacity, if a mega-solar power plant with 1 MW PV capacity is installed on 1–3 ha, the generated power is approximately 50–150 times greater than that from woody biomass. In any case, the high planting density is not realistic, because high plantation cost and the overpopulated stands would likely result in decreased ecosystem services, as existing research has shown that open tree canopies, allow for new tree species to be introduced into managed forests, resulting in increased forest species diversity [48,49]. In cases where the NPV or SEV of wood chip production were maximized, the results showed a negative value at all plantation densities and rotation ages (Figure 2b). Although this current research does not incorporate subsidies, it can be concluded that forests managed primarily for the production of wood chips for power generation are not economically feasible. The maximum NPV for one timber rotation and SEV from forest management under the optimal thinning and harvesting strategies were calculated as 29,863 JPY/ha/year and 3.6 MM JPY/ha, respectively. And also, the site quality of the study site was relatively good, the revenue from the forest management might be much lower, depending on the site quality. The severity of the management in forestry is apparent, although the subsidy was not taken into account this time. According to the surveys on forest management by the Ministry of Agriculture, Forestry, and Fisheries in 2009 and 2015, approximately 40% of the respondents answered that they more or less do not take care of their forests and 50% answered that they own forests but do not intend to manage the forest [50,51], thereby highlighting the abandonment of forest management. Abandoned artificial forests reportedly cause a decrease in watershed function and changes in vegetation [52,53]. In addition, the problem of “reforestation abandonment,” in which reforestation is not conducted after clear cutting, has been recognized since the 1990s, when the postwar expansion forestation reached the main logging season [54], and is a persistent problem even at present. The lack of viable management may be one of the factors that encourage the conversion of forestland to solar panels. However, unregulated conversion from forestland to solar facilities due to economic unsustainability may make it difficult to maintain sustainable forest ecosystem services.
As for profit from the mega-solar power plant, the results showed that it was profitable with the purchase price of 2018, however, the profit of 2019 seems to be sensitive to the purchase price. The IRR for 2019 was 1% while the IRR for 2018 was 3%. The simulation in this study showed that the installation of the mega-solar power plants may not be always profitable. Because Japan’s solar power generation costs are not falling as rapidly as outside Japan [45], from 2019, the solar power purchase price was decided during the bidding system. The lowest bid price was set based on the previous year’s prices from the top providers with low implementation costs. The intention is to encourage cost reduction by introducing a bidding system and to make the solar power business independent from the FIT system [42]. Developing a management plan that aims to be independent from FIT is required at present because operating under a business plan that does not have a negative impact while also simultaneously considering various risks and reducing costs is essential. Nevertheless, mega-solar power plant installation is a relatively low-risk business because the solar power purchase price is fixed from the beginning to the next 20 years. At the stage of installation, it is possible to determine whether it may profitable or not. Once it is determined that installation of the mega-solar power plants is profitable, it could happen that the forest will be easily converted to mega-solar power plants. The NPV for one timber rotation and SEV, which calculates the value of bare land in perpetual timber production, were calculated in this study. The forest owner may decide to convert to mega-solar facilities with the short-term revenue from the forest management because half of the forest owners do not intend to manage their forest as mentioned above. Therefore, the profit difference between forest management and installation of mega-solar power plants provided in this simulation, both NPV and SEV for forest management could be used effectively to set economic incentives, such as environmental taxes and subsidies, to ensure that managed forests are not converted to mega-solar facilities. For example, Howard (1997) has simulated several silvicultural management regimes, SEV, silvicultural and economic analysis, and the opportunity cost of managing a sustainable ecosystem using some simulator. Through this simulation, the explicit costs made it possible to represent complex issues of land management decision-making in a simple and understandable manner [5].
In this study, the simulation applies to a limited situation wherein forests are converted to mega-solar power plants. However, the land use planning should be considered from the perspective of sustainable development of surrounding areas including forests. Angelstam et al. [55] assessed regional profiles of benefits from forest landscapes in several countries that have different types of land ownership and political cultures and emphasized the need for an evidence-based collaborative learning processes that include both different academic disciplines as well as stakeholders that represent different sectors and levels of governance. Regarding the installation of mega-solar power plants after deforestation, many complaints have been received due to landscape and landslide hazards [56], and there has been a movement against mega-solar power plants [57]. Land-use planning should be developed across different academic disciplines and stakeholders, taking into account the economic, ecological, and social balance. Various laws, penalties, taxes, subsidies, etc. should then be formulated, as necessary, to prevent unbalanced development from occurring.
5. Conclusions
This research compared the profits and energy generated by mega-solar power plants installed on deforested land to those generated from managed forests. It was found that 50–150 times more power was generated by the mega-solar power plants than the maximum amount of power generated from woody biomass in the form of wood chips. Additionally, in cases where NPV or SEV of wood chip production was maximized, the results showed a negative value at all plantation densities and rotation ages; forests managed primarily to produce wood chips for power generation is not economically feasible. The most profitable forest management plan was calculated NPV of 29,863 JPY/ha/year and SEV of 3.6 MM JPY/ha from saw log production with a planting density of 1000 trees/ha at a rotation age of 40 years. On the other hand, the profit of mega-solar power plant with 1 MW PV capacity was NPV of 8.5–90.6 MM JPY/1–3 ha (0.1–3.0 MM JPY/ha/year), and the IRR was 1–3%. The profit from the installation of the mega-solar power plants seems to be sensitive to the solar power purchase price. However, once it is determined that installation of the mega-solar power plants is profitable than forest management, it could happen that the forest will be easily converted to the mega-solar facility. At that time, by encouraging incentives with a view to short-term profits as NPV for one timber rotation, it may be possible to prevent forest owners from easily converting forestland to mega-solar power plants to obtain certain profits.
The difference between the amount of electricity generated by mega-solar power plants and the benefits from forest management revealed in this study is fundamentally important for estimating the costs associated with the management of forest ecosystems. The information obtained from this simulation can be effectively used to set economic incentives, such as environmental taxes and subsidies, to prevent conversion of managed forests into mega-solar power plants. For the installation of mega-solar power plants after deforestation, those economic incentives should be formulated to prevent unbalanced development, taking into account the economic, ecological, and social balance. In contrast, the installation of mega-solar power plants is far more profitable than forest management. Still, with the phasing out of the FIT, the purchase price is declining, and there is now a need to formulate management plans aimed at independence from FIT.
Further research could be conducted in the future to clarify what forest ecosystem services have already been lost to mega-solar power plants, the environmental impact that occurs when power panels are disposed, and the treatment of the site after the panels have been removed. There is also a need to identify the impact of differences in site quality on timber production profits. Moreover, since this current research set the lifespan of a mega-solar facility at 30 years, future research is needed to compare longer periods of time, when the lifespan of the solar panels has been exceeded, which could result in a significant amount of power generation deterioration, and increased facility repairs. Further research is also needed to consider the influences of forest management abandonment and reforestation abandonment, where reforestation is not conducted following clear cutting, also need to be considered in these types of long-term analyses. Finally, more research, which considers the fact that managed forest enterprises typically seek long-term felling utilization plans based on timber demand, woody biomass power plant location, supplied amounts, and ecosystem services maintenance, is needed. In the future, these issues need to be overcome for the mathematical optimization models proposed in this study to be widely used with the objective of providing decision-making support regarding the creation of mega-solar facilities from forested land. In general, mathematical optimization models that can be adapted to address a wide range of social conditions and needs via the revision and expansion of their objective functions and constraint equations can be extremely effective tools for objective decision-making.
Funding
This research received no external funding.
Data Availability Statement
Not Applicable.
Acknowledgments
I would like to thank Konoshima M, who provided valuable comments.
Conflicts of Interest
The authors declare no conflict of interest.
Abbreviations
The following abbreviations are used in this manuscript:
| PV | Photovoltaic |
| FIT | feed-in tariffs |
| NPV | net present value |
| SEV | soil expectation value |
| IRR | internal rate of return |
| MSPATH | multi-stage projection alternative technique |
| DBH | diameter at breast height |
References
- The Website for Publishing Information on the Feed-In Tariff System 2020. Available online: https://www.fit-portal.go.jp/PublicInfoSummary (accessed on 18 June 2020).
- Summary of the Cabinet Order for Partial Amendment of the Order for Enforcement of the Environmental Impact Assessment Act 2019. Available online: http://www.env.go.jp/press/files/jp/112004.pdf (accessed on 18 June 2020).
- Collection of Examples of Initiatives by Local Governments for Environmental Conservation Measures in Solar Power Generation Projects 2016. Available online: http://www.env.go.jp/press/files/jp/103162.pdf (accessed on 24 August 2020).
- Views on the Pricing of REDD+ and Other Forest-Based Credits. Available online: https://www.kkc.co.jp/service/env_energy/pdf/research_vol_01.pdf (accessed on 26 January 2021). (In Japanese).
- Howard, J.L. An estimation of opportunity cost for sustainable ecosystems. In Proceedings of the XI World Forestry Congress, Antalya, Turkey, 13–22 October 1997; Volume 2, pp. 41–47. [Google Scholar]
- Søvde, N.E.; Sætersdal, M.; Løkketangen, A. A scenario-based method for assessing the impact of suggested woodland key habitats on forest harvesting costs. Forests 2014, 5, 2327–2344. [Google Scholar] [CrossRef] [Green Version]
- Straka, T.J.; Bullard, S.H. The land expectation value calculated in timberland valuation. Apprais. J. 1996, 64, 399–405. [Google Scholar]
- Liski, J.; Pussinen, A.; Pingoud, K.; Mäkipää, R.; Karjalainen, T. Which rotation length is favourable to carbon sequestration? Can. J. For. Res. 2004, 31, 2004–2013. [Google Scholar] [CrossRef]
- Henninger, C.R.; MacLean, D.A.; Amos-Binks, L.J. A novel approach to optimize management strategies for carbon stored in both forests and wood products. For. Ecol. Manag. 2008, 256, 786–797. [Google Scholar] [CrossRef]
- Nghiem, N. Optimal rotation age for carbon sequestration and biodiversity conservation in Vietnam. For. Policy Econ. 2014, 38, 56–64. [Google Scholar] [CrossRef]
- Triviño, M.; Pohjanmies, T.; Mazziotta, A.; Juutinen, A.; Podkopaev, D.; Tortorec, E.L.; Mönkkönen, M. Optimizing management to enhance multifunctionality in a boreal forestlandscape. J. Appl. Ecol. 2017, 54, 61–70. [Google Scholar] [CrossRef]
- Brodie, J.D.; Kao, C. Optimizing thinning in Douglas fir with three descriptor dynamic programming to account for accelerated diameter growth. For. Sci. 1979, 25, 665–672. [Google Scholar]
- Brodie, J.D.; Haight, R.G. Optimization of silvicultural investment for several types of stand projection systems. Can. J. For. Res. 1985, 15, 188–191. [Google Scholar] [CrossRef]
- Haight, R.G.; Brodie, J.D.; Dahms, W.G. A dynamic programming algorithm for optimization of lodgepole pine management. For. Sci. 1985, 31, 321–330. [Google Scholar]
- Kao, C.; Brodie, J.D. Determination of optimal thinning entry interval using dynamic programming. For. Sci. 1979, 25, 672–674. [Google Scholar]
- Asante, P.; Armstrong, G.W.; Adamowicz, W.L. Carbon sequestration and the optimal forest harvest decision: A dynamic programming approach considering biomass and dead organic matter. J. For. Econ. 2011, 17, 3–17. [Google Scholar] [CrossRef]
- Yoshimoto, A.; Yanagihara, H.; Nomoto, M. Carbon sequestration and optimal thinning regimes from forest stand optimization modeling. FORMATH 2005, 4, 71–92. [Google Scholar] [CrossRef]
- Sedjo, R.; Tian, X. An Investigation of the carbon neutrality of wood bioenergy. J. Environ. Prot. Ecol. 2012, 3, 989–1000. [Google Scholar] [CrossRef] [Green Version]
- Vass, M.; Elofsson, K. Is forest carbon sequestration at the expense of bioenergy and forest products cost-efficient in EU climate policy to 2050? J. For. Econ. 2016, 24, 82–105. [Google Scholar] [CrossRef] [Green Version]
- McCarthy, M.A.; Possingham, H.P.; Gill, A.M. Using stochastic dynamic programming to determine optimal fire management for Banksia ornate. J. Appl. Ecol. 2001, 38, 585–592. [Google Scholar] [CrossRef] [Green Version]
- Stirn, L.Z. Integrating the fuzzy analytic hierarchy process with dynamic programming approach for determining the optimal forest management decisions. Ecol. Model. 2006, 194, 296–305. [Google Scholar] [CrossRef]
- Yoshimoto, A.; Paredes, V.G.L.; Brodie, J.D. Efficient optimization of an individual tree growth model. USDA For. Serv. Gen. Tech. Rep. 1998, 16, 154–162. [Google Scholar]
- Nakama, K.; Ota, T.; Mizoue, N.; Yoshida, S. Effects of Recovering Logging Residues on Strategy and Benefits of Forest Stand Management. J. Jpn. For. Soc. 2011, 93, 226–234. [Google Scholar] [CrossRef]
- Ota, T.; Takahira, S.; Nakama, K.; Yoshida, S.; Mizoue, N. Effectiveness of Low-density Planting in Terms of Planting Cost Reduction and Felling Income Reduction. J. Jpn. For. Soc. 2013, 95, 126–133. [Google Scholar] [CrossRef] [Green Version]
- Yoshimoto, A.; Marušák, R. Evaluation of carbon sequestration and thinning regimes within the optimization framework for forest stand management. Eur. J. For. Res. 2007, 126, 315–329. [Google Scholar] [CrossRef]
- Konoshima, M.; Yoshimoto, A. Evaluating the Effect of Bio-Energy Use on Optimal Thinning Regimes through a Dynamic Programming Model. FORMATH 2010, 9, 9–101. [Google Scholar] [CrossRef]
- Yoshimoto, A. A Dynamic Programming Model for Forest Stand Management Using MSPATH Algorithm. Proc. Inst. Stat. Math. 2003, 51, 73–94. [Google Scholar]
- Faustman, M. Berechnung des Wertes, welchen Waldboden, sowie noch nicht haubare Holzbestände für die Waldwirtschaft besitzen. Allgemeine Forst-und Jagd-Zeitung 1849, 15, 441–455. [Google Scholar]
- Japanese Forestry Agency. A User Guide for Stand Density Management Diagram for Planted Sugi (Cryptomeria japonica) Forest Stands; Forestry Agency: Tokyo, Japan, 1980; p. 84. [Google Scholar]
- Richards, F.J. A Flexible growth function for empirical use. J. Exp. Bot. 1959, 10, 290–300. [Google Scholar] [CrossRef]
- Narasaki, K.; Maeda, H.; Sasaki, S. Preparation of a stand density control diagram and a site index curve for Sugi (Cryptomeria japonica) plantations to construct a system yield table in Fukuoka Prefecture. Bull. Fukuoka Agric. For. Res. Cent. 2015, 1, 38–43. [Google Scholar]
- Annual Report on Forest and Forestry in Japan 2011. Available online: https://www.rinya.maff.go.jp/j/kikaku/hakusyo/23hakusyo/190411_5.html (accessed on 26 January 2021).
- Agricultural, Forestry and Fisheries Statistics 2018. Available online: http://www.maff.go.jp/j/tokei/kouhyou/mokuryu/kakaku/attach/pdf/index-29.pdf (accessed on 18 June 2020).
- Inoue, A.; Kurokawa, Y. New Method for Estimating Relative Stem Profile Equations: Application to System Yield Tables. J. Jpn. For. Soc. 2001, 83, 1–4. [Google Scholar]
- Standard Unit Price for Fiscal Year of 2018. Available online: https://www.pref.oita.jp/uploaded/attachment/2029309.pdf (accessed on 18 June 2020).
- Annual Report on Forest and Forestry in Japan 2017. Available online: https://www.rinya.maff.go.jp/j/kikaku/hakusyo/29hakusyo/index.html (accessed on 26 January 2021).
- Noda, H.; Takahashi, R.; Takahata, K. The Estimated Impact of a Woody Biomass Power Generation System on the Management of Japanese Red Pine Forest. J. Life Cycle Assess. Jpn. 2015, 11, 154–171. [Google Scholar] [CrossRef] [Green Version]
- Report on Survey and Analysis of Wood Chip Conversion Project. Available online: http://zmchip.com (accessed on 18 June 2020).
- Database on Solar Radiation. Available online: http://www.nedo.go.jp/library/nissharyou.html (accessed on 18 June 2020).
- New Energy and Industrial Technology Development Organization. Solar Power Generation Deployment Guidebook; New Energy and Industrial Technology Development Organization: Tokyo, Japan, 2000; p. 180. [Google Scholar]
- Report on the Study on the Feasibility of Spreading Renewable and Other Distributed Energy in 2050. Available online: https://www.env.go.jp/earth/report/h26-01/index.html (accessed on 18 June 2020).
- Comments on the Procurement Price and Other Issues in Fiscal Year 2020. Available online: https://www.meti.go.jp/shingikai/santeii/pdf/20200204001_1.pdf (accessed on 24 August 2020).
- Report of the Cost Estimation Committee 2011. Available online: https://www.env.go.jp/council/06earth/y060-100/mat02_3.pdf (accessed on 18 June 2020). (In Japanese)
- Renewable Energy Purchase Price and Unit Price for Renewable Energy in Fiscal Year 2018. Available online: http://www.meti.go.jp/press/2017/03/20180323006/20180323006.html (accessed on 18 June 2020).
- Cost of Solar Power Generation in Japan. Available online: https://www.renewable-ei.org/pdfdownload/activities/Report_SolarCost_201907.pdf (accessed on 24 August 2020).
- Bidding System under the FIT 2020. Available online: https://nyusatsu.teitanso.or.jp (accessed on 3 August 2020). (In Japanese).
- Comments on the Procurement Prices and Other Issues in and after Fiscal Year 2019. Available online: https://www.meti.go.jp/shingikai/santeii/pdf/20190109001_01.pdf (accessed on 24 August 2020).
- Kiyono, Y. Dynamics and control of understories in Chamaecyparis obtuse Plantations. Bull. For. For. Prod. Res. Inst. 1990, 359, 1–122. [Google Scholar]
- Fujimori, T. Consider the issue of thinning. Why is thinning necessary? Jpn. For. Soc. 2005, 44, 4–8. [Google Scholar]
- Result of Opinion Survey on Forest Management 2009. Available online: https://www.maff.go.jp/j/finding/mind/attach/pdf/index-37.pdf (accessed on 18 February 2021).
- Survey on Awareness and Intention for Circular Use Forest Resources. Available online: https://www.maff.go.jp/j/finding/mind/pdf/sinrin_27.pdf (accessed on 18 February 2021).
- Oohara, H. The necessity for the research on the relationship between transition of forest floor vegetation accompanying thinning and function of soil and water conservation in artificial sugi (Cryptomeria japonica) forest. Bull. FFPRI 2007, 6, 127–134. [Google Scholar]
- Kume, T.; Higashi, N.; Wakiyama, Y.; Kanamaru, Y.; Ide, J.; Otsuki, K. Soil properties and moisture retention capacity in the Ochozu Experimental Watershed covered by an unmanaged man-made forest, Kyushu, Japan. Bull. Kyusyu Univ. For. 2008, 89, 13–27. [Google Scholar]
- Sakai, M. Forest owner’s mind for forest management and reorganization of forest policy (I): Negligence of forest operation on planted forest. Kyushu Univ. Inst. Repos. 1997, 76, 25–38. [Google Scholar]
- Angelstam, P.; Naumov, V.; Elbakidze, M.; Manton, M.; Priednieks, J.; Rendenieks, Z. Wood production and biodiversity conservation are rival forestry objectives in Europe’s Baltic Sea Region. Ecosphere 2018, 9, 1–26. [Google Scholar] [CrossRef] [Green Version]
- Report of the Study Group on the Basic Concept of Environmental Impact Assessment for Solar Power Generation Facilities. Available online: https://www.env.go.jp/press/files/jp/110948.pdf (accessed on 18 February 2021).
- Report of the Study Group on the Forestland Development Permit Standards for Solar Power Generation. Available online: https://www.rinya.maff.go.jp/j/tisan/tisan/attach/pdf/con_4-10.pdf (accessed on 18 February 2021).
Figure 1.
The electric output power (a) and net present value (NPV) (b) when wood chip production was maximized, and the optimal thinning regime for the rotation age of 30 years (c). The legend of the plantation density is shown in the figure (a).
Figure 1.
The electric output power (a) and net present value (NPV) (b) when wood chip production was maximized, and the optimal thinning regime for the rotation age of 30 years (c). The legend of the plantation density is shown in the figure (a).

Figure 2.
The electric output power (a) and NPV (b), when NPV was maximized for wood chip production, and the optimal thinning regime for the rotation age of 100 years (c). The legend of the plantation density is shown in the figure (a).
Figure 2.
The electric output power (a) and NPV (b), when NPV was maximized for wood chip production, and the optimal thinning regime for the rotation age of 100 years (c). The legend of the plantation density is shown in the figure (a).

Figure 3.
The NPV when the NPV was maximized for saw log production (a). The optimal thinning regime for the rotation age of 40 years (b). The legend of the plantation density is shown in the figure (a).
Figure 3.
The NPV when the NPV was maximized for saw log production (a). The optimal thinning regime for the rotation age of 40 years (b). The legend of the plantation density is shown in the figure (a).

Figure 4.
The relationship between the discount rate and the NPV of saw log production at a plantation density of 3000 trees/ha.
Figure 4.
The relationship between the discount rate and the NPV of saw log production at a plantation density of 3000 trees/ha.

Figure 5.
The relationship between the saw log price and the NPV for saw log production at a plantation density of 3000 trees/ha.
Figure 5.
The relationship between the saw log price and the NPV for saw log production at a plantation density of 3000 trees/ha.


Table 1.
Saw log price (DBH, diameter at breast height).
| DBH (cm) ( ≤ DBH ≤ ) | Price (JPY/) | |
|---|---|---|
| 9.0 | 14.9 | 7000 |
| 15.0 | 19.9 | 11,000 |
| 20.0 | 29.9 | 13,000 |
| 30.0 | 39.9 | 15,000 |
Table 2.
Installation and operation costs (median) for solar power systems of more than 1 and less than 2 MW photovoltaic (PV) capacity for 2018 and 2019 (1000 JPY (Japanese Yen)/kW) [42].
Table 2.
Installation and operation costs (median) for solar power systems of more than 1 and less than 2 MW photovoltaic (PV) capacity for 2018 and 2019 (1000 JPY (Japanese Yen)/kW) [42].
| 2018 | 2019 | |
|---|---|---|
| System costs | 271.0 | 222.0 |
| Land development costs | 17.8 | 9.8 |
| Continuing costs | 7.3 | 5.2 |
| Operation maintenance costs | 5.5 | 5.7 |
| Disposal fee | 10.0 | 10.0 |
| Total | 311.6 | 252.7 |
Publisher’s Note: MDPI stays neutral with regard to jurisdictional claims in published maps and institutional affiliations. |
© 2021 by the author. Licensee MDPI, Basel, Switzerland. This article is an open access article distributed under the terms and conditions of the Creative Commons Attribution (CC BY) license (http://creativecommons.org/licenses/by/4.0/).
Share and Cite
MDPI and ACS Style
Itaka, S. Economic Analysis of Cedar Plantation Management and Mega-Solar Replacement. Forests 2021, 12, 361. https://doi.org/10.3390/f12030361
AMA Style
Itaka S. Economic Analysis of Cedar Plantation Management and Mega-Solar Replacement. Forests. 2021; 12(3):361. https://doi.org/10.3390/f12030361
Chicago/Turabian StyleItaka, Shizu. 2021. "Economic Analysis of Cedar Plantation Management and Mega-Solar Replacement" Forests 12, no. 3: 361. https://doi.org/10.3390/f12030361
Note that from the first issue of 2016, this journal uses article numbers instead of page numbers. See further details here.