Article

Interactions between Climate and Stand Conditions Predict Pine Mortality during a Bark Beetle Outbreak

by
Paul J. Chisholm
1,*,
Camille S. Stevens-Rumann
2,3 and
Thomas Seth Davis
2
1
College of Natural Resources, University of Idaho, Moscow, ID 83844, USA
2
Forest and Rangeland Stewardship, Warner College of Natural Resources, Colorado State University, Fort Collins, CO 80523, USA
3
Colorado Forest Restoration Institute, Fort Collins, CO 80523, USA
*
Author to whom correspondence should be addressed.
Forests 2021, 12(3), 360; https://doi.org/10.3390/f12030360
Submission received: 6 February 2021 / Revised: 10 March 2021 / Accepted: 15 March 2021 / Published: 18 March 2021
(This article belongs to the Section Forest Ecology and Management)

Abstract

:
In temperate coniferous forests, biotic disturbances such as bark beetle outbreaks can result in widespread tree mortality. The characteristics of individual trees and stands, such as tree diameter and stand density, often influence the probability of tree mortality during a bark beetle outbreak. However, it is unclear if these relationships are mediated by climate. To test this, we assembled tree mortality data for over 3800 ponderosa pine trees from Forest Inventory and Analysis (FIA) plots measured before and after a mountain pine beetle outbreak in the Black Hills, South Dakota, USA. Logistic models were used to determine which tree, stand, and climate characteristics were associated with the probability of mortality. Interactions were tested between significant climate variables and significant tree/stand variables. Our analysis revealed that mortality rates were lower in trees with higher live crown ratios. Mortality rates rose in response to increasing tree diameter, stand basal area (both from ponderosa pine and non-ponderosa pine), and elevation. Below 1500 m, the mortality rate was ~1%, while above 1700 m, the rate increased to ~30%. However, the association between elevation and mortality risk was buffered by precipitation, such that relatively moist high-elevation stands experienced less mortality than relatively dry high-elevation stands. Tree diameter, crown ratio, and stand density affected tree mortality independent of precipitation. This study demonstrates that while stand characteristics affect tree susceptibility to bark beetles, these relationships may be mediated by climate. Thus, both site and stand level characteristics should be considered when implementing management treatments to reduce bark beetle susceptibility.

1. Introduction

Disturbances such as tree-killing bark beetles are a driver of tree mortality in North American forests and a concern for forest managers. Across North America, bark beetle outbreaks have resulted in widespread tree mortality in multiple forest types [1,2]. Understanding risk factors for individual trees and stands is important to determine where outbreaks are likely to occur and which trees may be more susceptible. However, the manner in which stand dynamics may interact with the site climate to influence mortality risk in a bark beetle outbreak is poorly understood.
Tree mortality as a result of bark beetle outbreaks is often correlated with site and forest structural characteristics, as well as individual tree characteristics within a stand [3]. Higher elevations, where extreme winter temperatures may limit the survival of bark beetle larvae, have previously been associated with lower tree mortality [4,5,6]. Dense stands [6,7,8,9,10,11] and low species diversity [12,13,14,15,16] may contribute to higher stand susceptibility due to a greater density of suitable host trees and a higher abundance of trees experiencing drought stress from overcrowding [17,18]. Similarly, trees with thinner crowns [19,20] and trees occupying subordinate positions in the canopy [7,21,22] are often more susceptible due to decreased fitness. Large [2,3,4,7,23,24] and older [3,18,24] trees are often more susceptible due to both decreased defenses and minimum host size requirements. Further, climate plays a role in regulating bark beetle-related tree mortality. Precipitation trends, including droughts [6,25,26] and long-term regional climate averages [27,28], have been correlated with beetle-related mortality. Drought-stressed trees may have attenuated defenses that render them more susceptible to bark beetle-related mortality ([29,30] and references therein).
Consequently, site climate, as well as tree- and stand-level variables, can be helpful in determining mortality risk during a bark beetle outbreak, but interactions between these variables are rarely synthesized or compared within one study. Many stand-level variables may influence the environmental stress experienced by individual trees, which in turn, may influence beetle-related mortality. Drought stress emerges from a complex interplay between stand conditions, climate, and soil conditions. Stand conditions that produce drought-stressed trees in one location may not have the same impact in another. For instance, trees in dense stands may be more prone to drought stress due to greater competition for moisture, and trees located on south-facing slopes may be hotter and drier. Given the interplay between drought stress and host-tree susceptibility described in previous studies [6,25,26,29,30], an expected pattern of tree–environment–beetle interactions is that thresholds of stand density resulting in heightened mortality susceptibility may be lower in relatively dry environments than in wetter environments. Large trees, which require more water than small trees, may similarly be most stressed and thus more susceptible to attack in low-precipitation environments. Aspect, or related physiographic variables such as heat load index, may be most influential in the hottest portions of a tree species’ range, where south-facing slopes are likely to reach more extreme temperatures. Still, few studies have addressed these potential interactions between stand structure, physiography, climate, and probability of beetle-driven tree mortality. While it is clear that many stand variables influence mortality risk, it is less clear whether the rate at which mortality risk increases as a function of stand conditions depends on how hot or dry a particular site may be, and if so, which stand- or tree-level variables are affected.
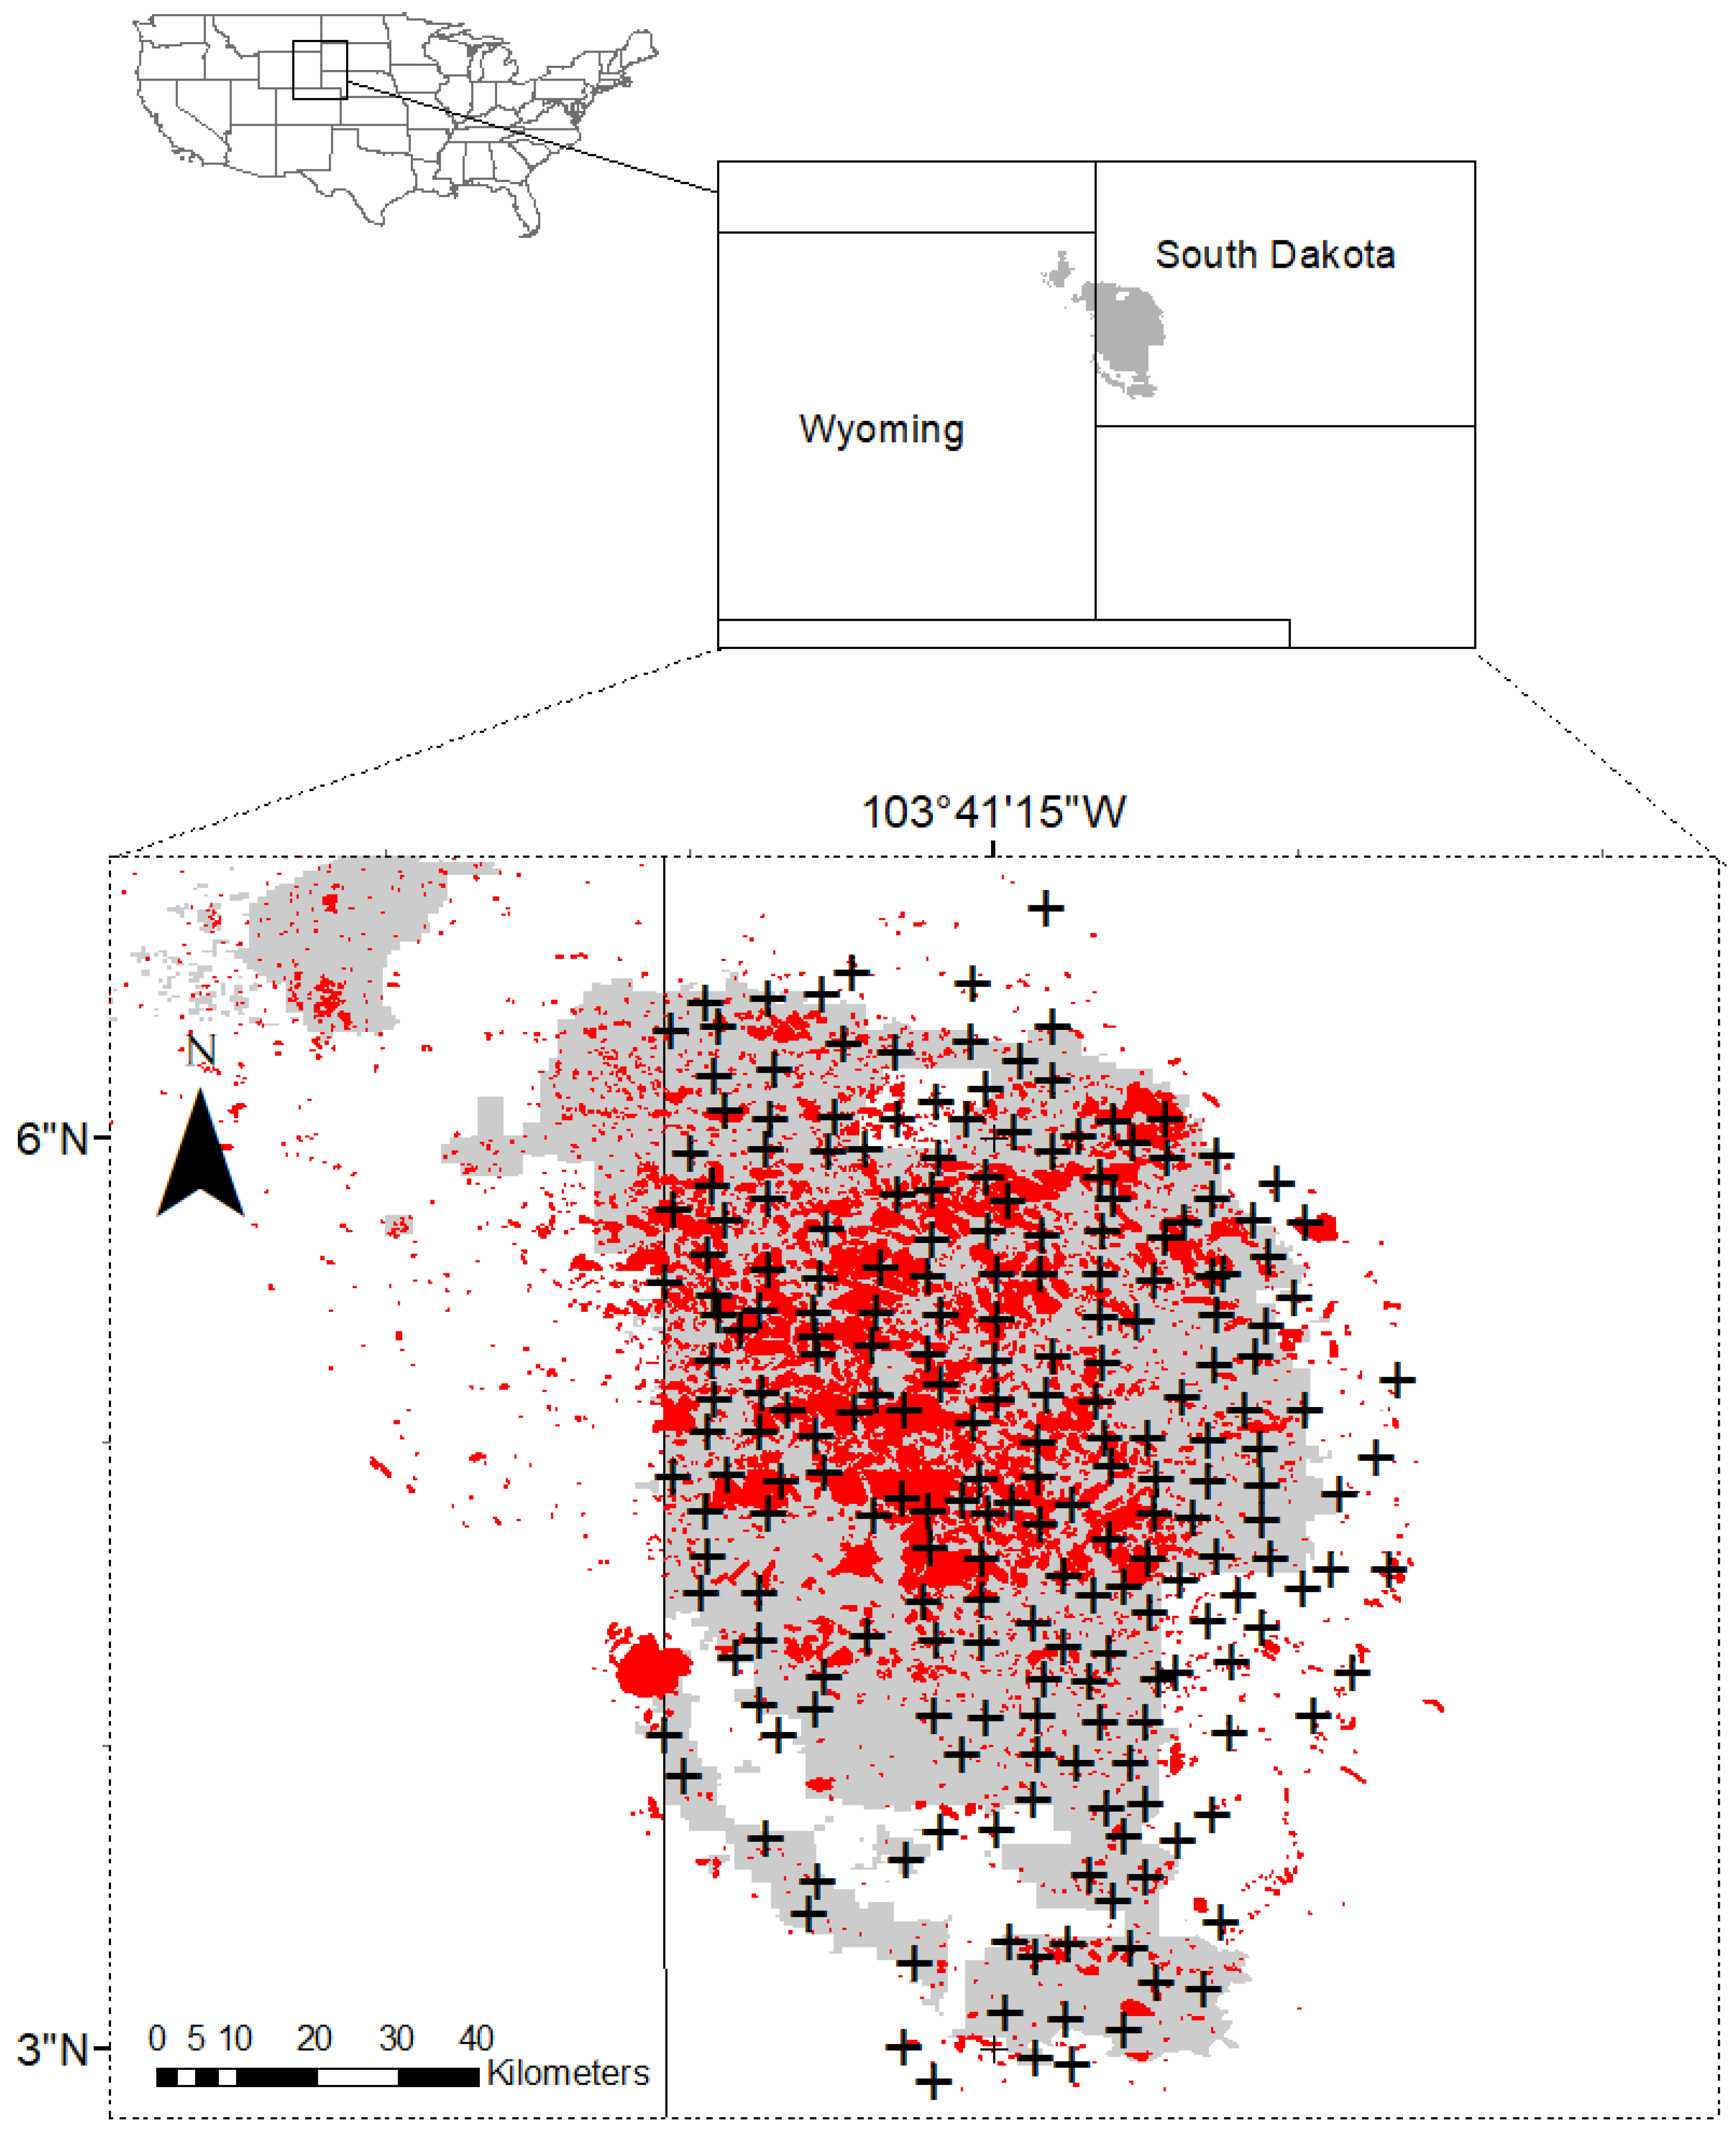
To address these gaps in understanding, this study examines ponderosa pine forests of the Black Hills, in western South Dakota, USA. The mountain pine beetle (Dendroctonus ponderosae Hopkins) reached outbreak proportions in the Black Hills beginning in the early 2000s, and by 2016, over 180,000 hectares had been affected by beetle damage [31]. Although the exact cause of the outbreak is undetermined, the gradual accumulation of viable host material (i.e., ponderosa pines of sufficient size to host mountain pine beetle) in relatively dense, homogenous stands may have contributed [31]. We analyzed Forest Inventory and Analysis (FIA) data from this area to address three objectives: (1) Identify the stand- and tree-level factors influencing the insect-related mortality hazard during a bark beetle outbreak, (2) determine whether climate can influence the mortality hazard when controlling for tree and stand properties, and (3) determine how the relationship between stand properties and mortality risk is influenced by climate. Our analyses provide new information on the role of environmental controls as mediators of mortality during a bark beetle outbreak, and describe how these controls interact with tree- and site-level factors to predict tree survival. These results have consequences for forest managers concerned with managing stands for resistance to bark beetle damage.

2. Materials and Methods

2.1. Data

Data for individual trees were extracted from the Forest Service’s Forest Inventory and Analysis (FIA) program [32] on 13 April 2020. FIA data are derived from a network of randomized plot locations covering forested land across the United States. Plots in South Dakota were measured on 5-year cycles starting in 2001; in 2014, the Forest Service began transitioning South Dakota to a 7-year cycle. Data from our analysis span the period of 2001–2019. Consequently, the plots in our dataset have been measured 3–4 times. Our study tracked 3806 individual trees within 224 unique plot locations (Figure 1). During our study period, 491 trees (12.9%) were killed by insects from 55 plots (24.6%). Most trees (79.6%) were located within Black Hills National Forest, and the rest fell on state (3.1%), private (16.5%), and other federal (0.8%) land. Elevations ranged from 966 to 2112 m, average annual precipitation from 396 to 802 mm/year, and total live basal area from 0.094 to 63 m2/hectare. Precipitation averages are fairly typical of ponderosa pine forests nationwide [33]. Although most individuals occurred in pure stands of ponderosa pine, just over a third (33.4%) of all individuals were located in a stand containing tree species other than ponderosa pine. Other tree species occasionally recorded on plots included quaking aspen (Populous tremuloides Michx.), white spruce (Picea glauca (Moench) Voss), Rocky Mountain juniper (Juniperus scopulorum Sarg.), bur oak (Quercus macrocarpa Michx.), and paper birch (Betula papyrifera Marshall).
FIA collects a wide range of variables at each fixed-radius plot, including tree diameter, height, canopy position (i.e., dominant, co-dominant, or overtopped), crown ratio (portion of the bole covered by live crown), and others. Trees are tagged to allow for long-term tracking of individuals. Stand-level variables such as live basal area and site index are derived from field measurements. Remeasured trees that died since the last inventory are assigned a cause of death, such as insect, fire, or silvicultural. For our purposes, we assumed that trees assigned a mortality code of “insect” were killed by bark beetles, as bark beetles are the only insect assemblage known to kill Black Hills ponderosa pine in significant numbers [34]. Additionally, all inventory plots occurred in or near known infestations, and this was verified against aerial detection survey data (Figure 1) [35]. In the FIA plot design in South Dakota, all trees >12.7 cm in diameter at breast height (DBH) are measured on a 7.3 m-radius subplot, while all trees >2.5 cm in DBH are measured on a 2.1 m-radius microplot nested within the subplot. Four subplots/microplots are measured within each plot [32]. More information on FIA field protocol and data is available online at https://www.fia.fs.fed.us/library/, accessed on 13 April 2020. These inventory plots, measured at various points throughout the outbreak, provide an excellent resource to examine the ecological, geographical, and climatological factors influencing tree mortality during a bark beetle outbreak.
A subset of data was taken to include ponderosa pines measured within five South Dakota counties covering the Black Hills region (Fall River, Pennington, Custer, Lawrence, and Meade). Data were further subset to include only trees that were alive at initial measurement and were remeasured at least once. Trees were excluded from the analysis if they were harvested, killed for silvicultural reasons, or had a noninsect mortality agent (fire, weather, animal, etc.). Although most of the damage during our observation period was likely attributable to the mountain pine beetle (Dendroctonus ponderosae Hopkins), these events are often accompanied by outbreaks of secondary and related bark beetle species that co-attack susceptible hosts, and outbreaks of Ips bark beetles were also observed during the study period [36,37]. Therefore, when drawing general conclusions about the environmental factors affecting forest mortality during insect outbreaks, it may be more useful to focus on the combined mortality driven by species assemblages (i.e., both Dendroctonus and Ips spp.) rather than focusing on the effects of individual beetle species.
The 1981–2010 climate averages for each plot location were estimated from the PRISM database [38] at a pixel resolution of 800 m using bilinear interpolation. As the exact coordinates of FIA plots are kept confidential to preserve sampling integrity, we obtained modelled climate averages for each plot location from the Forest Service, which blurred the climate values of a random 10% subset of the data to within 20% of the actual value in order to preserve plot location confidentiality. Climate variables extracted from the PRISM database included average annual temperature and average annual precipitation. While both temperature and precipitation are correlated with elevation in the Black Hills, precipitation is less correlated than temperature, as precipitation is influenced by a general N–S gradient, in addition to an elevational gradient [38]. It is important to note that this study examines long-term regional climate averages, and the impact of drought (negative deviations from typical precipitation patterns) was not examined.

2.2. Analysis

Analysis was conducted in R version 3.5.2 [39]. We addressed each of our objectives with mixed-effects logistic regression using the “glmer” function from the “lme4” package [40]. A positive event was defined as a tree that was dead at remeasurement with a recorded cause of death of “insect.” A negative event was defined as a tree that survived the entire study period. Each tree appears only once in the dataset—if a tree appeared in multiple sampling windows, these sampling windows were collapsed into one period for analysis. As we were primarily interested in the long-term effects of predictor variables on mortality risk, predictors were assigned based on the conditions that prevailed at the first time the tree was measured—i.e., if a tree was re-measured multiple times, the variables collected at the beginning of the study period were the variables used in the model. We retained individual trees as the unit of observation, which allowed us to parse out the effects of tree- and stand-level variables on mortality hazard. However, this approach necessitated a correction for the nonindependence of trees observed within the same plot. To address this, each model included a random effect of plot. Additionally, each model included a second covariate of total observation time (in years) to adjust for varying lengths of observation between plots. This correction was necessary to account for the higher likelihood of observing mortality during longer observation periods. Models initially included a second random effect of initial measurement year to account for potentially different levels of beetle pressure experienced by each time cohort, but the term did not significantly improve the model fit (Akaike information criterion (AIC) < 2) in any of the models and was consequently dropped. To reduce the impact of collinearity, all predictor variables were mean-centered and scaled by their standard deviation. Within each model, individual variable significance was assessed with a Wald test.
Our first objective—to identify the stand- and tree-level factors contributing to insect-related mortality—was addressed by testing associations between 11 variables on the probability of insect-related mortality. Stand-level variables included slope (°), aspect (° from NE), elevation (m), stand age (years), host (P. ponderosa) basal area (m2/hectare), non host basal area (m2/hectare), stand productivity (50-year site index), and heat load index. Heat load index is a composite of aspect, slope, and latitude that approximates the amount of solar radiation received by a particular site. Heat index was calculated using Equation (3) from McCune and Keon (2002):
H L I =   0.339 + 0.808 × cos L × cos S 0.196 × sin L × sin S 0.482 × cos A × sin S )
where L = latitude, S = slope, and A = aspect folded about a southwest by northwest axis (all in radians) [41]. Trees located on plots with zero slope were assigned a neutral (90° from NE) aspect. Tree-level variables included diameter at breast height (cm), crown ratio (% of bole containing live crown), and crown class—a number-based rating describing dominance in the canopy that ranges from 1 (completely open-growing) to 5 (overtopped; suppressed).
The initial logistic model included all 11 predictor variables. A final model was obtained through backward stepwise model selection. Nonsignificant variables were eliminated from the saturated model one by one, beginning with the highest p-value (as determined by a Wald test) until only significant (p < 0.05) parameters remained. This selection procedure was necessary because several of our predictor variables were intrinsically correlated with each other, and we wanted to choose the “best” variable among these. While correlated, these variables may influence tree mortality through different mechanistic pathways. For instance, the slope is correlated with heat load index, as heat load index is itself calculated from slope, aspect, and latitude. Trees in stands with higher heat load indices may experience greater heat stress due to their topographic position, and trees on steeper slopes may similarly experience higher heat loads when the aspect is southerly. However, steep slopes also cause water to run off faster, causing trees to be more susceptible to drought stress and mortality [42,43,44]. Thus, while they may be correlated, the mechanisms by which slope and heat load index may influence mortality are subtly different. Consequently, using stepwise regression to identify the best variable (from a pool of correlated variables) can help identify mechanistic pathways in the system. One potential drawback to this approach is that the inclusion of correlated predictor variables in a model may artificially inflate p-values and generate false positives. To account for this, variance inflation factors (VIFs) were calculated for each predictor variable to identify collinearity in the model and verify that predictors were not contributing to artificially inflated p-values.
To address our second objective and determine how climate influenced mortality risk, we ran two additional models. The first tested the effect of average annual precipitation (mm/yr) and average annual temperature (°C) on mortality risk in isolation. This allowed us to determine if climate, independent of stand- and tree-level factors, was predictive of mortality risk. In the second model, precipitation and temperature were analyzed in conjunction with the tree- and stand-level variables deemed significant in objective one. This allowed us to determine whether climate data were predictive of mortality risk when significant stand- and tree-level factors were accounted for.
To address our third objective and determine whether the relationships between stand/tree properties and mortality risk were mediated by climate, we included an interaction term between each significant stand/tree variable and each significant climate variable. Interaction terms were limited to variables that were proven to be significant in the additive model in order to limit exposure to type I errors. We applied a backward selection procedure to the interaction model identical to that used in Objective 1, eliminating nonsignificant interaction terms one at a time until only significant terms remained. Results reported for each variable include the p-value as determined by a Wald test and the change in log odds resulting from a one-standard-deviation increase in the predictor.
For each objective, statistics are reported for the final model containing significant predictors only. Variance inflation factors were calculated for each parameter from the final models within each objective.

3. Results

3.1. Effect of Stand and Tree Variables on Mortality

First, we sought to determine which tree- and stand-level variables were associated with insect-related mortality risk, independent of climate. Five variables were significantly related to mortality (Figure 2 and Figure 3, Table A2). As these variables were all analyzed in the same model, results can be interpreted as the impact of a given variable controlled for the other variables in the model. At the level of the individual tree, mortality was positively related to diameter (p < 0.001, Δlog odds = 0.599) and negatively related to crown ratio (p = 0.002, Δlog odds = −0.345). Accounting for other factors, the mortality risk for an individual tree roughly doubled for every 11 cm increase in tree diameter and halved for every 33% increase in crown ratio. At the stand level, tree mortality was positively associated with elevation (p < 0.001, Δlog odds = 2.082), host basal area (p < 0.001, Δlog odds = 1.306), and nonhost basal area (p = 0.039 Δlog odds = 0.446). Accounting for other factors, the mortality risk for an individual tree roughly doubled for every 83 m increase in elevation, every 5.3 m2/hectare increase in the host basal area of the stand, and every 4.6 m2/hectare increase in the nonhost basal area of the stand, though the difference between host vs. nonhost basal area was not statistically significant (p > 0.05).

3.2. Effect of Climate on Mortality

Next, we analyzed the impact of climatic variables on mortality, both in isolation and in conjunction with the significant stand/tree variables obtained in Objective 1. In the model containing climatic variables only, average annual temperature was inversely related to insect-caused mortality risk (p < 0.001, Δlog odds = −1.670, Table A3), while average annual precipitation was not correlated with mortality risk (p = 0.683). However, when tree- and stand-level variables were included in the model, there was a marginally significant (p = 0.063, Δlog odds = −0.797, Table A4, Figure 2 and Figure 3) inverse relationship between average annual precipitation and mortality risk, while average annual temperature was not correlated (p = 0.271). The significance or directionality of tree/stand variables found to be significant in Objective 1 was not influenced by the addition of climatic variables.

3.3. Interactions between Climate and Stand Condition

Finally, interactions between average annual precipitation and tree/stand variables were examined to determine if the relationship between tree/stand variables and mortality risk varied across a precipitation gradient. This analysis revealed a significant precipitation × elevation interaction (p = 0.013, Δlog odds = −1.112, Table 1, Figure 4). Elevation remained directly related to higher mortality risk, but the slope of the trendline became shallower with increasing precipitation (Figure 5). When the precipitation × elevation interaction term was included in the model, the main effect of precipitation was no longer significant (p = 0.291, Table 1). The final model from Objective 3—which included diameter, crown ratio, elevation, host basal area, nonhost basal area, average annual precipitation, and an elevation × precipitation interaction term—was the best fit out of all the models tested (Table 2). The marginal R2 for the final model was 0.55. Calculated VIFs for each predictor were <3 (Table A6), indicating that p-values were not being artificially inflated by multicollinearity.

4. Discussion

Several factors contributed to insect-related tree mortality during the recent bark beetle outbreak in the Black Hills, South Dakota. Although we did find a significant interaction between elevation and precipitation, the effect of stand density, tree size, and crown ratio on mortality was not mediated by the relative moistness of the site. This indicates that while climate may influence some of the factors that predispose trees to beetle-caused mortality, many of those factors are climate-independent.
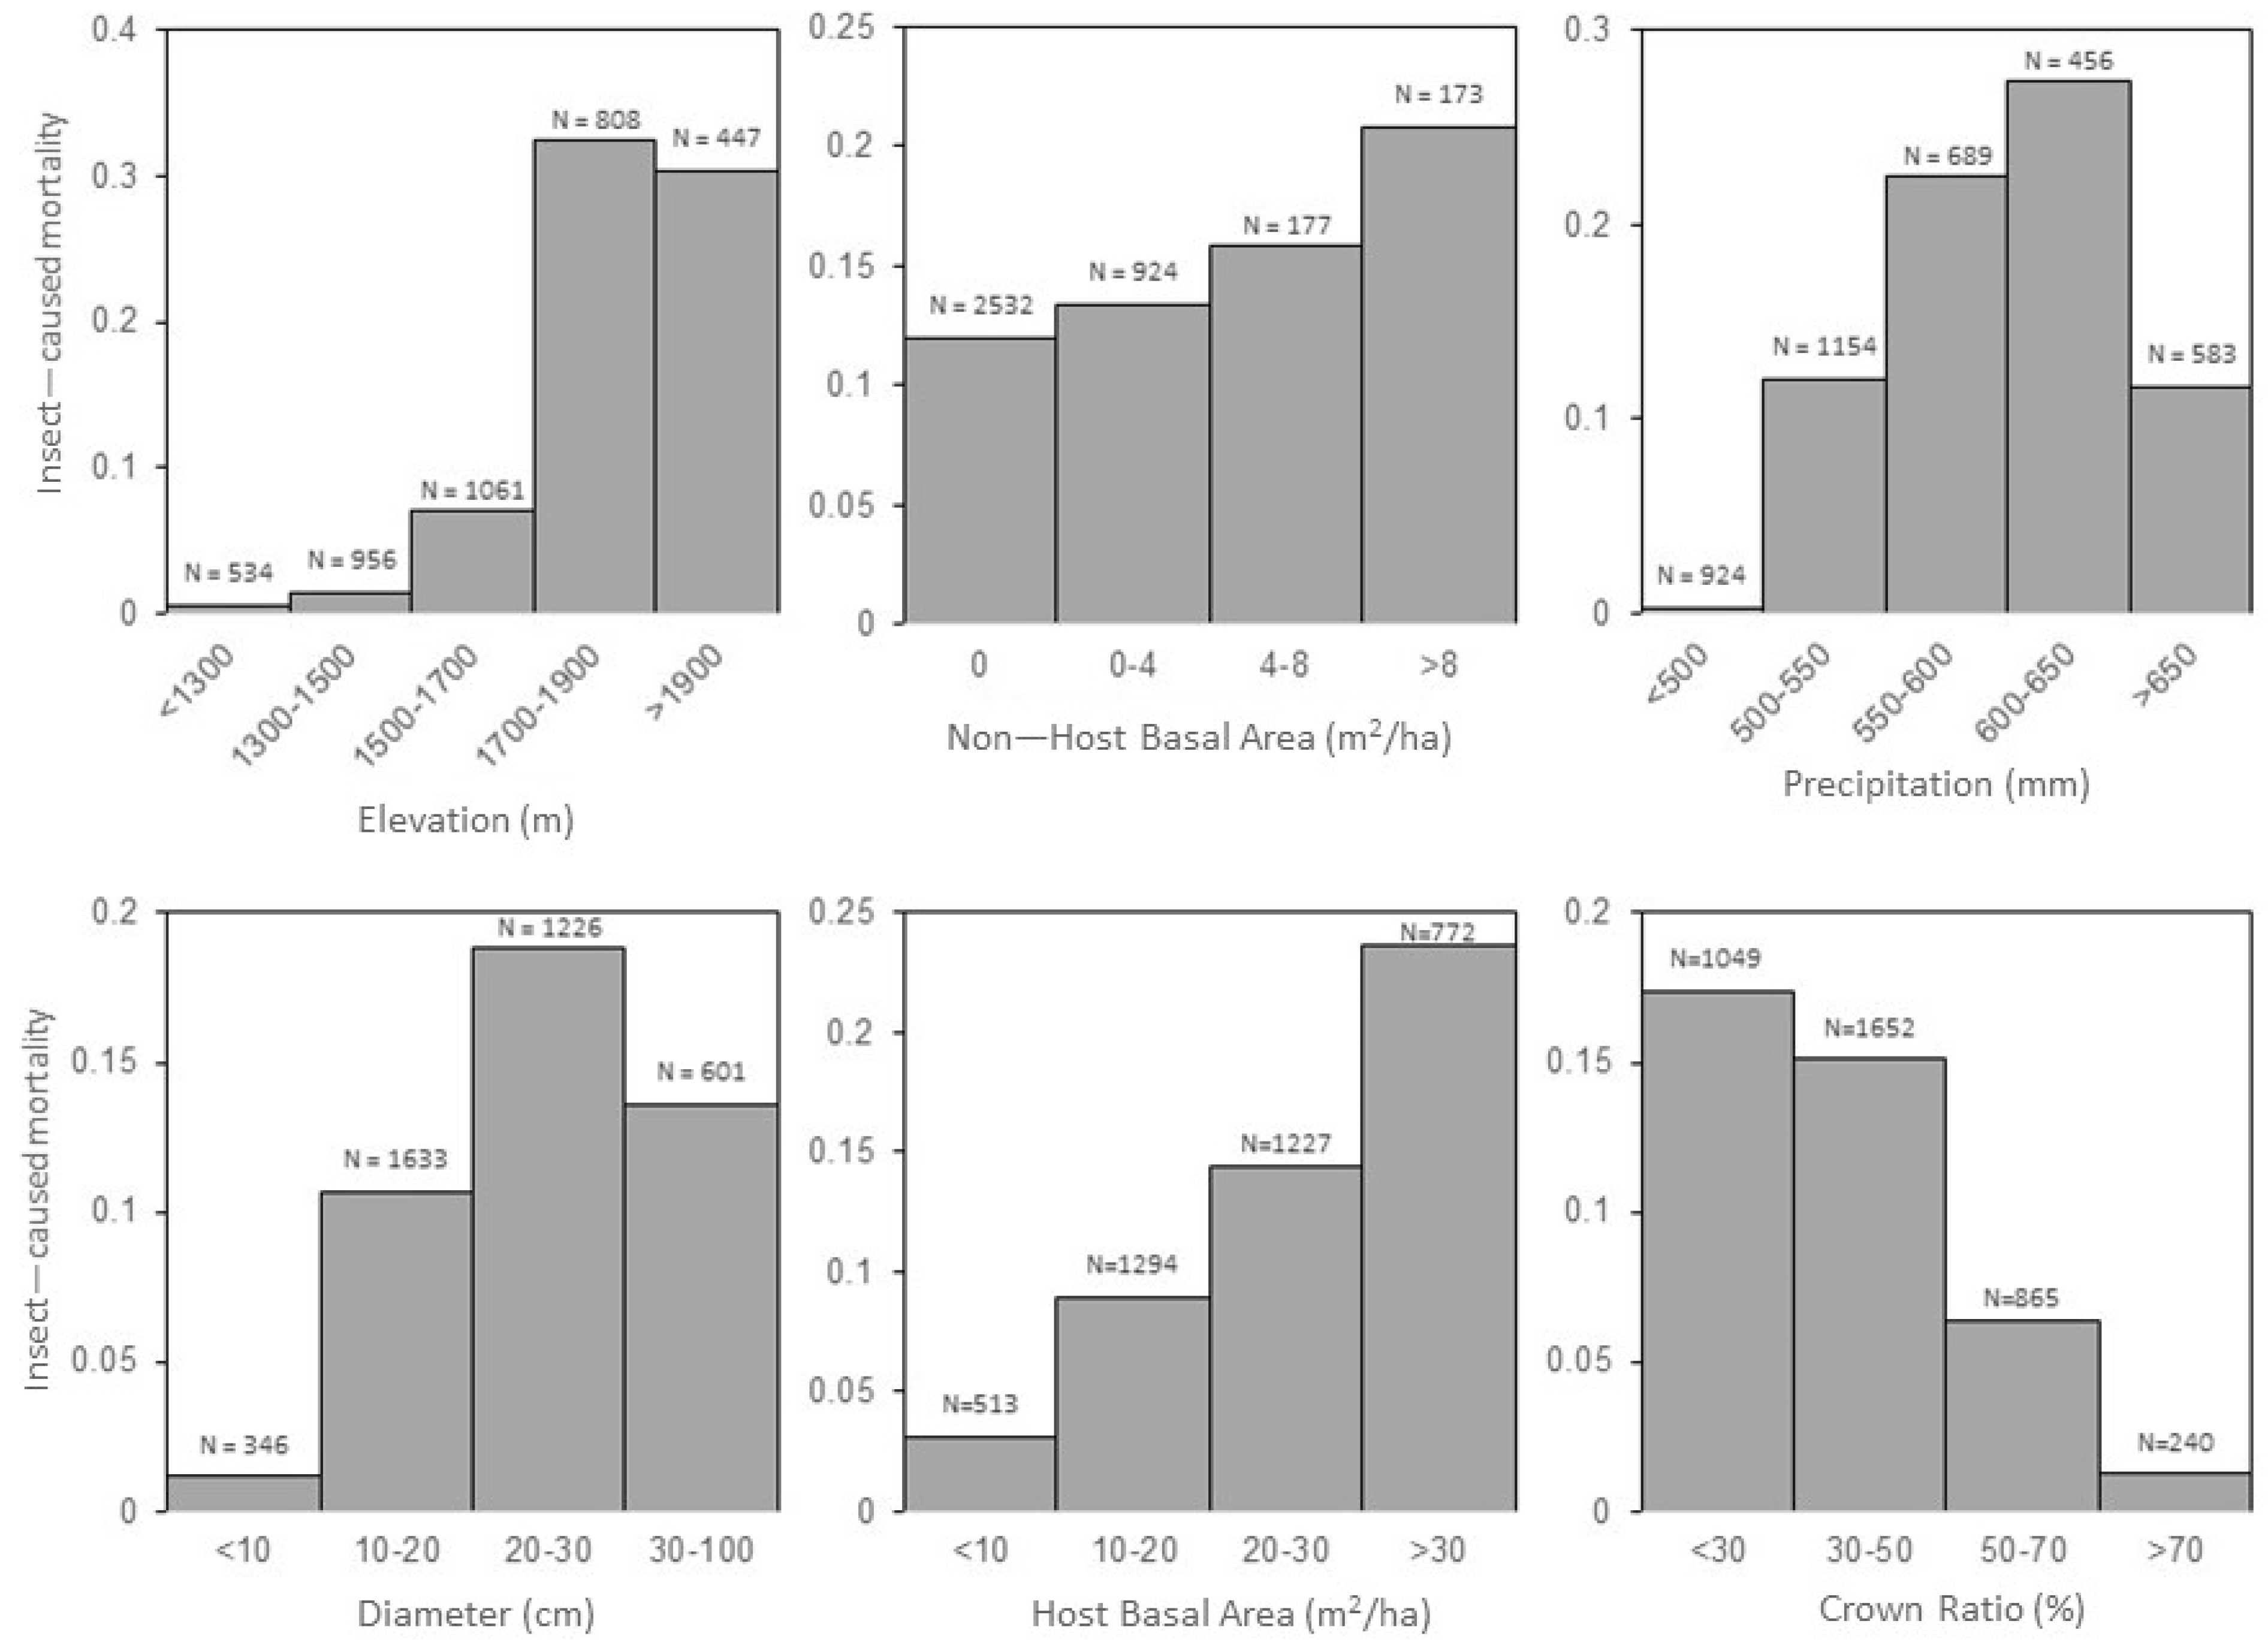
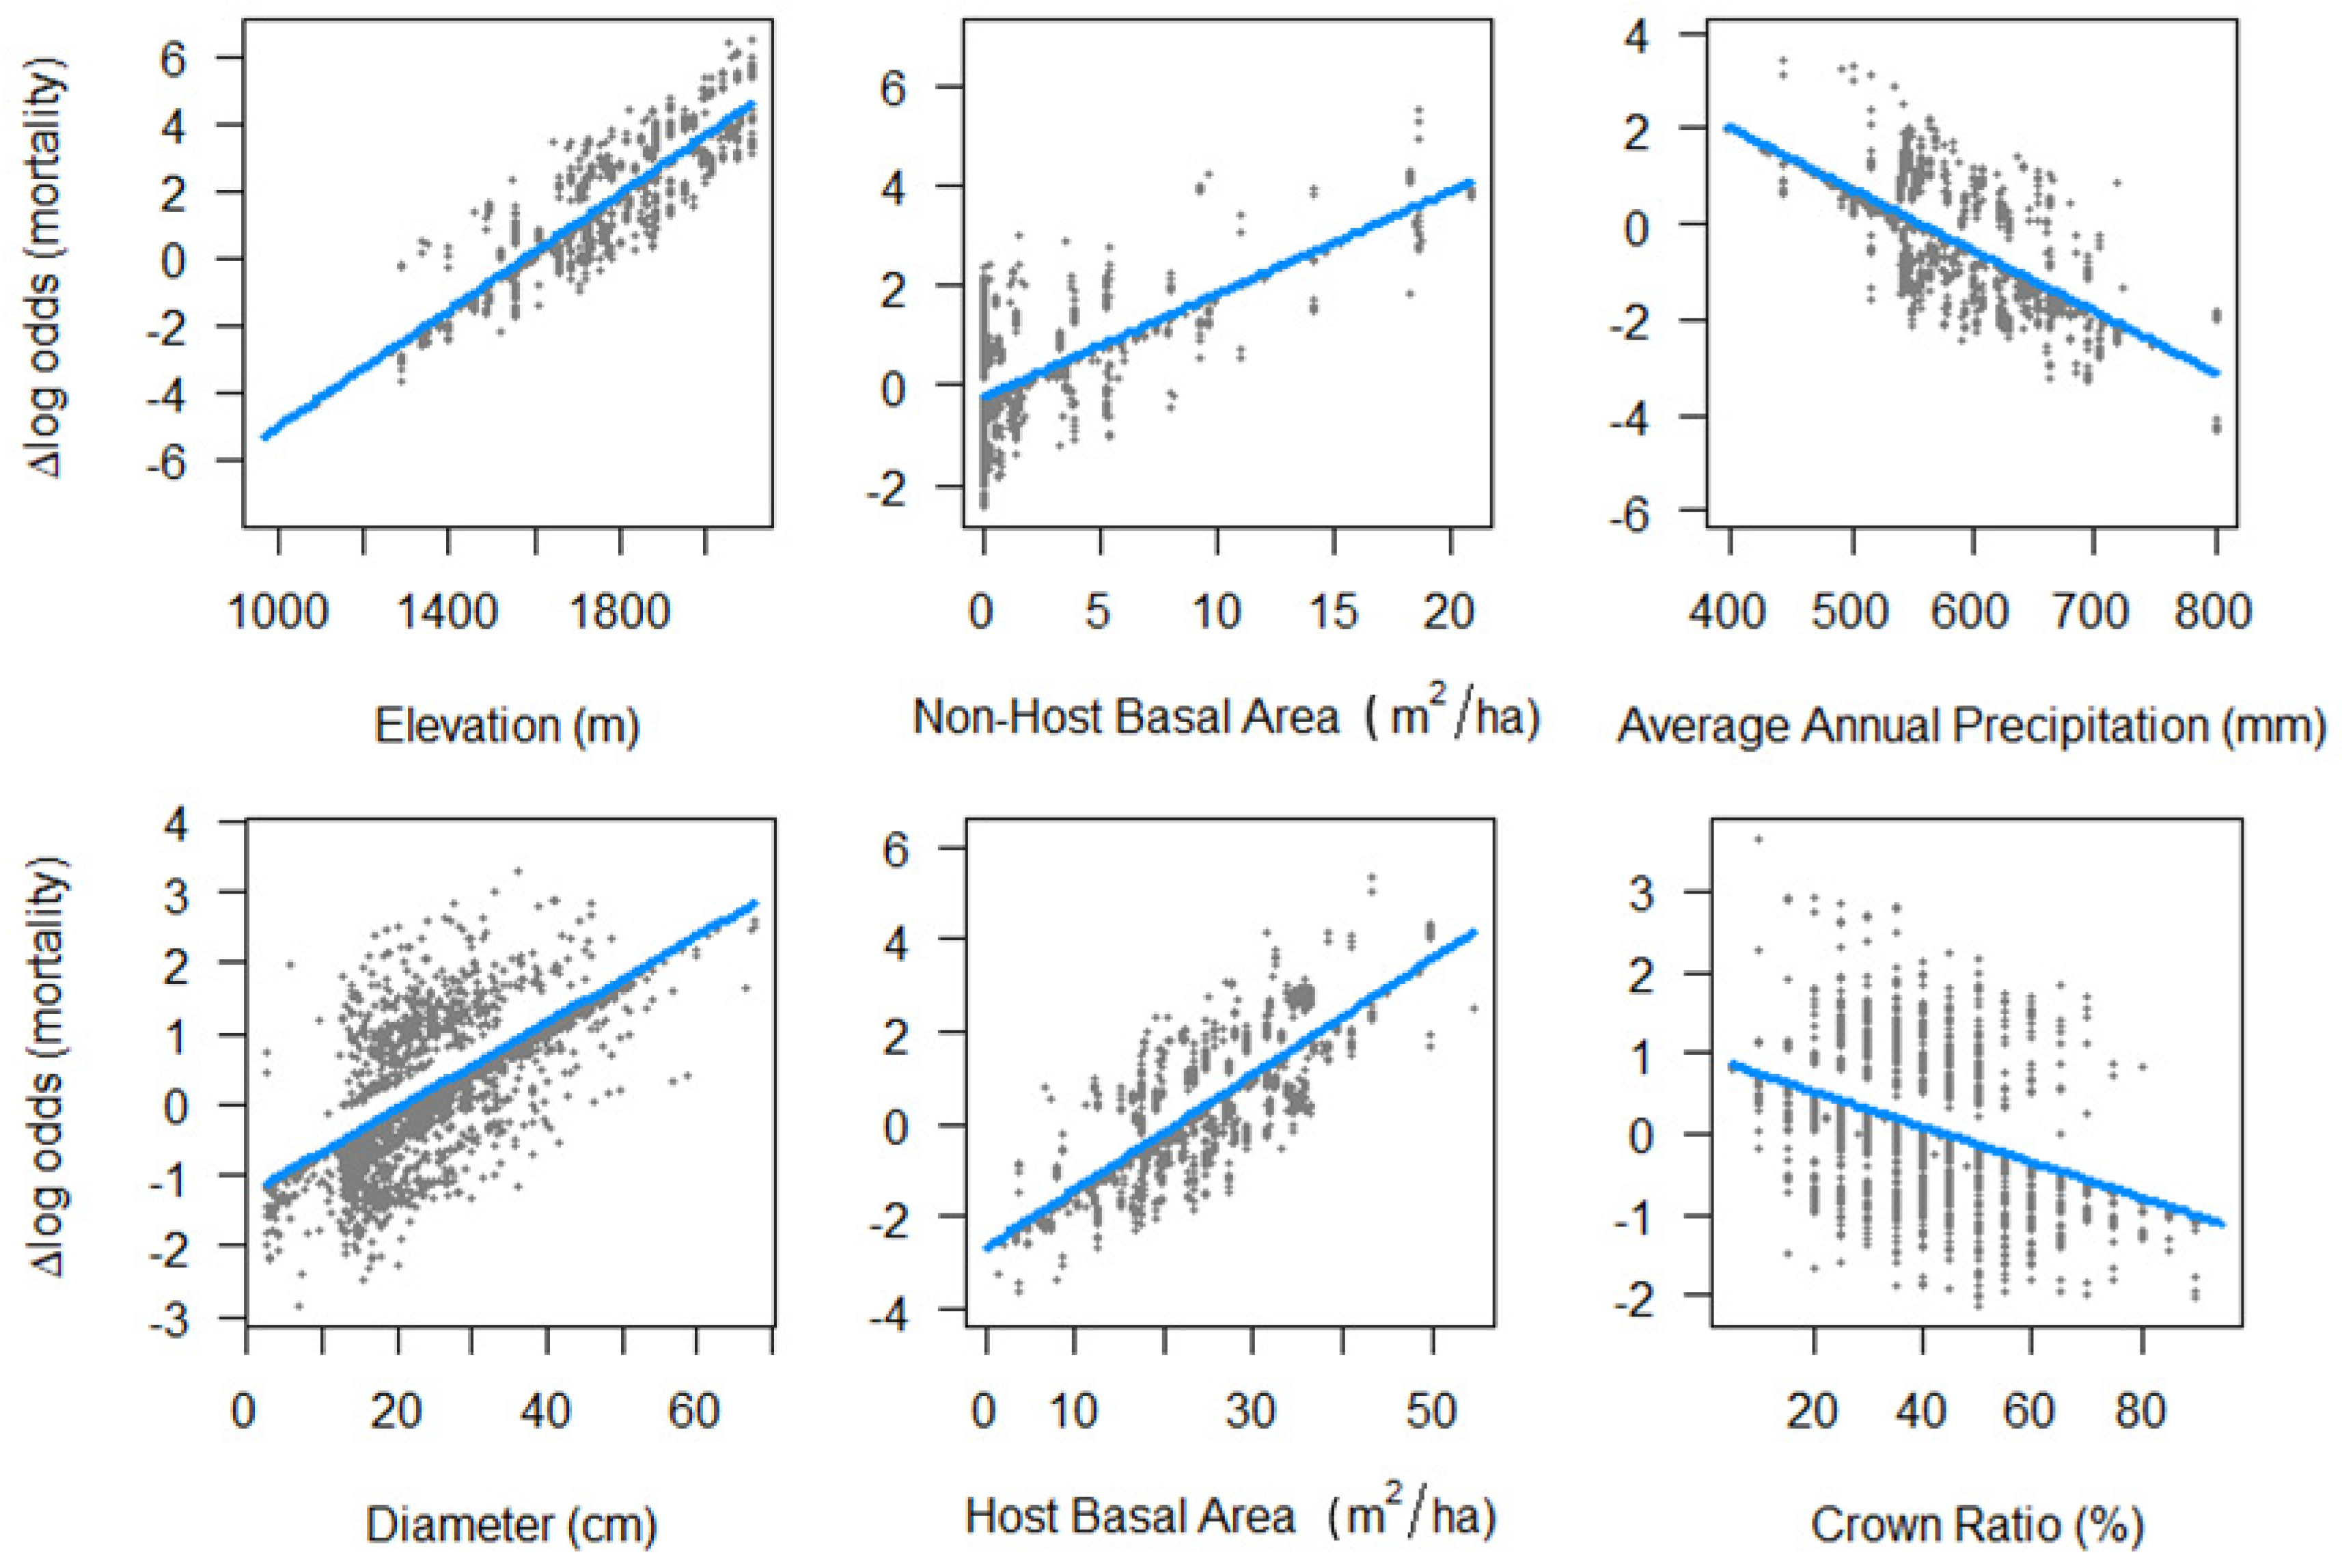
At the level of the individual tree, larger diameters and smaller crowns were associated with higher mortality rates (Figure 2 and Figure 3). The association between larger trees and higher mortality risk is consistent with past studies [7,9,23,45,46] that have examined mountain pine beetle-related mortality in ponderosa pine. Although rarely examined in the context of beetle-related mortality, crown ratio is an oft-used proxy for tree vigor [19,20,24] and larger crowns have been associated with lower rates of general tree mortality [47], so the association with lower beetle-related mortality is not surprising. Despite past work associating canopy position with mortality risk [7], we did not find a significant link, possibly because canopy position was strongly correlated with diameter (Pearson’s coefficient = 0.57), and diameter is critical in quantifying mountain pine beetle susceptibility.
At the stand level, higher elevations and denser stand conditions were associated with higher mortality rates (Figure 2 and Figure 3). The positive relationship observed between live basal area and mortality hazard during a bark beetle outbreak is well-established for bark beetles generally [6,8,10,48] and D. ponderosae specifically [7,9,11,49]. Interestingly, our model revealed that it did not matter whether the live basal area was contributed by ponderosa pine or a nonhost species, such as aspen or white spruce—the addition of live basal from either group contributed equally to higher mortality risk. This indicates that individuals from pure stands were just as likely to experience mortality as individuals from relatively heterogenous, species-diverse stands of a similar density.
Prior research on the impact of nonhost trees on bark beetle outbreaks is mixed. Several studies indicate that host trees located in stands containing higher proportions of nonhost material suffer lower rates of mortality [50,51], an assumption that is maintained in the stand hazard rating developed for D. ponderosae-P. ponderosa in the Black Hills for the Forest Service’s National Insect and Disease Risk Map [15]. However, other work from ponderosa pine forests in Colorado indicates that the presence of nonhost material in the stand can enhance mortality risk for host trees [7], which is consistent with our results. While nonhost species cannot amplify pest populations, they still compete with host individuals for moisture, which may explain why mortality risk from our study increased with nonhost basal area. However, conifer forests in the Black Hills are relatively homogeneous, so effects of species diversity on bark beetle-driven tree mortality may not be fully captured in this study.
While we identified a significant main effect of basal area, there was no evidence of a significant interaction with precipitation. This indicates that high-basal area stands are prone to beetle-related mortality across the full gradient of precipitation in the Black Hills, and that high-basal area stands are no more susceptible in dry environments than moist environments within the study region. Past research [52] reasoned that the live basal area could be increased in productive sites without an associated increase in mortality risk from beetles, but our data do not match this prediction, though productivity is influenced by more than just precipitation. Our results may support other hypotheses that dense stands promote beetle-caused mortality through moisture-independent pathways, such as by creating cooler microenvironments conducive to larval beetle development [8] and/or by suppressing winds that could interfere with aerial pheromones [31]. Alternatively, the lack of a precipitation x basal area interaction could be due to the relatively high intensity of the outbreak, which may have led to stands experiencing little drought stress being targeted by bark beetles at the same intensity as drought-stressed stands. The gradient of precipitation in the Black Hills may also not have been broad enough to detect an interaction, and analyses of other regions with different precipitation regimes may produce different results.
The strong relationship observed between higher elevation and increased mortality is one that, to our knowledge, has not been previously documented for mountain pine beetle outbreaks in ponderosa pine. Below 1500 m, the observed mortality rate during the study period was ~1%, but above 1700 m, the mortality rate rose to over 30% (Figure 2). While elevation has been shown to influence bark beetle-related mortality in other areas, the effect has typically been in the opposite direction. Past work has documented reduced bark beetle-associated mortality at higher elevations for D. ponderosae in lodgepole pine [4,5] and Ips in ponderosa pine [6], but those studies were conducted at higher elevations than ours. Lower rates of beetle-caused tree mortality at high elevation are thought to be caused by extreme low winter temperatures, which can kill brood developing below the bark, or through increased winter precipitation inputs that improve tree access to water during summer months [4,5,6]. This is unlikely to happen in the Black Hills, as the highest elevations in the Black Hills do not experience low winter temperatures needed to kill larval beetles [5,38]. Extreme highs—and not extreme lows—offer one alternative explanation for the relative dearth of insect-related mortality observed at low elevation in the Black Hills, as the mortality of larval bark beetles has been documented at high temperatures [53]. Other nonclimatic factors, such as soil quality or relative topographic position (i.e., whether a stand is located at the top of a ridge vs. the bottom of a draw) could also provide mechanistic explanations for the higher mortality rates observed at high elevation.
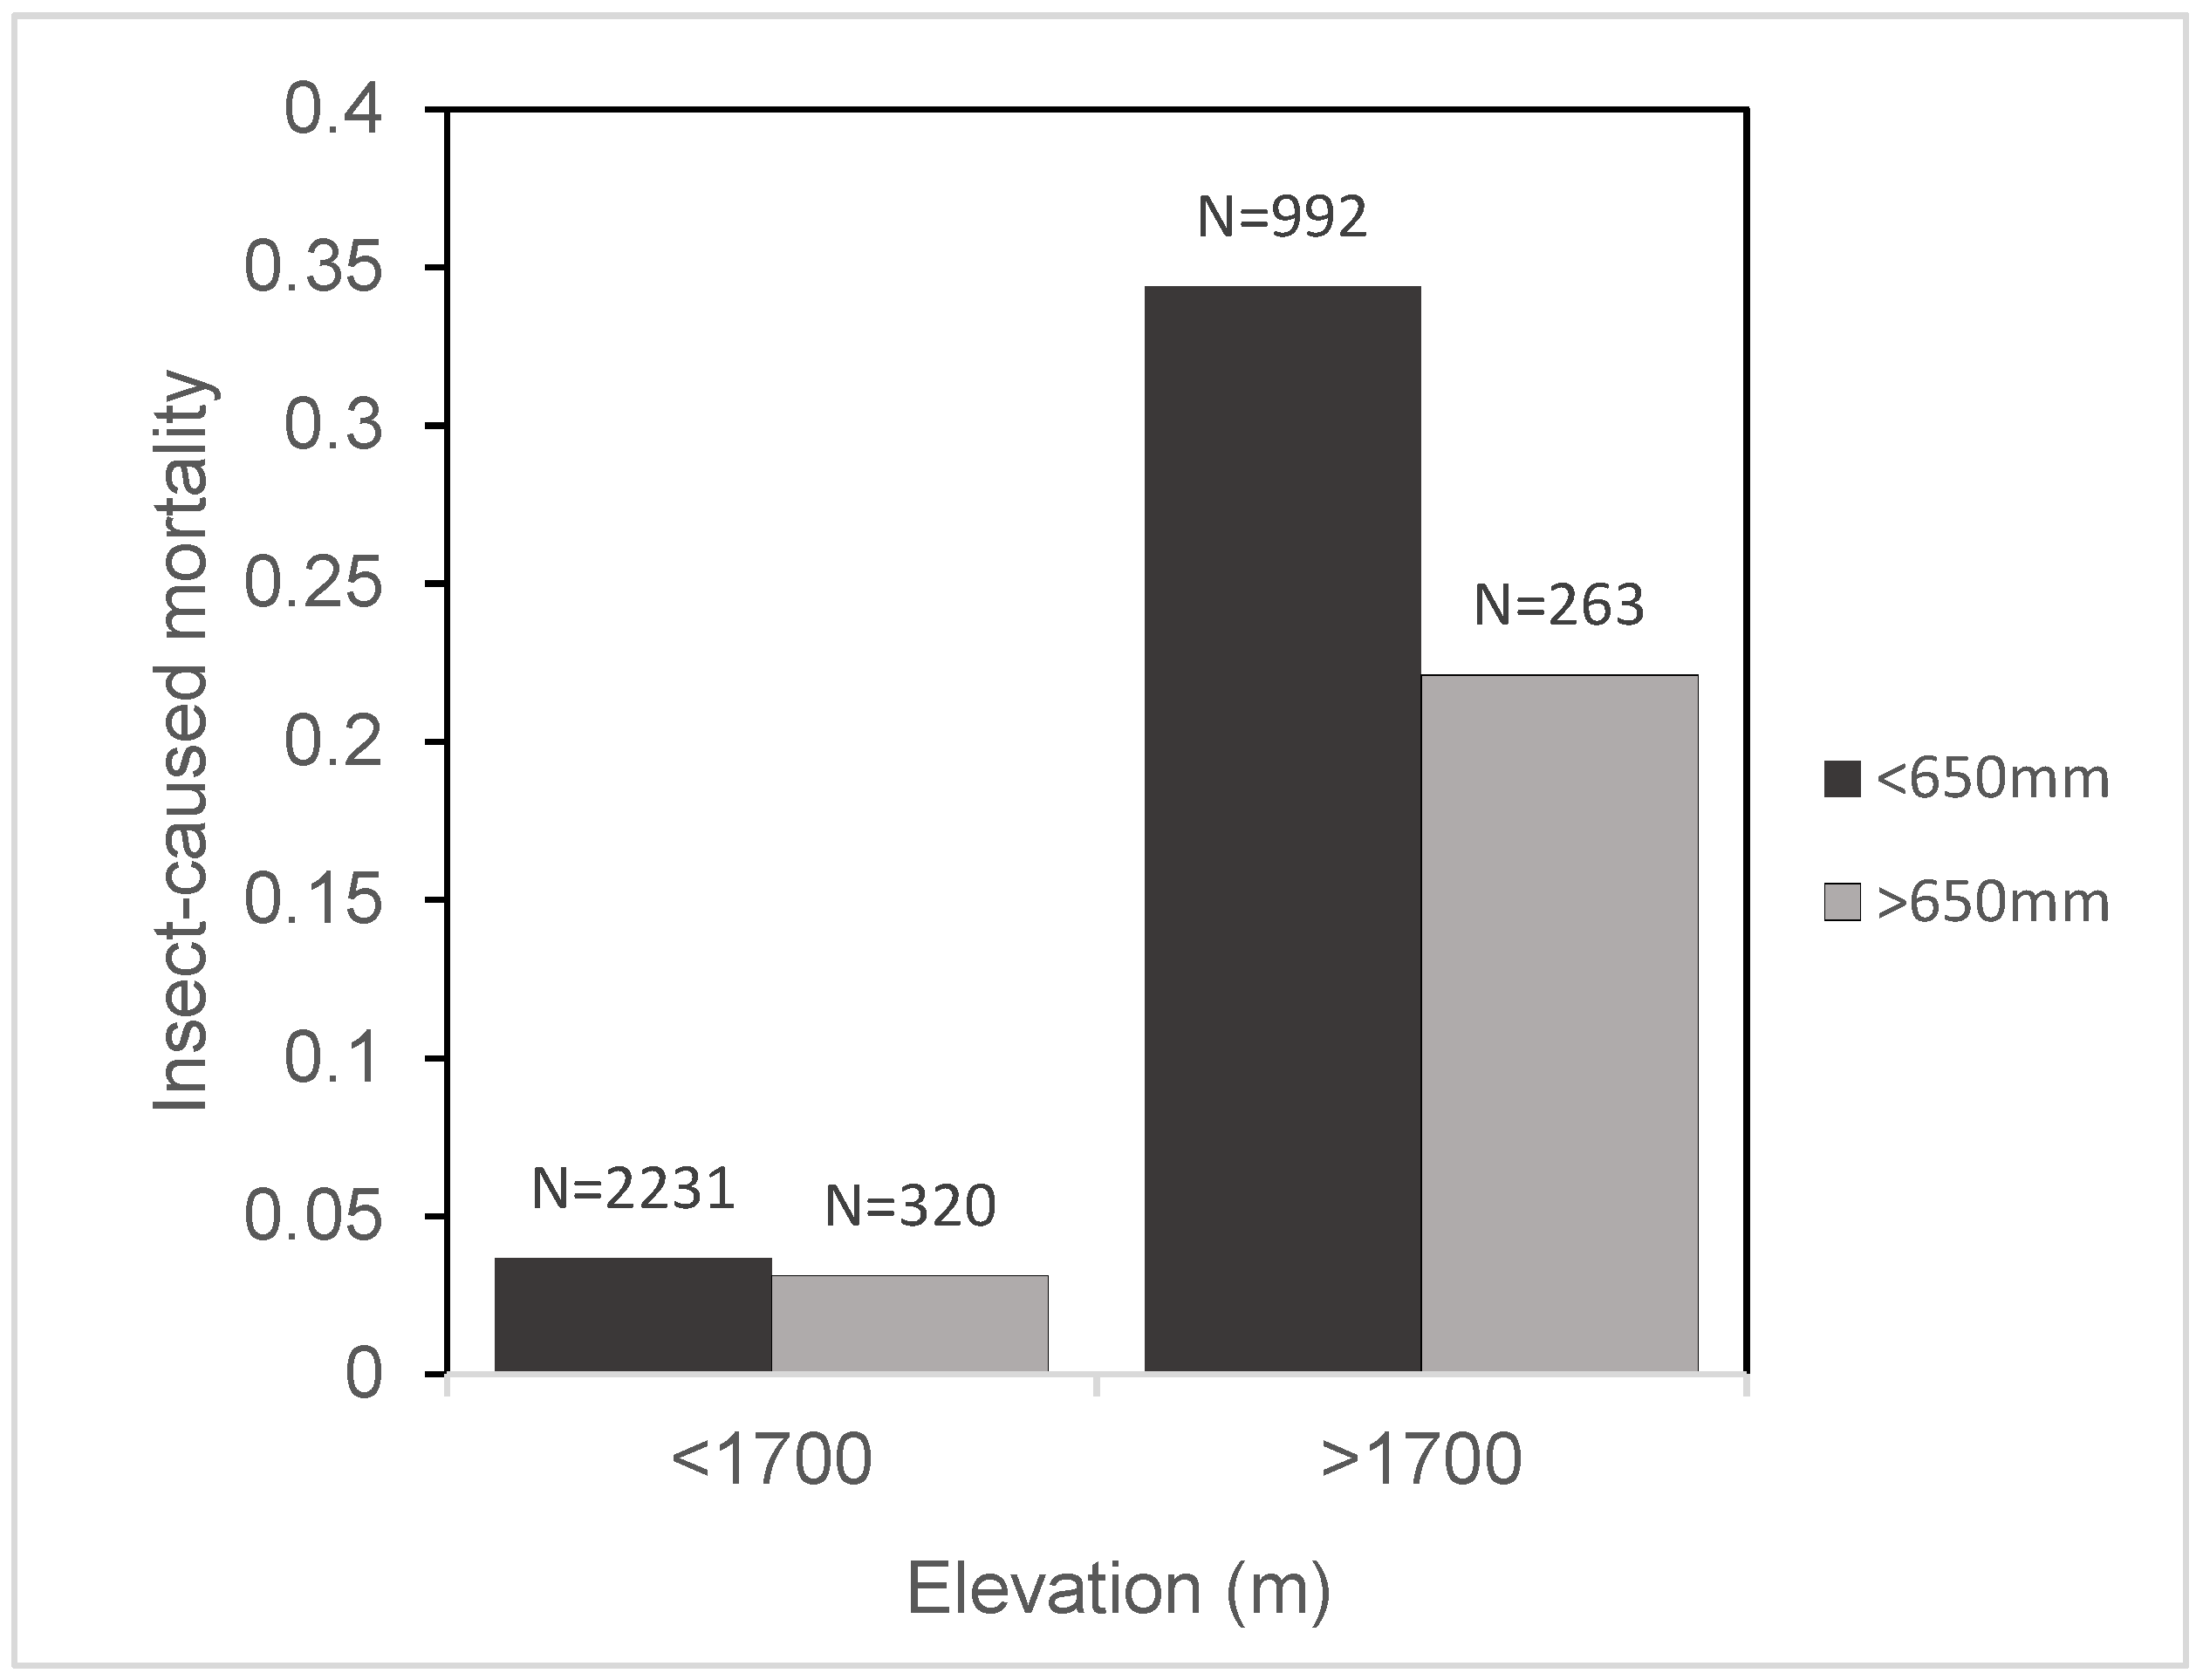
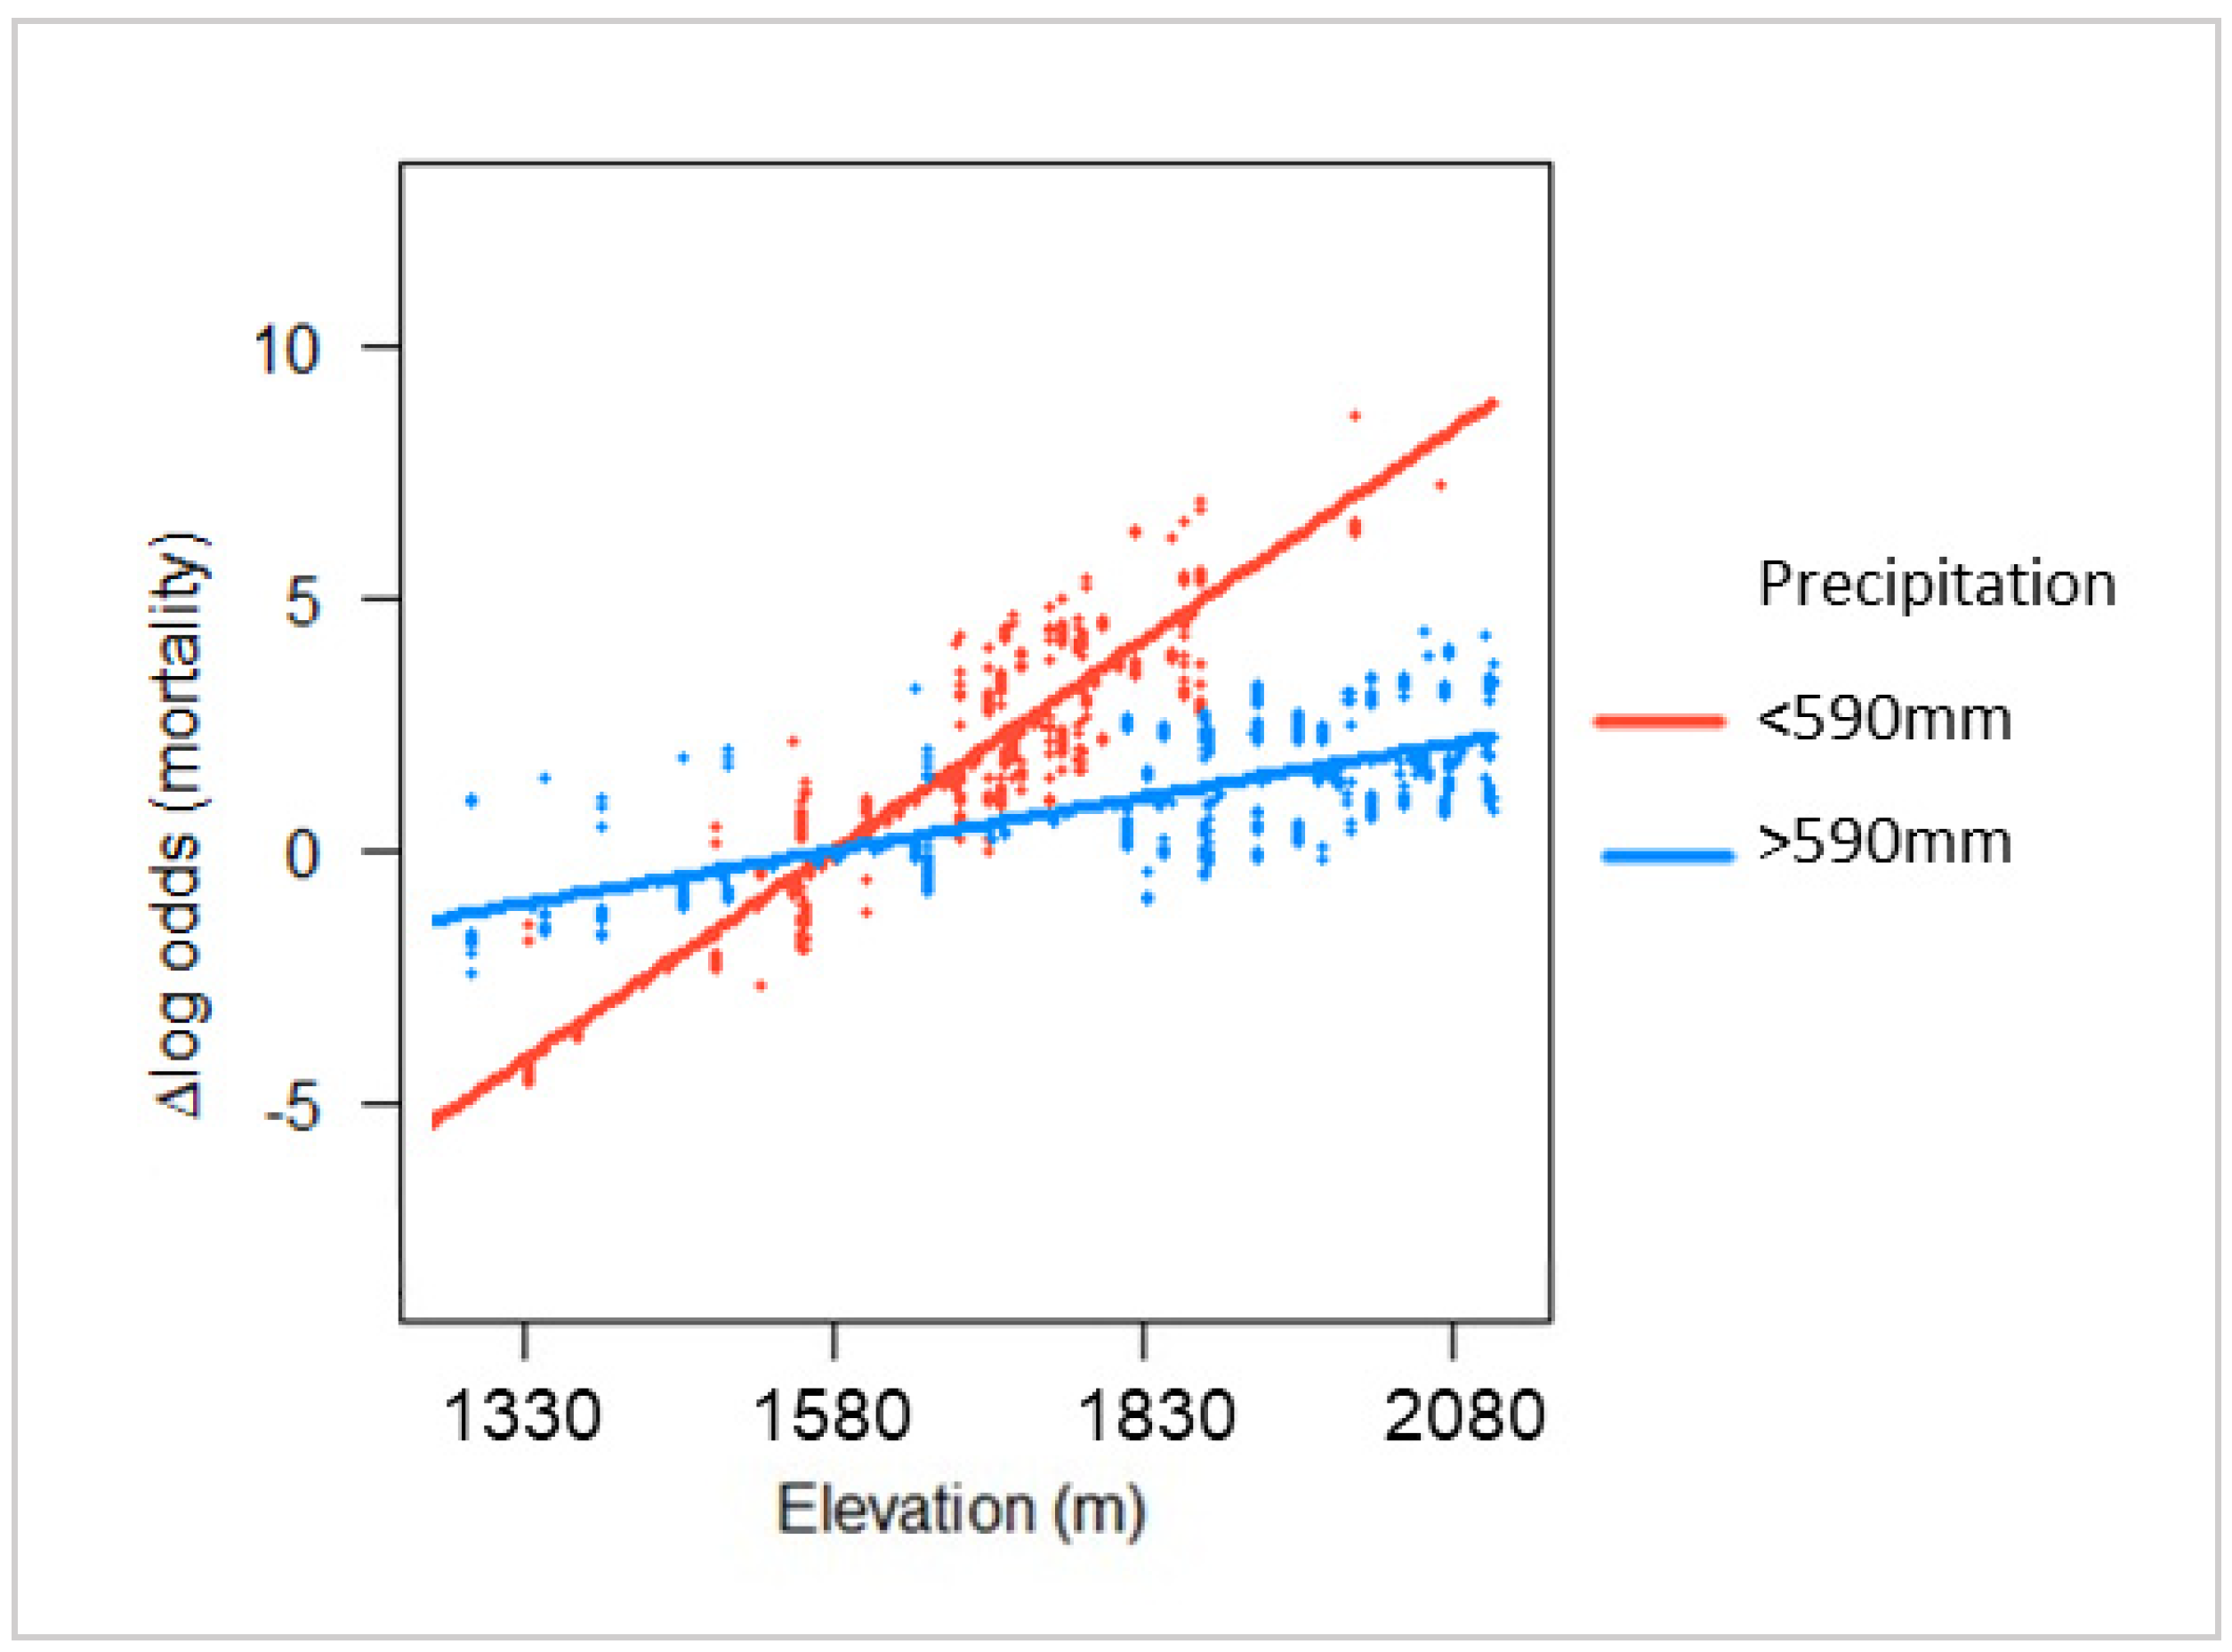
Although observed mortality rates were greatest at high elevation, this effect was buffered by a higher average annual precipitation. As elevation increased, mortality risk increased faster in dry sites than in moist sites (Figure 4 and Figure 5). This finding demonstrates that climate may influence the relationship between stand properties and mortality risk during a bark beetle outbreak. Stand hazard ratings have been developed for a multitude of pest–host–region combinations [12,13,15,50,54], but few models incorporate local climatic variation into their ratings. Our results suggest that such variations may be important in understanding tree susceptibility.
Despite these potential implications, it remains that most of the significant stand- and tree-level variables were not influenced by climate. This indicates that while the inclusion of climate variables could potentially improve current stand hazard ratings, the characteristics of an individual tree or stand are likely to remain the most important determinants for mortality risk. However, the relative importance of stand vs. climate variables (and their interactions) is likely to vary according to geographic scale. The Black Hills represents a relatively small land area, and our plots were separated by no more than 140 km (Figure 1). If the study area were broadened to include a greater range of climatic variation, climate variables could play a more important role in modulating mortality risk.
Results from this study could help determine which stands are at the highest risk of mortality during a future bark beetle outbreak. While high-value trees, such as those located in campgrounds or tourist areas, can be protected using insecticides or pheromones [55,56], these treatments are typically expensive, and managers must prioritize which areas to treat. Our results show that within a stand, large trees with sparse crowns were most susceptible. Meanwhile, across the landscape, stands that were dry, dense, and at high elevation were most susceptible to insect-related mortality. Thus, treatments to reduce tree density may be most effective in relatively dry stands above 1700 m. Additionally, outbreak mitigation may be most effective in areas with no recent outbreaks, as many susceptible mature trees in post-outbreak stands have presumably been selected out of the population [57].
The scope of this study is limited by several factors. First, our observation window covers only a portion of the latest mountain pine beetle outbreak in the Black Hills. FIA plots in the Black Hills are currently transitioning from a five- to a seven-year resampling period. This means that some plots measured in 2013–2015 will not be remeasured again until 2020–2022, and are not represented in our dataset. The outbreak subsided around 2016, so additional mortality is likely to be observed as plots continue to be remeasured. Second, this is an observational study with many uncontrolled or unobserved variables potentially influencing results. While we report correlations between observed variables, it is difficult to draw causal linkages. Third, our study relies on modelled climate averages for each plot [38], which may have varying levels of accuracy. Additionally, climate averages for each plot were provided by the Forest Service, which fuzzed the value of a subset of plots to within 20% of the actual value in order to preserve plot location confidentiality. Due to this fuzzing, the strength of correlations between climate variables and mortality risk could be underestimated.
Our study highlights the importance of examining both tree- and stand-level variables that could contribute to bark beetle-related mortality. The results from our analysis can help managers identify potentially high-risk stands if another bark beetle outbreak were to occur in the Black Hills. Additionally, our results demonstrate that correlations between stand characteristics and mortality hazard can be strongly mediated by climatic variables. The role that average annual precipitation played in our analysis underscores the potential for bark beetle-driven patterns of tree mortality to be strongly affected by alterations in regional climate, and it will be important to further determine whether these effects were driven by summer or winter precipitation inputs. As precipitation patterns across the western U.S. shift due to climate change, longstanding correlations between stand characteristics and bark beetle susceptibility may change as well.

Author Contributions

Conceptualization, P.J.C. and C.S.S.-R.; methodology, P.J.C.; formal analysis, P.J.C.; writing—original draft preparation, P.J.C.; writing—review and editing, T.S.D., C.S.S.-R. and P.J.C.; visualization, P.J.C. and T.S.D.; supervision, C.S.S.-R. and T.S.D.; funding acquisition, C.S.S.-R. All authors have read and agreed to the published version of the manuscript.

Funding

This research was supported with the Joint Fire Sciences Program grant 16-1-01-20.

Data Availability Statement

Publicly available datasets were analyzed in this study. This data can be found here: https://apps.fs.usda.gov/fia/datamart/ (accessed on 13 April 2020).

Acknowledgments

We would like to thank Justin Holgerson of USFS-Northern Research Station, who provided climate data for each plot location.

Conflicts of Interest

The authors declare no conflict of interest.

Appendix A. Additional Model Results

Table A1. Outputs from the Objective 1 model containing all stand- and tree-level variables. Predictors have been mean-centered and scaled by their standard deviation.
PredictorCoefficientStandard ErrorZp
Stand age (yrs)−0.368880.27303−1.3510.177
Site Index0.135740.283860.4780.633
Aspect (° from NE)−0.35720.26154−1.3660.172
Slope (°)0.104560.208480.5020.616
Heat load index0.256350.313820.8170.414
Ponderosa basal area (m2/ha)1.425910.317264.4946.98 × 10−6
Non-ponderosa basal area (m2/ha)0.371690.227371.6350.102
Diameter (cm)0.618890.097636.3392.31 × 10−10
Crown ratio (%)−0.334220.11067−3.020.00253
Elevation (m)2.141370.38185.6092.04 × 10−8
Time (yrs)0.838090.215493.8890.000101
Table A2. Outputs from the Objective 1 model containing significant stand- and tree-level variables. Predictors have been mean-centered and scaled by their standard deviation.
PredictorCoefficientStandard ErrorZp
Ponderosa basal area (m2/ha)1.30610.303044.311.63 × 10−5
Non-ponderosa basal area (m2/ha)0.445650.215672.0660.0388
Diameter (cm)0.599240.096036.244.37 × 10−10
Crown ratio (%)−0.344890.1095−3.150.00163
Elevation (m)2.081660.367155.671.43 × 10−8
Time (yrs)0.834480.214153.8979.75 × 10−5
Table A3. Outputs from the Objective 2 model examining correlations between site climate and mortality risk. Predictors have been mean-centered and scaled by their standard deviation.
PredictorCoefficientStandard ErrorZp
Avg annual precipitation (mm/yr)0.16370.40030.4090.683
Avg annual temperature (°)−1.67020.4136−4.0385.38 × 10−5
Time (yrs)1.07520.1965.4864.10 × 10−8
Table A4. Outputs from the Objective 2 model in which climate variables were included with all significant stand- and tree-level variables. Predictors have been mean-centered and scaled by their standard deviation.
PredictorCoefficientStandard ErrorZp
Ponderosa basal area (m2/ha)1.417670.308254.5994.24 × 10−6
Non-ponderosa basal area (m2/ha)0.606470.224472.7020.00690
Diameter (cm)0.605490.096256.2913.16 × 10−10
Crown ratio (%)−0.346620.10944−3.1670.00154
Elevation (m)1.80690.723612.4970.0125
Avg precipitation (mm/yr)−0.797080.42883−1.8590.0631
Avg annual temperature (°C)−0.74920.68051−1.1010.271
Time (yrs)0.855130.213863.9986.37 × 10−5
Table A5. Outputs from the Objective 3 model analyzing all possible interactions between precipitation and stand- and tree-level variables. Predictors have been mean-centered and scaled by their standard deviation.
PredictorCoefficientStandard ErrorZp
Avg annual precipitation (mm/yr)−0.57990.46149−1.2570.209
Ponderosa basal area (cm2/ha)1.288110.31554.0834.45 × 10−5
Non-ponderosa basal area (cm2/ha)0.724460.272292.6610.00780
Diameter (cm)0.528140.109744.8131.49 × 10−6
Crown ratio (%)−0.310560.12233−2.5390.0111
Elevation (m)3.052930.53155.7449.24 × 10−9
Precip x Ponderosa basal area0.18480.295030.6260.531
Precip x Non-ponderosa basal area−0.092420.20308−0.4550.650
Precip x Diameter0.186070.120561.5430.123
Precip x Crown ratio−0.114870.14994−0.7660.444
Precip x Elevation−1.035540.45575−2.2720.0231
Time (yrs)0.810090.210883.8410.000122
Table A6. Variance inflation factors (VIFs) calculated for each parameter from the final model.
PredictorVIF
Ponderosa basal area (m2/ha)1.185892
Non-ponderosa basal area (m2/ha)1.311208
Diameter (cm)1.053492
Crown ratio (%)1.046155
Elevation (m)2.161712
Avg annual precipitation (mm/yr)1.657891
Precip x Elevation2.30038
Time1.061499

References

  1. Coulson, R.N. Population dynamics of bark beetles. Ann. Rev. Entomol. 1979, 24, 417–447. [Google Scholar] [CrossRef]
  2. Negrón, J.F.; Bentz, B.J.; Fettig, C.J.; Gi3 llette, N.; Hansen, E.M.; Hayes, J.L.; Kelsey, R.G.; Lundquist, J.E.; Lynch, A.M.; Progar, R.A.; et al. US Forest Service bark beetle research in the western United States: Looking toward the future. J. Forest. 2008, 106, 325–331. [Google Scholar]
  3. Bakaj, F.; Mietkiewicz, N.; Veblen, T.T.; Kulakowski, D. The relative importance of tree and stand properties in susceptibility to spruce beetle outbreak in the mid-20th century. Ecosphere 2016, 7, e01485. [Google Scholar] [CrossRef]
  4. Amman, G.D.; Baker, B.H. Mountain Pine Beetle Influence on Lodgepole Pine Stand Structure. J. Forest. 1972, 70, 204–209. [Google Scholar]
  5. Amman, G.D. Population changes of the mountain pine beetle in relation to elevation. Environ. Entomol. 1973, 2, 541–547. [Google Scholar] [CrossRef]
  6. Negrón, J.F.; McMillin, J.D.; Anhold, J.A.; Coulson, D. Bark beetle-caused mortality in a drought-affected ponderosa pine landscape in Arizona, USA. Forest Ecol. Manag. 2009, 257, 1353–1362. [Google Scholar] [CrossRef]
  7. Negrón, J.F.; Popp, J.B. Probability of ponderosa pine infestation by mountain pine beetle in the Colorado Front Range. For. Ecol. Manag. 2004, 191, 17–27. [Google Scholar] [CrossRef]
  8. Fettig, C.J.; Klepzig, K.D.; Billings, R.F.; Munson, A.S.; Nebeker, T.E.; Negrón, J.F.; Nowak, J.T. The effectiveness of vegetation management practices for prevention and control of bark beetle infestations in coniferous forests of the western and southern United States. For. Ecol. Manag. 2007, 238, 24–53. [Google Scholar] [CrossRef]
  9. Negrón, J.F.; Allen, K.; Cook, B.; Withrow, J.R., Jr. Susceptibility of ponderosa pine, Pinus ponderosa (Dougl. ex Laws.), to mountain pine beetle, Dendroctonus ponderosae Hopkins, attack in uneven-aged stands in the Black Hills of South Dakota and Wyoming USA. For. Ecol. Manag. 2008, 254, 327–334. [Google Scholar] [CrossRef]
  10. Fettig, C.J.; Hayes, C.J.; Jones, K.J.; Mckelvey, S.R.; Mori, S.L.; Smith, S.L. Thinning Jeffrey pine stands to reduce susceptibility to bark beetle infestations in California, USA. Agric. Forest Entomol. 2012, 14, 111–117. [Google Scholar] [CrossRef]
  11. Negrón, J.F.; Allen, K.K.; Ambourn, A.; Cook, B.; Marchand, K. Large-scale thinnings, ponderosa pine, and mountain pine beetle in the Black Hills, USA. For. Sci. 2017, 63, 529–536. [Google Scholar] [CrossRef] [Green Version]
  12. Schenk, J.A.; Moore, J.A.; Adams, D.L.; Mahoney, R.L. A preliminary hazard rating of grand fir stands for mortality by the fir engraver. For. Sci. 1977, 23, 103–110. [Google Scholar]
  13. Schenk, J.A.; Mahoney, R.L.; Moore, J.A.; Adams, D.L. A model for hazard rating lodgepole pine stands for mortality by mountain pine beetle. For. Ecol. Manag. 1980, 3, 57–68. [Google Scholar] [CrossRef]
  14. Netherer, S.; Nopp-Mayr, U. Predisposition assessment systems (PAS) as supportive tools in forest management—Rating of site and stand-related hazards of bark beetle infestation in the High Tatra Mountains as an example for system application and verification. For. Ecol. Manag. 2005, 207, 99–107. [Google Scholar] [CrossRef]
  15. Potter, K.M.; Conkling, B.L. Forest Health Monitoring: National Status, Trends and Analysis, 2014; Southern Research Station, USDA Forest Service: Asheville, NC, USA, 2015; pp. 87–92. [Google Scholar]
  16. Aussenac, G.; Granier, A. Effects of thinning on water stress and growth in Douglas-fir. Can. J. For. Res. 1988, 18, 100–105. [Google Scholar] [CrossRef]
  17. Keen, F.P. Relative susceptibility of ponderosa pines to bark-beetle attack. J. Forest. 1936, 34, 919–927. [Google Scholar]
  18. D’Amato, A.W.; Bradford, J.B.; Fraver, S.; Palik, B.J. Effects of thinning on drought vulnerability and climate response in north temperate forest ecosystems. Ecol. Appl. 2013, 23, 1735–1742. [Google Scholar] [CrossRef] [Green Version]
  19. Hornibrook, E.M. A modified tree classification for use in growth studies and timber marking in Black Hills ponderosa pine. J. Forest. 1939, 37, 483–488. [Google Scholar]
  20. Salman, K.A.; Bongberg, J.W. Logging high-risk trees to control insects in the pine stands of northeastern California. J. Forest. 1942, 40, 533–539. [Google Scholar]
  21. Peet, R.K.; Christensen, N.L. Competition and Tree Death. BioScience 1987, 37, 586–595. [Google Scholar] [CrossRef]
  22. Costilow, K.C.; Knight, K.S.; Flower, C.E. Disturbance severity and canopy position control the radial growth response of maple trees (Acer spp.) in forests of northwest Ohio impacted by emerald ash borer (Agrilus planipennis). Ann. For. Sci. 2017, 74, 10. [Google Scholar] [CrossRef] [Green Version]
  23. Olsen, W.K.; Schmid, J.M.; Mata, S.A. Stand characteristics associated with mountain pine beetle infestations in ponderosa pine. Forest Sci. 1996, 42, 310–327. [Google Scholar]
  24. Miller, J.M.; Keen, F.P. Biology and Control of the Western Pine Beetle (Dendroctonus brevicomis): A Summary of the First Fifty Years of Research; Misc. Publ. 800.: Washington, DC, USA; Department of Agriculture, Forest Service: Asheville, NC, USA, 1960; p. 381.
  25. Breshears, D.D.; Cobb, N.S.; Rich, P.M.; Price, K.P.; Allen, C.D.; Balice, R.G.; Romme, W.H.; Kastens, J.H.; Floyd, M.L.; Belnap, J.; et al. Regional vegetation die-off in response to global-change-type drought. Proc. Nat. Acad. Sci. USA 2005, 102, 15144–15148. [Google Scholar] [CrossRef] [Green Version]
  26. Hart, S.J.; Veblen, T.T.; Eisenhart, K.S.; Jarvis, D.; Kulakowski, D. Drought induces spruce beetle (Dendroctonus rufipennis) outbreaks across northwestern Colorado. Ecology 2014, 95, 930–939. [Google Scholar] [CrossRef] [PubMed]
  27. Preisler, H.K.; Hicke, J.A.; Ager, A.A.; Hayes, J.L. Climate and weather influences on spatial temporal patterns of mountain pine beetle populations in Washington and Oregon. Ecology 2012, 93, 2421–2434. [Google Scholar] [CrossRef]
  28. Bentz, B.J.; Régnière, J.; Fettig, C.J.; Hansen, E.M.; Hayes, J.L.; Hicke, J.A.; Kelsey, R.G.; Negrón, J.F.; Seybold, S.J. Climate change and bark beetles of the western United States and Canada: Direct and indirect effects. BioScience 2010, 60, 602–613. [Google Scholar] [CrossRef]
  29. Gely, C.; Laurance, S.G.; Stork, N.E. How do herbivorous insects respond to drought stress in trees? Biol. Rev. 2020, 95, 434–448. [Google Scholar] [CrossRef] [PubMed]
  30. Mattson, W.J.; Haack, R.A. The role of drought in outbreaks of plant-eating insects. Bioscience 1987, 37, 110–118. [Google Scholar] [CrossRef]
  31. Graham, R.T.; Asherin, L.A.; Battaglia, M.A.; Jain, T.; Mata, S.A. Mountain Pine Beetles: A Century of Knowledge, Control Attempts, and Impacts Central to the Black Hills; US Department of Agriculture, Forest Service, Rocky Mountain Research Station: Fort Collins, CO, USA, 2016; p. 193.
  32. Burrill, E.; Wilson, A.; Turner, J.; Pugh, S.; Menlove, J.; Christiansen, G.; Conkling, B.; David, W. The Forest Inventory and Analysis Database: Database Description and User Guide version 8.0 for Phase 2; US Department of Agriculture, Forest Service: Washington, DC, USA, 2018.
  33. Oliver, W.W.; Ryker, R.A. Pinus ponderosa Dougl. ex Laws. Ponderosa Pine Pinaceae Pine family. Silv. N. Am. Conif. 1990, 654, 413. [Google Scholar]
  34. Allen, K.; US Forest Service, Forest Health Protection, Rapid City, SD, USA. Personal communication, 30 July 2019.
  35. Coleman, T.W.; Graves, A.D.; Heath, Z.; Flowers, R.W.; Hanavan, R.P.; Cluck, D.R. Accuracy of aerial detection surveys for mapping insect and disease disturbances in the United States. Forest Ecol. Manag. 2018, 430, 321–336. [Google Scholar] [CrossRef]
  36. U.S. Forest Service. Major Forest Insect and Disease Conditions in the United States: 2015. FS-1093. 2017. Available online: https://www.fs.fed.us/foresthealth/publications/ConditionsReport_2015.pdf (accessed on 20 April 2020).
  37. U.S. Forest Service. Highlights from the 2017 Forest Health Surveys of the Black Hills Area of South Dakota. 2017. Available online: https://www.fs.usda.gov/Internet/FSE_DOCUMENTS/fseprd569853.pdf (accessed on 20 April 2020).
  38. PRISM Climate Group, Oregon State University. Available online: http://prism.oregonstate.edu (accessed on 24 July 2020).
  39. R Core Team. R: A Language and Environment for Statistical Computing; R Foundation for Statistical Computing: Vienna, Austria, 2018; Available online: https://www.R-project.org/ (accessed on 18 March 2019).
  40. Bates, D.; Maechler, M.; Bolker, B.; Walker, S. Fitting Linear Mixed-Effects Models Using lme4. J. Stat. Softw. 2015, 67, 1–48. [Google Scholar] [CrossRef]
  41. McCune, B.; Keon, D. Equations for potential annual direct incident radiation and heat load. J. Veg. Sci. 2002, 13, 603–606. [Google Scholar] [CrossRef]
  42. Bellingham, P.J.; Tanner, E.V.J. The Influence of Topography on Tree Growth, Mortality, and Recruitment in a Tropical Montane Forest. Biotropica 2000, 32, 378–384. [Google Scholar] [CrossRef]
  43. Kharuk, V.I.; Im, S.T.; Oskorbin, P.A.; Petrov, I.A.; Ranson, K.J. Siberian pine decline and mortality in southern Siberian mountains. For. Ecol. Manag. 2013, 310, 312–320. [Google Scholar] [CrossRef]
  44. Kharuk, V.I.; Im, S.T.; Petrov, I.A.; Golyukov, A.S.; Ranson, K.J.; Yagunov, M.N. Climate-induced mortality of Siberian pine and fir in the Lake Baikal Watershed, Siberia. Forest Ecol. Manag. 2017, 384, 191–199. [Google Scholar] [CrossRef] [PubMed]
  45. McCambridge, W.F.; Hawksworth, F.G.; Edminster, C.B.; Laut, J.G. Res. Paper RM-RP-235; US Department of Agriculture, Forest Service, Rocky Mountain Forest and Range Experiment Station: Fort Collins, CO, USA, 1982; 7, p. 235.
  46. Chojnacky, D.C.; Bentz, B.J.; Logan, J.A. Mountain pine beetle attack in ponderosa pine: Comparing methods for rating susceptibility. Ft. Collins, CO: U.S. Depart-ment of Agriculture, Forest Service, Rocky Mountain Research Station; 2000. Report No.: RMRS-RP-26. Available online: https://www.fs.usda.gov/treesearch/pubs/4621 (accessed on 20 April 2020).
  47. Monserud, R.A.; Sterba, H. Modeling individual tree mortality for Austrian forest species. Forest Ecol. Manag. 1999, 113, 109–123. [Google Scholar] [CrossRef]
  48. Showalter, T.D.; Turchin, P. Southern pine beetle infestation development: Interaction between pine and hardwood basal areas. Forest Sci. 1993, 39, 201–210. [Google Scholar]
  49. Schmid, J.M.; Mata, S.A. Stand Density and Mountain Pine Beetle-Caused Tree Mortality in Ponderosa Pine Stands; USDA, Forest Service, Rocky Mountain Forest and Range Experiment Station: Fort Collins, CO, USA, 1992.
  50. Schmid, J.M.; Frye, R.H. Stand Ratings for Spruce Beetles; US Department of Agriculture, Forest Service, Rocky Mountain Forest and Range Experiment Station: Fort Collins, CO, USA, 1976.
  51. Klutsch, J.G.; Negron, J.F.; Costello, S.L.; Rhoades, C.C.; West, D.R.; Popp, J.; Caissie, R. Stand characteristics and downed woody debris accumulations associated with a mountain pine beetle (Dendroctonus ponderosae Hopkins) outbreak in Colorado. For Ecol. Manag. 2009, 258, 641–649. [Google Scholar] [CrossRef]
  52. Sartwell, C.; Stevens, R.E. Mountain Pine Beetle in Ponderosa Pine–Prospects for Silvicultural Control in Second-Growth Stands. J. Forest. 1975, 73, 136–140. [Google Scholar]
  53. Mitchell, J.C.; Schmid, J.M. Spruce beetle: Mortality from solar heat in cull logs of Engelmann spruce. J. Econom. Entomol. 1973, 66, 401–403. [Google Scholar] [CrossRef]
  54. Moore, J.A.; Schenk, J.A.; Hatch, C.R. Validation and refinement of a hazard rating model for fir engraver-caused mortality in grand fir stands. For. Sci. 1978, 24, 309–312. [Google Scholar]
  55. Gibson, K.E.; Bennett, D.D. Carbaryl prevents attacks on lodgepole pine by the mountain pine beetle. J. Forest. 1985, 83, 109–112. [Google Scholar]
  56. Huber, D.P.W.; Borden, J.H. Protection of lodgepole pines from mass attack by mountain pine beetle, Dendroctonus ponderosae, with nonhost angiosperm volatiles and verbenone. Entomol. Exp. Appl. 2001, 99, 131–141. [Google Scholar] [CrossRef]
  57. Hart, S.J.; Veblen, T.T.; Kulakowski, D. Do tree and stand-level attributes determine susceptibility of spruce-fir forests to spruce beetle outbreaks in the early 21st century? For. Ecol. Manag. 2014, 318, 44–53. [Google Scholar] [CrossRef]
Figure 1. Map showing plot locations (cross hatching) in the Black Hills National Forest (indicated in gray) in western South Dakota. Forest Service land is shown in gray. Red polygons denote aerially mapped observations of tree mortality from mountain pine beetle from 2001 to 2016.
Forests 12 00360 g001
Figure 2. Raw mortality rates observed during the study. Sample sizes (individual trees) are denoted above each bar.
Forests 12 00360 g002
Figure 3. Several tree, stand, and climatic variables were correlated with mortality risk. This figure is derived from the additive model in Objective 2 containing all significant tree, stand, and climate variables. Mortality risk is depicted on the y-axis as the change in log odds of insect-caused mortality (relative to the average value of the dependent variable), controlling for the other variables in the model.
Forests 12 00360 g003
Figure 4. Proportion mortality at high and low elevation, split by precipitation. Higher elevations were associated with higher mortality (p < 0.001), but this effect was reduced in stands receiving a higher average annual precipitation.
Forests 12 00360 g004
Figure 5. Regression lines derived from the final interaction model in Objective 3. The change in log odds of insect-caused mortality (relative to the mean value of elevation) is shown on the y-axis, controlled for the other components in the model. Data are split by average annual precipitation. In relatively dry stands, the risk of mortality rises quickly with elevation, but in relatively moist stands, the elevation-associated increase in mortality risk is less pronounced (precip × elevation, p = 0.0013).
Forests 12 00360 g005
Table 1. Output from the final model containing all significant stand- and tree-level variables and significant interactions with climate variables. Prior to modelling, variables were scaled by subtracting the mean and dividing by the standard deviation, so the coefficient can be interpreted as the change in log odds of mortality resulting from a one-standard-deviation increase in the predictor.
PredictorCoefficientStandard ErrorZp
Ponderosa basal area (m2/ha)1.350.2914.63<0.001
Non-ponderosa basal area (m2/ha)0.6250.2112.960.003
Diameter (cm)0.6060.09556.34<0.001
Crown ratio (%)−0.3410.109−3.130.002
Elevation (m)3.060.5205.89<0.001
Avg annual precipitation (mm/yr)−0.4380.414−1.060.291
Precip x Elevation−1.110.450−2.470.013
Time (yrs)0.8220.2093.94<0.001
Table 2. Akaike information criteria (AIC) values for each model. The model containing only stand/tree variables (diameter, crown ratio, ponderosa basal area, non-ponderosa basal area, elevation) was significantly better than the model containing only climate variables (temperature and precipitation). However, the best-fit model contained stand/tree variables in interaction with climate variables.
ModelAIC
Stand/tree variables only1470.2
Climate variables only1562
Stand/tree variables + climate variables1469.2
Stand/tree variables x climate variables1464.7
Publisher’s Note: MDPI stays neutral with regard to jurisdictional claims in published maps and institutional affiliations.

