Article

Phenotypic Plasticity of Drought Tolerance Traits in a Widespread Eucalypt (Eucalyptus obliqua)

by
Carola Pritzkow
*,
Christopher Szota
,
Virginia G. Williamson
and
Stefan K. Arndt
School of Ecosystem and Forest Sciences, The University of Melbourne, 500 Yarra Boulevard, Richmond, VIC 3121, Australia
*
Author to whom correspondence should be addressed.
Forests 2020, 11(12), 1371; https://doi.org/10.3390/f11121371
Submission received: 26 November 2020 / Revised: 14 December 2020 / Accepted: 17 December 2020 / Published: 21 December 2020
(This article belongs to the Special Issue The Physiology of Tree Response to Drought)

Abstract

:
Long-term studies of tree responses to drought stress help us to understand the capacity of species to adapt to their environment. In this study, we investigated how Eucalyptus obliqua adjusts physiological and morphological traits in response to seasonal and multi-year droughts. We monitored physiological and morphological traits over multiple years in undisturbed control and throughfall reduction plots in a eucalypt forest in south-eastern Australia. The throughfall reduction treatment did not induce significantly lower soil moisture in the throughfall reduction plots compared with the control plots. However, natural variability in precipitation and evaporative demand induced drought stress of varying intensity each summer in all plots. We observed a significant relationship between seasonal precipitation and leaf pre-dawn water potential (ΨPD), with less precipitation over summer, resulting in a decline in ΨPD and drought stress when ΨPD fell below −0.75 MPa. Eucalyptus obliqua responded to short-term summer drought through rapid leaf osmotic adjustment which lowered the leaf water potential at the turgor loss point beyond the minimum leaf water potential. Morphological adjustments, such as the reduction of leaf area to sapwood area (higher Huber Value) were moderate during the measurement period and only occurred under severe drought stress (pre-dawn water potential < −1.2 MPa). Overall, E. obliqua responded to short-term mild drought stress through physiological trait plasticity, while morphological adjustment only occurred under a more severe water deficit.

1. Introduction

Seasonal droughts are experienced by most tree species, and trees have evolved mechanisms to tolerate regular water deficits [1,2]. However, climate change will likely intensify or extend drought conditions in the future [3], which may increase tree mortality [4]. To predict future changes in forest cover, productivity and species composition, a better understanding of the mechanisms driving how trees respond to drought is needed [5]. Currently, we have a limited understanding of how trees adjust to drier conditions over multiple years [6], how adjustments differ among species [7] and if these adjustments can improve drought resistance enabling the forest to recover [8,9].
Tree drought responses are often investigated in young seedlings in short-term controlled environment studies. However, most drought experiments are performed over short time periods, and the temporal stability of physiological and morphological adjustments may overestimate the effects of drought [6,7,10]. Further, the responses of seedlings may not be representative of those of mature trees [11]. Hence, there is a need to study the drought response of mature trees within the natural environment, which makes multi-year field studies extremely valuable. However, these studies are time-consuming, as soil moisture changes slowly and can be unpredictable under natural conditions. An alternative is to implement experimental approaches that reduce throughfall and soil moisture availability in the field [7]. Throughfall reduction experiments partially prevent rainfall from reaching the soil and enable the analysis of short and long-term influences of drought on tree responses to drier conditions [7]. The long-term drought exposure of trees in throughfall reduction experiments enables observations of temporal changes in functional traits in response to drought [12,13].
Eucalyptus is a dominant Australian tree genus with over 800 species inhabiting many diverse ecosystems throughout Australia [14]. Eucalypts are generally well adapted to drought, with eucalypts from drier environments also often being inherently more drought-tolerant. This is achieved by sensitive stomata, expressing lower water potentials at turgor loss point (ΨTLP), lower leaf xylem vulnerability to embolism (P50/P88), narrower xylem vessels, smaller leaves and a lower leaf area index [15,16,17,18,19]. Many eucalypts are characterised by narrow climatic ranges and are likely to experience environmental conditions outside of their current range in the future [20]. In some regions, climatic conditions have already changed [21] and may have driven the increased drought-induced mortality observed in recent years [22,23]. It is less well known how eucalypts with a widespread distribution have adapted to drought or will adjust to immediate drought events. Eucalyptus obliqua L’Hérit, the first described eucalypt, is one of the most widespread and economically important species, ranging from New South Wales in the north to Tasmania in the south and to South Australia in the west [24]. The species shows distinct trait variation among populations, with populations at drier sites being more drought-tolerant with lower ΨTLP, lower P50/P88, lower leaf area, and smaller leaves [25]. The expression of many of these traits is strongly genetically controlled, which suggests that individual populations might have different vulnerabilities to seasonal drought and potentially longer-term shifts in climate [25].
We studied how E. obliqua trees growing in a wetter environment with less frequent droughts respond to chronically lower rainfall and to acute seasonal droughts. Given that the expression of many morphological and physiological traits in E. obliqua is under strong genetic control, we hypothesized that E. obliqua would express different levels of trait plasticity depending on the level of water deficit. We hypothesized that mild seasonal water deficit would trigger transient adjustments, such as a lower ΨTLP, whereas more severe reductions in water availability would lead to a substantial reduction in leaf area to avoid water deficits. Thus, the aim of this study was to investigate the plasticity of morphological and physiological traits in established E. obliqua trees in response to (i) seasonal and (ii) long-term reductions in water availability. We established a throughfall reduction experiment in an E. obliqua dominated forest in southeast Australia to assess the impacts of seasonal and multi-year droughts on the plasticity and interaction of drought-related traits.

2. Material and Methods
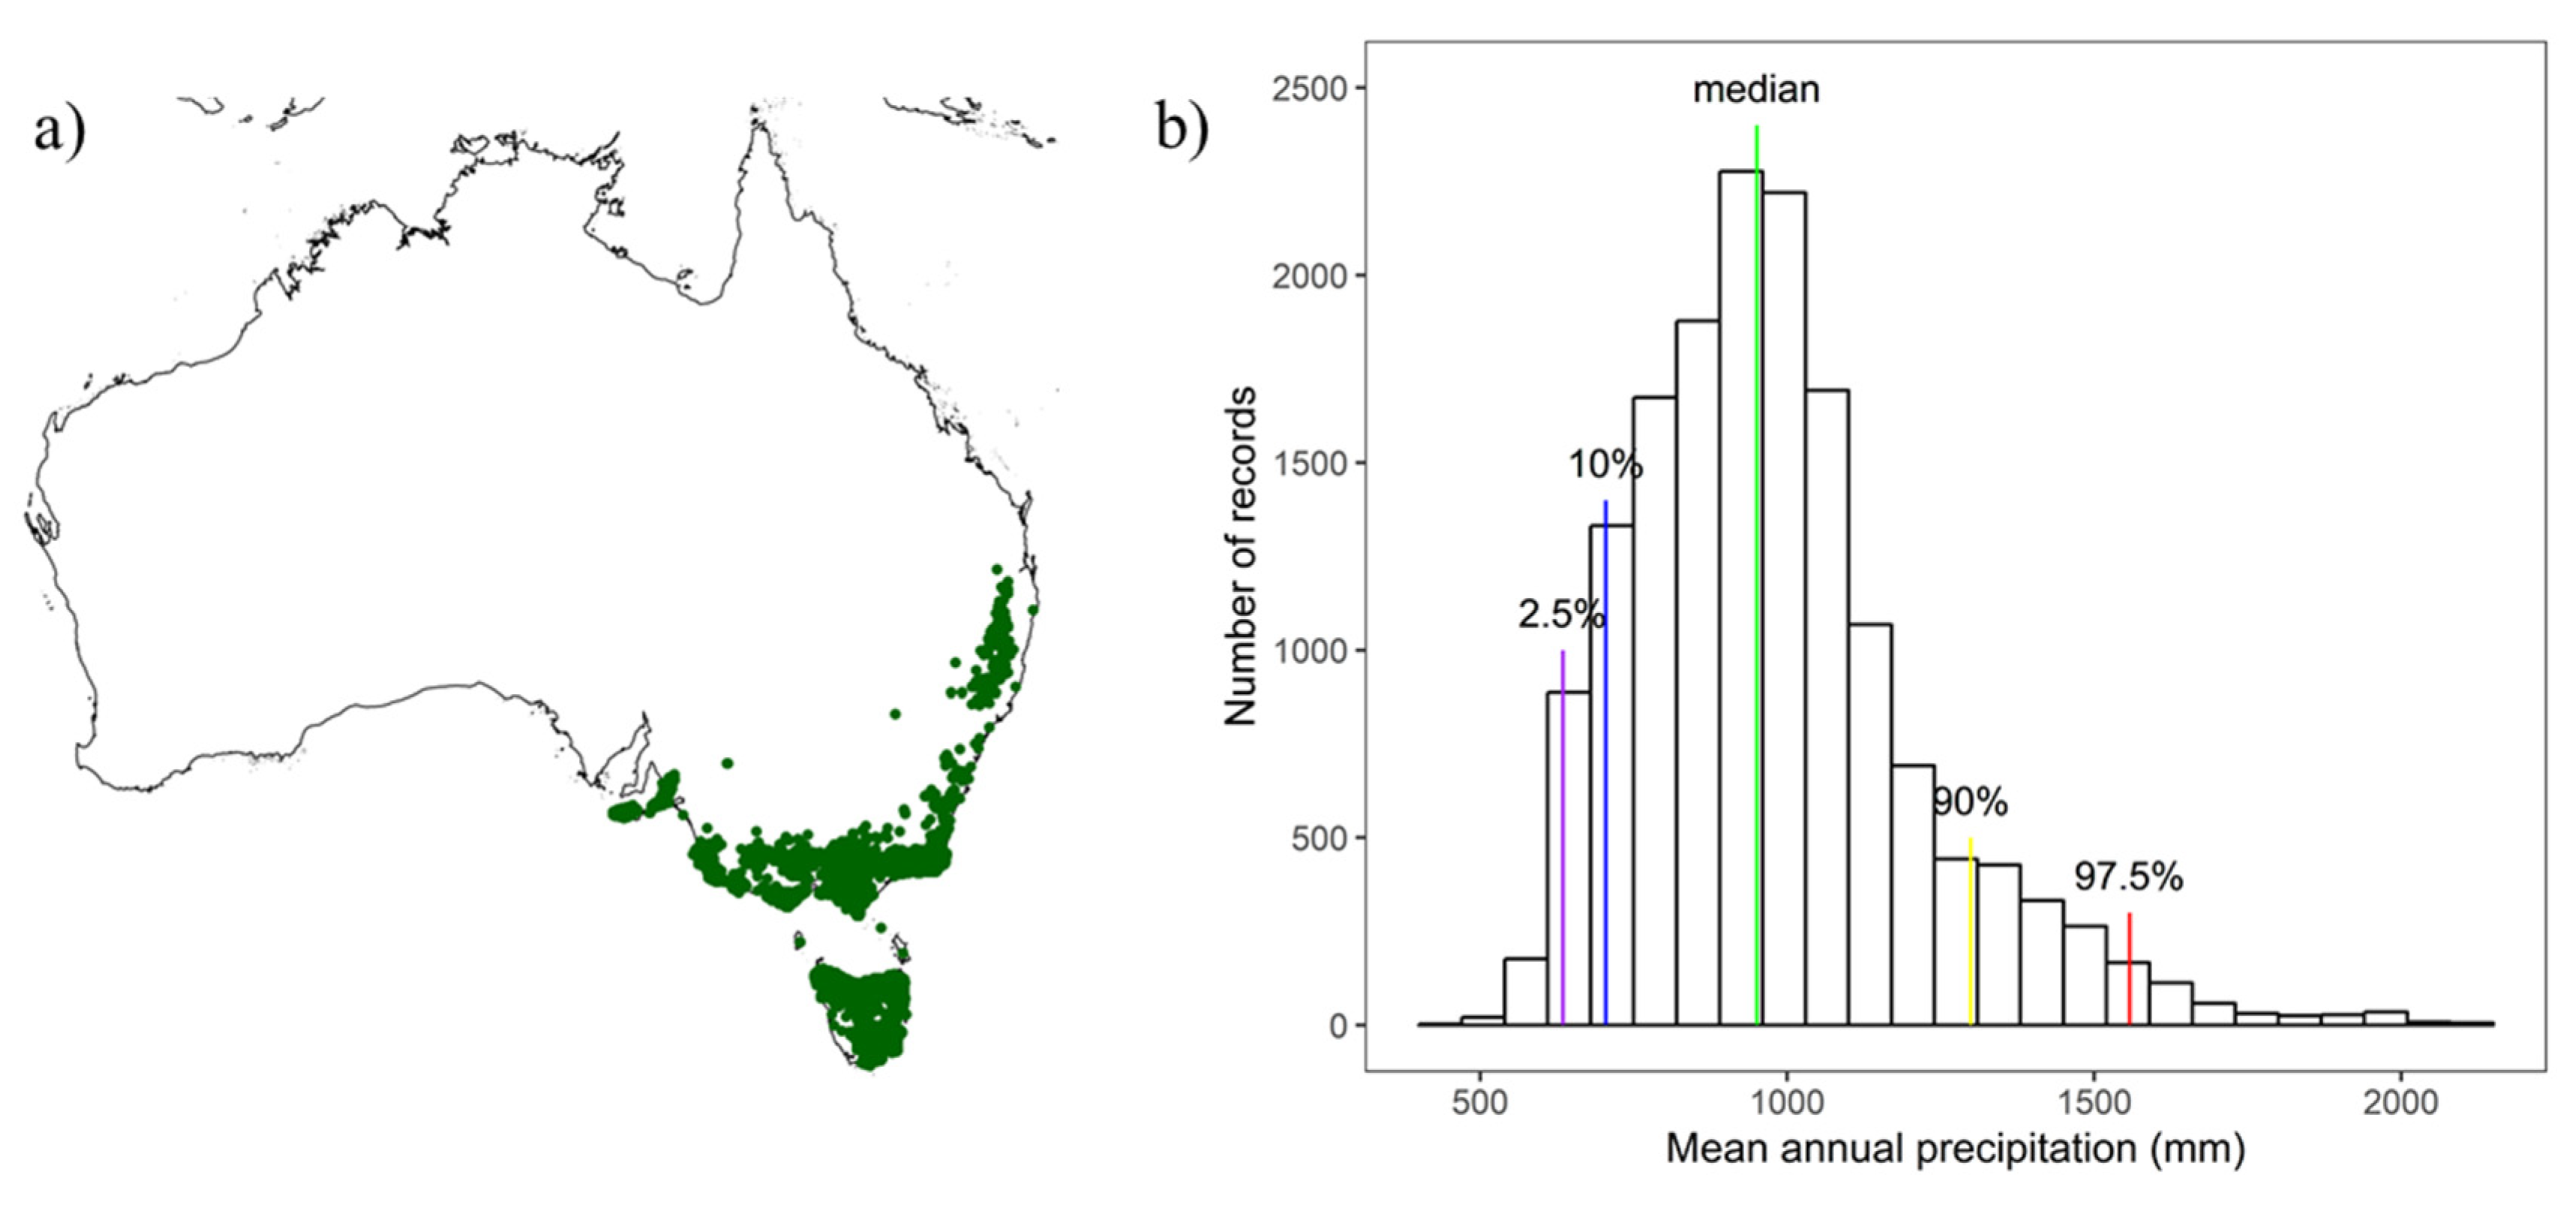
2.1. Study Site

The study was conducted in the Wombat State Forest, approximately 100 km north-west of Melbourne, Australia (37°25′01″ S, 144°10′48″ E, 770 m above sea level). The overstorey consists of E. obliqua, E. radiata and E. dives, growing in a mixed, even-aged wet sclerophyll regrowth stand, with a stand basal area ranging between 13.7 and 33.6 cm2 m−2. The study species, E. obliqua, was 14 years old and, on average, 7–15 m tall with an average diameter at breast height of 5.5–8.5 cm.
Long-term climate data for the site at the Wombat State Forest was obtained from ANUCLIM v1 [26]. Long-term average daily minimum temperatures in summer were 9.5 °C and maximum temperatures 22 °C, compared with 2.5 °C and 8 °C in winter. Precipitation occurs in all months, the majority occurring in winter (mean annual rainfall is 1015 mm). Historically, droughts of high severity are uncommon at the site, but the Standardized Precipitation Evapotranspiration Index (SPEI; http://spei.csic.es/index.html) indicates that the site is becoming persistently drier since 1997 (Figure 1).
The Standardized Precipitation Evapotranspiration Index is a robust drought index, where precipitation is the most important factor [27]. According to observations in the Atlas of Living Australia (https://www.ala.org.au), the climatic centre of distribution of E. obliqua’s is at 951 mm mean annual precipitation (Figure 2). Hence, our study site at 1015 mm mean annual precipitation reflects the growing conditions for most individuals of the species (Figure 2b).

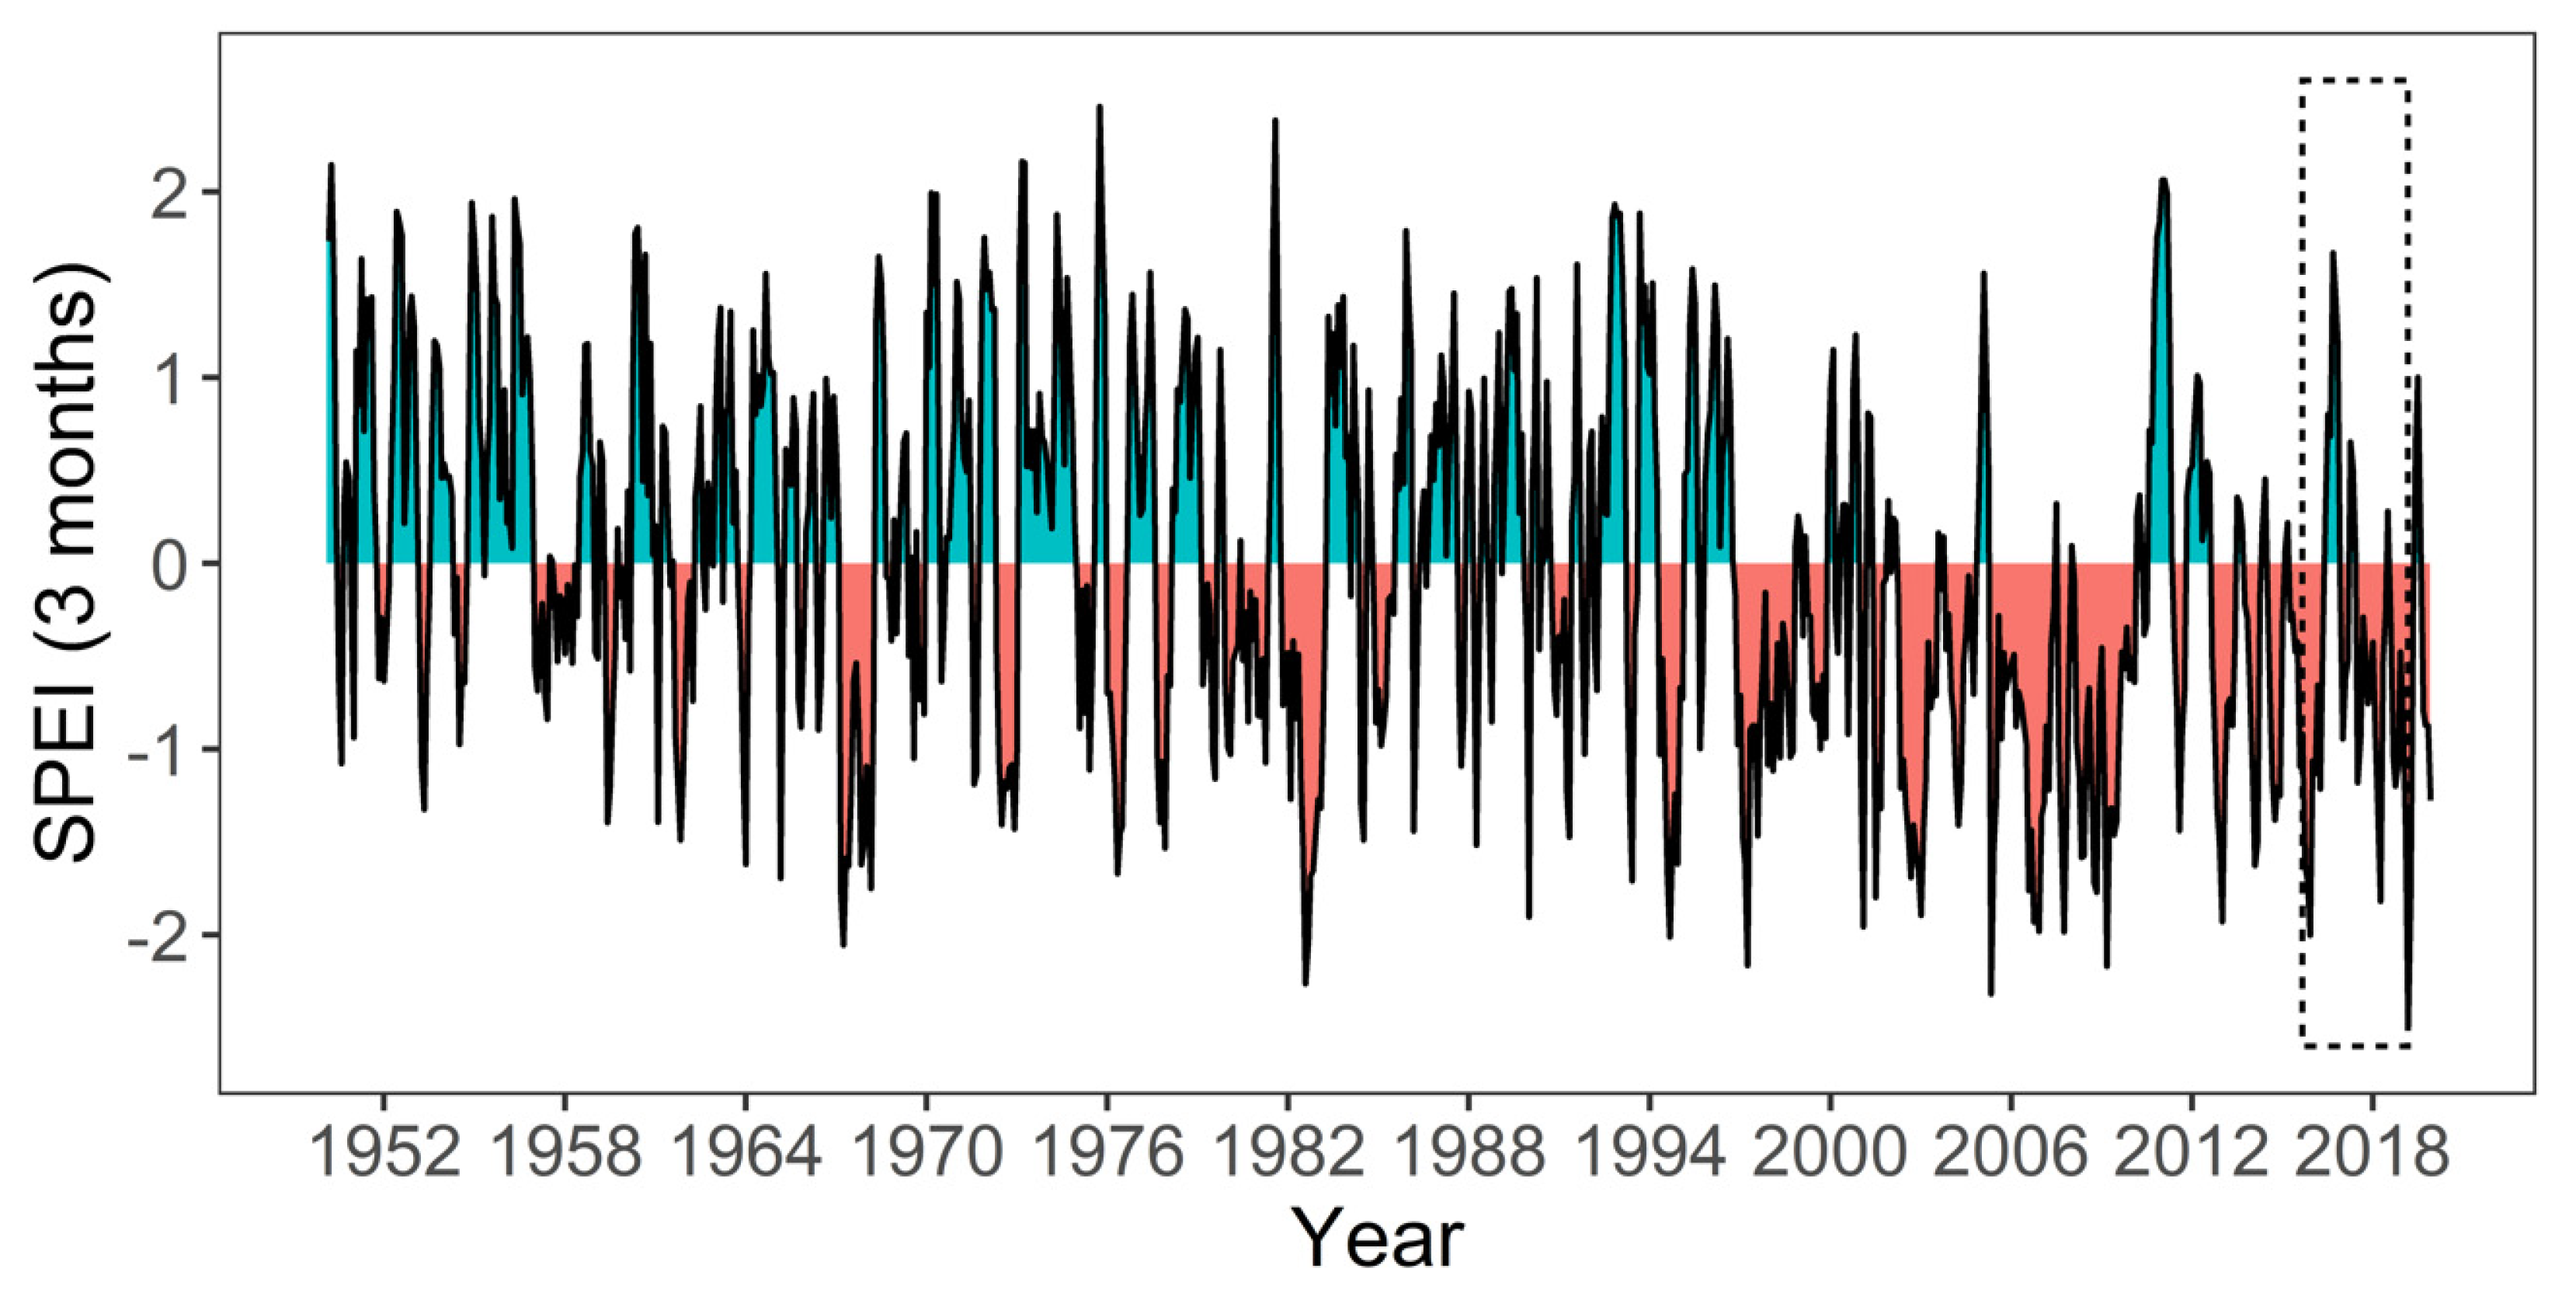
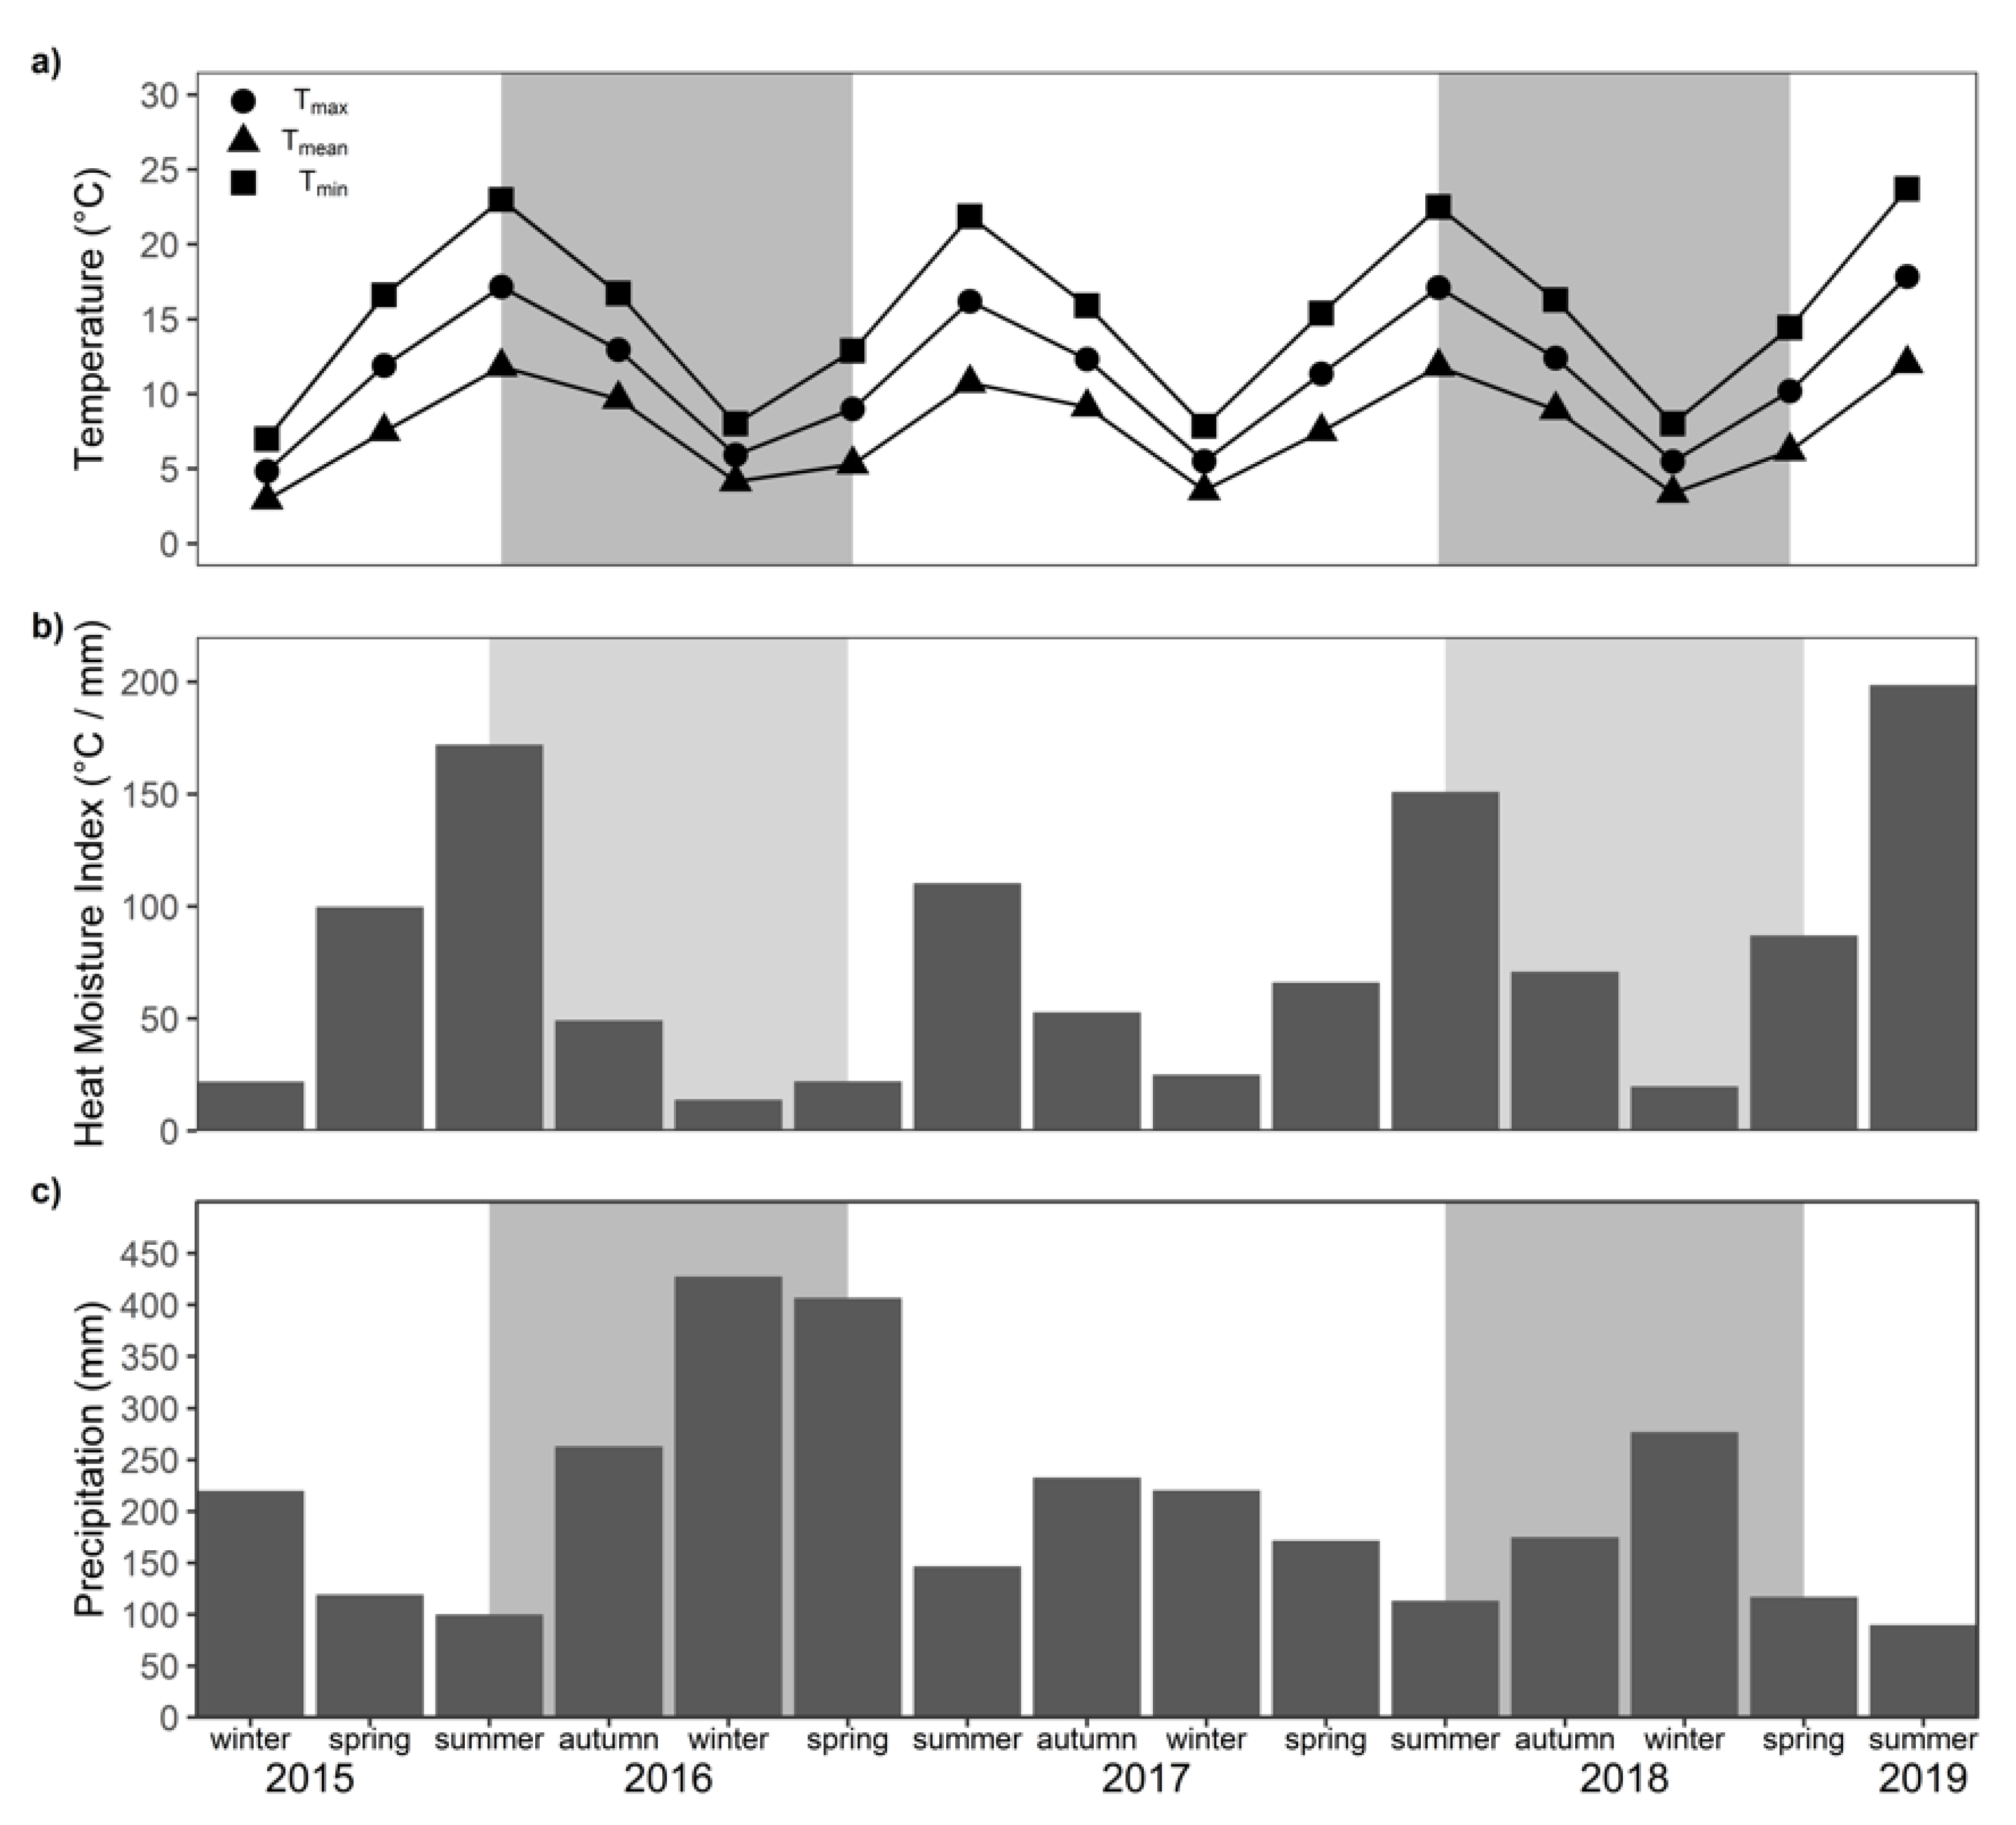
2.2. Meteorological Conditions During the Study Period

A weather station at the Wombat flux tower site of the Terrestrial Ecosystem Research Network (TERN; www.ozflux.org.au) was used to capture weather conditions during the experiment (2015–2019). The Wombat flux tower site is located 8 km west of the study site. Average seasonal temperatures showed minor differences between the years 2015‒2019. Average summer maximum temperature was 23 °C across all years, with the lowest average maximum summer temperature in 2017 being 21.9 °C and the highest of 23.7 °C in 2019 (Figure 3). Total seasonal rainfall varied substantially between years and seasons. The driest year (2015) had only 666 mm compared with the wettest year of 1197 mm in 2016, and 772 mm for 2017 and 682 mm for 2018. As an indicator of drought stress, we calculated the Heat Moisture Index [28] for each season as: Heat Moisture Index (HMI) = seasonal mean temperature/(seasonal mean precipitation/1000). High HMI values reflect drought conditions, and low values represent a wet growth environment.

2.3. Experimental Design

Trees at the site were monitored from 2015 to 2019, with the aim to conduct a throughfall reduction experiment in the forest according to DroughtNet guidelines (https://drought-net.colostate.edu/). To establish a baseline, six 10 × 10 m plots were set up in 2015 to measure seasonal water relations traits for three trees in each plot (18 trees in total). After 1.5 years of monitoring, rainfall exclusion gutters were installed in spring 2016 in three of the six plots. The rainfall gutters were 40 cm wide and placed to cover 50% of a 14 × 14 m area, with the 10 × 10 m plot being in the centre. The trenches were at the highest point 2.40 m in height and sloped over 14 m down to 40 cm in height (Figure S1). We were unable to hydrologically isolate the site by trenching because the research permit provided by the State Government did not permit trenching in the forest. To compensate, we performed all trait measurements on three trees growing in the plot centre (5 × 5 m area). As an evergreen tree, the canopy of E. obliqua contains leaves from 1–3 years of age [29]. All sample material was collected from recent shoots to be able to relate leaf trait changes to seasonal differences and the throughfall reduction treatment.

2.4. Functional Trait Measurements

Towards the end of each season, we measured morphological and physiological water relations traits on three trees per plot, which resulted in a total of 18 trees (nine in control plots and nine in throughfall reduction plots). We used an extendable pole to obtain branches from the lower position within the canopy and performed all analysis on healthy leaves. If occurring, we also measured not fully expanded leaves in our morphological analysis. Pre-dawn (ΨPD) and midday (ΨMD) leaf water potentials were measured for two leaves per tree using a pressure chamber (Model 3000, Soilmoisture Equipment Corporation, Santa Barbara, CA, USA). The leaves were harvested between 0500 h and 0700 h for ΨPD and between 1200 h and 1400 h for ΨMD and stored in resealable plastic bags in a portable cooler before measuring them in the field. We also performed pressure-volume curves on one leaf per tree following the description given by Sanders and Arndt [30]. The turgor loss point (ΨTLP) and osmotic potential at full turgor (Ψsolute) were derived from the curve of 1/Ψ against relative water content using a fitting routine available online (http://landflux.org) based on Schulte and Hinckley [31].
We sampled five twigs of a diameter of ~0.3 cm for each tree to determine the Huber Value (HV, sapwood area/leaf area) [32], average leaf size (LA) and specific leaf area (SLA). A leaf area meter (Li 3100, Li-Cor Inc., Lincoln, NE, USA) was used to measure cumulative leaf area and ImageJ software to measure the sapwood area [33]. The cumulative leaf area was divided by the number of leaves per individual twig to obtain the LA, whereas SLA represented the total leaf area divided by the total leaf dry weight. The dry weight was recorded after oven drying leaves for 48 h at 65 °C or until weight did not change.

2.5. Statistics

All analyses were performed in R (version 3.4.3), [34]. One-way ANOVA was used to test for a treatment effect between throughfall reduction and control treatments. All season and trait combinations were analysed individually, with three throughfall reductions and three control plots. To understand the biological importance of seasonal trait adjustment, we calculated the effect sizes of year and season. To analyse the seasonal variation, we used all control trees and the treatment trees prior to the installation of the throughfall gutters. As we had only a small sample size, we used Hedges’ g effect sizes where a significant trait adjustment existed, if the confidence interval was not overlapping zero [35]. A negative effect indicated that the first group had a lower trait mean compared to the second group, whereas a positive effect indicated that the first group had a higher trait mean than the second group. We estimated the yearly effect size only between 2016 and 2017 as these were the only years where we measured all seasons. Linear models were used to assess the influence of seasonal precipitation and HMI on ΨPD (package: lme) as well as the influence of ΨPD on all other functional traits.

3. Results

3.1. Effectiveness of Throughfall Reduction Experiment

The throughfall reduction treatment had no statistically significant effect on any of the measured traits, except for HV on one occasion (Table S1). Huber value was significantly greater in the trees of throughfall reduction plots during summer 2017 (p = 0.027) compared with the control trees. The ΨPD, ΨMD, ΨTLP, Ψsolute, LA and SLA showed no significant differences in seasonal trait expression between control and throughfall reduction treatments at any point in time.

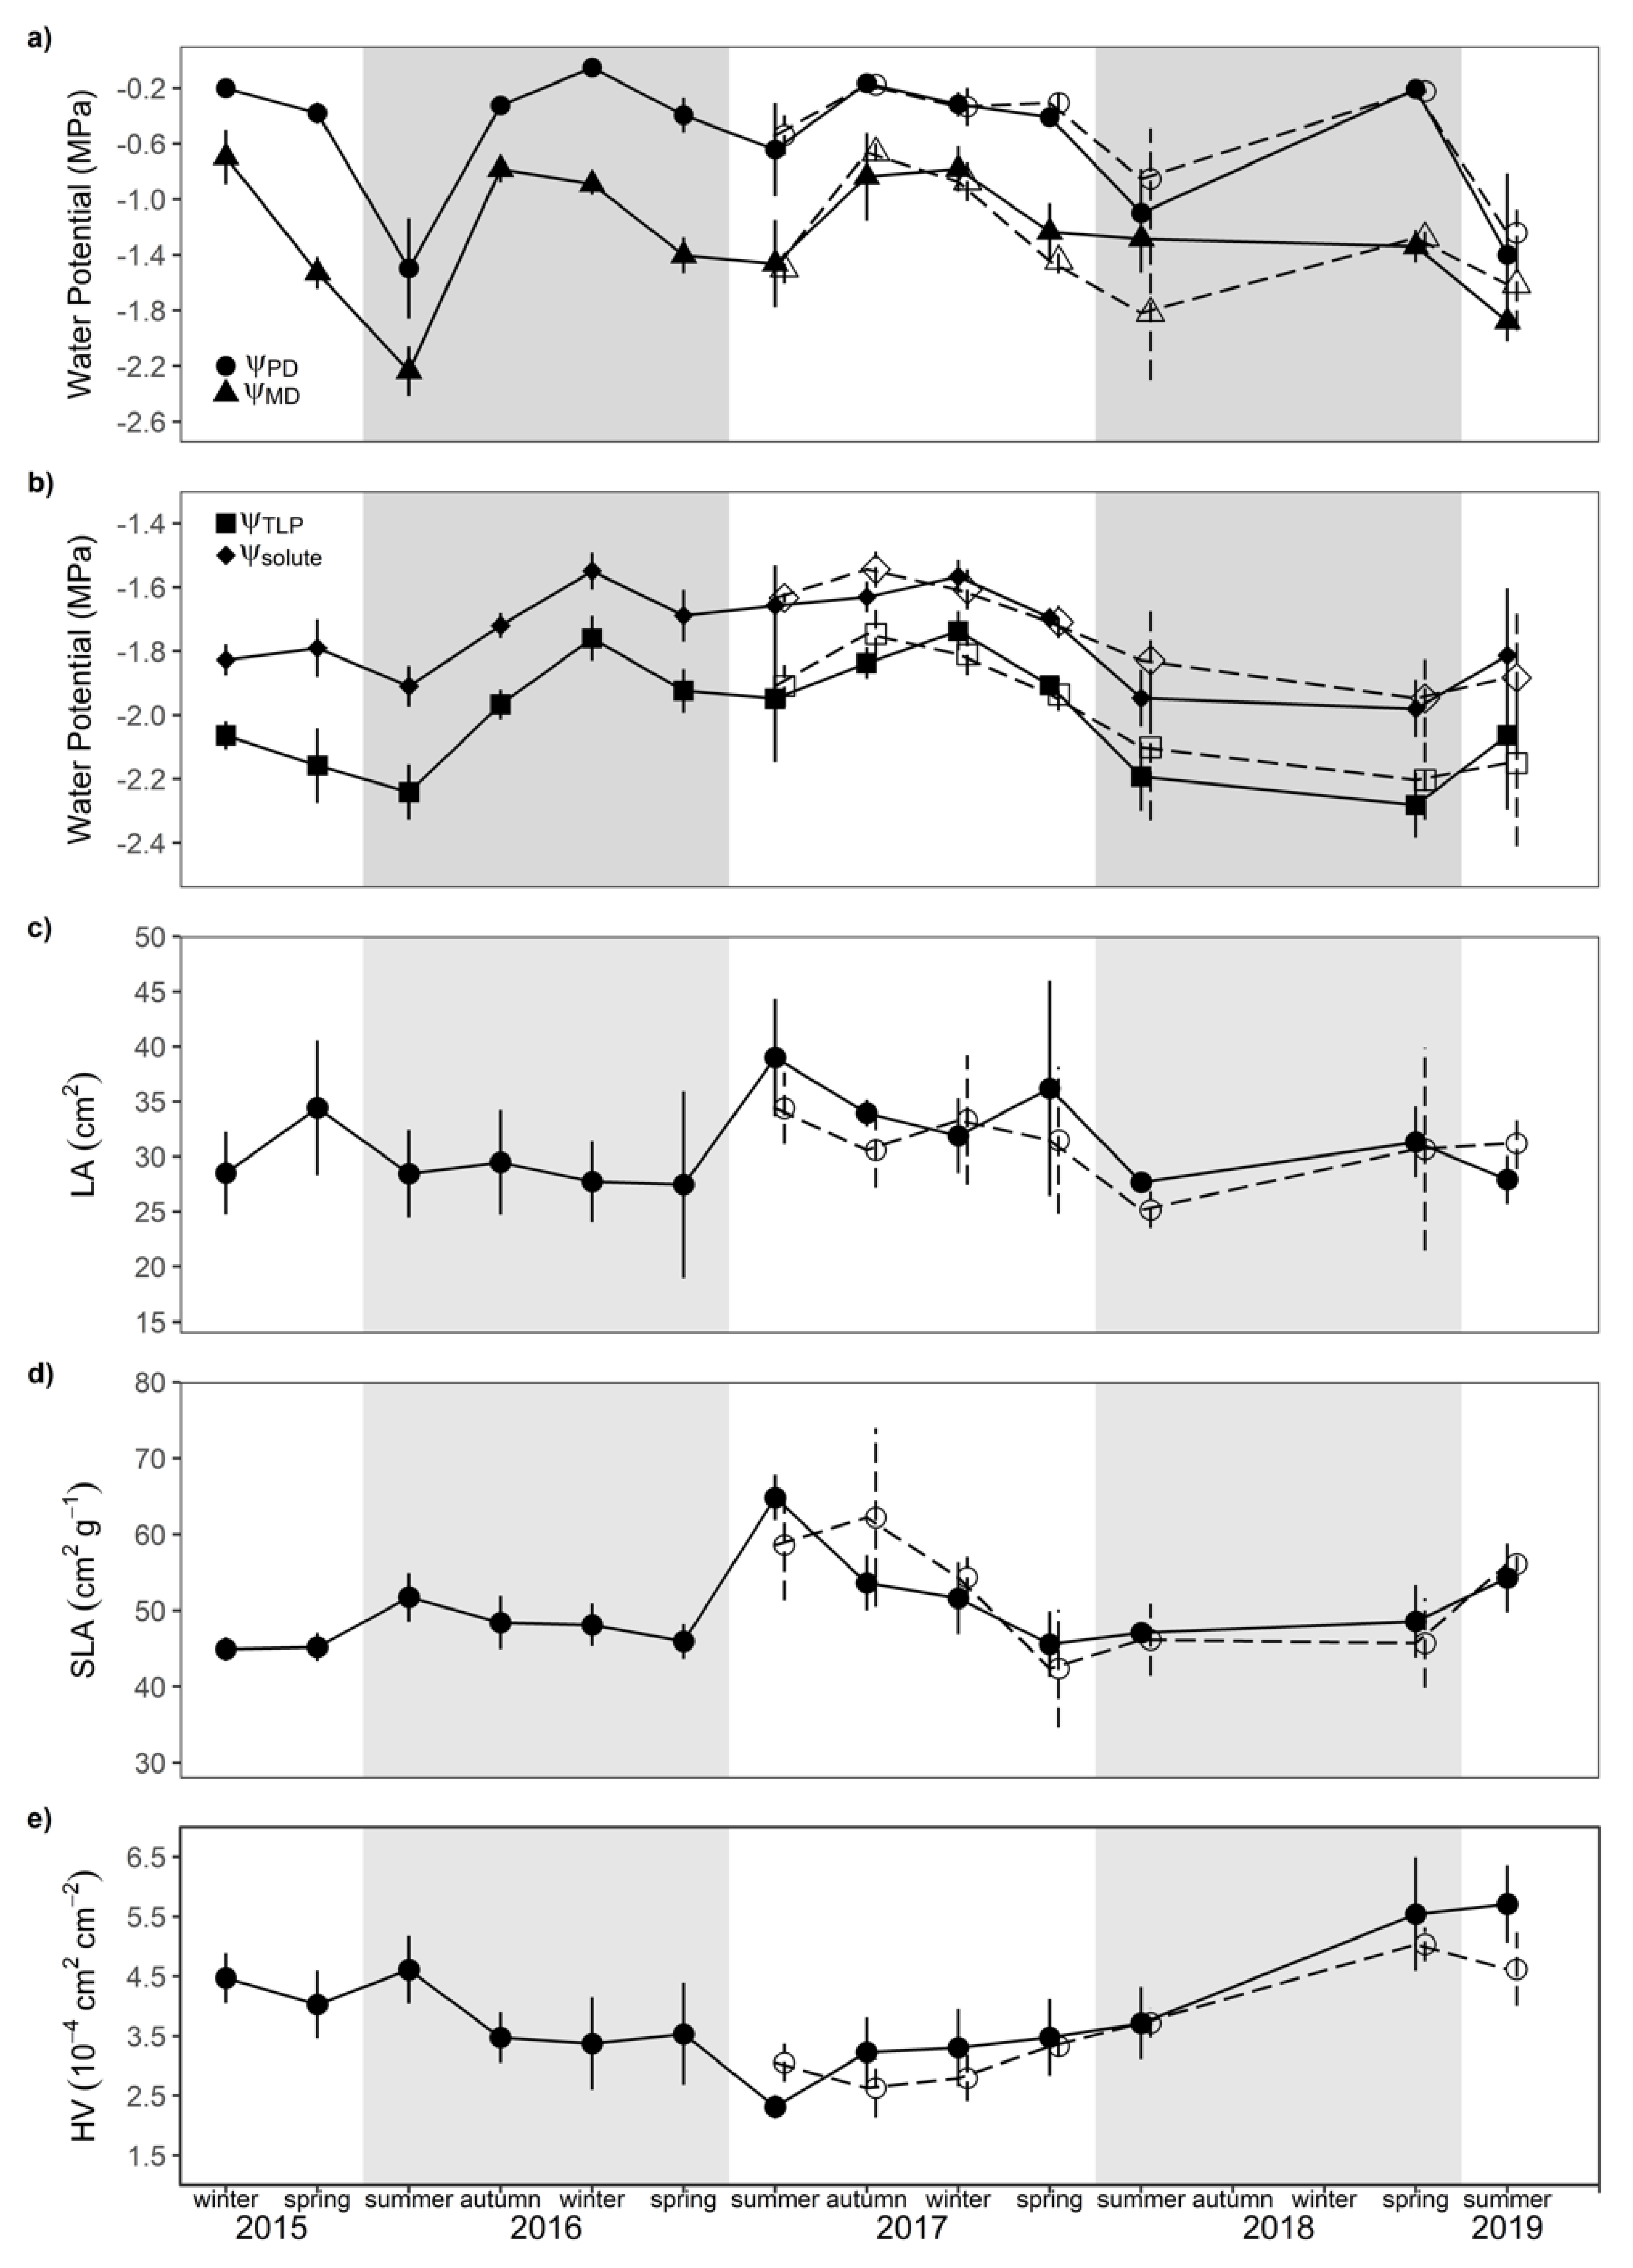
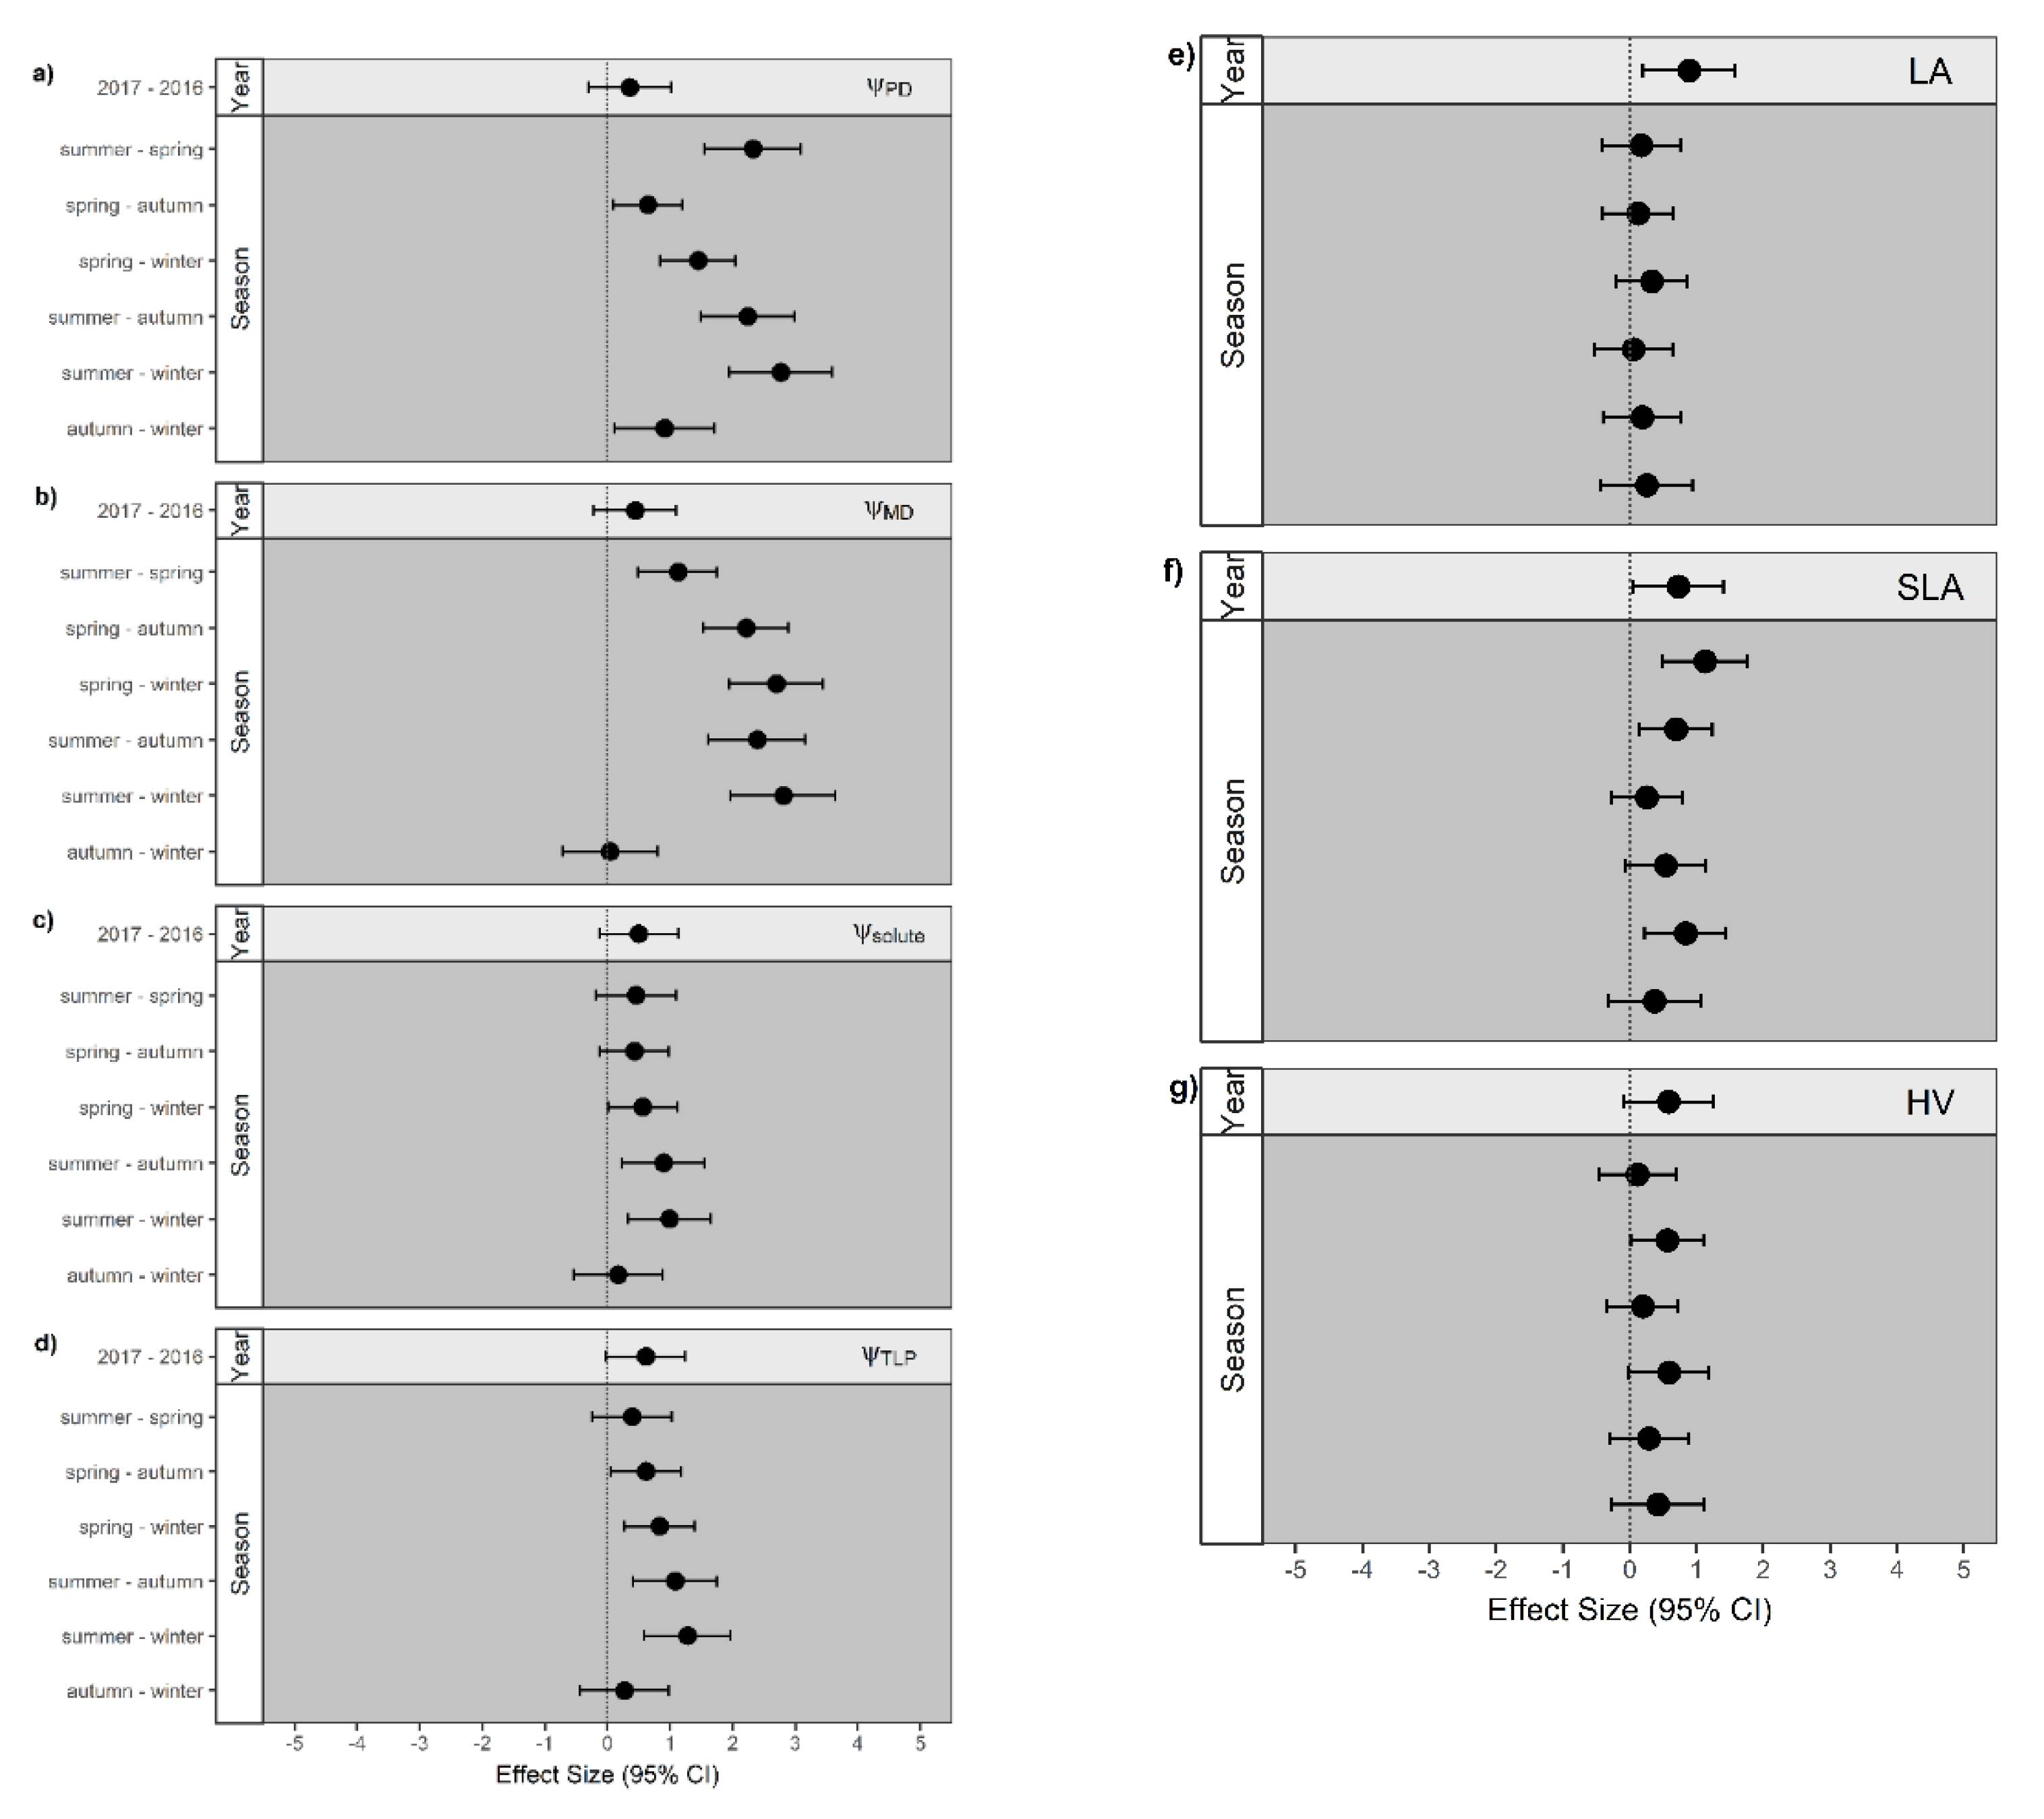
3.2. Seasonal Physiological and Morphological Trait Variability

The ΨPD and ΨMD changed in response to season, with both values being lowest in summer and highest in winter (Figure 4a). Except for the ΨMD transition from autumn to winter, ΨPD and ΨMD responded significantly to all other seasonal changes (Figure 5). However, between years, ΨPD and ΨMD differed strongly in the summer expression. The lowest ΨPD of −1.50 MPa and ΨMD of −2.24 MPa were measured during the summer of 2016, whereas summer in 2017 had ΨPD values of −0.64 MPa and ΨMD values of −1.46 MPa. Further, the strongest seasonal trait plasticity was observed for ΨPD and ΨMD between summer and winter (Hedges’ g: 2.77 and 2.81, respectively, Table S2).
The seasonal changes in ΨTLP and Ψsolute were similar to those in leaf water potential. Summer and spring were characterised with lower ΨTLP and Ψsolute values than during autumn and winter (Figure 4b). Seasonal adjustments were significant for ΨTLP and Ψsolute from summer to either winter or autumn as well as from spring to winter (Figure 5). In 2016, the ΨTLP adjusted by −0.48 MPa from summer to winter compared with only −0.21 MPa in 2017. The Ψsolute adjustment with season was similar to the adjustment in ΨTLP, whereby Ψsolute was on average −0.22 MPa (±0.06) higher than the ΨTLP (Figure 4).
Of all measured traits, only SLA and LA differed significantly between years (Figure 5). Leaves were bigger and has a higher specific leaf area in 2017 compared with 2016 (Figure 4). Among seasons, SLA was higher during summer compared with spring (Hedges’ g: 1.23) and winter (Hedges’ g: 0.84). The SLA and HV also demonstrated significant adjustments between spring and autumn, with lower SLA and lower HV in autumn. In contrast, no seasonal pattern was observed for LA.

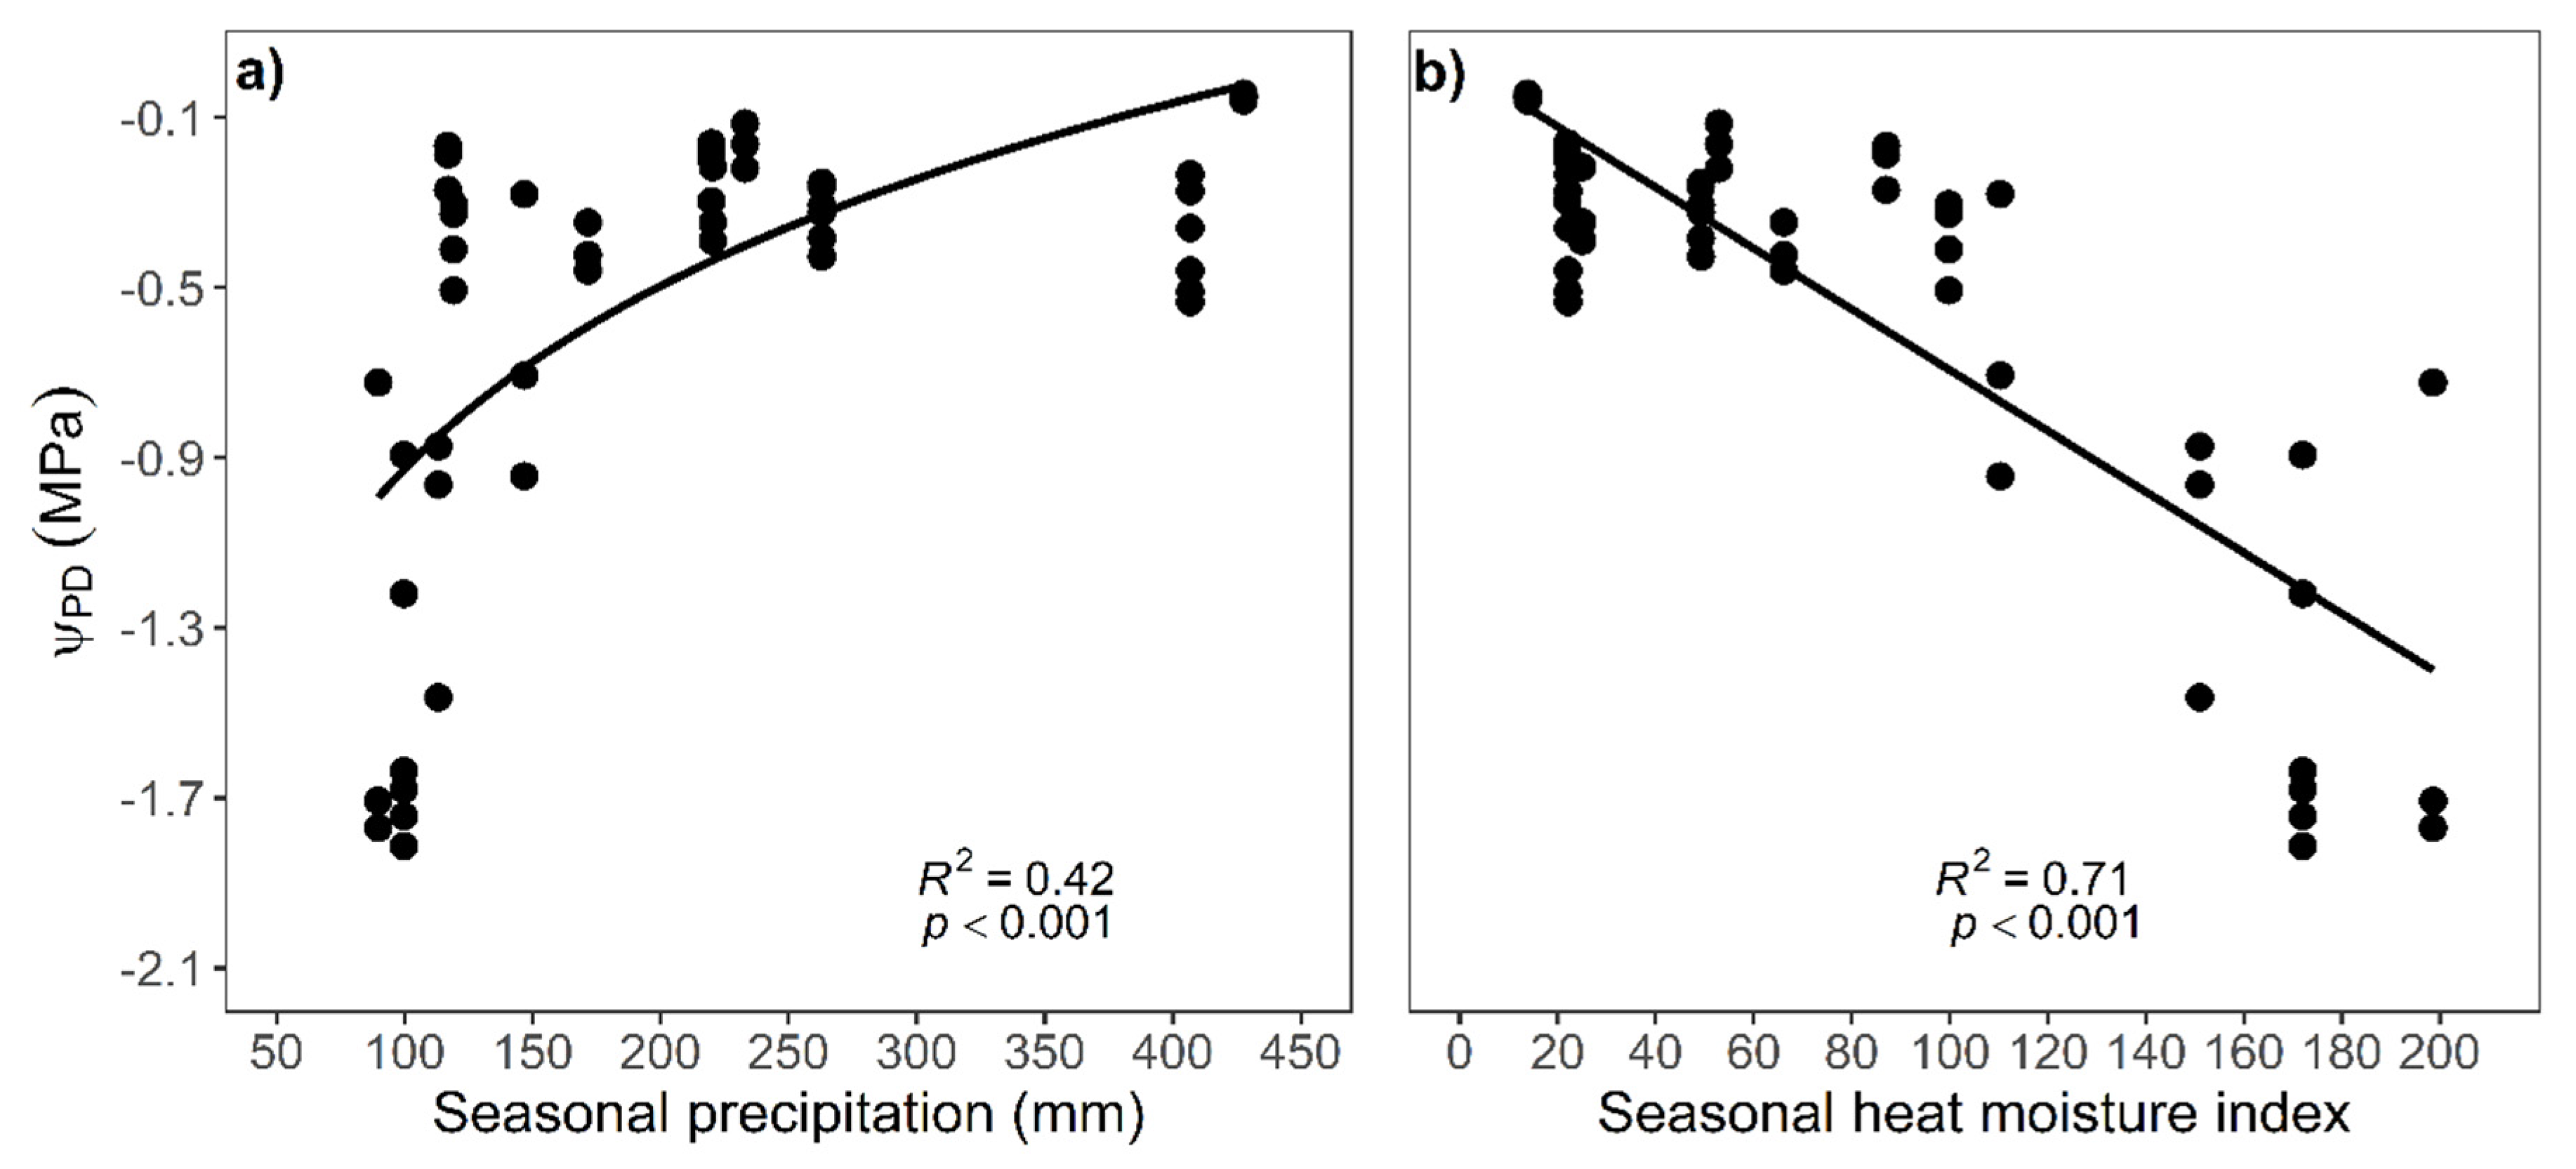
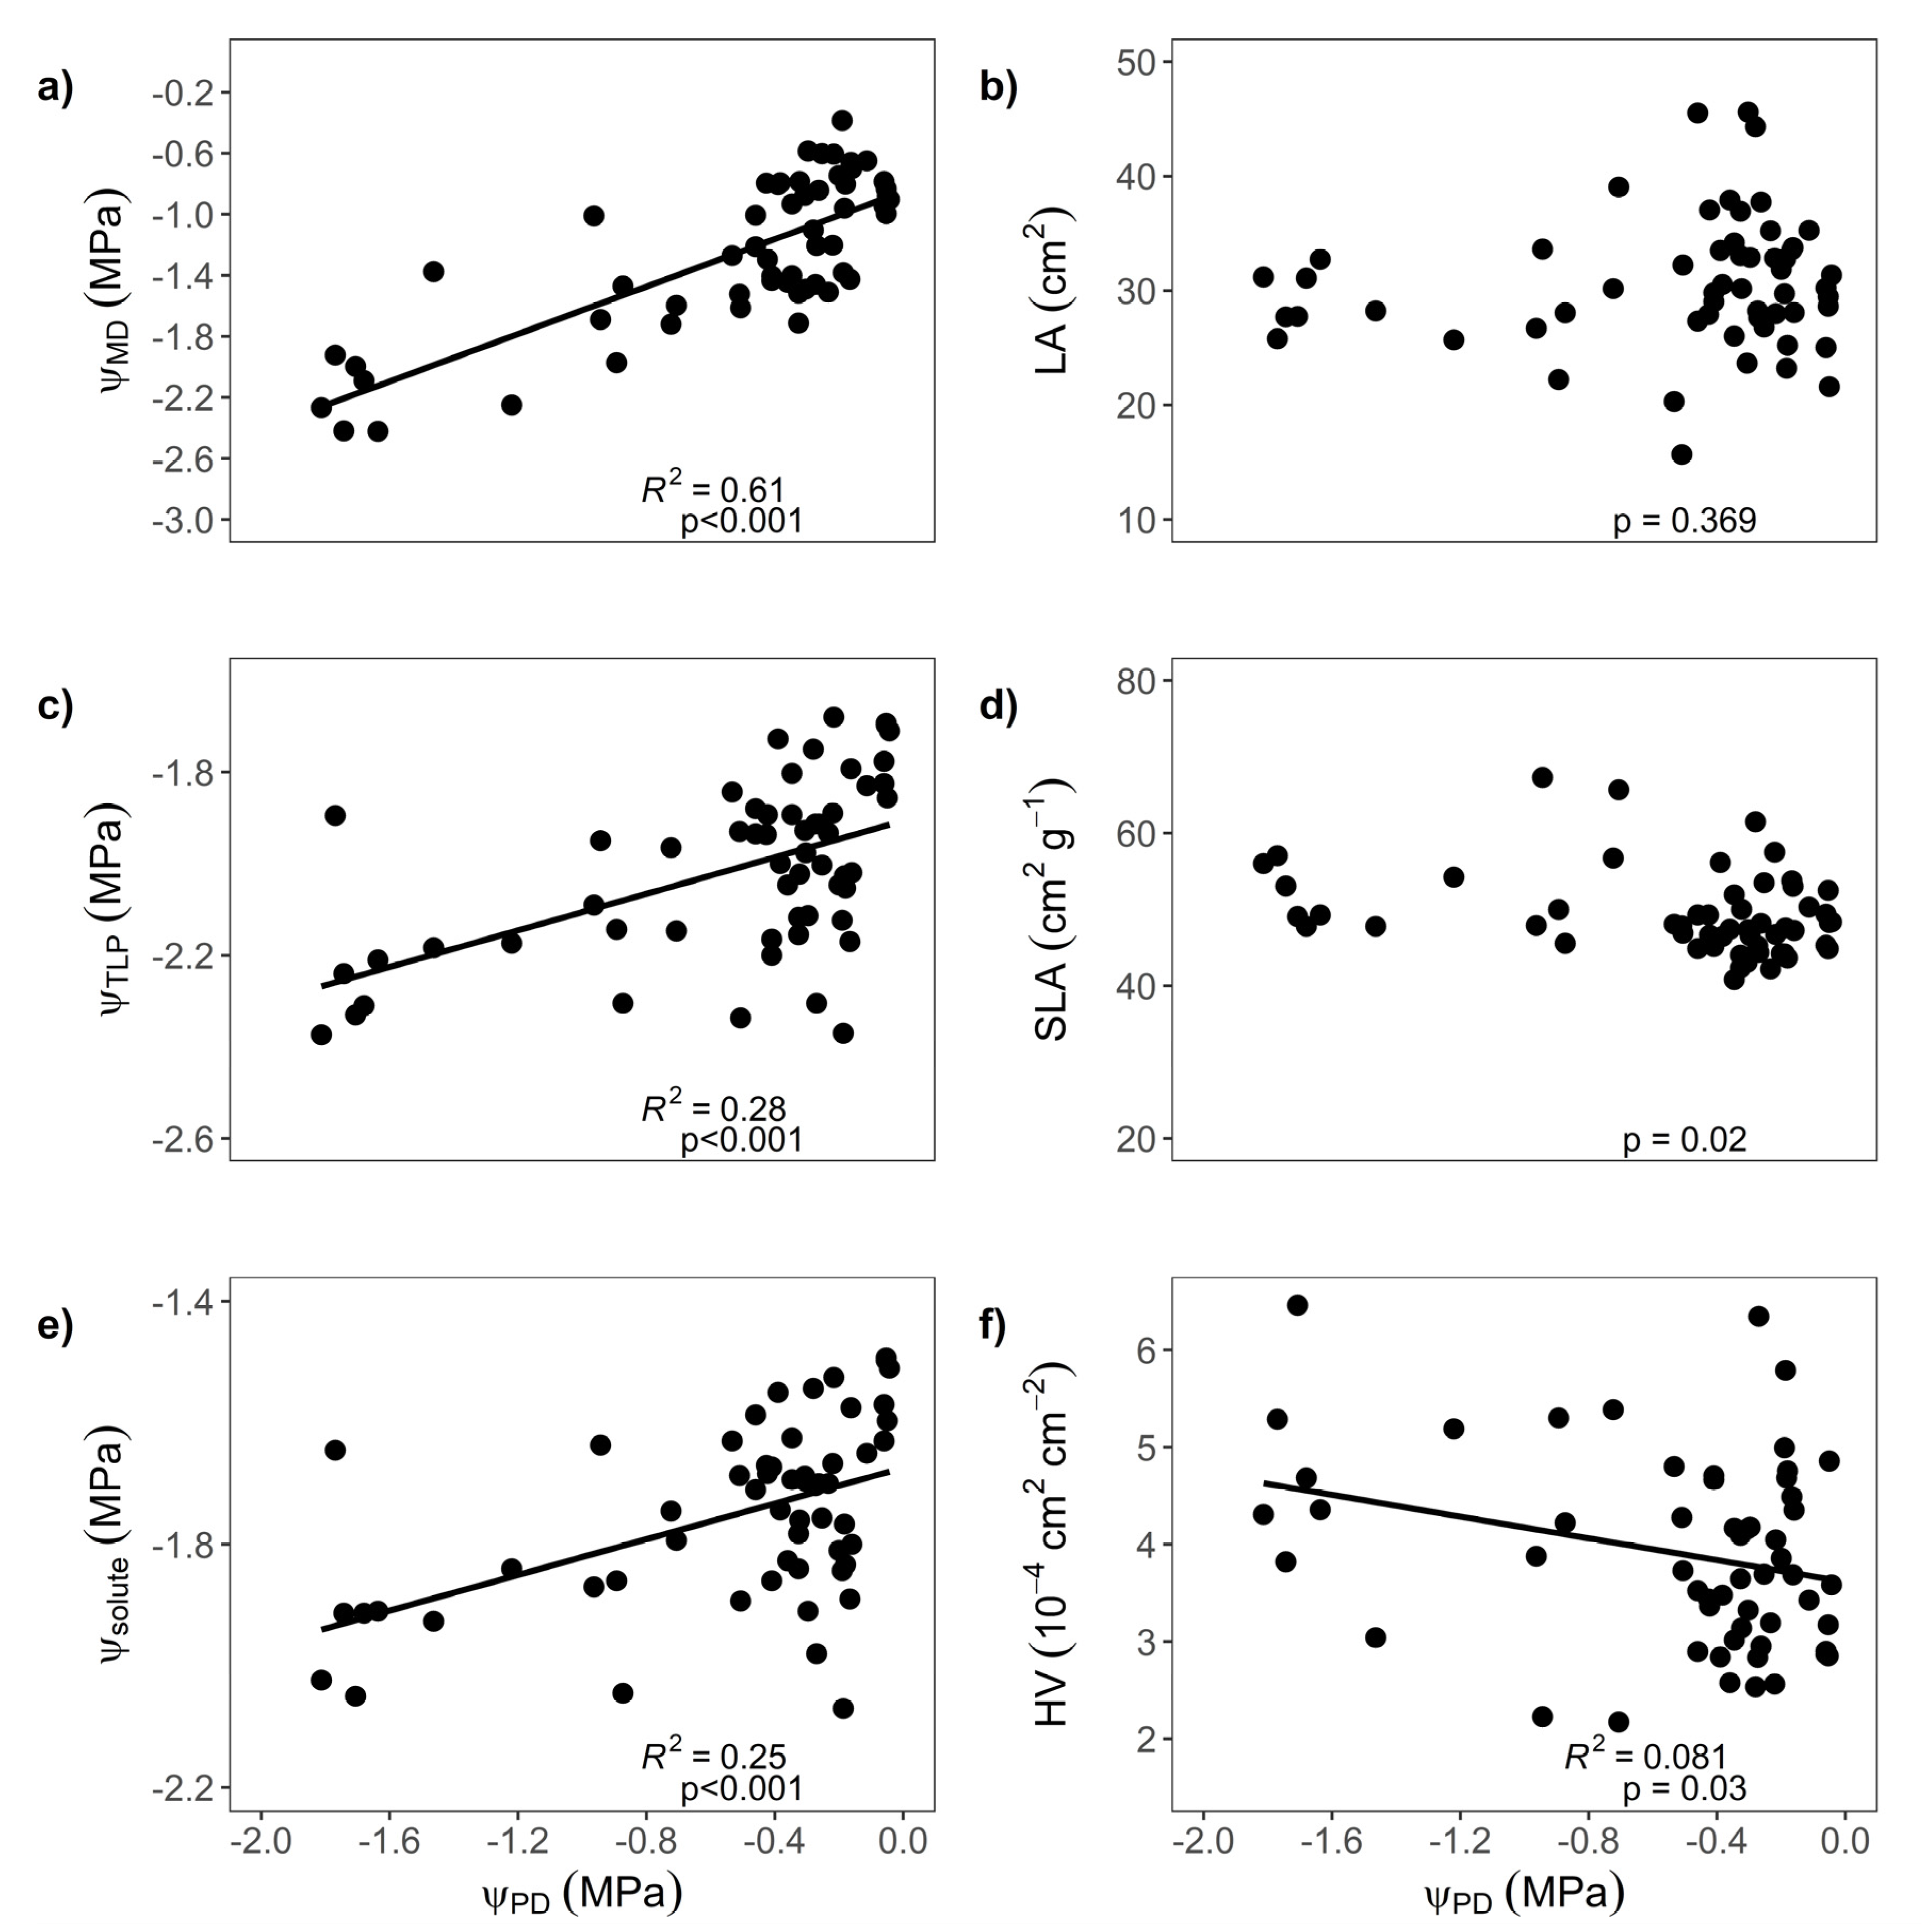
3.3. Impact of Seasonal Drought on Trait Expression

Significant relationships were observed between seasonal rainfall and ΨPD and between seasonal HMI and ΨPD (Figure 6). The ΨPD decreased exponentially with decreasing seasonal precipitation (R2 = 0.41). Thus, we could define ‘drought’ as the seasonal periods where ΨPD homeostasis was not upheld when seasonal precipitation was reduced to less than 120 mm, and ΨPD decreased below -0.75 MPa. Over the measurement range, ΨPD also decreased linearly with increasing seasonal HMI (R2 = 0.69).
All physiological traits were relatively unrelated to ΨPD during well-water seasons (ΨPD bigger than −0.75 MPa) but related significantly to ΨPD during drought (Figure 7). A decline in ΨPD was accompanied by a decrease ΨMD, ΨTLP and Ψsolute. In contrast, HV was the only morphological trait that responded significantly to changes in ΨPD, with higher HV in response to lower ΨPD.

4. Discussion

4.1. Effectiveness of Throughfall Reduction Experiment

The throughfall reduction experiment was designed to analyse the effect of short-term (seasonal) and long-term (inter-annual) droughts on established E. obliqua trees. However, we observed no differences in ΨPD between treatment and control plots and except for the Huber value, no other traits changed in response to throughfall reduction. Hence, the initial aim to investigate long-term drought adjustments by comparing control and throughfall reduction plots within the forest cannot be answered with the current dataset.
It is possible that the measurement period following throughfall reduction was not long enough to detect a treatment effect. Although soil moisture reductions during rainfall reduction studies can be detected after three months [36], most setups detect differences after one year [13,37,38]. Differences in ΨPD between control and throughfall reduction plots can take longer than the soil water reductions [39]. While no treatment effect during the wet winter season was expected [38], all trees exhibited declining leaf water potentials and drought in summer, which should have been amplified by throughfall reduction. The first two summers following the throughfall reduction installation, however, were wetter than the summer in 2016, which may have reduced the effectiveness of the experimental setup. It is possible that the high stem density allowed considerable stem flow and interception loss [40] and/or the coverage of 50% surface area was insufficient to substantially reduce the overall amount of water reaching the soil, although it is recommended by the international drought network (https://drought-net.colostate.edu/). Furthermore, it is possible that the experiment was not effective because we were not permitted to hydrologically isolate the treatment plots through trenching. Hence, water may have entered the throughfall reduction plots through lateral flow from outside the treatment area. While the throughfall reduction installation was ineffective, we observed seasonal trait changes, which we discuss in the following sections.

4.2. Seasonal Physiological and Morphological Trait Variability

We observed that most morphological and physiological traits changed with seasons. The seasonal decline in ΨPD and ΨMD suggests that the greatest water deficit occurred in seasons with high temperatures and low precipitation (summer). In contrast, ΨPD and ΨMD were high during autumn and winter, thus no water deficit occurred during these seasons [41,42]. Further significant trait adjustments in response to seasons were observed for ΨTLP, Ψsolute, SLA and HV.
The ΨTLP was more negative in summer compared with other seasons, which has been observed in eucalypts before [42,43,44]. The ΨTLP showed a seasonal adjustment of up to 0.4 MPa, which is similar to the global average based on a meta-analysis [45] and within the range observed for other eucalypts [46]. Variations in ΨTLP were mirrored by those in Ψsolute, indicating that changes in osmotically active solutes led to changes in the turgor loss point [30,43]. The use of osmotic adjustment as the key driver of turgor adjustment allows for a faster response to increasing drought stress, as osmolytes can be quickly released from storage carbohydrates like starch, or recent assimilates can be allocated to osmotic adjustment (Hartmann and Trumbore, 2016). A lower ΨTLP may facilitate water uptake during summer while avoiding stomatal closure [47,48,49]. However, this also means that the accumulation of osmolytes within the leaf can be metabolically costly [50] and will often be reversed once the drought stress decreases, e.g., during winter [48]. The large effect size as Ψsolute and ΨTLP adjusted from winter to summer suggests that these seasonal changes are a key response in eucalypts under drought stress.
The strong seasonal shifts in ΨMD suggest that E. obliqua has anisohydric characteristics [51]. It has been suggested that anisohydric trees are potentially more vulnerable to xylem embolism and death through hydraulic failure [52], as these trees often have a narrow safety margin between ΨMD and the leaf water potential inducing 50% or 88% loss of sapwood xylem conductivity (P50/88) [53]. In angiosperms, the hydraulic safety margin can be calculated as the difference between ΨMD and sapwood P88, as P88 has been identified as a mortality threshold [54]. The leaf P88 for E. obliqua at this site was −4.72 MPa [25], and the lowest observed ΨMD was −2.24 MPa (Figure 4a), which indicates a wide safety margin and a low risk of drought-induced mortality. In a drought mortality experiment in two-year-old E. obliqua trees drought mortality occurred at a ΨPD of −6 MPa (Pritzkow et al., under revision), indicating a large hydraulic safety margin for trees at this site.
The maintenance of a high Ψ can also be aided by leaf area adjustment and the highest HV (lowest leaf area relative to sapwood area) was observed in the summer months when ΨPD fell below −1.60 MPa. It is likely that, depending on the ΨMD, each summer generated some degree of embolism in the leaf cohort, which likely reduces leaf conductivity. Based on the leaf xylem vulnerability curve for this E. obliqua population [25] and the measured summer ΨMD, it is likely that embolism reduced leaf conductivity by 13–17% during the wet summers of 2017 and 2018 and by 27–36% during the dry summers of 2019 and 2016. The loss of leaf conductivity may be a result of leaf embolism [55]. A high degree of embolism reduces leaf function and induces tissue death [56], which may also promote leaf shedding and consequently a higher HV. Seasonal adjustments in HV were observed in diverse ecosystems [57,58] and likely contribute to maintaining homeostasis by reducing the total leaf area under dry conditions. Decreasing photosynthetic area through leaf shedding during an uncommonly intensive drought is likely more sustainable than increasing embolism resistance in mesic habitats where droughts are rare [12,59]. However, for E. obliqua it is also possible that leaf area adjustment is a long-term adjustment to water availability. E. obliqua trees at drier sites generally had a higher HV than in wetter sites and seasonal increases in HV in summer were greater in trees at drier sites compared to wetter sites [25]. Hence, leaf area adjustment to lower water availability seems common in this species.
We also observed plasticity in SLA and LA and some of these changes can be attributed to leaf development. Like many eucalypts, E. obliqua produces new leaves mainly during the summer months [60], confirming that changes in SLA of the recent leaf cohort may be mainly driven by leaf development changes rather than drought stress. Interestingly, SLA and LA were also the only measured parameters with a significant effect of year, with leaf sizes and specific leaf areas being greater in 2017 than in 2016. We suspect that greater drought stress during the 2016 summer (ΨPD = −1.60 MPa) compared to the mild drought stress during the 2017 summer (ΨPD = −0.64 MPa) strongly influenced leaf expansion. Drought stress potentially reduced the cell division and elongation in the developing leaves, leading to smaller leaves with reduced specific leaf area [61,62,63].

4.3. Impact of Seasonal Drought on Trait Expression

Except for LA and SLA, all traits were related to ΨPD, suggesting that their trait plasticity is a result of leaf water potential changes. Seasonal plasticity in ΨPD only developed when seasonal precipitation decreased below 120 mm, or HMI increased above 130. The ΨTLP and Ψsolute adjustments in response to declining ΨPD were main contributors to the drought resistance strategy of E. obliqua as adjustment occurred not only under severe drought stress but also in response to a mild decline in ΨPDPD > −0.75 MPa). Periods of water deficit in summer where ΨMD was low were met by lowering the turgor loss point beyond ΨMD. Leaf area adjustments (HV changes) were rather moderate during the entire measurement period and only occurred under more severe drought stress (ΨPD less than −1.2 MPa).

5. Conclusions

Our study indicated that trait plasticity is a key factor in the drought response of established trees in this widespread eucalypt. Whilst the rainfall reduction experiment was ineffective and did not induce a long-term soil moisture reduction, we did observe significant seasonal droughts in all control plots for two years. We confirmed the hypothesis that mild levels of seasonal water deficit trigger transient adjustments in lower ΨTLP. While we could not test chronic reductions in water availability, we did observe reductions in leaf area only in response to more severe water deficits. Our study was conducted in a mesic environment, where droughts are not common, and trees generally operated at high Ψ that only decreased in very dry summers. The small changes in HV indicate that partial drought deciduousness is possible but is a secondary response that is triggered only when a significant water deficit occurs. Overall, there is no indication that the studied E. obliqua population is currently at a risk of drought-induced mortality, which by extrapolation suggests a relatively stable distribution area, as the site represents the climatic conditions under which the majority of E. obliqua occurs.

Supplementary Materials

The following are available online at https://www.mdpi.com/1999-4907/11/12/1371/s1: Figure S1: Throughfall reduction setup (a) concept and (b) implemented field setup in the Wombat State forest. Figure S2: Leaf hydraulic vulnerability for mature E. obliqua populations. Table S1: ANOVA results for comparison between impact and control treatment. Table S2: Effect size (Hedges’ g), replication (N Group 1, N Group 2) and confidence interval (CI) for each water relations trait.

Author Contributions

Conceptualization, C.P., C.S., V.G.W. and S.K.A.; formal analysis, C.P.; writing—original draft, C.P.; writing—review and editing, C.P., C.S., V.G.W. and S.K.A.; visualization, C.P.; supervision, C.S., V.G.W. and S.K.A. All authors have read and agreed to the published version of the manuscript.

Funding

This research was supported by the Madeleine Selwyn Smith Memorial Trust Fund, the Albert Shimmins Fund and a grant by the Holsworth Wildlife Research Endowment fund to C.P.

Acknowledgments

We thank Gregor Sanders, Tarquin Netherway, Martin Pount and Thomas Haden for their assistance with field work. We acknowledge the Dja Dja and Wurundjeri peoples, the traditional owners of the land where this research was undertaken.

Conflicts of Interest

The authors declare no conflict of interest. The funders had no role in the design of the study; in the collection, analyses, or interpretation of data; in the writing of the manuscript, or in the decision to publish the results.

References

  1. Basu, S.; Ramegowda, V.; Kumar, A.; Pereira, A. Plant adaptation to drought stress. F1000Research 2016, 5, 1554–1564. [Google Scholar] [CrossRef] [PubMed]
  2. Levitt, J. Responses of Plants to Environmental Stresses; Academic Press: New York, NY, USA, 1980. [Google Scholar]
  3. IPCC. Climate Change 2013: The Physical Science Basis. Contribution of Working Group I to the Fifth Assessment Report of the Intergovernmental Panel on Climate Change; Cambridge University Press: Cambridge, UK; New York, NY, USA, 2013; p. 1535. [Google Scholar]
  4. Allen, C.D.; Macalady, A.K.; Chenchouni, H.; Bachelet, D.; McDowell, N.; Vennetier, M.; Kitzberger, T.; Rigling, A.; Breshears, D.D.; Hogg, E.H.; et al. A global overview of drought and heat-induced tree mortality reveals emerging climate change risks for forests. For. Ecol. Manag. 2010, 259, 660–684. [Google Scholar] [CrossRef] [Green Version]
  5. Leuzinger, S.; Thomas, R.Q. How do we improve earth system models? Integrating earth system models, ecosystem models, experiments and long-term data. N. Phytol. 2011, 191, 15–18. [Google Scholar] [CrossRef] [PubMed]
  6. Binks, O.; Meir, P.; Rowland, L.; da Costa, A.C.L.; Vasconcelos, S.S.; de Oliveira, A.A.R.; Ferreira, L.; Christoffersen, B.; Nardini, A.; Mencuccini, M. Plasticity in leaf-level water relations of tropical rainforest trees in response to experimental drought. N. Phytol. 2016, 211, 477–488. [Google Scholar] [CrossRef] [Green Version]
  7. Barbeta, A.; Ogaya, R.; Peñuelas, J. Dampening effects of long-term experimental drought on growth and mortality rates of a holm oak forest. Glob. Chang. Biol. 2013, 19, 3133–3144. [Google Scholar] [CrossRef]
  8. Da Costa, A.C.L.; Metcalfe, D.B.; Doughty, C.E.; de Oliveira, A.A.R.; Neto, G.F.C.; da Costa, M.C.; Silva, J.D.A., Jr.; Aragão, L.E.O.C.; Almeida, S.; Galbraith, D.R.; et al. Ecosystem respiration and net primary productivity after 8–10 years of experimental through-fall reduction in an eastern Amazon forest. Plant Ecol. Divers. 2014, 7, 7–24. [Google Scholar] [CrossRef]
  9. Seidel, H.; Menzel, A. Above-ground dimensions and acclimation explain variation in drought mortality of scots pine seedlings from various provenances. Front. Plant Sci. 2016, 7, 1001–1014. [Google Scholar] [CrossRef]
  10. Leuzinger, S.; Luo, Y.; Beier, C.; Dieleman, W.; Vicca, S.; Körner, C. Do global change experiments overestimate impacts on terrestrial ecosystems? Trends Ecol. Evol. 2011, 26, 236–241. [Google Scholar] [CrossRef]
  11. Cavender-Bares, J.; Bazzaz, F.A. Changes in drought response strategies with ontogeny in quercus rubra: Implications for scaling from seedlings to mature trees. Oecologia 2000, 124, 8–18. [Google Scholar] [CrossRef]
  12. Martin-StPaul, N.K.; Limousin, J.-M.; Vogt-Schilb, H.; Rodríguez-Calcerrada, J.; Rambal, S.; Longepierre, D.; Misson, L. The temporal response to drought in a mediterranean evergreen tree: Comparing a regional precipitation gradient and a throughfall exclusion experiment. Glob. Chang. Biol. 2013, 19, 2413–2426. [Google Scholar] [CrossRef]
  13. Tng, D.Y.P.; Apgaua, D.M.G.; Ishida, Y.F.; Mencuccini, M.; Lloyd, J.; Laurance, W.F.; Laurance, S.G.W. Rainforest trees respond to drought by modifying their hydraulic architecture. Ecol. Evol. 2018, 8, 12479–12491. [Google Scholar] [CrossRef] [PubMed] [Green Version]
  14. Booth, T.H.; Broadhurst, L.M.; Pinkard, E.; Prober, S.M.; Dillon, S.K.; Bush, D.; Pinyopusarerk, K.; Doran, J.C.; Ivkovich, M.; Young, A.G. Native forests and climate change: Lessons from eucalypts. For. Ecol. Manag. 2015, 347, 18–29. [Google Scholar] [CrossRef]
  15. White, D.A.; Beadle, C.L.; Worledge, D. Leaf water relations of Eucalyptus globulus ssp. Globulus and E. nitens: Seasonal, drought and species effects. Tree Physiol. 1996, 16, 469–476. [Google Scholar] [CrossRef] [PubMed] [Green Version]
  16. Bourne, A.E.; Creek, D.; Peters, J.M.R.; Ellsworth, D.S.; Choat, B. Species climate range influences hydraulic and stomatal traits in Eucalyptus species. Ann. Bot. 2017, 120, 123–133. [Google Scholar] [CrossRef] [PubMed]
  17. Pfautsch, S.; Harbusch, M.; Wesolowski, A.; Smith, R.; Macfarlane, C.; Tjoelker, M.G.; Reich, P.B.; Adams, M.A.; Lloret, F. Climate determines vascular traits in the ecologically diverse genus Eucalyptus. Ecol. Lett. 2016, 19, 240–248. [Google Scholar] [CrossRef]
  18. Merchant, A.; Arndt, S.K.; Rowell, D.M.; Posch, S.; Callister, A.; Tausz, M.; Adams, M.A. Seasonal changes in carbohydrates, cyclitols, and water relations of 3 field grown Eucalyptus species from contrasting taxonomy on a common site. Ann. For. Sci. 2010, 67, 104. [Google Scholar] [CrossRef]
  19. Mitchell, P.J.; O’Grady, A.P.; Tissue, D.T.; Worledge, D.; Pinkard, E.A. Co-ordination of growth, gas exchange and hydraulics define the carbon safety margin in tree species with contrasting drought strategies. Tree Physiol. 2014, 34, 443–458. [Google Scholar] [CrossRef]
  20. Hughes, L.; Cawsey, E.M.; Westoby, M. Climatic range sizes of eucalyptus species in relation to future climate change. Glob. Ecol. Biogeogr. Lett. 1996, 5, 23–29. [Google Scholar] [CrossRef]
  21. Jones, D.A.; Wang, W.; Fawcett, R. High-quality spatial climate data-sets for Australia. Aust. Meteorol. Oceanogr. J. 2009, 58, 233–248. [Google Scholar] [CrossRef]
  22. Matusick, G.; Ruthrof, K.X.; Kala, J.; Brouwers, N.C.; Breshears, D.D.; Hardy, G.E.S.J. Chronic historical drought legacy exacerbates tree mortality and crown dieback during acute heatwave-compounded drought. Environ. Res. Lett. 2018, 13, 1–14. [Google Scholar] [CrossRef]
  23. Ross, C.; Brack, C. Eucalyptus viminalis dieback in the Monaro region, NSW. Aust. For. 2015, 78, 243–253. [Google Scholar] [CrossRef]
  24. Green, J.W. Variation in Eucalyptus obliqua l’hérit. N. Phytol. 1971, 70, 897–909. [Google Scholar] [CrossRef]
  25. Pritzkow, C.; Williamson, V.; Szota, C.; Trouvé, R.; Arndt, S.K. Phenotypic plasticity and genetic adaptation of functional traits influences intra-specific variation in hydraulic efficiency and safety. Tree Physiol. 2020, 40, 215–229. [Google Scholar] [CrossRef] [PubMed]
  26. Hutchinson, M.; Kesteven, J.; Xu, T. Anuclimate 1.0, 0.01 Degree, Australian Coverage, 1970–2016; Australian National University: Canberra, Australia, 2017; Available online: https://app.bccvl.org.aued (accessed on 25 November 2020).
  27. Vicente-Serrano, S.M.; Beguería, S.; López-Moreno, J.I. A multiscalar drought index sensitive to global warming: The standardized precipitation evapotranspiration index. J. Clim. 2009, 23, 1696–1718. [Google Scholar] [CrossRef] [Green Version]
  28. Wang, T.; Hamann, A.; Yanchuk, A.; O’Neill, G.A.; Aitken, S.N. Use of response functions in selecting lodgepole pine populations for future climates. Glob. Chang. Biol. 2006, 12, 2404–2416. [Google Scholar] [CrossRef]
  29. Jacobs, M.R. Growth Habits of the Eucalypts; Institute of Foresters: Canberra, Australia, 1986. [Google Scholar]
  30. Sanders, G.J.; Arndt, S.K. Osmotic adjustment under drought conditions. In Plant Responses to Drought Stress: From Morphological to Molecular Features; Aroca, R., Ed.; Springer: Berlin/Heidelberg, Germany, 2012; pp. 199–229. [Google Scholar]
  31. Schulte, P.J.; Hinckley, T.M. A comparison of pressure-volume curve data analysis techniques. J. Exp. Bot. 1985, 36, 1590–1602. [Google Scholar] [CrossRef]
  32. Tyree, M.T.; Zimmermann, M. Xylem Structure and the Ascent of Sap; Springer: Berlin/Heidelberg, Germany, 2002; Volume 2. [Google Scholar]
  33. Schneider, C.A.; Rasband, W.S.; Eliceiri, K.W. NIH image to ImageJ: 25 years of image analysis. Nat. Methods 2012, 9, 671–675. [Google Scholar] [CrossRef]
  34. R Core Team. R: A Language and Environment for Statistical Computing; R Foundation for Statistical Computing: Vienna, Austria, 2017; Available online: https://www.R-project.org (accessed on 25 November 2020).
  35. Nakagawa, S.; Cuthill, I.C. Effect size, confidence interval and statistical significance: A practical guide for biologists. Biol. Rev. 2007, 82, 591–605. [Google Scholar] [CrossRef]
  36. Ogaya, R.; Peñuelas, J. Comparative field study of Quercus ilex and Phillyrea latifolia: Photosynthetic response to experimental drought conditions. Environ. Exp. Bot. 2003, 50, 137–148. [Google Scholar] [CrossRef]
  37. Battie-Laclau, P.; Laclau, J.-P.; Domec, J.-C.; Christina, M.; Bouillet, J.-P.; Piccolo, M.C.; Gonçalves, J.L.M.; Moreira, R.M.e.; Krusche, A.V.; Bouvet, J.-M.; et al. Effects of potassium and sodium supply on drought-adaptive mechanisms in Eucalyptus grandis plantations. N. Phytol. 2014, 203, 401–413. [Google Scholar] [CrossRef]
  38. Limousin, J.-M.; Rambal, S.; Ourcival, J.M.; Rocheteau, A.; Joffre, R.; Rodriguez-Cortina, R. Long-term transpiration change with rainfall decline in a mediterranean Quercus ilex forest. Glob. Chang. Biol. 2009, 15, 2163–2175. [Google Scholar] [CrossRef]
  39. Nepstad, D.C.; Tohver, I.M.; Ray, D.; Moutinho, P.; Cardinot, G. Mortality of large trees and lianas following experimental drought in an Amazon forest. Ecology 2007, 88, 2259–2269. [Google Scholar] [CrossRef] [PubMed]
  40. Limousin, J.-M.; Rambal, S.; Ourcival, J.-M.; Joffre, R. Modelling rainfall interception in a mediterranean Quercus ilex ecosystem: Lesson from a throughfall exclusion experiment. J. Hydrol. 2008, 357, 57–66. [Google Scholar] [CrossRef]
  41. Myers, B.; Neales, T. Seasonal changes in the water relations of Eucalyptus behriana F. Muell. and E. Microcarpa (maiden) maiden in the field. Aust. J. Bot. 1984, 32, 495–510. [Google Scholar] [CrossRef]
  42. Zolfaghar, S.; Villalobos-Vega, R.; Cleverly, J.; Eamus, D. Co-ordination among leaf water relations and xylem vulnerability to embolism of Eucalyptus trees growing along a depth-to-groundwater gradient. Tree Physiol. 2015, 35, 732–743. [Google Scholar] [CrossRef] [Green Version]
  43. Mitchell, P.J.; Veneklaas, E.J.; Lambers, H.; Burgess, S.S.O. Leaf water relations during summer water deficit: Differential responses in turgor maintenance and variation in leaf structure among different plant communities in South-Western Australia. Plant Cell Environ. 2008, 31, 1791–1802. [Google Scholar] [CrossRef]
  44. Myers, B.A.; Duff, G.A.; Eamus, D.; Fordyce, I.R.; O’Grady, A.; Williams, R.J. Seasonal variation in water relations of trees of differing leaf phenology in a wet-dry tropical savanna near darwin, Northern Australia. Aust. J. Bot. 1997, 45, 225–240. [Google Scholar] [CrossRef]
  45. Bartlett, M.K.; Zhang, Y.; Kreidler, N.; Sun, S.; Ardy, R.; Cao, K.; Sack, L. Global analysis of plasticity in turgor loss point, a key drought tolerance trait. Ecol. Lett. 2014, 17, 1580–1590. [Google Scholar] [CrossRef]
  46. White, D.A.; Turner, N.C.; Galbraith, J.H. Leaf water relations and stomatal behavior of four allopatric Eucalyptus species planted in mediterranean Southwestern Australia. Tree Physiol. 2000, 20, 1157–1165. [Google Scholar] [CrossRef]
  47. Brodribb, T.J.; Holbrook, N.M.; Edwards, E.J.; Gutiérrez, M.V. Relations between stomatal closure, leaf turgor and xylem vulnerability in eight tropical dry forest trees. Plant Cell Environ. 2003, 26, 443–450. [Google Scholar] [CrossRef] [Green Version]
  48. Warren, C.R.; Aranda, I.; Cano, F.J. Metabolomics demonstrates divergent responses of two Eucalyptus species to water stress. Metabolomics 2012, 8, 186–200. [Google Scholar] [CrossRef] [Green Version]
  49. Mitchell, P.J.; O’Grady, A.P.; Tissue, D.T.; White, D.A.; Ottenschlaeger, M.L.; Pinkard, E.A. Drought response strategies define the relative contributions of hydraulic dysfunction and carbohydrate depletion during tree mortality. N. Phytol. 2013, 197, 862–872. [Google Scholar] [CrossRef] [PubMed]
  50. Sala, A.; Piper, F.; Hoch, G. Physiological mechanisms of drought-induced tree mortality are far from being resolved. N. Phytol. 2010, 186, 274–281. [Google Scholar] [CrossRef] [PubMed]
  51. Tardieu, F.; Simonneau, T. Variability among species of stomatal control under fluctuating soil water status and evaporative demand: Modelling isohydric and anisohydric behaviours. J. Exp. Bot. 1998, 49, 419–432. [Google Scholar] [CrossRef] [Green Version]
  52. McDowell, N.; Pockman, W.T.; Allen, C.D.; Breshears, D.D.; Cobb, N.; Kolb, T.; Plaut, J.; Sperry, J.; West, A.; Williams, D.G.; et al. Mechanisms of plant survival and mortality during drought: Why do some plants survive while others succumb to drought? N. Phytol. 2008, 178, 719–739. [Google Scholar] [CrossRef]
  53. Anderegg, W.R.L.; Klein, T.; Bartlett, M.; Sack, L.; Pellegrini, A.F.A.; Choat, B.; Jansen, S. Meta-analysis reveals that hydraulic traits explain cross-species patterns of drought-induced tree mortality across the globe. Proc. Natl. Acad. Sci. USA 2016, 113, 5024–5029. [Google Scholar] [CrossRef] [Green Version]
  54. Urli, M.; Porté, A.J.; Cochard, H.; Guengant, Y.; Burlett, R.; Delzon, S. Xylem embolism threshold for catastrophic hydraulic failure in angiosperm trees. Tree Physiol. 2013, 33, 672–683. [Google Scholar] [CrossRef]
  55. Brodribb, T.J.; Skelton, R.P.; McAdam, S.A.M.; Bienaimé, D.; Lucani, C.J.; Marmottant, P. Visual quantification of embolism reveals leaf vulnerability to hydraulic failure. N. Phytol. 2016, 209, 1403–1409. [Google Scholar] [CrossRef]
  56. Cardoso, A.A.; Batz, T.A.; McAdam, S.A.M. Xylem embolism resistance determines leaf mortality during drought in Persea americana. Plant Physiol. 2020, 182, 547–554. [Google Scholar] [CrossRef] [Green Version]
  57. Macinnis-Ng, C.; McClenahan, K.; Eamus, D. Convergence in hydraulic architecture, water relations and primary productivity amongst habitats and across seasons in Sydney. Funct. Plant Biol. 2004, 31, 429–439. [Google Scholar] [CrossRef] [PubMed]
  58. Whitehead, D.; Beadle, C.L. Physiological regulation of productivity and water use in Eucalyptus: A review. For. Ecol. Manag. 2004, 193, 113–140. [Google Scholar] [CrossRef]
  59. Zeppel, M.; Eamus, D. Coordination of leaf area, sapwood area and canopy conductance leads to species convergence of tree water use in a remnant evergreen Woodland. Aust. J. Bot. 2008, 56, 97–108. [Google Scholar] [CrossRef] [Green Version]
  60. Griebel, A.; Bennett, L.T.; Arndt, S.K. Evergreen and ever growing—Stem and canopy growth dynamics of a temperate eucalypt forest. For. Ecol. Manag. 2017, 389, 417–426. [Google Scholar] [CrossRef]
  61. Wright, I.J.; Westoby, M.; Reich, P.B. Convergence towards higher leaf mass per area in dry and nutrient-poor habitats has different consequences for leaf life span. J. Ecol. 2002, 90, 534–543. [Google Scholar] [CrossRef] [Green Version]
  62. Poorter, H.; Niinemets, Ü.; Poorter, L.; Wright, I.J.; Villar, R. Causes and consequences of variation in leaf mass per area (LMA): A meta-analysis. N. Phytol. 2009, 182, 565–588. [Google Scholar] [CrossRef]
  63. Metcalfe, J.C.; Davies, W.J.; Pereira, J.S. Leaf growth of Eucalyptus globulus seedlings under water deficit. Tree Physiol. 1990, 6, 221–227. [Google Scholar] [CrossRef]
Figure 1. Monthly Standardized Precipitation Evapotranspiration Index (SPEI) averaged over three months from 1950 to 2019 (0.5° gridded SPEI range between −37.25 and −37.75 latitude and 144.25 longitude, calibration period from 1950 to 2010). Shaded box represents the study period.
Forests 11 01371 g001
Figure 2. Geographical distribution (a) and precipitation envelope (b) with key quantiles (coloured lines) of Eucalyptus obliqua (Source: Atlas of Living Australia, Records: 33,964, Downloaded: 12 April 2019).
Forests 11 01371 g002
Figure 3. Seasonal changes in minimum (Tmin), mean (Tmean) and maximum (Tmax) temperature (a), seasonal heat moisture index (b) and precipitation (c) during the measurement period at the Wombat State Forest site.
Forests 11 01371 g003
Figure 4. Seasonal changes in water relation traits in Eucalyptus obliqua for control (closed symbols) and throughfall reduction (open symbols) plots. The following traits are represented: (a) Pre-dawn (ΨPD, circles) and midday leaf water potentials (ΨMD, triangle), (b) water potential at turgor loss point (ΨTLP, square) and solute water potential at full turgor (Ψsolute diamond), (c) leaf area (LA), (d) specific leaf area (SLA), and (e) Huber Value (HV).
Forests 11 01371 g004
Figure 5. Effect size (Hedges’ (g) between both complete years (2016 and 2017) and all seasons for: (a) Pre-dawn water potential (ΨPD), (b) midday water potential (ΨMD), (c) solute potential at full turgor (Ψsolute), (d) water potential at turgor loss point (ΨTLP), (e) leaf area (LA), (f) specific leaf area (SLA), and (g) Huber Value (HV). The trait data were used on tree level, and all 18 trees were used prior to the installation of the throughfall gutters. Following the throughfall gutter installation, we used only data from nine trees (control plot trees).
Forests 11 01371 g005
Figure 6. Relationship between pre-dawn water potential (ΨPD) and (a) seasonal precipitation and (b) seasonal heat moisture index in Eucalyptus obliqua at the Wombat State Forest. The ΨPD from three control plots and three impact plots (prior to the throughfall installation) was averaged to plot level for this analysis.
Forests 11 01371 g006
Figure 7. Relationship between pre-dawn water potential (ΨPD) and (a) midday water potential (ΨMD), (b) leaf area (LA), (c) water potential at turgor loss point (ΨTLP), (d) specific leaf area (SLA), (e) solutes potential at full turgor (Ψsolute) and (f) Huber Value (HV) in Eucalyptus obliqua at the Wombat State Forest. The ΨPD from three control plots and three impact plots (prior to the throughfall installation) was averaged to plot level for this analysis.
Forests 11 01371 g007
Publisher’s Note: MDPI stays neutral with regard to jurisdictional claims in published maps and institutional affiliations.

