Article

Metabolome and Transcriptome Association Analysis Reveals Regulation of Flavonoid Biosynthesis by Overexpression of LaMIR166a in Larix kaempferi (Lamb.) Carr

1
State Key Laboratory of Tree Genetics and Breeding, Research Institute of Forestry, Chinese Academy of Forestry, Beijing 100091, China
2
Key Laboratory of Tree Breeding and Cultivation, National Forestry and Grassland Administration, Research Institute of Forestry, Chinese Academy of Forestry, Beijing 100091, China
3
Chongqing Key Laboratory of Economic Plant Biotechnology, College of Landscape Architecture and Life Science/Institute of Special Plants, Chongqing University of Arts and Sciences, Chongqing 402160, China
4
Research Institute of Forest Ecology, Environment and Protection, Chinese Academy of Forestry, Beijing 100091, China
*
Author to whom correspondence should be addressed.
These authors contributed equally to this work.
Forests 2020, 11(12), 1367; https://doi.org/10.3390/f11121367
Submission received: 2 November 2020 / Revised: 14 December 2020 / Accepted: 14 December 2020 / Published: 21 December 2020
(This article belongs to the Section Forest Ecophysiology and Biology)

Abstract

:
Somatic embryogenesis is an ideal model process for studying early plant development. Embryonic cell lines of Larix kaempferi (Lamb.) Carr overexpressing LaMIR166a were obtained in our previous study. Here, a combination of de novo transcriptomics and extensively targeted metabolomics was used to study the transcriptional profiles and metabolic changes in wild-type and LaMIR166a-overexpressed embryonic cell lines. A total of 459 metabolites were found in the wild-type and transgenic cell lines. Compared to those in the wild-type cell lines, transcripts and metabolites were significantly altered in the LaMIR166a-overexpressed cell lines. Among differentially expressed genes (DEGs), phenylalanine and flavonoid synthesis genes were significantly enriched, and among differentially accumulated metabolites (DAMs), phenolic acids and flavonoids accumulated in particularly high amounts. Thus, the flavonoid biosynthetic pathway seems to be the most abundant pathway in response to LaMIR166a overexpression. Based on the Kyoto Encyclopedia of Genes and Genomes database, the association analysis of metabolome and transcriptome data showed that flavonoid biosynthesis and plant hormone signal transduction processes were significantly changed in miR166a-overexpression lines, suggesting that miR166 might be involved in these processes. The present study identified a number of potential metabolites associated with LaMIR166a overexpression, providing a significant foundation for a better understanding of the regulatory mechanisms underlying miR166.

1. Introduction

Larix kaempferi (Lamb.) Carr is a coniferous tree species used for afforestation in the northern parts of China [1]. It a significant source of forest timber and plays an important role in ecological construction. The somatic embryogenesis system (SE) is an ideal model system for studying the growth and development of gymnosperms, including L. kaempferi [2].
Micro RNAs (miRNAs) are a class of small molecular non-coding RNAs with a length of 19–24 nucleotides and are widely found in eukaryotes [3]. Since the discovery of the first miRNA [4], a growing number of miRNAs have been discovered and recognized, and nearly 39,000 miRNAs have been registered in the miRBase database (release 22.1) (http://www.mirbase.org/). Mir165/166 (miR166) is a rich and highly conserved RNA family present in all terrestrial plants [5,6], and it plays a key regulatory role in plant growth and development as well as in plant response to different stresses by specific binding to class III homeodomain leucine zipper proteins (HD-ZIP III) [7,8,9,10]. Previous studies have made significant progress in exploring the role of miR166a, including in shoot apical meristem (SAM) maintenance and the development of roots, stems, leaves, flowers, and seeds, as well as in various developmental processes [11,12,13,14]. Lateral root generation [10] and responses to stresses (such as drought, cold, and heavy metal stress) [15,16] also help mediate plant embryo development and seed germination [17,18]. Previous studies have found that LaMIR166a may indirectly regulate the development of SAM by affecting WOX expression [19]. LaMIR166a plays an important role in auxin biosynthesis and signal transmission during somatic embryo maturation and germination [20,21]. However, the role of miR166 and its regulatory mechanisms in the proembryo stage are not clear.
Previous studies have indicated that miRNAs are involved in plant metabolism; e.g., light-responsive miRNAs appear to play important roles in secondary metabolic pathways in potato (Solanum tuberosum L.) [22]. In Taxus cell lines, miRNAs could up-regulate primary metabolism [23]; this led to a hypothesis that miRNAs act as metabolic pathway regulators. In recent years, metabolomics has become a hot research topic because metabolites are the final products of gene expression, and they can also regulate gene transcription and protein expression [24]. The integration of metabolomics and transcriptomic network analysis can help elucidate the changes in function and content of many secondary metabolites as well as the changes in corresponding genes [25,26].
Previously, we obtained five LaMIR166a-overexpressed embryonic cell lines [19]. In the present study, we randomly selected three lines and conducted transcriptomics and metabolomics research. By comparing the interaction and transcription data, our goal was to identify potential metabolic products and their corresponding genes related to LaMIR166a overexpression and to predict the relationship between genes and metabolites. Besides providing a theoretical basis for the use of L. kaempferi somatic embryo technology in forestry production, the results of our study can also be used as a valuable reference for effective development and utilization of other gymnosperms.

2. Materials and Methods

2.1. Plant Materials

Wild embryogenic cultures were obtained from L. kaempferi immature zygotic embryos on the induction medium, LaMIR166a was cloned into a psuper1300+ binary vector and successfully transformed into embryogenic suspensor masses (ESMs), and five transgenic embryogenic cell lines were obtained, which increased lateral root number and biomass at the germination stage [19,20,21]. Based on our previous studies, we selected three of these soft and fresh cell clusters (named a-3, a-4, and a-5), which were grown for 20 days on the proliferation medium at the same developmental stage; they were cultured in triplicate and taken from different culture masses. The wild-type embryogenic cultures (WT) were cultured in triplicate and used as control. The cultures were immediately frozen in liquid nitrogen and stored at −80 °C until further RNA extraction. Part of the samples was used for transcriptome library construction and sequencing, whereas the other part was used for metabolome analysis.

2.2. Sample Preparation

Sample preparation, metabolome profiling, and statistical analyses were performed at Wuhan MetWare Biotechnology Co., Ltd. (Wuhan, China, www.metware.cn) following standard procedures. Vacuum-freeze-dried cell samples of WT and a-3, a-4, and a-5 were crushed to powder using a grinder (MM 400, Retsch, Haan, Germany). A total of 100 mg of crushed powder was weighed, and aliquots were extracted at 4 °C with 0.6 mL of 70% aqueous methanol. Then, the samples were vortexed six times during the extraction process to increase the extraction rate. The obtained aliquots were centrifuged at 10,000× g for 10 min to obtain the supernatant (CNWBOND Carbon-GCB SPE Cartridge, 250 mg, 3 mL; ANPEL, Shanghai, China, www.anpel.com.cn/cnw), and the supernatants were filtered through a microporous membrane (SCAA-104, 0.22 μm pore size; ANPEL, Shanghai, China, http://www.anpel.com.cn/) and subsequently stored for UPLC–MS/MS analysis.
In addition, all the tissues were ground in liquid nitrogen and the total RNA was prepared by isolation with the RNAiso Plus and RNAiso-mate for Plant Tissue kits (Takara, Japan) following the manufacturer’s instructions, total RNA was treated with DNase (Takara, Japan) to remove DNA. The same amount of RNA from each sample (WT, a-3, a-4, and a-5) was used for sequencing analysis.

2.3. Chromatographic Mass Spectrometry Conditions

The sample extracts were analyzed using a UPLC–ESI–MS/MS system (UPLC, Shim-pack UFLC SHIMADZU CBM30A system, www.shimadzu.com.cn/; MS, Applied Biosystems 4500 Q TRAP, www.appliedbiosystems.com.cn/). The liquid phase conditions were as follows: UPLC column, Agilent SB-C18 (1.8 µm, 2.1 mm × 100 mm); mobile phase: solvent A, pure water with 0.1% formic acid and solvent B, acetonitrile. Sample measurements were performed with a gradient program using starting conditions of 95% A and 5% B. Within 9 min, a linear gradient to 5% A and 95% B was programmed, and these conditions were retained for 1 min. Subsequently, the conditions of 95% A and 5% B were adjusted within 1 min and retained for 2 min. The column oven temperature was set to 40 °C, and the injection volume was 4 μL. The effluent was alternatively connected to an ESI-triple quadrupole-linear ion trap (QTRAP)-M.
Linear ion trap (LIT) and triple quadrupole (QQQ) scans were acquired with a triple quadrupole-linear ion trap mass spectrometer (Q TRAP, AB Sciex, Waltham, MA, USA ) API 4500 Q TRAP UPLC/MS/MS system equipped with an ESI Turbo Ion-Spray interface, operating in positive and negative ion mode and controlled by the Analyst 1.6.3 software (AB Sciex). The ESI source operation parameters were as follows: ion source, turbo spray; source temperature, 550 °C; ion spray voltage (IS), 5500 V (positive ion mode)/−4500 V (negative ion mode); ion source gas I (GSI), gas II(GSII), and curtain gas (CUR) were set at 50, 60, and 30.0 psi, respectively; the collision gas (CAD) level was set at high. Instrument tuning and mass calibration were performed with 10 and 100 μmol/L polypropylene glycol solutions in QQQ and LIT modes, respectively. QQQ scans were acquired from multiple reaction monitoring (MRM) experiments with collision gas (nitrogen) set to 5 psi. Declustering potential (DP) and collision energy (CE) for individual MRM transitions were performed with further DP and CE optimization, respectively. A specific set of MRM transitions was monitored for each period according to the metabolites eluted within the period.

2.4. Metabolomic and Transcriptome Data Analysis

Unsupervised principal component analysis (PCA) was performed using the statistics function prcomp in R (www.r-project.org). The data were scaled to unit variance before the unsupervised PCA.
The results of the hierarchical cluster analysis (HCA) of the samples and metabolites were presented as heatmaps with dendrograms, whereas Pearson correlation coefficients (PCC) between samples were calculated using the cor function in R and presented only as heatmaps. Both HCA and PCC were carried out using the R package pheatmap. For HCA, normalized signal intensities of metabolites (unit variance scaling) were visualized as a color spectrum. Significantly regulated metabolites between groups were determined by VIP ≥ 1 and absolute Log2C (fold change) ≥ 1. VIP values were extracted from orthogonal partial least squares discriminant analysis (OPLS–DA) results. The data were log-transformed (log2) and mean-centered before OPLS–DA. In order to avoid overfitting, a permutation test (200 permutations) was performed.
The identified metabolites were annotated using the Kyoto Encyclopedia of Genes and Genomes (KEGG) Compound database (http://www.kegg.jp/kegg/compound/), after which they were mapped to the KEGG Pathway database (http://www.kegg.jp/kegg/pathway.htmL). The pathways with significantly regulated metabolites mapped were then fed into the metabolite set enrichment analysis (MSEA), and their significance was determined by hypergeometric test p-values.
EdgeR software was used to analyze the p-value and false discovery rate (FDR) values of differential expression of unigenes in each sample based on the alignment results. FDR values were combined with FoldChange (FC) to screen for differential unigenes, whose FC was ≥1 and whose FDR was <0.05 in a comparison as the significantly differentially expressed screening condition.

2.5. Library preparation, RNA sequencing and De Novo Assembly

The RNA library were constructed and sequenced on an Illumina NovaSeq6000 at the Berry. Genomics (Beijing, China). Filtering the raw reads which affected alignment and subsequent analysis quality to obtain clean reads. A small number of spliced, repetitive, and low-quality reads (the mass value Q≤3 and the base number accounts for more than 50% of the whole read) were removed to gain more reliable results. De novo assembly of L. kaempferi transcriptome was using the Trinity-v2.4.0 software.

2.6. Combined Analysis of Transcriptome and Metabolome

Differentially expressed genes (DEGs) and differentially accumulated metabolites (DAMs) were mapped onto the KEGG pathway at the same time. The enrichment results were used to show the degree of enrichment pathways with a false discovery rate (FDR) < 0.05. The transcript-metabolite network was constructed with a Pearson’s correlation coefficient > 0.8.

3. Results

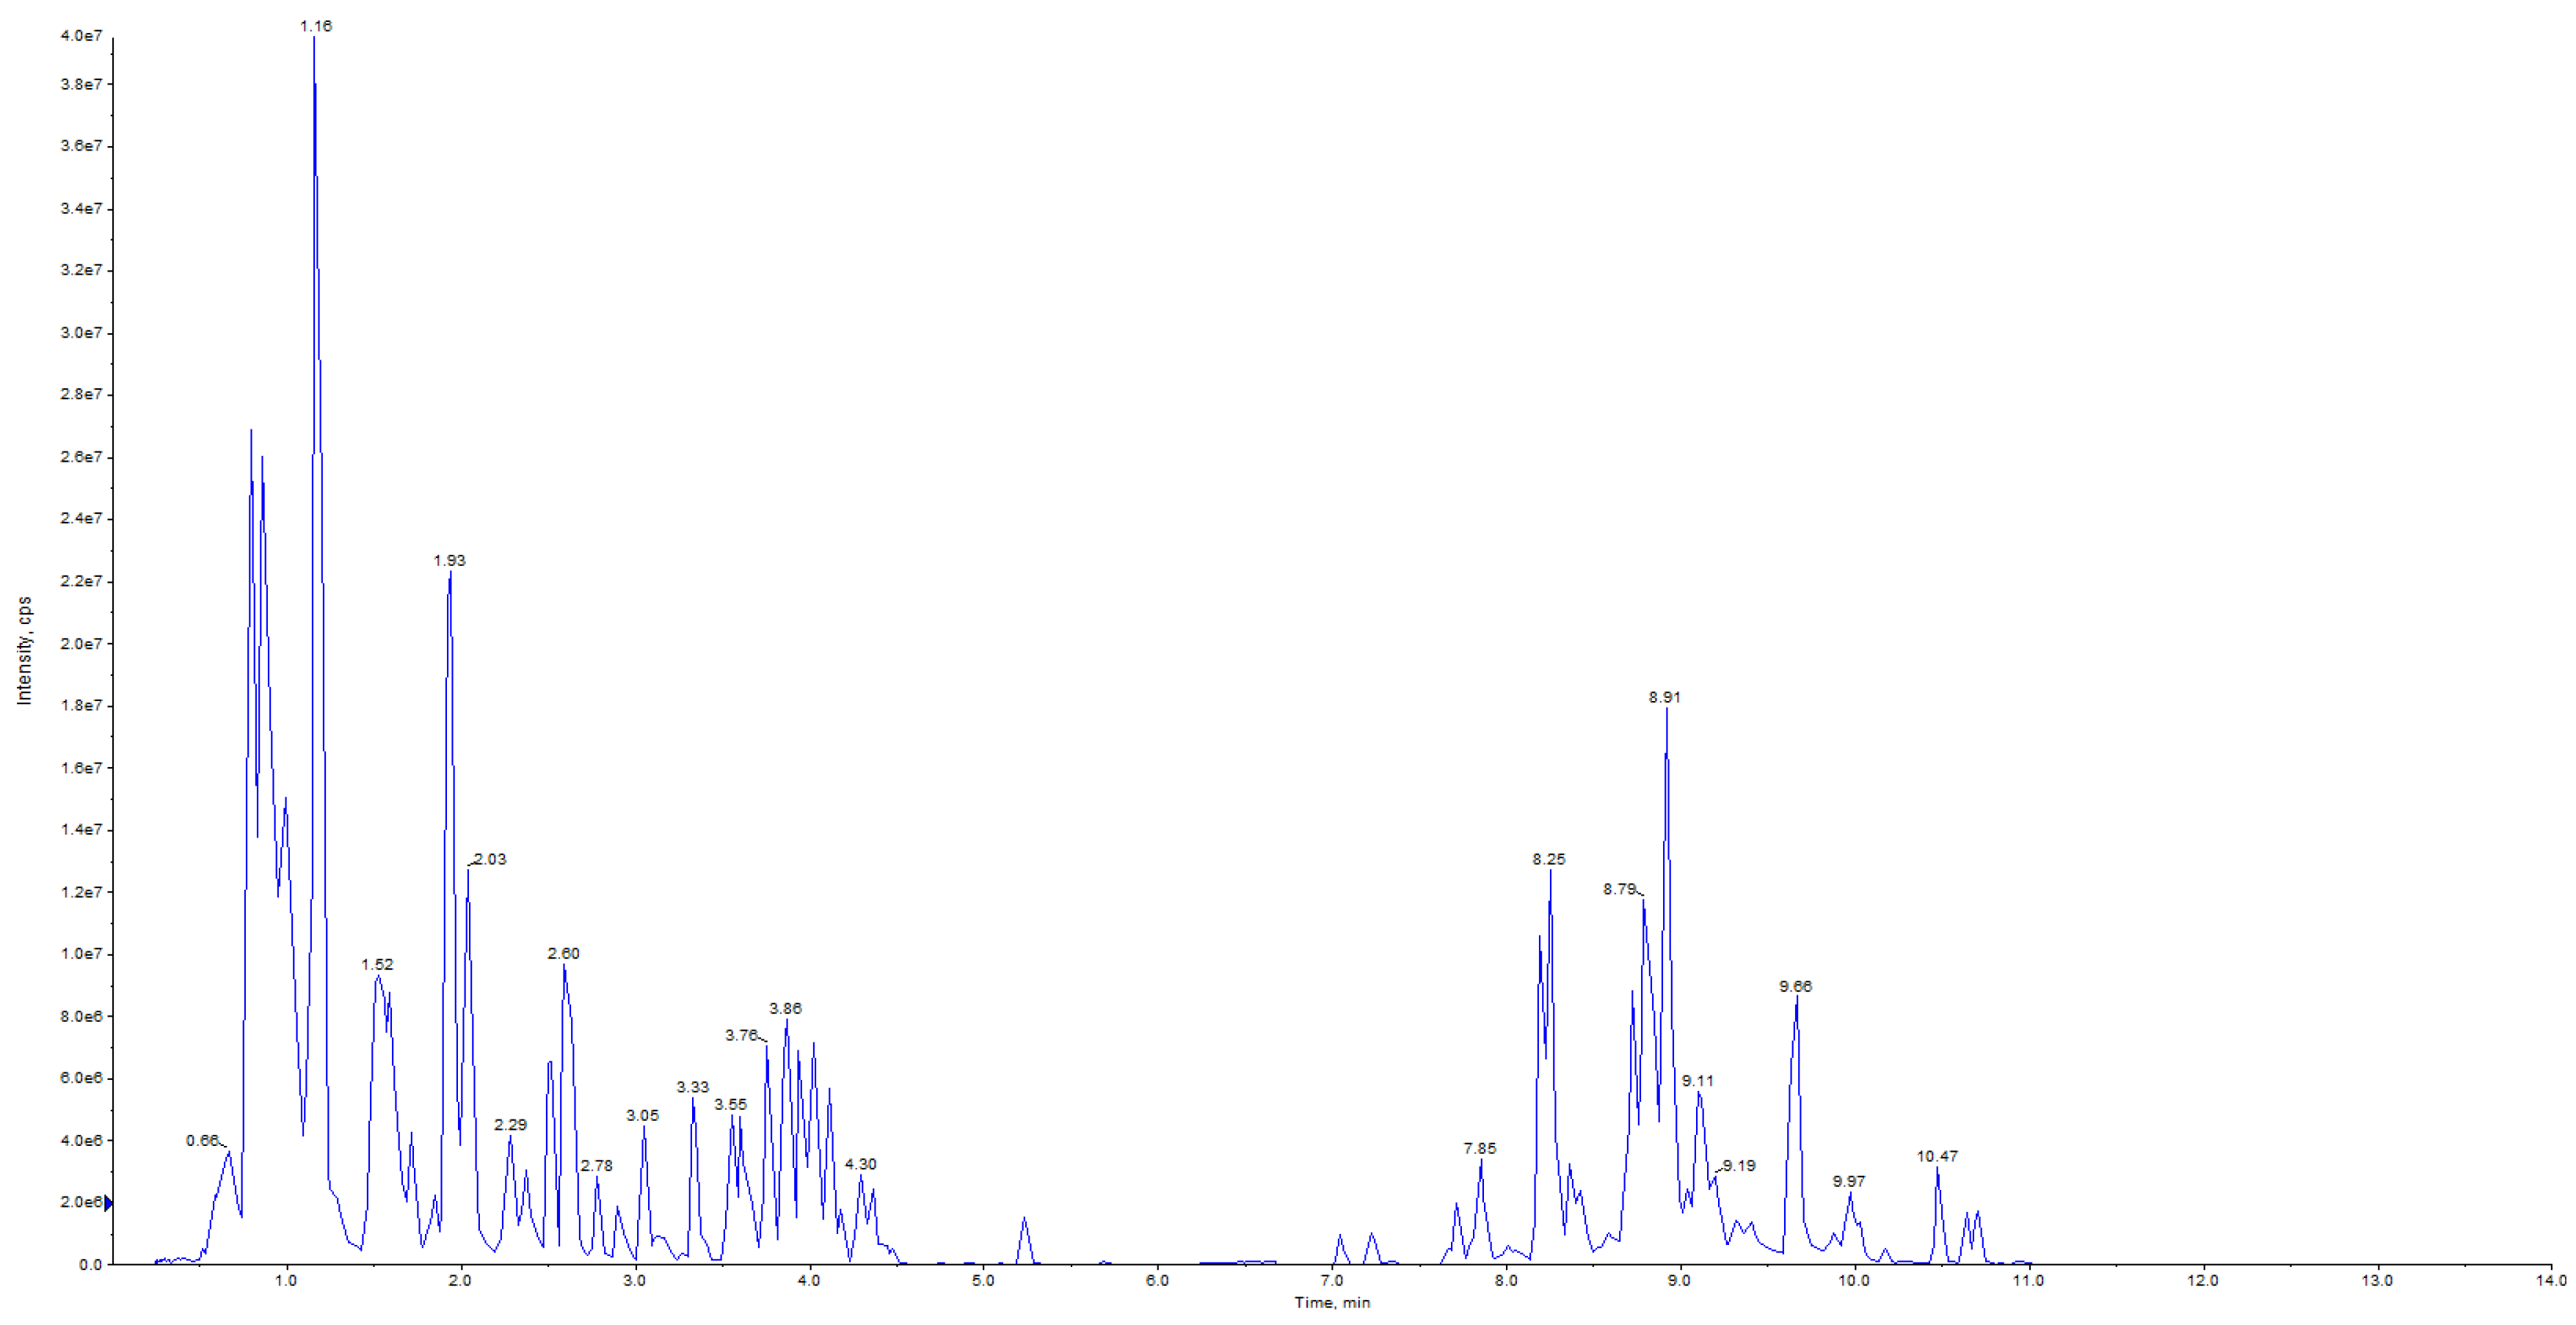
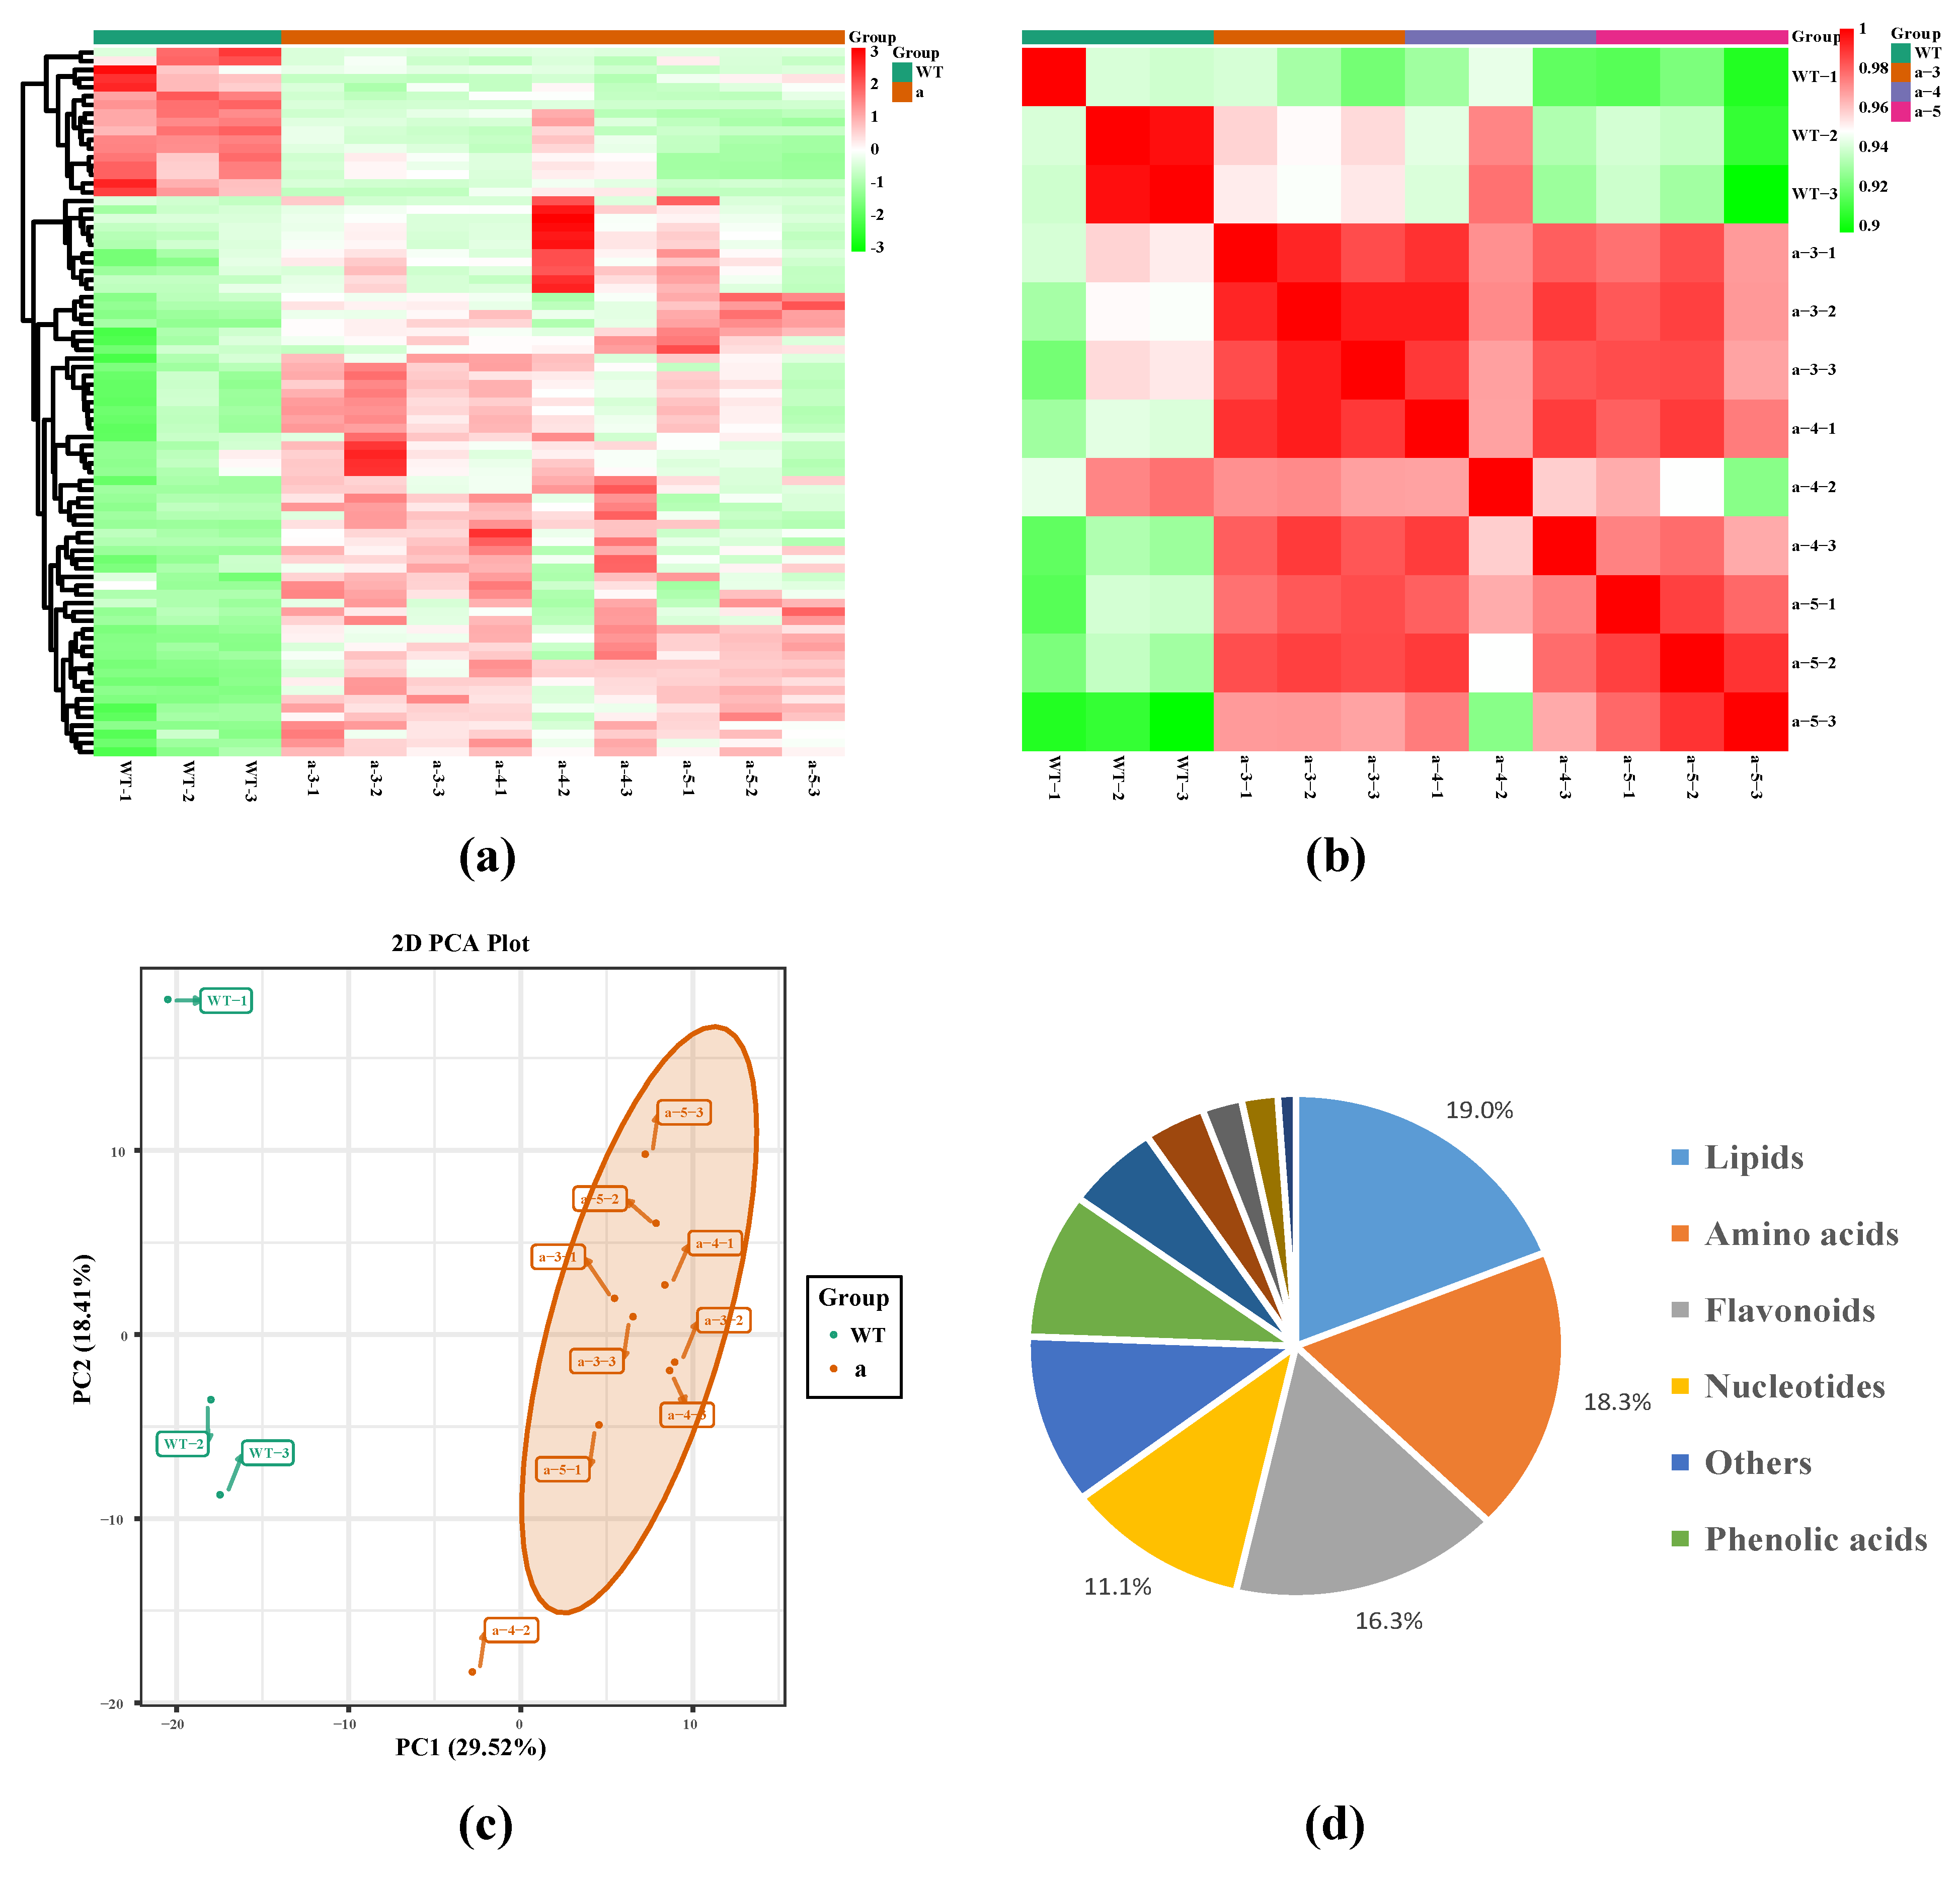
3.1. Qualitative and Quantitative Metabolomic Analysis Based on UPLC–MS/MS and Identification of Metabolites

The results showed that in the process of metabolite detection, the total ion current (TIC) curves of quality control (QC) in different samples overlapped, and the retention time and peak intensity were consistent, indicating that the same sample signal was detected to be stable at different times (Figure 1).
Cluster analysis can reflect the differential patterns of accumulated metabolites. Cluster analysis results showed that the same groups had similar metabolite accumulation patterns, and different groups had different metabolite accumulation patterns (Figure 2a). Pearson’s correlation coefficient reflects the repeatability between samples within a group (Figure 2b). PCA showed that WT and transgenic samples were separately aggregated, each forming a cluster except a-4-2, indicating that there were significant differences between WT and transgenic lines (Figure 2c).
A total of 459 metabolites with known structures were identified in WT and a-3, a-4, and a-5. Lipids (19.0%), amino acids (18.3%), flavonoids (16.3%), and nucleotides (11.1%) accounted for a large proportion of the identified metabolites (Figure 2d). Detailed information about the identified metabolites, including compounds, categories, molecular weights (Da), ionization models, and the number of each metabolite are shown in Supplementary Materials Table S1.

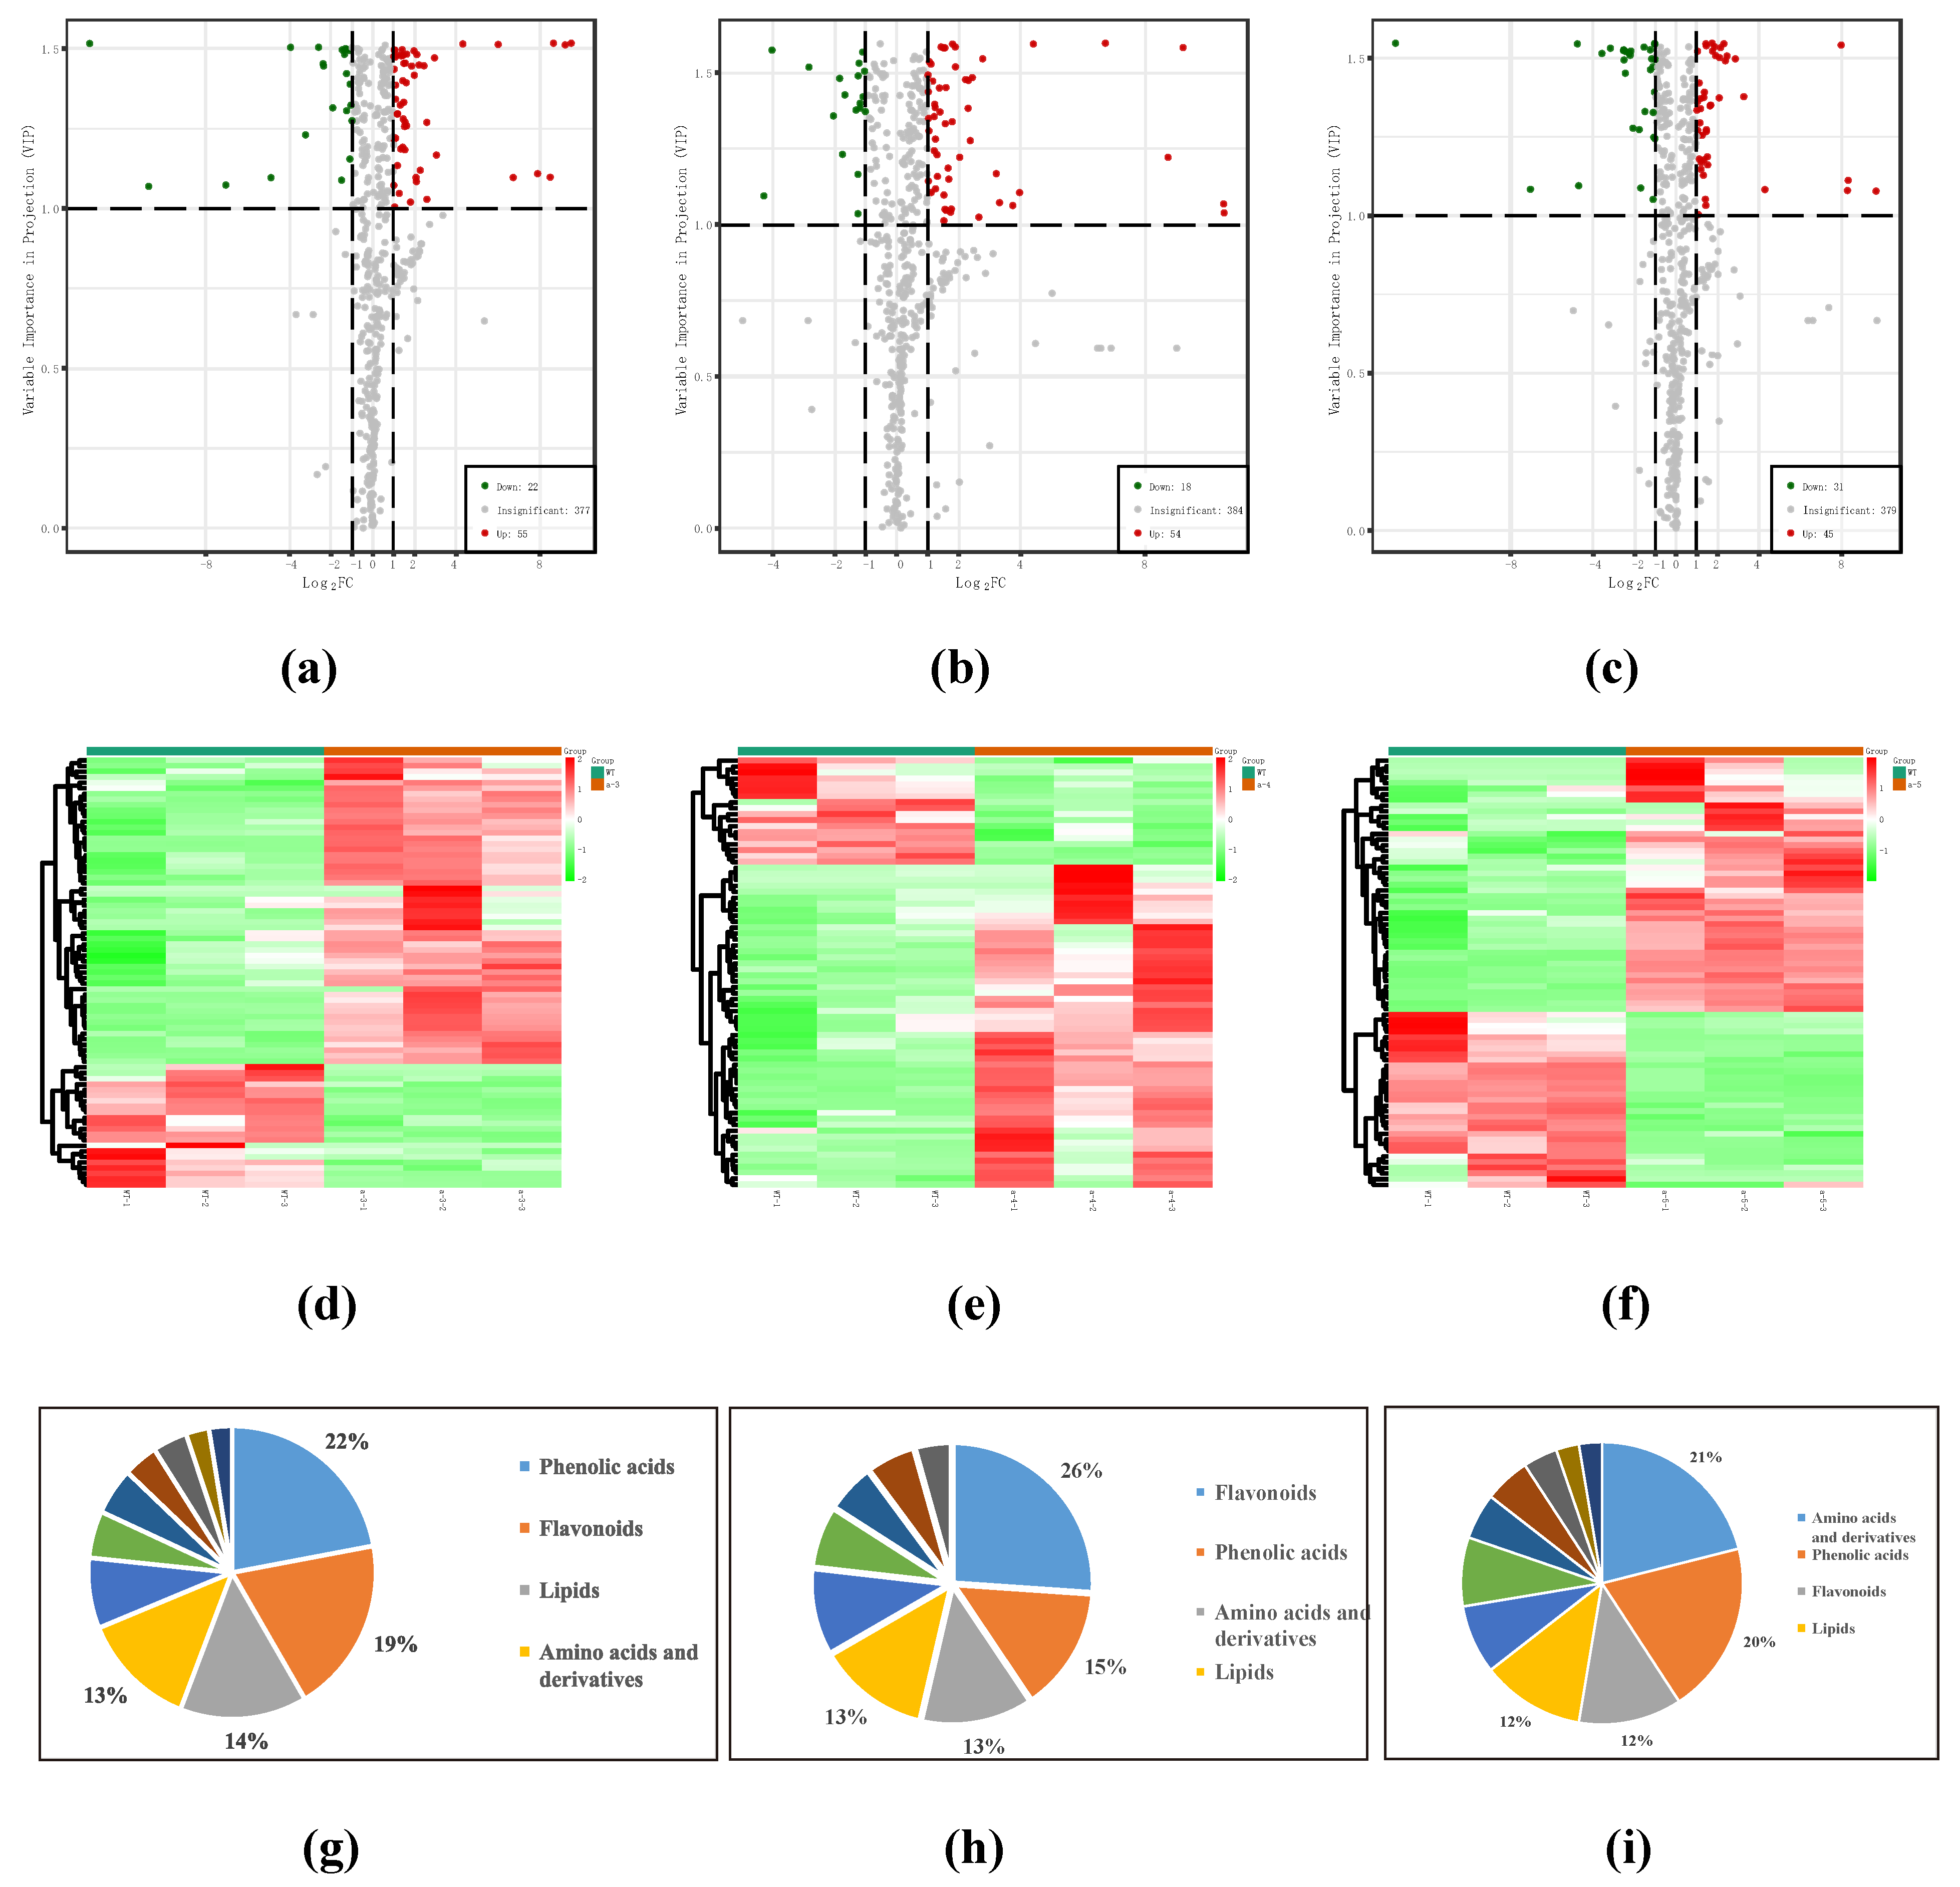
3.2. Identification of DAMs

DAMs were defined as those showing a fold change of ≥ 2 or a fold change of ≤ 0.5 and a variable importance in project (VIP) ≥ 1 between WT and a-3, a-4, and a-5 (p < 0.05). A total of 77, 72, and 76 DAMs were identified between WT and a-3, a-4, and a-5, respectively. For WT and a-3, 55 of the 77 DAMs (71.4%) were up-regulated and 22 (28.6%) were down-regulated. Among the 72 DAMs identified between WT and a-4, 54 (75%) and 53 (25%) metabolites were up-regulated and down-regulated, respectively. Among the 76 DAMs identified between WT and a-5, 45 (59.2%) and 31 (40.8%) were up-regulated and down-regulated, respectively (Table 1 and Table S2). The volcano map shows significant differences between WT and a-3, a-4, and a-5 (Figure 3a–c). The results of the hierarchical cluster analysis show the DAM accumulation models (Figure 3d–f).
The number of DAM categories in each group is listed in Table 2. An overview of the three groups showed that compared with WT, the transformant lines had the largest differences in phenolic acids, flavonoids, lipids, and amino acids (Figure 3g–i) following LaMIR166a overexpression. DAMs involved in flavonoid biosynthesis are shown in Table 3. We also used Venn analysis to study the differences in metabolites accumulated by WT and those accumulated by a-3, a-4, and a-5 (Figure 4). In addition, there were a total of 43 common metabolites in the three transformant groups (Table 4).

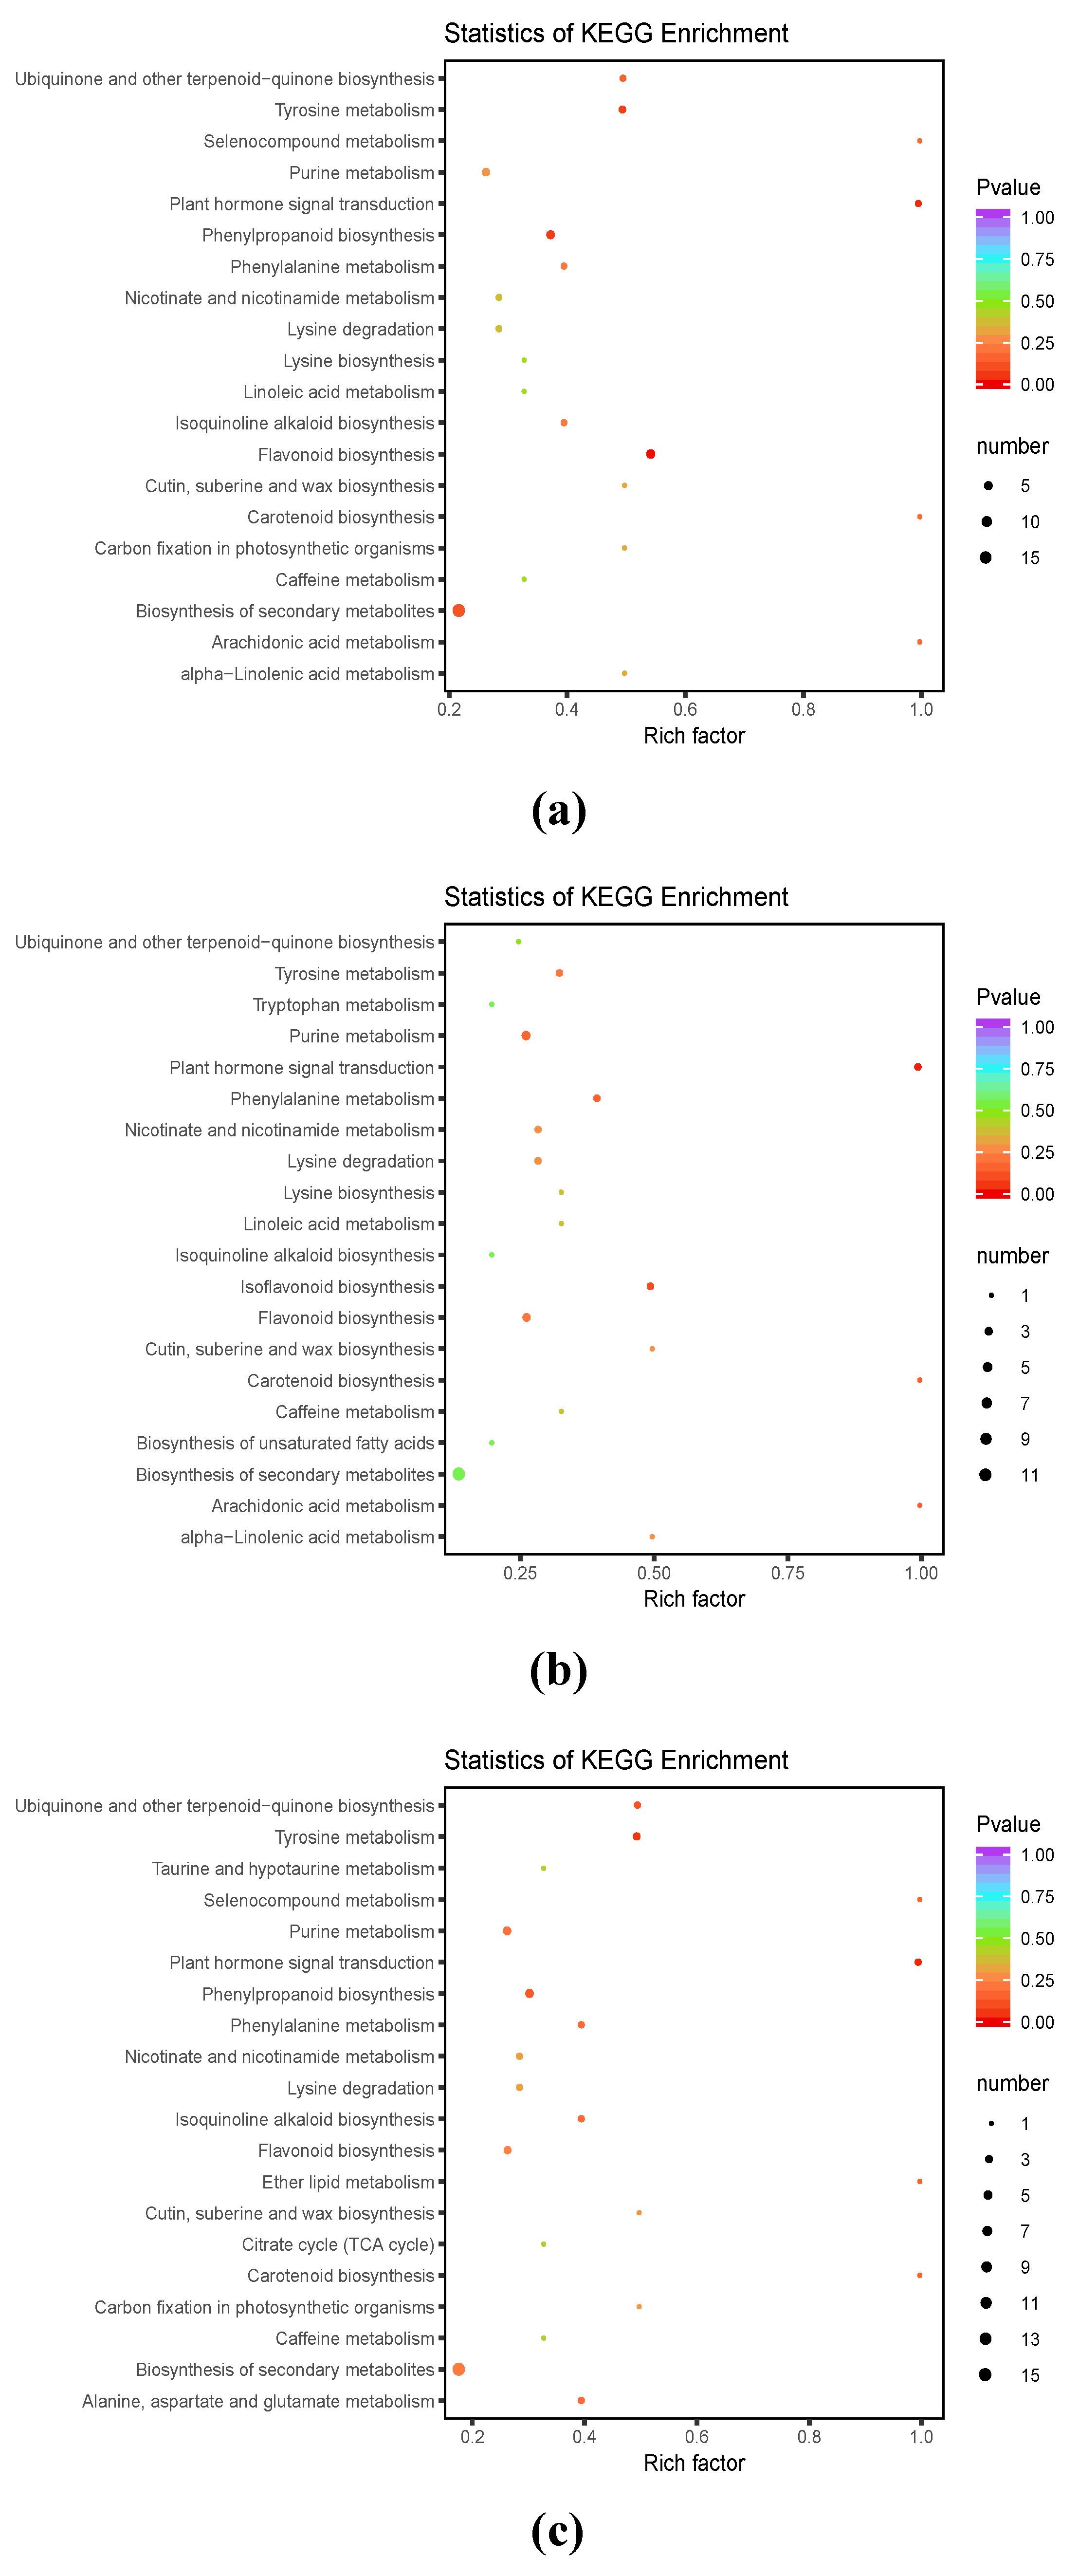
3.3. DAM Functional Annotation and KEGG Enrichment Analysis

Metabolites were functionally annotated using the KEGG database, and the DAMs in WT and a-3, a-4, and a-5 are shown in Table S3. In order to further study the metabolites that may have changed as a consequence of LaMIR166a overexpression, we analyzed the differences in biological processes between the control and transformant lines. In general, KEGG enrichment analysis showed that “flavonoid synthesis”, “auxin signal transduction”, and “phenylpropane biosynthesis” were significantly enriched in WT and transformant lines (Figure 5a–c). DAMs involved in flavonoid biosynthesis, plant hormone signal transduction, and phenylpropanoid biosynthesis are shown in Table 5.

3.4. Association Analysis of Metabolome and Transcriptome Data Sets

In order to provide an overview of the changes that occur after the overexpression of LaMIR166a in embryonic masses, we performed RNA-seq-based transcription analysis. The raw data have been submitted to Sequence Read Archive (SRA) (http://www.ncbi.nlm.nih.gov/) under the accession number PRJNA680899. The RNA-seq yielded a total of 82.5 Gb clean data, and 203,256 non-redundant unigenes were obtained after assembly. 39276 unigenes have length of more than 1 kb (Table S4). Significant DEGs were detected between WT and a-3, a-4, and a-5. By comprehensive analysis of metabolomic and transcriptomic data, DEGs and the corresponding potential metabolites could be found.

3.4.1. KEGG Enrichment Analysis of DAMs and DEGs in L. kaempferi Embryonic Masses

In order to study the relationship between genes and metabolites after the overexpression of LaMIR166a, the DAMs and DEGs of WT, a-3, a-4, and a-5 were analyzed. According to KEGG database mapping, there were 29, 26, and 32 co-mapped pathways in WT vs. a-3, WT vs. a-4, and WT vs. a-5, respectively. The number of common pathways in the three groups was 16. Interestingly, among these commonly mapped pathways, “phenylpropane biosynthesis” (ko00940), “flavonoid biosynthesis” (ko00941), “Cutin, suberine and wax biosynthesis”, and “Plant hormone signal transduction” (ko04075) showed significant levels of accumulation. The above results can be found in Table S5.

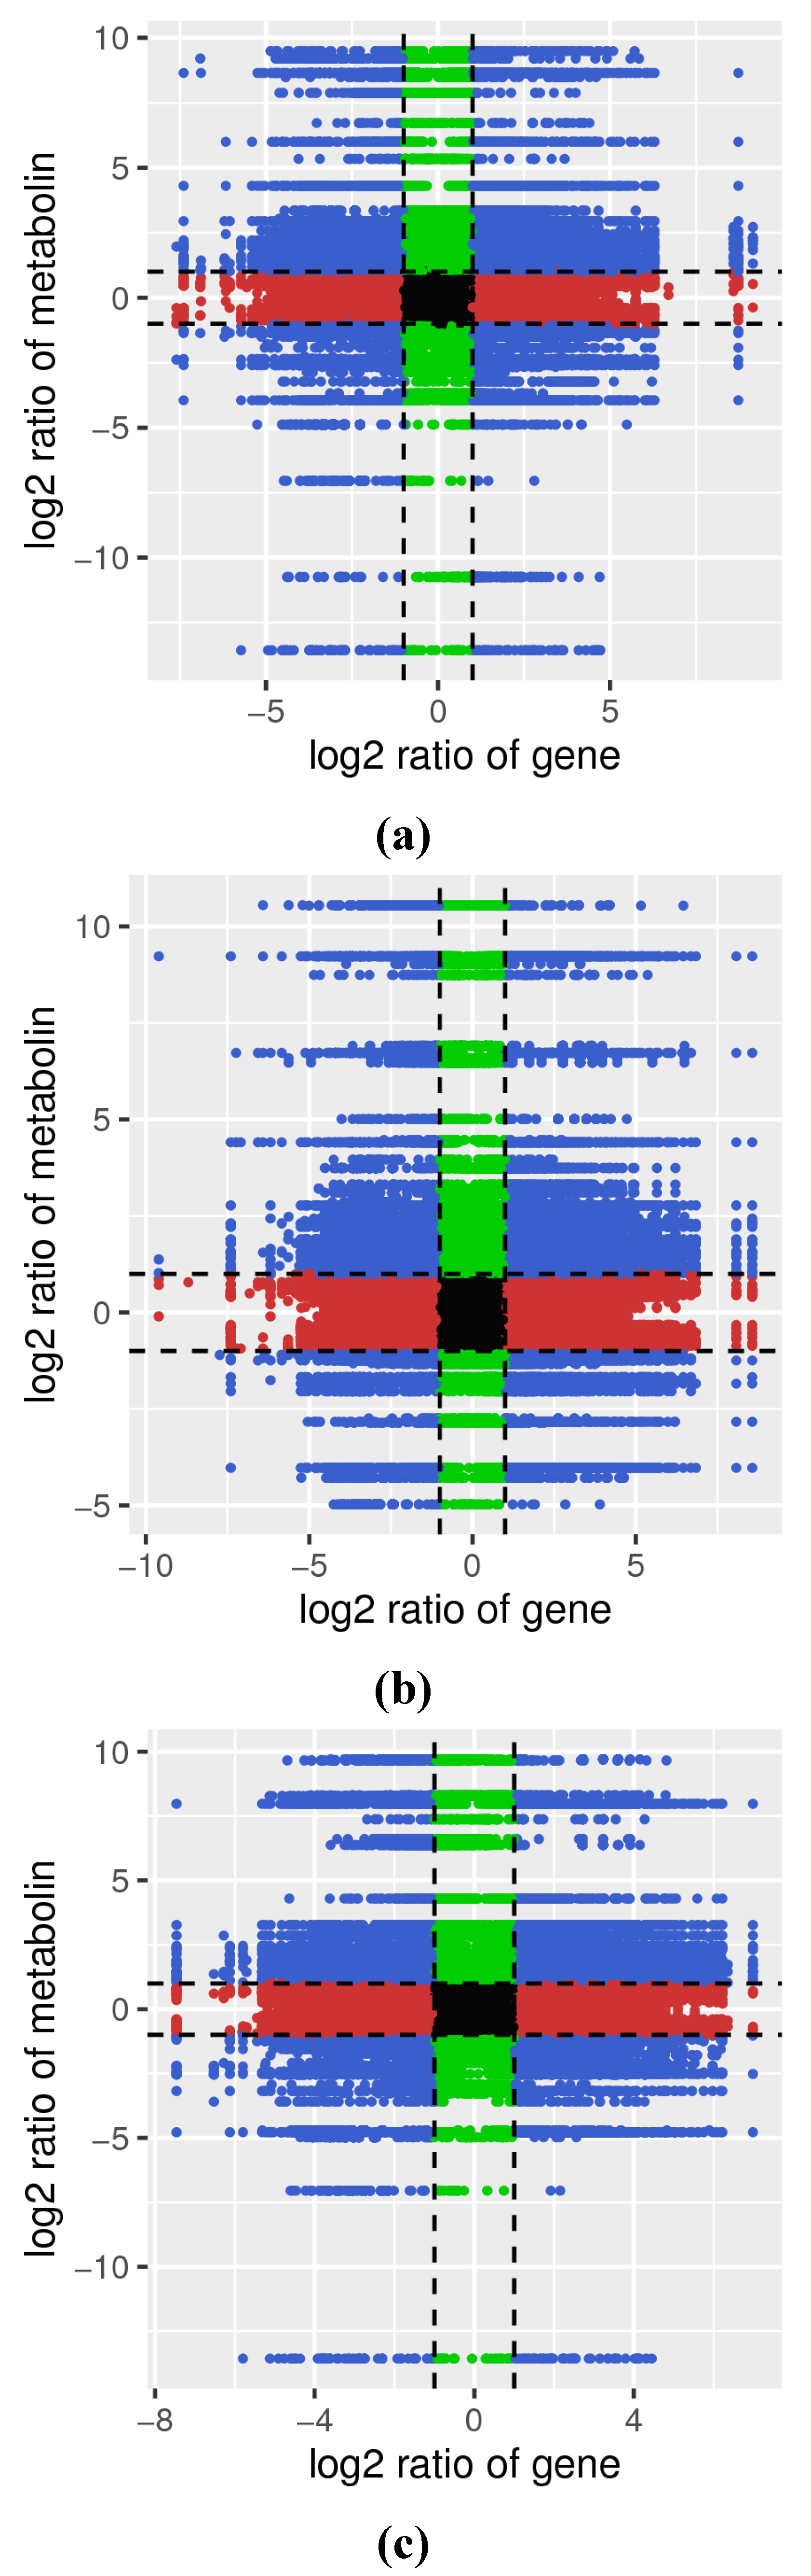
3.4.2. Correlation Analysis of DAMs and DEGs

In order to obtain a systematic overview of metabolites and their corresponding gene PCC > 0.8 variants, nine quadrant diagrams were generated (Figure 6a–c).
The black dashed line divides each graph into nine quadrants: the first quadrant shows up-regulated metabolites and down-regulated genes; the second quadrant shows up-regulated metabolites and unchanged genes; the third quadrant shows up-regulated metabolites and genes; the fourth quadrant shows unchanged metabolites and down-regulated genes; the fifth quadrant shows unchanged metabolites and genes; the sixth quadrant shows unchanged metabolites and up-regulated genes; the seventh quadrant shows down-regulated metabolites and genes; the eighth quadrant shows down-regulated metabolites and unchanged genes; and the ninth quadrant shows down-regulated metabolites and up-regulated genes. In addition, the DAMs and DEGs shown in the third and seventh quadrant were positively correlated and had similar consistent patterns. It is worth noting that the genes and metabolites related to the flavonoid synthesis pathway and phenylpropane synthesis pathway were all in the third quadrant, and they were all up-regulated, indicating that the up-regulated genes were involved in flavonoid biosynthesis. The up-regulated genes included chalcone synthase (CHS) TRINITY_DN101081_c0_g2, TRINITY_DN101081_c0_g5, TRINITY_DN94950_c1_g3, flavonol synthase (FLS) TRINITY_DN114346_c3_g1, TRINITY_DN112973_c0_g1, dihydroflavonol-4-reductase (DFR) TRINITY_DN106194_c1_g2, and cytochrome P450 (CYP75A) TRINITY_DN104908_c1_g1, TRINITY_DN94249_c6_g1. The metabolites correlative with genes were mainly dihydroquercetin, catechin, and procyanidins. The DEGs and corresponding DAMs involved in the “flavonoid biosynthesis process” and “phenylpropane biosynthesis” are listed in Table S6.

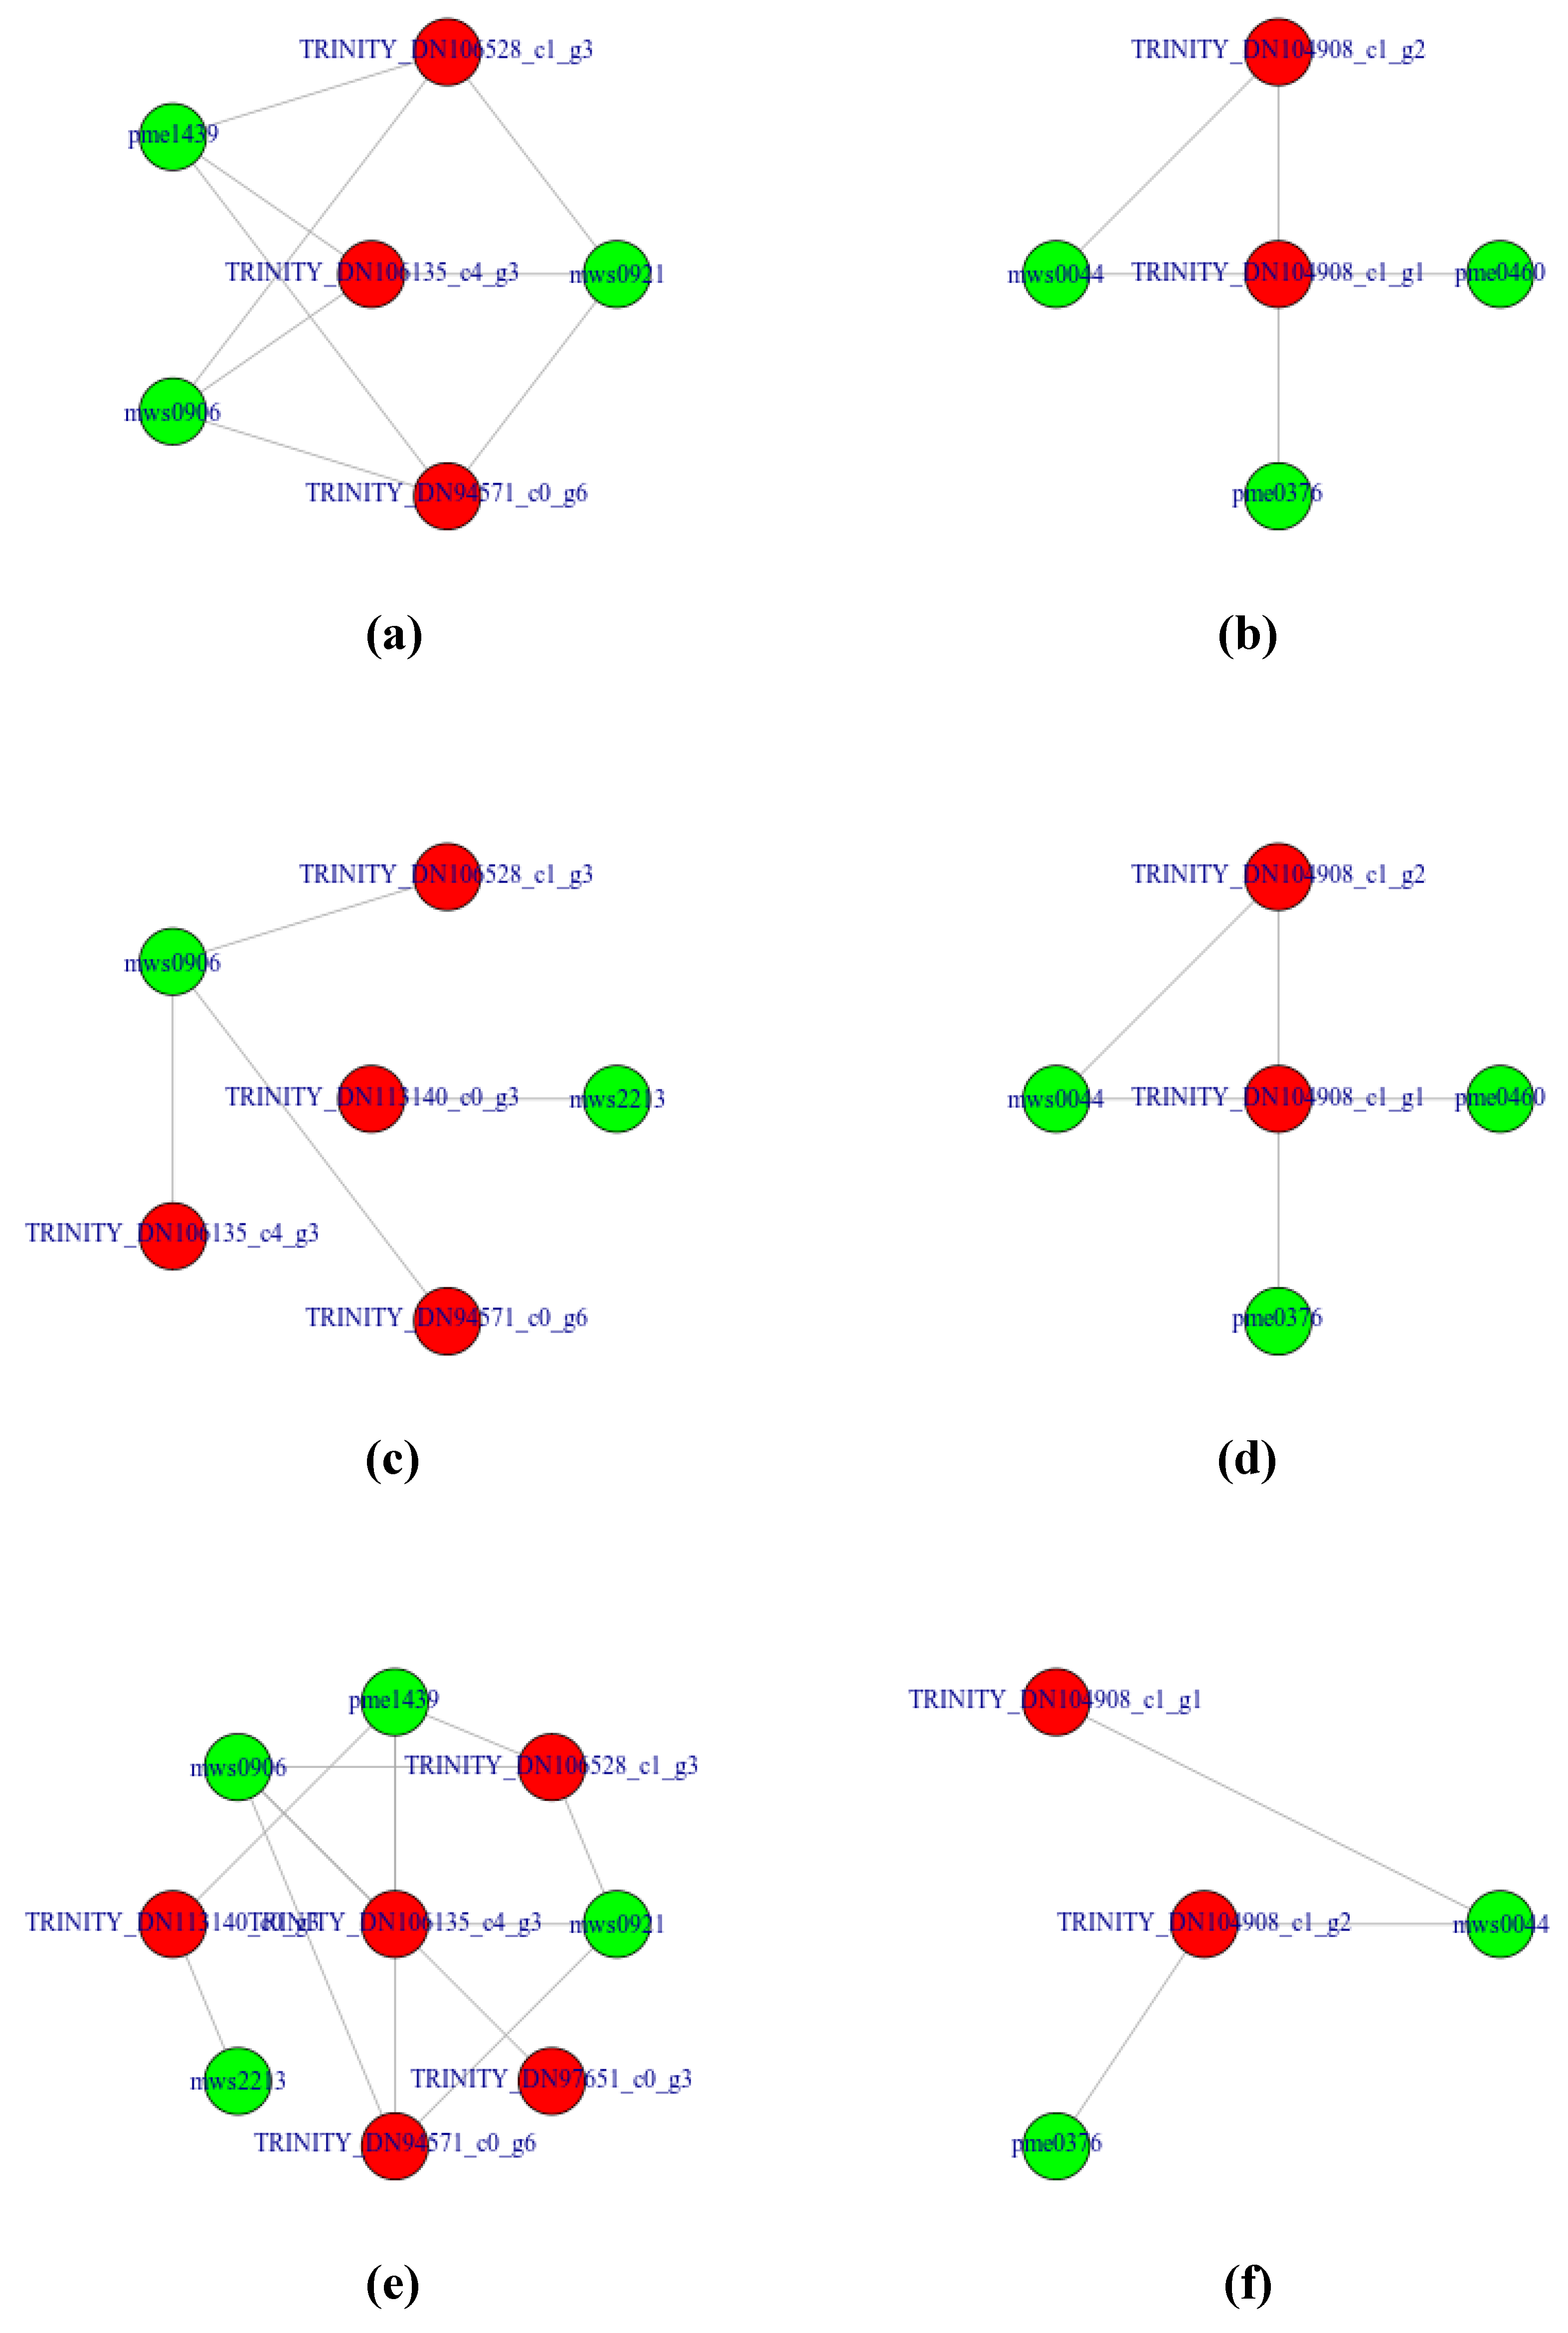
3.4.3. Representing the Transcript-Metabolite Correlation Network of DAMs and DEGs

In order to simulate the synthesis and regulation characteristics of DAMs and DEGs, a subnet was constructed to determine the transcript-metabolite correlation. Only related pairs with a correlation coefficient > 0.8 were included in the analysis. KEGG pathways related to flavonoid biosynthesis (ko00940 and ko00941) were highlighted. Related tests included several classic key genes, which are specifically activated by the overexpression of LaMIR166a (Figure 7, Table S6).

4. Discussion

Combining metabolomics and transcriptomics to analyze the regulatory mechanisms of overexpressed miRNA in plants can further deepen our understanding of the function of miRNA. In the present study, we analyzed the metabolomics and transcriptomics of LaMIR166a-overexpressed proembryo mass in L. kaempferi. The ESMs stage is the necessary material signal for embryo formation, and it is the key to transformation into embryos. This was the first time that multi-omics were combined to analyze the ESMs in order to better understand the regulatory role of LaMIR166a in L. kaempferi.
Studies have shown that L. kaempferi contains up to 30% of the non-structural hemicellulose polysaccharide ArGal, which has high medical value [27] because of its immune-enhancing properties of stimulating the cytotoxicity of natural killer (NK) cells, enhancing other functions of the immune system and inhibiting the metastasis of tumor cells to the liver [28]. Compared to spruce, L. kaempferi contains a much higher level of hydrophilic phenols; as hydrophilic flavonoids appear to be the key components in wood protection, large amounts of flavonoids play a key role in L. kaempferi’s defense mechanism [29]. Studies have demonstrated that conifer shoots contain high levels of healthy compounds such as phenolics [30]. Using metabolomic studies, researchers can significantly increase the value of existing data, and multigroup analysis has become a powerful tool in recent years [24,31,32]. Combined analysis of transcriptome and proteome provided the basis for the molecular regulation of ovule development in gymnosperms [33], whereas metabolomics combined with potential target prediction, degradome validation, and transcriptome sequencing can expand our knowledge of metabolite profiling and potential functional roles in gymnosperm pollination drops [34]. Transcriptome and metabonomic analysis revealed the metabolic variation in sex differences in Ginkgo biloba L. [35]. Therefore, identification and analysis of L. kaempferi metabolites have become an important topic.
The investigated cell lines a-3, a-4, and a-5 are produced by the same gene transformation, and the background of the transformed cell lines was consistent. In previous studies, the relative expression level of LaMIR166a in the transgenic cell line a-4 was more than five times higher than in WT, which was the highest among the five transgenic cell lines [19]. In the present study, we analyzed the differences and metabolite changes between WT and a-3, a-4, and a-5. The results of this study showed that the accumulation of flavonoids in the three transgenic lines was significantly higher than that in WT; moreover, a-4 had a higher flavonoid accumulation than that of a-3 and a-5, suggesting that LaMIR166a had a great influence on the flavonoid biosynthesis pathway. In addition, 43 differential metabolites were the same among a-3, a-4, and a-5; phenolic acids, amino acids, and flavonoids were the most abundant metabolites in all three cell lines. In particular, flavonoids, lipids, alkaloids, organic acids, and tannins were all up-regulated, whereas the other metabolites were either up-regulated or down-regulated. Accordingly, a-3, a-4, and a-5 had 11, 14, and 21 unique accumulated metabolites, respectively. This indicated that the function of LaMIR166a is very complex. LaMIR166a overexpression had different intensity effects as a consequence of different expression levels and gene insertion locations, which might be the main reason for the differences between the three transgenic lines.
Studies have shown that the leaf extracts of flavonoids in Myrcia guianensis (Aubl.) DC. altered the expression of miR166 [36]. Gregory S. found that flavonols played a positive role in the formation of lateral roots in tomato [37]. Substantial results support the role of flavonoids in the modulation of auxin transport in plants [38,39]. Based on previous studies, we found that LaMIR166a was involved in auxin synthesis and signaling regulation during the germination of somatic embryos [21], and we hypothesized that this may also be associated with flavonoid biosynthesis. In the present study, KEGG enrichment analysis showed that “phenylpropane biosynthesis” (KO00940), “flavonoid biosynthesis” (Ko00941), and “flavonoid and flavonoid biosynthesis” (Ko00944) were significantly enriched in the LaMIR166a-overexpressed cell lines, and flavonoid compounds were synthesized via the phenylpropane metabolism pathway. A number of products can be produced in this metabolic pathway, including flavonols, flavano-3-alcohols, proanthocyanidins (tannic acids), and many other polyphenols. In the present study, DAMs identified in WT and three transgenic cell lines had a high amount of flavonoids, the accumulation of polyphenols, anthocyanins, flavanones, flavanones, and isoflavones determined by the metabonomics map of LaMIR166a-overexpressed cell lines was consistent with the transcriptome data. These compounds are regulated by genes such as CHS, FLS, and DFR, which have been found in correlation analysis of transcriptome and metabolome (Table S6). In particular, the correlation network of DAMs and DEGs found that those genes might participate in the biosynthesis of metabolites. These results give us a hint that we should pay more attention to flavonoid biosynthesis during somatic embryo maturation and germination in our future work. Therefore, the accumulation of flavonoid biosynthesis-related genes and metabolites in the overexpressed cell lines indicated that miR166 might be involved in flavonoid biosynthesis in L. kaempferi.

5. Conclusions

In conclusion, our results demonstrated that the function of miR166 is far more complex than indicated by previous studies, and the combination of multi-omics can help us obtain more information about its function in plants, although it will make the results difficult to understand.

Supplementary Materials

The following are available online at https://www.mdpi.com/1999-4907/11/12/1367/s1, Table S1: title Total identified metabolites in WT, a-3, a-4 and a-5; Table S2: title Differentially accumulated metabolites (DAMs) in WT, a-3, a-4 and a-5 respectively; Table S3: title KEGG enrichment analysis of differentially accumulated metabolites in WT vs a-3, WT vs a-4, WT vs a-5; Table S4: title Distribution of the unigenes length; Table S5: title Metabolome and transcriptome association analysis of co-mapped KEGG pathways enriched in WT vs a-3, WT vs a-4 and WT vs a-5; Table S6: title Metabolome and transcriptome association analysis of flavonoid biosynthesis and phenylpropane biosynthesis enriched in WT vs a-3, WT vs a-4 and WT vs a-5.

Author Contributions

Y.F. designed the experiments and drafted the manuscript; Y.F. and Z.L. carried out the experiments, data analysis, and revised the manuscript; L.Z. helped to perform the experiment; S.H. and L.Q. provided suggestions on the experimental design and analyses. All authors have read and agreed to the published version of the manuscript.

Funding

This research was funded by the National Transgenic Major Program of China (2018ZX08020-003), the National Natural Science Foundation of China (31600544 and 31330017), the Fundamental Research Funds for the Central Non-profit Research Institution of CAF (CAFYBB2019SY011).

Conflicts of Interest

The authors declare no conflict of interest.

References

  1. Zhang, P. ECOLOGY: China’s Forest Policy for the 21st Century. Science 2000, 288, 2135–2136. [Google Scholar] [CrossRef] [PubMed] [Green Version]
  2. Zhang, J.; Zhang, S.; Han, S.; Wu, T.; Li, X.; Li, W.; Qi, L. Genome-wide identification of microRNAs in larch and stage-specific modulation of 11 conserved microRNAs and their targets during somatic embryogenesis. Planta 2012, 236, 647–657. [Google Scholar] [CrossRef] [PubMed]
  3. Voinnet, O. Origin, Biogenesis, and Activity of Plant MicroRNAs. Cell 2009, 136, 669–687. [Google Scholar] [CrossRef] [PubMed] [Green Version]
  4. Yang, T.; Xue, L.; An, L. Functional diversity of miRNA in plants. Plant Sci. 2007, 172, 423–432. [Google Scholar] [CrossRef]
  5. Kidner, C.A.; Martienssen, R.A. Spatially restricted microRNA directs leaf polarity through ARGONAUTE1. Nature 2004, 428, 81–84. [Google Scholar] [CrossRef]
  6. Barik, S.; SarkarDas, S.; Singh, A.; Gautam, V.; Kumar, P.; Majee, M.; Sarkar, A.K. Phylogenetic analysis reveals conservation and diversification of micro RNA166 genes among diverse plant species. Genomics 2014, 103, 114–121. [Google Scholar] [CrossRef] [Green Version]
  7. Merelo, P.; Ram, H.; Pia Caggiano, M.; Ohno, C.; Ott, F.; Straub, D.; Graeff, M.; Cho, S.K.; Yang, S.W.; Wenkel, S.; et al. Regulation of MIR165/166 by class II and class III homeodomain leucine zipper proteins establishes leaf polarity. Proc. Natl. Acad. Sci. USA 2016, 113, 11973–11978. [Google Scholar] [CrossRef] [Green Version]
  8. Rong, F.; Chen, F.; Huang, L.; Zhang, J.; Zhang, C.; Hou, D.; Cheng, Z.; Weng, Y.; Chen, P.; Li, Y. A mutation in class III homeodomain-leucine zipper (HD-ZIP III) transcription factor results in curly leaf (cul) in cucumber (Cucumis sativus L.). Theor. Appl. Genet. 2019, 132, 113–123. [Google Scholar] [CrossRef]
  9. Rhoades, M.W.; Reinhart, B.J.; Lim, L.P.; Burge, C.B.; Bartel, B.; Bartel, D.P. Prediction of Plant MicroRNA Targets. Cell 2002, 110, 513–520. [Google Scholar] [CrossRef] [Green Version]
  10. Williams, L. Regulation of Arabidopsis shoot apical meristem and lateral organ formation by microRNA miR166g and its AtHD-ZIP target genes. Development 2005, 132, 3657–3668. [Google Scholar] [CrossRef] [Green Version]
  11. Jung, J.; Park, C. MIR166/165 genes exhibit dynamic expression patterns in regulating shoot apical meristem and floral development in Arabidopsis. Planta 2007, 225, 1327–1338. [Google Scholar] [CrossRef]
  12. Boualem, A.; Laporte, P.; Jovanovic, M.; Laffont, C.; Plet, J.; Combier, J.; Niebel, A.; Crespi, M.; Frugier, F. MicroRNA166 controls root and nodule development in Medicago truncatula. Plant J. 2008, 54, 876–887. [Google Scholar] [PubMed]
  13. Zhang, Q.L.; Su, L.Y.; Zhang, S.T.; Xu, X.P.; Chen, X.H.; Li, X.; Jiang, M.Q.; Huang, S.Q.; Chen, Y.K.; Zhang, Z.H.; et al. Analyses of microRNA166 gene structure, expression, and function during the early stage of somatic embryogenesis in Dimocarpus longan Lour. Plant Physiol. Biochem. 2020, 147, 205–214. [Google Scholar] [CrossRef] [PubMed]
  14. Zhu, H.; Hu, F.; Wang, R.; Zhou, X.; Sze, S.; Liou, L.W.; Barefoot, A.; Dickman, M.; Zhang, X. Arabidopsis Argonaute10 Specifically Sequesters miR166/165 to Regulate Shoot Apical Meristem Development. Cell 2011, 145, 242–256. [Google Scholar] [CrossRef] [PubMed] [Green Version]
  15. Li, X.; Lian, H.; Zhao, Q.; He, Y. MicroRNA166 Monitors SPOROCYTELESS/NOZZLE for Building of the Anther Internal Boundary. Plant Physiol. 2019, 181, 208–220. [Google Scholar] [CrossRef] [PubMed]
  16. Kulcheski, F.R.; de Oliveira, L.F.; Molina, L.G.; Almerao, M.P.; Rodrigues, F.A.; Marcolino, J.; Barbosa, J.F.; Stolf-Moreira, R.; Nepomuceno, A.L.; Marcelino-Guimaraes, F.C.; et al. Identification of novel soybean microRNAs involved in abiotic and biotic stresses. BMC Genom. 2011, 12, 307. [Google Scholar] [CrossRef] [Green Version]
  17. Juárez-González, V.T.; López-Ruiz, B.A.; Baldrich, P.; Luján-Soto, E.; Meyers, B.C.; Dinkova, T.D. The explant developmental stage profoundly impacts small RNA-mediated regulation at the dedifferentiation step of maize somatic embryogenesis. Sci. Rep. 2019, 9, 14511. [Google Scholar] [CrossRef] [Green Version]
  18. Zhang, T.; Lian, H.; Zhou, C.; Xu, L.; Jiao, Y.; Wang, J. A Two-Step Model for de Novo Activation of WUSCHEL during Plant Shoot Regeneration. Plant Cell 2017, 29, 1073–1087. [Google Scholar] [CrossRef] [PubMed] [Green Version]
  19. Li, Z.; Li, S.; Zhang, L.; Han, S.; Li, W.; Xu, H.; Yang, W.; Liu, Y.; Fan, Y.; Qi, L. Over-expression of miR166a inhibits cotyledon formation in somatic embryos and promotes lateral root development in seedlings of Larix leptolepis. Plant Cell Tissue Organ Cult. (PCTOC) 2016, 127, 461–473. [Google Scholar] [CrossRef]
  20. Li, Z.; Zhang, L.; Li, W.; Qi, L.; Han, S. MIR166a Affects the Germination of Somatic Embryos in Larixleptolepis by Modulating IAA Biosynthesis and Signaling Genes. J. Plant Growth Regul. 2017, 36, 889–896. [Google Scholar] [CrossRef]
  21. Li, Z.X.; Fan, Y.R.; Dang, S.F.; Li, W.F.; Qi, L.W.; Han, S.Y. LaMIR166a-mediated auxin biosynthesis and signalling affect somatic embryogenesis in Larix leptolepis. Mol. Genet. Genom. 2018, 293, 1355–1363. [Google Scholar] [CrossRef]
  22. Qiao, Y.; Zhang, J.; Zhang, J.; Wang, Z.; Ran, A.; Guo, H.; Wang, D.; Zhang, J. Integrated RNA-seq and sRNA-seq analysis reveals miRNA effects on secondary metabolism in Solanum tuberosum L. Mol. Genet. Genom. 2017, 292, 37–52. [Google Scholar] [CrossRef]
  23. Zhang, M.; Dong, Y.; Nie, L.; Lu, M.; Fu, C.; Yu, L. High-throughput sequencing reveals miRNA effects on the primary and secondary production properties in long-term subcultured Taxus cells. Front. Plant Sci. 2015, 6, 604. [Google Scholar] [CrossRef] [Green Version]
  24. Fiehn, O.; Kopka, J.; Dormann, P.; Altmann, T.; Trethewey, R.N.; Willmitzer, L. Metabolite profiling for plant functional genomics. Nat. Biotechnol. 2000, 18, 1157–1161. [Google Scholar] [CrossRef] [PubMed]
  25. Rothenberg, D.O.; Yang, H.; Chen, M.; Zhang, W.; Zhang, L. Metabolome and Transcriptome Sequencing Analysis Reveals Anthocyanin Metabolism in Pink Flowers of Anthocyanin-Rich Tea (Camellia sinensis). Molecules 2019, 24, 1064. [Google Scholar] [CrossRef] [PubMed] [Green Version]
  26. Lou, Q.; Liu, Y.; Qi, Y.; Jiao, S.; Tian, F.; Jiang, L.; Wang, Y. Transcriptome sequencing and metabolite analysis reveals the role of delphinidin metabolism in flower colour in grape hyacinth. J. Exp. Bot. 2014, 65, 3157–3164. [Google Scholar] [CrossRef] [PubMed] [Green Version]
  27. André, S.; Classen, B.; Gabius, H. Studies on Unprocessed and Acid-Treated Arabinogalactan from Larch as an Inhibitor of Glycan Binding of a Plant Toxin and Biomedically Relevant Human Lectins. Planta Med. 2015, 81, 1146–1153. [Google Scholar] [CrossRef] [PubMed] [Green Version]
  28. Kelly, G.S. Larch arabinogalactan: Clinical relevance of a novel immune-enhancing polysaccharide. Altern. Med. Rev. 1999, 4, 96–103. [Google Scholar] [PubMed]
  29. Fuchtner, S.; Brock-Nannestad, T.; Smeds, A.; Fredriksson, M.; Pilgard, A.; Thygesen, L.G. Hydrophobic and Hydrophilic Extractives in Norway Spruce and Kurile Larch and Their Role in Brown-Rot Degradation. Front. Plant Sci. 2020, 11, 855. [Google Scholar] [CrossRef] [PubMed]
  30. Dziedzinski, M.; Kobus-Cisowska, J.; Szymanowska, D.; Stuper-Szablewska, K.; Baranowska, M. Identification of Polyphenols from Coniferous Shoots as Natural Antioxidants and Antimicrobial Compounds. Molecules 2020, 25, 3527. [Google Scholar] [CrossRef]
  31. Riikonen, J.; Kontunen-Soppela, S.; Ossipov, V.; Tervahauta, A.; Tuomainen, M.; Oksanen, E.; Vapaavuori, E.; Heinonen, J.; Kivimäenpää, M. Needle metabolome, freezing tolerance and gas exchange in Norway spruce seedlings exposed to elevated temperature and ozone concentration. Tree Physiol. 2012, 32, 1102–1112. [Google Scholar] [CrossRef] [PubMed] [Green Version]
  32. Xu, S.; Hu, C.; Hussain, S.; Tan, Q.; Wu, S.; Sun, X. Metabolomics analysis reveals potential mechanisms of tolerance to excess molybdenum in soybean seedlings. Ecotoxicol. Environ. Saf. 2018, 164, 589–596. [Google Scholar] [CrossRef]
  33. Zhang, M.; Li, W.; Feng, J.; Gong, Z.; Yao, Y.; Zheng, C. Integrative transcriptomics and proteomics analysis constructs a new molecular model for ovule abortion in the female-sterile line of Pinus tabuliformis Carr. Plant Sci. 2020, 294, 110462. [Google Scholar] [CrossRef] [PubMed]
  34. Lu, Z.; Jiang, B.; Zhao, B.; Mao, X.; Lu, J.; Jin, B.; Wang, L. Liquid profiling in plants: Identification and analysis of extracellular metabolites and miRNAs in pollination drops of Ginkgo biloba. Tree Physiol. 2020, 40, 1420–1436. [Google Scholar] [CrossRef]
  35. Liao, Q.; Du, R.; Gou, J.; Guo, L.; Shen, H.; Liu, H.; Nguyen, J.K.; Ming, R.; Yin, T.; Huang, S.; et al. The genomic architecture of the sex-determining region and sex-related metabolic variation in Ginkgobiloba. Plant J. 2020, 104, 1399–1409. [Google Scholar] [CrossRef] [PubMed]
  36. Franco, D.M.; Saldanha, L.L.; Silva, E.M.; Nogueira, F.T.S.; Dokkedal, A.L.; Santos, C.; Rolim, D.A.L.F. Effects of leaf extracts of Myrcia guianensis (Aubl.) DC. on growth and gene expression during root development of Sorghum bicolor (L.) Moench. Allelopath. J. 2015, 35, 237–248. [Google Scholar]
  37. Maloney, G.S.; DiNapoli, K.T.; Muday, G.K. The anthocyanin reduced Tomato Mutant Demonstrates the Role of Flavonols in Tomato Lateral Root and Root Hair Development. Plant Physiol. 2014, 166, 614–631. [Google Scholar] [CrossRef] [PubMed] [Green Version]
  38. Yin, R.; Han, K.; Heller, W.; Albert, A.; Dobrev, P.I.; Zažímalová, E.; Schäffner, A.R. Kaempferol 3-O-rhamnoside-7-O-rhamnoside is an endogenous flavonol inhibitor of polar auxin transport in Arabidopsis shoots. New Phytol. 2013, 201, 466–475. [Google Scholar] [CrossRef] [Green Version]
  39. Franco, D.M.; Silva, E.M.; Saldanha, L.L.; Adachi, S.A.; Schley, T.R.; Rodrigues, T.M.; Dokkedal, A.L.; Nogueira, F.T.; Rolim, D.A.L. Flavonoids modify root growth and modulate expression of SHORT-ROOT and HD-ZIP III. J. Plant Physiol. 2015, 188, 89–95. [Google Scholar] [CrossRef]
Figure 1. Analysis of the total ion current (TIC) in different quality control (QC) samples. The abscissa represents the retention time (min) of metabolite detection, and the ordinate represents the intensity (cps: count per second) of the ion current.
Forests 11 01367 g001
Figure 2. Qualitative and quantitative analysis of the metabolomics data. (a) Metabolite clustering heatmap. Abscissa indicates sample name, and ordinate indicates hierarchical clustering results. Red color represents high accumulation, and green color represents low accumulation. (b) Pearson’s correlation coefficients among the twelve samples. (c) Principal coordinate analysis of the four groups. The abscissa represents the first principal component, and the ordinate represents the second principal component. (d) Component analysis of the identified metabolites. The top four metabolites lipids, amino acids, flavonoids, and nucleotides are shown beside the graph. WT represents wild embryogenic cultures; a represents transgenic embryogenic cultures, including WT vs. a-3, WT vs. a-4, and WT vs. a-5.
Forests 11 01367 g002
Figure 3. Differentially accumulated metabolites (DAMs) among WT vs. a-3, WT vs. a-4, and WT vs. a-5. (a) Volcano plot showing the differential metabolites in WT vs. a-3. (b) Volcano plot showing the differential metabolites in WT vs. a-4. (c) Volcano plot showing the differential metabolites in WT vs. a-5. The red dots represent up-regulated DAMs, the green dots represent down-regulated DAMs, and the black dots represent non-DAMs. (d) Heatmap representing the hierarchical cluster analysis in WT vs. a-3. (e) Heatmap representing the hierarchical cluster analysis in WT vs. a-4. (f) Heatmap representing the hierarchical cluster analysis in WT vs. a-5. Red color indicates high abundance, and green color indicates low abundance. (g) Component analysis of DAMs in WT vs. a-3. (h) Component analysis of DAMs in WT vs. a-4. (i) Component analysis of DAMs in WT vs. a-5. The top foreground DAMs are noted in each graph.
Forests 11 01367 g003
Figure 4. Differential metabolites commonly and specifically accumulated in WT vs. a-3, WT vs. a-4, and WT vs. a-5. Venn diagrams show the distribution of DAMs in WT vs. a-3, WT vs. a-4, and WT vs. a-5.
Forests 11 01367 g004
Figure 5. Kyoto Encyclopedia of Genes and Genomes (KEGG) pathway enrichment analysis of DAMs. (a) Pathway enrichment in WT vs. a-3. (b) Pathway enrichment in WT vs. a-4. (c) Pathway enrichment in WT vs. a-5. The abscissa represents the enrichment factor, the ordinate represents the enrichment pathway, and the dot point sizes represent the number of differentially enriched metabolites.
Forests 11 01367 g005
Figure 6. Quadrant diagrams representing the association of metabolomic and transcriptomic data. (a) Overview of metabolomic and transcriptomic variation in WT vs. a-3. (b) Overview of metabolomic and transcriptomic variation in WT vs. a-4. (c) Overview of metabolomic and transcriptomic variation in WT vs. a-5. The abscissa represents the fold changes in the transcriptome data, and the ordinate represents the fold changes in the metabolome data. The black dotted lines represent the differential thresholds. Each point represents a gene/metabolite. Blue dots represent that genes and metabolites were both changed; black dots represent unchanged genes/metabolites; green dots represent DAMs with unchanged genes; red dots represent differentially expressed genes (DEGs) with unchanged metabolites.
Forests 11 01367 g006
Figure 7. Transcript-metabolite correlation network representing DAMs and DEGs involved in WT and overexpression of LaMIR166a cell lines. (a,b) Pearson correlation network representing ko00940 and ko00941 in WT vs. a-3. (c,d) Pearson correlation network representing ko00940 and ko00941 in WT vs. a-4. (e,f) Pearson correlation network representing ko00940 and ko00941 in WT vs. a-5. The gene–metabolite pairs were connected within the network by edges. Red nodes represent genes, and green nodes represent metabolites. Full lines represent positive correlations.
Forests 11 01367 g007
Table 1. Summary of differentially accumulated metabolites (DAMs) among WT, a-3, a-4, and a-5.
GroupNumbersUp-RegulatedDown-Regulated
WT vs. a-3775522
WT vs. a-4725418
WT vs. a-5764531
Table 2. Numbers of DAMs class among groups.
Class Numbers of WT vs. a-3PercentageNumbers of WT vs. a-4PercentageNumbers of WT vs. a-5Percentage
Phenolic acids1722.1%1013.9%1519.7%
Flavonoids1519.5%1825.0%911.8%
Lipids1114.3%912.5%911.8%
Amino acids and derivatives1013.0%912.5%1621.1%
Others67.8%79.7%67.9%
Nucleotides and derivatives45.2%56.9%45.3%
Tannins45.2%34.2%33.9%
Alkaloids33.9%45.6%22.6%
Organic acids33.9%34.2%67.9%
Lignans and Coumarins22.6%45.6%22.6%
Terpenoids22.6%00.0%45.3%
Table 3. DAMs involved in flavonoid biosynthesis.
IndexCompound ClassFold ChangeLog2(FC)Type
mws0057Eriodictyol 7-O-glucosideDihydroflavone2.271.18up
mws0064EriodictyolDihydroflavone4.422.14up
pme0376NaringeninDihydroflavone4.912.30up
mws0044Dihydroquercetin(Taxifolin)Dihydroflavonol2.691.43up
mws1361AstilbinDihydroflavonol3.011.59up
pmb0736Tricin 7-O-GlucosideFlavonoid2.251.17up
HJAP006Syringetin-O-glucosideFlavonoid2.611.39up
mws0058DiosmetinFlavonoid2.661.41up
HJAP110Myricetin-O-rhamnosideFlavonoid3.901.97up
HJN041Epicatechin glucosideFlavonoid4.732.24up
mws1662TectochrysinFlavonoid9.083.18up
Xmyp005987Isorhamnetin-3-O-β-d-glucopyranosideFlavonoid1.69 × 1014.08up
Xmyp005746Isorhamnetin-3-O-rutinosideFlavonoid4.18 × 1028.71up
mws0913Kaempferol-3-O-galactoside (Trifolin) *Flavonols2.291.20up
mws4183Quercetin-3-O-α-L-arabinopyranoside(guaijaverin) *Flavonols2.771.47up
mws0061Quercetin-3-O-β-d-Galactoside (Hyperin) *Flavonols3.381.76up
pmp0013096-Hydroxykaempferol-7-O-glucosideFlavonols3.501.81up
Lmdp003286isohyperosideFlavonols3.531.82up
mws0091Quercetin-3-O-β-d-glucoside(Isoquercitrin) *Flavonols3.761.91up
mws0856SpiraeosideFlavonols3.791.92up
mws1329Quercetin-7-O-Glucoside *Flavonols4.022.01up
pmp0013116-Hydroxykaempferol-7,6-O-DiglucosideFlavonols4.622.21up
Hmcp002316Isorhamnetin-3-O-arabinosideFlavonols4.90 × 1028.94up
mws0054Catechin *Flavanols5.402.43up
pme0460Epicatechin *Flavanols5.832.54up
The asterisks represents an isomeride.
Table 4. Common differentially accumulated metabolites in WT vs. a-3, WT vs. a-4, and WT vs. a-5.
IndexCompoundsClassType
mws0146Nicotinic Acid Methyl Ester(Methyl Nicotinate)Alkaloidsup
pme2268TrigonellineAlkaloidsup
Lmhp003064Cyclo(Pro-Phe)Amino acids and derivativesdown
mws0193L-HomocitrullineAmino acids and derivativesup
mws0582S-(methyl)glutathioneAmino acids and derivativesdown
mws1401L-theanineAmino acids and derivativesdown
pme0122N6-Acetyl-L-lysineAmino acids and derivativesup
pme1002L-TyramineAmino acids and derivativesup
pme12285-Hydroxy-L-tryptophanAmino acids and derivativesup
pme1712L-SaccharopineAmino acids and derivativesup
Hmcp002316Isorhamnetin-3-O-arabinosideFlavonoidsup
mws0044Dihydroquercetin(Taxifolin)Flavonoidsup
ws4183Quercetin-3-O-α-L-arabinopyranoside(guaijaverin)Flavonoidsup
pme0376NaringeninFlavonoidsup
pmp0013116-Hydroxykaempferol-7,6-O-DiglucosideFlavonoidsup
Xmyp005746Isorhamnetin-3-O-rutinosideFlavonoidsup
Xmyp005987Isorhamnetin-3-O-β-d-glucopyranosideFlavonoidsup
Hmgn004139isohydroxymatairesinolLignans and Coumarinsup
mws5039Esculin HydrateLignans and Coumarinsdown
pma36069-Hydroxy-10,12,15-octadecatrienoic acidLipidsup
pmb27869-HOTrELipidsup
pmn00168610,16-Dihydroxy-palmitic acidLipidsup
mws0609Guanosine 3′,5′-cyclic monophosphateNucleotides and derivativesup
pme0256XanthineNucleotides and derivativesup
pme31842′-Deoxyadenosine-5′-monophosphateNucleotides and derivativesdown
Lmtn004049Abscisic acidOrganic acidsup
mws01473-Hydroxy-3-methyl butyric acidOrganic acidsup
mws2608N-Acetyl-d-galactosamineOthersdown
mws4174N-Acetyl-β-d-mannosamineOthersdown
pme0490Nicotinic acidOthersup
pme1261PantothenolOthersdown
pme25291,5-Anhydro-d-glucitolOthersup
HmLn002358Vanillic acid-glucosidePhenolic acidsdown
Lmgn001670Salicylic acidPhenolic acidsup
Lmtn0035983-Prenyl-4-O-β-d-glucopyranosyloxy-4-hydroxyl-benzoic acidPhenolic acidsdown
mws0906ConiferinPhenolic acidsup
mws2213Cinnamic acidPhenolic acidsup
mws2368TyrosolPhenolic acidsup
pmb3107Glucosyringic AcidPhenolic acidsup
pmn0015181-O-Galloyl-β-d-glucosePhenolic acidsdown
Zmxn001997Isosalicylic acid O-glycosidePhenolic acidsup
mws0836Procyanidin B1Tanninsup
pme0434Procyanidin B2Tanninsup
Table 5. DAMs involved in Flavonoid biosynthesis, Plant hormone signal transduction and Phenylpropanoid biosynthesis. The asterisks represents an isomeride.
IndexKEGG PathwayCompoundClassFold ChangeLog2(FC)Type
pme0376Flavonoid biosynthesisNaringeninFlavonoids4.622.21up
mws0044Dihydroquercetin(Taxifolin)Flavonoids2.401.26up
pmb30743-O-p-Coumaroyl quinic acidPhenolic acids6.012.59up
pme0460Epicatechin *Flavonoids3.481.80up
mws0042Epigallocatechin *Flavonoids8.233.04up
Lmgn001670Plant hormone signal transductionSalicylic acid *Phenolic acids3.031.60up
Lmtn004049Abscisic acidOrganic acids3.951.98up
mws0921Phenylpropanoid biosynthesisp-Coumaryl alcoholPhenolic acids2.061.04up
mws0906ConiferinPhenolic acids2.741.45up
pmb30743-O-p-Coumaroyl quinic acidPhenolic acids6.012.59up
mws2213Cinnamic acidPhenolic acids2.721.44up
pme1439p-Coumaric acidPhenolic acids2.021.02up
Publisher’s Note: MDPI stays neutral with regard to jurisdictional claims in published maps and institutional affiliations.

