Changes in Community Composition of Tropical Evergreen Forests during Succession in Ta Dung National Park, Central Highlands of Vietnam

 ,
,  , ,
, , 
Abstract
:1. Introduction
2. Materials and Methods
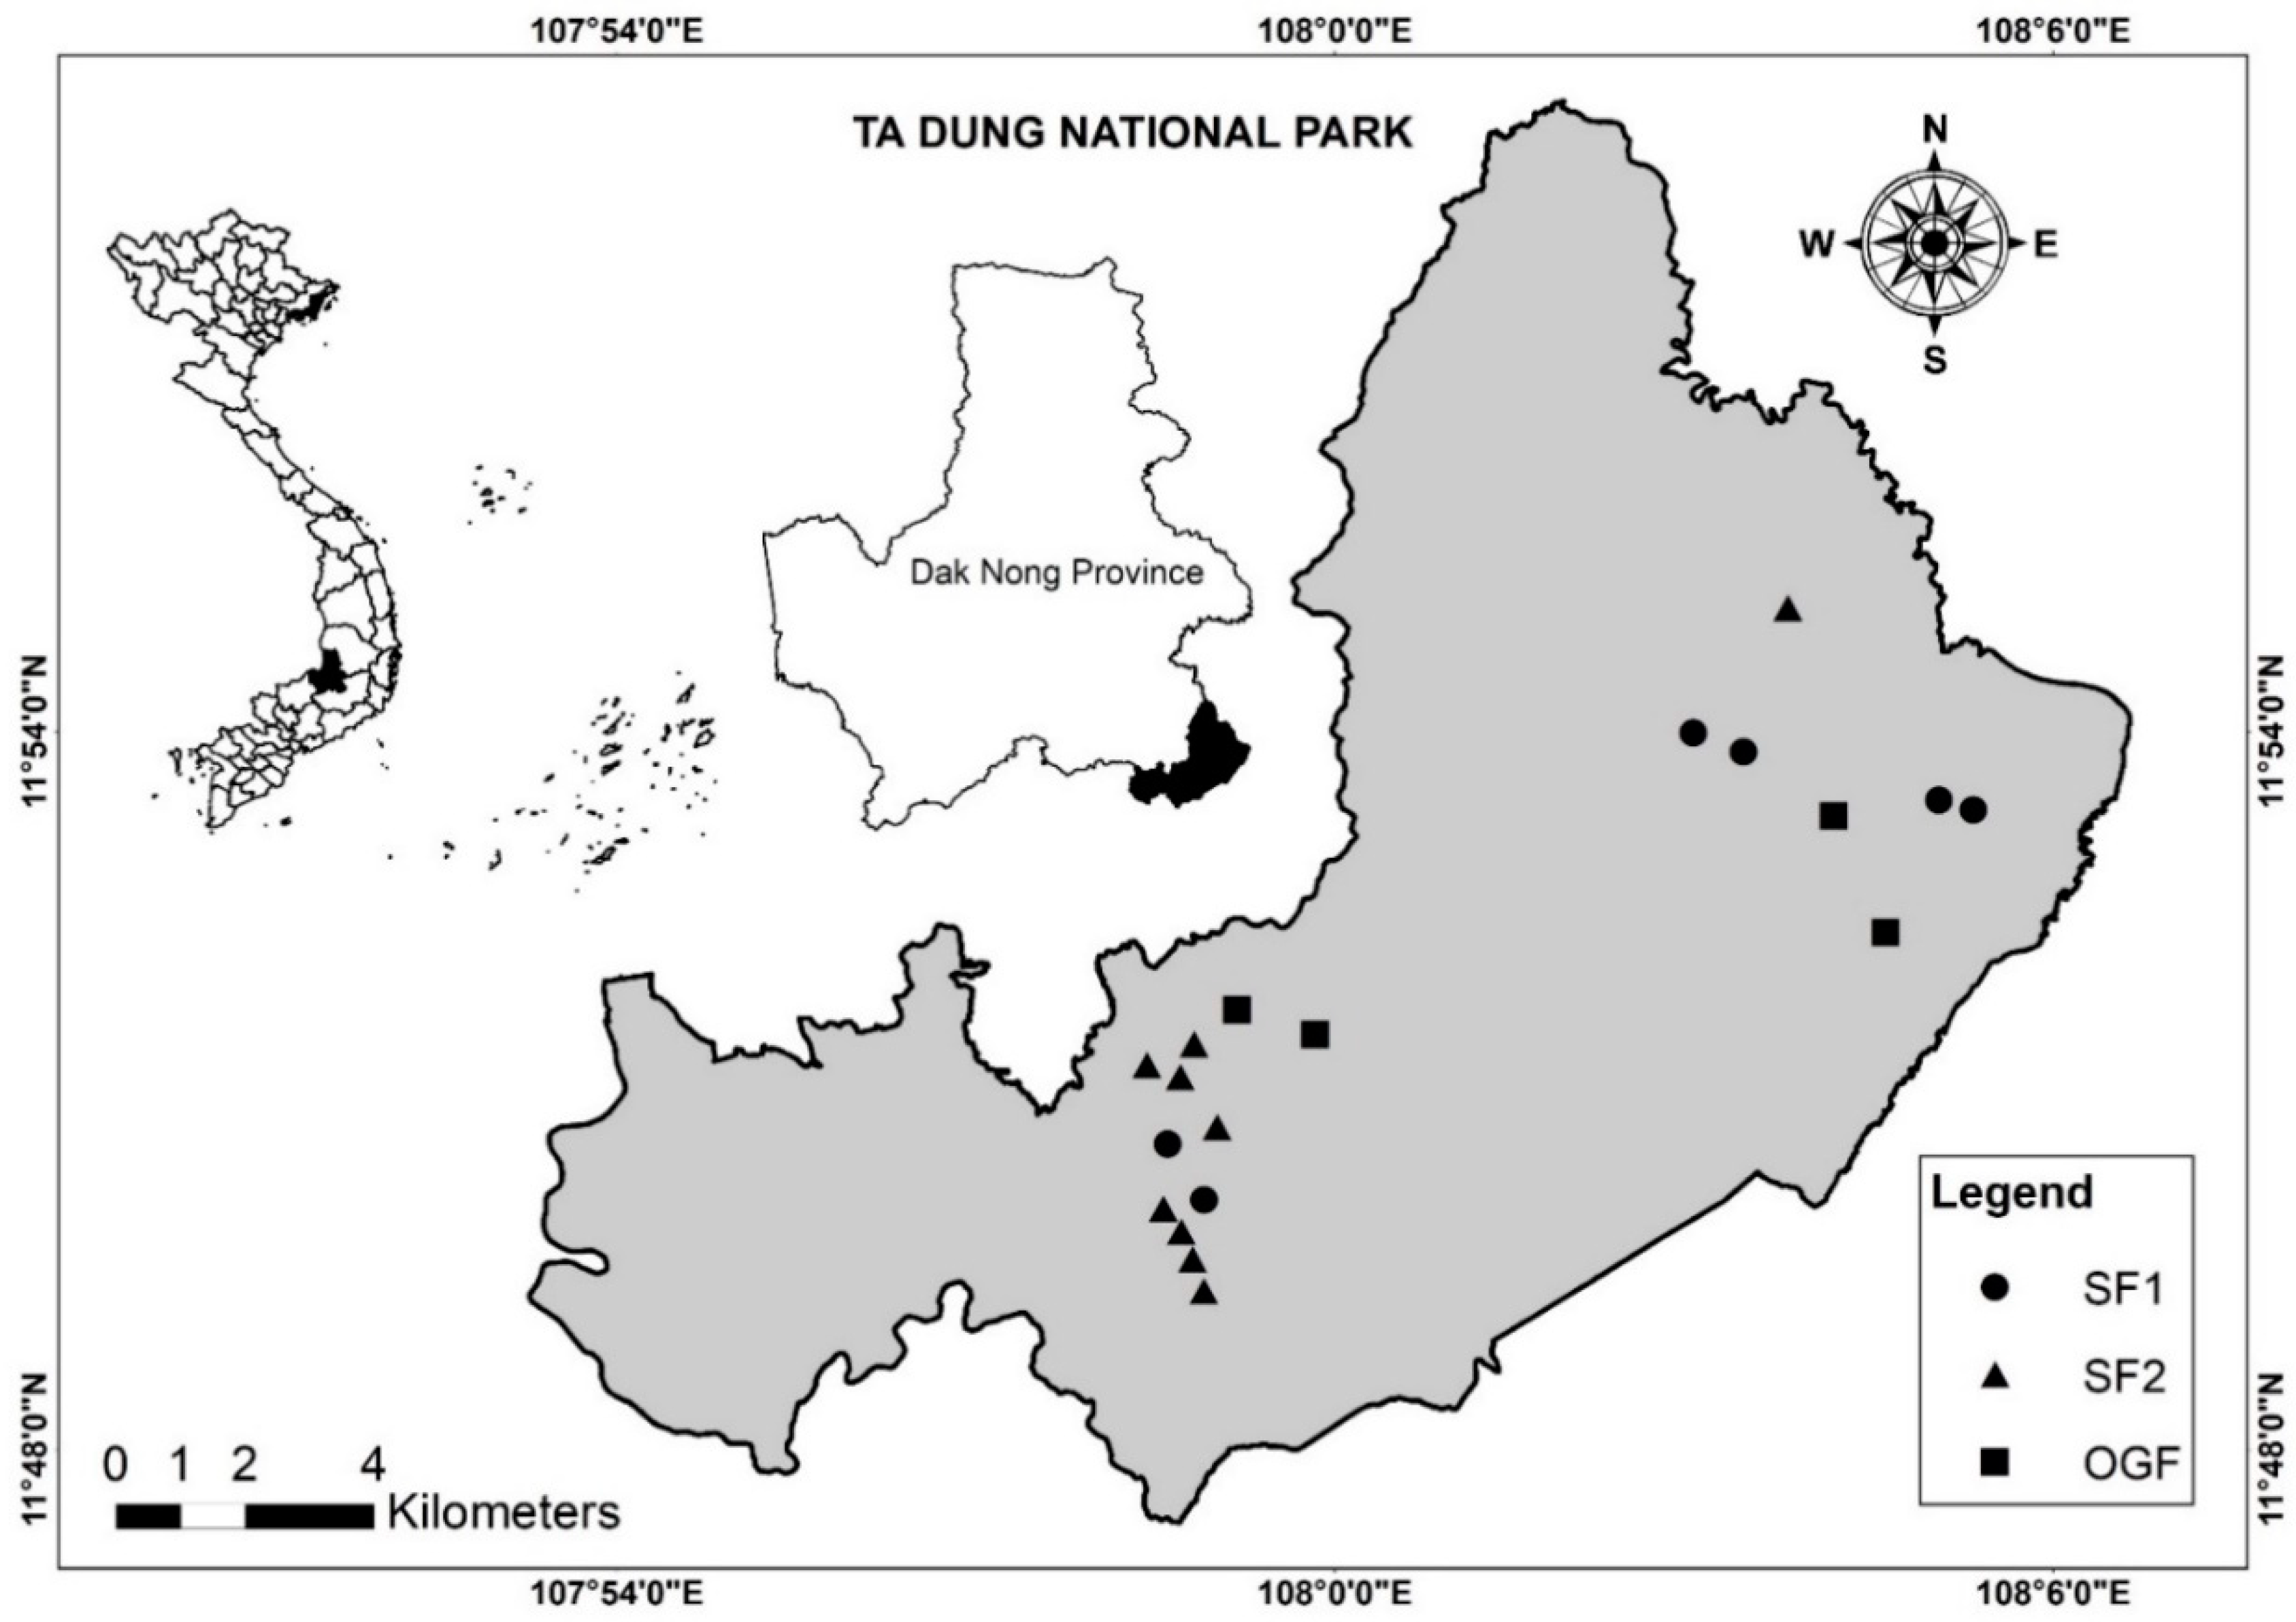
2.1. Study Site and Data Collection
2.2. Data Analysis
2.2.1. Community Diversity and Structure
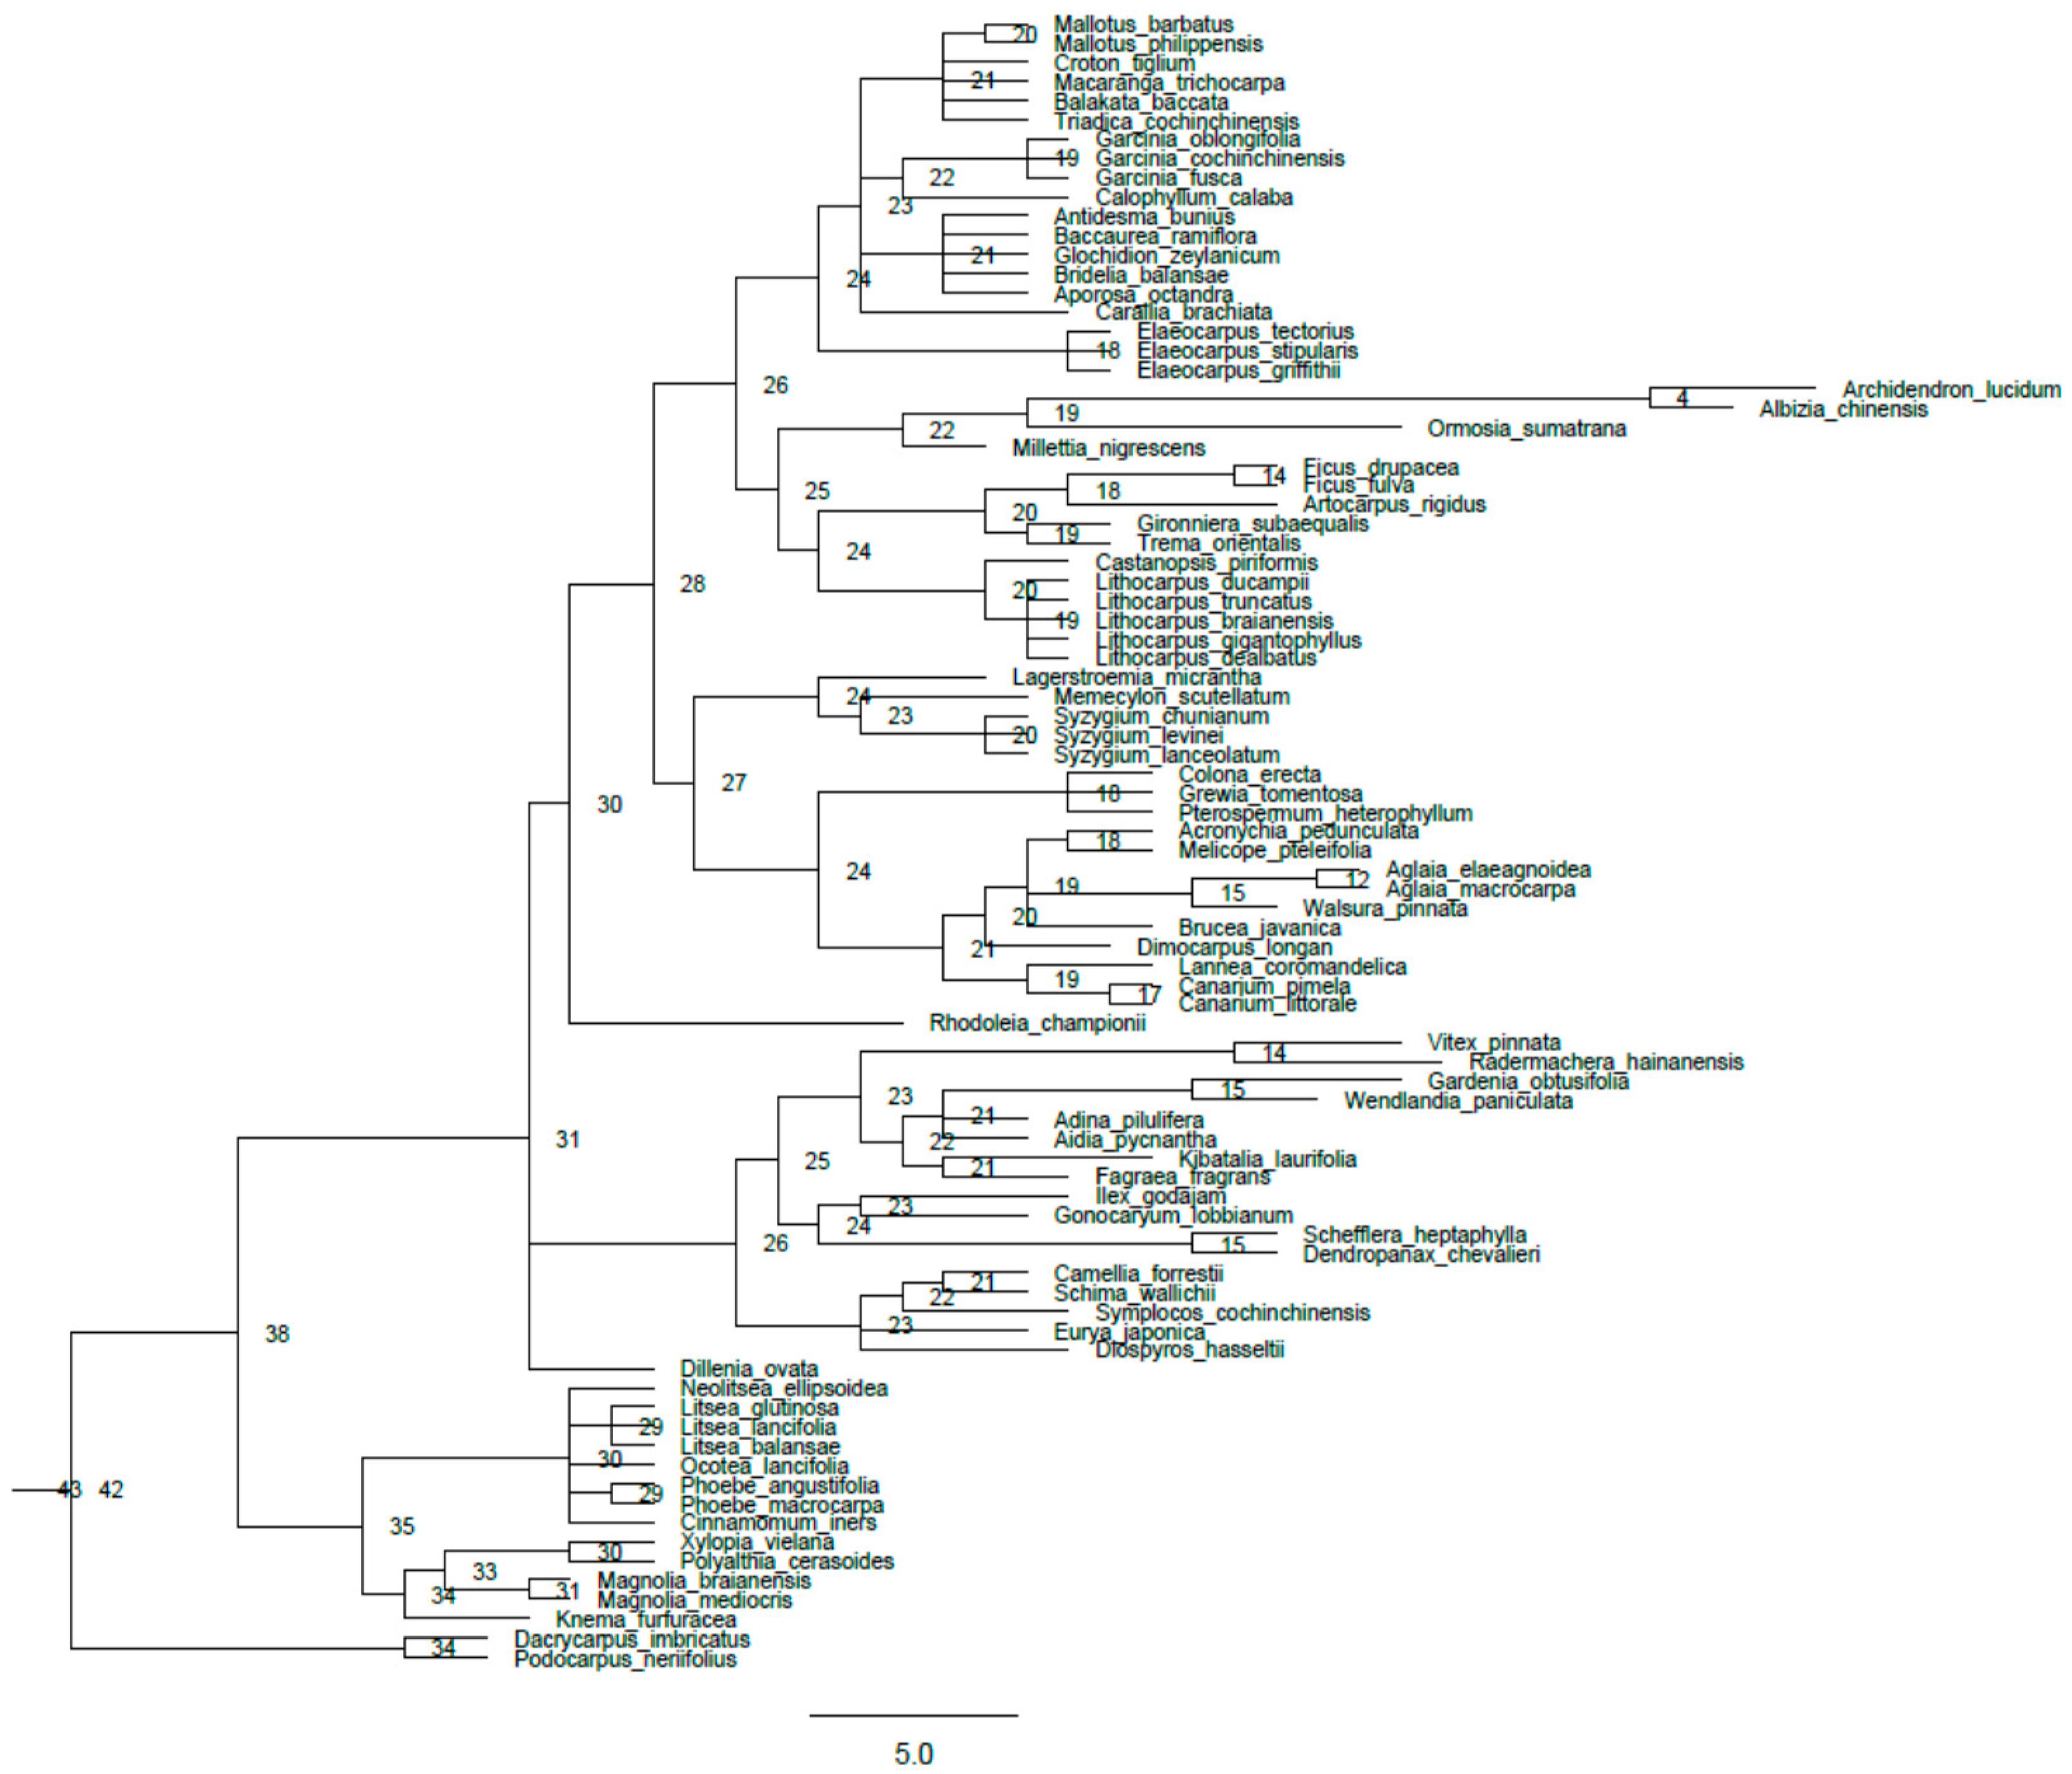
2.2.2. Phylogenetic Diversity and Structure
2.2.3. Correlation between Community Diversity and Structure
- (1)
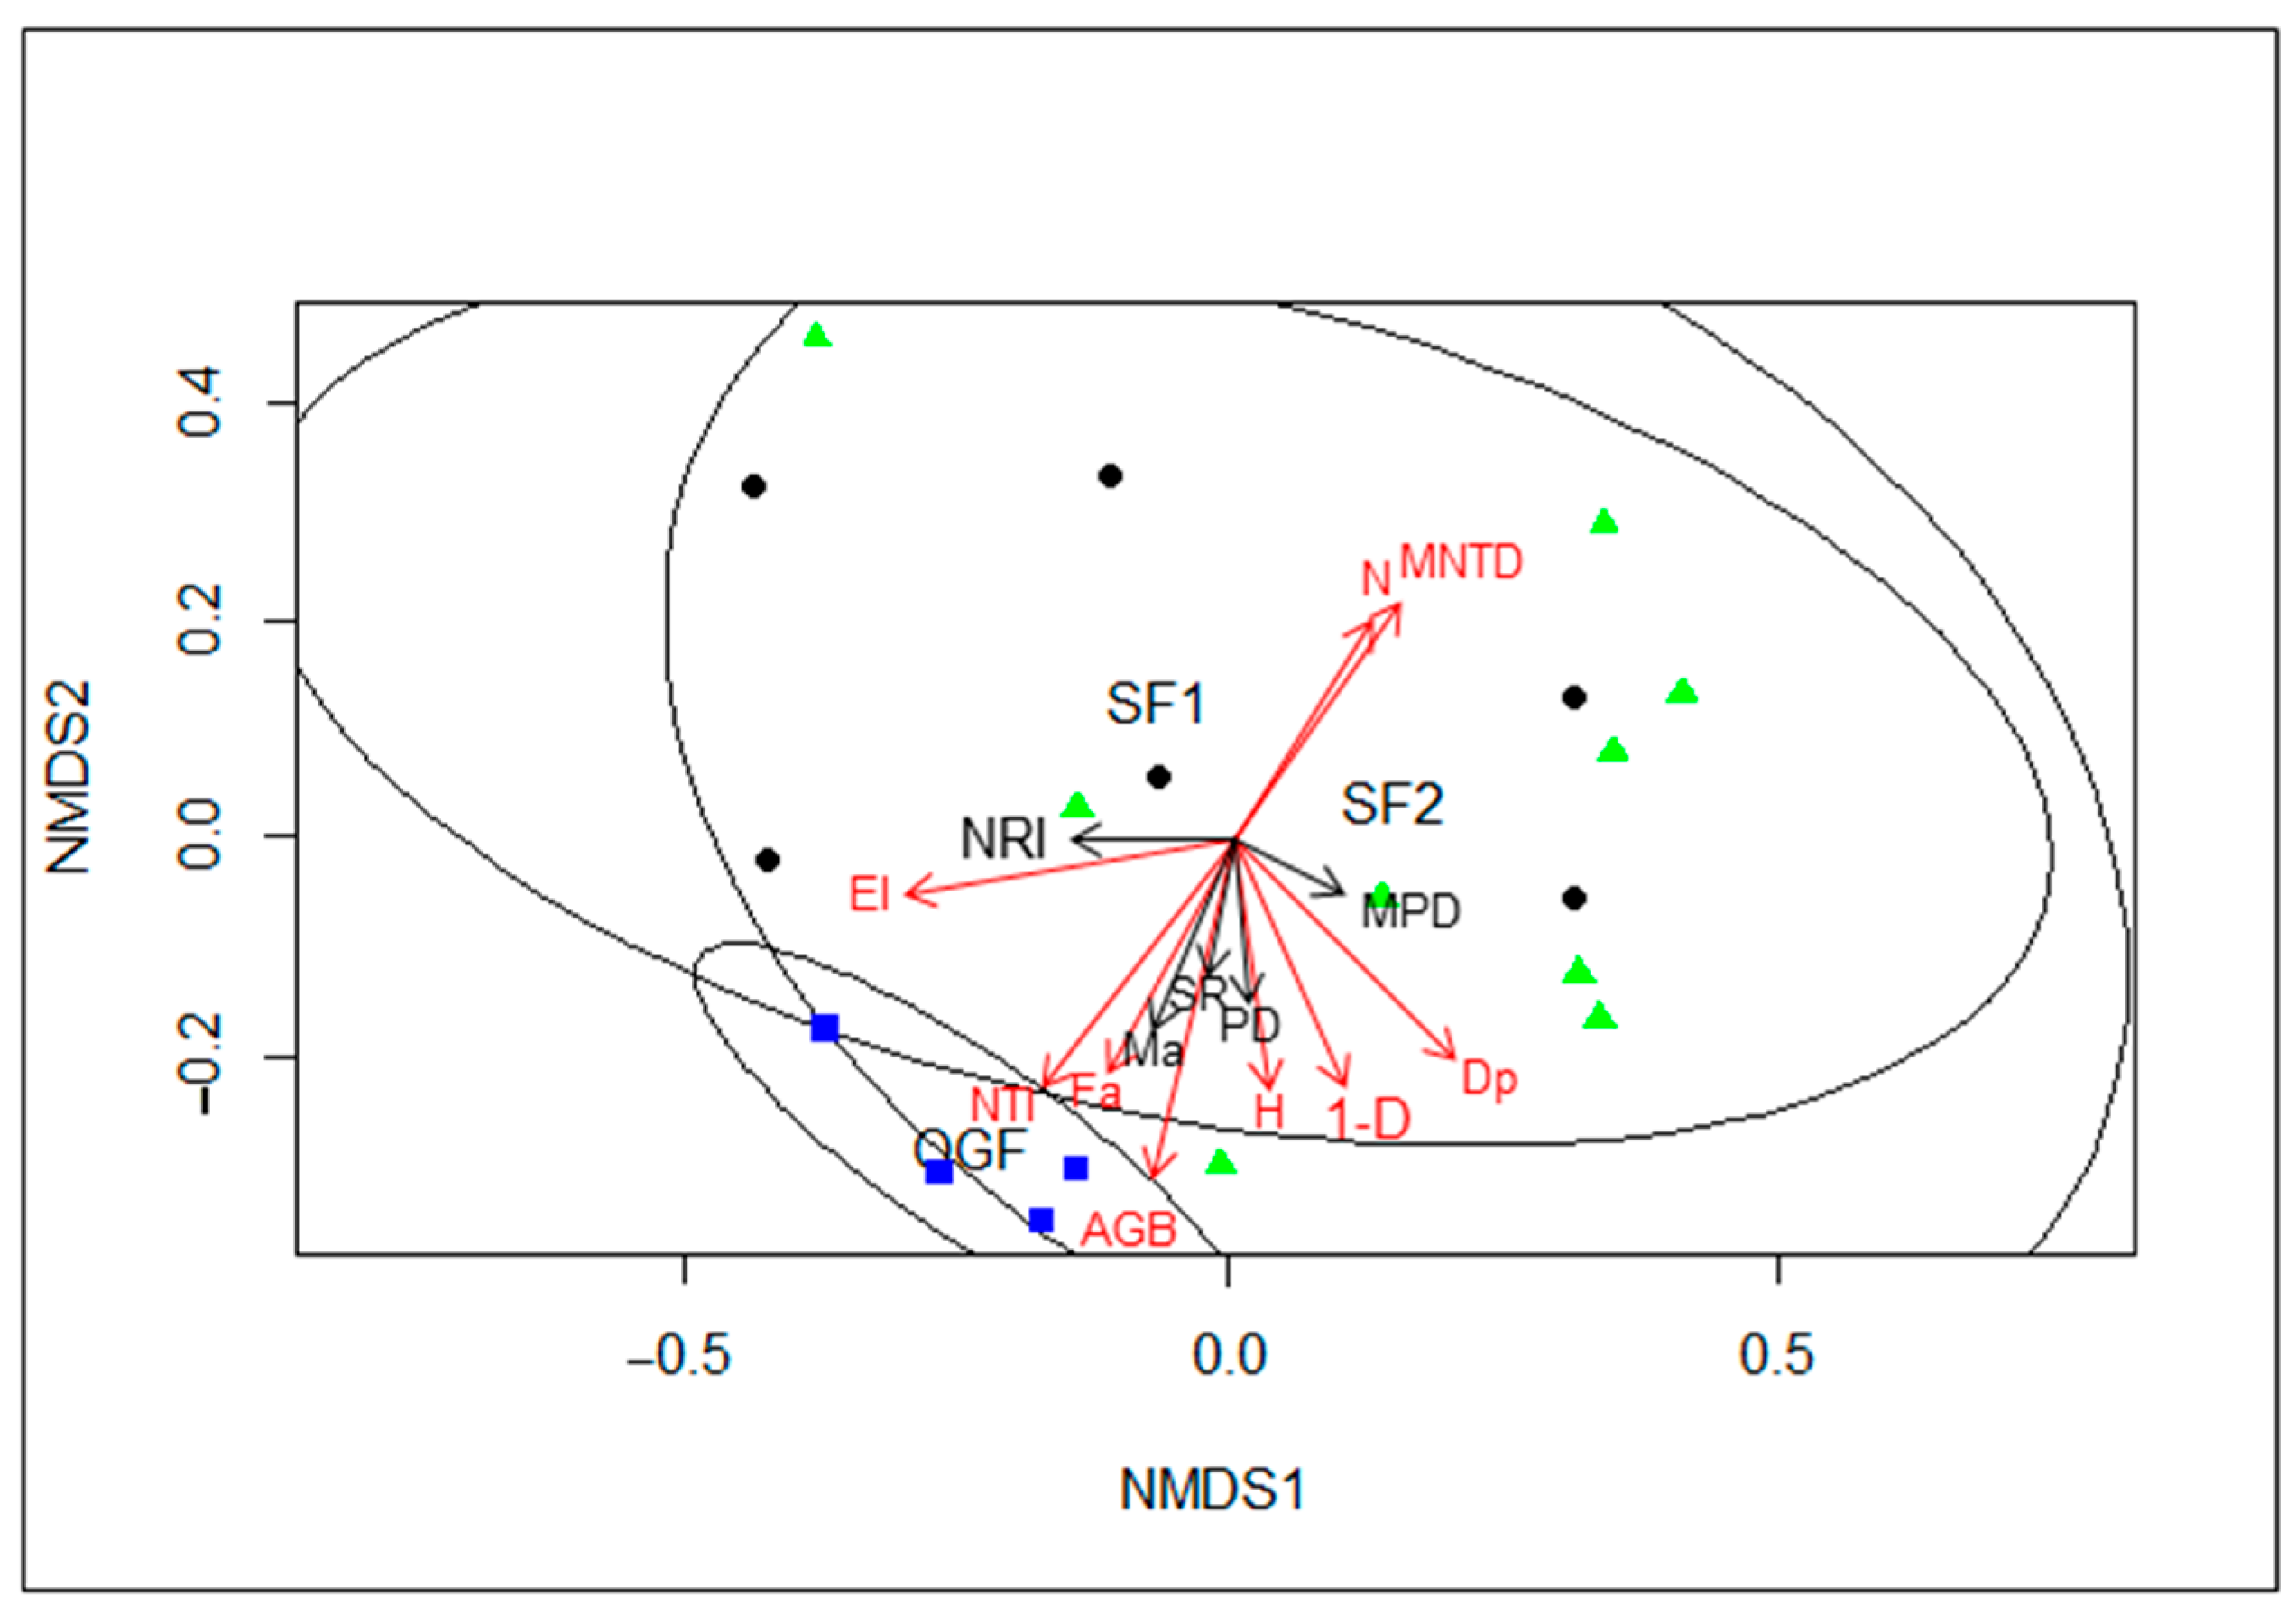
- Non-metric multidimensional scaling (NMDS) with abundance-based Bray–Curtis dissimilarities (adjustment noshare = 0.1; 999 permutations) was used to test the differences in tree community composition using a nested permutational multivariate analysis of variance (PERMANOVA, 999 permutations). All statistical analyses were performed in R ver. 3.5.1. All tests and ordination plots were computed using the package vegan ver. 2.4–5 [48]. The variables were fitted onto the NMDS ordinations using the envfit function in the vegan package and goodness of fit and p-value were computed 999 times, in order to detect environmental drivers for community dynamics.
- (2)
- Data normality and homogeneity of variances were tested using one-way ANOVA with the Shapiro–Wilk and Levene tests. When the ANOVA indicated a significant difference among forest categories (p < 0.05, F test), the differences between means were tested with Scheffe post-hoc test. All statistical analyses were performed using STATISTICA 9.1 (StatSoft, Inc., Tulsa, OK, USA).
3. Results
3.1. Plant Community
3.2. Compositional Pattern of Forest Community
3.3. Correlation of Community Composition
4. Discussion
5. Conclusions
Author Contributions
Funding
Acknowledgments
Conflicts of Interest
Appendix A


| NMDS1 | NMDS2 | r2 | Pr(>r) | |
|---|---|---|---|---|
| El | −0.99225 | −0.12427 | 0.6608 | 0.002 |
| N | 0.50871 | 0.86094 | 0.4423 | 0.009 |
| AGB | −0.32277 | −0.94648 | 0.6935 | 0.001 |
| X1.D | 0.41065 | −0.91179 | 0.5036 | 0.003 |
| H | 0.17959 | −0.98374 | 0.3267 | 0.041 |
| Fa | −0.45491 | −0.89054 | 0.4011 | 0.018 |
| Ma | −0.39278 | −0.91963 | 0.2733 | 0.074 |
| SR | −0.28326 | −0.95904 | 0.1225 | 0.331 |
| MPD | 0.9323 | −0.36169 | 0.0882 | 0.5 |
| NRI | −0.9995 | −0.03152 | 0.1574 | 0.275 |
| NTI | −0.54346 | −0.83943 | 0.6318 | 0.001 |
| PD | 0.1418 | −0.9899 | 0.1624 | 0.233 |
| Dp | 0.6978 | −0.71629 | 0.5767 | 0.003 |
| MNTD | 0.56364 | 0.82602 | 0.5168 | 0.008 |
| No | Species | Family | SF1 Plots | SF2 Plots | OGF Plots | ||||||||||||||||
|---|---|---|---|---|---|---|---|---|---|---|---|---|---|---|---|---|---|---|---|---|---|
| 1 | 2 | 3 | 4 | 5 | 6 | 1 | 2 | 3 | 4 | 5 | 6 | 7 | 8 | 9 | 1 | 2 | 3 | 4 | |||
| 1 | Acronychia pedunculata (L.) Miq. | Rutaceae | 20 | 2 | 12 | 1 | 5 | 1 | 41 | 62 | 4 | 6 | 6 | 4 | 11 | 3 | 1 | 2 | 9 | 7 | |
| 2 | Actinodaphne pilosa (Lour.) Merr. | Lauraceae | 3 | ||||||||||||||||||
| 3 | Aglaia elaeagnoidea (A. Juss.) Benth. | Meliaceae | 1 | 4 | 4 | 7 | 2 | 5 | 1 | ||||||||||||
| 4 | Aidia pycnantha (Drake) Tirveng. | Rubiaceae | 2 | 1 | 1 | 1 | |||||||||||||||
| 5 | Albizia chinensis (Osbeck) Merr. | Fabaceae | 1 | 9 | 1 | 2 | |||||||||||||||
| 6 | Albizia lebbeck (L.) Benth. | Fabaceae | 1 | 5 | 1 | 6 | 37 | 5 | |||||||||||||
| 7 | Alphitonia philippinensis Braid | Rhamnaceae | 1 | 3 | 1 | 1 | |||||||||||||||
| 8 | Alstonia scholaris (L.) R. Br. | Apocynaceae | 1 | 1 | 1 | 2 | |||||||||||||||
| 9 | Antidesma bunius (L.) Spreng. | Phyllanthaceae | 2 | 1 | |||||||||||||||||
| 10 | Aporosa octandra (Buch.-Ham. ex D. Don) Vickery | Phyllanthaceae | 21 | 1 | 38 | 1 | 2 | 3 | 3 | 10 | 7 | 1 | 3 | 1 | |||||||
| 11 | Aralia vietnamensis Ha | Araliaceae | 1 | 1 | 1 | ||||||||||||||||
| 12 | Archidendron clypearia (Jack) I.C.Nielsen | Fabaceae | 1 | ||||||||||||||||||
| 13 | Archidendron lucidum (Benth.) I.C.Nielsen | Fabaceae | 6 | 1 | 10 | 16 | 3 | 9 | 4 | 13 | 3 | 3 | 2 | 2 | 1 | ||||||
| 14 | Artocarpus rigidus Blume | Moraceae | 1 | 1 | 1 | 4 | 1 | 2 | 1 | 3 | 1 | 1 | 1 | 1 | |||||||
| 15 | Azadirachta excelsa (Jack) Jacobs | Meliaceae | 2 | 10 | 1 | 4 | 3 | 1 | |||||||||||||
| 16 | Baccaurea ramiflora Lour. | Phyllanthaceae | 27 | 2 | 2 | 5 | 1 | 5 | 8 | 7 | 8 | 7 | 1 | 7 | 9 | 7 | 21 | 1 | 7 | ||
| 17 | Balakata baccata (Roxb.) Esser | Euphorbiaceae | 8 | 6 | 3 | 3 | 1 | 1 | 87 | 1 | |||||||||||
| 18 | Barringtonia macrocarpa Hassk. | Lecythidaceae | 3 | ||||||||||||||||||
| 19 | Broussonetia papyrifera (L.) L’Hér. ex Vent. | Moraceae | 1 | 1 | |||||||||||||||||
| 20 | Brucea javanica (L.) Merr. | Simaroubaceae | 16 | 1 | 1 | 1 | |||||||||||||||
| 21 | Buchanania siamensis Miq. | Anacardiaceae | 1 | ||||||||||||||||||
| 22 | Calophyllum calaba L. | Calophyllaceae | 1 | 2 | 2 | 2 | |||||||||||||||
| 23 | Camellia forrestii (Diels) Cohen-Stuart | Theaceae | 1 | 1 | 1 | 2 | 2 | 3 | 11 | 2 | 1 | 1 | |||||||||
| 24 | Cananga latifolia (Hook.f. & Thomson) Finet & Gagnep. | Annonaceae | 1 | ||||||||||||||||||
| 25 | Canarium album (Lour.) DC. | Burseraceae | 1 | 1 | |||||||||||||||||
| 26 | Canarium littorale Blume | Burseraceae | 4 | 1 | 2 | 3 | 1 | 3 | 1 | 1 | 1 | ||||||||||
| 27 | Canarium pimela K.D. Koenig | Burseraceae | 1 | 2 | 4 | 1 | 3 | 3 | 3 | ||||||||||||
| 28 | Carallia brachiata (Lour.) Merr. | Rhizophoraceae | 9 | 2 | 1 | 1 | 3 | ||||||||||||||
| 29 | Castanopsis piriformis Hickel & A.Camus | Fagaceae | 3 | 5 | 3 | 5 | 1 | 85 | 20 | 8 | 2 | 3 | |||||||||
| 30 | Cinnamomum bejolghota (Buch.-Ham.) Sweet | Lauraceae | 1 | 1 | |||||||||||||||||
| 31 | Cinnamomum iners Reinw. ex Blume | Lauraceae | 29 | 3 | 12 | 5 | 1 | 1 | 21 | 9 | 3 | 5 | 2 | 2 | 12 | 19 | 4 | 11 | |||
| 32 | Cinnamomum porrectum (Roxb.) Kosterm. | Lauraceae | 1 | ||||||||||||||||||
| 33 | Citrus hystrix DC. | Rutaceae | 1 | 1 | 1 | ||||||||||||||||
| 34 | Clausena excavata Burm. f. | Rutaceae | 4 | 4 | 6 | 1 | |||||||||||||||
| 35 | Colona erecta (Pierre) Burret | Malvaceae | 1 | 1 | 1 | 1 | 1 | 7 | 1 | 1 | 2 | 1 | 6 | 3 | 3 | 6 | |||||
| 36 | Cratoxylum formosum (Jack) Benth. & Hook. f. ex Dyer | Hypericaceae | 4 | 8 | 2 | 26 | 18 | 4 | 17 | 7 | |||||||||||
| 37 | Croton tiglium L. | Euphorbiaceae | 6 | 1 | 1 | 1 | 1 | 1 | 16 | 16 | 6 | 21 | |||||||||
| 38 | Crypteronia paniculata Blume | Crypteroniaceae | 12 | 21 | 1 | 6 | 2 | 3 | |||||||||||||
| 39 | Dillenia ovata Wall. ex Hook.f. & Thomson | Dilleniaceae | 1 | 2 | 2 | 10 | 5 | 10 | |||||||||||||
| 40 | Dimocarpus longan Lour. | Sapindaceae | 1 | 3 | 6 | 9 | 22 | 1 | 3 | 6 | 3 | ||||||||||
| 41 | Diospyros buxifolia (Blume) Hiern | Ebenaceae | 1 | ||||||||||||||||||
| 42 | Diospyros hasseltii Zoll. | Ebenaceae | 1 | 5 | 1 | 1 | 3 | 3 | |||||||||||||
| 43 | Dysoxylum loureirii (Pierre) Pierre ex Laness. | Meliaceae | 2 | 1 | 1 | 3 | 2 | ||||||||||||||
| 44 | Elaeocarpus bojeri R.E. Vaughan | Elaeocarpaceae | 1 | 2 | |||||||||||||||||
| 45 | Elaeocarpus chinensis (Gardner & Champ.) Hook. f. ex Benth. | Elaeocarpaceae | 1 | 1 | |||||||||||||||||
| 46 | Elaeocarpus gagnepainii Merr. | Elaeocarpaceae | 1 | 1 | |||||||||||||||||
| 47 | Elaeocarpus griffithii (Wight) A.Gray | Elaeocarpaceae | 3 | 2 | 4 | 16 | 9 | 6 | 5 | 1 | 1 | 2 | |||||||||
| 48 | Elaeocarpus harmandii Pierre | Elaeocarpaceae | 1 | ||||||||||||||||||
| 49 | Elaeocarpus lanceifolius Roxb. | Elaeocarpaceae | 1 | ||||||||||||||||||
| 50 | Elaeocarpus obtusus Blume | Elaeocarpaceae | 1 | 1 | |||||||||||||||||
| 51 | Elaeocarpus stipularis Blume | Elaeocarpaceae | 2 | 1 | 1 | 12 | 2 | 8 | 3 | 1 | |||||||||||
| 52 | Elaeocarpus tectorius Poir. | Elaeocarpaceae | 2 | 1 | 3 | 2 | 1 | 29 | 8 | 3 | 2 | 3 | 7 | 2 | 8 | ||||||
| 53 | Endospermum chinense Benth | Euphorbiaceae | 1 | 1 | |||||||||||||||||
| 54 | Engelhardtia serrata Blume | Juglandaceae | 1 | 1 | |||||||||||||||||
| 55 | Eurya japonica Thunb. | Pentaphylacaceae | 1 | 1 | 3 | 3 | 5 | 2 | |||||||||||||
| 56 | Eurya trichocarpa Korth. | Pentaphylacaceae | 4 | 1 | 1 | 3 | |||||||||||||||
| 57 | Eurycoma longifolia Jack | Simaroubaceae | 1 | ||||||||||||||||||
| 58 | Fagraea fragrans Roxb. ex Carey & Wall. | Gentianaceae | 3 | 18 | 41 | 1 | 3 | ||||||||||||||
| 59 | Ficus drupacea Thunb. | Moraceae | 1 | 1 | |||||||||||||||||
| 60 | Ficus fulva Reinw. | Moraceae | 1 | 3 | 30 | 1 | |||||||||||||||
| 61 | Ficus hispida L. f. | Moraceae | 2 | ||||||||||||||||||
| 62 | Garcinia cochinchinensis (Lour.) Choisy | Clusiaceae | 2 | 2 | 2 | 2 | 5 | ||||||||||||||
| 63 | Garcinia fusca Pierre | Clusiaceae | 6 | 4 | 8 | 12 | 3 | 7 | |||||||||||||
| 64 | Garcinia oblongifolia Champ. ex Benth. | Clusiaceae | 1 | 2 | 1 | 2 | 1 | 2 | 8 | 9 | |||||||||||
| 65 | Gardenia obtusifolia Roxb. ex Hook.f. | Rubiaceae | 3 | 2 | 2 | 1 | 3 | 2 | |||||||||||||
| 66 | Gironniera subaequalis Planch. | Cannabaceae | 5 | 3 | 1 | 2 | 8 | 2 | 2 | 8 | |||||||||||
| 67 | Glochidion zeylanicum (Gaertn.) A. Juss. | Phyllanthaceae | 1 | 5 | 3 | 11 | 4 | 4 | 18 | 3 | 1 | ||||||||||
| 68 | Gonocaryum lobbianum (Miers) Kurz | Cardiopteridaceae | 2 | 1 | 1 | ||||||||||||||||
| 69 | Grewia asiatica L. | Malvaceae | 1 | 3 | |||||||||||||||||
| 70 | Grewia tomentosa Juss. | Malvaceae | 1 | 1 | 1 | 2 | 1 | ||||||||||||||
| 71 | Helicia formosana Hemsl. | Proteaceae | 10 | 1 | 4 | ||||||||||||||||
| 72 | Hibiscus squamosus Hochr. | Malvaceae | 1 | 1 | 3 | 1 | |||||||||||||||
| 73 | Homalium cochinchinensis (Lour.) Druce | Salicaceae | 1 | 2 | |||||||||||||||||
| 74 | Horsfieldia amygdalina (Wall.) Warb. | Myristicaceae | 1 | ||||||||||||||||||
| 75 | Hymenodictyon orixense (Roxb.) Mabb. | Rubiaceae | 1 | ||||||||||||||||||
| 76 | Ilex godajam (Colebr. ex Wall.) Wall. ex Hook. f. | Aquifoliaceae | 1 | 6 | 1 | 11 | 1 | 2 | |||||||||||||
| 77 | Kibatalia laurifolia (Ridl.) Woodson | Apocynaceae | 6 | 1 | 1 | ||||||||||||||||
| 78 | Knema furfuracea (Hook. f. & Thomson) Warb. | Myristicaceae | 3 | 2 | 1 | 2 | 1 | 6 | 2 | 1 | 1 | 1 | |||||||||
| 79 | Knema globularia (Lam.) Warb. | Myristicaceae | 1 | ||||||||||||||||||
| 80 | Lagerstroemia micrantha Merr. | Lythraceae | 4 | 21 | 1 | 2 | 1 | ||||||||||||||
| 81 | Lannea coromandelica (Houtt.) Merr. | Anacardiaceae | 4 | 3 | 1 | ||||||||||||||||
| 82 | Lithocarpus braianensis A.Camus | Fagaceae | 1 | 3 | 2 | 1 | |||||||||||||||
| 83 | Lithocarpus dealbatus (Hook. f. & Thomson ex Miq.) Rehder | Fagaceae | 1 | 4 | 7 | 1 | 8 | 2 | 4 | 21 | 3 | 29 | 12 | 1 | 1 | 6 | 1 | 6 | |||
| 84 | Lithocarpus echinotholus (H.H. Hu) Chun & C.C. Huang | Fagaceae | 1 | 1 | 1 | ||||||||||||||||
| 85 | Lithocarpus gigantophyllus (Hickel & A. Camus) A. Camus | Fagaceae | 6 | 1 | 2 | 1 | 2 | 2 | 3 | ||||||||||||
| 86 | Lithocarpus truncatus (King ex Hook. f.) Rehder & E.H. Wilson | Fagaceae | 2 | 4 | 2 | 1 | 1 | 3 | 1 | 1 | 12 | 21 | 15 | 25 | |||||||
| 87 | Litsea auriculata S.S. Chien & W.C. Cheng | Lauraceae | 2 | ||||||||||||||||||
| 88 | Litsea balansae Lecomte | Lauraceae | 1 | 6 | 2 | 1 | 12 | 4 | 5 | 1 | 4 | 1 | 2 | 1 | 8 | ||||||
| 89 | Litsea cubeba (Lour.) Pers. | Lauraceae | 3 | ||||||||||||||||||
| 90 | Litsea elongata (Nees) Hook. f. | Lauraceae | 3 | ||||||||||||||||||
| 91 | Litsea glutinosa (Lour.) C.B. Rob. | Lauraceae | 1 | 2 | 6 | 9 | 1 | 2 | 1 | 2 | 1 | 5 | 3 | 4 | 8 | ||||||
| 92 | Litsea lancifolia (Roxb. ex Nees) Benth. & Hook. f. ex Fern.-Vill. | Lauraceae | 1 | 1 | |||||||||||||||||
| 93 | Litsea martabanica (Kurz) Hook. f. | Lauraceae | 2 | 1 | |||||||||||||||||
| 94 | Litsea monopetala (Roxb.) Pers. | Lauraceae | 3 | 3 | 1 | ||||||||||||||||
| 95 | Litsea rotundifolia Hemsl. | Lauraceae | 1 | 6 | 1 | 1 | 6 | 5 | |||||||||||||
| 96 | Macaranga trichocarpa (Zoll.) Müll.Arg. | Euphorbiaceae | 1 | 121 | 17 | 80 | 1 | 124 | 1 | 1 | 2 | 2 | 1 | 5 | |||||||
| 97 | Magnolia braianensis (Gagnep.) Figlar | Magnoliaceae | 1 | 5 | 9 | 6 | |||||||||||||||
| 98 | Magnolia mediocris (Dandy) Figlar | Magnoliaceae | 1 | 1 | 9 | 1 | 2 | ||||||||||||||
| 99 | Mallotus barbatus Müll.Arg. | Euphorbiaceae | 15 | 15 | 2 | 8 | 2 | 1 | 5 | 1 | |||||||||||
| 100 | Mallotus philippensis (Lam.) Müll. Arg. | Euphorbiaceae | 23 | 9 | 11 | 6 | 8 | 2 | 4 | 1 | 3 | ||||||||||
| 101 | Mangifera odorata Griff. | Anacardiaceae | 3 | 2 | |||||||||||||||||
| 102 | Melicope pteleifolia (Champ. ex Benth.) T.G. Hartley | Rutaceae | 1 | 4 | 1 | 6 | 2 | 2 | 1 | 1 | |||||||||||
| 103 | Memecylon scutellatum (Lour.) Hook. & Arn. | Melastomataceae | 1 | 1 | 2 | 1 | 1 | 1 | 3 | 2 | |||||||||||
| 104 | Millettia nigrescens Gagnep. | Fabaceae | 1 | 1 | |||||||||||||||||
| 105 | Neolitsea ellipsoidea C.K. Allen | Lauraceae | 14 | 1 | 10 | 3 | 2 | 3 | 2 | 1 | 16 | 16 | 6 | ||||||||
| 106 | Ocotea lancifolia (Schott) Mez | Lauraceae | 23 | 3 | 10 | 3 | 1 | 4 | 16 | 8 | 8 | 2 | 3 | 1 | 16 | 11 | 5 | 4 | |||
| 107 | Ormosia sumatrana (Miq.) Prain | Fabaceae | 3 | 1 | 1 | 3 | |||||||||||||||
| 108 | Parinari anamensis Hance | Chrysobalanaceae | 4 | ||||||||||||||||||
| 109 | Peltophorum dasyrrhachis (Miq.) Kurz | Fabaceae | 1 | 1 | |||||||||||||||||
| 110 | Phoebe angustifolia Meisn. | Lauraceae | 12 | 2 | 9 | 20 | 27 | 101 | 9 | 14 | 12 | 10 | 2 | 13 | 2 | 7 | 12 | ||||
| 111 | Phoebe macrocarpa C.Y. Wu | Lauraceae | 4 | 8 | 3 | 1 | 1 | ||||||||||||||
| 112 | Phyllanthus reticulatus Poir. | Phyllanthaceae | 2 | ||||||||||||||||||
| 113 | Polyalthia cerasoides (Roxb.) Benth. & Hook. f. ex Bedd. | Annonaceae | 3 | 1 | 3 | 3 | 1 | 1 | 9 | 1 | 11 | 5 | |||||||||
| 114 | Premna mollissima Roth | Lamiaceae | 1 | 1 | |||||||||||||||||
| 115 | Prunus arborea (Blume) Kalkman | Rosaceae | 1 | 2 | 2 | 1 | 3 | 3 | 1 | ||||||||||||
| 116 | Prunus phaeosticta (Hance) Maxim. | Rosaceae | 11 | 18 | 7 | 2 | |||||||||||||||
| 117 | Psydrax dicoccos Gaertn. | Rubiaceae | 1 | ||||||||||||||||||
| 118 | Pterospermum heterophyllum Hance | Malvaceae | 2 | 3 | 1 | ||||||||||||||||
| 119 | Radermachera hainanensis Merr. | Bignoniaceae | 6 | 1 | 1 | 1 | 2 | 1 | 1 | 1 | |||||||||||
| 120 | Randia aculeata L. | Rubiaceae | 1 | 1 | 2 | ||||||||||||||||
| 121 | Rhodoleia championii Hook. f. | Hamamelidaceae | 5 | 4 | 1 | 44 | 5 | 75 | 2 | 2 | |||||||||||
| 122 | Schefflera heptaphylla (L.) Frodin | Araliaceae | 1 | 5 | 1 | 1 | 3 | 1 | 4 | 3 | 1 | 5 | 2 | 5 | |||||||
| 123 | Schima wallichii (DC.) Korth. | Theaceae | 20 | 4 | 14 | 3 | 1 | 11 | 16 | 13 | |||||||||||
| 124 | Stereospermum annamense Dop | Bignoniaceae | 1 | 1 | |||||||||||||||||
| 125 | Styrax tonkinensis (Pierre) Craib ex Hartwich | Styracaceae | 2 | 5 | 24 | 4 | 4 | 1 | 12 | 1 | 22 | 14 | 4 | ||||||||
| 126 | Syzygium chunianum Merr. & L.M. Perry | Myrtaceae | 10 | 2 | 16 | 3 | 45 | 3 | 3 | 4 | 3 | 15 | 8 | 18 | |||||||
| 127 | Syzygium cumini (L.) Skeels | Myrtaceae | 10 | 3 | |||||||||||||||||
| 128 | Syzygium lanceolatum (Lam.) Wight & Arn. | Myrtaceae | 3 | 2 | 13 | 5 | 1 | 31 | 9 | 3 | 3 | 14 | 3 | 5 | 6 | 7 | 23 | 44 | 31 | ||
| 129 | Syzygium levinei (Merr.) Merr. & L.M. Perry | Myrtaceae | 8 | 3 | 9 | 8 | 5 | ||||||||||||||
| 130 | Terminalia bellirica (Gaertn.) Roxb. | Combretaceae | 1 | ||||||||||||||||||
| 131 | Toona sureni (Blume) Merr. | Meliaceae | 1 | 1 | 2 | ||||||||||||||||
| 132 | Trema orientalis (L.) Blume | Cannabaceae | 1 | 8 | 64 | 20 | 1 | 6 | |||||||||||||
| 133 | Trevesia palmata (Roxb. ex Lindl.) Vis. | Araliaceae | 1 | 1 | |||||||||||||||||
| 134 | Triadica cochinchinensis Lour. | Euphorbiaceae | 10 | 3 | 1 | 2 | 2 | 4 | 2 | 6 | 5 | 6 | |||||||||
| 135 | Vitex pinnata L. | Lamiaceae | 1 | 1 | 1 | 1 | 1 | ||||||||||||||
| 136 | Walsura pinnata Hassk. | Meliaceae | 2 | 3 | 3 | 5 | 2 | 3 | 1 | 1 | 10 | 20 | 7 | 12 | |||||||
| 137 | Wendlandia paniculata (Roxb.) DC. | Rubiaceae | 6 | 29 | 9 | 1 | 2 | 43 | 11 | 12 | 1 | ||||||||||
| 138 | Xylopia vielana Pierre | Annonaceae | 1 | 2 | 11 | 8 | 14 | 5 | 1 | ||||||||||||
References
- Asner, G.P.; Knapp, D.E.; Broadbent, E.N.; Oliveira, P.J.; Keller, M.; Silva, J.N. Selective logging in the Brazilian Amazon. Science 2005, 310, 480–482. [Google Scholar] [CrossRef] [PubMed]
- Wright, S.J. Tropical forests in a changing environment. Trends Ecol. Evol. 2005, 20, 553–560. [Google Scholar] [CrossRef] [PubMed]
- Satdichanh, M.; Ma, H.; Yan, K.; Dossa, G.G.; Winowiecki, L.; Vågen, T.G.; Gassner, A.; Xu, J.; Harrison, R.D. Phylogenetic diversity correlated with above-ground biomass production during forest succession: Evidence from tropical forests in Southeast Asia. J. Ecol. 2019, 107, 1419–1432. [Google Scholar] [CrossRef]
- Balmford, A. Extinction filters and current resilience: The significance of past selection pressures for conservation biology. Trends Ecol. Evol. 1996, 11, 193–196. [Google Scholar] [CrossRef]
- Santos, B.A.; Arroyo-Rodríguez, V.; Moreno, C.E.; Tabarelli, M. Edge-related loss of tree phylogenetic diversity in the severely fragmented Brazilian Atlantic forest. PLoS ONE 2010, 5, e12625. [Google Scholar] [CrossRef] [Green Version]
- Ouyang, S.; Xiang, W.; Wang, X.; Zeng, Y.; Lei, P.; Deng, X.; Peng, C. Significant effects of biodiversity on forest biomass during the succession of subtropical forest in south China. For. Ecol. Manag. 2016, 372, 291–302. [Google Scholar] [CrossRef]
- Santo-Silva, E.E.; Santos, B.A.; Arroyo-Rodríguez, V.; Melo, F.P.; Faria, D.; Cazetta, E.; Mariano-Neto, E.; Hernández-Ruedas, M.A.; Tabarelli, M. Phylogenetic dimension of tree communities reveals high conservation value of disturbed tropical rain forests. Divers. Distrib. 2018, 24, 776–790. [Google Scholar] [CrossRef] [Green Version]
- Lasky, J.R.; Uriarte, M.; Boukili, V.K.; Erickson, D.L.; John Kress, W.; Chazdon, R.L. The relationship between tree biodiversity and biomass dynamics changes with tropical forest succession. Ecol. Lett. 2014, 17, 1158–1167. [Google Scholar] [CrossRef] [PubMed]
- Tucker, C.M.; Cadotte, M.W.; Carvalho, S.B.; Davies, T.J.; Ferrier, S.; Fritz, S.A.; Grenyer, R.; Helmus, M.R.; Jin, L.S.; Mooers, A.O. A guide to phylogenetic metrics for conservation, community ecology and macroecology. Biol. Rev. 2017, 92, 698–715. [Google Scholar] [CrossRef]
- Gravel, D.; Bell, T.; Barbera, C.; Combe, M.; Pommier, T.; Mouquet, N. Phylogenetic constraints on ecosystem functioning. Nat. Commun. 2012, 3, 1–6. [Google Scholar] [CrossRef] [Green Version]
- Cadotte, M.W. Phylogenetic diversity–ecosystem function relationships are insensitive to phylogenetic edge lengths. Funct. Ecol. 2015, 29, 718–723. [Google Scholar] [CrossRef] [Green Version]
- Venail, P.; Gross, K.; Oakley, T.H.; Narwani, A.; Allan, E.; Flombaum, P.; Isbell, F.; Joshi, J.; Reich, P.B.; Tilman, D. Species richness, but not phylogenetic diversity, influences community biomass production and temporal stability in a re-examination of 16 grassland biodiversity studies. Funct. Ecol. 2015, 29, 615–626. [Google Scholar] [CrossRef] [Green Version]
- Davies, T.J.; Urban, M.C.; Rayfield, B.; Cadotte, M.W.; Peres-Neto, P.R. Deconstructing the relationships between phylogenetic diversity and ecology: A case study on ecosystem functioning. Ecology 2016, 97, 2212–2222. [Google Scholar] [CrossRef] [PubMed]
- Potter, K.M.; Woodall, C.M. Does biodiversity make a difference? Relationships between species richness, evolutionary diversity, and aboveground live tree biomass across US forests. For. Ecol. Manag. 2014, 321, 117–129. [Google Scholar] [CrossRef] [Green Version]
- Rozendaal, D.M.; Chazdon, R.L. Demographic drivers of tree biomass change during secondary succession in northeastern Costa Rica. Ecol. Appl. 2015, 25, 506–516. [Google Scholar] [CrossRef]
- Swenson, N.G.; Erickson, D.L.; Mi, X.; Bourg, N.A.; Forero-Montaña, J.; Ge, X.; Howe, R.; Lake, J.K.; Liu, X.; Ma, K. Phylogenetic and functional alpha and beta diversity in temperate and tropical tree communities. Ecology 2012, 93, S112–S125. [Google Scholar] [CrossRef] [Green Version]
- Chazdon, R. Second Growth. (Intergovernmental Panel on Climate Change, Ed.), Climate Change 2013—The Physical Science Basis; University of Chicago Press: Chicago, IL, USA, 2014; Volume 53. [Google Scholar]
- Giehl, E.L.; Jarenkow, J.A. Disturbance and stress gradients result in distinct taxonomic, functional and phylogenetic diversity patterns in a subtropical riparian tree community. J. Veg. Sci. 2015, 26, 889–901. [Google Scholar] [CrossRef]
- Helmus, M.R.; Keller, W.; Paterson, M.J.; Yan, N.D.; Cannon, C.H.; Rusak, J.A. Communities contain closely related species during ecosystem disturbance. Ecol. Lett. 2010, 13, 162–174. [Google Scholar] [CrossRef]
- Burns, J.H.; Strauss, S.Y. More closely related species are more ecologically similar in an experimental test. Proc. Natl. Acad. Sci. USA 2011, 108, 5302–5307. [Google Scholar] [CrossRef] [Green Version]
- Maire, V.; Gross, N.; Börger, L.; Proulx, R.; Wirth, C.D.S.; Pontes, L.; Soussana, J.F.; Louault, F. Habitat filtering and niche differentiation jointly explain species relative abundance within grassland communities along fertility and disturbance gradients. New Phytol. 2012, 196, 497–509. [Google Scholar]
- Purschke, O.; Schmid, B.C.; Sykes, M.T.; Poschlod, P.; Michalski, S.G.; Durka, W.; Kühn, I.; Winter, M.; Prentice, H.C. Contrasting changes in taxonomic, phylogenetic and functional diversity during a long-term succession: Insights into assembly processes. J. Ecol. 2013, 101, 857–866. [Google Scholar] [CrossRef]
- Mi, X.; Swenson, N.G.; Jia, Q.; Rao, M.; Feng, G.; Ren, H.; Bebber, D.P.; Ma, K. Stochastic assembly in a subtropical forest chronosequence: Evidence from contrasting changes of species, phylogenetic and functional dissimilarity over succession. Sci. Rep. 2016, 6, 32596. [Google Scholar] [CrossRef] [PubMed]
- Zhu, Z.-X.; Nizamani, M.M.; Sahu, S.K.; Kunasingam, A.; Wang, H.F. Tree abundance, richness, and phylogenetic diversity along an elevation gradient in the tropical forest of Diaoluo Mountain in Hainan, China. Acta Oecol. 2019, 101, 103481. [Google Scholar] [CrossRef]
- Monge-González, M.L.; Craven, D.; Krömer, T.; Castillo-Campos, G.; Hernández-Sánchez, A.; Guzmán-Jacob, V.; Guerrero-Ramírez, N.; Kreft, H. Response of tree diversity and community composition to forest use intensity along a tropical elevational gradient. Appl. Veg. Sci. 2020, 23, 69–79. [Google Scholar] [CrossRef]
- Chave, J.; Réjou-Méchain, M.; Búrquez, A.; Chidumayo, E.; Colgan, M.S.; Delitti, W.B.; Duque, A.; Eid, T.; Fearnside, P.M.; Goodman, R.C. Improved allometric models to estimate the aboveground biomass of tropical trees. Glob. Chang. Biol. 2014, 20, 3177–3190. [Google Scholar] [CrossRef]
- Con, T.V.; Thang, N.T.; Khiem, C.C.; Quy, T.H.; Lam, V.T.; van Do, T.; Sato, T. Relationship between aboveground biomass and measures of structure and species diversity in tropical forests of Vietnam. For. Ecol. Manag. 2013, 310, 213–218. [Google Scholar] [CrossRef]
- Huy, B.; Kralicek, K.; Poudel, K.P.; Phuong, V.T.; Van Khoa, P.; Hung, N.D.; Temesgen, H. Allometric equations for estimating tree aboveground biomass in evergreen broadleaf forests of Viet Nam. For. Ecol. Manag. 2016, 382, 193–205. [Google Scholar] [CrossRef]
- Nam, V.T.; van Kuijk, M.; Anten, N.P. Allometric equations for aboveground and belowground biomass estimations in an evergreen forest in Vietnam. PLoS ONE 2016, 11, e0156827. [Google Scholar] [CrossRef]
- Do, T.V.; Sato, T.; Dai Hai, V.; Thang, N.T.; Binh, N.T.; Son, N.H.; Van Thuyet, D.; van Thang, H.; Hung, T.T.; van Con, T. Aboveground biomass and tree species diversity along altitudinal gradient in Central Highland, Vietnam. Trop. Ecol. 2017, 58, 95–104. [Google Scholar]
- Kralicek, K.; Huy, B.; Poudel, K.P.; Temesgen, H.; Salas, C. Simultaneous estimation of above-and below-ground biomass in tropical forests of Viet Nam. For. Ecol. Manag. 2017, 390, 147–156. [Google Scholar] [CrossRef]
- Baker, T.R.; Phillips, O.L.; Malhi, Y.; Almeida, S.; Arroyo, L.; Di Fiore, A.; Erwin, T.; Killeen, T.J.; Laurance, S.G.; Laurance, W.F. Variation in wood density determines spatial patterns in Amazonian forest biomass. Glob. Change Biol. 2004, 10, 545–562. [Google Scholar] [CrossRef]
- Magurran, A.E. Ecological Diversity and Its Measurement; Princeton University Press: Princeton, NJ, USA, 1988. [Google Scholar]
- Simpson, E.H. Measurement of diversity. Nature 1949, 163, 688. [Google Scholar] [CrossRef]
- Heip, C.H.; Herman, P.M.; Soetaert, K. Indices of diversity and evenness. Oceanis 1998, 24, 61–88. [Google Scholar]
- Fisher, R.A.; Corbet, A.S.; Williams, C.B. The relation between the number of species and the number of individuals in a random sample of an animal population. J. Anim. Ecol. 1943, 12, 42–58. [Google Scholar] [CrossRef]
- Condit, R.; Hubbell, S.P.; Lafrankie, J.V.; Sukumar, R.; Manokaran, N.; Foster, R.B.; Ashton, P.S. Species-area and species-individual relationships for tropical trees: A comparison of three 50-ha plots. J. Ecol. 1996, 84, 549–562. [Google Scholar] [CrossRef] [Green Version]
- Harper, D.A. Numerical Palaeobiology: Computer-Based Modelling and Analysis of Fossils and Their Distributions; John Wiley & Sons Inc.: Chichester, UK, 1999. [Google Scholar]
- Prodan, M. Messung der Waldbestande; Sauerlander’s Verlag: Frankfurt/M, Germany, 1951; Volume 26. [Google Scholar]
- Boyle, B.; Hopkins, N.; Lu, Z.; Garay, J.A.R.; Mozzherin, D.; Rees, T.; Matasci, N.; Narro, M.L.; Piel, W.H.; Mckay, S.J. The taxonomic name resolution service: An online tool for automated standardization of plant names. BMC Bioinform. 2013, 14, 16. [Google Scholar] [CrossRef] [Green Version]
- Gastauer, M.; Meira Neto, J.A.A. Updated angiosperm family tree for analyzing phylogenetic diversity and community structure. Acta Bot. Bras. 2017, 31, 191–198. [Google Scholar] [CrossRef] [Green Version]
- Webb, C.O.; Ackerly, D.D.; McPeek, M.A.; Donoghue, M.J. Phylogenies and community ecology. Annu. Rev. Ecol. Syst. 2002, 33, 475–505. [Google Scholar] [CrossRef] [Green Version]
- Webb, C.; Ackerly, D.; Kembel, S. Phylocom: Software for the Analysis of Phylogenetic Community Structure and Character Evolution, with Phylomatic and Ecoevolve, 2011. User’s Manual, Version, 4. Available online: https://phylodiversity.net/phylocom/ (accessed on 5 October 2020).
- Bell, C.D.; Soltis, D.E.; Soltis, P.S. The age and diversification of the angiosperms re-revisited. Am. J. Bot. 2010, 97, 1296–1303. [Google Scholar] [CrossRef]
- Webb, C.O.; Ackerly, D.D.; Kembel, S.W. Phylocom: Software for the analysis of phylogenetic community structure and trait evolution. Bioinformatics 2008, 24, 2098–2100. [Google Scholar] [CrossRef] [Green Version]
- Faith, D.P. Conservation evaluation and phylogenetic diversity. Biol. Conserv. 1992, 61, 1–10. [Google Scholar] [CrossRef]
- Champely, S.; Chessel, D. Measuring biological diversity using Euclidean metrics. Environ. Ecol. Stat. 2002, 9, 167–177. [Google Scholar] [CrossRef]
- Oksanen, J. Vegan: An Introduction to Ordination. Available online: http://cran.r-project.org/web/packages/vegan/vignettes/introvegan (accessed on 5 October 2020).
- Ouyang, S.; Xiang, W.; Wang, X.; Xiao, W.; Chen, L.; Li, S.; Sun, H.; Deng, X.; Forrester, D.I.; Zeng, L. Effects of stand age, richness and density on productivity in subtropical forests in China. J. Ecol. 2019, 107, 2266–2277. [Google Scholar] [CrossRef]
- Poorter, L.; van der Sande, M.T.; Thompson, J.; Arets, E.J.; Alarcón, A.; Álvarez-Sánchez, J.; Ascarrunz, N.; Balvanera, P.; Barajas-Guzmán, G.; Boit, A. Diversity enhances carbon storage in tropical forests. Glob. Ecol. Biogeogr. 2015, 24, 1314–1328. [Google Scholar] [CrossRef]
- Liang, J.; Crowther, T.W.; Picard, N.; Wiser, S.; Zhou, M.; Alberti, G.; Schulze, E.D.; McGuire, A.D.; Bozzato, F.; Pretzsch, H. Positive biodiversity-productivity relationship predominant in global forests. Science 2016, 354, aaf8957. [Google Scholar] [CrossRef] [PubMed] [Green Version]
- Cadotte, M.W.; Dinnage, R.; Tilman, D. Phylogenetic diversity promotes ecosystem stability. Ecology 2012, 93, S223–S233. [Google Scholar]
- Larkin, D.J.; Hipp, A.L.; Kattge, J.; Prescott, W.; Tonietto, R.K.; Jacobi, S.K.; Bowles, M.L. Phylogenetic measures of plant communities show long-term change and impacts of fire management in tallgrass prairie remnants. J. Appl. Ecol. 2015, 52, 1638–1648. [Google Scholar] [CrossRef] [Green Version]
- Steudel, B.; Hallmann, C.; Lorenz, M.; Abrahamczyk, S.; Prinz, K.; Herrfurth, C.; Feussner, I.; Martini, J.W.; Kessler, M. Contrasting biodiversity—ecosystem functioning relationships in phylogenetic and functional diversity. New Phytol. 2016, 212, 409–420. [Google Scholar] [CrossRef] [Green Version]
- Yuan, Z.; Wang, S.; Gazol, A.; Mellard, J.; Lin, F.; Ye, J.; Hao, Z.; Wang, X.; Loreau, M. Multiple metrics of diversity have different effects on temperate forest functioning over succession. Oecologia 2016, 182, 1175–1185. [Google Scholar] [CrossRef] [Green Version]
- Dalmaso, C.A.; Marques, M.C.; Higuchi, P.; Zwiener, V.P.; Marques, R. Spatial and temporal structure of diversity and demographic dynamics along a successional gradient of tropical forests in southern Brazil. Ecol. Evol. 2020, 10, 3164–3177. [Google Scholar] [CrossRef]
- Cadotte, M.W.; Davies, T.J.; Peres-Neto, P.R. Why phylogenies do not always predict ecological differences. Ecol. Monogr. 2017, 87. [Google Scholar] [CrossRef]
- Marshall, A.R.; Willcock, S.; Platts, P.; Lovett, J.C.; Balmford, A.; Burgess, N.D.; Latham, J.; Munishi, P.; Salter, R.; Shirima, D. Measuring and modelling above-ground carbon and tree allometry along a tropical elevation gradient. Biol. Conserv. 2012, 154, 20–33. [Google Scholar] [CrossRef]
- Dossa, G.G.; Paudel, E.; Fujinuma, J.; Yu, H.; Chutipong, W.; Zhang, Y.; Paz, S.; Harrison, R.D. Factors determining forest diversity and biomass on a tropical volcano, Mt. Rinjani, Lombok, Indonesia. PLoS ONE 2013, 8, e67720. [Google Scholar] [CrossRef] [PubMed]
- Girardin, C.A.; Farfan-Rios, W.; Garcia, K.; Feeley, K.J.; Jørgensen, P.M.; Murakami, A.A.; Cayola Pérez, L.; Seidel, R.; Paniagua, N.; Fuentes Claros, A.F. Spatial patterns of above-ground structure, biomass and composition in a network of six Andean elevation transects. Plant. Ecol. Divers. 2014, 7, 161–171. [Google Scholar] [CrossRef]
- Culmsee, H.; Leuschner, C. Consistent patterns of elevational change in tree taxonomic and phylogenetic diversity across Malesian mountain forests. J. Biogeogr. 2013, 40, 1997–2010. [Google Scholar] [CrossRef]


| Structural Properties | SF1 | SF2 | OGF |
|---|---|---|---|
| Stand structure | |||
| Density of trees | 199.00 ± 54.38 a | 274.22 ± 76.53 a | 262.00 ± 30.61 a |
| Basal area (m2) | 2.24 ± 1.05 a | 4.29 ± 2.00 a | 9.49 ± 1.46 b |
| Volume (m3) | 8.92 ± 5.26 a | 21.16 ± 12.79 a | 80.55 ± 16.99 b |
| AGB (Mg) | 8.24 ± 4.71 a | 21.37 ± 13.53 a | 76.88 ± 15.82 b |
| Species diversity | |||
| Species richness | 35.00 ± 8.07 a | 41.78 ± 10.21 ab | 52.75 ± 1.71 b |
| Shannon’s index | 2.77 ± 0.51 a | 2.84 ± 0.52 ab | 3.46 ± 0.01 b |
| Margalef’s index | 6.47 ± 1.47 a | 7.28 ± 1.64 ab | 9.31 ± 0.46 b |
| Fisher’s alpha | 12.95 ± 4.26 a | 14.04 ± 4.35 ab | 20.08 ± 2.21 b |
| Simpson’s index | 0.87 ± 0.11 a | 0.86 ± 0.15 a | 0.95 ± 0.01 a |
| Plot | Elevation (m) | MPD | NRI | NTI | PD | Dp | MNTD | ||||||
|---|---|---|---|---|---|---|---|---|---|---|---|---|---|
| SF1-Early succession | |||||||||||||
| 1 | 1117 | 25.6 | 25.17 ± 0.90 b | 0.04 | 0.502 ± 0.91 ab | 1.24 | 0.29 ± 0.82 b | 239 | 249.17 ± 45.78 a | 10.84 | 10.75 ± 1.33 a | 5.78 | 6.64 ± 1.28 b |
| 2 | 1092 | 24.45 | 0.97 | −0.24 | 200 | 8.97 | 8.13 | ||||||
| 3 | 1152 | 25.88 | −0.33 | 1.4 | 320 | 11.94 | 4.91 | ||||||
| 4 | 1199 | 24.79 | 1.28 | −0.57 | 289 | 9.29 | 6.05 | ||||||
| 5 | 668 | 26.3 | −0.53 | −0.13 | 219 | 12.07 | 7.97 | ||||||
| 6 | 718 | 23.97 | 1.7 | 0.04 | 228 | 11.4 | 7.03 | ||||||
| SF2 -Early-mid succession | |||||||||||||
| 1 | 1300 | 16.23 | 22.69 ± 3.02 ab | 1.3 | 0.02 ± 0.98 b | 0.81 | 0.07 ± 1.62 b | 187 | 256.56 ± 35.85 a | 8.12 | 11.35 ± 1.51 a | 5.47 | 6.43 ± 2.09 ab |
| 2 | 984 | 21.76 | 0.72 | 1.61 | 253 | 10.88 | 4.67 | ||||||
| 3 | 1013 | 23.14 | 0.2 | 0.7 | 306 | 11.57 | 5.09 | ||||||
| 4 | 970 | 24.66 | −1.12 | 0.97 | 273 | 12.33 | 4.72 | ||||||
| 5 | 704 | 25.05 | −0.69 | 1.8 | 280 | 12.53 | 4.53 | ||||||
| 6 | 676 | 23.44 | −0.13 | 0.61 | 223 | 11.72 | 6.33 | ||||||
| 7 | 738 | 26.03 | −1.42 | −2.97 | 266 | 13.01 | 9.72 | ||||||
| 8 | 732 | 23.98 | 0.04 | −1.34 | 282 | 11.99 | 7.71 | ||||||
| 9 | 657 | 19.97 | 1.3 | −1.51 | 239 | 9.98 | 9.62 | ||||||
| OGF-Old-growth | |||||||||||||
| 1 | 1002 | 22.39 | 21.85 ± 0.63 a | 1.13 | 1.44 ± 0.48 a | 1.23 | 1.75 ± 0.61 a | 287 | 278.75 ± 6.65 a | 11.19 | 10.92 ± 0.32 a | 5.29 | 4.84 ± 0.53 a |
| 2 | 1061 | 22.19 | 1.27 | 1.39 | 280 | 11.09 | 5.25 | ||||||
| 3 | 1285 | 21.93 | 1.22 | 1.81 | 277 | 10.96 | 4.64 | ||||||
| 4 | 1417 | 20.93 | 2.16 | 2.6 | 271 | 10.46 | 4.17 | ||||||
Publisher’s Note: MDPI stays neutral with regard to jurisdictional claims in published maps and institutional affiliations. |
© 2020 by the authors. Licensee MDPI, Basel, Switzerland. This article is an open access article distributed under the terms and conditions of the Creative Commons Attribution (CC BY) license (http://creativecommons.org/licenses/by/4.0/).
Share and Cite
Hai, N.H.; Tan, N.T.; Bao, T.Q.; Petritan, A.M.; Mai, T.H.; Hien, C.T.T.; Anh, P.T.; Hung, V.T.; Petritan, I.C. Changes in Community Composition of Tropical Evergreen Forests during Succession in Ta Dung National Park, Central Highlands of Vietnam. Forests 2020, 11, 1358. https://doi.org/10.3390/f11121358
Hai NH, Tan NT, Bao TQ, Petritan AM, Mai TH, Hien CTT, Anh PT, Hung VT, Petritan IC. Changes in Community Composition of Tropical Evergreen Forests during Succession in Ta Dung National Park, Central Highlands of Vietnam. Forests. 2020; 11(12):1358. https://doi.org/10.3390/f11121358
Chicago/Turabian StyleHai, Nguyen Hong, Nguyen Thanh Tan, Tran Quang Bao, Any Mary Petritan, Trinh Hien Mai, Cao Thi Thu Hien, Pham The Anh, Vu Tien Hung, and Ion Catalin Petritan. 2020. "Changes in Community Composition of Tropical Evergreen Forests during Succession in Ta Dung National Park, Central Highlands of Vietnam" Forests 11, no. 12: 1358. https://doi.org/10.3390/f11121358