Article

A Tree Ring Measurement Method Based on Error Correction in Digital Image of Stem Analysis Disk

1
School of Information Science and Technology, Beijing Forestry University, Beijing 100083, China
2
Engineering Research Center for Forestry-Oriented Intelligent Information Processing, National Forestry and Grassland Administration, Beijing 100083, China
3
Forestry Information Research Institute, Beijing Forestry University, Beijing 100083, China
*
Author to whom correspondence should be addressed.
Forests 2021, 12(4), 464; https://doi.org/10.3390/f12040464
Submission received: 6 March 2021 / Revised: 31 March 2021 / Accepted: 8 April 2021 / Published: 10 April 2021
(This article belongs to the Special Issue Modelling of Forests Structure and Biomass Distribution)

Abstract

:
Stem analysis is an essential aspect in forestry investigation and forest management, as it is a primary method to study the growth law of trees. Stem analysis requires measuring the width and number of tree rings to ensure the accurate measurement, expand applicable tree species, and reduce operation cost. This study explores the use of Open Source Computer Vision Library (Open CV) to measure the ring radius of analytic wood disk digital images, and establish a regression equation of ring radius based on image geometric distortion correction. Here, a digital camera was used to photograph the stem disks’ tree rings to obtain digital images. The images were preprocessed with Open CV to measure the disk’s annual ring radius. The error correction model based on the least-square polynomial fitting method was established for digital image geometric distortion correction. Finally, a regression equation for tree ring radius based on the error correction model was established. Through the above steps, click the intersection point between the radius line and each ring to get the pixel distance from the ring to the pith, then the size of ring radius can be calculated by the regression equation of ring radius. The study’s method was used to measure the digital image of the Chinese fir stem disk and compare it with the actual value. The results showed that the maximum error of this method was 0.15 cm, the average error was 0.04 cm, and the average detection accuracy reached 99.34%, which met the requirements for measuring the tree ring radius by stem disk analysis. This method is simple, accurate, and suitable for coniferous and broad-leaved species, which allows researchers to analyze tree ring radius measurement, and is of great significance for analyzing the tree growth process.

1. Introduction

The tree growth model is an important method to evaluate tree growth, where stem analysis data is necessary to establish the model. We can obtain the change rules and growth process of factors such as diameter at breast height (DBH), tree height, form factor, volumes, and growth rate of the tree species. During stem analysis, the stem disk measurement is one of the primary steps, and the accurate number and spacing of tree rings are the basis to determine the growth of trees. Stem analysis is of great significance for the monitoring of forest tree growth state [1]. Annual rings are the archives of trees used to study forest yield, basal area increment, forest patch dynamics, insect outbreak, and tree growth response to climate change [2,3,4,5,6]. Tree ring width measurement mainly includes the microscope method [7], the image method [8], the ray method [9], and the tree ring analysis system based on a combination of the microscope and image methods [10]. Traditional tree ring identification methods mainly rely on manual measurement, which is laborious, inefficient, and prone to fatigue error [11]. When tree ring images are too complex, auxiliary methods should be used, like a magnifying glass to observe the surface after soaking, and chemical staining. In most cases, the rings are not uniformly round, and the irregular extension of the ring boundaries results in boundaries of different years not being parallel to each other. At the same time, the long-term preservation of disks requires an appropriate storage environment. If the disks are stored for a long time, dehydration will cause the wood to become dry, crack, and deform, increasing errors in second measurements. Moreover, the transportation of large volume disks is difficult.
The tree ring measuring instrument is the main hardware tool for measuring the width of tree rings. At present, the mature tree ring measurement tools include the LINTAB tree ring analyzer, Win DENDRO tree ring measurement and analysis system, and LA-S plant image analysis system. The LINTAB tree ring analyzer measures the width of the year ring by a rotating wheel control and high-resolution microscope positioning technology, but the working environment of the equipment is required to be high, and the application scope of the instrument is limited [12]. The Win DENDRO tree ring measurement and analysis system uses a high-quality graphic scanning system to measure the tree ring width. However, drilling cores or stem disks are collected from the field, dried, and polished before being used for analysis, which is complicated and expensive [13]. The LA-S plant image analysis system has the function of automatically judging tree rings and width, and can automatically generate analysis chronology, but its purchase cost is relatively high, so it is not a universal tool [14].
Since the 1980s, computer vision technology has been applied to tree ring detection [15,16], and it is efficient to use digital images for stem analysis [17]. Thetford et al. [18] applied image processing method to tree chronology research to measure tree ring width in 1991. A scanner or camera performs the tree ring image acquisition. The former can ensure that the image is not deformed, but is limited by conditions. The latter is deformed but flexible and more practical. In cases where the disk is too large, the working environment is in the field, the tree rings measured are cultural relics, or the rings measured are fragile (decayed wood, charcoal wood), the scanning method cannot be used for imaging; therefore, many scholars use digital cameras to take pictures and use image technology for tree ring data collection. For example, the R software package measurement method is used to measure tree ring width [19], but the measurement operation needs to be carried out in the command-line interface. The tree ring’s width can also be measured by AutoCAD [20], but this method requires AutoCAD to read the disk image and the operation is complex. ArcGIS platform can be used to measure the tree ring, but software would need to be purchased separately [21]. The feature detection algorithm is used to determine the feature points of the tree ring images, and then analyze the number and width of tree rings [22]. However, the extracted tree rings are prone to lack of rings, which cannot meet stem-disk ring-width measurement requirements. For conifer samples, using the edge detection algorithm of machine learning is better, but this method is only applicable to samples with good visibility. For species with complex anatomical structures, such as broadleaf species, the transition between early and late wood is not obvious, making automatic identification difficult. Simultaneously, a scar on a tree ring can easily be mistaken for a part of the ring, affecting the width measurement of the tree ring interval [23]. In addition, some scholars designed image processing software to measure the ring width. Newton [24] developed a stem analysis data processing and calculation algorithm and related software suite, but the system is only suitable for stem analysis of temperate and northern forest species. Luo [25] used PCI Geomatica 8.2 remote sensing image processing software to measure the tree ring width of the sample core, and corrects the width of the inclined tree ring according to the principle of a trigonometric function, but the improvement of the accuracy after correction is uncertain. Levanic [26] developed a tree age image acquisition system named ATRICS that also requires expensive software.
There are many studies on ring width measurement using images, but they rarely consider the geometric distortion of image edge, so the measurement accuracy needs to be improved. Therefore, we explore to improve the measurement accuracy by establishing an error correction model to correct the geometric distortion of the image edge, and use the Open Source Computer Vision Library (Open CV) to design a set of tree ring image preprocessing algorithms and tree ring width measurement algorithm. Open CV is an open-source computer vision software, which is light and efficient [27], and can reduce the cost of measurement. In this study, based on the digital images of tree rings taken by digital cameras, an error correction model is established to correct the geometric distortion of image edge. Then, the regression equation of ring radius based on error correction is established to realize the measurement of ring radius. Finally, the image measurement system of tree ring is developed based on this research method. The method of measuring ring radius in this study is simple and easy, with high accuracy. It is suitable for coniferous tree species with a clear ring, and broad-leaved tree species with unclear early and late wood boundaries. When there is no professional ring measuring instrument or software, this method has more practical significance, and improves the overall processing level of trunk analysis data.

2. Materials and Methods

2.1. Experimental Data and Stem Disk Shooting

2.1.1. Data Sources

The experimental data sets of this study are self-drawn imitation data and Chinese fir stem disk data, as shown in Figure 1.
Three drawn stem analysis disk samples were measured in four directions to measure the width, and the average values of the measurements in four directions were used to represent the real data set, to verify the research techniques and methods in this paper. The data are shown in Table 1.
The data of Chinese fir stem disks was used as the test data set, and two stem disks were selected. Three people measured the annual ring radius data. The average value measured by three people was used to compare the accuracy with the subsequent tree ring radius identification data, to verify the practicability of the technical method in this study. The data are shown in Table 2.

2.1.2. Image Data Acquisition

The four measurement directions of east, west, south, and north and the segment number are marked on the disk. A measuring direction line and a vertical line of the measuring direction were drawn on the stem analysis disk with a pencil through the pith. A ruler was placed along the measuring direction line to measure the radius line, to locate the zero in the pith. A digital camera or mobile phone was used to take images of the imitation stem analysis disk and Chinese fir stem analysis disk. The shooting diagram is shown in Figure 2, and the images were stored in JPG format. When shooting, the lens surface was kept parallel to the stem disk’s surface, ensuring that the measurement path was parallel to the upper and lower edges of the viewfinder window. Scattered light provided the best lighting condition.

2.1.3. Image Preprocessing and Pixel Coordinate Extraction

Digital images of the annual rings of the disks are RGB (Red-Green-Blue) images taken under natural conditions, the images easily influenced by natural light and shadow, collected images tend to have much noise. In the ring parameters measurement, ring boundary characteristics are the important basis of ring radius measurement. Therefore, it is necessary to preprocess the original image to eliminate the image’s uneven background illumination and highlight the core of the pith and ring boundary. Image preprocessing steps are as follows, the detailed parameter description of the function can be found in Appendix A.
Step 1. Call the function cvtColor ( ) to gray the read image. Image grayscale processing can retain the image information of interest, reduce the size of the image effectively, and provide the save and process conveniently for the processor.
Step 2. Call the function threshold ( ) to binary the read image. It can reduce the amount of image data and highlight the contour of tree ring.
Step 3. Call the function resize ( ) to scale the tree ring image according to any specified value to improve the click accuracy of the tree ring.
The measurement path is created after image preprocessing from the pith to the bark, locating the point position of the annual ring. The user can select the measuring path with the mouse, then drag and click the corresponding tree-ring point. The system collects the pixel coordinates of the measured points and saves the results in the data table for that disk. The measurement procedure calls the function circle ( ) to obtain coordinates and display them, the detailed parameter description of the function can be found in Appendix A.

2.2. Research Methods

In this study, the measurement of the ring radius is to use the pixel coordinate capture function of the Open CV to realize the conversion between the pixel coordinate and the ring width, and indirectly realize the measurement of the ring radius. However, when the image is taken, the geometric position of the image edge will be distorted. Therefore, the geometric distortion correction model is established in this study, and then the geometric distortion correction model is introduced into the regression model of ring radius to improve the measurement accuracy of ring radius. The experimental process is shown in Figure 3. The specific steps are as follows:
Step 1. Preprocessed the original digital image. The preprocessing process includes image graying and binary.
Step 2. Extract the pixel coordinates of annual rings, use pixel distance and actual distance to get the scale, measure the annual ring radius data of image.
Step 3. Establish the geometric distortion correction model by error value and the ring radius pixel distance.
Step 4. Establish the regression model of annual ring radius based on error correction and test its accuracy.

2.2.1. Calculate Ring Radius

The measuring scale was obtained from the pixel coordinate value and a ring radius with a true width, in accordance with the scale formula. The remaining annual ring radius of the analytic stem disk is obtained. The specific calculation principle is as follows: click on the digital image of pith o, the system records the coordinates of the pith core in the computer image coordinates ( x o ,   y o ), and then click the intersection point a between any growth ring on the analytic stem disk and the measurement path, get the coordinates ( x a ,   y a ) of the point in the computer image coordinates access to that point in computer image coordinates. Simultaneously, read the actual length R a from point o to point a on the scale. According to the two-point distance formula of computer image coordinates, the pixel distance d a between two-pixel points is obtained, and Equation (1) is used to calculate the pixel distance d a .
d a = ( x a x o ) 2 + ( y a y o ) 2
Click other tree rings on the digital image at the point b where they intersect with the measured path. The system obtains point b in the computer image coordinates ( x b , y b ), and automatically calculates d b . The actual radius of the tree ring at point b is R b . The scale formula is shown in Equation (2).
d a d b = R b R a
Substitute Equation (1) into Equation (2) and transform to obtain Equation (3).
R b = R a ( x b x o ) 2 + ( y b y o ) 2 ( x a x o ) 2 + ( y a y o ) 2
Click the remaining tree ring points in turn on the digital image to obtain tree ring point coordinates, and then the uncorrected tree ring radius number R b can be obtained.

2.2.2. Measurement Error Correction

In measuring tree ring radius, many error factors affect the measured value, including geometric distortion in image and the error when clicking on the measuring point. In this study, the disk image was enlarged to pixel level in the retractable window, so the error when clicking the measuring point has little influence on the accuracy and can be ignored. The shooting of the images was performed using the small hole imaging principle; its physical property makes the light in the optical center position in a straight line, but with the distance between the light and the axis of the optical center, the refraction effect caused by the lens is more obvious. This creates a lens distortion, which is more evident at the image edge [28,29]. Therefore, on the premise of ensuring that images were taken, and tree ring data obtained by clicking are in line with standard specifications as far as possible, the influence of the pixel distance from the ring to the pith on the geometric distortion error is analyzed.
In this study, error separation technology is adopted in the process of tree ring radius measurement, the error value is not measured in advance, eliminating it during the data processing. The limited samples’ measured values were stored in the computer, and the geometric distortion correction model is constructed by using the error values of sample points. That is, the error values are fitted into an error curve, according to which the measured values can be corrected. Then, the basic model and the error correction model are combined, and the prediction model of ring radius based on error correction is constructed through the correction function method. The correction function consists of the basic function and the error correction function, combined in any form. The expression is as Equation (4).
R ( x ) = f ( x ) u ( x )
In the Equation (4), R ( x ) is the correction function; f ( x ) is the basic equation; u ( x ) is the error correction function composed of correction variables, which can be in various functional forms; the symbol represents the operation mode, which can be addition, subtraction, multiplication, division, or some unstructured combination form.
The establishment of the prediction model of ring radius based on error correction mainly includes the following three steps.
Step 1: Determine the basic equation. The computer image pixel distance formula (Equation (1)) and scale formula (Equation (2)) are selected as the basic model.
Step 2: Establish the error correction function. The pixel distance to the pith will affect the error value, therefore, the error correction function u ( x ) is constructed with the pixel distance from the ring to the pith as the variable.
Step 3: Determine the combination form of basic function and error correction function. In this paper, the basic function and correction function are combined in an unstructured way to establish the ring radius’s regression equation based on error correction.

3. Results

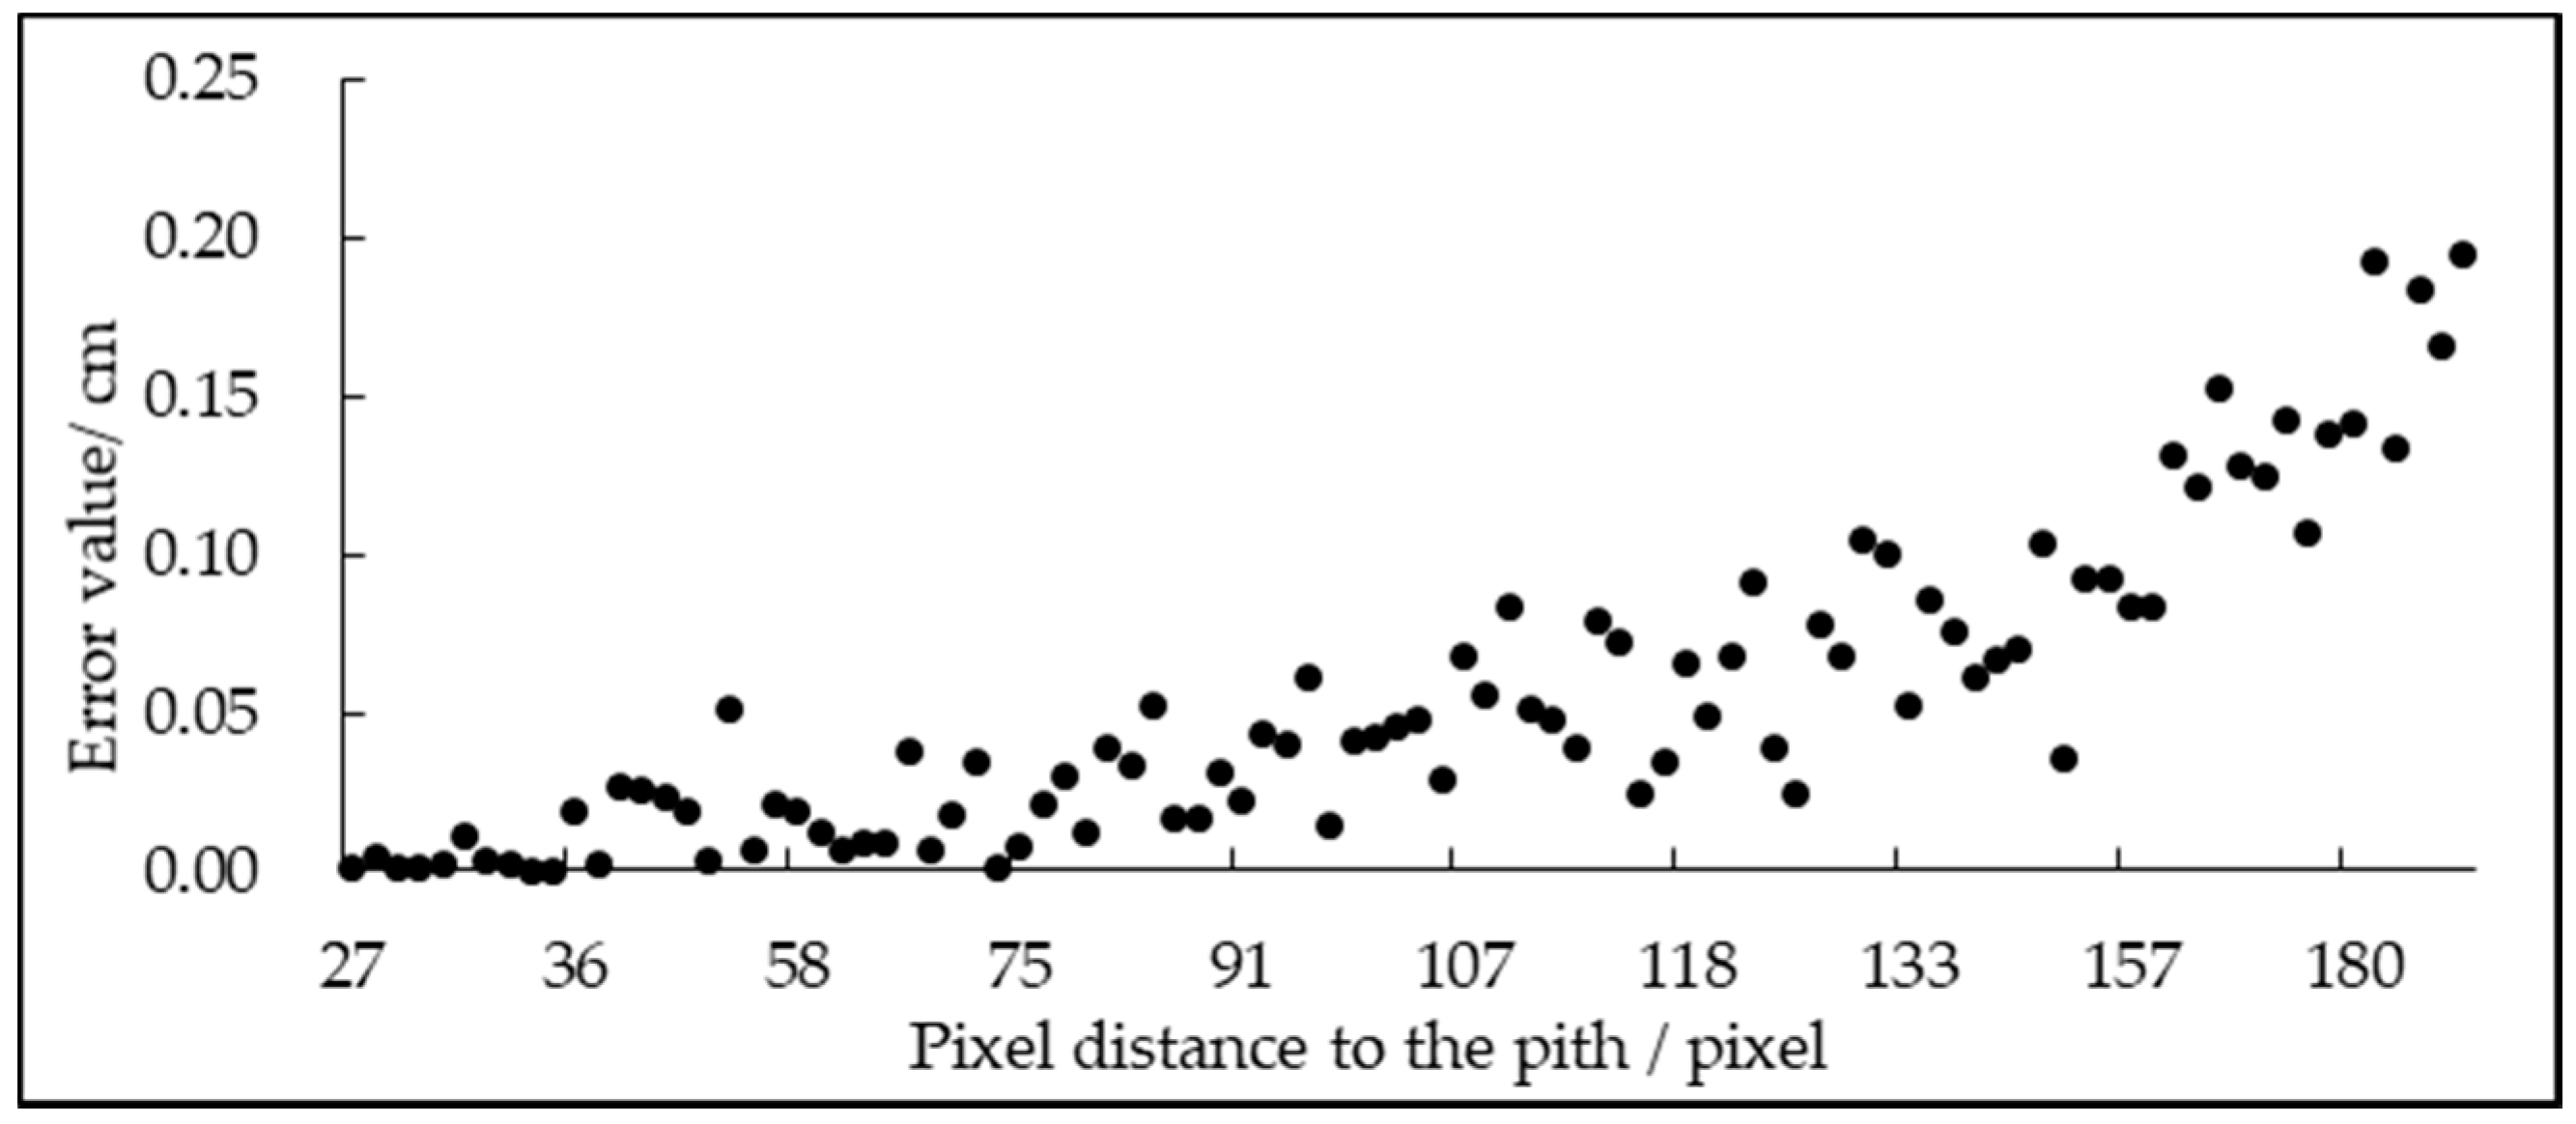
3.1. Obtain the Uncorrected Ring Radius

The coordinates of the intersection of the radius lines from the pith and the rings of each ring were recorded through the system window to extract the ring number and ring radius. The pixel distance is converted into the actual distance by scale calculation, the ring radius of each ring in four directions was obtained, and the measured results were compared with the ring radius measured by hand for verification. The measured data are shown in Table 3. In Table 3, to compare with the actual value, the measured value is rounded to two decimal places.

3.2. Geometric Distortion Correction Model

The tree ring radius value measured by the automatic tree ring radius measurement algorithm (measured value) and the tree ring radius value measured by hand (true value) were compared and verified. The difference between the measured value and true value is the error value, the measuring error u can be represented by Equation (5). Figure 4 shows the error distribution of the distance between different tree rings and the pith in the experimental measurement, and it can be seen in the unadjusted cases. The farther the ring is from the pith, the greater the measurement error is.
u = measured value − true value
According to the error terms’ distribution trend in Figure 4, the exponential regression and polynomial regression models to fit the error terms were compared and analyzed the fitting effects of the two models. The determination coefficient R2 was used to evaluate the fitting results of the model accuracy. The determination coefficient R2 reflected the confidence of the model fitting. The determination coefficient R2 is calculated by Equation (6).
R 2 = 1 i = 1 n ( y i y i ^ ) 2 i = 1 n ( y i y i ¯ ) 2 ( n 1 n p 1 )
In Equation (6), n is the number of independent variables, y i is the true value, y i ^ is the estimated value, and p is the number of independent variables.

3.2.1. Exponential Regression Model

The equation y = ae bx expresses the type of exponential curve, and the trend line is generated by log ( y ) = log ( a ) + bx . If y = log ( y ) and a = log ( a ) , we can straighten it to y = a + bx .
The pixel distance x and absolute error u(x) from the measurement point to the pith were used to establish a single-factor exponential curve regression model, as shown in Equation (7). In Equation (7), u(x) is the error value, x is the distance from the measurement point to the pith, and a and b are the correction model parameters.
u ( x ) = ae bx
The data scatter diagram after transformation is nonlinear, and the fitting effect after nonlinear regression is shown in Figure 5.
According to the least square method to estimate the model coefficients, the best estimator of a and b is a = −6.10064 and b = 0.02495. The goodness of fit R2 of this model is 0.6685, and the fitting effect is fair. Equation (8) of the exponential regression model is as follows.
u ( x ) = 0.00224 e 0.02495 x
After error correction with the exponential regression equation, the predicted value was compared with the real value to obtain the model residual diagram (Figure 6). The overall residual of the model fluctuates randomly around 0. In the ring close to the pith, the correction effect of the model is good, and the residual is distributed between (−0.05 cm, 0.05 cm). However, for the ring far away from the pith (the radius is more than 8 cm), the residual shows an increasing trend, indicating that the random error term may have heteroscedasticity.

3.2.2. Polynomial Regression Model

Polynomial geometric distortion correction model is adopted. According to the aberration theory, the influence of the high-order distortion coefficient on the distortion quantity is much smaller than that of the low-order distortion coefficient, so the high-order part is usually ignored. Too many geometric distortion coefficients will lead to too much calculation, and the calculation accuracy is not significantly improved. Therefore, only the first three radial distortion coefficients are considered in the geometric distortion model. The geometric distortion model is expressed as Equation (9). In Equation (9), u(x) is the error value, x is the distance from the measuring point to the pulp core, and α 0 , α 1 , and α 2 are the parameters of the correction model.
u ( x ) = α 0 + α 1 x + α 2 x 2
Under the condition of given measurement points, the fitting order of polynomial based on the least square method is too low, and the fitting effect is not ideal. However, when the fitting order is too high, the fitting curve swings a lot, and its coefficient matrix is ill-conditioned, with reduced reliability and complicated calculation. In this study, the least-square fitting polynomial was used to establish the error correction model, and the best-estimated value of   α 0 , α 1 , and α 2 was obtained as α 0 = −0.00797112, α 1 = 0.00017254, α 2 = 0.00000503. The fitting effect is shown in Figure 7.
The goodness of fit R2 of this model is 0.8649, and the polynomial regression model Equation (10) is as follows:
u ( x ) = 0.00797112 + 0.00017254 x + 0.00000503 x 2
The polynomial correction model was used to correct the measured values, and the predicted and the actual values were compared to obtain the model residual graph (Figure 8). The residual is significantly reduced after correction, and the overall residual fluctuates randomly around 0. The residual is uniformly distributed in the range of (−0.05 cm, 0.05 cm) as a whole, especially for the growth rings far away from the pith.
Through the above comparative study, we concluded that, compared with exponential regression model, polynomial regression model has better correction effect. However, the residual graph of polynomial regression model still has the problem of trumpet distribution, which indicates that the model may have heteroscedasticity. We tried to use weighted least square method to eliminate heteroscedasticity. The corrected residual is shown in Figure 9. Nevertheless, considering the evaluation accuracy and residual map of the model, the polynomial regression model after eliminating heteroscedasticity is used as the geometric correction model, and the regression equation of ring radius based on error correction is constructed.

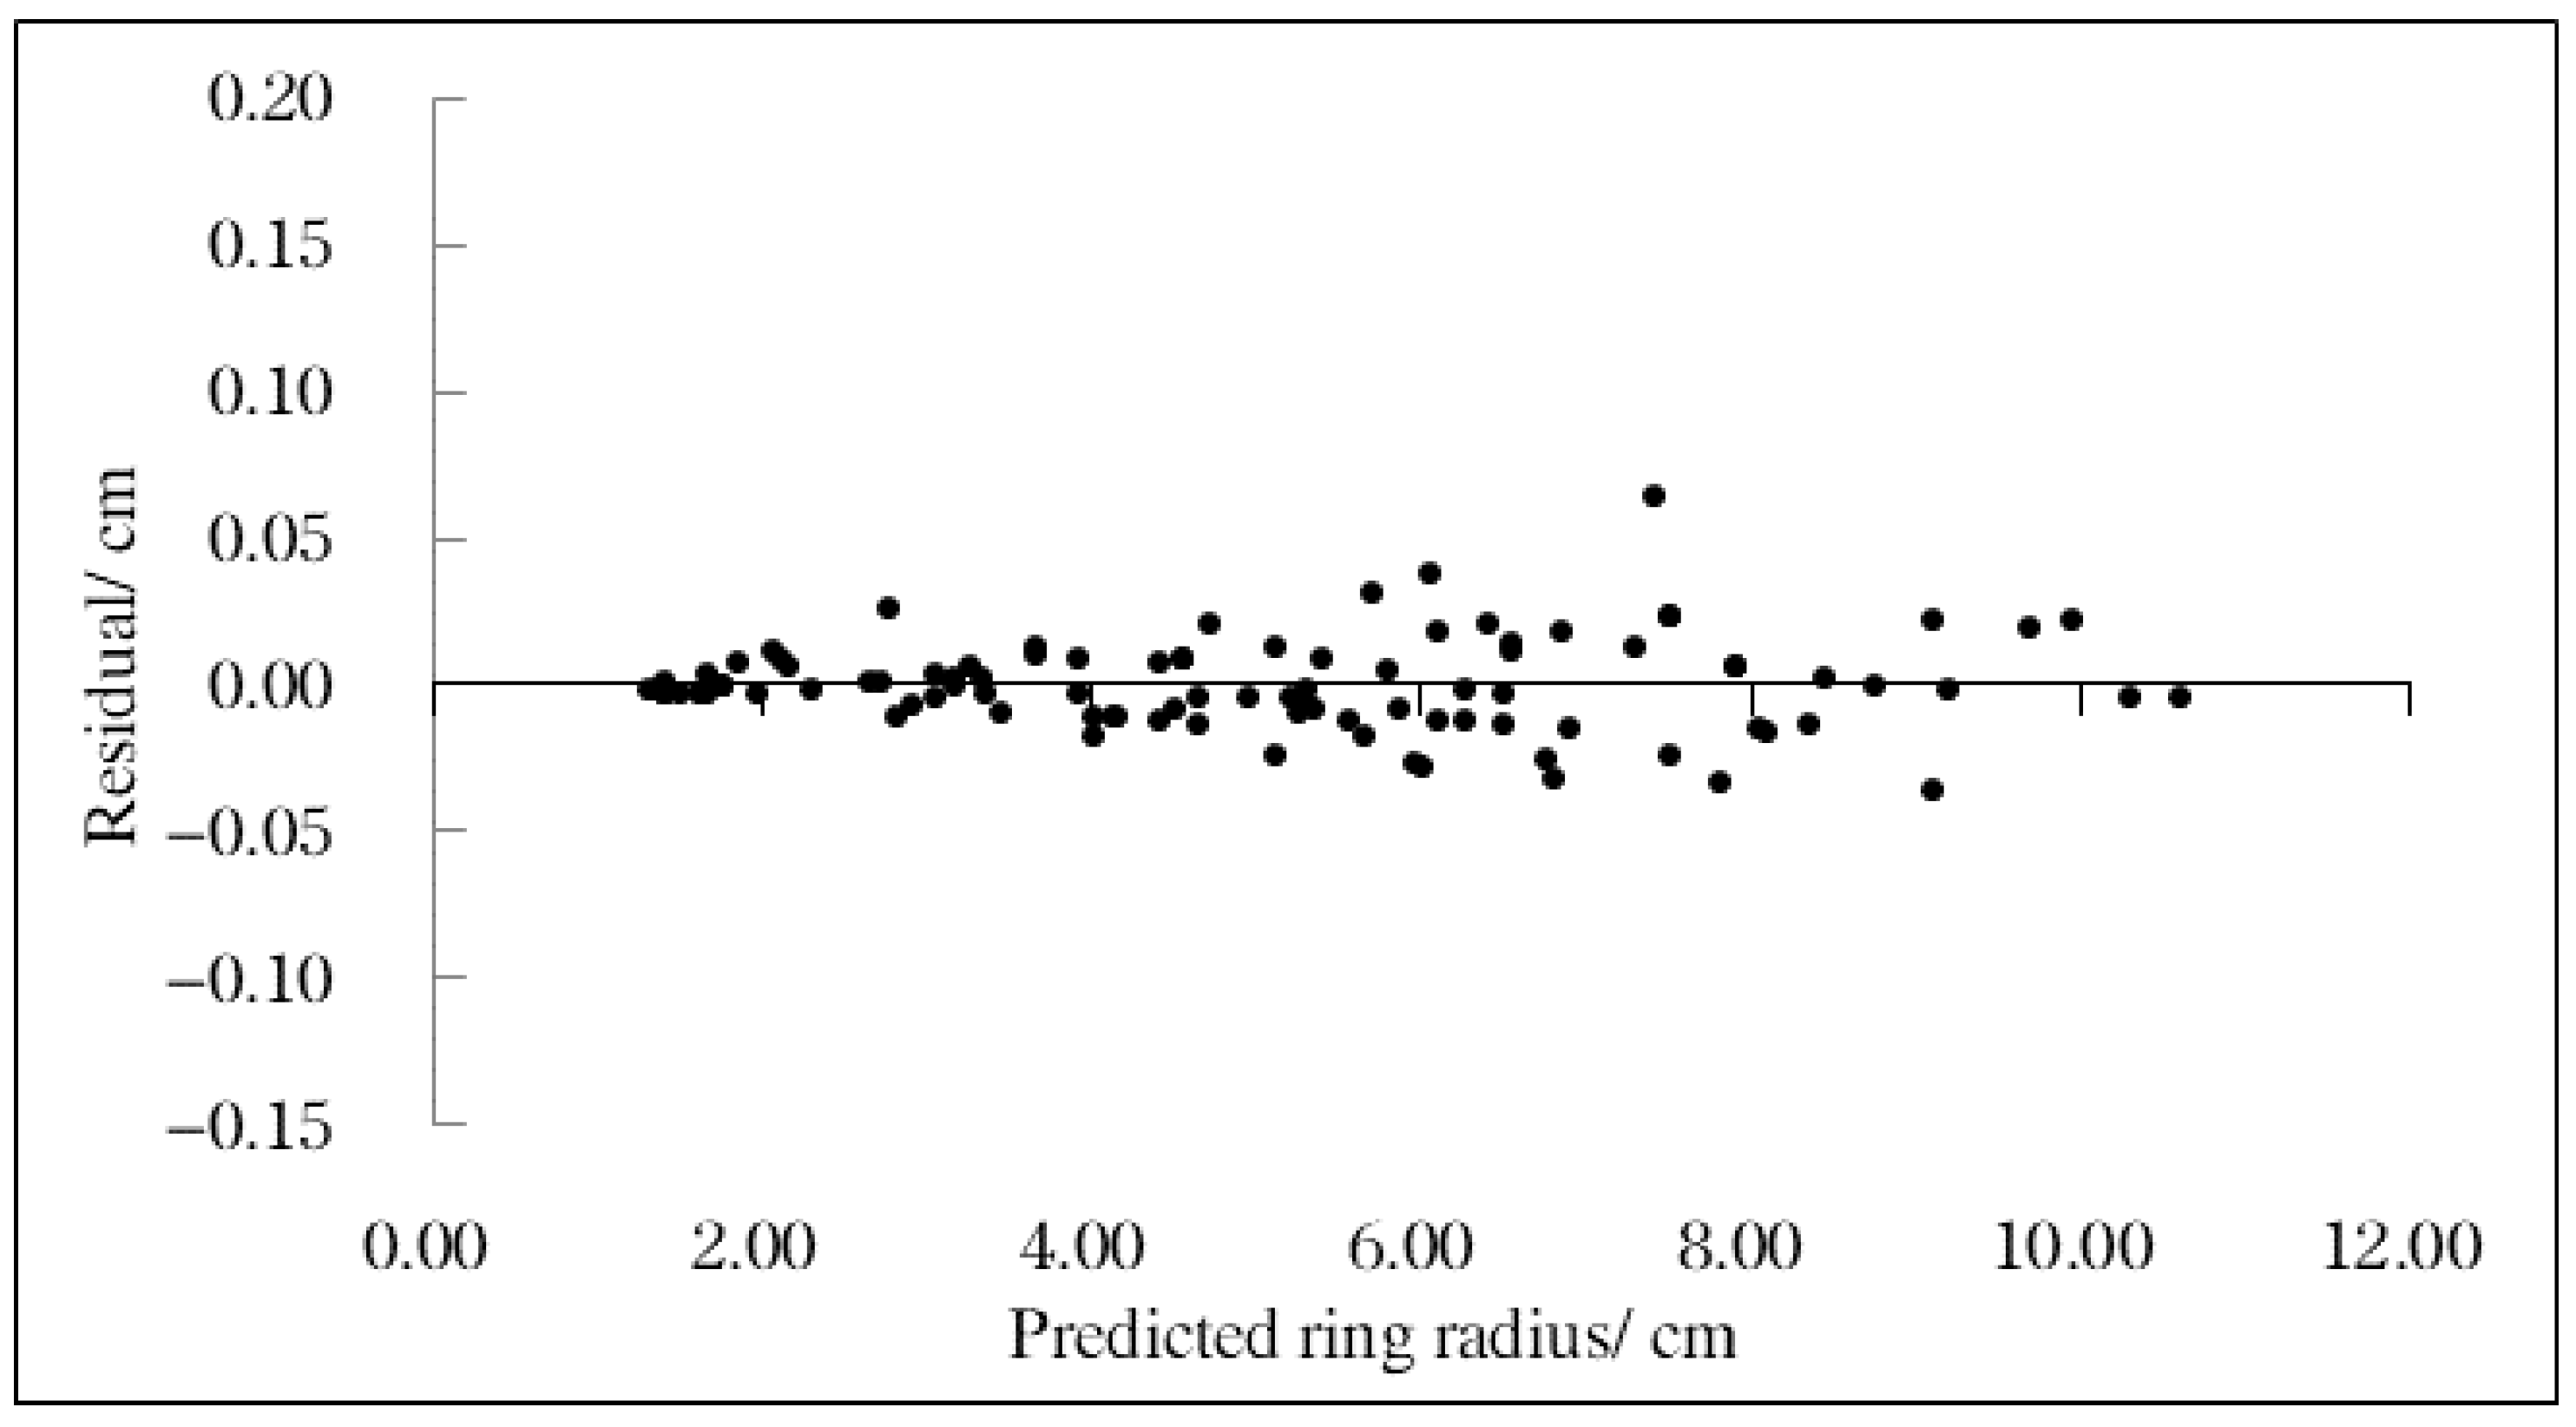
3.3. Comparative Analysis of Exponential Fitting and Polynomial Fitting Results

The exponential regression model and polynomial regression model were introduced into the tree ring radius extraction equation respectively, and the regression equation of measuring pixel distance and tree ring radius was established. The equation measures the tree ring radius, and the measurement error of the two models is compared and analyzed. In the regression equation of tree ring radius, R ( x ) is the tree-ring radius to be solved, x is the pixel distance from the measuring point of the system to the pith, d 1 is the true value of the ring radius of a circle known, and x 1 is the pixel distance between the ring of a circle known and the pith.
The exponential correction model was introduced into the tree ring radius extraction equation, and the tree ring radius regression equation based on the exponential correction model was obtained. The equation is expressed as Equation (11).
R ( x ) =   0.01076 + 1.00417 d 1 x 1 x + 0.00095 e 0.02495 x
The polynomial correction model was introduced into the tree ring radius extraction equation, and the regression equation of tree ring radius based on the polynomial correction model after eliminating heteroscedasticity was obtained. The equation is expressed as Equation (12).
R ( x ) =   0.042125 + 0.99283 d 1 x 1 x 0.0003471 x 0.00000226 x 2
Two tree ring radius regression equations were used to predict the tree ring radius, and the difference between the predicted value and the true value (Table 1) was taken as the error value. The error values of the two tree ring radius regression equations were compared, and the results are shown in Figure 10.
Results show that an effective regression equation of tree ring radius can be established by measuring the pixel distance of the point and the tree ring radius. Error-values using the polynomial correction model regression equation are lower than the calibration model based on the exponential regression equation. The ring radius regression equation based on the polynomial correction model after eliminating heteroscedasticity for the image geometric-distortion has a better correction effect.

3.4. Model Application Verification

To verify the availability and measurement accuracy of the tree ring radius regression equation measured by the polynomial correction model, this paper designed experiments for verification, and the obtained data are shown in Table 4.
It can be seen from Table 4 that the tree ring radius regression equation based on the polynomial correction model adopted in this paper can effectively correct the geometric distortion generated by the digital image and achieve a more accurate measurement of the tree ring radius of the analytic stem disk. The maximum error of tree ring radius measurement results obtained by using this regression model is 0.15 cm, the average error is 0.04 cm, and the average detection accuracy reaches 99.34%, which can meet the measurement requirements of analytic tree ring radius.

4. Discussion

4.1. Measurement Comparison with Mainstream Research Methods

Tree ring has been recognized as an essential means to study tree growth and climate change due to its accurate dating, strong continuity, high resolution, wide geographical distribution, and it is easy to obtain copies [30]. In 1980, the report and recommendations of the second International Conference on tree climate ring climatology pointed out that “many tree ring records responding to large changes in various climate parameters in most parts of the earth are better than any other alternative climate data that can be measured by year” [31]. Ring width is linked in the study of tree ring climatology and forest productivity, and its deviation directly affects the accuracy of the above measurement results.
In the past, we used images to measure ring width. Liu [32] used IMAGE1/AT image analysis system to obtain tree ring sample parameters, with a measurement accuracy of 97.7%. Xie [33] obtained a tree ring digital image with a scanner and automatically segmented it to obtain width value, the edge model of maximum mean gray difference is used to segment and calculate the ring width, and the measurement accuracy is 97.06%. Qi [34] proposed to use the FSDI method to measure the width of annual rings, the measurement process is based on Adobe Photoshop image processing function and Auto CAD precise query function, and the results show that this method’s accuracy is 94.33%. Xu [35] studied a method for measuring tree ring width based on impedance meter, and established a power function model for predicting tree ring width by using the waveform characteristics of impedance data. The model’s accuracy is 97%, and it needs to select living trees that grow well and have no obvious decay outside, so its application scope is limited. Ning [36] studied the semantic segmentation model of tree ring image based on the U-Net convolutional neural network, and the measurement accuracy was 97.68%. In this paper, the regression equation of ring radius based on the geometric distortion correction model is studied. When the digital image detection method is introduced into the measurement of ring radius, the measurement error caused by the edge distortion of ring image is corrected, and the prediction accuracy of the regression model of ring radius is improved to 99.34%, which makes the actual calculated data of ring radius more objective.

4.2. Analysis of Tree Species Suitable for the Model

The image detection method’s introduction into the measurement of tree ring parameters can solve manual measurement problems, such as heavy workload, and artificial random error. However, the tree rings of different tree species vary greatly, bringing great difficulties to the automatic detection of tree rings. In tree ring climatology research, tree species is mainly arbor, mainly coniferous tree species with a clear ring. On the contrary, using broad-leaved trees with an unclear boundary of early and late wood is relatively less. To explore a method of measuring ring width suitable for coniferous tree species and broad-leaved tree species simultaneously and ensure high measurement accuracy is particularly important. To explore regression equation’s applicability and accuracy of annual ring radius in broad-leaved tree species, we selected the analytical wood disc of Ulmus pumila L. and Zelkova serrata (Thunb.) Makino as the research objects. We took sample images of broad-leaved tree species, as shown in Figure 11.
The regression equation of ring radius of Ulmus pumila L. based on the correction model is obtained as Equation (13).
R ( x ) = 0.042125 + 0.014436 x 0.00000226 x 2
The regression equation of ring radius of Zelkova serrata (Thunb.) Makino based on the correction model is obtained as Equation (14).
R ( x ) = 0.042125 + 0.014024 x   0.00000226 x 2
The results show the regression model accuracy based on error correction is above 99%, the ring radius’s overall measurement accuracy meets the requirements. The regression model of ring radius based on error correction in this study is also applicable to broad-leaved tree species, and the measurement results and goodness of fit of the model are shown in Table 5.

5. Conclusions

In this study, based on the analysis of disk digital image, we used Open CV to measure the ring width, and established a regression model of ring radius based on error correction, which is a new exploration in the research of ring width measurement. We concluded that: (1) in the measurement of China fir analytic wood disk, the maximum measurement error was less than 0.15 cm, the average error was 0.04 cm, and the average detection accuracy was 99.34%, meeting the ring width measurement requirements; (2) when establishing the geometric distortion error correction model, the polynomial regression model (R2 = 0.8649) was better than the exponential regression model (R2 = 0.6685); (3) through the experiments in Ulmus pumila L. and Zelkova serrata (Thunb.) Makino, this method is applicable in the measurement of broad-leaved tree ring width.
Based on the above research, the stem analysis disk measurement and analysis software system were designed. The system can measure the disk digital image’s tree ring width and store the measured data and the basic information of the corresponding parse wood into a database. Also, all disk data of the analytical wood can be exported to Excel according to the number of the analytical stem. The main interface of the system is shown in Figure 12.

Author Contributions

Conceptualization, W.Z., T.Z., X.S. and B.W.; methodology, W.Z. and B.W.; software, W.Z., Z.M. and Y.T.; validation, W.Z.; formal analysis, W.Z.; investigation, W.Z., Z.M., Y.T.; data curation, W.Z.; writing—original draft preparation, W.Z.; writing—review and editing, W.Z., B.W., Z.M. and Y.T.; visualization, W.Z. All authors have read and agreed to the published version of the manuscript.

Funding

This study was funded by the Key National Research and Development Program of China (project no. 2017YFD0600906) and the Key National Research and Development Program of China (project no. 2012AA102003). The authors would also like to thank the reviewers for their comments, which were helpful in improving the manuscript.

Data Availability Statement

Not available.

Conflicts of Interest

The authors declare no conflict of interest.

Appendix A

In the chapter of image preprocessing and pixel coordinate extraction, the functions used are as follows. The important parameters of the function are described.
1. Grayscale function cvtColor ( ):
cvtColor (img, IMG, COLOR_BGR2GRAY);
Parameter description: img is the original image to be grayed; IMG is the output image after graying; COLOR_BGR2GRAY converts RGB format to grayscale image.
2. Binarization function threshold ( ):
threshold (img, IMG,0,255,THRESH_BINARY);
Parameter description: img is the original image without binarization; IMG is the output image after binarization; 0 represents the part less than the threshold, and the pixel gray value is set to 0; 255 represents the part larger than the threshold value, and the pixel gray value is set to 255; THRESH_BINARY represents the type of binarization operation for the threshold.
3. Image scaling function resize ( ):
resize (Input Array image, Output Array lines, Size dsize, double fx = 0, double fy = 0, int interpolation = INTER_LINEAR);
Parameter description: Input Array image is input image to be scaled; Output array lines is the output image after scaling; Size dsize is the size of the target image; double fx is the scale on the X axis; double fy is the scale on the Y axis; int interpolation is the way of interpolation, INTER_LINEAR r represents bilinear interpolation.
4. Function to get pixel coordinates cv2. circle ( ):
cv2. circle (img, (x, y), 1, (255, 0, 0), thickness = −1);
Parameter description: img is the input image; (x, y) indicates the center position of the circle; 1 represents the radius of the circle is 1; (255, 0, 0) represents the color of a circle according to BGR, blue = 255, green = 0, red = 0; thickness represents the thickness of the lines that make up a circle, thickness = −1 means to draw a solid circle.

References

  1. Xianyu, M. Forest Mensuration; China Forestry Publishing House: Beijing, China, 2006. [Google Scholar]
  2. Smith, D.C. Tree Rings and Climate. By HC Fritts, and Climates of the States: National Oceanic and Atmospheric Administration Narrative Summaries, and Maps for Each State; with Current Tables of Normals, 1941–1970, Means and Extremes to 1975, and Overview of State Climatologist Programs. For. Conserv. Hist. 1979, 23, 202–203. [Google Scholar]
  3. Tiwari, A.; Zexin, F.; Alistair, S.J.; Shufeng, L.; Zhekun, Z. Gradual expansion of moisture sensitive Abies spectabilis forest in the Trans-Himalayan zone of central Nepal associated with climate change. Dendrochronologia 2017, 41, 34–43. [Google Scholar] [CrossRef]
  4. Gaire, N.P.; Dhakal, Y.R.; Lekhak, H.C.; Bhuju, D.R.; Shah, S.K. Dynamics of Abies spectabilis in Relation to Climate Change at the Treeline Ecotone in Langtang National Park. Nepal J. Sci. Technol. 2012, 12, 220–229. [Google Scholar] [CrossRef] [Green Version]
  5. Baral, S.; Gaire, N.P.; Aryal, S.; Pandey, M.; Rayamajhi, S.; Vacik, H. Growth Ring Measurements of Shorea robusta Reveal Responses to Climatic Variation. Forests 2019, 10, 466. [Google Scholar] [CrossRef] [Green Version]
  6. Roibu, C.; Sfeclă, V.; Mursa, A.; Ionita, M.; Nagavciuc, V.; Chiriloaei, F.; Leșan, I.; Popa, I. The Climatic Response of Tree Ring Width Components of Ash (Fraxinus excelsior L.) and Common Oak (Quercus robur L.) from Eastern Europe. Forests 2020, 11, 600. [Google Scholar] [CrossRef]
  7. Weiwei, H.; Pedersen, N.B.; Fredriksson, M.; Thygesen, L.G. Annual Variations in Norway Spruce Xylem Studied Using Infrared Micro-spectroscopy. Forests 2019, 10, 1–11. [Google Scholar]
  8. Tinning, Z.; Youxiang, Q.; Runyang, S.; Wenlong, Z. New method of dendro-chronology based on R2V and AutoCAD and its application in the mountainous area of northern Hebei province. Sci. Soil Water Conserv. 2005, 3, 87–91. [Google Scholar]
  9. Tingkui, W.; Ziqiang, L.; Yaoming, W. Non-destructive Detection of Annual Rings in Wood by X-ray Transmissive Technique. J. North-East For. Univ. 1987, 2, 97–101. [Google Scholar]
  10. Ruili, N.; Haijiang, L.; Chengyi, Z.; Jinling, L. Tree ring analysis of the dynamic variation of air pollution in Beijing. Environ. Monito Ring China 2001, 4, 20–24. [Google Scholar]
  11. Woning, W.; Tao, W. Progress of Dating Methods of Tree Age. J. Green Sci. Technol. 2013, 7, 152–155. [Google Scholar]
  12. Vannoppen, A.; Maes, S.; Kint, V.; de Mil, T.; Ponette, Q.; van Acker, J.; van den Bulcke, J.; Verheyen, K.; Muys, B. Using X-ray CT based tree-ring width data for tree growth trend analysis. Dendrochronologia 2017, 44, 66–75. [Google Scholar] [CrossRef]
  13. Vladimír, Š.; Michal, B.; Bohdan, K.; Jozef, P. Indices of tree competition in dense spruces stand originated from natural regeneration. For. J. 2013, 59, 172–179. [Google Scholar]
  14. Shen, W. LA-S plant image analyzer system. Sci. Agric. Sin. 2018, 51, 3620. [Google Scholar]
  15. Mcmillin, C.W. Application of Automatic Image-Analysis to Wood Science. Wood Sci. 1982, 14, 97–105. [Google Scholar]
  16. Soille, P.; Misson, L. Tree Ring Area Measurements Using Morphological Image Analysis; NRC Research Press: Ottawa, ON, Canada, 2001; p. 31. [Google Scholar]
  17. Ji, C. The Application of Technology of Image Processing and Statistic Approach in Automatic Tree Rings Analysis System. Master’s Thesis, Xidian University, Xi’an, China, 2013. [Google Scholar]
  18. Thetford, R.D.; D’Arrigo, R.D.; Jacoby, G.C. An image analysis system for determining densitometric and ring-width time series. Can. J. For. Res. 1991, 21, 1544–1549. [Google Scholar] [CrossRef]
  19. Jingning, S.; Jian, Y.; Hua, Z.; Shengwang, M.; Qijing, L. Application of R software on tree ring width measurement. Chin. J. Ecol. 2017, 36, 2052–2059. [Google Scholar]
  20. Xingwen, B.; Luo, X.; Shubin, L. The Application of AutoCAD in Digital Photos of Stem Analysis Disk. For. Resour. Manag. 2013, 2, 145–148. [Google Scholar]
  21. Shengwang, M.; Guang, Z.; Jian, Y.; Hua, Z.; Qijing, L. Measuring stem disk rings using GIS tools. Chin. J. Ecol. 2017, 36, 1746–1751. [Google Scholar]
  22. Mingyuan, J.; Mingyuan, Z. Research on Tree Ring Analysis System Based on Java. Nat. Sci. J. Harbin Norm. Univ. 2019, 35, 89–93. [Google Scholar]
  23. Yanfeng, W.; Hailin, F.; Xiaochen, D.; Yiming, F. Improving the tree-age measurement by enhancing the tree-ring image with bilateral filter. J. For. Eng. 2017, 2, 109–114. [Google Scholar]
  24. Newton, P.F. Examining Naturogenic Processes and Anthropogenic Influences on Tree Growth and Development via Stem Analysis: Data Processing and Computational Analytics. Forests 2019, 10, 1058. [Google Scholar] [CrossRef] [Green Version]
  25. Chunwang, L.; Jian, Y.; Qijing, L.; Qianqian, X.; Guochun, Z. Automation for measuring tree ring width and its correction based on photogrammetry. Chin. J. Ecol. 2016, 35, 2845–2851. [Google Scholar]
  26. Levanič. Atrics—A New System for Image Acquisition in Dendrochronology. Tree-Ring Res. 2007, 63, 117–122. [Google Scholar] [CrossRef] [Green Version]
  27. Yuanwei, T.; Tsungwui, H.; Chunglong, P.; Rongching, W. Motion Control System of Unmanned Railcars Based on Image Recognition. Appl. Syst. Innov. 2019, 2, 9. [Google Scholar] [CrossRef] [Green Version]
  28. Chengzhi, S.; Enguo, W.; Jiangtao, H.; Guohua, C.; Hongji, X. Distortion correction for images in planar metrology. Opt. Precis. Eng. 2011, 19, 161–167. [Google Scholar] [CrossRef]
  29. Honglu, X.; Baoguo, W. A method of stem analysis with polynomial fit by diameter line. Chin. J. Ecol. 2017, 36, 854–861. [Google Scholar]
  30. Xiangding, W.; Xuemei, S. Status of dendroclimatological study and its prospects in China. Adv. Earth Sci. 1996, 2, 44–51. [Google Scholar]
  31. Hughes, M.K.; Kelly, P.M.; Pilcher, J.R.; LaMarche, V.C., Jr. Climate from Tree Rings; Cambridge University Press: Cambridge, UK, 1982. [Google Scholar]
  32. Hongbin, L.; Xiangding, W.; Xuemei, S. A preliminary study on climate change research during historical time using image analysis of tree ring in kangding area, sichuan province. Geogr. Res. 1996, 2, 4–51. [Google Scholar]
  33. Kunqing, X.; Zhiyao, L. Method of scanning image analysis for tree-ring research and its application in environmental change. Quat. Sci. 2000, 1, 259–269. [Google Scholar]
  34. Youxiang, Q. The Research on Digital Images Photogrammetry of Several Ecological Parameters. Ph.D. Thesis, Beijing Forestry University, Beijing, China, 2009. [Google Scholar]
  35. Qun, X.; Huadong, X.; Qizhe, L.; Zhixing, C. A Method of Identifying Ring Width of Standing Tree by Using Resistograph Detector. For. Eng. 2019, 35, 32–35, 40. [Google Scholar]
  36. Xiao, N.; Peng, Z. Segmentation algorithm of annual ring image based on U-Net convolution network. Chin. J. Ecol. 2019, 38, 1580–1588. [Google Scholar]
Figure 1. Digital images of stem disk. (a) Digital images of self-drawn imitation stem disk; (b) digital image of Chinese fir stem disk.
Forests 12 00464 g001
Figure 2. Shooting schematic of stem analysis disk digital image.
Forests 12 00464 g002
Figure 3. Flow chart of the experiment. N means the image has not been preprocessed; Y indicates that the image has been preprocessed.
Forests 12 00464 g003
Figure 4. The distribution of error values corresponding to the pixel distance from the tree ring to the pith.
Forests 12 00464 g004
Figure 5. The fitting results of the exponential regression model.
Forests 12 00464 g005
Figure 6. Residual graph of the exponential regression correction model.
Forests 12 00464 g006
Figure 7. Fitting results of the polynomial regression model.
Forests 12 00464 g007
Figure 8. Residual diagram of the polynomial regression correction model.
Forests 12 00464 g008
Figure 9. Residual diagram of polynomial regression correction model after heteroscedasticity correction.
Forests 12 00464 g009
Figure 10. Comparison of the error values of the measured results based on exponential tree ring radius regression equation and polynomial regression equations after eliminating heteroscedasticity. The “u1” indicates that the error value of the tree-ring radius regression equation (Equation (11)) fitted by the exponential correction model, and “u2” indicates the error value of the tree-ring radius regression equation (Equation (12)) fitted by the polynomial correction model.
Forests 12 00464 g010
Figure 11. Sample images of broad-leaved tree species. (a) Digital image of Ulmus pumila L. analytic wood disk; (b) the enlarged picture in the system of the box in the Figure 11a; (c) digital image of Zelkova serrata (Thunb.) Makino analytic wood disk; (d) the enlarged picture in the system of the box in the Figure 11c.
Forests 12 00464 g011
Figure 12. The main interface of the measurement and analysis system of the stem analysis disk.
Forests 12 00464 g012
Table 1. Radius measurement dataset of self-drawn imitation stem disks. SNO is the sample number of the imitation stem disk. RNO is the number of the growth ring (the number starts at the heart of the pith). D1, D2, D3, and D4 represent four measurement directions. RV is the value of the radius of the ring. MV is the mean of the ring radius in the four directions.
SNORNORV (cm)MV (cm)
D1D2D3D4
111.401.301.301.401.35
22.152.052.052.152.10
33.103.303.053.353.20
44.254.054.004.304.15
55.104.704.655.154.90
65.755.355.255.855.55
76.556.206.056.706.38
87.657.207.307.557.43
211.401.801.801.401.60
21.853.402.752.502.63
33.333.683.553.453.50
44.234.714.554.384.47
55.105.125.155.075.11
65.755.825.805.775.79
76.556.806.806.556.68
87.958.028.007.977.99
98.809.489.408.889.14
311.751.651.651.751.70
23.202.802.803.203.00
34.353.803.654.504.08
45.254.904.855.305.08
56.105.675.706.075.89
67.456.756.807.407.10
78.808.458.458.808.63
Table 2. Radius measurement dataset of Chinese fir stem disk. DNO is the number of the sample of the stem disk. DH is the height of the stem disk at the trunk; RNO is the number of the growth ring (starting at the pith); D1, D2, D3, and D4 represent four measurement directions; RV is the value of the radius of the ring; MV is the mean of the ring radius in the four directions.
DNODH(m)RNORV (cm)MV (cm)
D1D2D3D4
11.011.000.800.750.900.86
22.101.751.201.901.74
33.152.802.653.002.90
44.253.603.604.003.86
54.904.204.304.704.53
65.304.804.705.455.06
76.055.205.306.005.64
86.305.755.556.355.99
96.606.305.806.656.34
106.907.006.067.006.74
117.357.456.507.307.15
127.607.906.757.607.46
137.808.156.907.907.69
147.958.607.108.207.96
158.058.907.258.458.16
168.259.107.408.708.36
178.409.207.708.908.55
188.559.307.909.158.73
198.609.408.109.408.88
208.709.608.309.609.05
218.809.708.509.909.23
229.109.908.6010.209.45
21.310.700.570.600.700.64
21.701.551.601.701.64
32.902.602.603.052.79
43.903.423.304.053.67
54.604.053.904.854.35
64.904.524.355.554.83
75.405.054.906.105.36
85.655.405.206.455.68
95.906.005.456.806.04
106.406.405.707.156.41
116.706.706.107.406.73
126.907.006.407.707.00
137.207.406.607.907.28
147.457.706.708.107.49
157.607.906.908.307.68
167.708.207.058.507.86
177.808.507.208.808.08
187.908.707.459.008.26
198.008.907.709.208.45
208.159.007.809.508.61
218.309.107.959.708.76
228.409.208.209.808.90
238.559.458.5010.109.15
Table 3. The true value and the measured value of the ring radius data. SNO is the sample number of the imitation stem analysis disk. RNO is the number of the growth ring (the number starts at the heart of the pith). D1, D2, D3, and D4 represent four measurement directions. PD is the pixel distance from this ring to the heart of the pith. TV is the true value of the ring radius. MV is the measured value of the ring radius. MTV is the mean of the true values. MMV is the mean of the measured value.
SNORNOD1D2D3D4MTV
(cm)
MMV
(cm)
PDTV (cm)MV (cm)PDTV (cm)MV (cm)PDTV (cm)MV (cm)PDTV (cm)MV (cm)
11291.401.40311.501.50271.301.30291.401.401.401.40
2442.102.13482.302.32432.052.08452.152.172.152.17
3663.153.19763.653.67633.053.06693.353.373.303.32
4874.154.20944.504.54824.004.04924.404.444.264.31
51075.105.171115.405.44954.654.711055.105.135.065.11
61235.855.941245.955.991085.305.381185.655.705.695.75
71456.907.001376.556.621286.256.321336.506.586.556.63
81728.458.591577.507.581587.507.631577.507.587.747.85
21271.401.40321.651.65361.851.85381.971.971.721.72
2522.752.80512.652.65562.902.91593.053.062.842.86
3643.333.34753.903.91713.653.68794.134.163.753.77
4884.554.57894.654.68884.554.571035.305.354.764.79
51045.355.401085.555.611015.205.241166.106.185.555.61
61186.106.121226.406.471176.006.071296.806.906.336.39
71427.307.371336.856.901326.756.851547.907.997.207.28
81809.209.341547.907.991598.108.251789.109.248.588.71
920210.3010.481718.758.871889.9510.1420810.6010.809.9010.07
31361.751.75361.751.75341.651.65331.601.601.691.69
2673.253.26653.153.16582.802.82562.702.722.982.99
3974.704.71834.004.03713.453.45803.903.914.014.03
41185.705.731014.954.99914.404.421095.255.305.085.11
51356.506.561185.805.871085.305.351256.056.085.915.96
61748.358.461336.556.641276.256.331537.407.447.147.21
72039.709.871638.058.181587.807.921909.109.238.668.80
Table 4. The measured data of tree ring radius of Chinese fir disk. DNO is the number of the sample of the stem analysis disk. RNO is the number of the growth ring (the number starts at the heart of the pith). D1, D2, D3, and D4 represent four measurement directions. PD is the pixel distance from this ring to the heart of the pith. MV is the measured value of the ring radius calculated by the system according to the regression equation of tree ring radius based on the polynomial type correction model. EV is the error value of the ring radius. MEV is the mean of the error value.
DNORNOD1D2D3D4MEV (cm)
MV (cm)EV (cm)MV (cm)EV (cm)MV (cm)EV (cm)MV (cm)EV (cm)
111.010.010.800.000.730.020.900.000.01
22.110.011.760.011.200.001.900.000.00
33.180.032.780.022.620.033.040.040.03
44.220.033.610.013.600.004.000.000.01
54.870.034.230.034.280.024.780.080.04
65.240.064.830.034.670.035.450.000.03
75.980.075.220.025.240.065.970.030.05
86.350.055.780.035.520.036.280.070.04
96.570.036.350.055.740.066.580.070.05
106.870.036.950.056.080.026.980.020.03
117.390.047.500.056.520.027.270.030.04
127.650.057.950.056.780.037.600.000.03
137.850.058.220.076.930.037.930.030.05
148.000.058.670.077.130.038.240.040.05
158.100.048.980.087.280.038.520.070.06
168.300.059.170.077.440.048.760.060.06
178.450.059.280.087.740.048.980.080.06
188.610.069.330.037.950.059.240.090.06
198.630.039.430.038.160.069.470.070.05
208.810.119.640.048.370.079.670.070.07
218.830.039.730.038.500.0010.000.100.04
229.130.039.930.038.680.0810.270.070.05
210.700.000.580.010.600.000.700.000.00
21.660.041.590.041.600.001.750.050.03
32.910.012.640.042.630.023.050.000.02
43.910.013.390.033.330.024.100.050.03
54.610.013.980.073.980.074.900.050.05
64.860.044.540.024.430.085.650.090.06
75.360.045.060.014.980.076.130.030.04
85.680.025.430.025.280.076.480.020.04
95.930.026.010.015.530.076.840.040.04
106.430.026.400.005.730.027.230.080.03
116.730.026.740.046.190.097.480.080.06
126.940.047.050.056.490.097.780.080.06
137.140.067.440.046.690.098.010.110.07
147.380.087.630.086.790.098.080.020.06
157.630.037.940.046.990.098.280.020.04
167.720.028.230.037.190.148.480.030.05
177.870.078.440.067.240.048.780.030.05
187.960.068.670.037.500.058.970.040.04
198.060.068.870.047.750.059.240.040.04
208.200.058.970.037.950.159.530.030.06
218.350.059.070.037.980.029.720.020.03
228.490.099.170.038.230.039.840.030.05
238.630.089.430.038.530.0310.140.040.04
Table 5. The measurement results and goodness of fit of the model. MAXE is the maximum error value of the measurement result. AVGE is the average error value of the measurement results. DOA represents the degree of accuracy of the measurement results.
Tree SpeciesUlmus pumila L.Zelkova serrata (Thunb.) Makino
ParameterMAXEAVGEDOAMAXEAVGEDOA
Value0.090.0599.68%0.100.0799.44%
Publisher’s Note: MDPI stays neutral with regard to jurisdictional claims in published maps and institutional affiliations.

