Article

Stomatal and Leaf Morphology Response of European Beech (Fagus sylvatica L.) Provenances Transferred to Contrasting Climatic Conditions

1
Faculty of Forestry, Technical University in Zvolen, T. G. Masaryka 24, 960 53 Zvolen, Slovakia
2
Institute of Forest Ecology, Slovak Academy of Sciences, Ľ. Štúra 2, 960 53 Zvolen, Slovakia
3
Forestry and Game Management Research Institute, Strnady 136, 252 02 Jíloviště, Czech Republic
*
Author to whom correspondence should be addressed.
Contributed equally to this work.
Forests 2020, 11(12), 1359; https://doi.org/10.3390/f11121359
Submission received: 12 November 2020 / Revised: 9 December 2020 / Accepted: 16 December 2020 / Published: 18 December 2020

Abstract

:
Climate change-induced elevated temperatures and drought are considered to be serious threats to forest ecosystems worldwide, negatively affecting tree growth and viability. We studied nine European beech (Fagus sylvatica L.) provenances located in two provenance trial plots with contrasting climates in Central Europe. Stomata play a vital role in the water balance of plants by regulating gaseous exchanges between plants and the atmosphere. Therefore, to explain the possible adaptation and acclimation of provenances to climate conditions, stomatal (stomatal density, the length of guard cells, and the potential conductance index) and leaf morphological traits (leaf size, leaf dry weight and specific leaf area) were assessed. The phenotypic plasticity index was calculated from the variability of provenances’ stomatal and leaf traits between the provenance plots. We assessed the impact of various climatic characteristics and derived indices (e.g., ecodistance) on intraspecific differences in stomatal and leaf traits. Provenances transferred to drier and warmer conditions acclimated through a decrease in stomatal density, the length of guard cells, potential conductance index, leaf size and leaf dry weight. The reduction in stomatal density and the potential conductance index was proportional to the degree of aridity difference between the climate of origin and conditions of the new site. Moreover, we found that the climate heterogeneity and latitude of the original provenance sites influence the phenotypic plasticity of provenances. Provenances from lower latitudes and less heterogeneous climates showed higher values of phenotypic plasticity. Furthermore, we observed a positive correlation between phenotypic plasticity and mortality in the arid plot but not in the more humid plot. Based on these impacts of the climate on stomatal and leaf traits of transferred provenances, we can improve the predictions of provenance reactions for future scenarios of global climate change.

1. Introduction

European beech forests may be seriously affected by climate change-induced drought due to their well-known vulnerability to water shortages [1,2]. Combinations of heat and drought stress may cause a decrease in the vitality and competitive ability of beech populations [3,4,5]. There have been reports of beech populations facing strong selective pressures [6], which are foreseen to become more intense due to upcoming alterations in rainfall patterns and temperatures with ongoing climate change [7,8]. To mitigate these negative effects on the future performance of beech forests in afforestation programs in Europe, there has been increased interest in research on the intraspecific variation in beech responses to environmental changes [9,10,11].
Large intraspecific differences in morphological and physiological traits among the beech provenances of distinct origin reflect possible strategies which are expected to modify their response to drought. Beech populations show divergent water use strategies reflected in the differences of photosynthetic performance, water-use efficiency, leaf water potential, xylem embolism resistance and leaf morphology [10,11,12,13]. The intraspecific variation in tolerance of water deficit follows a pattern shaped by both regional and local scale effects. Beech populations originating from the sites with low precipitation [14,15,16], lower altitude [17] or marginal distribution range [9,18,19] show higher drought resistance in comparison with the populations from more humid environments. The observed functional variation between beech populations reaffirms the importance of local adaptation to water deficit in the context of climate change [13,20].
Common garden experiments allow us to assess the relative importance of adaptation to the site of origin and acclimation to the new environment in the expression of phenotypic traits, as all provenances are exposed to the same conditions in provenance trial plots [21]. As a result of adaptation to local original conditions, the performance and vitality of populations show a correlation with ecological characteristics at the site of origin, even after their transfer to a new environment. The effect of environmental change on a provenance planted at a given location can be expressed as the difference between the ecological characteristics of the trial plot and the site of provenance origin, called the ecodistance [22]. Moreover, if we study the performance of populations in different provenance trial plots and the differences between plots are greater than within, we expect that the differences between phenotypes are driven more by acclimation to current environmental conditions than by local adaptation [23,24]. Stomatal and leaf morphological traits such as stomatal density, potential conductance index and specific leaf area affect stomatal conductance and transpiration (functional traits) which in return influence performance, growth and survival [13,19]. Therefore, stomatal and leaf morphological traits represent a viable means to identify populations suitable for a specific environment.
The populations that possess stomatal and leaf morphological traits adapted to drought and heat stress will have an evolutionary advantage under future scenarios [3]. Hence, a plant strategy to cope with differences in water regimes involves altering stomatal density and stomatal size [25,26,27]. Some studies have shown that smaller stomata close more quickly than larger stomata do, thus indicating that this could enhance plant adaptation to drought [28]. However, there remains the debated issue of how stomatal density varies within a particular environment. It has been reported that drought resistant plants show higher stomatal density [27,29,30], but the results of more recent studies performed in controlled environments suggest that lower stomatal density improves drought tolerance [31,32]. Other functional traits frequently utilized in ecological studies and linked to drought tolerance are specific leaf area and leaf size. Several studies have revealed that changes in environmental factors such as light, temperature or nutrients strongly influence leaf traits [33,34]. Species with smaller, thicker leaves mainly occur in more stressful habitats and exhibit lower specific leaf areas. This trait is related to the species water use strategy [34], and it is highly plastic [35], although the precise physiological regulation mechanism of specific leaf area is still uncertain [33,36].
Furthermore, the phenotypic plasticity, defined as the capacity for a genotype to alter its morphology and/or physiology under altered environmental conditions [37], can play a major role in the survival and sustainability of forest populations subjected to global change [38,39,40]. This is generally seen as favourable under stress conditions because it enables plants to react to fluctuations in the environment [41,42]. However, several studies have reported a potential trade-off between phenotypic plasticity and individual fitness [43], suggesting reduced performance with increasing plasticity [38,44,45]. Therefore, it is crucial to assess the ability for stomatal and leaf morphological traits to react plastically to their environment and to test the connection between their phenotypic plasticity and plant fitness and performance.
We investigated stomatal and leaf morphological traits, their phenotypic plasticity and a link to the climate of origin and current climate in nine European beech provenances located in two provenance trial plots with contrasting climates (warmer and drier/colder and more humid) in Central Europe. Based on the premise that environmental differences between provenance trial plots can alter the stomatal and leaf morphological traits of European beech, we hypothesized that (i) provenances that grow in drier and warmer provenance plots will exhibit lower values of measured traits than those growing in more humid and colder plots to increase their performance under suboptimal conditions. We further expected to find that (ii) the climate of the provenance’s original site would affect the provenance’s phenotype even 18 years after transfer to a different environment. In addition to the relationship between the climate of origin and phenotype itself, we also hypothesized that (iii) the provenance climate of origin should affect the phenotypic plasticity of provenances, where provenances from more heterogeneous environments show higher phenotypic plasticity. Finally, we hypothesized (iv) a negative relationship between phenotypic plasticity and tree mortality, and provenances with higher value of plasticity would acclimate better under different environments, thus mitigating the risk of mortality.

2. Materials and Methods

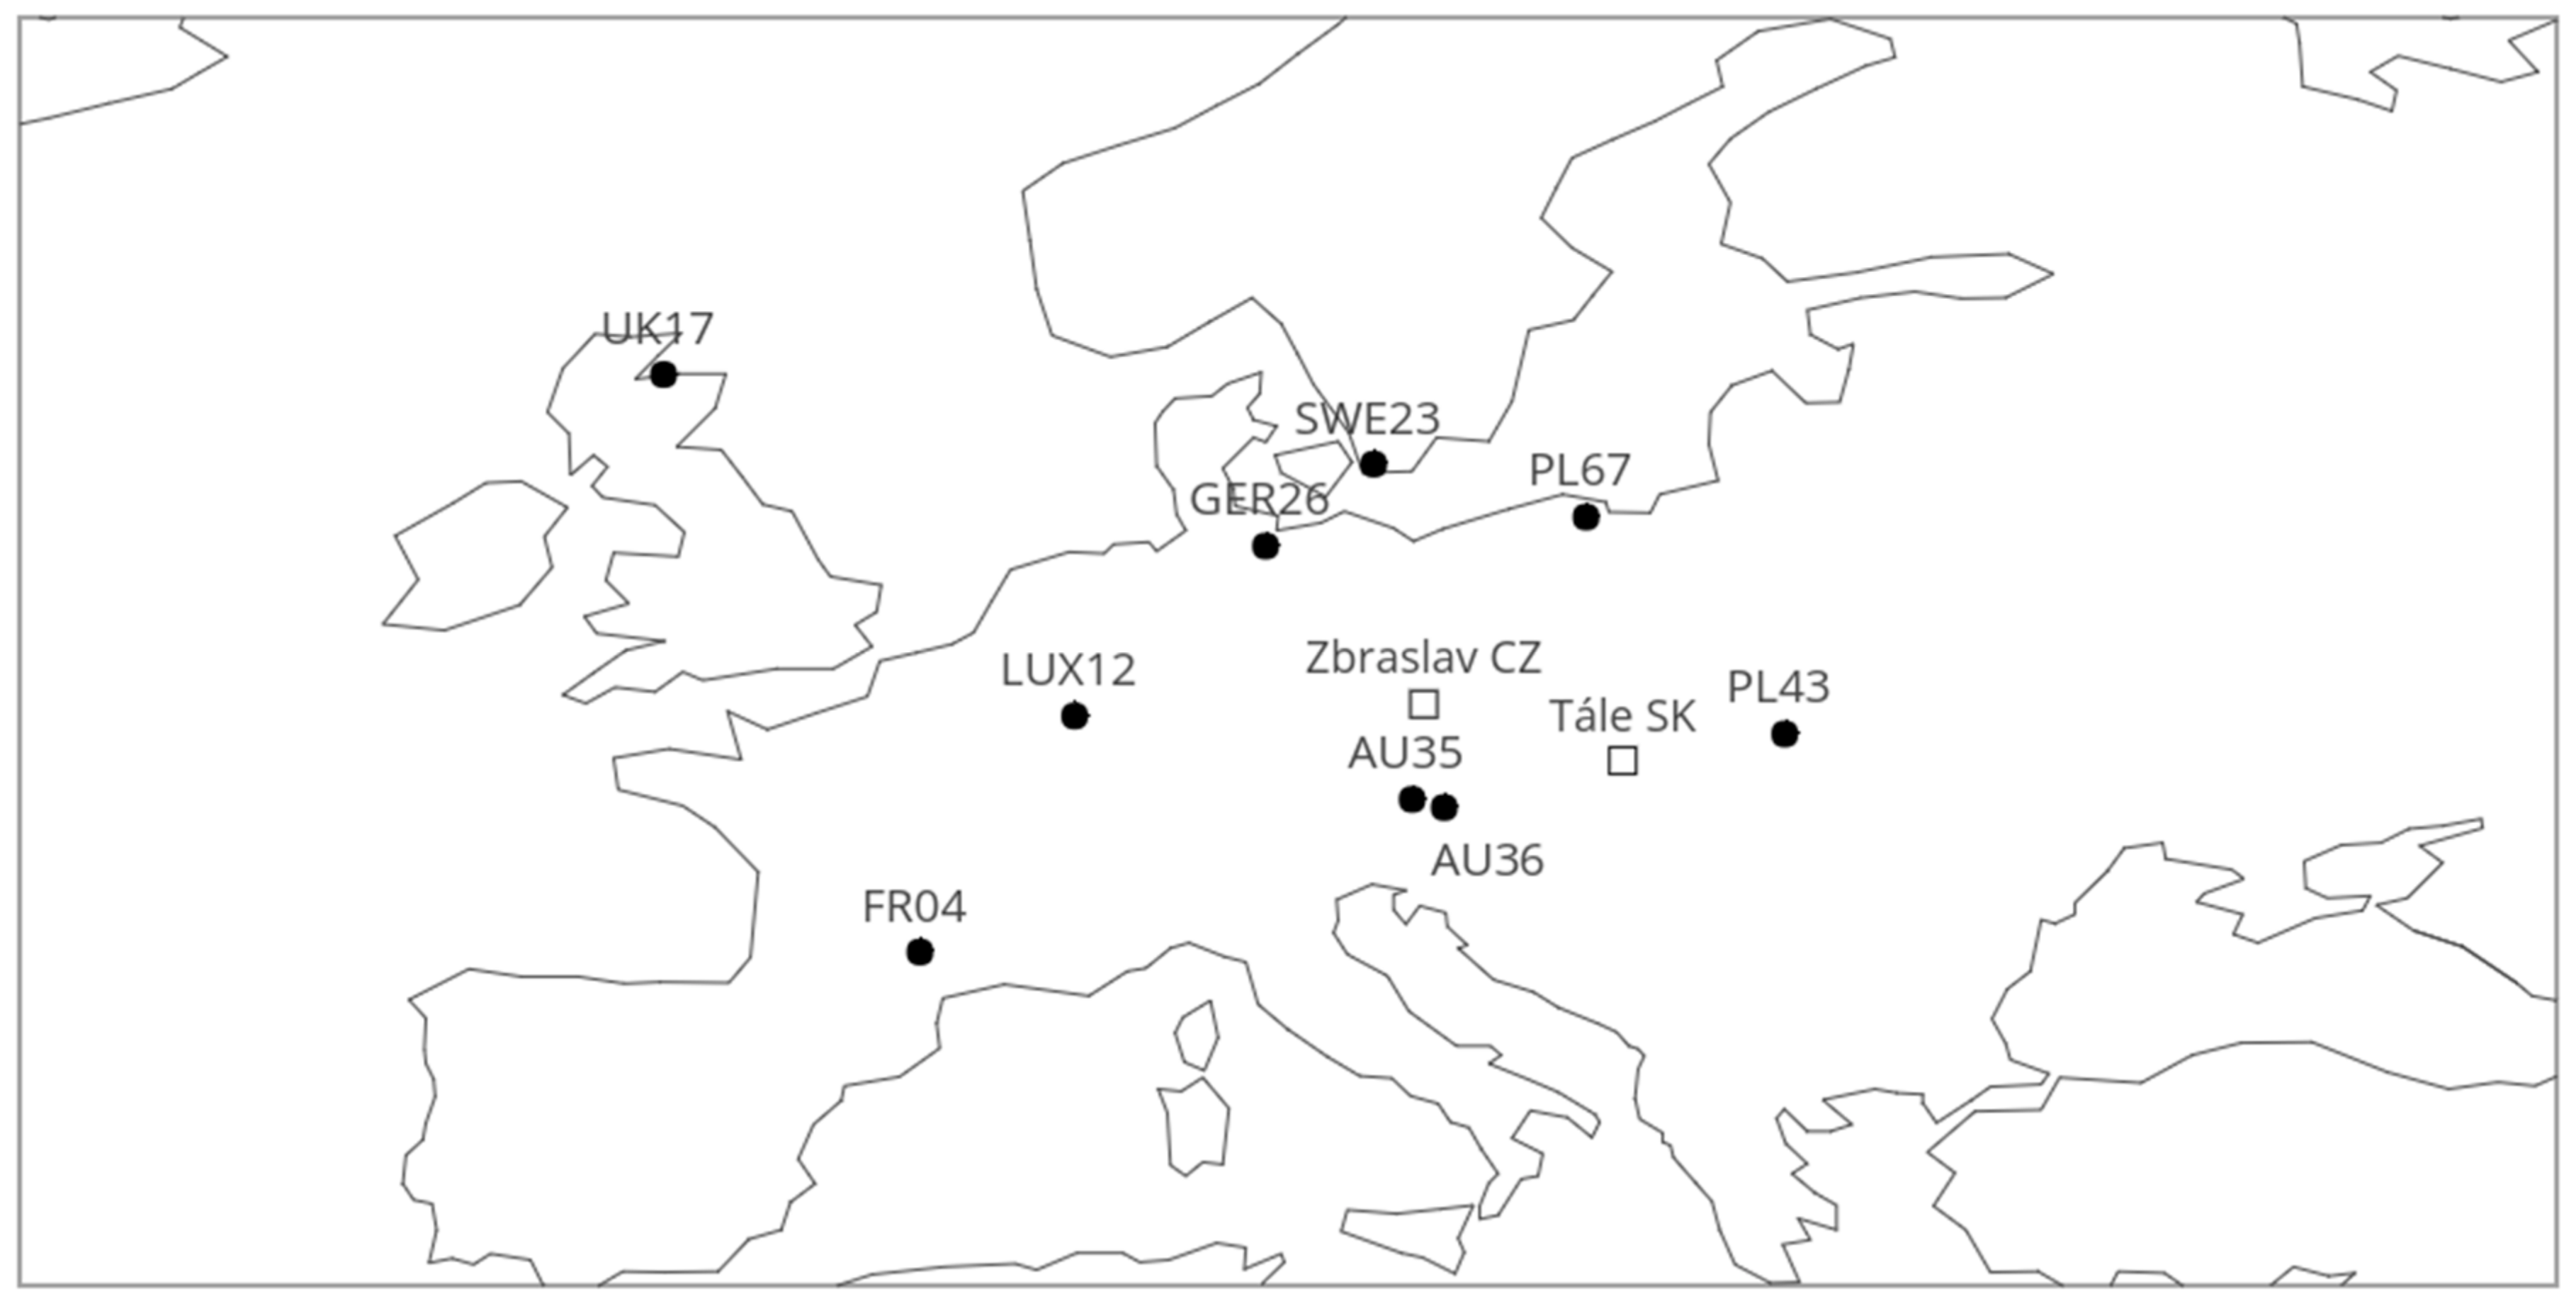
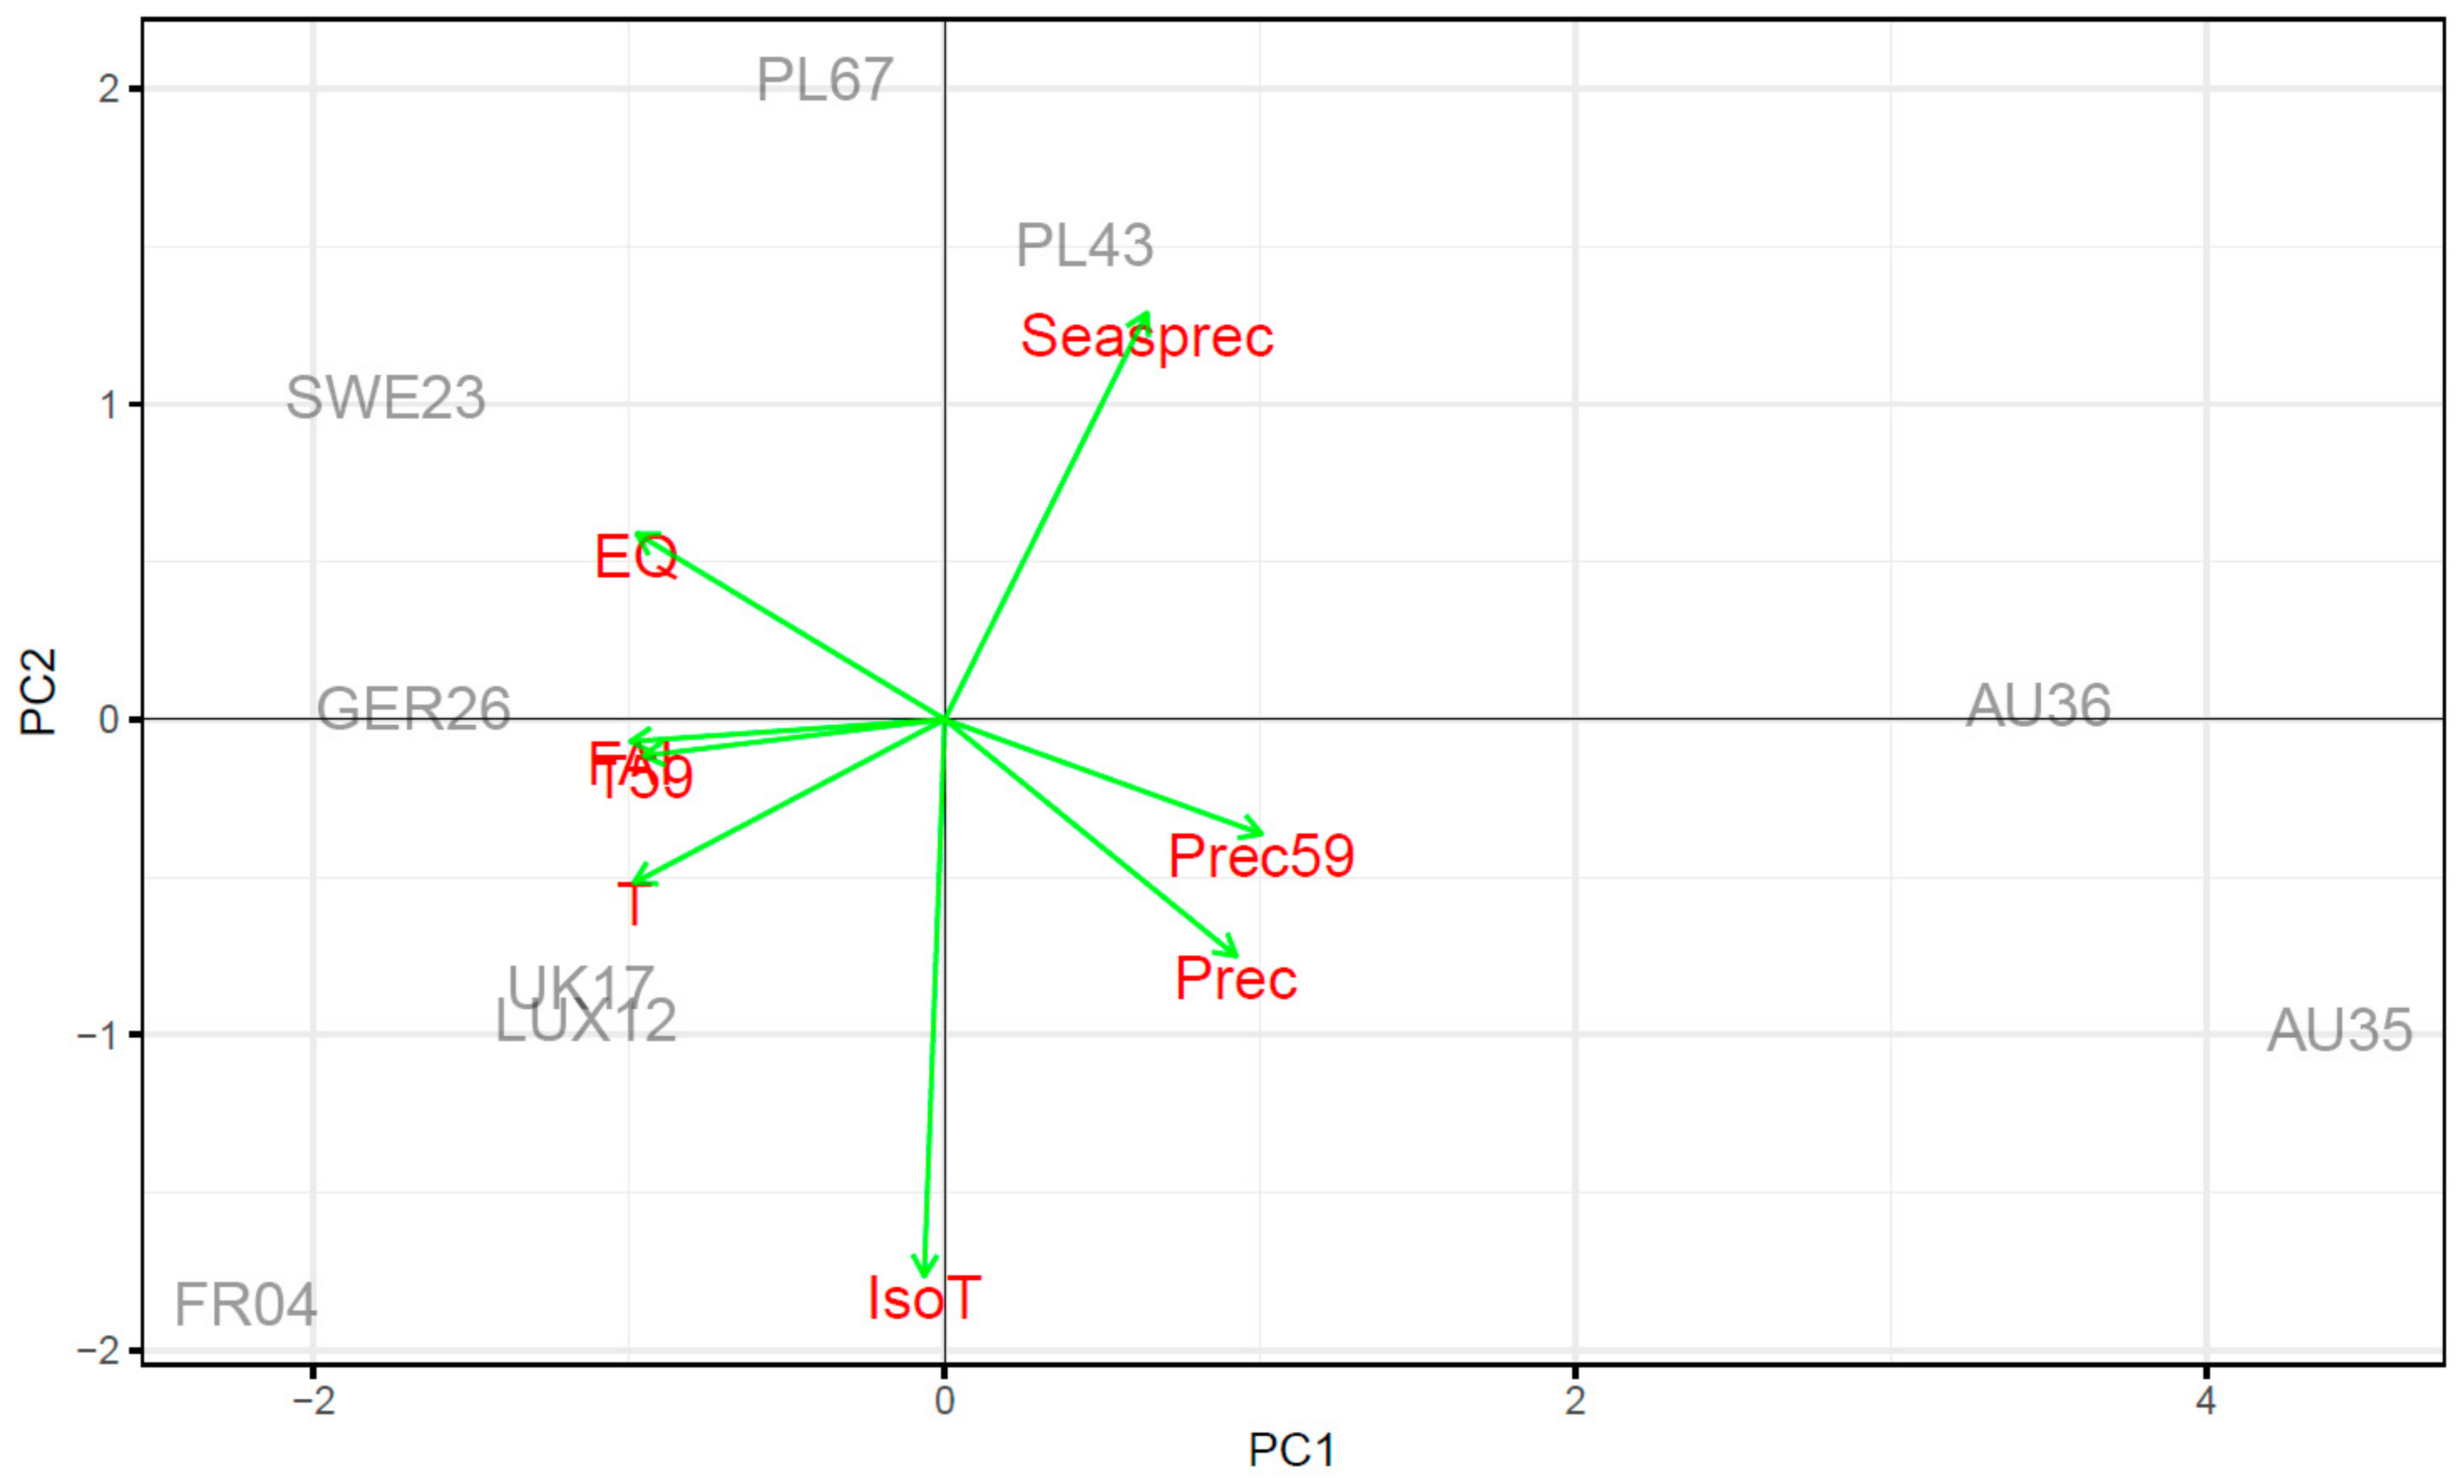
2.1. Locality Description and Plant Material

The material used for this experiment was collected from two European beech (Fagus sylvatica L.) provenance trial plots: Tále in the Slovak Republic (near Zvolen, 48°38′ N, 19°02′ E, 810 m a.s.l.) and Zbraslav in the Czech Republic (near Prague, 49°57′ N, 14°22′ E, 360 m a.s.l.). The Slovak provenance plot included loam soil with good nutrient availability and high water holding capacity, while the Czech provenance plot included sandy loam soil with poor nutrient availability and average water holding capacity [12]. Climate data for the original provenance sites were obtained from the WorldClim high-resolution climate database [46]. The climate characteristics of the Czech provenance plot were obtained from the Praha-Libuš meteorological station, and freely available data were provided by the Czech Hydrometeorological Institute (http://portal.chmi.cz). Climate data for the Slovak provenance plot were obtained from the nearby Kremnické Bane meteorological station monitored by the Slovak Hydrometeorological Institute. We calculated additional indices from the above climate data:
  • Ellenberg quotient (EQ) [47]
    E Q = 1000   ×   T h P r e c
    Th—mean temperature of the hottest month (here July), Prec—annual sum of precipitation.
  • Forest Aridity Index (FAI) [48]
    F A I = 100   ×   T 7 8 P r e c 5 7 + P r e c 7 8
    T7–8—mean temperature of July and August, Prec5–7—precipitation sum for May to July, Prec7–8—precipitation sum for July to August.
  • Isothermality (IsoT)
    I s o T = T   ×   T h T c T M A X T M I N   ×   100
    T—annual mean temperature, Th—mean temperature of warmest month, Tc—mean temperature of coldest month, TMAX—max temperature of warmest month, TMIN—min temperature of coldest month.
  • Precipitation seasonality (SeasPrec)
    S e a s P r e c = σ P r e c P r e c
    σPrec—annual standard deviation of precipitation, Prec—annual sum of precipitation.
All geographical and climatic data are presented in Table 1. Optimal hydric conditions of European beech stands are represented by EQ values of below 20. European beech starts to lose its competitive performance in environments with EQs of above 20 and is replaced by more xerotic tree species in places with EQs of above 30 [49,50]. Moreover, locations with optimal rainfall patterns during the vegetation season for European beech are defined by an FAI of under 4.75 [48,51]. The EQ for the Czech provenance plot is 33.5, and the FAI is 5.1, which characterizes the plot as a location with marginal environmental conditions for European beech occurrence. The Slovak provenance plot with an EQ of 19.1 and FAI of 2.5 represents the optimal hydric environment according to the classifications mentioned above. Both provenance plots were established in 1998 as a part of the European provenance plot network, whereas proven ances were planted as two-year-old seedlings [52]. Both plots were planted with 2 × 1 m spacing under a randomized block design with three blocks and fifty seedlings per block. Nine provenances were chosen for the analysis to capture the whole altitude range of the distribution of European beech (Figure 1). The distribution of provenance original sites regarding climate characteristics is visualized in Figure A1 of the Appendix A. We were not able to sample some of the provenances in multiple blocks due to high spatial mortality. The third block of the Czech provenance plot completely died off, and some of the provenances remained only in one block. Similarly, the third block of the Slovak provenance plot suffered high mortality, and we avoided this to minimize sample heterogeneity due to unknown factors.

2.2. Stomatal and Leaf Morphological Traits

The samples were taken during June 2016 from full sun-exposed leaves located in the upper third of the crown to minimize irradiation and canopy position effects on stomatal and leaf morphology development [53,54]. We sampled six individuals per provenance per plot and made two imprints per individual. The imprints were made by the application of transparent nail polish to the abaxial side of the leaves [55]. The layer of polish was then transferred to a microscope slide with transparent tape. To avoid possible variations in stomatal distribution within the leaves, we took imprints between the second and third veins from the base of the leaves [17]. Six images were taken from each imprint using a Motic BA210 microscope with an integrated camera (Motic Electric, Linz, Austria). Three of these images were captured at 40 × 10 magnification, and three photos were captured at 10 × 10 magnification. The images at 10 × 10 magnification were used to assess stomatal density (SD). The number of stomata was calculated within a 750 × 750 µm square per image with a random position using ImageJ 1.51k software (National Institute of Health, Bethesda, MD, USA). The assessed value of the number of stomata per square was converted to the number per square millimetre. The length of guard cells (LA) was measured for ten stomata in a 40 × 10 magnification image using ImageJ software. The SD and LA values were then averaged per individual for further analysis. Additional leaves from the same branch were scanned with a HP Scanjet G4010 scanner (Hewlett Packard, California, USA), and the leaf size (Sleaf) was subsequently measured by ImageJ software. The scanned leaves were stored in silica gel, after which the leaves were dried at 75 °C to a constant weight (approximately 48 h). Afterwards, the dry weight (mleaf) was assessed. From the measured parameters, we calculated the following traits:
The potential conductance index (PCI), an integrative variable of stomatal density and the length of guard cells, which can be used as a proxy for the theoretical maximal stomatal water vapour conductance [56,57]:
P C I = L A 2   ×   S D   ×   10 4
LA—length of guard cells, SD—stomatal density.
Specific leaf area (SLA), a parameter that corresponds to the thickness and density of leaf lamina [58,59]:
S L A = S l e a f m l e a f
Sleaf—leaf size and mleaf—dry weight of leaves.

2.3. Quantification of Phenotypic Plasticity

The plasticity index based on maximum and minimum means (PIv) was calculated for each trait and provenance, respectively [37].
P I v = x ¯ m a x x ¯ m i n x ¯ m a x
x ¯ m a x —maximum mean (mean of the group showing the maximal value relative to that of other groups); x ¯ m i n —minimum mean (mean of the group showing the minimal value relative to that of other groups). In our case, the groups refer to identical provenances from two different provenance plots.

2.4. Statistical Analysis

Statistical analysis was performed using R statistical software (Version 4.0.3, R Core Team, Vienna, Austria). Original climate characteristics of provenances were analysed by principal component analysis to visualize likeness or disparity between the original sites of the provenances. The normal distribution of the obtained data was first tested by the Shapiro–Wilk test. A two-way analysis of variance was used where provenance and plots were set as factors with fixed effects. Moreover, differences between provenances were tested separately for each plot by Fisher’s LSD post hoc test. We used ecodistance to capture shifts between the climate of origin and the climate of the provenance plot. The ecodistance was defined as the difference between the investigated ecologically relevant variables at the test site and at the population origin [22,60]. Furthermore, mixed models in the R “nlme” package [61] were used to explore relationships between individual stomatal and leaf morphological traits (dependent variables) and various explanatory variables, such as EQ, FAI, latitude and longitude. To account for between-plot variability, we included plot as a random effect variable, and the between-plot variance in the intercept estimation was quantified. We were not able to include a block design in the mixed models, as there were missing data due to spatial mortality within the plots. We used maximum likelihood to estimate the parameters of the model. To estimate the importance of individual explanatory variables, we calculated the normalized model likelihoods (Akaike weights). First, we fitted all possible model variants, including the null model (including only the intercept) and full model (including all explanatory variables). Then, Akaike weights were calculated for each model based on the corrected Akaike information criterion using the “Weights” function in the “MuMIn” R package [62]. The models with the highest weights were further selected and interpreted. In addition to that, we calculated marginal R2 (R2m) and conditional R2 (R2c) for better comparison of fixed and random factors in model [63]. Statistical significance of differences between the plasticity of the traits was assessed by analysis of variance and Tukey’s post-hoc test. The relationships between original climate, phenotypic plasticity and tree mortality were tested by linear regression.

3. Results

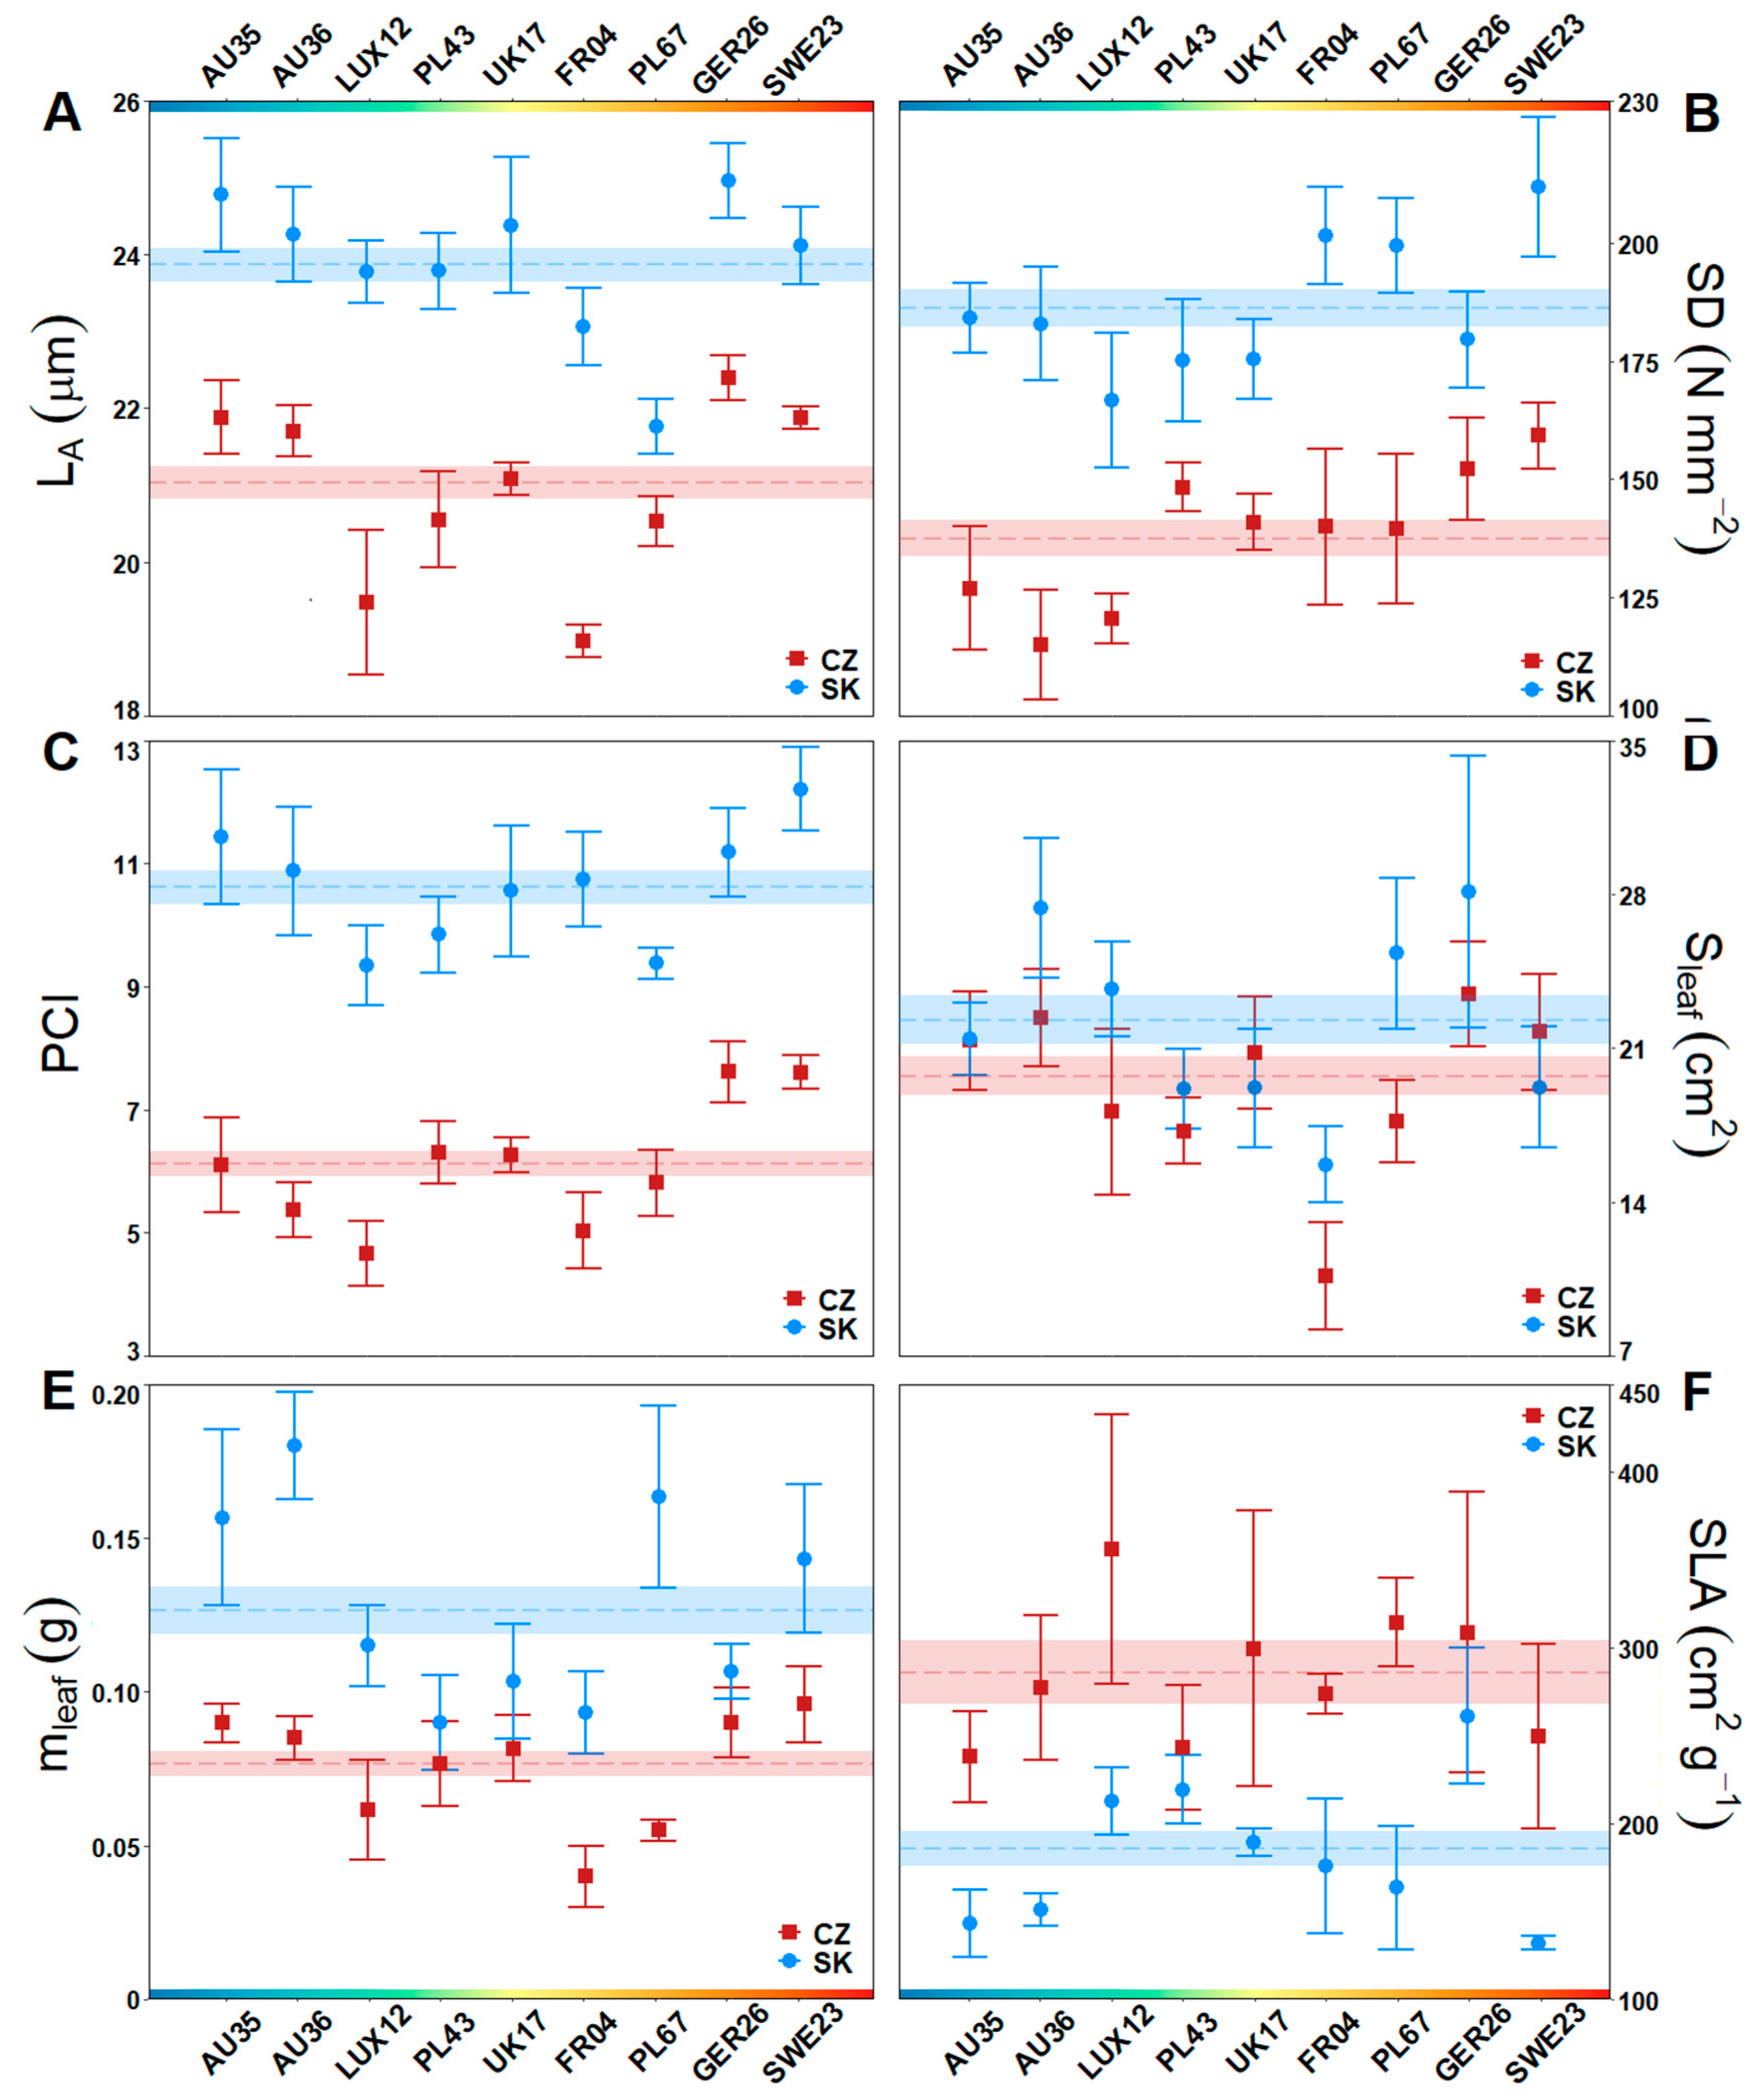
3.1. Stomatal and Leaf Morphological Traits

The effects of the tested factors, provenance, plot and provenance-by-plot interactions were statistically significant for all traits except in the case of specific leaf area (SLA) (Table 2, Table A1 in Appendix A). Provenances growing in a warmer and drier site in the Czech Republic showed lower guard cell length (LA, Figure 2A), stomatal density (SD, Figure 2B), potential conductance index (PCI, Figure 2C), leaf dry weight (mleaf, Figure 2D) and leaf size (Sleaf, Figure 2E) values than the provenances in the colder and more humid Slovak plot. Provenances in the Czech provenance plot showed an average 57% reduction in the PCI for leaves that were 12% smaller than those in the Slovak provenance plot. Based on the average mleaf, the provenances in the drier Czech plot accumulated 39% less biomass per leaf than the provenances in the more humid Slovak plot. Values of SLA were higher on average for the drier provenance plot, but changes were inconsistent and insignificant between provenances (Figure 2F).

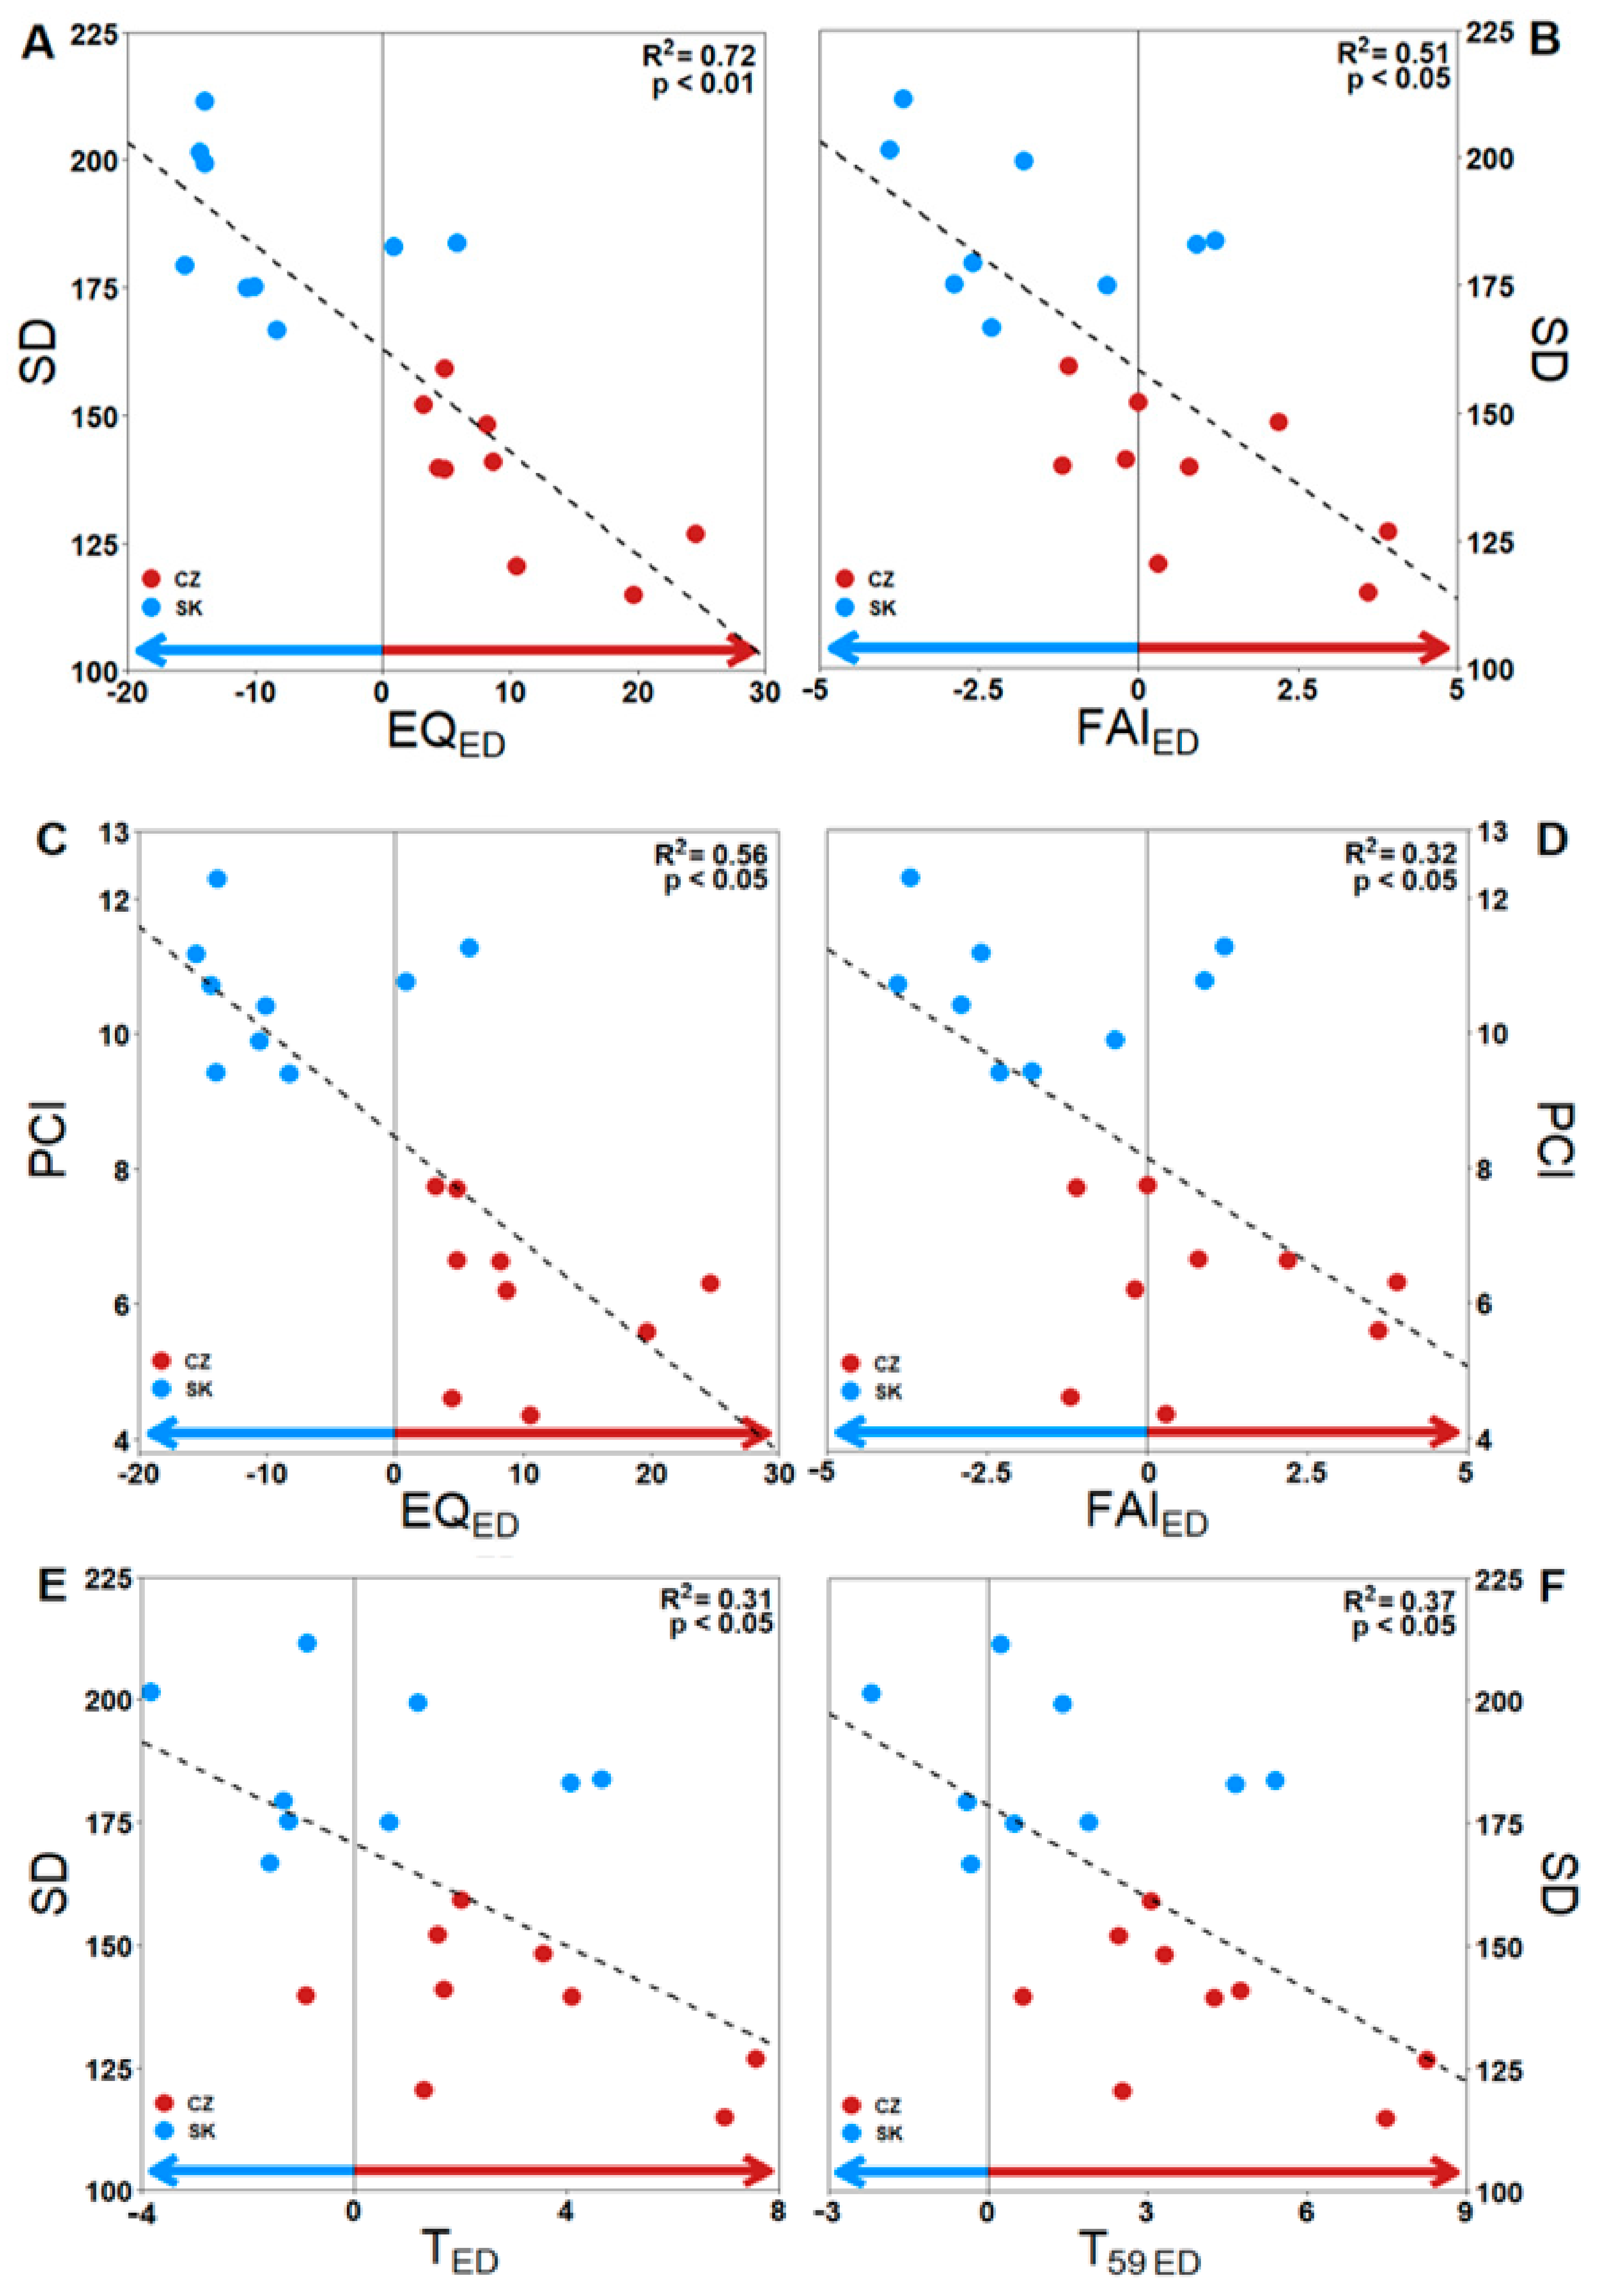
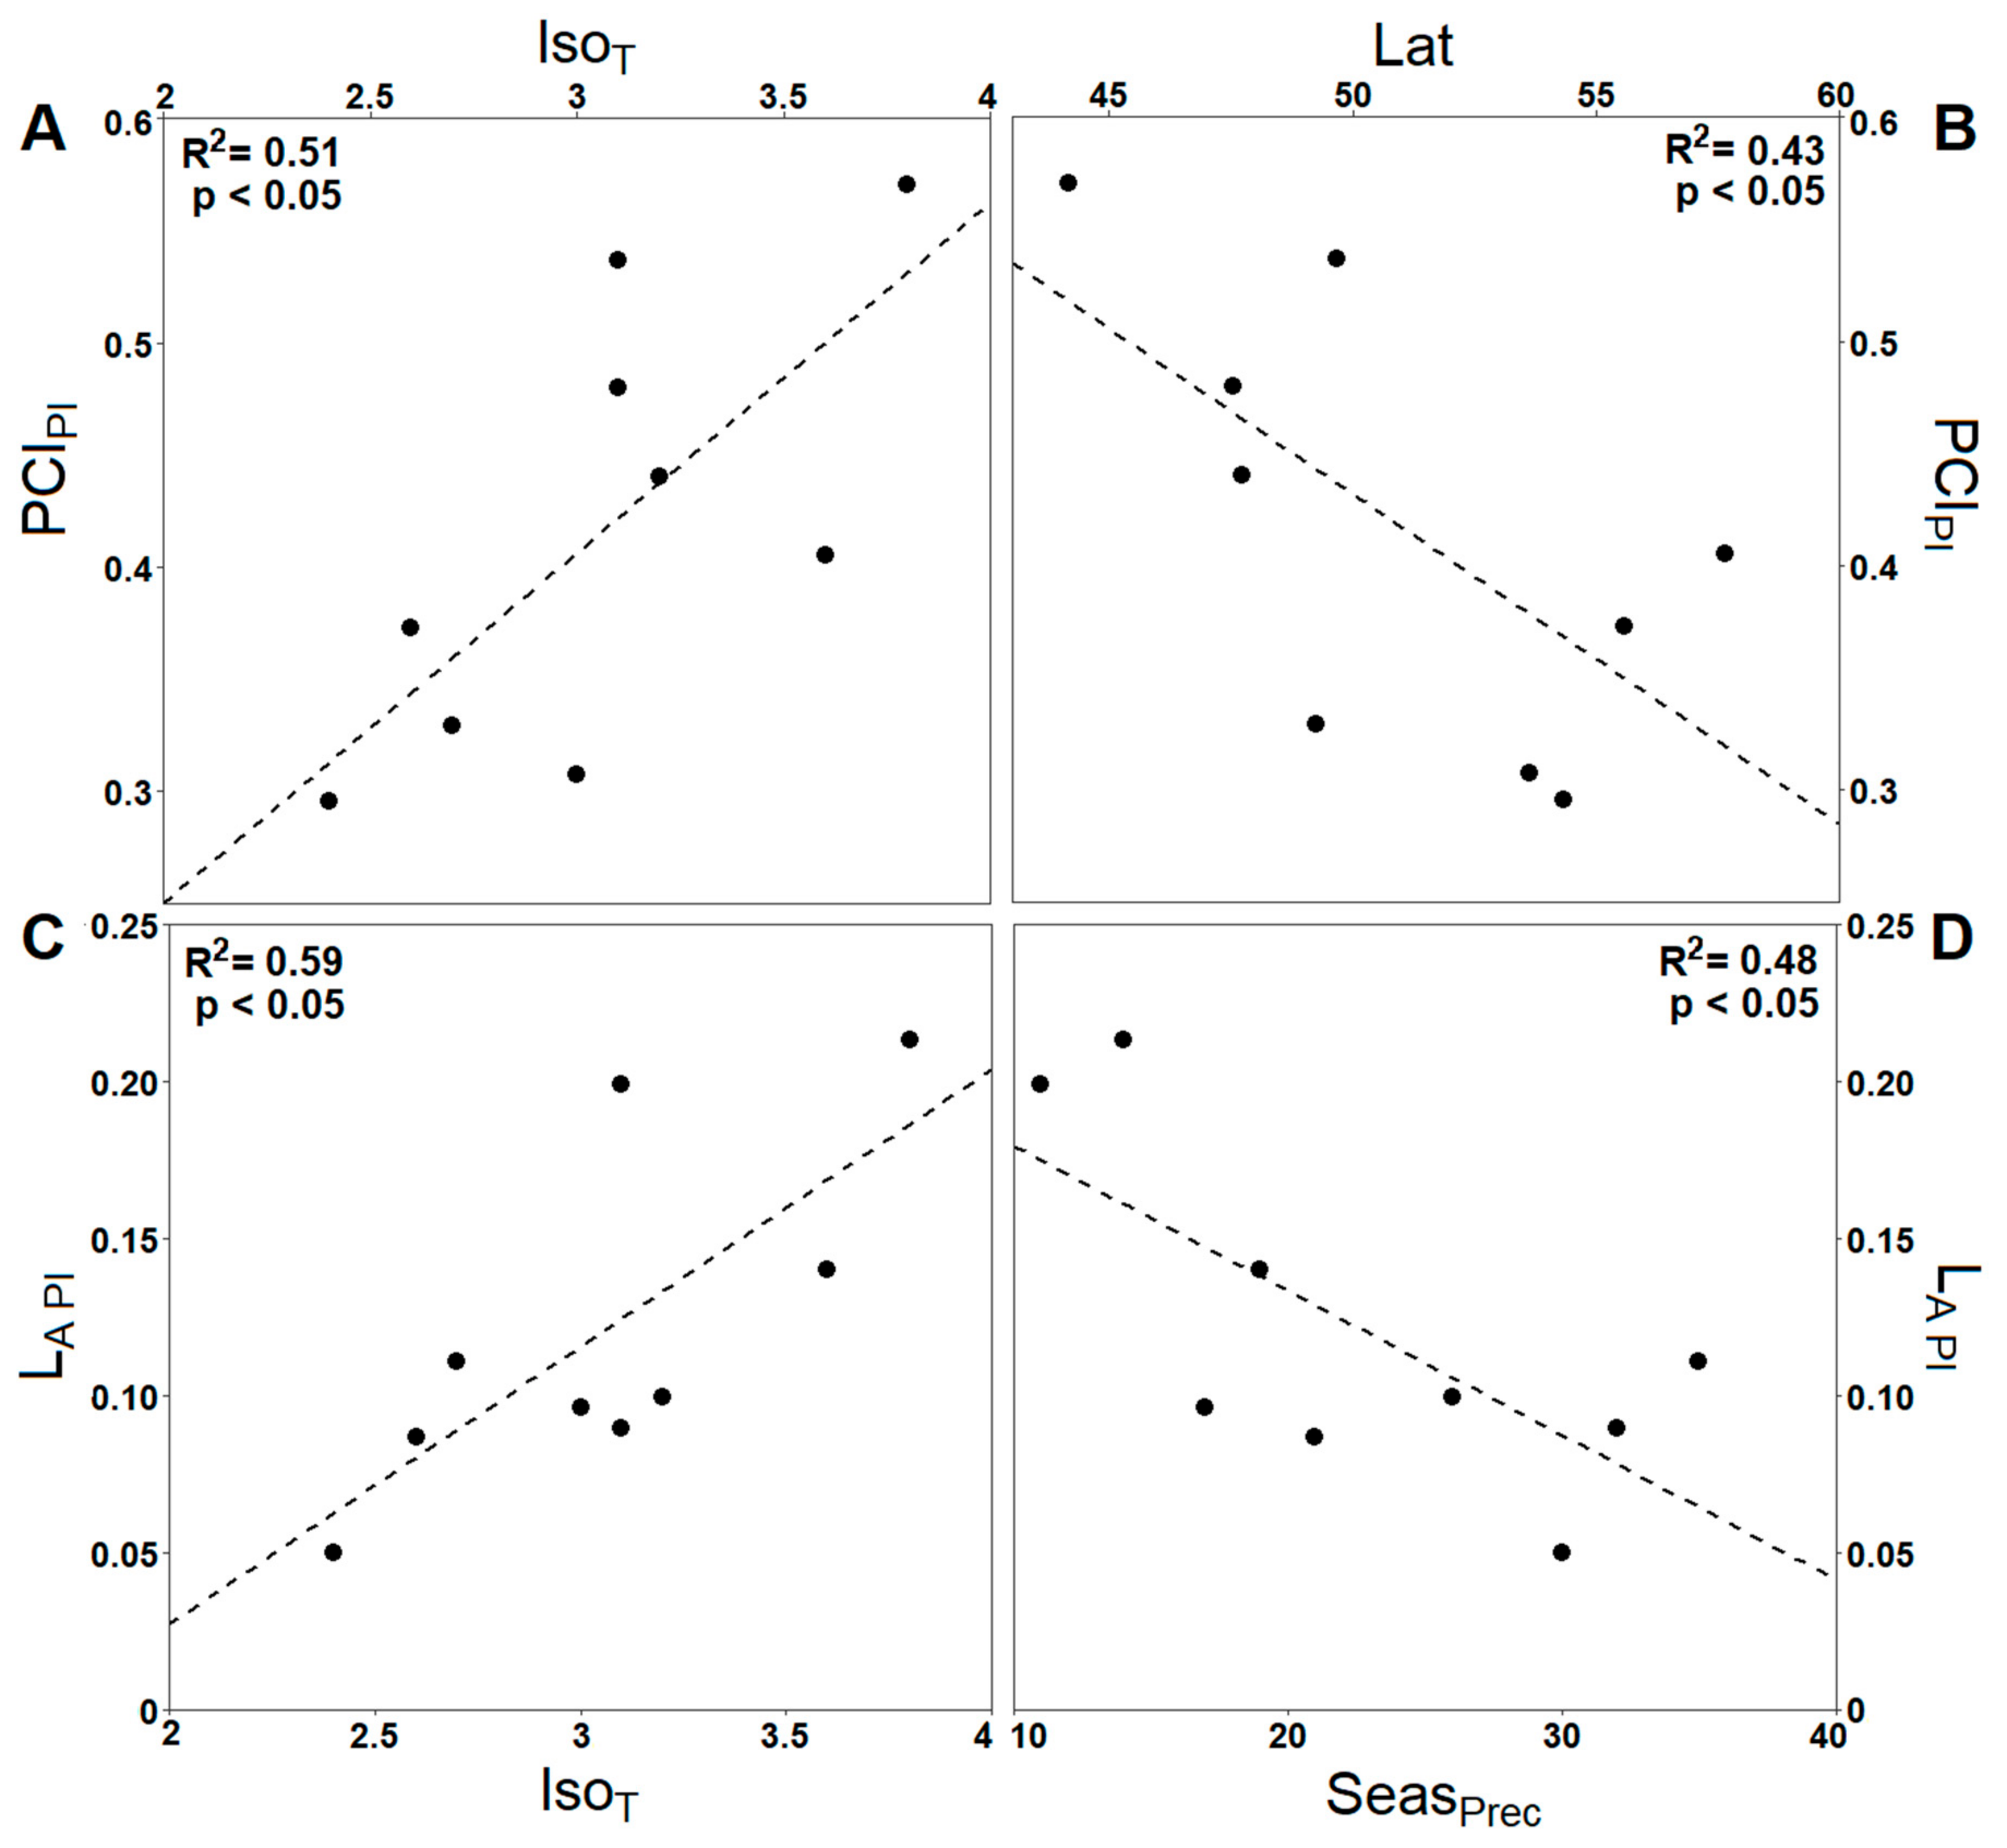
3.2. Impact of Climate Ecodistance on Stomatal and Leaf Morphological Traits

The multifactorial approach based on mixed models showed that the models with singular explanatory variables performed better than those with multiple factors; thus, a further analysis employed simple linear regression models (Table A2 and Table A3). The degree of aridity and temperature differences between provenances’ origins and new plots (ecodistance) had a significant effect on provenances’ stomatal development (Figure 3). The ecodistance of the Ellenberg quotient (EQED) and forest aridity index (FAIED) had a significant negative influence on SD (Figure 3A,B) and the PCI (Figure 3C,D). Provenances transferred to a drier environment relative to their original site showed a proportionally lower density of stomata with lower potential conductance. The ecodistance of average temperature (TED) and average temperature during the vegetation season (T59ED) also had a significant negative influence on SD, and provenances transferred to a climate warmer than that of their original site showed a proportional decrease in SD (Figure 3E,F). Other climate ecodistance indices showed no significant correlations with stomatal and leaf morphological traits.

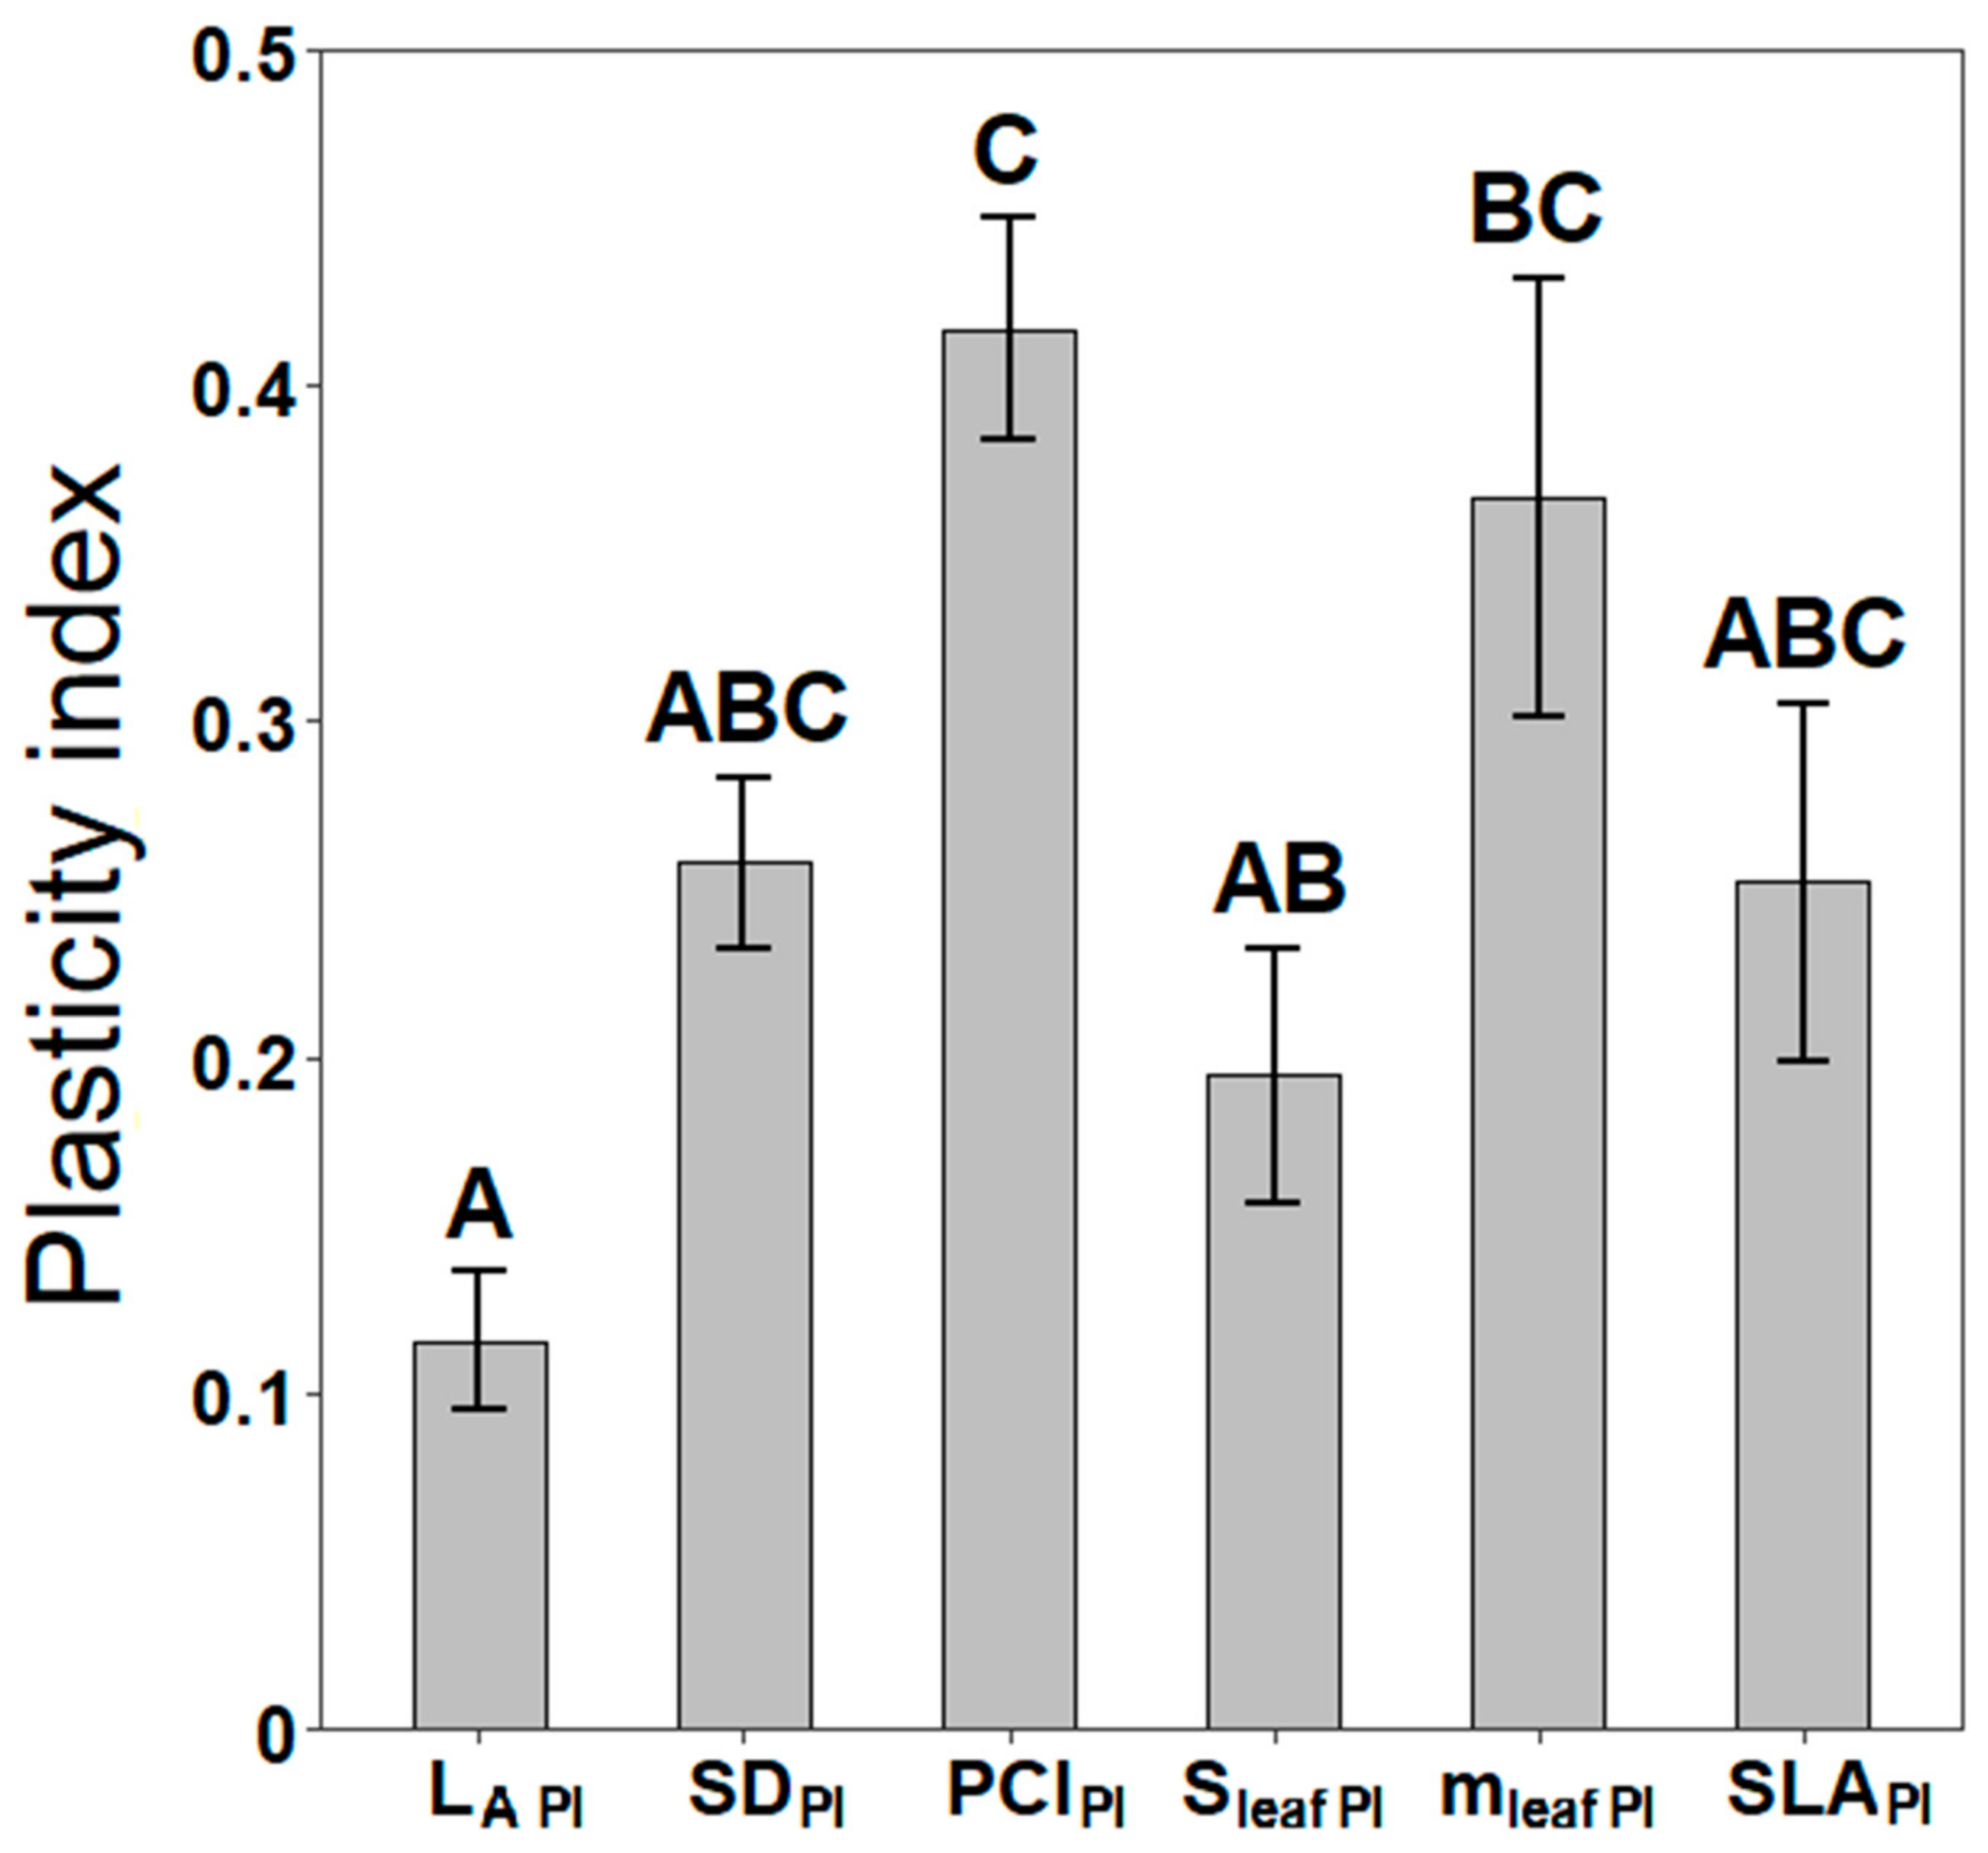
3.3. Phenotypic Plasticity of Stomatal and Leaf Morphological Traits
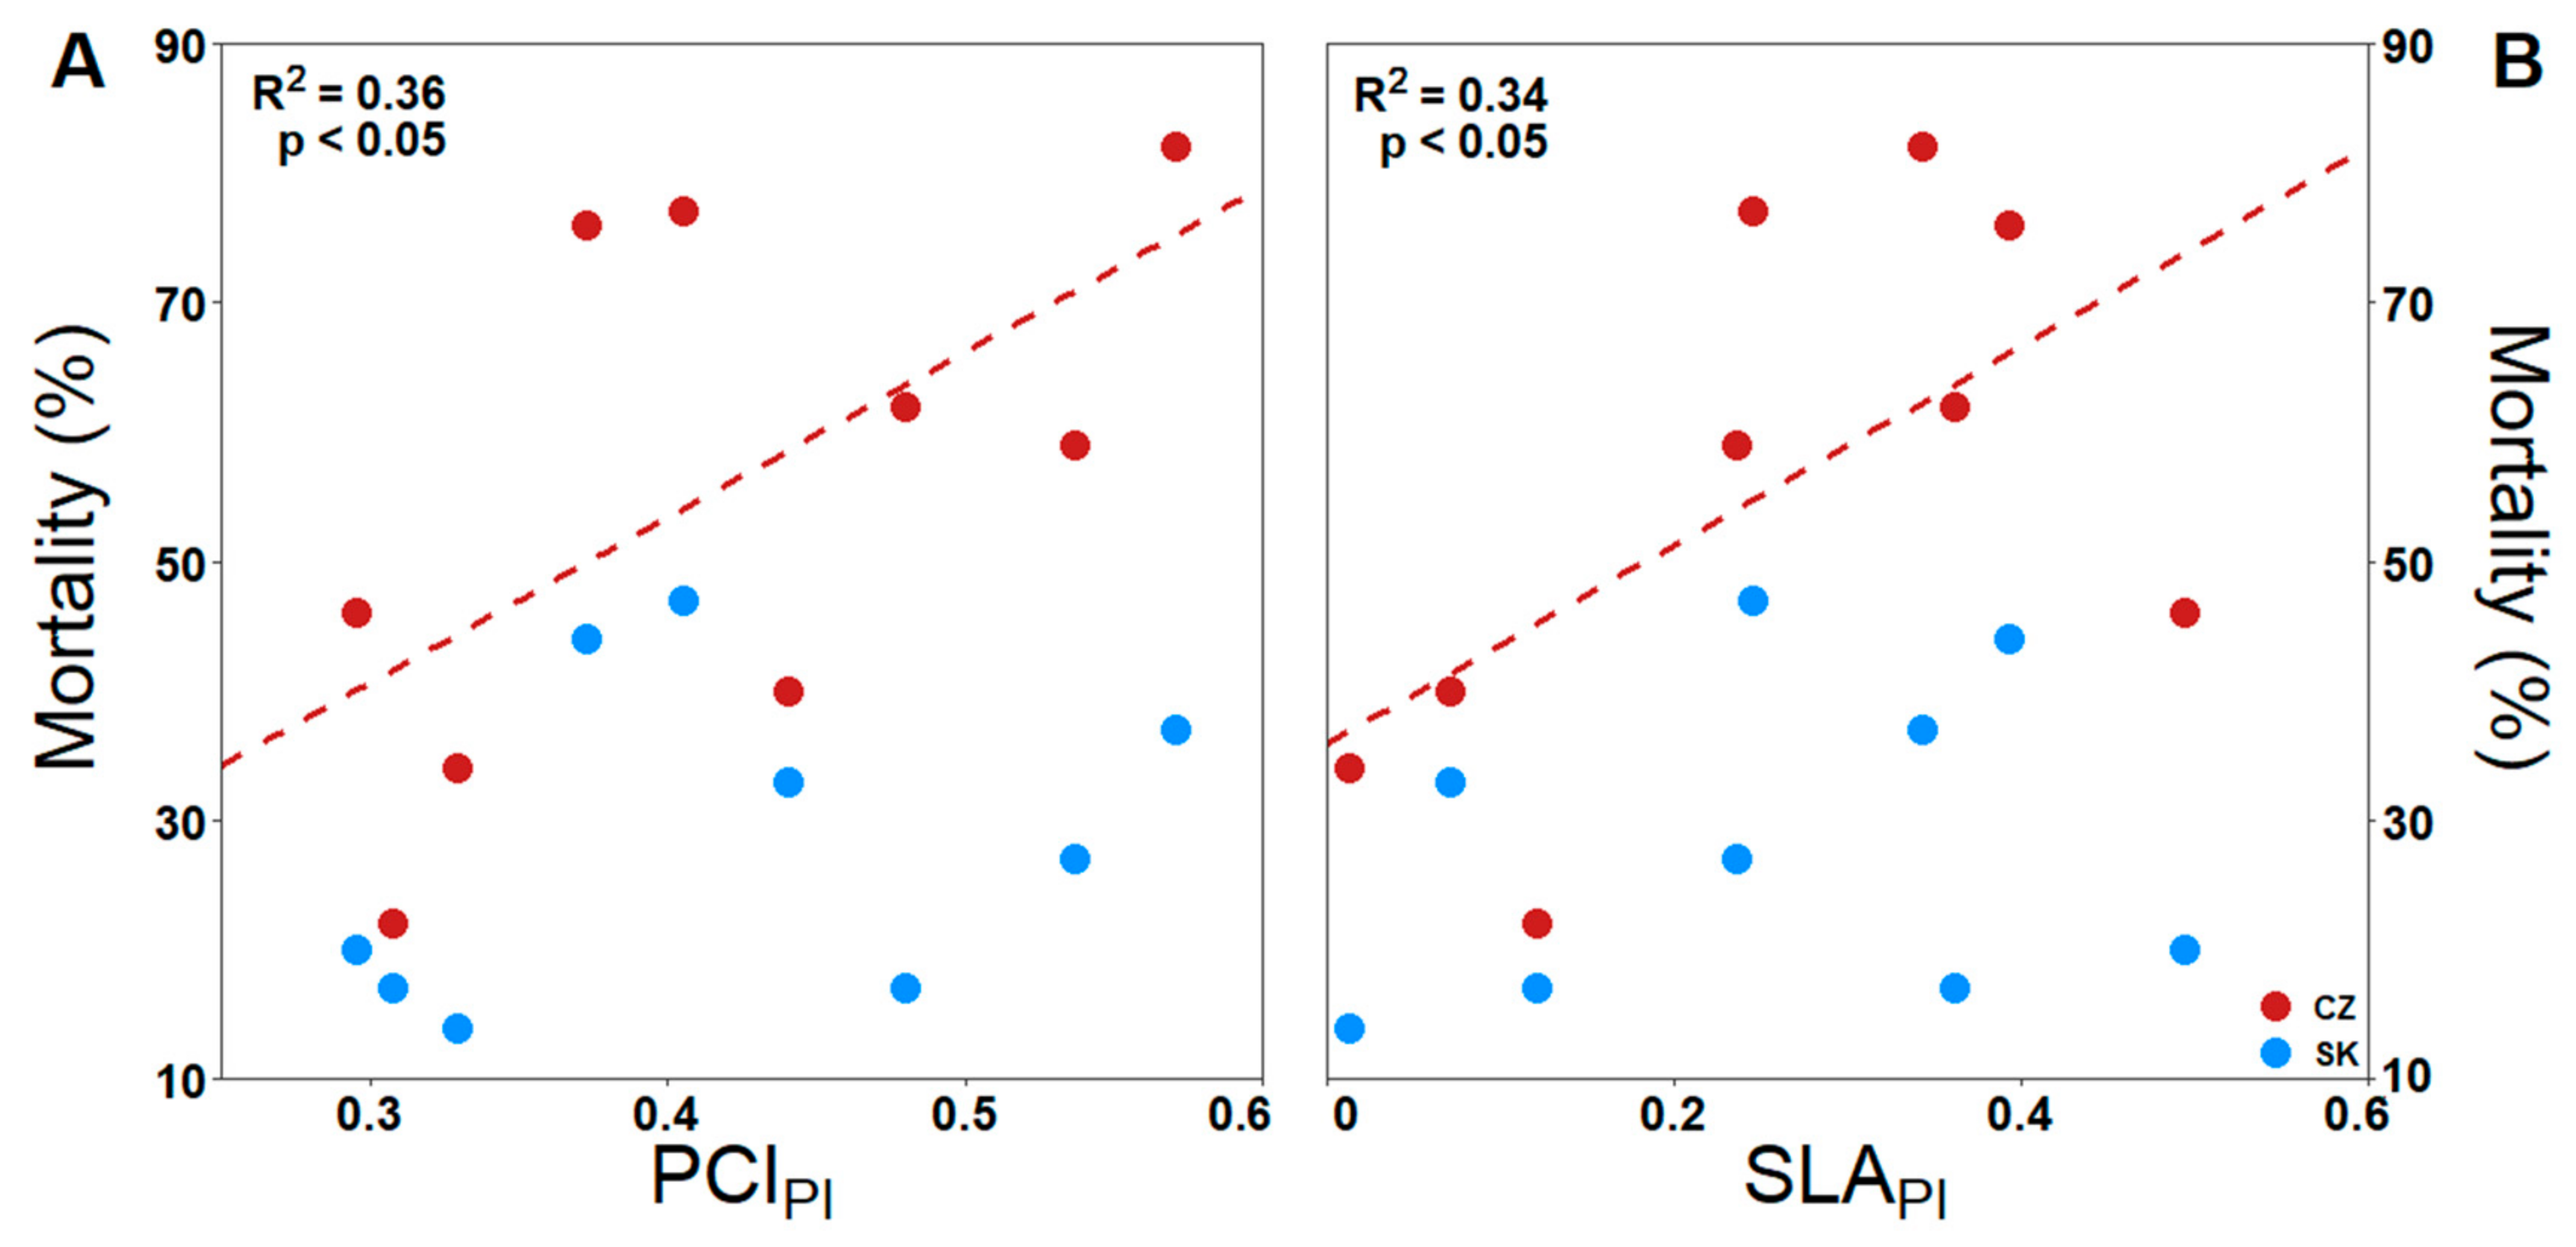
To quantify the acclimation response, we calculated the phenotypic plasticity index for each trait and provenance. Plasticity indices of the potential conductance index (PCIPI), leaf dry weight (mleaf PI) and specific leaf area (SLAPI) showed the highest values of plasticity among the provenances. In contrast, the plasticity index of the length of guard cells (LA PI) was the lowest among the provenances (Figure 4). The climate of the original provenance locations affected the plasticity response of acclimation after transfer to a new environment. Provenances from locations with more heterogeneous environmental temperatures showed lower PCIPI and LA PI plasticity. We found a positive relationship between the isothermality (IsoT) of the original location and provenances PCIPI and LA PI (Figure 5A,C). Moreover, provenances from environments with more heterogeneous precipitation distributions showed lower plasticity of LA. The seasonality of precipitation (SeasPrec) at the original locations of the provenances negatively influenced the LA PI of the provenances (Figure 5D). Furthermore, the original latitude (Lat) affected the PCIPI, as provenances from lower latitudes showed a higher PCIPI (Figure 5B). We found a significant negative relationship between provenance mortality and the plasticity of stomatal and leaf morphological traits (PCIPI and SLAPI) in the drier and hotter Czech provenance plot (Figure 6) but no significant relationship between mortality and plasticity in the more humid Slovak provenance plot.

4. Discussion

4.1. Functional Aspects of the Adaptive Response

Our study demonstrates that European beech provenances adjusted their stomatal and leaf morphological traits in response to being transferred to a new environment. Provenances exhibited significantly lower SD, LA, PCI, Sleaf and mleaf levels in the drier Czech provenance plot than in the more humid Slovak provenance plot. There were no significant differences in SLA when we considered provenance–plot interactions. Lack of significant differences regarding SLA might be caused by low sample size and high variability of the trait. Nevertheless, we observed that provenances in more xeric plot showed higher overall SLA. This is in opposition to general consensus [13,36,64,65], but has already been observed in some studies [66,67]. The adjustment of stomatal and leaf development can be seen as an adaptive response to either suboptimal climatic conditions of the Czech plot or to favourable climatic conditions of the Slovak plot. It has been reported that plants might improve their drought tolerance and water use efficiency (WUE) by reducing SD [31,32,68] and LA [28,69]. Both herbaceous plants and trees react to episodic drought and long-term xericity of the environment by decreasing SD [25,70] and developing smaller stomata with lower LA [26,56,71,72,73]. Combined stomatal morphology (LA) and the distribution of stomata on leaves (SD), represented as the PCI, might be seen as a proxy for structural constraints of maximal stomatal conductance. A reduction in the PCI under xeric conditions should then ultimately reduce stomatal conductance [74] and water loss, which can lead to improved WUE [73,75]. Acclimation through the development of smaller leaves (Sleaf) under xeric conditions leads to less water loss through transpiration [76] and higher WUE [77,78]. It should be mentioned that WUE is also influenced by photosynthetic capacity and not just stomata related traits [13]. Plants exposed to water deficit show a reduction in mleaf [64,79]. The combination of lower Sleaf with mleaf in drier site might be explained by trees’ strategy to invest more in root biomass with the cost of lower leaf biomass and leaf size [80]. The above-mentioned traits, therefore, represent plants’ adaptive mechanisms in mitigating drought stress [81]. As these stomatal and leaf morphological traits have a significant impact on plant performance under water stress, their adjustment is vital for plants to successfully acclimate under changing conditions due to either anthropogenic transport to new environments or accelerating global climate change.
On the other hand, an increase in SD and LA can enhance photosynthetic capacity [82,83], which could enhance tree performance under optimal climatic conditions where the strongest selective pressure is competition [84]. Leaves with higher SD and larger stomata (LA) show an increase in maximal stomatal conductance [85,86,87], which leads to higher biomass accumulation and growth [88]. A higher PCI increases the maximal limit of stomatal conductance, which might improve photosynthetic capacity [89]. Moreover, the PCI has also been found to be related to leaf hydraulic conductance [57], which has been correlated with photosynthesis rates across plant species [89,90]. Higher Sleaf values under favourable conditions lead to higher photosynthesis rates [91,92], which positively affect leaf biomass production with higher mleaf values [93]. According to our results, provenances in the drier and hotter Czech plot might acclimatise to their environment by undertaking a water conservation strategy with decreasing SD, LA, PCI, Sleaf and mleaf values. Conversely, provenances growing on the more humid Slovak plot could utilize the development of larger leaves (Sleaf, mleaf) with higher SD, LA and PCI values to maximize photosynthetic activity and growth in a competitive environment. Despite the clear theoretical basis for why the provenances showed significantly different values of the tested traits, we did not find any significant relationship between the tested traits and mortality. To address our first hypothesis (i), we found the morphological response as expected, but there is no evidence that the alternation of stomatal and leaf morphological traits had a significant positive effect on provenance performance. To capture the drought resistance profile of provenances for practical application, we suggest analysing additional physiological and functional traits, such as WUE, cuticular conductance, xylem embolism resistance and the turgor loss point [10,13,94]. Stomatal and leaf morphological traits alone are not satisfactory to define which provenances would be favourable for hotter and more xeric conditions in the near future.

4.2. Climate Ecodistance as an Effective Tool for Provenance Research

We found that the SD and PCI of provenances depend on the aridity ecodistance (EQED and FAIED) and temperature ecodistance (TED and T59ED). The ecodistance represents the climatic shift between the original provenance site and the provenance plot to which it is transferred. The connection between both the climate of origin and the current climate and stomatal phenotype might suggest strong coordination between genetic and environmental impacts on stomatal development. A previous provenance study showed strong significant relationships between temperature and ecodistance and the phenology, morphology and dendrometric traits of European beech provenances [22]. Aridity ecodistance (EQ) has been found to be a significant explanatory variable for the vitality [95] and growth [96] of European beech provenances. A study of four temperate tree species (Fagus sylvatica, Picea abies (L.) Karst., Pinus sylvestris L. and Quercus petraea (Matt.) Liebl.) has also shown a significant relationship between aridity ecodistance (the annual aridity index) and the growth of provenances after transfer to a new environment [97]. Our second hypothesis (ii) is confirmed by a significant relationship between SD, the PCI and ecodistance, which incorporates the climate of origin as well as the current climate of new plots. The ecodistance has not attracted much popularity since its first formulation [22], but it seems that this simple mathematical formulation of climate transfer could capture the physiological, morphological and growth reactions of tree provenances to their new environments. More studies have focused on additional tree species, and other aspects of tree phenotyping are needed to test whether ecodistance is robust enough to be useful and reliable for forestry applications. The ecodistance could then be used not only to explain the effect of climatic shifts caused by the spatial transfer of provenances but also to predict provenance reactions to temporal changes caused by accelerating anthropogenic global climate change.

4.3. Phenotypic Plasticity

Populations with higher phenotypic plasticity can adapt to higher environmental variability and thus can minimize the risk of mortality [65,98,99]. Our results suggest that the PCI, mleaf and SLA are the most plastic, while LA is the least plastic trait among provenances. The low plasticity of LA might suggest higher genetic control of stomatal size relative to the other tested traits. Similar results of low plasticity for LA and high plasticity for the PCI and leaf morphology were also observed in beech provenance studies [71,95]. Furthermore, we found a significant relationship between climate heterogeneity of the original site (IsoT and SeasPrec) and the plasticity of LA and PCI (LA PI and PCIPI). We expected populations that had evolved under more heterogeneous environments to favour higher phenotypic plasticity to quickly adjust their phenotype if needed [11,37,99,100]. In contrast to what we expected, the provenances from the most heterogeneous environment showed the lowest LA PI and PCIPI values, so hypothesis (iii) cannot be confirmed. We also found a negative significant relationship between latitude and PCIPI, which might be attributable to a reduction in genetic diversity from lower to higher latitudes after the recolonization of habitats after the last glacial maximum [101,102,103]. A harsher northern environment or higher competition at the distribution edge may create more selection pressure than elsewhere in the distribution range [44]. Therefore, populations that evolved under strong selection pressure might favour more efficient strong genetic control over high phenotypic plasticity within the population [104]. This could lead to trait canalization which might be translated to lower phenotypic plasticity [105,106,107].
We found a significant positive relationship between PCIPI, SLAPI and mortality values, but only in the drier and hotter Czech provenance plots. However, in this study with phenotyping data from only the remaining trees, we cannot conclude that the high plasticity of these two traits causes high provenance mortality as the plasticity was calculated from surviving individuals and thus might be biased. Higher mortality, which created more open canopies and less competition among the remaining trees, might have caused the higher values of phenotypic plasticity, as trees reacted to newly available canopy space. High phenotypic plasticity is generally seen as a favourable property of plants, trees or populations under global climate change [37,108,109]. We cannot confirm our hypothesis that (iv) there is a negative relationship between phenotypic plasticity and tree mortality. Despite this, we find it important to discuss phenotypic plasticity. Both recent and earlier studies have shown that the high phenotypic plasticity of plants should not be universally seen as a positive attribute [43,45,110,111]. The plasticity cost might not be pronounced under normal conditions, but when plants are exposed to a highly stressful environment, the plasticity cost might outweigh the fitness gain [112,113]. The results of several studies suggest reduced performance with increasing phenotypic plasticity under stress [38,44]. Thus, phenotypic plasticity, measured by common metrics [37], should not be automatically interpreted as beneficial for plants under global climate change. The high phenotypic plasticity of populations exposed to severe environmental stress might be associated with increased mortality and reduced fitness.

5. Conclusions

European beech provenances have shown a high degree of both adaptation and acclimation after transfer to a new environment. The observed differences in stomatal morphological traits were linked to the long-term aridity and air temperature of both the original site and the current provenance plot. The heterogeneity of the original site’s climate and latitude affected the phenotypic plasticity of stomatal traits. Higher phenotypic plasticity was associated with higher mortality under suboptimal conditions but not under favourable hydric conditions. Additional functional and physiological traits should be considered to evaluate the resistance or performance of European beech provenances, as we have not found any direct link between mortality and the tested stomatal and leaf morphological traits. Ecodistance can be considered as an easy to use and robust tool for analysing adaptive responses of tree provenances under global climate change. Studies of phenotypic plasticity should not interpret the positive effects of high plasticity without taking into consideration the performance, fitness or vitality of plants.

Author Contributions

D.K., J.F. and A.K. conceived the experimental design and coordinated the experiment; P.P., A.P., A.K., J.F. and D.K. sampled the plant material; A.P. and P.P. processed the samples and performed the measurements; M.B., P.P. and P.F. performed the statistical analyses; P.P. and A.P. wrote the first version of the manuscript, which was discussed and approved by all of the co-authors. All authors have read and agreed to the published version of the manuscript.

Funding

The study was supported by research grants from the Slovak Research and Development Agency APVV-18-0390, by the Slovak Grant Agency for Science no. VEGA 1/0535/20 and by the Ministry of Agriculture of the Czech Republic, institutional support MZE-RO0118. Climatic data provided by SHMÚ and ČHMÚ are greatly appreciated.

Conflicts of Interest

The authors declare no conflict of interest.

Appendix A

Table A1. Results of Fisher LSD post-hoc test.
SKLASDPCISleafmleafSLA
FR04BCACABBAAB
LUX12ABBAABABCBC
UK17ABABABABABABC
SWE23ABCBABABCDA
GER26AABCABAABCC
AU35AABCABABBCDA
AU36ABABCABADAB
PL43ABABAABABC
PL67CACAACDAB
CZLASDPCISleafmleafSLA
FR04CABCDABBDA
LUX12CABBABACDA
UK17ABABCDACDAABCA
SWE23ABDCDABA
GER26BCDDAABA
AU35ABABCACAABA
AU36ABAABAABCA
PL43ACBCDACDABABCDA
PL67ACABCDABABCDA
SD—stomatal density, LA—length of guard cells, PCI—potential conductance index, SLA—specific leaf area, Sleaf—leaf size, mleaf—dry weight per leaf.
Table A2. AICc based variable weights of mixed models. Green to red spectrum represents the explanatory power of individual parameters and their combinations. Full model consists of all three parameters: aridity (expressed as the EQ and FAI), longitude and latitude.
TraitEQEDLongEDLatEDEQED + LongEDEQED + LatEDLongED + LatEDFull Model
SD0.7040.0140.0070.1250.1310.0020.016
LA0.2220.310.1680.2020.0310.0470.021
PCI0.2110.4610.1510.0650.0320.0730.007
SLA0.3120.2390.2920.0440.060.0460.006
Sleaf0.160.4720.1520.0690.0310.1020.014
FAIEDLongEDLatEDFAIED + LongEDFAIED + LatEDLongED + LatEDFull model
SD0.2630.0560.0290.0460.5320.0090.065
LA0.2860.2840.1540.1630.0490.0430.021
PCI0.1770.4820.1580.0680.0310.0760.008
SLA0.3160.2410.2960.0470.0480.0470.005
Sleaf0.1490.3450.1110.2730.0210.0750.027
SD—stomatal density, LA—length of guard cells, PCI—potential conductance index, SLA—specific leaf area, Sleaf—leaf size, EQED—Ellenberg quotient ecodistance, FAIED—Forest Aridity Index ecodistance, LongED—longitude ecodistance, LatED—latitude ecodistance.
Table A3. Values of the marginal and conditional R2 of mixed models presented in Table A2.
SDLAPCISLASleaf
R2mR2cR2mR2cR2mR2cR2mR2cR2mR2c
EQED0.380.760.030.870.010.890.040.860.020.38
LongED0.010.840.020.780.010.910.010.750.120.18
LatED0.000.840.000.780.000.910.010.770.030.22
EQED + LongED0.380.750.070.920.010.910.040.860.190.75
EQED + LatED0.370.770.030.860.010.880.040.860.050.40
LongED + LatED0.020.840.020.780.010.910.020.770.150.29
Full model0.370.760.070.910.010.910.040.860.210.77
SDLAPCISLASleaf
R2mR2cR2mR2cR2mR2cR2mR2cR2mR2c
FAIED0.060.820.020.830.000.900.020.800.090.43
LongED0.010.840.020.780.010.910.010.750.120.18
LatED0.000.840.000.780.000.910.010.770.030.22
FAIED + LongED0.060.820.040.850.010.910.020.790.230.58
FAIED + LatED0.110.860.020.830.000.900.020.790.090.40
LongED + LatED0.020.840.020.780.010.910.020.770.150.29
Full model0.110.860.050.850.010.900.020.780.230.56
Figure A1. The principal component analysis biplot of provenance’s original climate.
Forests 11 01359 g0a1

References

  1. Leuschner, C.; Backes, K.; Hertel, D.; Schipka, F.; Schmitt, U.; Terborg, O.; Runge, M. Drought responses at leaf, stem and fine root levels of competitive Fagus sylvatica L. and Quercus petraea (Matt.) Liebl. trees in dry and wet years. For. Ecol. Manag. 2001, 149, 33–46. [Google Scholar] [CrossRef]
  2. Bréda, N.; Huc, R.; Granier, A.; Dreyer, E. Temperate forest trees and stands under severe drought: A review of ecophysiological responses, adaptation processes and long-term consequences. Ann. For. Sci. 2006, 63, 625–644. [Google Scholar] [CrossRef] [Green Version]
  3. Gessler, A.; Keitel, C.; Kreuzwieser, J.; Matyssek, R.; Seiler, W.; Rennenberg, H. Potential risks for European beech (Fagus sylvatica L.) in a changing climate. Trees 2006, 21, 1–11. [Google Scholar] [CrossRef]
  4. Kramer, K.; Degen, B.; Buschbom, J.; Hickler, T.; Thuiller, W.; Sykes, M.T.; De Winter, W. Modelling exploration of the future of European beech (Fagus sylvatica L.) under climate change—Range, abundance, genetic diversity and adaptive response. For. Ecol. Manag. 2010, 259, 2213–2222. [Google Scholar] [CrossRef]
  5. Hacket-Pain, A.J.; Cavin, L.; Friend, A.D.; Jump, A.S. Consistent limitation of growth by high temperature and low precipitation from range core to southern edge of European beech indicates widespread vulnerability to changing climate. Eur. J. For. Res. 2016, 135, 897–909. [Google Scholar] [CrossRef] [Green Version]
  6. Piovesan, G.; Biondi, F.; Di Filippo, A.; Alessandrini, A.; Maugeri, M. Drought-driven growth reduction in old beech (Fagus sylvatica L.) forests of the central Apennines, Italy. Glob. Chang. Biol. 2008, 14, 1265–1281. [Google Scholar] [CrossRef]
  7. Charru, M.; Seynave, I.; Morneau, F.; Bontemps, J.-D. Recent changes in forest productivity: An analysis of national forest inventory data for common beech (Fagus sylvatica L.) in north-eastern France. For. Ecol. Manag. 2010, 260, 864–874. [Google Scholar] [CrossRef]
  8. Rita, A.; Gentilesca, T.; Ripullone, F.; Todaro, L.; Borghetti, M. Differential climate–growth relationships in Abies alba Mill. and Fagus sylvatica L. in Mediterranean mountain forests. Dendrochronologia 2014, 32, 220–229. [Google Scholar] [CrossRef]
  9. Rose, L.; Leuschner, C.; Köckemann, B.; Buschmann, H. Are marginal beech (Fagus sylvatica L.) provenances a source for drought tolerant ecotypes? Eur. J. For. Res. 2009, 128, 335–343. [Google Scholar] [CrossRef] [Green Version]
  10. Schuldt, B.; Knutzen, F.; Delzon, S.; Jansen, S.; Müller-Haubold, H.; Burlett, R.; Clough, Y.; Leuschner, C. How adaptable is the hydraulic system of European beech in the face of climate change-related precipitation reduction? New Phytol. 2015, 210, 443–458. [Google Scholar] [CrossRef] [Green Version]
  11. Aranda, I.; Bahamonde, H.A.; Sánchez-Gómez, D. Intra-population variability in the drought response of a beech (Fagus sylvatica L.) population in the southwest of Europe. Tree Physiol. 2017, 37, 938–949. [Google Scholar] [CrossRef] [PubMed]
  12. Robson, T.M.; BeechCOSTe52 Database Consortium; Garzón, M.B. Phenotypic trait variation measured on European genetic trials of Fagus sylvatica L. Sci. Data 2018, 5, 180149. [Google Scholar] [CrossRef] [PubMed]
  13. Sánchez-Gómez, D.; Robson, T.M.; Gascó, A.; Gil-Pelegrín, E.; Aranda, I. Differences in the leaf functional traits of six beech (Fagus sylvatica L.) populations are reflected in their response to water limitation. Environ. Exp. Bot. 2013, 87, 110–119. [Google Scholar] [CrossRef] [Green Version]
  14. García-Plazaola, J.I.; Becerril, J. Effects of drought on photoprotective mechanisms in European beech (Fagus sylvatica L.) seedlings from different provenances. Trees 2000, 14, 485–490. [Google Scholar] [CrossRef]
  15. Peuke, A.D.; Schraml, C.; Hartung, W.; Rennenberg, H. Identification of drought-sensitive beech ecotypes by physiological parameters. New Phytol. 2002, 154, 373–387. [Google Scholar] [CrossRef]
  16. Bolte, A.; Czajkowski, T.; Cocozza, C.; Tognetti, R.; De Miguel, M.; Pšidová, E.; Ditmarová, Ĺ.; Dinca, L.; Delzon, S.; Cochard, H.; et al. Desiccation and Mortality Dynamics in Seedlings of Different European Beech (Fagus sylvatica L.) Populations under Extreme Drought Conditions. Front. Plant Sci. 2016, 7, 751. [Google Scholar] [CrossRef] [Green Version]
  17. Bresson, C.C.; Vitasse, Y.; Kremer, A.; Delzon, S. To what extent is altitudinal variation of functional traits driven by genetic adaptation in European oak and beech? Tree Physiol. 2011, 31, 1164–1174. [Google Scholar] [CrossRef] [Green Version]
  18. Dounavi, A.; Netzer, F.; Ćelepirović, N.; Ivanković, M.; Burger, J.; Figueroa, A.; Schön, S.; Simon, J.; Cremer, E.; Fussi, B.; et al. Genetic and physiological differences of European beech provenances (F. sylvatica L.) exposed to drought stress. For. Ecol. Manag. 2016, 361, 226–236. [Google Scholar] [CrossRef]
  19. Thiel, D.; Kreyling, J.; Backhaus, S.; Beierkuhnlein, C.; Buhk, C.; Egen, K.; Huber, G.; Konnert, M.; Nagy, L.; Jentsch, A. Different reactions of central and marginal provenances of Fagus sylvatica to experimental drought. Eur. J. For. Res. 2014, 133, 247–260. [Google Scholar] [CrossRef]
  20. Aranda, I.; Cano, F.J.; Gascó, A.; Cochard, H.; Nardini, A.; Mancha, J.A.; López, R.; Sánchez-Gómez, D. Variation in photosynthetic performance and hydraulic architecture across European beech (Fagus sylvatica L.) populations supports the case for local adaptation to water stress. Tree Physiol. 2015, 35, 34–46. [Google Scholar] [CrossRef]
  21. De Villemereuil, P.; Gaggiotti, O.E.; Mouterde, M.; Till-Bottraud, I. Common garden experiments in the genomic era: New perspectives and opportunities. Heredity 2016, 116, 249–254. [Google Scholar] [CrossRef] [PubMed] [Green Version]
  22. Matyas, C. Climatic adaptation of trees: Rediscovering provenance tests. Euphytica 1996, 92, 45–54. [Google Scholar] [CrossRef]
  23. Konôpková, A.; Kurjak, D.; Kmeť, J.; Klumpp, R.; Longauer, R.; Ditmarová, Ľ.; Gömöry, D. Differences in photochemistry and response to heat stress between silver fir (Abies alba Mill.) provenances. Trees 2017, 32, 73–86. [Google Scholar] [CrossRef]
  24. Kurjak, D.; Konôpková, A.; Kmeť, J.; Macková, M.; Frýdl, J.; Zivcak, M.; Palmroth, S.; Ditmarová, Ľ.; Gömöry, D. Variation in the performance and thermostability of photosystem II in European beech (Fagus sylvatica L.) provenances is influenced more by acclimation than by adaptation. Eur. J. For. Res. 2018, 138, 79–92. [Google Scholar] [CrossRef]
  25. Lavilla, M.; Seral, A.; Murciano, A.; Molino, S.; De-La-Fuente-Redondo, P.; Galan, J.M.G.Y. Stomatal traits in Iberian populations of Osmunda regalis (Osmundaceae, Polypodiopsida) and its relationship with bioclimatic variables. Acta Bot. Malacit. 2018, 42, 5–13. [Google Scholar] [CrossRef]
  26. Durand, M.; Brendel, O.; Buré, C.; Le Thiec, D. Changes in irradiance and vapour pressure deficit under drought induce distinct stomatal dynamics between glasshouse and field-grown poplars. New Phytol. 2020, 227, 392–406. [Google Scholar] [CrossRef]
  27. Gindel, I. Stomatal Number and Size as Related to Soil Moisture in Tree Xerophytes in Israel. Ecology 1969, 50, 263–267. [Google Scholar] [CrossRef]
  28. Drake, P.L.; Froend, R.H.; Franks, P.J. Smaller, faster stomata: Scaling of stomatal size, rate of response, and stomatal conductance. J. Exp. Bot. 2013, 64, 495–505. [Google Scholar] [CrossRef] [Green Version]
  29. McCree, K.J.; Davis, S.D. Effect of Water Stress and Temperature on Leaf Size and on Size and Number of Epidermal Cells in Grain Sorghum 1. Crop. Sci. 1974, 14, 751–755. [Google Scholar] [CrossRef]
  30. Cutler, J.M.; Rains, D.W.; Loomis, R.S. The Importance of Cell Size in the Water Relations of Plants. Physiol. Plant. 1977, 40, 255–260. [Google Scholar] [CrossRef]
  31. Hepworth, C.; Doheny-Adams, T.; Hunt, L.; Cameron, D.D.; Gray, J.E. Manipulating stomatal density enhances drought tolerance without deleterious effect on nutrient uptake. New Phytol. 2015, 208, 336–341. [Google Scholar] [CrossRef] [PubMed] [Green Version]
  32. Caine, R.S.; Yin, X.; Sloan, J.; Harrison, E.L.; Mohammed, U.; Fulton, T.; Biswal, A.K.; Dionora, J.; Chater, C.C.; Coe, R.A.; et al. Rice with reduced stomatal density conserves water and has improved drought tolerance under future climate conditions. New Phytol. 2018, 221, 371–384. [Google Scholar] [CrossRef] [PubMed]
  33. Poorter, H.; Niinemets, Ü.; Poorter, L.; Wright, I.J.; Villar, R. Causes and consequences of variation in leaf mass per area (LMA): A meta-analysis. New Phytol. 2009, 182, 565–588. [Google Scholar] [CrossRef] [PubMed]
  34. Wright, I.J.; Reich, P.B.; Westoby, M. Strategy shifts in leaf physiology, structure and nutrient content between species of high- and low-rainfall and high- and low-nutrient habitats. Funct. Ecol. 2001, 15, 423–434. [Google Scholar] [CrossRef] [Green Version]
  35. Wellstein, C.; Chelli, S.; Campetella, G.; Bartha, S.; Galiè, M.; Spada, F.; Canullo, R. Intraspecific phenotypic variability of plant functional traits in contrasting mountain grasSLAnds habitats. Biodivers. Conserv. 2013, 22, 2353–2374. [Google Scholar] [CrossRef] [Green Version]
  36. Wellstein, C.; Poschlod, P.; Gohlke, A.; Chelli, S.; Campetella, G.; Rosbakh, S.; Canullo, R.; Kreyling, J.; Jentsch, A.; Beierkuhnlein, C. Effects of extreme drought on specific leaf area of grasSLAnd species: A meta-analysis of experimental studies in temperate and sub-Mediterranean systems. Glob. Chang. Biol. 2017, 23, 2473–2481. [Google Scholar] [CrossRef]
  37. Valladares, F.; Sanchez-Gomez, D.; Zavala, M.A. Quantitative estimation of phenotypic plasticity: Bridging the gap between the evolutionary concept and its ecological applications. J. Ecol. 2006, 94, 1103–1116. [Google Scholar] [CrossRef]
  38. Merilä, J.; Hendry, A.P. Climate change, adaptation, and phenotypic plasticity: The problem and the evidence. Evol. Appl. 2014, 7, 1–14. [Google Scholar] [CrossRef]
  39. Stamp, M.A.; Hadfield, J.D. The relative importance of plasticity versus genetic differentiation in explaining between population differences; a meta-analysis. Ecol. Lett. 2020, 23, 1432–1441. [Google Scholar] [CrossRef]
  40. Palacio-López, K.; Beckage, B.; Scheiner, S.M.; Molofsky, J. The ubiquity of phenotypic plasticity in plants: A synthesis. Ecol. Evol. 2015, 5, 3389–3400. [Google Scholar] [CrossRef]
  41. Blackman, C.J.; Aspinwall, M.J.; Tissue, D.T.; Rymer, P.D. Genetic adaptation and phenotypic plasticity contribute to greater leaf hydraulic tolerance in response to drought in warmer climates. Tree Physiol. 2017, 37, 583–592. [Google Scholar] [CrossRef] [PubMed] [Green Version]
  42. Kramer, K.; Ducousso, A.; Gömöry, D.; Hansen, J.K.; Ionita, L.; Liesebach, M.; Lorenţ, A.; Schueler, S.; Sułkowska, M.; De Vries, S.; et al. Chilling and forcing requirements for foliage bud burst of European beech (Fagus sylvatica L.) differ between provenances and are phenotypically plastic. Agric. For. Meteorol. 2017, 2017, 172–181. [Google Scholar] [CrossRef]
  43. DeWitt, T.J.; Sih, A.; Wilson, D.S. Costs and limits of phenotypic plasticity. Trends Ecol. Evol. 1998, 13, 77–81. [Google Scholar] [CrossRef]
  44. Michalski, S.; Malyshev, A.V.; Kreyling, J. Trait variation in response to varying winter temperatures, diversity patterns and signatures of selection along the latitudinal distribution of the widespread grasSLAnd plantArrhenatherum elatius. Ecol. Evol. 2017, 7, 3268–3280. [Google Scholar] [CrossRef] [PubMed]
  45. Kreyling, J.; Puechmaille, S.J.; Malyshev, A.V.; Valladares, F. Phenotypic plasticity closely linked to climate at origin and resulting in increased mortality under warming and frost stress in a common grass. Ecol. Evol. 2019, 9, 1344–1352. [Google Scholar] [CrossRef] [PubMed]
  46. Fick, S.E.; Hijmans, R.J. WorldClim 2: New 1-km spatial resolution climate surfaces for global land areas. Int. J. Climatol. 2017, 37, 4302–4315. [Google Scholar] [CrossRef]
  47. Ellenberg, H. Vegetation Ecology of Central Europe; Cambridge University Press: Cambridge, UK; New York, NY, USA; New Rochelle, NY, USA; Melbourne, VIC, Australia; Sydney, NSW, Australia, 1988. [Google Scholar]
  48. Führer, E.; Horváth, L.; Jagodics, A.; Machon, A.; Pödör, Z. Application of a new aridity index in Hungarian forestry practice. Idojaras 2011, 3, 205–216. [Google Scholar]
  49. Fang, J.; Lechowicz, M.J. Climatic limits for the present distribution of beech (Fagus L.) species in the world. J. Biogeogr. 2006, 33, 1804–1819. [Google Scholar] [CrossRef]
  50. Stojanović, D.B.; Kržič, A.; Matović, B.; Orlović, S.; Duputié, A.; Djurdjević, V.; Galic, Z.; Stojnić, S. Prediction of the European beech (Fagus sylvatica L.) xeric limit using a regional climate model: An example from southeast Europe. Agric. For. Meteorol. 2013, 176, 94–103. [Google Scholar] [CrossRef]
  51. Gavrilov, M.B.; Lukić, T.; Janc, N.; Basarin, B.; Marković, S.B. Forestry Aridity Index in Vojvodina, North Serbia. Open Geosci. 2019, 11, 367–377. [Google Scholar] [CrossRef]
  52. Von Wühlisch, G.; Liesebach, M.; Muhs, H.J.; Stephan, B.R. A network of international beech provenance trials. In First EUFORGEN Meeting on Social Broadleaves; Turok, J., Kremer, A., de Vries, S., Eds.; International Plant Genetic Resources Institute: Rome, Italy, 1998; pp. 164–172. [Google Scholar]
  53. Vega, C.; González, G.; Bahamonde, H.A.; Valbuena-Carabaña, M.; Gil, L.; Fernández, V. Effect of irradiation and canopy position on anatomical and physiological features of Fagus sylvatica and Quercus petraea leaves. Plant Physiol. Biochem. 2020, 152, 232–242. [Google Scholar] [CrossRef] [PubMed]
  54. Aranda, I.; Pardo, F.; Gil, L.; Pardos, J. Anatomical basis of the change in leaf mass per area and nitrogen investment with relative irradiance within the canopy of eight temperate tree species. Acta Oecologica 2004, 25, 187–195. [Google Scholar] [CrossRef]
  55. Wolf, L. Mikroskopicka Tehnica; National Health Publishing: Praha, Czech Republic, 1950. [Google Scholar]
  56. Holland, N.; Richardson, A.D. Stomatal Length Correlates with Elevation of Growth in Four Temperate Species†. J. Sustain. For. 2009, 28, 63–73. [Google Scholar] [CrossRef]
  57. Sack, L.; Cowan, P.D.; Jaikumar, N.; Holbrook, N.M. The “hydrology” of leaves: Co-ordination of structure and function in temperate woody species. Plant Cell Environ. 2003, 26, 1343–1356. [Google Scholar] [CrossRef] [Green Version]
  58. Vile, D.; Garnier, É.; Shipley, B.; Laurent, G.; Navas, M.-L.; Roumet, C.; Lavorel, S.; Díaz, S.; Hodgson, J.G.; Lloret, F.; et al. Specific Leaf Area and Dry Matter Content Estimate Thickness in Laminar Leaves. Ann. Bot. 2005, 96, 1129–1136. [Google Scholar] [CrossRef]
  59. Aranda, I.; Bergasa, L.F.; Gil, L. Effects of relative irradiance on the leaf structure of Fagus sylvatica L. seedlings planted in the understory of a Pinus sylvestris L. stand after thinning. Ann. For. Sci. 2001, 58, 673–680. [Google Scholar] [CrossRef]
  60. Mátyás, C.; Fady, B.; Vendramin, G. Forests at the limit: Evolutionary—genetic consequences of environmental changes at the receding (xeric) edge of distribution. Report from a researcher workshop. Acta Silv Lign Hung 2009, 66, 201–204. [Google Scholar] [CrossRef]
  61. Pinheiro, J.; Bates, D.; DebRoy, S.; Sarkar, D.; R Core Team. nlme: Linear and Nonlinear Mixed Effects Models, R package version 3.1-150; 2020; Available online: https://cran.r-project.org (accessed on 28 October 2020).
  62. Bartoń, K. MuMIn: Multi-Model Inference, R package version 1.43.17; 2020; Available online: https://cran.r-project.org (accessed on 28 October 2020).
  63. Nakagawa, S.; Schielzeth, H. A general and simple method for obtainingR2from generalized linear mixed-effects models. Methods Ecol. Evol. 2012, 4, 133–142. [Google Scholar] [CrossRef]
  64. Marron, N.; Dreyer, E.; Boudouresque, E.; DeLay, D.; Petit, J.-M.; Delmotte, F.M.; Brignolas, F. Impact of successive drought and re-watering cycles on growth and specific leaf area of two Populus x canadensis (Moench) clones, “Dorskamp” and “Luisa_Avanzo”. Tree Physiol. 2003, 23, 1225–1235. [Google Scholar] [CrossRef] [Green Version]
  65. Robson, T.M.; Sánchez-Gómez, D.; Cano, F.J.; Aranda, I. Variation in functional leaf traits among beech provenances during a Spanish summer reflects the differences in their origin. Tree Genet. Genomes 2012, 8, 1111–1121. [Google Scholar] [CrossRef]
  66. Meier, I.C.; Leuschner, C. Genotypic variation and phenotypic plasticity in the drought response of fine roots of European beech. Tree Physiol. 2008, 28, 297–309. [Google Scholar] [CrossRef] [PubMed]
  67. Aspelmeier, S.; Leuschner, C. Genotypic variation in drought response of silver birch (Betula pendula Roth): Leaf and root morphology and carbon partitioning. Trees 2005, 20, 42–52. [Google Scholar] [CrossRef]
  68. Dunn, J.; Hunt, L.; Afsharinafar, M.; Al Meselmani, M.; Mitchell, A.; Howells, R.; Wallington, E.; Fleming, A.J.; Gray, J.E. Reduced stomatal density in bread wheat leads to increased water-use efficiency. J. Exp. Bot. 2019, 70, 4737–4748. [Google Scholar] [CrossRef] [PubMed]
  69. Lawson, T.; Matthews, J. Guard Cell Metabolism and Stomatal Function. Annu. Rev. Plant Biol. 2020, 71, 273–302. [Google Scholar] [CrossRef] [PubMed] [Green Version]
  70. Bussotti, F.; Prancrazi, M.; Matteucci, G.; Gerosa, G. Leaf morphology and chemistry in Fagus sylvatica (beech) trees as affected by site factors and ozone: Results from CONECOFOR permanent monitoring plots in Italy. Tree Physiol. 2005, 25, 211–219. [Google Scholar] [CrossRef] [PubMed] [Green Version]
  71. Stojnić, S.; Orlovic, S.; Trudić, B.; Živković, U.; Von Wuehlisch, G.; Miljkovic, D. Phenotypic plasticity of European beech (Fagus sylvatica L.) stomatal features under water deficit assessed in provenance trial. Dendrobiology 2015, 73, 163–173. [Google Scholar] [CrossRef] [Green Version]
  72. Stojnić, S.; Orlović, S.; Miljković, D.; Galić, Z.; Kebert, M.; Von Wuehlisch, G. Provenance plasticity of European beech leaf traits under differing environmental conditions at two Serbian common garden sites. Eur. J. For. Res. 2015, 134, 1109–1125. [Google Scholar] [CrossRef]
  73. Li, Y.; Li, H.; Li, Y.; Zhang, S. Improving water-use efficiency by decreasing stomatal conductance and transpiration rate to maintain higher ear photosynthetic rate in drought-resistant wheat. Crop. J. 2017, 5, 231–239. [Google Scholar] [CrossRef]
  74. Lawson, T.; Blatt, M.R.; Yu, L.; Shi, D.; Li, J.; Kong, Y.; Yu, Y.; Chai, G.; Hu, R.; Wang, J.; et al. Stomatal Size, Speed, and Responsiveness Impact on Photosynthesis and Water Use Efficiency. Plant Physiol. 2014, 164, 1556–1570. [Google Scholar] [CrossRef] [Green Version]
  75. Diazlopez, L.; Gimeno, V.; Simón, I.; Martínez, V.; Rodríguez-Ortega, W.; García-Sánchez, F. Jatropha curcas seedlings show a water conservation strategy under drought conditions based on decreasing leaf growth and stomatal conductance. Agric. Water Manag. 2012, 105, 48–56. [Google Scholar] [CrossRef]
  76. George-Jaeggli, B.; Mortlock, M.Y.; Borrell, A.K. Bigger is not always better: Reducing leaf area helps stay-green sorghum use soil water more slowly. Environ. Exp. Bot. 2017, 138, 119–129. [Google Scholar] [CrossRef] [Green Version]
  77. Anyia, A. Water-use efficiency, leaf area and leaf gas exchange of cowpeas under mid-season drought. Eur. J. Agron. 2004, 20, 327–339. [Google Scholar] [CrossRef]
  78. Songsri, P.; Jogloy, S.; Holbrook, C.; Kesmala, T.; Vorasoot, N.; Akkasaeng, C.; Patanothai, A. Association of root, specific leaf area and SPAD chlorophyll meter reading to water use efficiency of peanut under different available soil water. Agric. Water Manag. 2009, 96, 790–798. [Google Scholar] [CrossRef]
  79. Poorter, L.; Markesteijn, L. Seedling Traits Determine Drought Tolerance of Tropical Tree Species. Biotropica 2008, 40, 321–331. [Google Scholar] [CrossRef]
  80. Slot, M.; Poorter, L. Diversity of Tropical Tree Seedling Responses to Drought. Biotropica 2007, 39, 683–690. [Google Scholar] [CrossRef]
  81. Basu, S.; Ramegowda, V.; Kumar, A.; Pereira, A. Plant adaptation to drought stress. F1000Research 2016, 5, 1554. [Google Scholar] [CrossRef]
  82. Tanaka, Y.; Sugano, S.S.; Shimada, T.; Hara-Nishimura, I. Enhancement of leaf photosynthetic capacity through increased stomatal density in Arabidopsis. New Phytol. 2013, 198, 757–764. [Google Scholar] [CrossRef]
  83. Harrison, E.L.; Cubas, L.A.; Gray, J.E.; Hepworth, C. The influence of stomatal morphology and distribution on photosynthetic gas exchange. Plant J. 2020, 101, 768–779. [Google Scholar] [CrossRef] [Green Version]
  84. Davis, M.A.; Wrage, K.J.; Reich, P.B.; Tjoelker, M.G.; Schaeffer, T.; Muermann, C. Survival, growth, and photosynthesis of tree seedlings competing with herbaceous vegetation along a water-light-nitrogen gradient. Plant Ecol. 1999, 145, 341–350. [Google Scholar] [CrossRef]
  85. Franks, P.J.; Beerling, D.J. Maximum leaf conductance driven by CO2 effects on stomatal size and density over geologic time. Proc. Natl. Acad. Sci. USA 2009, 106, 10343–10347. [Google Scholar] [CrossRef] [Green Version]
  86. Fanourakis, D.; Briese, C.; Max, J.; Kleinen, S.; Putz, A.; Fiorani, F.; Ulbrich, A.; Schurr, U. Rapid determination of leaf area and plant height by using light curtain arrays in four species with contrasting shoot architecture. Plant Methods 2014, 10, 9. [Google Scholar] [CrossRef] [PubMed] [Green Version]
  87. Vráblová, M.; Vrábl, D.; Hronková, M.; Kubásek, J.; Šantrůček, J. Stomatal function, density and pattern, and CO2 assimilation in Arabidopsis thaliana tmm1 and sdd1-1 mutants. Plant Biol. 2017, 19, 689–701. [Google Scholar] [CrossRef] [PubMed]
  88. Doheny-Adams, T.; Hunt, L.; Franks, P.J.; Beerling, D.J.; Gray, J.E. Genetic manipulation of stomatal density influences stomatal size, plant growth and tolerance to restricted water supply across a growth carbon dioxide gradient. Philos. Trans. R. Soc. B Biol. Sci. 2012, 367, 547–555. [Google Scholar] [CrossRef] [PubMed]
  89. Bucher, S.F.; Auerswald, K.; Tautenhahn, S.; Geiger, A.; Otto, J.; Müller, A.; Römermann, C. Inter—and intraspecific variation in stomatal pore area index along elevational gradients and its relation to leaf functional traits. Plant Ecol. 2016, 217, 229–240. [Google Scholar] [CrossRef]
  90. Brodribb, T.J.; Holbrook, N.M.; Zwieniecki, M.A.; Palma, B. Leaf hydraulic capacity in ferns, conifers and angiosperms: Impacts on photosynthetic maxima. New Phytol. 2004, 165, 839–846. [Google Scholar] [CrossRef] [PubMed]
  91. Barigah, T.; Saugier, B.; Mousseau, M.; Guittet, J.; Ceulemans, R.J. Photosynthesis, leaf area and productivity of 5 poplar clones during their establishment year. Ann. Sci. For. 1994, 51, 613–625. [Google Scholar] [CrossRef]
  92. Richards, R.A. Selectable traits to increase crop photosynthesis and yield of grain crops. J. Exp. Bot. 2000, 51, 447–458. [Google Scholar] [CrossRef]
  93. Gómez-del-Campo, M.; Ruiz, C.; Lissarrague, J.R. Effect of Water Stress on Leaf Area Development, Photosynthesis, and Productivity in Chardonnay and Airén Grapevines. Am. J. Enol. Vitic. 2002, 53, 138–143. [Google Scholar]
  94. Wortemann, R.; Herbette, S.; Barigah, T.S.; Fumanal, B.; Alia, R.; Ducousso, A.; Gomory, D.; Roeckel-Drevet, P.; Cochard, H. Genotypic variability and phenotypic plasticity of cavitation resistance in Fagus sylvatica L. across Europe. Tree Physiol. 2011, 31, 1175–1182. [Google Scholar] [CrossRef] [Green Version]
  95. Čortan, D.; Nonić, M.; Šijačić-Nikolić, M. Phenotypic Plasticity of European Beech from International Provenance Trial in Serbia. In Advances in Global Change Research; Springer Science and Business Media LLC: Berlin/Heidelberg, Germany, 2019; pp. 333–351. [Google Scholar]
  96. Petkova, K.; Molle, E.; Konnert, M.; Knutzen, F. Comparing German and Bulgarian provenances of European beech (Fagus sylvatica L.) regarding survival, growth and ecodistance. Silva Balc. 2019, 2, 27–48. [Google Scholar]
  97. Sáenz-Romero, C.; Kremer, A.; Nagy, L.; Újvári-Jármay, É.; Ducousso, A.; Kóczán-Horváth, A.; Hansen, J.K.; Mátyás, C. Common garden comparisons confirm inherited differences in sensitivity to climate change between forest tree species. Peer J. 2019, 7, e6213. [Google Scholar] [CrossRef]
  98. Robson, T.M.; Rasztovits, E.; Aphalo, P.J.; Alía, R.; Aranda, I. Flushing phenology and fitness of European beech (Fagus sylvatica L.) provenances from a trial in La Rioja, Spain, segregate according to their climate of origin. Agric. For. Meteorol. 2013, 180, 76–85. [Google Scholar] [CrossRef]
  99. Frank, A.; Pluess, A.R.; Howe, G.T.; Sperisen, C.; Heiri, C. Quantitative genetic differentiation and phenotypic plasticity of European beech in a heterogeneous landscape: Indications for past climate adaptation. Perspect. Plant Ecol. Evol. Syst. 2017, 26, 1–13. [Google Scholar] [CrossRef]
  100. Gianoli, E.; Valladares, F. Studying phenotypic plasticity: The advantages of a broad approach. Biol. J. Linn. Soc. 2011, 105, 1–7. [Google Scholar] [CrossRef] [Green Version]
  101. Hewitt, G.M. Some genetic consequences of ice ages, and their role in divergence and speciation. Biol. J. Linn. Soc. 1996, 58, 247–276. [Google Scholar] [CrossRef]
  102. Hewitt, G.M. Post-glacial re-colonization of European biota. Biol. J. Linn. Soc. 1999, 68, 87–112. [Google Scholar] [CrossRef]
  103. Lander, T.A.; Klein, E.K.; Roig, A.; Oddou-Muratorio, S. Weak founder effects but significant spatial genetic imprint of recent contraction and expansion of European beech populations. Heredity 2020, 1–14. [Google Scholar] [CrossRef]
  104. Callahan, H.S.; Maughan, H.; Steiner, U.K. Phenotypic Plasticity, Costs of Phenotypes, and Costs of Plasticity. Ann. N. Y. Acad. Sci. 2008, 1133, 44–66. [Google Scholar] [CrossRef] [Green Version]
  105. McDonald, J.M.C.; Ghosh, S.M.; Gascoigne, S.J.L.; Shingleton, A.W. Plasticity Through Canalization: The Contrasting Effect of Temperature on Trait Size and Growth in Drosophila. Front. Cell Dev. Biol. 2018, 6, 156. [Google Scholar] [CrossRef]
  106. Debat, V.; David, P. Mapping phenotypes: Canalization, plasticity and developmental stability. Trends Ecol. Evol. 2001, 16, 555–561. [Google Scholar] [CrossRef]
  107. Klingenberg, C.P. Phenotypic Plasticity, Developmental Instability, and Robustness: The Concepts and How They Are Connected. Front. Ecol. Evol. 2019, 7, 7. [Google Scholar] [CrossRef] [Green Version]
  108. Yeh, P.J.; Price, T.D. Adaptive Phenotypic Plasticity and the Successful Colonization of a Novel Environment. Am. Nat. 2004, 164, 531–542. [Google Scholar] [CrossRef] [PubMed]
  109. Nicotra, A.B.; Atkin, O.; Bonser, S.; Davidson, A.; Finnegan, E.; Mathesius, U.; Poot, P.; Purugganan, M.; Richards, C.; Valladares, F.; et al. Plant phenotypic plasticity in a changing climate. Trends Plant Sci. 2010, 15, 684–692. [Google Scholar] [CrossRef] [PubMed]
  110. Ghalambor, C.K.; McKay, J.K.; Carroll, S.P.; Reznick, D.N. Adaptive versus non-adaptive phenotypic plasticity and the potential for contemporary adaptation in new environments. Funct. Ecol. 2007, 21, 394–407. [Google Scholar] [CrossRef]
  111. Anderson, J.T.; Song, B. Plant adaptation to climate change—Where are we? J. Syst. Evol. 2020, 58, 533–545. [Google Scholar] [CrossRef]
  112. Van Buskirk, J.; Steiner, U.K. The fitness costs of developmental canalization and plasticity. J. Evol. Biol. 2009, 22, 852–860. [Google Scholar] [CrossRef]
  113. Scheiner, S.M. The genetics of phenotypic plasticity. XVI. Interactions among traits and the flow of information. Evolution 2018, 72, 2292–2307. [Google Scholar] [CrossRef]
Figure 1. Localities of the tested provenances (dots) and provenance plots (squares).
Forests 11 01359 g001
Figure 2. Mean values and standard errors of stomatal and leaf morphological traits per provenance: length of guard cell (LA, (A)), stomatal density (SD, (B)), potential conductance index (PCI, (C)), leaf size (Sleaf, (D)), leaf dry weight (mleaf, (E)) and specific leaf area (SLA, (F)). The red colour represents provenances growing in the Czech provenance plot, and the blue colour represents provenances growing in the Slovak provenance plot. The dashed horizontal line represents the average per plot with the surrounding standard error interval band. Provenances are arranged based on the Ellenberg quotient of the original site (blue to red x axis band).
Forests 11 01359 g002
Figure 3. Linear regression results showing the relationship between ecodistance (EQED, FAIED, TED, T59 ED) and stomatal morphological traits, stomatal density (SD, (A,B,E,F)) and the potential conductance index (PCI, (C,D)). Positive values on the horizontal axis represent transfer to a drier/hotter environment (red arrow), and negative values represent transfer to a more humid/colder environment (blue arrow).
Forests 11 01359 g003
Figure 4. Phenotypic plasticity indices of stomatal density (SDPI), guard cell length (LA PI), the potential conductance index (PCIPI), leaf size (Sleaf PI), leaf dry weight (mleaf PI) and specific leaf area (SLAPI) for each provenance. Plasticity indices obtain values of 0 to 1, where 0 denotes no plasticity and 1 denotes theoretical maximal plasticity. Confidence intervals represent standard error and the capital letters correspond to results of post-hoc analysis.
Forests 11 01359 g004
Figure 5. Linear regression results showing the relationship between isothermality (IsoT, (A,C)), latitude (Lat, (B)) and precipitation seasonality (SeasPrec, (D)) of the provenance’s original site and plasticity indices (LA PI, PCIPI).
Forests 11 01359 g005
Figure 6. Visualization of the relationship between plasticity indices (PCIPI, (A); SLAPI, (B)) and the observed mortality of provenances in the Czech (red) and Slovak (blue) provenance plot. The linear regression was significant only for drier Czech provenance plot.
Forests 11 01359 g006
Table 1. Geographic and climate characteristics of provenance plots and their original locations.
ProvenanceLongLatAltTT59PrecPrec59EQFAIIsoTSeasprec
FR042.5844.1585010.816.880434423.85.43.814
LUX126.249.674008.614.986636519.74.83.111
UK17−3.4257.67108.212.767130321.85.33.619
SWE2313.255.57407.914.364028625.96.22.621
GER2610.6753.65558.31567831925.55.13.017
AU3514.147.7212502.49.214957797.61.33.226
AU3614.8547.5311002.99.9116864810.41.63.132
PL4322.8249.259006.314.176243321.52.92.735
PL6718.1754.332505.813.263333624.64.32.430
CZ Zbraslav14.3749.953608.2515.653233033.55.1nana
SK Tále19.0348.638506.5814.184244119.12.5nana
Long—longitude, Lat—latitude, Alt—altitude, T—annual average temperature, T59—average temperature during the vegetation season, Prec—sum of annual precipitation, Prec59—sum of precipitation during the vegetation season, EQ—Ellenberg quotient, FAI—Forest Aridity Index, IsoT—isothermality, Seasprec—precipitation seasonality, na—not available.
Table 2. Results of two-way ANOVAs for each stomatal and leaf morphological trait.
FactorDfTraitLASDPCImleafSleafSLA
Provenance1F57.9517.6511.593.7910.830.69
p**************0.64
Plot8F1771.5457.41221.2531.3521.589.48
p*****************
Provenance × Plot8F18.094.6427.662.723.921.64
p*************0.13
LA—length of guard cells, SD—stomatal density, PCI—potential conductance index, Sleaf—leaf size, mleaf—dry weight per leaf, SLA—specific leaf area, significance levels *** <0.001 ** <0.01 * <0.05.
Publisher’s Note: MDPI stays neutral with regard to jurisdictional claims in published maps and institutional affiliations.

