Article

The Influence of Pressure on Local Heat Transfer Rate under the Vapor Bubbles during Pool Boiling

Kutateladze Institute of Thermophysics, 630090 Novosibirsk, Russia
*
Author to whom correspondence should be addressed.
Energies 2023, 16(9), 3918; https://doi.org/10.3390/en16093918
Submission received: 14 April 2023 / Revised: 30 April 2023 / Accepted: 3 May 2023 / Published: 5 May 2023
(This article belongs to the Special Issue Heat Transfer and Fluid Dynamics in Boiling Systems)

Abstract

:
This paper presents the results of an experimental study on the evolution of a nonstationary temperature field during ethanol pool boiling in a pressure range of 12–101.2 kPa. Experimental data were obtained using infrared thermography with high temporal and spatial resolutions, which made it possible to reconstruct the distribution of the heat flux density and to study the influence of pressure reduction on the local heat transfer rate in the vicinity of the triple contact line under vapor bubbles for the first time. It is shown that, for all studied pressures, a significant heat flux density is removed from the heating surface due to microlayer evaporation, which exceeds the input heat power by a factor of 3.3–27.7, depending on the pressure. Meanwhile, the heat transfer rate in the area of the microlayer evaporation significantly decreases with the pressure reduction. In particular, the local heat flux density averaged over the microlayer area decreases by four times as the pressure decreases from 101.3 kPa to 12 kPa. Estimates of the microlayer profile based on the heat conduction equation were made, which showed the significant increase in the microlayer thickness with the pressure reduction.

1. Introduction

Boiling is one of the most efficient heat transfer regimes, widely used in various technologies. To date, quite a large number of experimental and theoretical studies devoted to various aspects of boiling have been presented. Despite this, today there is no complete theory of heat transfer during nucleate boiling [1,2,3]. In particular, to calculate the heat transfer coefficients (HTC) during the boiling of various liquids under various conditions, dozens of semi-empirical correlations are given in the literature, which usually describe only a narrow change range of regime parameters. This is due to the fact that boiling is a multiscale nonstationary process, and for its correct description it is necessary to take into account the effects that take place on various scales, down to micro- and even nanoscales (Figure 1).
One of the phenomena that occur on the microscale during boiling is the formation and further evaporation of a liquid layer under a vapor bubble, which is called a microlayer due to its small thickness [4,5,6]. As can be seen from Figure 1, this region is limited on one side by the wall–liquid–vapor contact line and the surrounding liquid (the so-called macrolayer) on the other. To date, it has generally been accepted that the process of formation and evaporation of a microlayer is an essential and important part of a vapor bubble dynamics [7,8,9]. Moreover, it was shown in a number of papers [10,11,12,13] that the evaporation of a microlayer is one of the key mechanisms explaining the high intensity of heat transfer during nucleate boiling. Finally, understanding the nature and influence of various parameters on the microlayer evaporation rate is important to develop and fabricate micro- and nanostructured heating surfaces to achieve maximum heat transfer rates and critical heat fluxes during boiling [14,15,16].
However, despite the rather large number of papers devoted to both the experimental study on microlayer evolution and structure [5,6,7,8,9,10,11,12] and the numerical simulation of its evaporation [17,18,19,20], a number of questions remain open. One of such issues is the influence of system parameters (pressure, subcooling degree, gravity level, etc.), as well as the properties of a heating surface (wettability, capillary wicking, structure, etc.) on the evolution and structure of a microlayer.
Pressure is one of the most important parameters in a boiling system, the change in which has a complex effect on the nucleation, dynamics of vapor bubbles, heat transfer rate and the development of boiling crisis phenomena. At the same time, it is known that the pressure reduction below atmospheric level leads not only to a quantitative, but also to a qualitative change in the boiling character [21,22,23,24,25]. In particular, a decrease in pressure is accompanied by a decrease in the intensity of heat transfer and a decrease in the critical heat flux, the nucleation of bubbles becomes more unstable and takes place at larger surface superheating. As a result, a noticeable change in the local characteristics of boiling (bubble growth rates, departure diameters, nucleation frequency, etc.) is observed. However, as the literature analysis shows, in contrast to boiling at atmospheric pressure, today there is practically no information about the features of local heat transfer and the dynamics of the contact line under vapor bubbles during boiling at subatmospheric pressures. Among other things, this is due to the fact that in most experimental studies the analysis of the temperature of a heating surface during boiling was carried out using thermocouples or temperature sensors. This method of temperature measurement can only be used to analyze the surface temperature averaged over the heater area.
Today, to measure the temperature field distribution of various objects, including boiling systems, the method of high-speed infrared thermography is widely used, which is devoid of the above-mentioned disadvantages. As an analysis of the papers of various authors (e.g., [10,23,26,27,28,29,30,31,32,33,34]) shows, this technique makes it possible to obtain fundamentally new information about the local and integral multiscale characteristics of boiling, as well as about the development of crisis phenomena under various conditions. In particular, infrared thermography allows the features of heat transfer in the vicinity of the triple contact line to be studied, including the evaporation of the microlayer during boiling [10,11].
In the present paper, an experimental study on the evolution of a nonstationary temperature field during the pool boiling of ethanol at pressures 12–101.2 kPa was performed. Experimental data were obtained using infrared thermography with high temporal and spatial resolutions, which made it possible to reconstruct the distribution of the heat flux density and to study the influence of pressure reduction on the local heat transfer rate in the vicinity of the triple contact line under the vapor bubbles.

2. Materials and Methods

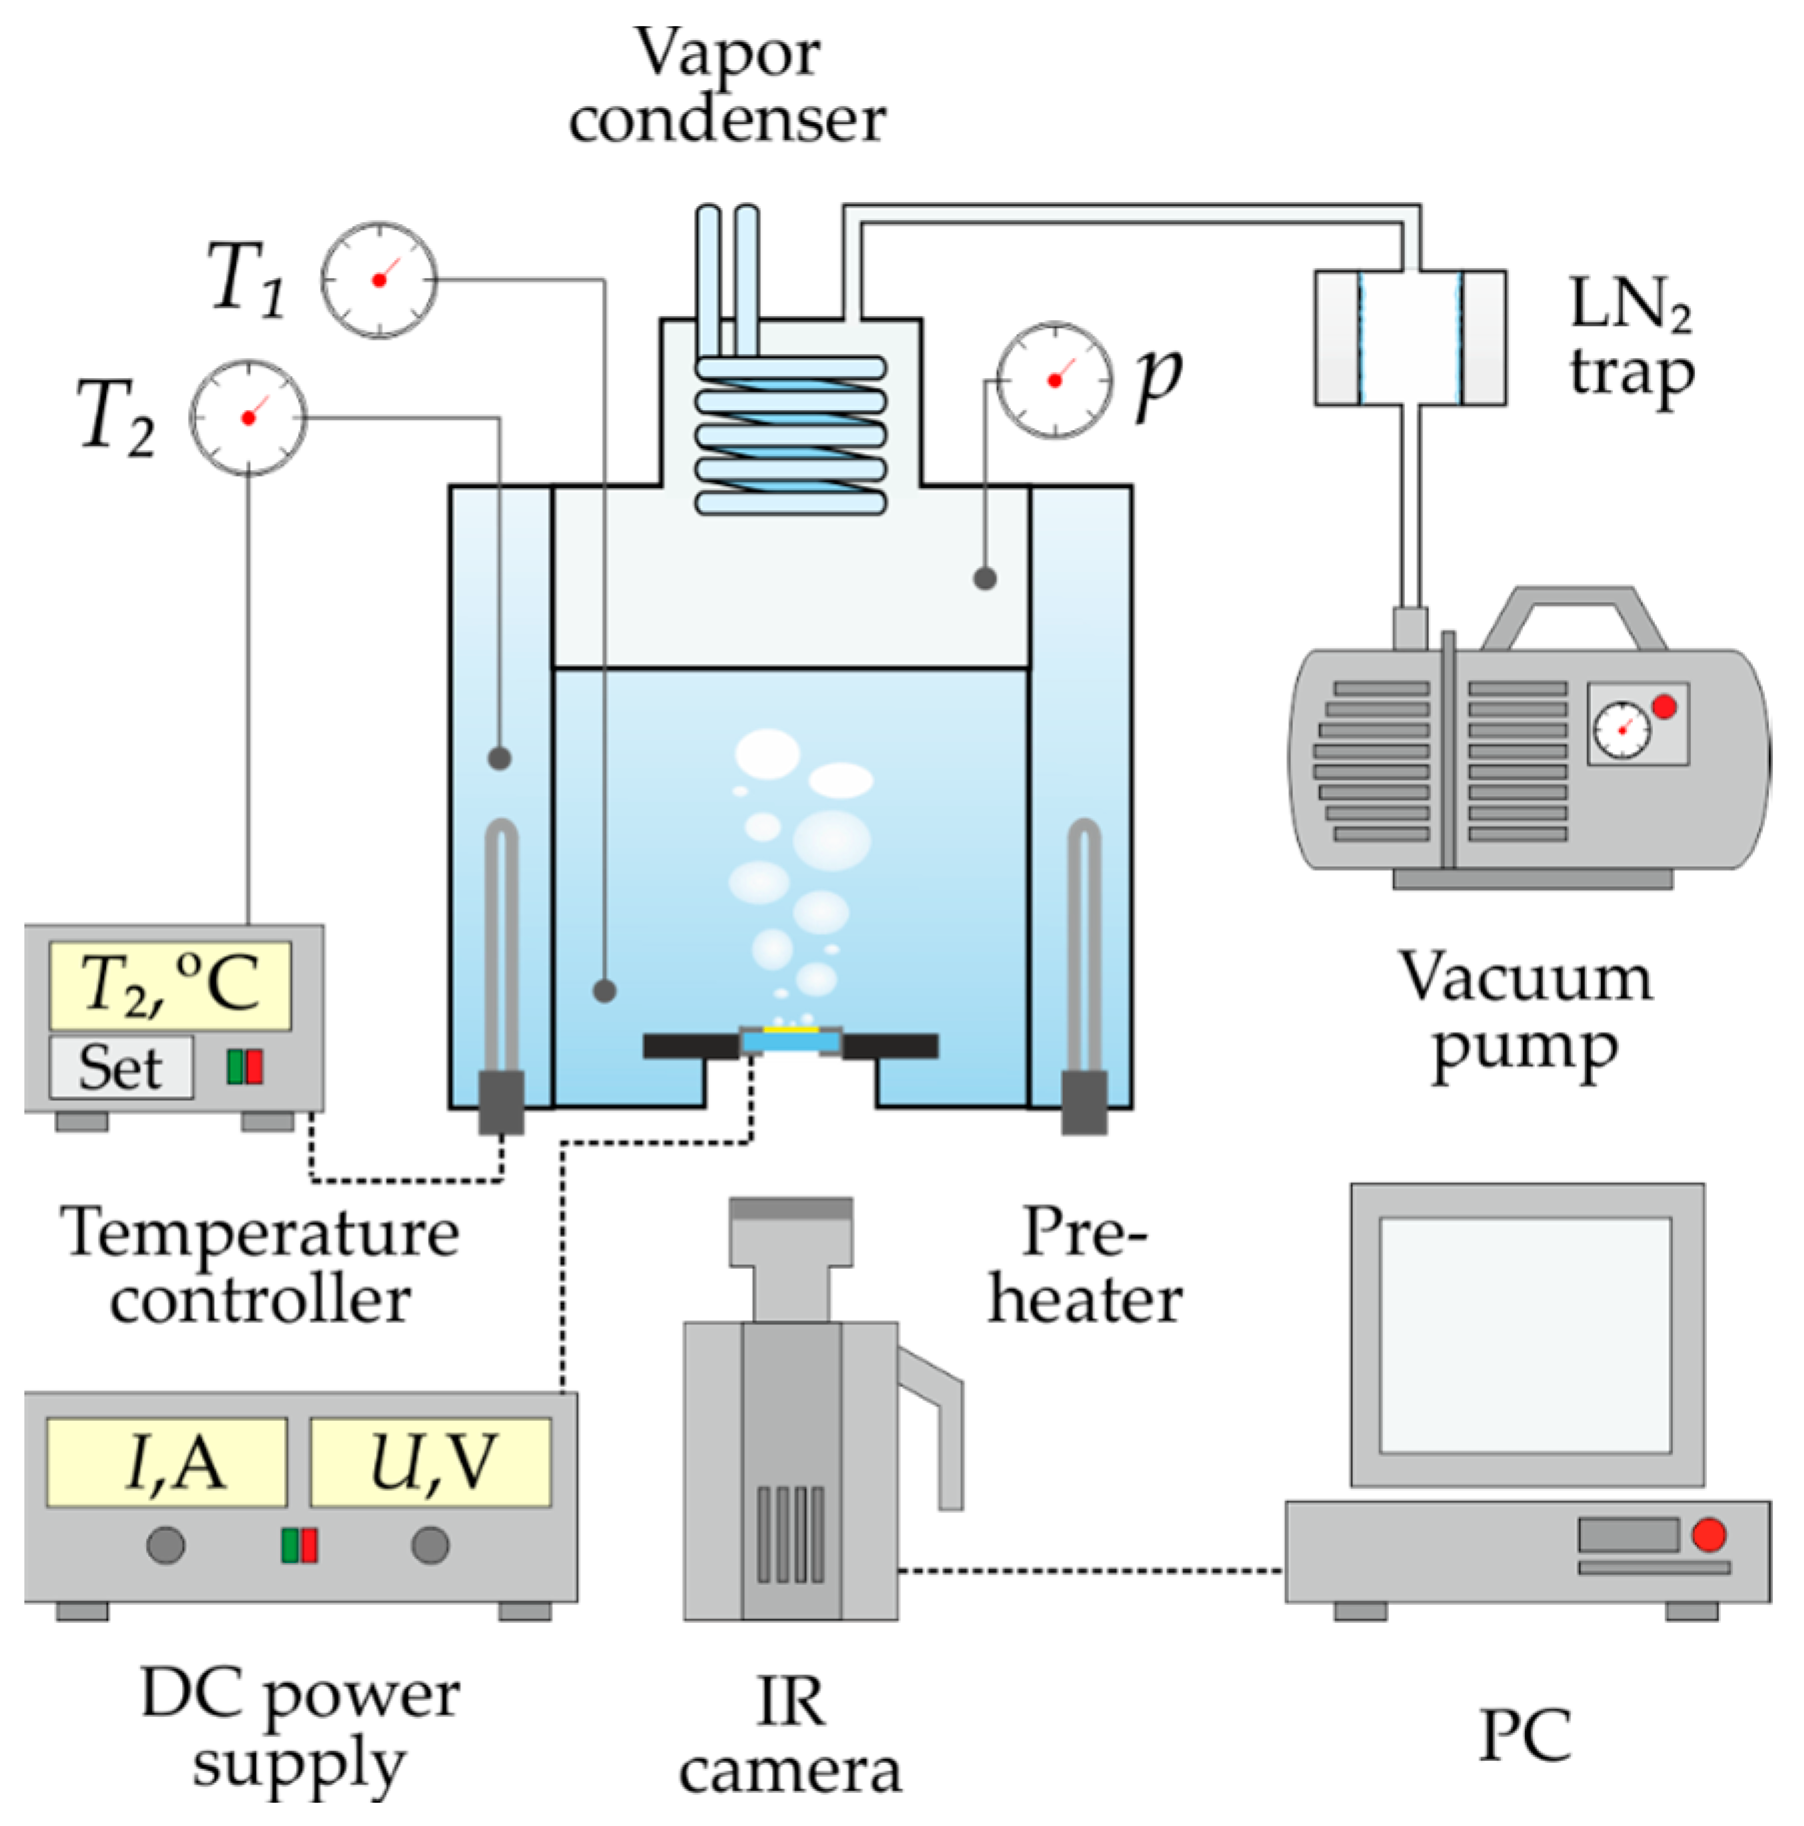
2.1. Experimental Setup

The experiments were performed using the setup, a schematic view of which is shown in Figure 2. The setup consists of two sealed parts. To maintain a constant temperature of the working fluid, the inner volume was placed in thermostatic chamber filled with deionized water. The water temperature in the thermostatic volume was set at the required level using the Danfoss EKC-102 electronic temperature controller and two pre-heaters, each with a power of 1.2 kW. The temperature of the liquid in the inner volume (T1) and the outer chamber (T2) was monitored using Honeywell HEL 700 and NTC thermistors, respectively. In order to avoid the system pressure increase in the working area during boiling experiments, the internal volume was equipped with a water-cooled vapor condenser.
To perform boiling experiments under subatmospheric pressure conditions, the setup was evacuated according to DIN 28400-1-1990 norm. The required pressure level in the working volume was set using a rotary vane vacuum pump EVP 2XZ-1C, equipped with a liquid nitrogen trap, and controlled using a digital piezoresistive vacuum gauge Thyracont VD81. The value of the reduced pressure ps in the experiments was calculated based on the readings of the vacuum gauge (p), taking into account the influence of the hydrostatic pressure of the working fluid column with height h:
ps = p + ρlgh
As the working fluid, 95% ethanol was used under the saturation conditions at a given pressure ps. During experiments on boiling at low pressures, it is extremely important to correctly calculate the system conditions. In the present study, for such conditions (ps, Tsat), the ones near a heating surface were considered. To do this, in each experiment the value of the reduced pressure was calculated according to (1) and the corresponding saturation temperature of the working fluid Tsat was taken from the tabular data. The following reduced pressures were studied in the paper: 12 kPa (Tsat = 32.4 °C), 21.8 kPa (Tsat = 44.3 °C), 35 kPa (Tsat = 53.6 °C), 57.6 kPa (Tsat = 64.7 °C), 80 kPa (Tsat = 72.4 °C) and 101.3 kPa (Tsat = 78.6 °C).

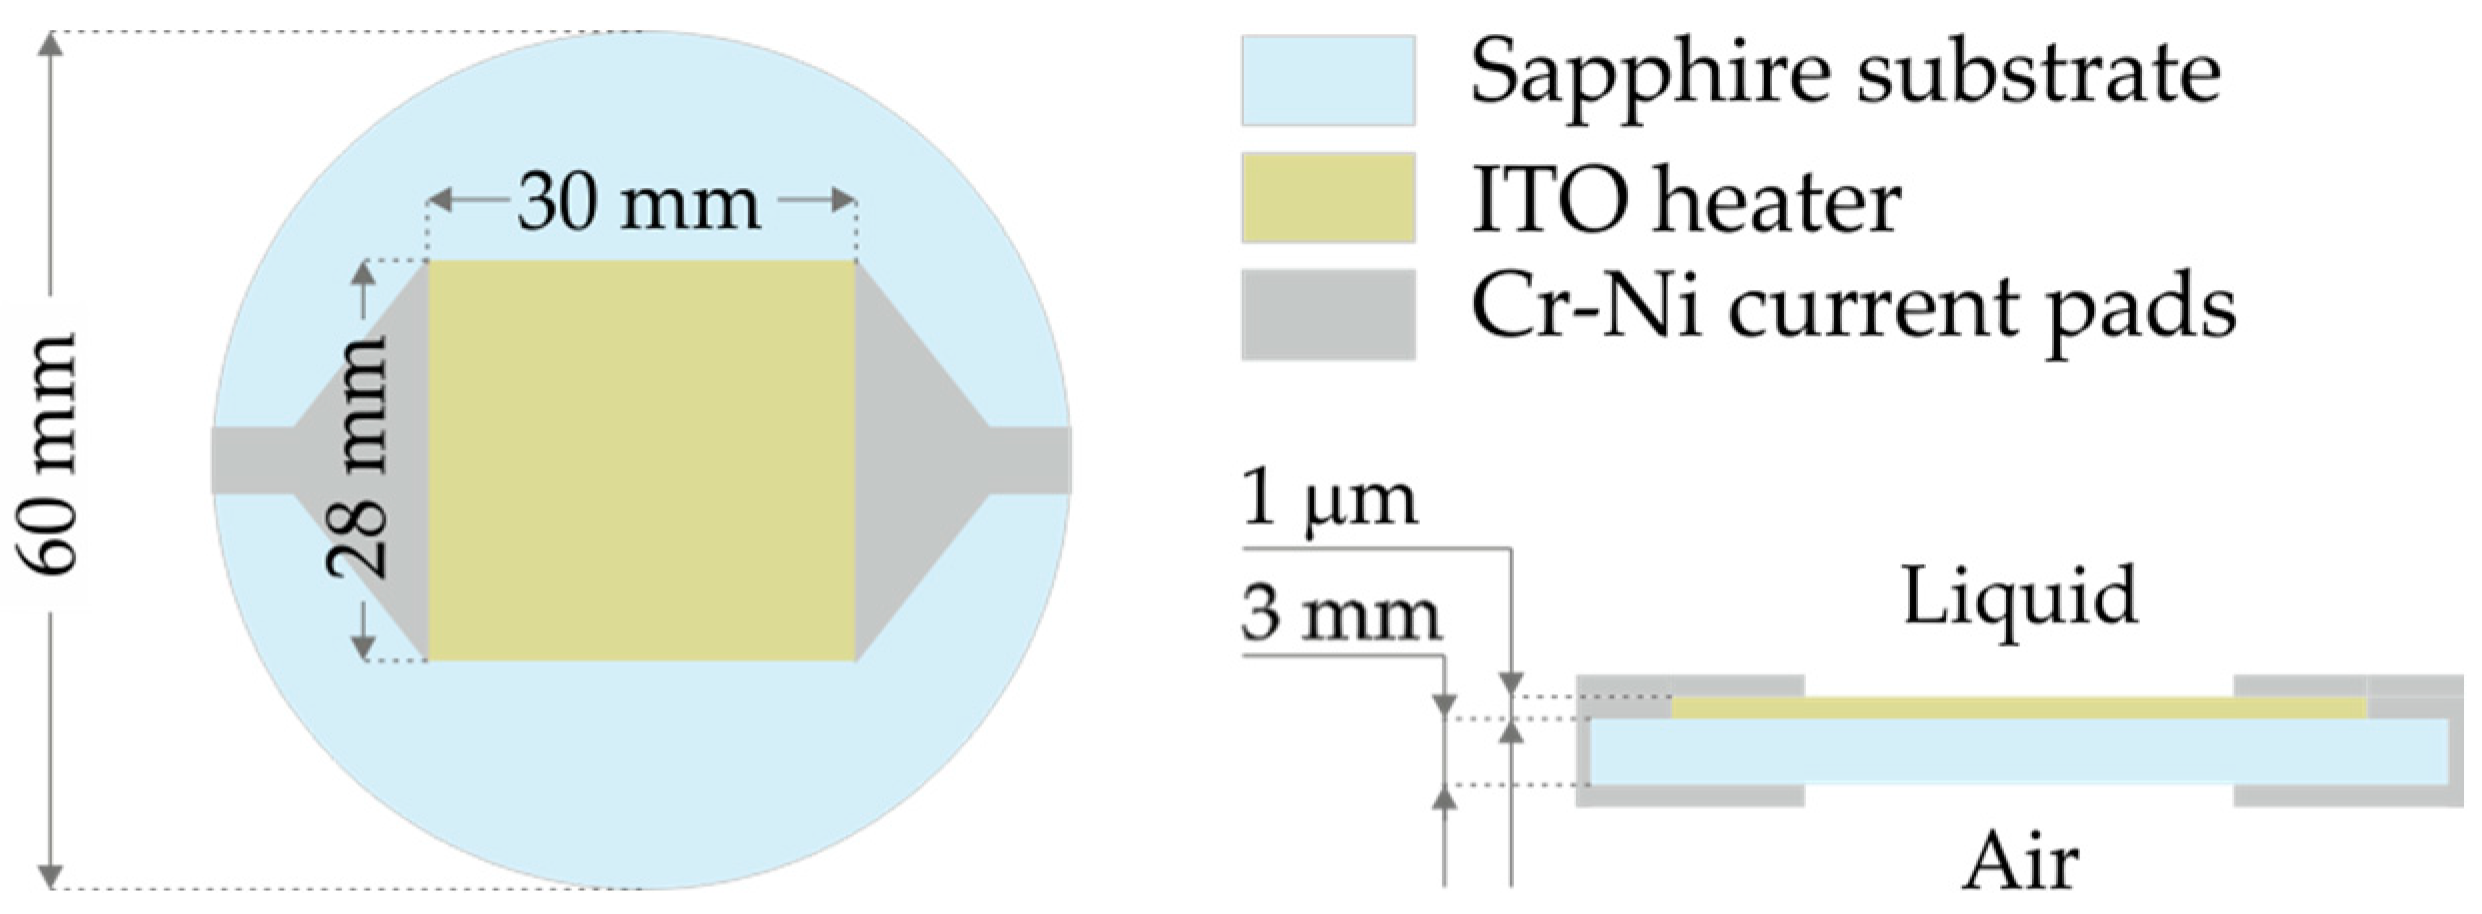
2.2. Heating Surface

The heating surface used in the study (Figure 3) was a conductive film of indium-tin oxide (ITO), 1 µm thick, deposited by ion sputtering onto a sapphire substrate 60 mm in diameter and 3 mm thick. The area of the heat release was 30 × 28 mm2. Samples were resistively heated by a DC power supply Elektro Automatik PS 8080-60 DT via thin (2 µm) chromium-nickel electrodes vacuum deposited onto the ITO film and brought to the reverse side of the sapphire substrate.
An important advantage of using indium–tin oxide as a heater material in experiments to study boiling characteristics is its transparency in the visible wavelength range (380–750 nm) and opacity in the mid-IR range (3–5 µm). In turn, the integral transmission capacity of a sapphire in the 0.3–5 µm wavelength range exceeds 80%. The combination of these properties makes it possible to measure the non-stationary temperature field on the ITO film using an infrared camera with corresponding spectral range and to visually record the vapor bubble dynamics on the heating surface using a video camera [23,26,27,28,29,30,31].
In the present study, the transient temperature field of the ITO heater was recorded using a FLIR X6530sc high-speed infrared camera with a spectral range of 1.5–5.1 µm, 160 × 128 resolution and a frame rate of 1500 fps. The spatial resolution of the IR recording in the experiments was 250 μm per pixel. Prior to the boiling experiments, the IR camera was calibrated using a resistance temperature detector located near the film heater [23].
Prior to the experiments, an analysis of the physicochemical properties of the heat-releasing surface was performed. According to the profilometry performed using the Bruker Contour GT-K1 optical profilometer, the ITO film roughness was Ra = 3 nm, which classifies it as an “ultra” smooth heating surface. Using the KRUSS DSA 100 setup, an analysis of the wetting properties of the ITO film was performed for the working fluid to determine the value of the static contact angle (θ). According to these measurements, the value of θ was about 10°. To additionally check the working fluid for the absence of harmful insoluble impurities, the wetting properties of the heating surface were also investigated after boiling experiments. An analysis of these results showed that the measured values of the contact wetting angles before and after the experiments are consistent with each other within the error (±2°), which indicates sufficient purity of the used liquid and the absence of harmful impurities in it.

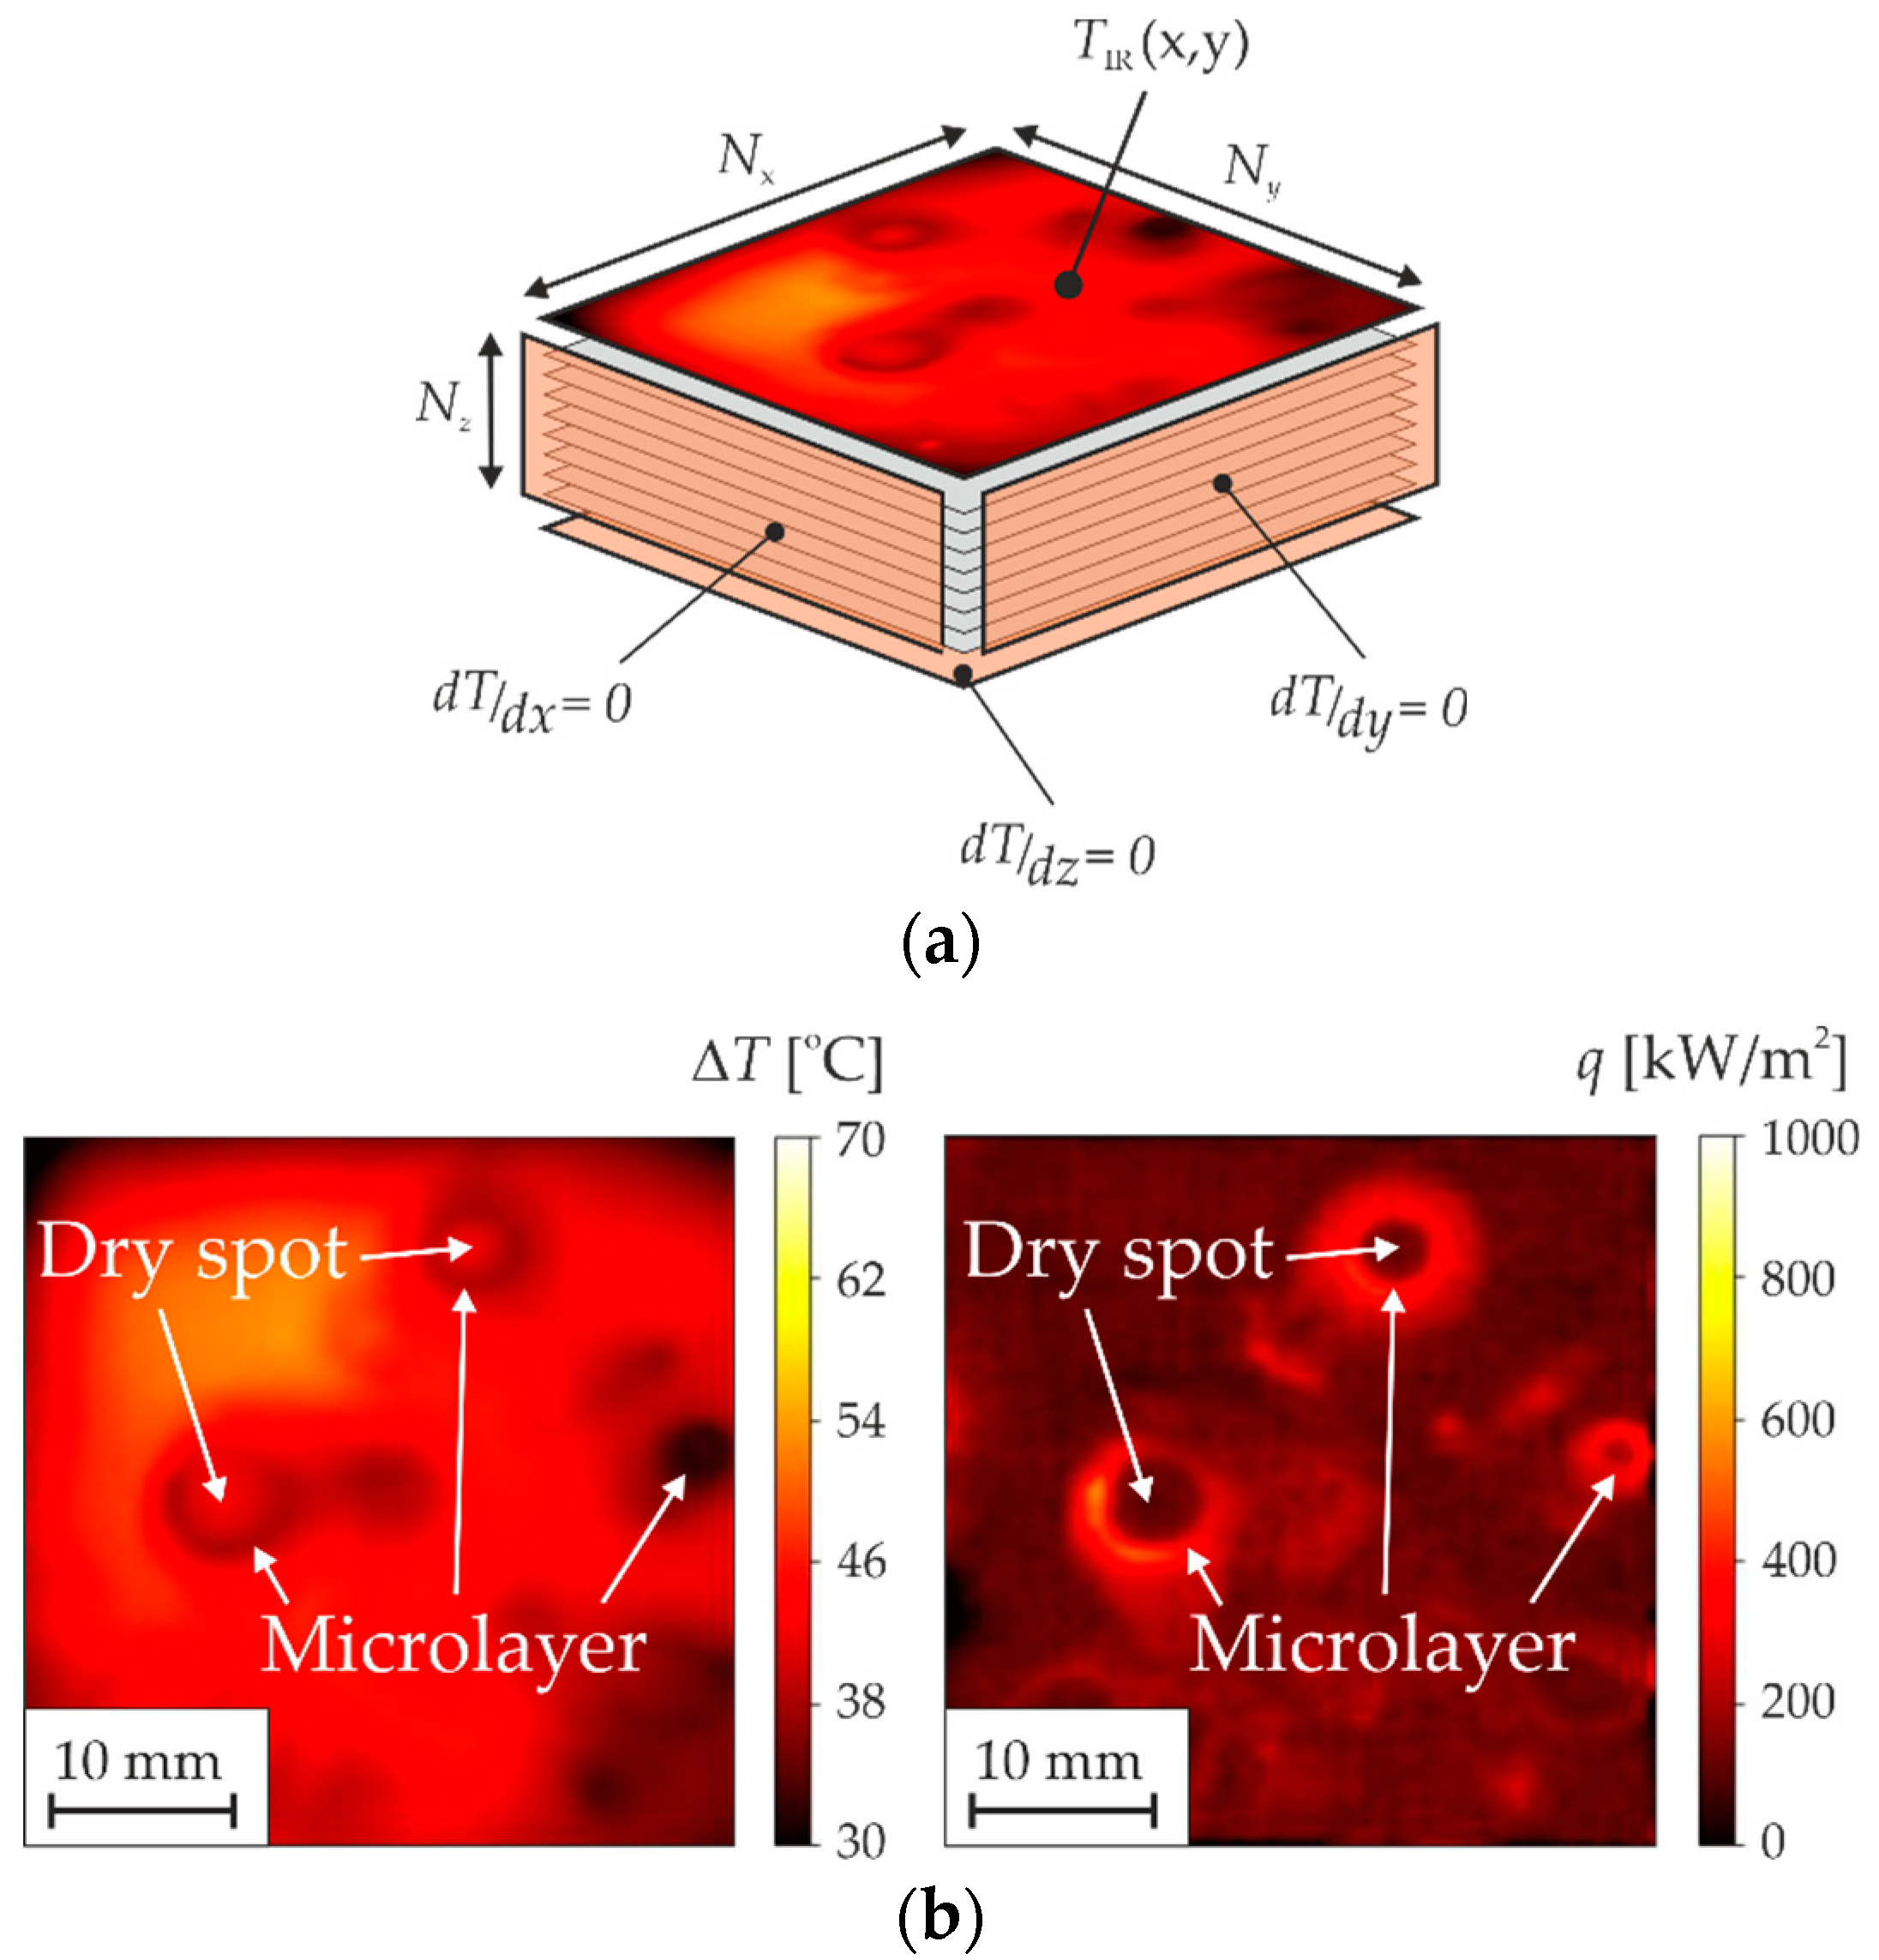
2.3. Local Heat Flux Calculation

To analyze the local density of the heat flux coming from the heater to the liquid, a numerical calculation was performed using the experimental data of infrared thermography on the evolution of the ITO film temperature field. Below, the problem of heat conduction to recover local heat fluxes will be described. In the study, a numerical solution of the non-stationary heat conduction equation was performed, which has the following form:
T t = λ sap 2 T x 2 + 2 T y 2 + 2 T z 2 .
The three-dimensional internal volume of the sapphire substrate (Figure 4a) was used as the computational domain, bounded from above and below by the outer boundaries of the sapphire, and from the sides by the boundaries of the heat release region. The boundary conditions were given as follows:
T ( x , y ) z = z max = T I R ( x , y ) ,
T z z = 0 = 0 , T x x = 0 , x = x max = 0 , T y y = 0 . y = y max = 0 .
These conditions correspond to the absence of heat losses to the sides, which, as the analysis of the experimental results showed, is quite correct. The temperature field of the wall–liquid contact surface changed with time, as happened in the experiment.
The calculations were performed using an explicit finite difference scheme. The splitting of the calculated area along the X and Y axes corresponded to the splitting of the IR frame to the pixels. The splitting along the Z axis and in time were chosen based on the analysis of the decrease in the calculation error with an increase in the amount of splitting. For calculations at intermediate moments between recorded IR frames, the temperature field was recovered using linear interpolation. The temperature field measured with IR camera was set as the initial temperature distribution in the calculated volume on all layers.
As a result of the numerical calculations, the non-stationary temperature distribution in the volume of the sapphire substrate was recovered. To calculate the density of the heat flux incoming to the liquid, the energy conservation condition was used, which takes into account the heat release in the ITO film qinput:
q l = q input q sap ,
where qsap is the heat flux density going into the sapphire substrate, determined on the basis of the calculated temperature distribution in the volume of sapphire:
q sap = λ T z
As an example, Figure 4b shows an IR recording frame and the corresponding calculated distribution of the heat flux density during the boiling of ethanol at ps = 21.8 kPa (qinput = 150 kW/m2). As can be seen, the obtained experimental data and the heat fluxes map calculated on their basis make it possible to identify and analyze various heat transfer areas in the vicinity of the contact line (Figure 1). In particular, the area in the center of the vapor bubble with a higher temperature and with a lower heat flux density consequently is a dry spot bounded by a triple contact line. In turn, the region along the periphery of the bubble with the minimum temperature and the maximum heat flux density corresponds to the region of a microlayer evaporation.

2.4. Measurements Uncertainties

The uncertainty of the pressure measurement consists of the sum of the pressure sensor accuracy and the accuracy of the liquid column height h measurement. The total pressure measurement error was about 1% in the experiments. In turn, the uncertainty of the input heat flux measurement includes inaccuracies associated with the current, voltage gauging, and heat losses. According to the apparatus data sheets, the total error in current and voltage measurements is no more than 1%. In turn, the 2D numerical calculation in Comsol Multiphysics was performed to analyze the lateral heat losses for the steady-state conditions. The results showed that the heat losses contribute about 5%, since the sapphire substrate has a relatively low thermal conductivity and the heat transfer coefficients on the ITO-liquid surface are rather high. Therefore, the total uncertainty of the heat flux density measurement in the experiments was about 6%. The major contributions to the uncertainty of the surface temperature measurements using IR camera are an uncertainty associated with the calibration procedure and camera sensitivity. According to the analysis, the total uncertainty of the surface temperature measurement was no more than 1.5 K.
To verify the correctness of the performed data gathering and curation, a comparison of the obtained results on the heat transfer rate during boiling at atmospheric pressure with the models of Rohsenow, 1952 [35] and Yagov, 1988 [36] was made (Figure 5). As the literature analysis shows, these models are some of the most used to describe boiling data for various liquids and heating surfaces.
As can be seen from Figure 5, the experimental data show the same trend as the used dependencies, which confirms that the data were collected correctly. However, it is also seen that the experiments show lower values of HTC compared to the calculations. Apparently, this is due to a rather low roughness of the heating surface used in the study. In particular, it is well known [37] that smooth and ultrasmooth surfaces are characterized by much lower heat transfer rates during boiling compared to the so-called technical surfaces, for which the semi-empirical models shown in Figure 5 were developed.

3. Results

3.1. Heat Transfer Rate

First of all, the effect of the pressure reduction on the heat transfer rate during ethanol boiling was studied. To do this, the values of the integral temperature of the heating surface (averaged over the area and recording time (10 s)) were obtained based on the IR recording data. As the result, the corresponding boiling curves qT) were plotted for various pressures (Figure 6a). As can be seen from the figure, the pressure reduction in a given range is accompanied by a significant increase in the onset of nucleate boiling (ONB). In particular, if for atmospheric pressure conditions the onset of nucleate boiling corresponds to surface superheating ΔT = 14 K, then for the lowest studied pressure (12 kPa) this value is 37 K.
Using the obtained data, the heat transfer coefficients HTC were also determined and dependencies of HTC(ps) were constructed for different heat flux densities qinput (Figure 6b). An analysis of the obtained curves shows that for all presented heat flux densities, the dependence of HTC(ps) has a linear form. The pressure reduction from 101.3 kPa to 12 kPa leads to the heat transfer deteriorating by approximately 40%. The literature analysis shows that the results on the influence of pressure reduction on heat transfer rate during boiling obtained in the present study are consistent with the data of other authors obtained using different liquids, including ethanol [38].
As noted in the introduction, such a decrease in the heat transfer rate during boiling with the pressure reduction is directly related to a significant change in the nucleation and vapor bubbles dynamics. This is clearly demonstrated by the analysis of heat flux distribution maps obtained according to the algorithm described in Section 2.3 (Figure 7).
In particular, Figure 7 demonstrates that a noticeable decrease in the number of nucleation sites happens with the pressure reduction, while the departure diameters of the vapor bubbles and their lifetime on the heating surface increase. In addition, it is clearly seen that in the area of microlayer evaporation, the local heat flux density decreases with pressure reduction. At the same time, it is also seen that a change in pressure affects the heat transfer rate in the regions free of vapor bubbles, i.e., the convective component of the heat transfer according to the mechanistic approach [39,40]. Thus, for atmospheric pressure, the average heat flux density removed by the convection does not exceed 50 kW/m2, while for pressures below 35 kPa this value is about 150 kW/m2, which is comparable to the input heat power. In the future, the authors plan to perform a more detailed analysis of the effect of pressure reduction on the contribution of various heat transfer mechanisms (e.g., convection, microlayer evaporation, and quenching) during boiling, based on the machine learning algorithms [41] of infrared thermography dataset analysis. Further, a more detailed analysis of the features of local heat transfer under single nucleation sites during boiling at various pressures will be presented.

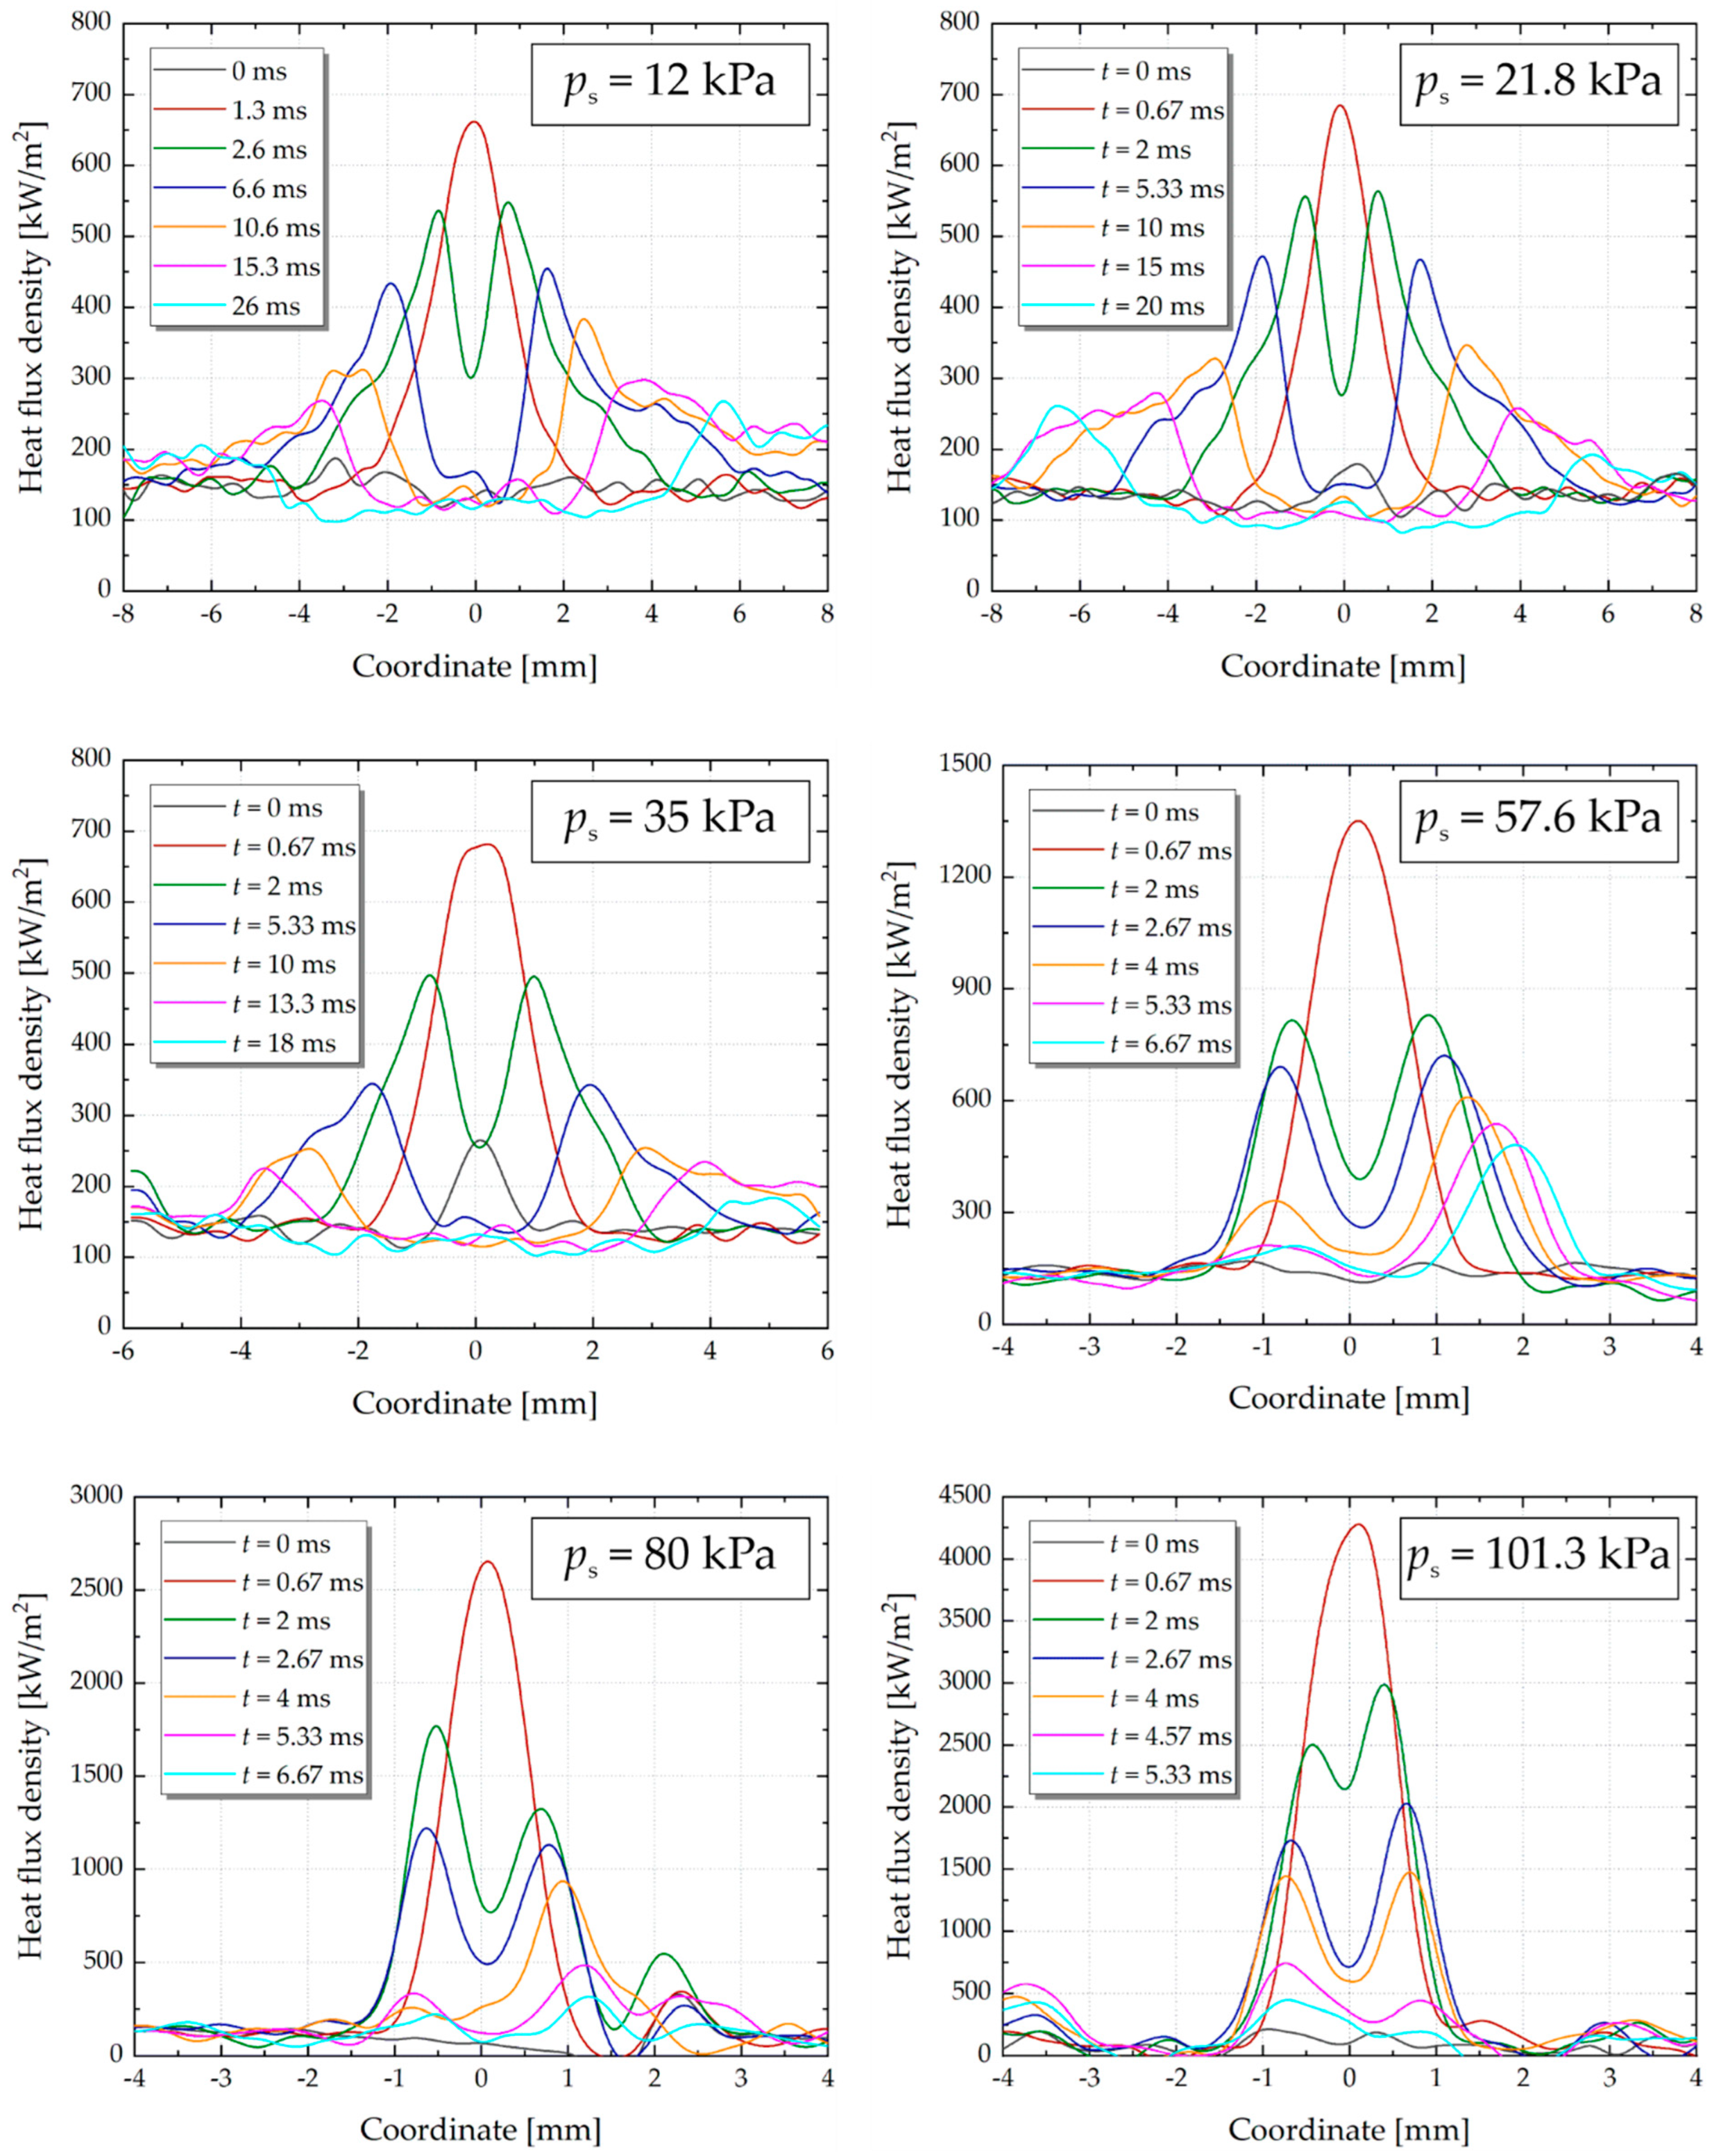
3.2. Local Heat Transfer under the Vapor Bubbles

Figure 8 demonstrates the heat flux density distribution under a vapor bubble at different moments for various pressures and the same input heat flux density (qinput = 150 kW/m2). It can be seen that for all pressures, the maximum local heat flux is observed in the region of microlayer evaporation at the initial stage of vapor bubble growth (t = 0.67–1.3 ms depending on pressure). Additionally, the appearance of a region with reduced heat transfer under the vapor bubble’s center is clearly visible for all bubbles, which corresponds to the formation and growth of a dry spot on a heating wall. As a result, the local heat flux spent to evaporate the microlayer decreases as the bubble grows and becomes comparable to the input heat power at the final stage of the bubble’s lifecycle. In addition, the presented figures reveal a significant effect of a pressure reduction on the complete depletion time of the microlayer, which is associated with a significant increase in the lifetime of a bubble with a decrease in pressure. In particular, for atmospheric pressure, the microlayer fully evaporated in 6 ms. In turn, as the pressure decreased to ps = 12 kPa, this value increased to more than 26 ms.
In the further analysis of the microlayer region, the following criteria were used to determine its boundaries: the inner microlayer boundary corresponds to the maximum intensity of local heat transfer. In turn, the outer boundary of the microlayer was determined from the condition that the local heat flux does not change with distance from the bubble center.
In addition, the presented figures show that the region of microlayer evaporation noticeably increases in size with pressure reduction. In particular, if its maximum transverse size during boiling at atmospheric pressure is about 2.5 mm, then at 12 kPa this value is more than 10 mm. On the one hand (also taking into account the longer lifetime of the microlayer), this suggests that during boiling at low pressures, the evaporation of the microlayer should make a greater contribution to the overall heat transfer compared to boiling at atmospheric conditions. On the other hand, the results obtained indicate a noticeable decrease in the density of the heat flux removed from the heating surface due to the microlayer evaporation with pressure reduction. As noted earlier, the authors plan to use the obtained data for a more accurate analysis of the effect of pressure reduction on the contribution of various mechanisms, including microlayer evaporation, to the heat transfer during boiling.
An analysis of the results shows that with pressure reduction, the maximum heat flux density spent to microlayer evaporation decreases significantly (Figure 9a). Thus, the ratio of this value (qml max) to the input heat flux density decreases from 27.7 times (qml max ≈ 4.36 × 10³ kW/m2) at boiling under atmospheric pressure to 3.3 times (qml max ≈ 484 kW/m2) at ps = 12 kPa.
Additionally, two trends are observed in Figure 9a. If the pressure reduction from atmospheric to 35 kPa demonstrates close to linear dependence qml max(ps), then a further decrease in pressure to 12 kPa no longer leads to such a significant drop in the heat transfer intensity in the microlayer evaporation region. It is interesting to note that in the previous studies of the authors [23], a change in the dynamics of the contact line under vapor bubbles was also experimentally found during water boiling at a similar pressure. In particular, the authors showed that if pressure reduction to 42 kPa leads to a decrease in the growth rate of the dry spot (which is directly related to the evaporation of the microlayer), then a further pressure reduction, on the contrary, is characterized by an increasing growth rate of the dry spot. This indicates that, apparently, at these pressure levels, there is a change in the determining mechanisms of the intensity of microlayer evaporation and the dynamics of the triple contact line. Nevertheless, an accurate answer to this question requires a comprehensive analysis of both the dynamics of the contact line and the structure of the microlayer during the boiling of various liquids at various pressures.
Using the obtained experimental data, the evolution of the local heat flux averaged over the area of microlayer evaporation was also studied for various pressures (Figure 9b). It can be seen that for all studied pressures, the main contribution to heat transfer is made by the evaporation of the microlayer at the initial stage of vapor bubble growth. This figure again indicates that the pressure reduction leads to a noticeable decrease in the heat flux density spent to evaporate the microlayer. In particular, the heat flux density averaged over the microlayer area decreases by four times with a pressure reduction from atmospheric level to 12 kPa.

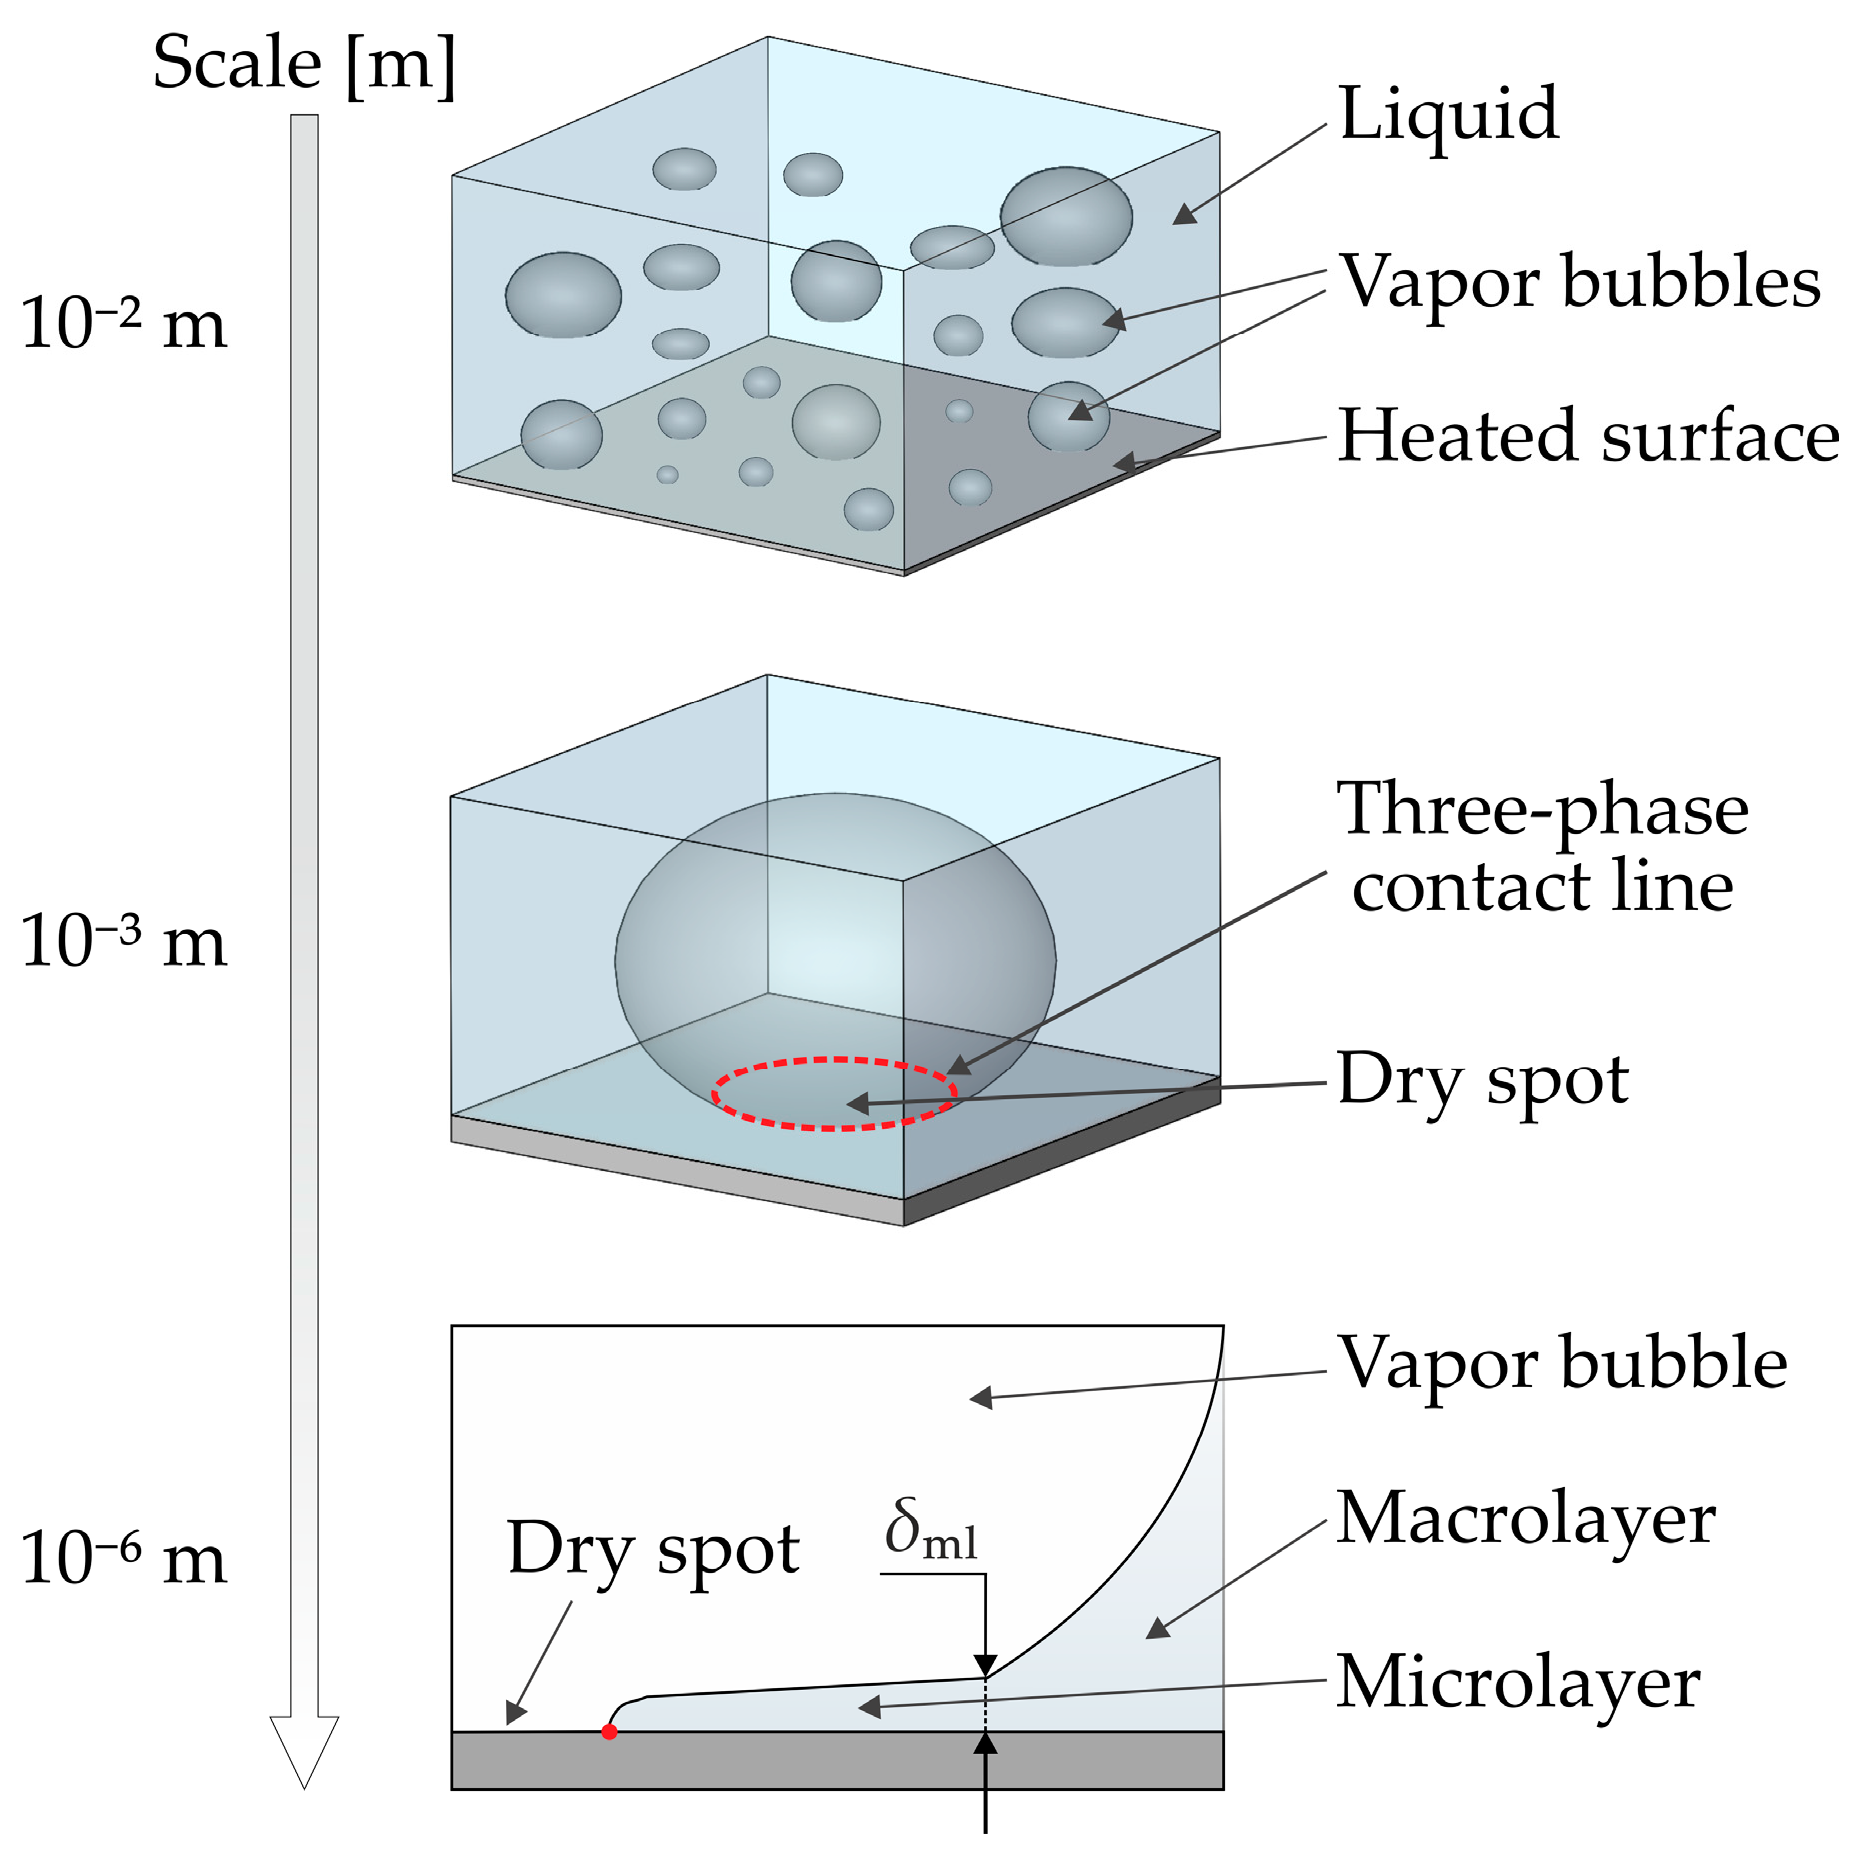
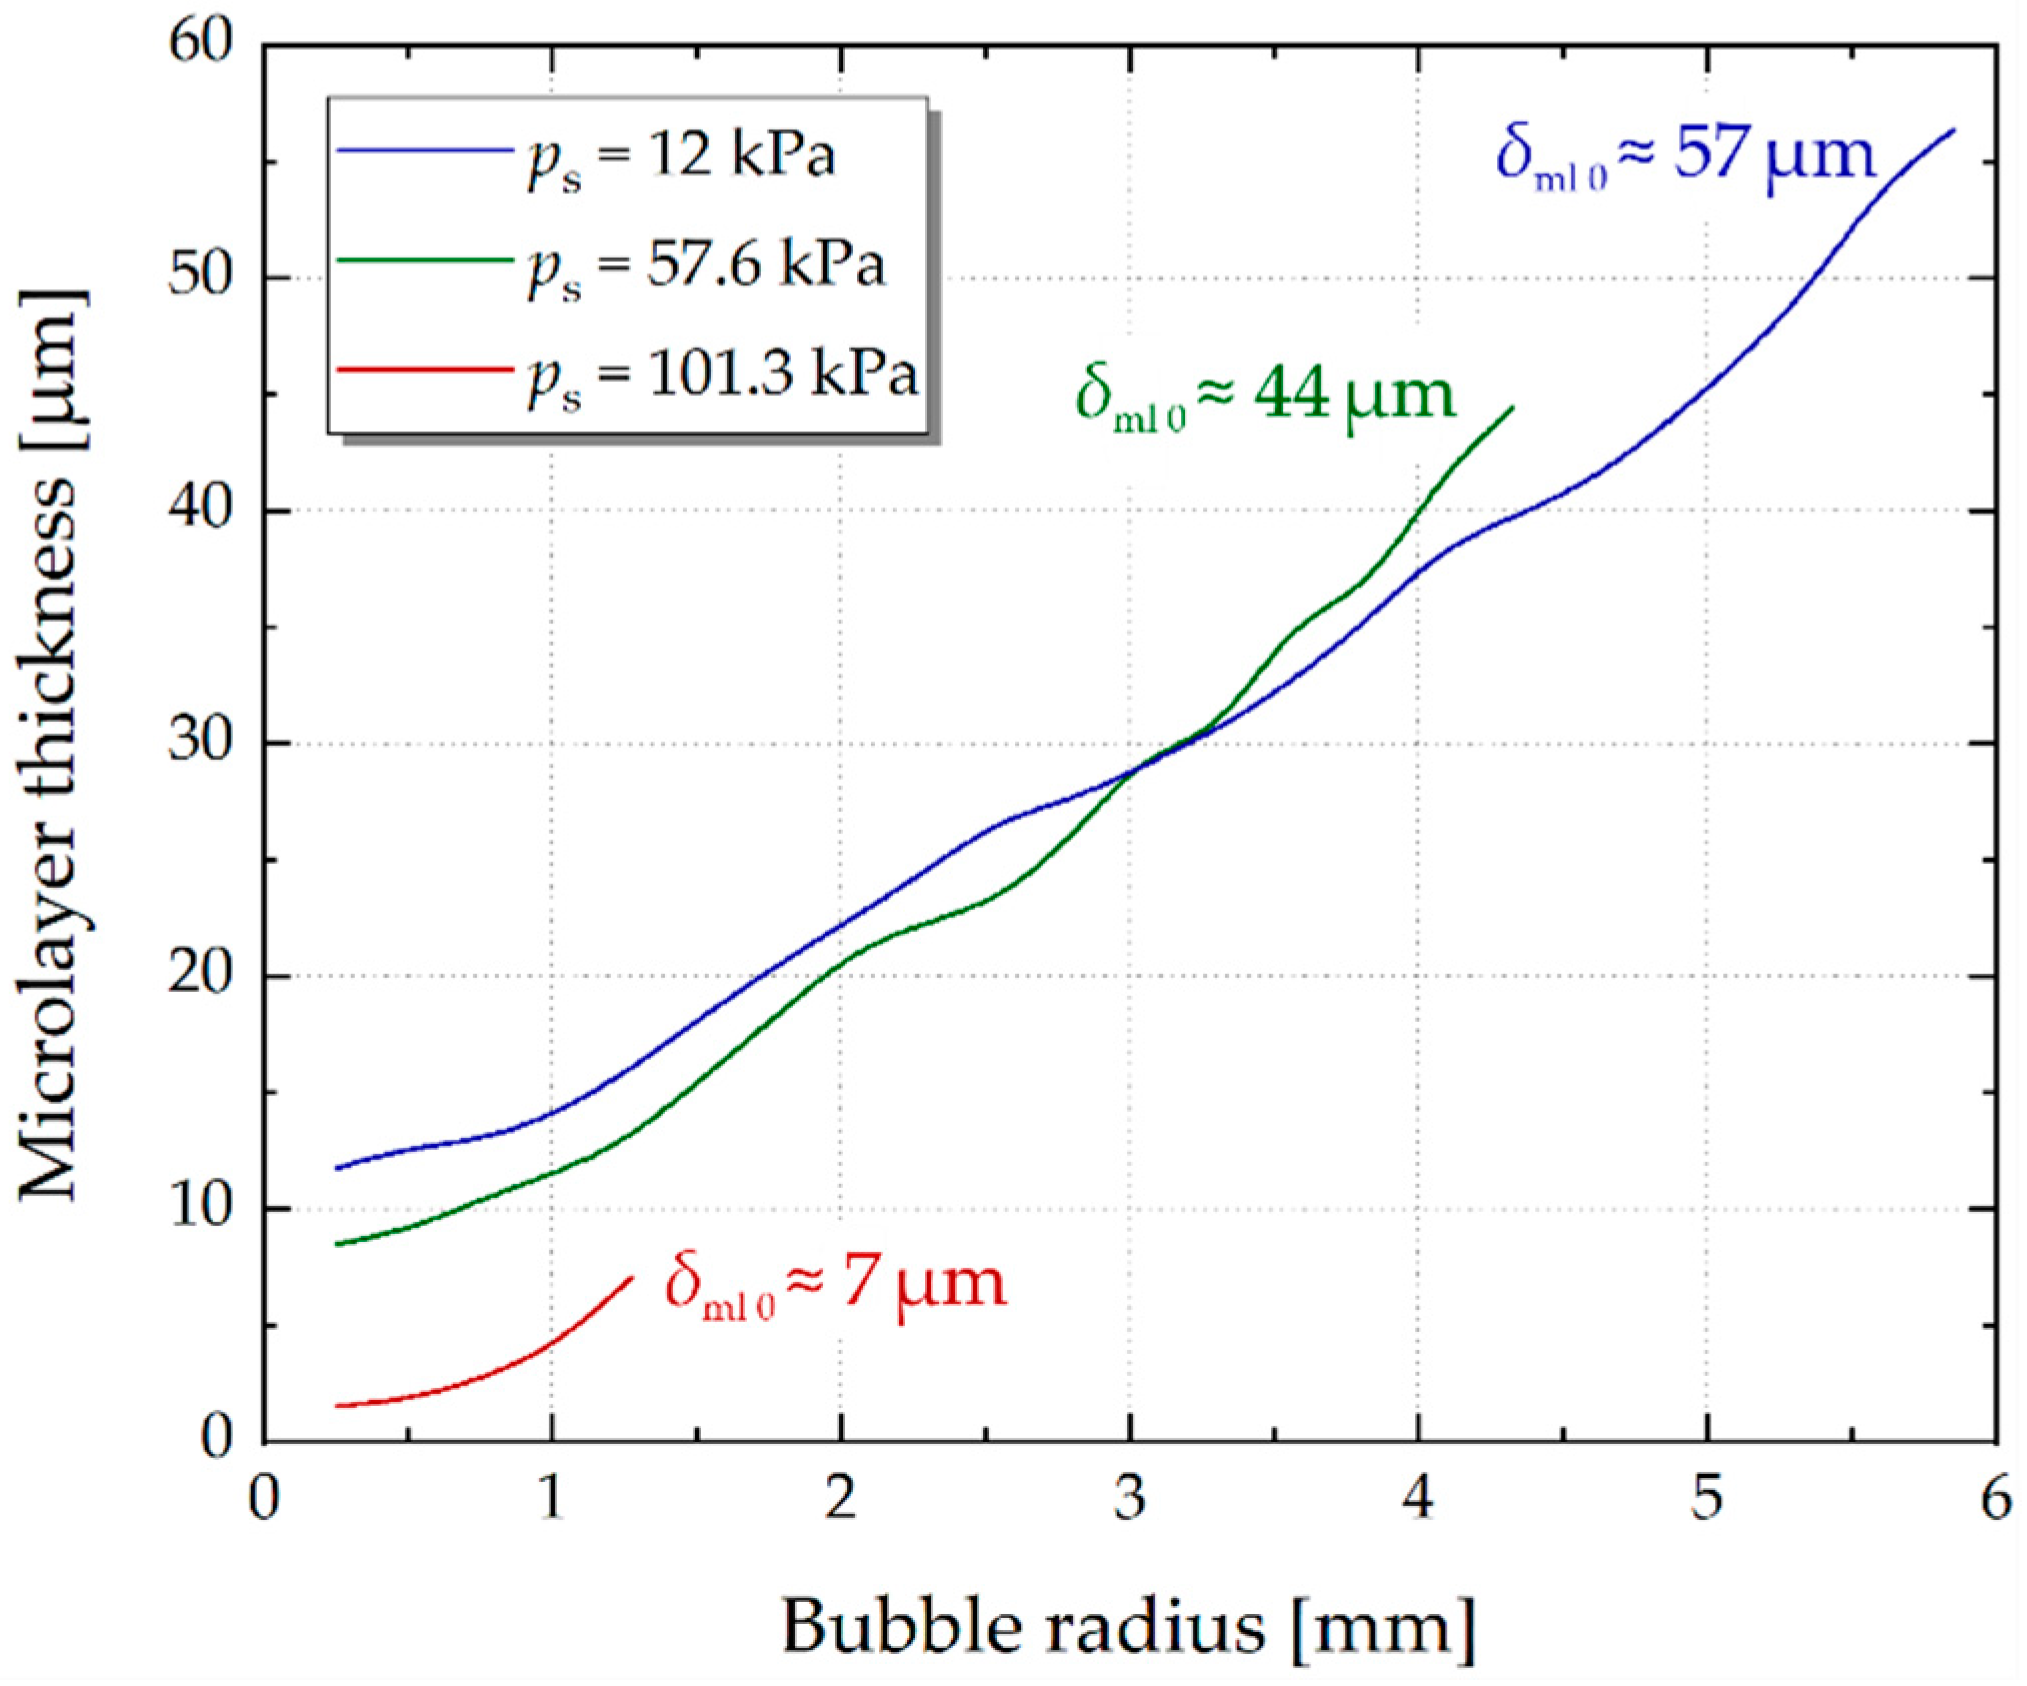
3.3. Microlayer Thickness Estimation

Using the obtained data on the heat flux densities spent to evaporate the microlayer, it becomes possible to reconstruct its profile δml(Rb), where δml is the thickness of the microlayer at a distance Rb from the center of a bubble. A fairly simple estimate can be made using the following heat conduction equation:
q ml = k l δ ml T w T i
where Tw is the temperature of a heating surface and Ti is the temperature at the vapor–liquid interface. In this case, the temperature Ti was taken to be the saturation temperature for a given pressure. Figure 10 shows the microlayer profiles at the initial moment of its formation for pressures ps = 12, 57.6 and 101.3 kPa. Additionally, the values of the so-called initial thickness of the microlayer δml 0 (Figure 1) are presented. The obtained profiles show that with a pressure reduction from atmospheric pressure to the lowest one, the microlayer becomes more than eight times thicker. Moreover, it can be seen that at ps = 12 kPa, the minimum thickness of the microlayer in the vicinity of the triple contact line is noticeably larger and is about 10 μm. This may be due to a significant change in the shape of vapor bubbles during boiling at subatmospheric pressures and their strong deviation from the spherical shape characteristic of boiling at atmospheric pressure. In particular, a number of authors showed via high-speed video recordings [22,23,25] that the vapor bubbles formed during boiling in vacuum have a “mushroom” shape with a pronounced vapor stem, which connects the bubble body with a heating surface.
It is important to note here that the performed analysis is only an estimate of the microlayer thickness during boiling at various pressures, which does not claim to be quantitatively accurate. In particular, a number of authors [42,43] showed that the heat flux spent to evaporate the microlayer depends significantly on the so-called evaporation resistance associated with the molecular dynamics of the evaporation process at the liquid–vapor interface. Ignoring it and calculating the microlayer thickness only using the heat conduction Equation (7) shows overestimated values of δml(Rb). For an accurate description of the microlayer profile, it is necessary to perform direct experimental observations using interferometric methods [6,7,10,12], which make it possible to study the process of its formation and growth with high temporal and spatial resolutions and to study the δml(Rb) dependence in detail. Here, the method of LED interferometry proposed recently in [44] should be especially noted, which is a simpler alternative to laser interferometry for studying the structure and evolution of a microlayer during boiling. Using the example of water flow boiling, the authors of [44] showed that this relatively easy-to-implement technique makes it possible to obtain distinct interference patterns during the formation and growth of bubbles, which makes it possible to analyze the microlayer thickness. The usage of LED interferometry simultaneously with the high-speed infrared thermography is promising for studying the effect of pressure on the microlayer structure during boiling. The authors of the present paper plan to perform such a study in the near future.

4. Conclusions

In the present paper, the effect of pressure reduction on the local heat transfer in the vicinity of the contact line during pool boiling under conditions was studied for the first time. Experimental data on the evolution of the non-stationary temperature field of the heating surface during the ethanol boiling in the pressure range of 12–101.3 kPa were obtained using high-speed infrared thermography. The developed numerical algorithm made it possible to reconstruct the distribution of the heat flux density over the heater for various pressures and to study the heat transfer in the area of microlayer evaporation. The analysis of the data showed the following:
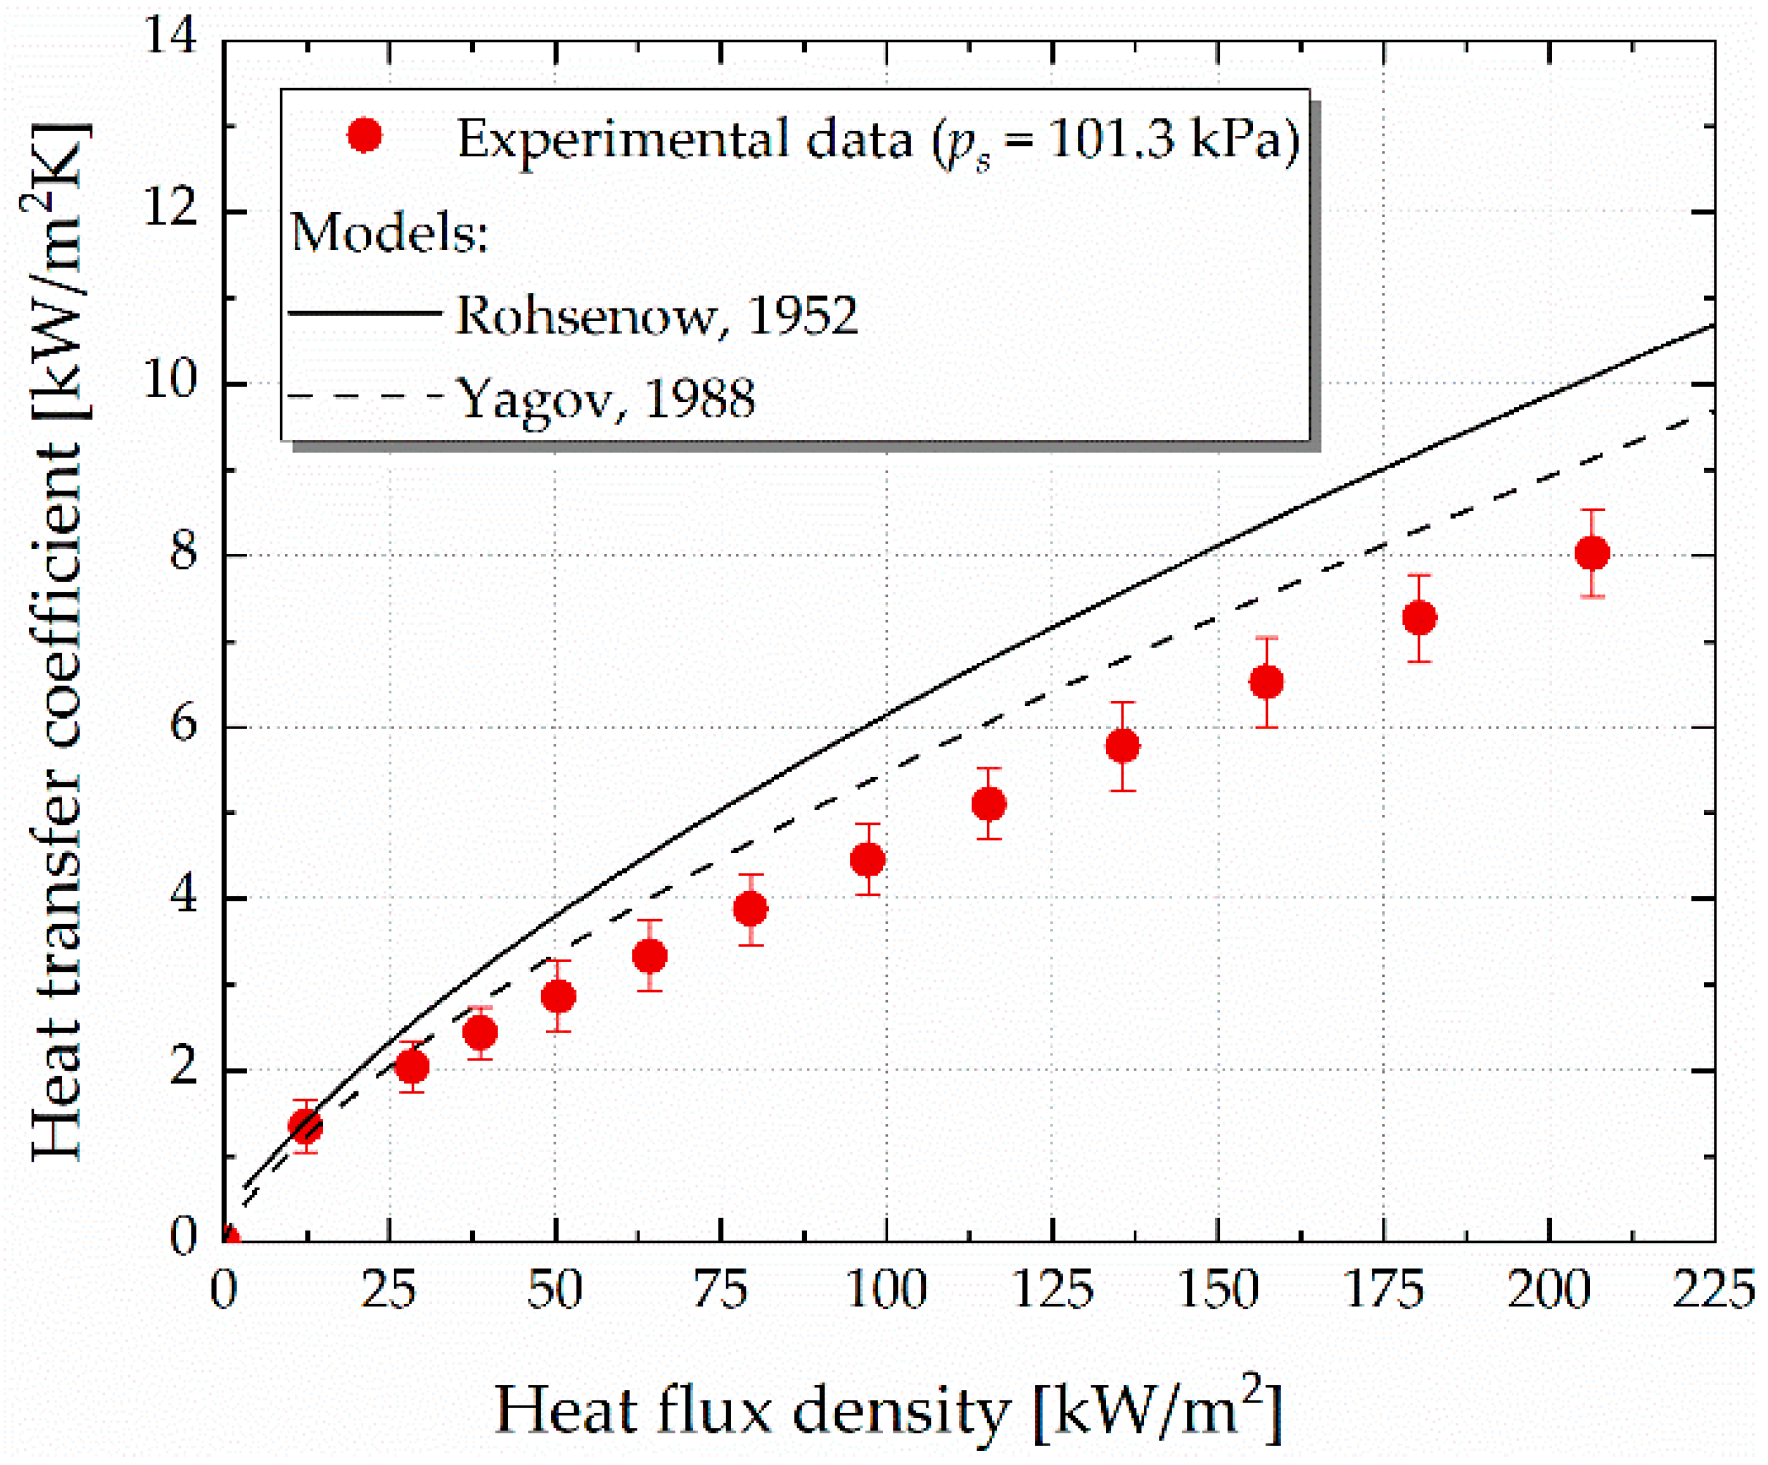
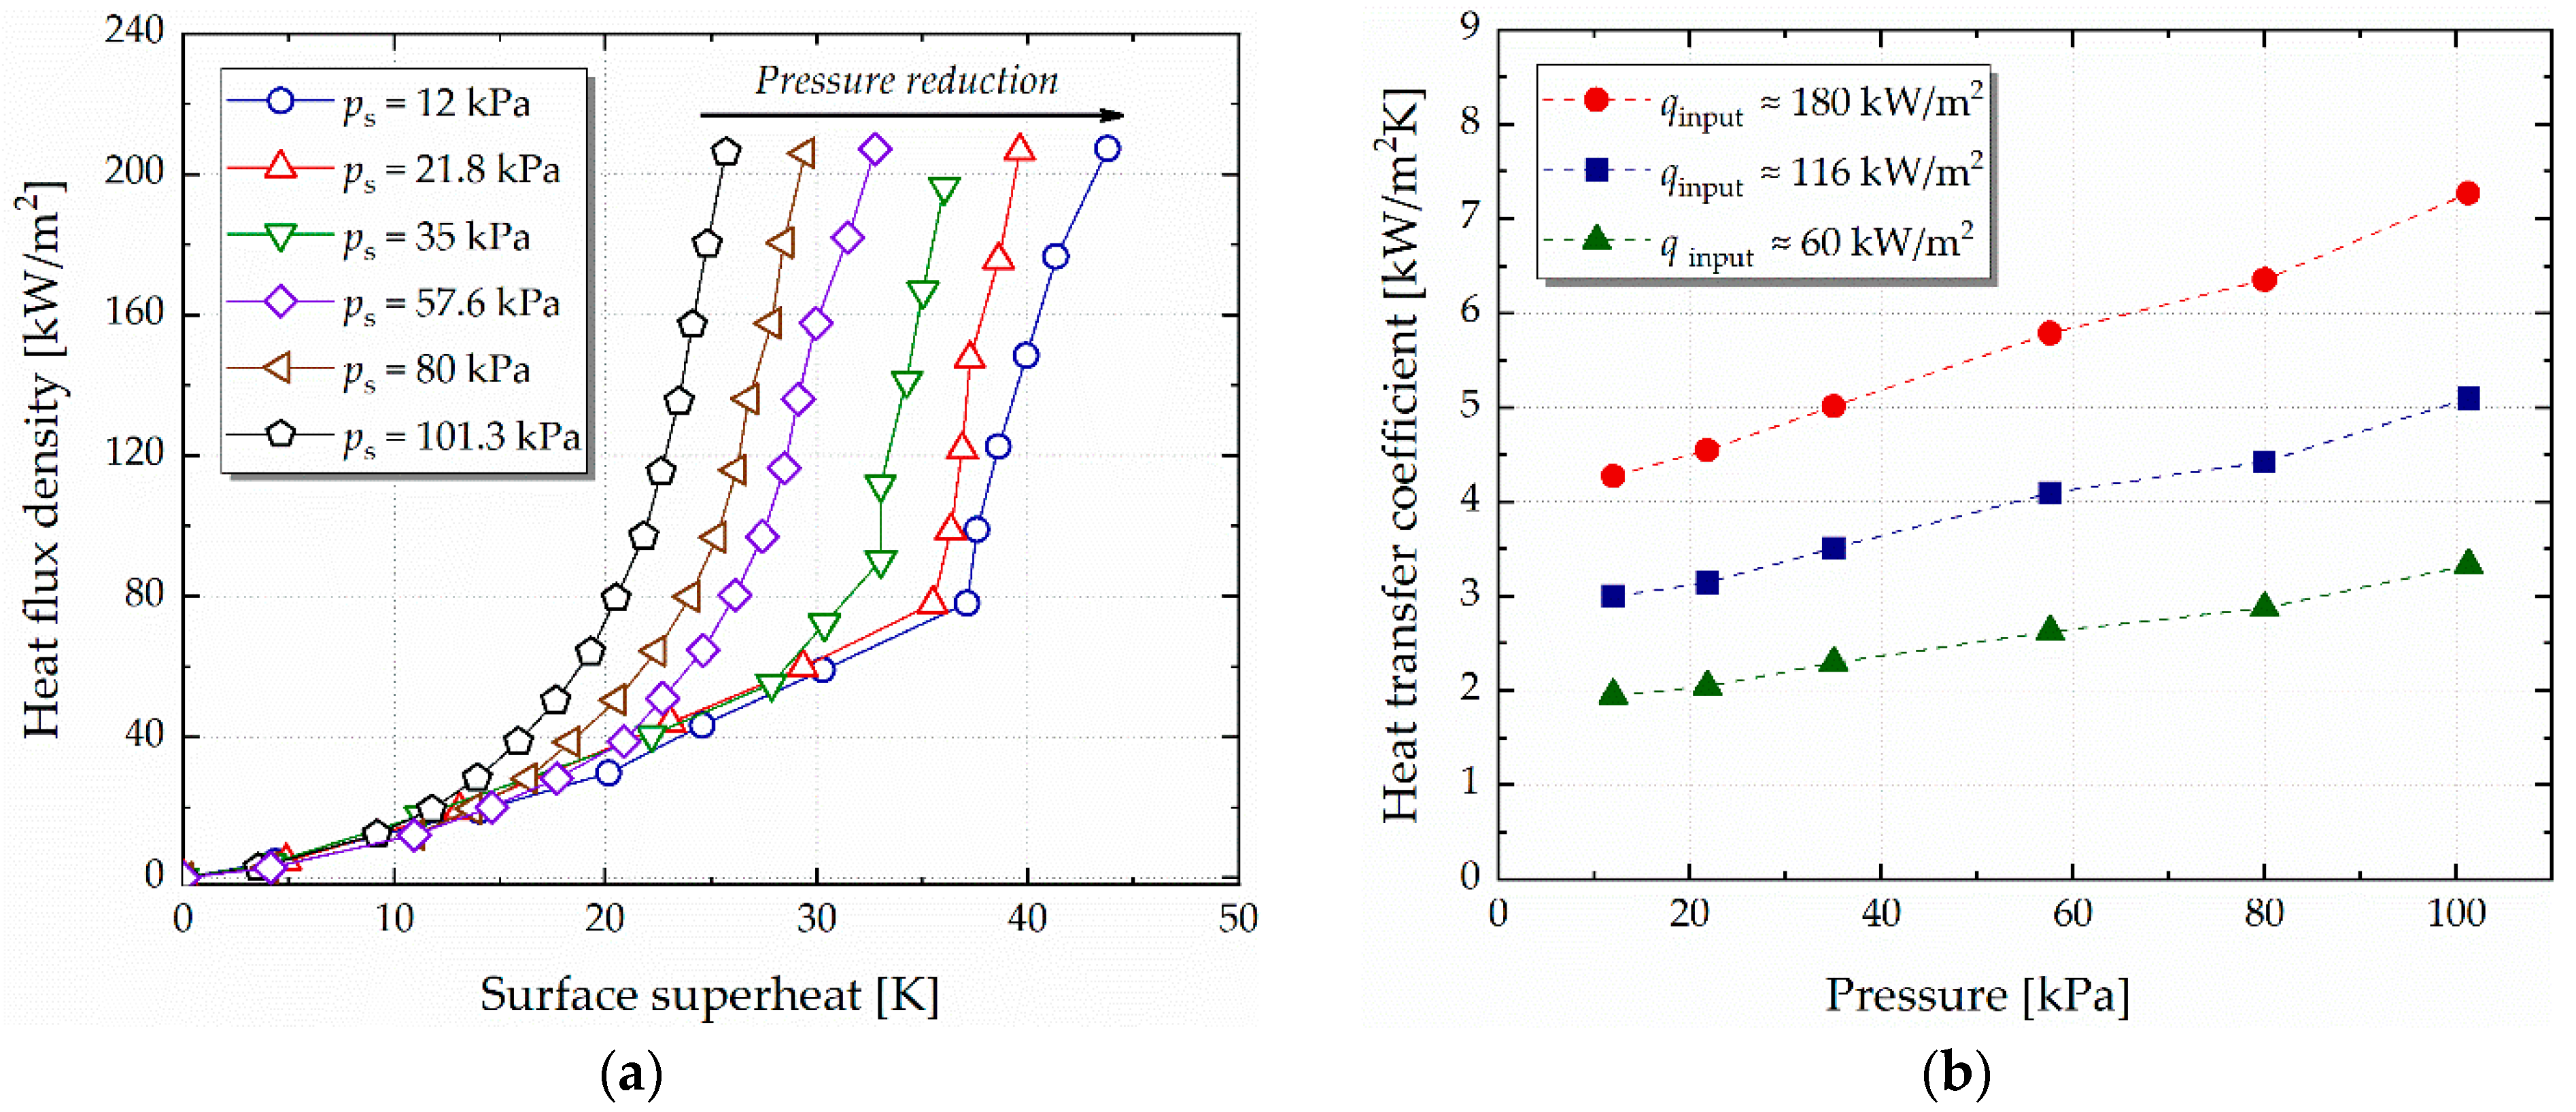
  • The dependence of heat transfer coefficients on pressure during ethanol pool boiling has a linear form. A decrease in pressure from 101.3 kPa to 12 kPa leads to a decrease in the intensity of heat transfer of about 40%. At the same time, the onset of nucleate boiling noticeably increases—from 14 to 37 K.
  • The data obtained indicate the effect of pressure reduction on the contribution of various mechanisms to the integral heat transfer rate during boiling. The results can be further used to perform a more accurate analysis of this influence, including using machine learning algorithms.
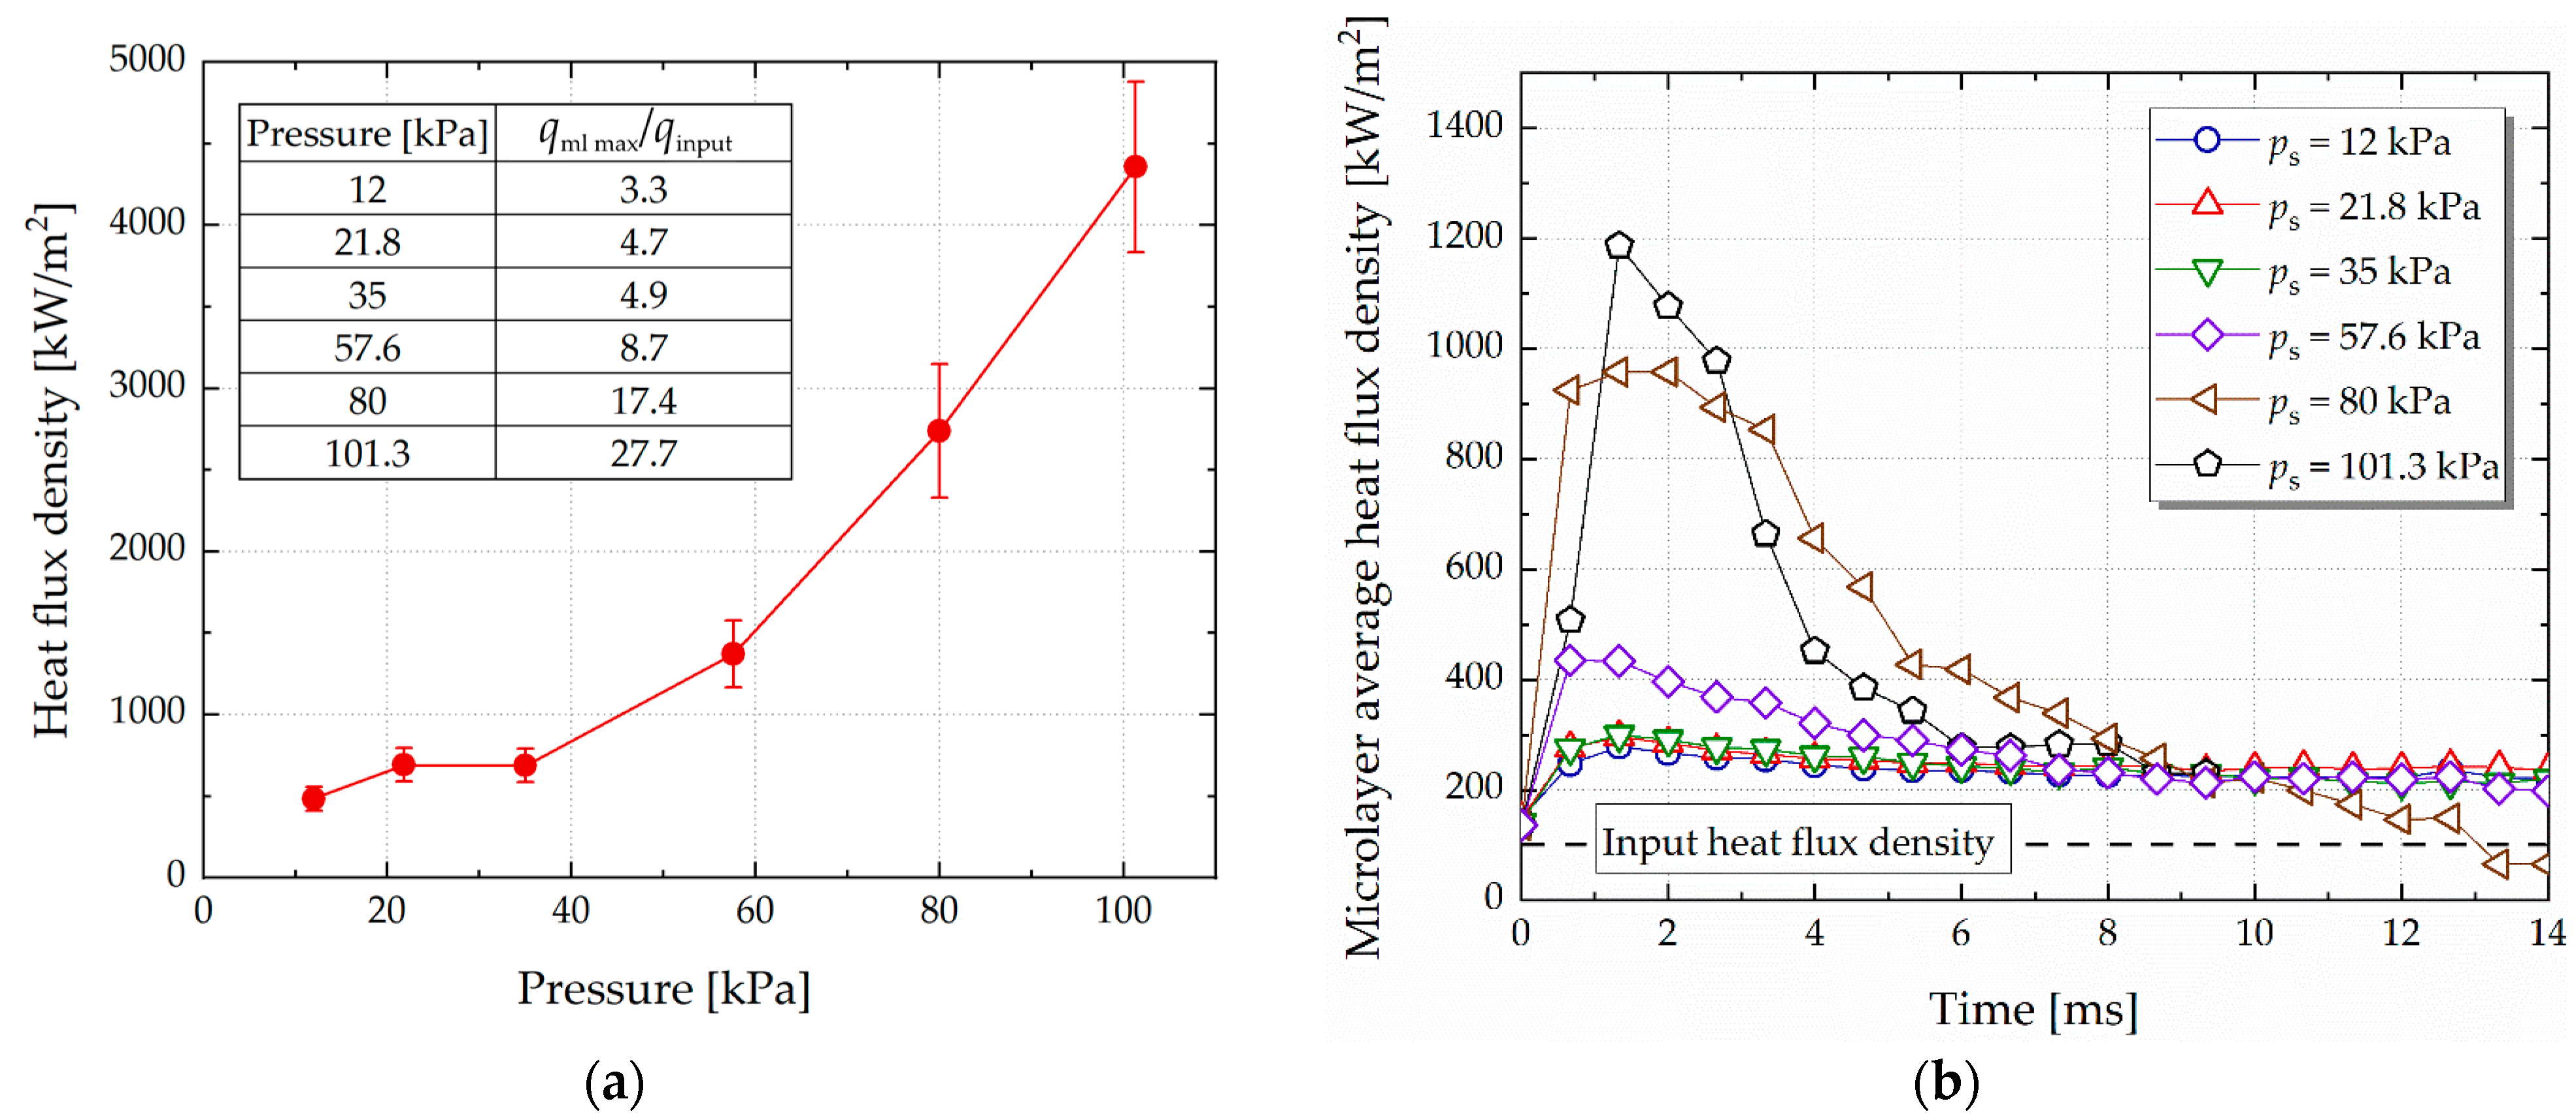
  • For all studied pressures, a significant heat flux density is removed from the heating surface due to microlayer evaporation (qml max = 484 kW/m2–4.36 × 103 kW/m2), which exceeds the input heat power by a factor of 3.3–27.7, depending on pressure.
  • The heat transfer rate in the area of the microlayer evaporation significantly decreases with reduction in pressure. Thus, local heat flux density averaged over the microlayer area decreases by four times as the pressure decreases from 101.3 kPa to 12 kPa.
  • Estimates of the microlayer thickness based on the heat conduction equation were made. The results showed that the pressure reduction from atmospheric level to 12 kPa leads to the microlayer thickness increasing by more than eight times—from 7 µm to 57 µm.

Author Contributions

Conceptualization, V.S. and A.S.; methodology, V.S. and A.S.; software, I.M.; validation, V.S. and I.M.; formal analysis, V.S. and I.M.; investigation, I.M. and V.S.; resources, V.S. and A.S.; data curation, V.S. and I.M.; writing—original draft preparation, V.S.; writing—review and editing, V.S.; visualization, V.S. and I.M.; supervision, V.S.; project administration, V.S.; funding acquisition, V.S. All authors have read and agreed to the published version of the manuscript.

Funding

The work was supported by the Russian Science Foundation (Grant No. 22-79-00174). The experimental setup was designed and made within the framework of the state assignment of the IT SB RAS (№ 121031800216-1).

Data Availability Statement

Not applicable.

Conflicts of Interest

The authors declare no conflict of interest.

References

  1. Yagov, V.V. Nucleate boiling heat transfer: Possibilities and limitations of theoretical analysis. Heat Mass Transf. 2009, 45, 881–892. [Google Scholar] [CrossRef]
  2. Koizumi, Y.; Shoji, M.; Monde, M.; Takata, Y.; Nagai, N. Boiling: Research and Advances; Elsevier: Amsterdam, The Netherlands, 2017. [Google Scholar]
  3. Liang, G.; Mudawar, I. Pool boiling critical heat flux (CHF)—Part 2: Assessment of models and correlations. Int. J. Heat Mass Transf. 2018, 117, 1368–1383. [Google Scholar] [CrossRef]
  4. Moore, F.D.; Mesler, R.B. The measurement of rapid surface temperature fluctuations during nucleate boiling of water. AIChE J. 1961, 7, 620–624. [Google Scholar] [CrossRef]
  5. Cooper, M.G.; Lloyd, A.J.P. The microlayer in nucleate pool boiling. Int. J. Heat Mass Transf. 1969, 12, 895–913. [Google Scholar] [CrossRef]
  6. Voutsinos, C.M.; Judd, R.L. Laser Interferometric Investigation of the Microlayer Evaporation Phenomenon. ASME J. Heat Transf. 1975, 97, 88–92. [Google Scholar] [CrossRef]
  7. Jawurek, H.H. Simultaneous determination of microlayer geometry and bubble growth in nucleate boiling. Int. J. Heat Mass Transf. 1969, 12, 843–848. [Google Scholar] [CrossRef]
  8. Chen, Z.; Utaka, Y. On heat transfer and evaporation characteristics in the growth process of a bubble with microlayer structure during nucleate boiling. Int. J. Heat Mass Transf. 2015, 81, 750–759. [Google Scholar] [CrossRef]
  9. Srivastava, A. On the identification and mapping of three distinct stages of single vapor bubble growth with the corresponding microlayer dynamics. Int. J. Multiph. Flow 2021, 142, 103722. [Google Scholar]
  10. Jung, S.; Kim, H. An experimental study on heat transfer mechanisms in the microlayer using integrated total reflection, laser interferometry and infrared thermometry technique. Heat Transf. Eng. 2015, 36, 1002–1012. [Google Scholar] [CrossRef]
  11. Serdyukov, V.S.; Surtaev, A.S.; Pavlenko, A.N.; Chernyavskiy, A.N. Study on local heat transfer in the vicinity of the contact line under vapor bubbles at pool boiling. High Temp. 2018, 56, 546–552. [Google Scholar] [CrossRef]
  12. Utaka, Y.; Hu, K.; Chen, Z.; Morokuma, T. Measurement of contribution of microlayer evaporation applying the microlayer volume change during nucleate pool boiling for water and ethanol. Int. J. Heat Mass Transf. 2018, 125, 243–247. [Google Scholar] [CrossRef]
  13. Narayan, L.S.; Srivastava, A. Non-contact experiments to quantify the microlayer evaporation heat transfer coefficient during isolated nucleate boiling regime. Int. Commun. Heat Mass Transf. 2021, 122, 105191. [Google Scholar] [CrossRef]
  14. Zou, A.; Singh, D.P.; Maroo, S.C. Early evaporation of microlayer for boiling heat transfer enhancement. Langmuir 2016, 32, 10808–10814. [Google Scholar] [CrossRef]
  15. Ding, W.; Zhang, J.; Sarker, D.; Hampel, U. The role of microlayer for bubble sliding in nucleate boiling: A new viewpoint for heat transfer enhancement via surface engineering. Int. J. Heat Mass Transf. 2020, 149, 119239. [Google Scholar] [CrossRef]
  16. Bongarala, M.; Hu, H.; Weibel, J.A.; Garimella, S.V. Microlayer evaporation governs heat transfer enhancement during pool boiling from microstructured surfaces. Appl. Phys. Lett. 2022, 120, 221602. [Google Scholar] [CrossRef]
  17. Urbano, A.; Tanguy, S.; Huber, G.; Colin, C. Direct numerical simulation of nucleate boiling in micro-layer regime. Int. J. Heat Mass Transf. 2018, 123, 1128–1137. [Google Scholar] [CrossRef]
  18. Guion, A.; Afkhami, S.; Zaleski, S.; Buongiorno, J. Simulations of microlayer formation in nucleate boiling. Int. J. Heat Mass Transf. 2018, 127, 1271–1284. [Google Scholar] [CrossRef]
  19. Bureš, L.; Sato, Y. Comprehensive simulations of boiling with a resolved microlayer: Validation and sensitivity study. J. Fluid Mech. 2022, 933, A54. [Google Scholar] [CrossRef]
  20. Lakew, E.; Sarchami, A.; Giustini, G.; Kim, H.; Bellur, K. Thin film evaporation modeling of the liquid microlayer region in a dewetting water bubble. Fluids 2023, 8, 126. [Google Scholar] [CrossRef]
  21. Kutateladze, S.S.; Mamontova, N.N. Critical heat fluxes in the pool boiling of liquids at reduced pressure. J. Eng. Phys. 1967, 12, 86–90. [Google Scholar] [CrossRef]
  22. Van Stralen, S.J.D.; Zijl, W.; De Vries, D.A. The behaviour of vapour bubbles during growth at subatmospheric pressures. Chem. Eng. Sci. 1977, 32, 1189–1195. [Google Scholar] [CrossRef]
  23. Surtaev, A.; Serdyukov, V.; Malakhov, I. Effect of subatmospheric pressures on heat transfer, vapor bubbles and dry spots evolution during water boiling. Exp. Therm. Fluid Sci. 2020, 112, 109974. [Google Scholar] [CrossRef]
  24. Emir, T.; Ourabi, H.; Budakli, M.; Arik, M. Parametric effects on pool boiling heat transfer and critical heat flux: A critical review. J. Electron. Packag. 2022, 144, 040801. [Google Scholar] [CrossRef]
  25. Mahmoud, M.M.; Karayiannis, T.G. Bubble growth on a smooth metallic surface at atmospheric and sub-atmospheric pressure. Int. J. Heat Mass Transf. 2023, 209, 124103. [Google Scholar] [CrossRef]
  26. Gerardi, C.; Buongiorno, J.; Hu, L.W.; McKrell, T. Study of bubble growth in water pool boiling through synchronized, infrared thermometry and high-speed video. Int. J. Heat Mass Transf. 2010, 53, 4185–4192. [Google Scholar] [CrossRef]
  27. Su, G.Y.; Wang, C.; Zhang, L.; Seong, J.H.; Kommajosyula, R.; Phillips, B.; Bucci, M. Investigation of flow boiling heat transfer and boiling crisis on a rough surface using infrared thermometry. Int. J. Heat Mass Transf. 2020, 160, 120134. [Google Scholar] [CrossRef]
  28. Surtaev, A.; Serdyukov, V.; Malakhov, I.; Safarov, A. Nucleation and bubble evolution in subcooled liquid under pulse heating. Int. J. Heat Mass Transf. 2021, 169, 120911. [Google Scholar] [CrossRef]
  29. Ronshin, F.V.; Dementiev, Y.A.; Chinnov, E.A. Investigation of dielectric liquid FC-72 boiling in a slit microchannel. Thermophys. Aeromech. 2022, 29, 975–980. [Google Scholar] [CrossRef]
  30. Surtaev, A.; Koşar, A.; Serdyukov, V.; Malakhov, I. Boiling at subatmospheric pressures on hydrophobic surface: Bubble dynamics and heat transfer. Int. J. Therm. Sci. 2022, 173, 107423. [Google Scholar] [CrossRef]
  31. Kangude, P.; Srivastava, A. Experiments to understand bubble base evaporation mechanisms and heat transfer on nano-coated surfaces of varying wettability under nucleate pool boiling regime. Int. J. Multiph. Flow 2022, 152, 104098. [Google Scholar] [CrossRef]
  32. Može, M.; Hadžić, A.; Zupančič, M.; Golobič, I. Boiling heat transfer enhancement on titanium through nucleation-promoting morphology and tailored wettability. Int. J. Heat Mass Transf. 2022, 195, 123161. [Google Scholar] [CrossRef]
  33. Surtaev, A.; Malakhov, I.; Serdyukov, V. Explosive vaporization of ethanol on microheater during pulse heating. Heat Transf. Eng. 2022, 44, 502–511. [Google Scholar] [CrossRef]
  34. Sielaff, A.; Mangini, D.; Kabov, O.; Raza, M.Q.; Garivalis, A.I.; Zupančič, M.; Dehaeck, S.; Evgenidis, S.; Jacobs, C.; Van Hoof, D.; et al. The multiscale boiling investigation on-board the International Space Station: An overview. Appl. Therm. Eng. 2022, 205, 117932. [Google Scholar] [CrossRef]
  35. Rohsenow, W.M. A method of correlating heat-transfer data for surface boiling of liquids. Trans. Am. Soc. Mech. Eng. 1952, 74, 969–975. [Google Scholar] [CrossRef]
  36. Yagov, V.V. Heat transfer with developed nucleate boiling of liquids. Therm. Eng. 1988, 35, 65. [Google Scholar]
  37. Jones, B.J.; McHale, J.P.; Garimella, S.V. The influence of surface roughness on nucleate pool boiling heat transfer. J. Heat Transf. 2009, 131, 121009. [Google Scholar] [CrossRef]
  38. Kalani, A.; Kandlikar, S.G. Enhanced pool boiling with ethanol at subatmospheric pressures for electronics cooling. J. Heat Transf. 2013, 135, 111002. [Google Scholar] [CrossRef]
  39. Kurul, N.; Podowski, M.Z. Multidimensional effects in forced convection subcooled boiling. In Proceedings of the International Heat Transfer Conference Digital Library, Jerusalem, Israel, 19–24 August 1990; Begel House Inc.: Danbury, CT, USA, 1990. [Google Scholar]
  40. Benjamin, R.J.; Balakrishnan, A.R. Nucleate pool boiling heat transfer of pure liquids at low to moderate heat fluxes. Int. J. Heat Mass Transf. 1996, 39, 2495–2504. [Google Scholar] [CrossRef]
  41. Malakhov, I.; Seredkin, A.; Chernyavskiy, A.; Serdyukov, V.; Mullyadzanov, R.; Surtaev, A. Deep learning segmentation to analyze bubble dynamics and heat transfer during boiling at various pressures. Int. J. Multiph. Flow 2023, 162, 104402. [Google Scholar] [CrossRef]
  42. Giustini, G.; Jung, S.; Kim, H.; Walker, S.P. Evaporative thermal resistance and its influence on microscopic bubble growth. Int. J. Heat Mass Transf. 2016, 101, 733–741. [Google Scholar] [CrossRef]
  43. Chen, Y.; Jin, S.; Yu, B.; Ling, K.; Sun, D.; Zhang, W.; Jiao, K.; Tao, W. Modeling and study of microlayer effects on flow boiling in a mini-channel. Int. J. Heat Mass Transf. 2023, 208, 124039. [Google Scholar] [CrossRef]
  44. Kossolapov, A.; Phillips, B.; Bucci, M. Can LED lights replace lasers for detailed investigations of boiling phenomena? Int. J. Multiph. Flow 2021, 135, 103522. [Google Scholar] [CrossRef]
Figure 1. Multiscale nature of the nucleate boiling.
Energies 16 03918 g001
Figure 2. The scheme of the experimental setup.
Energies 16 03918 g002
Figure 3. The scheme of the heating surface used in the study.
Energies 16 03918 g003
Figure 4. (a) The calculation domain including boundary conditions to reconstruct heat flux density distribution maps during boiling on the ITO heater based on the infrared thermography data; (b) an example of the reconstruction of the heat flux distribution map (ps = 21.8 kPa, qinput = 150 kW/m2).
Energies 16 03918 g004
Figure 5. Comparison of the obtained experimental data on the heat transfer rate during ethanol pool boiling under atmospheric pressure with the models of Rohsenow (1952) [35] and Yagov (1988) [36].
Energies 16 03918 g005
Figure 6. (a) Ethanol boiling curves at various pressures ps; (b) the pressure influence on the heat transfer coefficient during ethanol boiling at various heat flux densities.
Energies 16 03918 g006
Figure 7. Heat flux density distribution maps during boiling of ethanol at various pressures.
Energies 16 03918 g007
Figure 8. Evolution of the heat flux density distribution under vapor bubbles during ethanol boiling at various pressures ps (qinput = 150 kW/m2).
Energies 16 03918 g008
Figure 9. (a) Dependence of the maximum heat flux density in the microlayer evaporation area on pressure; (b) evolution of the local heat flux density averaged over the microlayer area during ethanol boiling at various pressures (qinput = 150 kW/m2).
Energies 16 03918 g009
Figure 10. Microlayer profiles during ethanol boiling at various pressures.
Energies 16 03918 g010
Disclaimer/Publisher’s Note: The statements, opinions and data contained in all publications are solely those of the individual author(s) and contributor(s) and not of MDPI and/or the editor(s). MDPI and/or the editor(s) disclaim responsibility for any injury to people or property resulting from any ideas, methods, instructions or products referred to in the content.

