Article

Thermal Performance Analysis of Micro Pin Fin Heat Sinks under Different Flow Conditions

by
Jéssica Martha Nunes
1,
Jeferson Diehl de Oliveira
2,
Jacqueline Biancon Copetti
3,
Sameer Sheshrao Gajghate
4,
Utsab Banerjee
5,
Sushanta K. Mitra
5 and
Elaine Maria Cardoso
1,*
1
Post-Graduation Program in Mechanical Engineering, School of Engineering, UNESP—São Paulo State University, Av. Brasil, 56, Ilha Solteira 15385-000, SP, Brazil
2
Department of Mechanical Engineering, FSG—University Center, Os Dezoito do Forte, 2366, Caxias do Sul 95020-472, RS, Brazil
3
LETEF—Laboratory of Thermal and Fluid Dynamic Studies, UNISINOS—University of Vale do Rio dos Sinos, São Leopoldo 93022-750, RS, Brazil
4
Mechanical Engineering Department, G H Raisoni College of Engineering & Management, Pune 412207, Maharashtra, India
5
Micro & Nano-Scale Transport Laboratory, Department of Mechanical and Mechatronics Engineering, Waterloo Institute for Nanotechnology, University of Waterloo, Waterloo, ON N2L 3G1, Canada
*
Author to whom correspondence should be addressed.
Energies 2023, 16(7), 3175; https://doi.org/10.3390/en16073175
Submission received: 22 February 2023 / Revised: 21 March 2023 / Accepted: 27 March 2023 / Published: 31 March 2023
(This article belongs to the Special Issue Heat Transfer and Fluid Dynamics in Boiling Systems)

Abstract

:
Due to microscale effects, the segmented microchannels or micro pin fin heat sinks emerged as a high thermal management solution. In this context, the present work analyzes the influence of different heights of square micro pin fins with an aligned array and investigates their influence on pressure drop and heat transfer behavior. The HFE-7100 is used as the working fluid, and the pressure drop and surface temperature behavior are analyzed for different mass fluxes and inlet subcooling. The single-phase flow was analyzed numerically using the computational fluid dynamics (CFD) software ANSYS FLUENT® for comparing the simulation results with the experimental data, showing that the highest micro pin fins configuration provides a more uniform and lowest wall temperature distribution compared to the lowest configuration. There is a good agreement between the experimental results and the numerical analysis, with a mean absolute error of 6% for all the considered parameters. For the two-phase flow condition, experimental tests were performed, and for the highest subcooling, an increase in mass flux causes an enhancement in the heat transfer for low heat flux; by increasing heat flux, there is a gradual predominance of boiling heat transfer over convection as the heat transfer mechanism. The pressure drop drastically increases with the vapor amount flowing into the system, regardless of the pin fin height; the boiling curves for the higher fin height show a much smaller slope and a smaller wall superheat than the fin with the smallest height, and consequently, a high heat transfer performance. A larger region of the heat sink is filled with vapor for lower inlet subcooling temperatures, degrading the heat transfer performance compared to higher inlet subcooling temperatures.

1. Introduction

An alternative to modifying the configuration of microchannels to minimize the instabilities presented in this system is using segmented or microfinned microchannels (micro pin fins). Such compact heat sinks can be used in high-power laser cooling systems, high-concentration photovoltaic cell cooling, microreactor cooling, fuel cells, and microchips. In addition to the advantage of segmented microchannels in terms of increasing the heat exchange area to volume ratio, which provides an ability to dissipate higher heat rates, they can also be manufactured on the chip scales of electronic devices. The recent development of microfabrication techniques has allowed complex geometries on a reduced scale; thus, in recent years, several studies involving heat transfer in micro pin-fin heat sinks have been carried out in order to characterize the heat transfer mechanisms and to predict the thermal and fluid dynamic behavior of these systems. The micro fins can have different shapes and sizes and be arranged in different patterns to improve heat transfer [1,2,3]. It is also noteworthy that the ideal spacing of the fins depends on the working fluid and its subcooling in the system. The mini and microfinned channel arrangements are considered promising structures for compact heat sinks [4].
Deng et al. [5] proposed a new type of heat sink with pin fin-interconnected reentrant microchannels (PFIRM) and tested it in convective boiling, using deionized (DI) water and ethanol as working fluids. Several tests were performed under different subcooling conditions (40 and 10 °C) and mass fluxes (125 to 300 kg/m2s). An increase of 39–284% was observed in the heat transfer coefficient (HTC) for water and 29–220% for ethanol compared to parallel microchannels. Authors attributed this enhancement to the interconnected microchannels, which provide different paths for the vapor bubbles reducing the confinement effect. In addition, the interconnected spaces provided ideal conditions for the nucleation of vapor bubbles, contributing to the heat transfer improvement for the PFIRM. For pressure drop, Deng et al. [5] reported an increase with increasing heat flux and vapor quality; moreover, the mass flux strongly influenced pressure drop at moderated and high heat fluxes.
Recently, Asrar et al. [6] conducted an experimental investigation of convective boiling using R245fa in micro gaps improved with the arrays of micro pin fins made of silicon (cylindrical pin fins 150 µm in diameter and 200 µm of interfin space in a staggered arrangement). Several tests were performed at different mass flux conditions (between 781 and 5210 kg/m2s) and inlet temperatures (between 13 and 18 °C). The authors reported that HTC increased with increasing mass flux for the single-phase flow regime. For the two-phase flow regime, they compared the results with their previous works [7]; the new device showed better thermal performance than the previous one. Regarding pressure drop and vapor quality, Asrar et al. [6] found the same behavior as Woodcock et al. [8] and Chien et al. [9], in which these parameters were independent of the heat flux in the single-phase regime but increased remarkably with the intensification of convective boiling.
The scientific community has extensively studied heat transfer in segmented microchannels. However, there are still several challenges that require further research to understand and optimize the process, such as (i) the good balance between heat transfer and pressure drop to have an efficient heat sink, (ii) the appropriate material for the heat sink and the micro pin fins in order to have high thermal conductivity and good mechanical strength, and (iii) the optimal configuration for a micro pin fin heat sink to improve the heat transfer capacity.
Many of the developed works take into account different dimensions and configurations of micro pin fins to understand the physical mechanisms responsible for heat transfer enhancement in an attempt to develop models to be applied on an industrial scale capable of predicting the heat transfer coefficient, the behavior of the critical heat flux, and the pressure drop. As mentioned by Jung et al. [10], since water is more widely available and has superior thermophysical properties, most studies are conducted with it; however, its high electrical conductivity limits its use for embedded cooling.
In this context, the current work investigates the thermal performance and pressure drop of HFE-7100 in micro pin fin heat sinks with different heights and their influence on pressure drop and heat transfer behavior. The effects of geometrical parameters and operating conditions on the thermal performance and pressure drop were analyzed experimentally and, for single-phase flow, numerically. The computational model used in the current study validates the thermal performance and pressure drop determined from the experiments for single-phase flow. The current study contributes to better comprehending heat removal capability, factors impacting heat transfer performance, and mechanisms responsible for enhancing heat transfer in such compact heat exchangers.

2. Materials and Methods

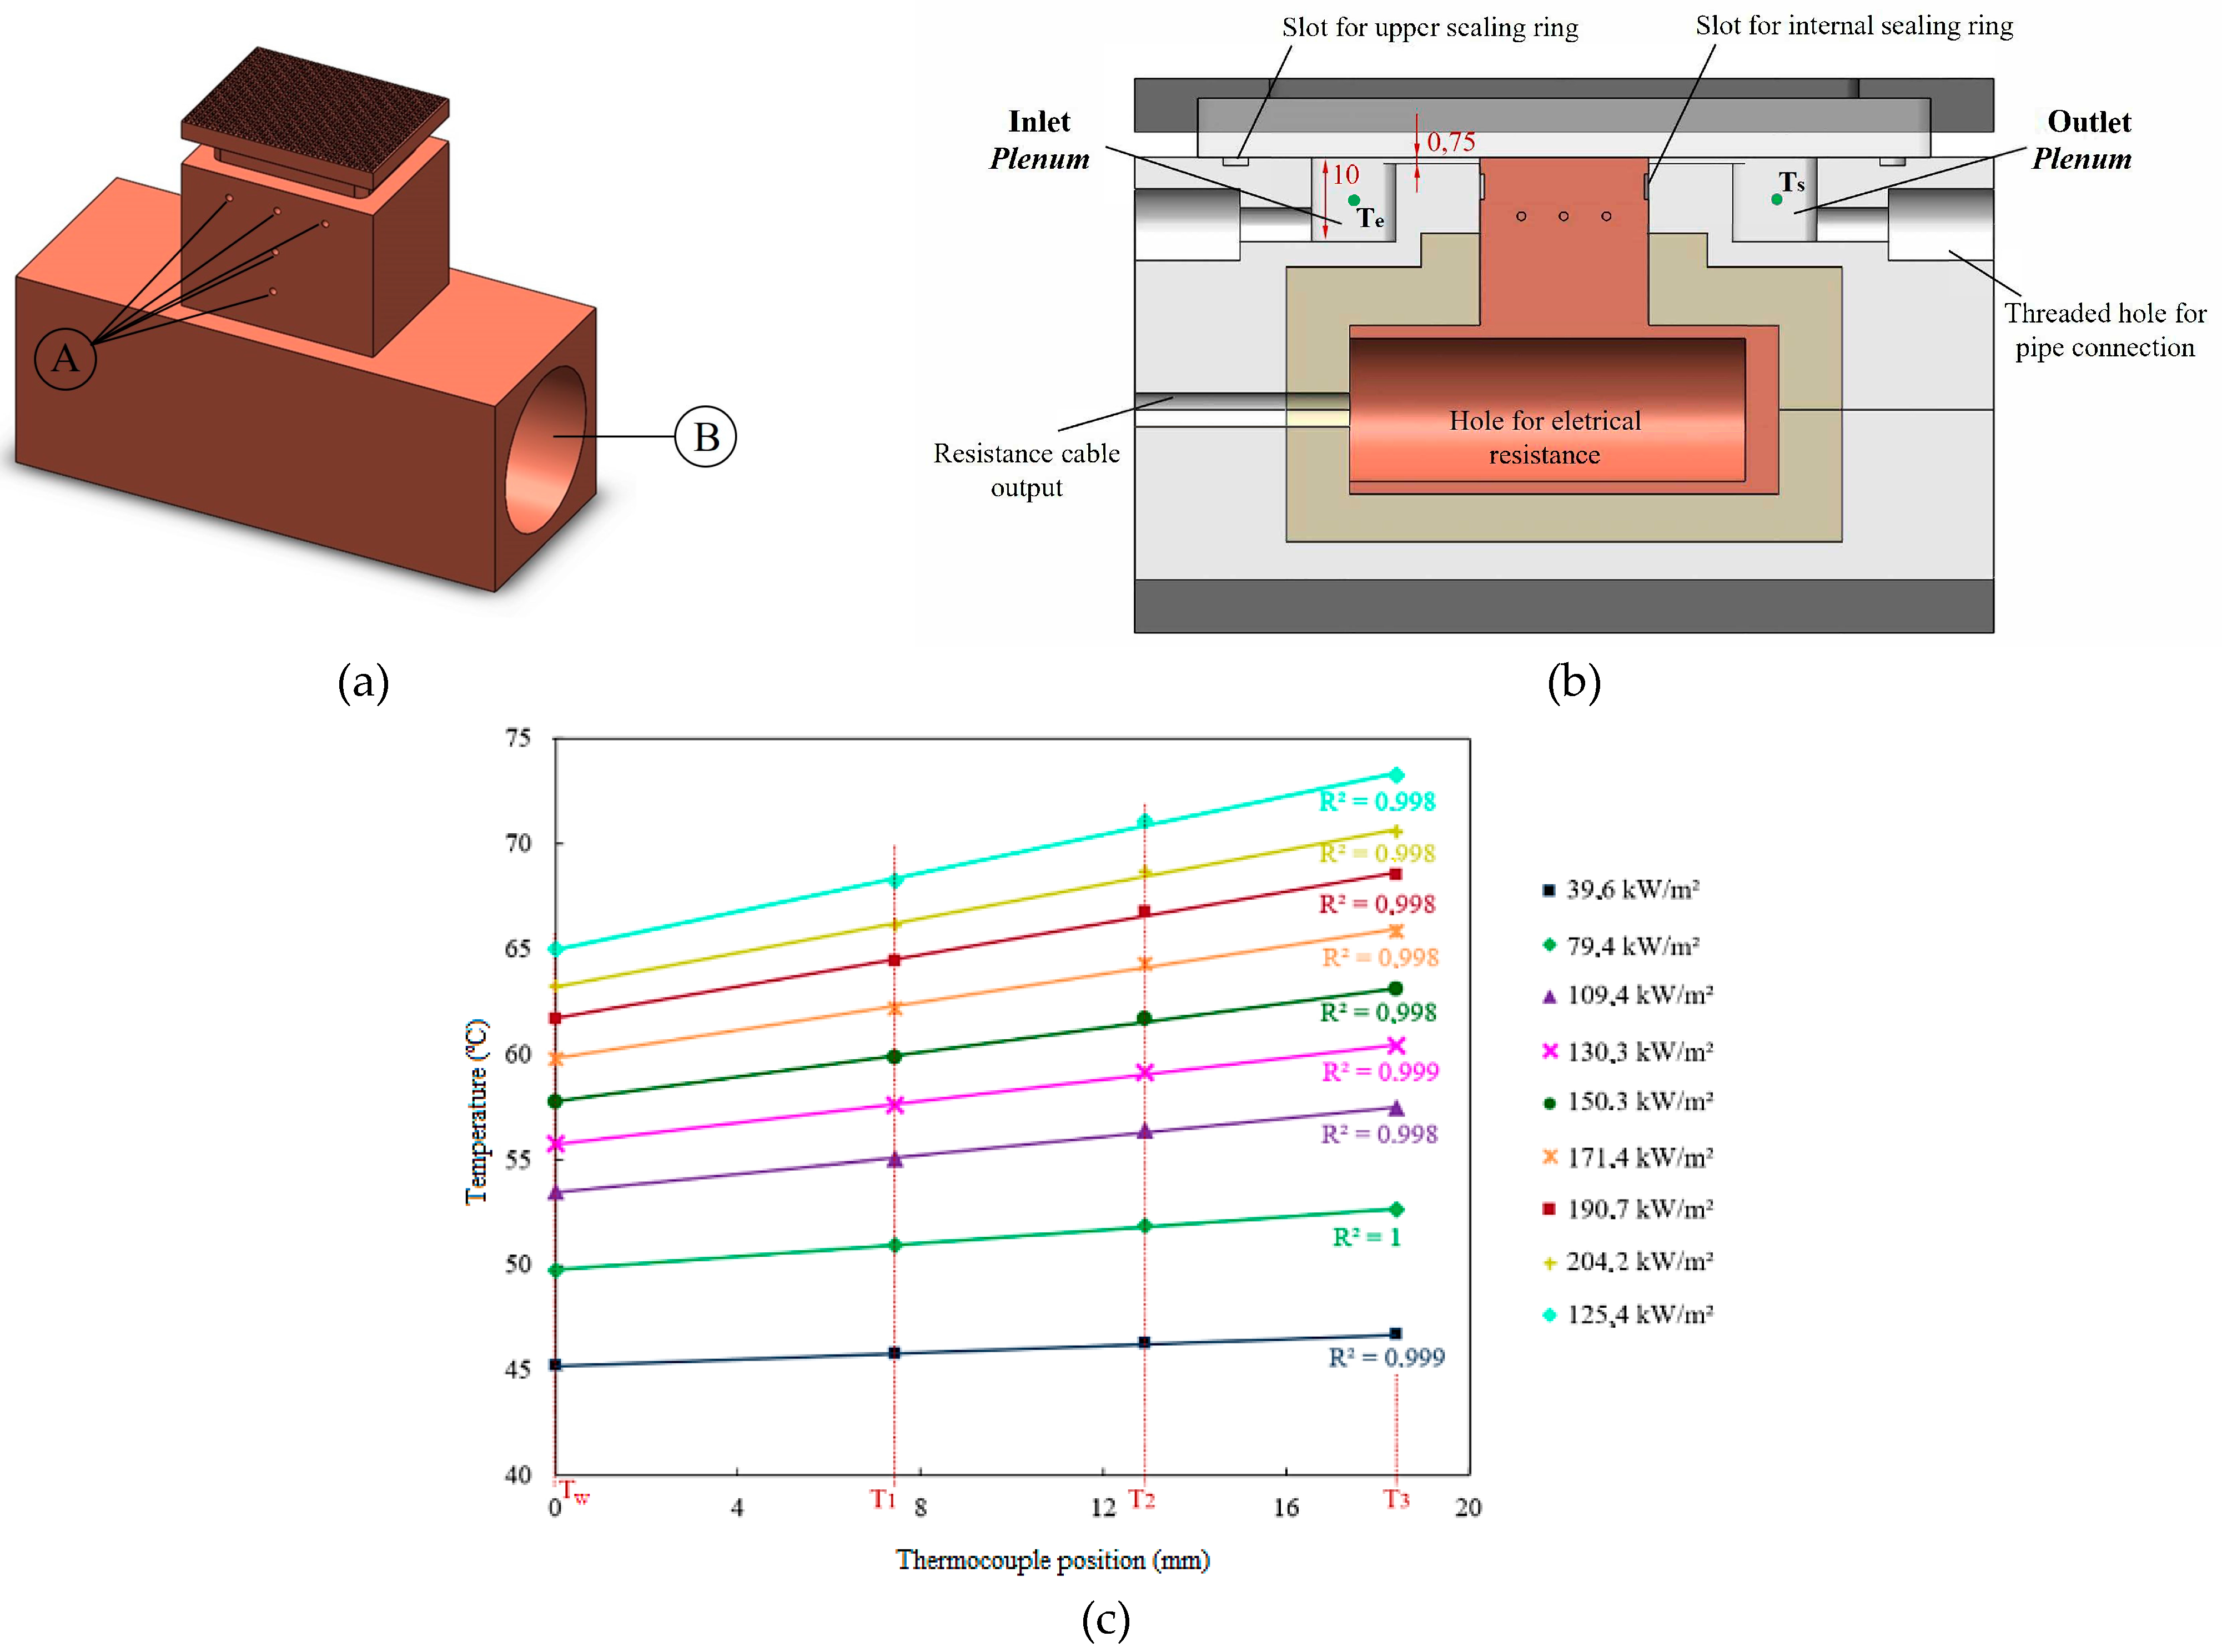
2.1. Experimental Apparatus

Figure 1 shows the experimental apparatus used in the present study. The working fluid is pumped from a reservoir to the flow loop; the HFE-7100 flow rate is set by a Coriolis mass flow meter (Yokogawa ROTAMASS Total Insight with 0.2% mass flow accuracy) installed just upstream of the preheater (consisting of a horizontal copper tube heated by an electrical tape resistance). There is a bypass line used for the test facility maintenance. The pressure drop between inlet and outlet plenums is measured by two pressure transducers (OMEGA PX309 model, with 0.25% accuracy). The flow temperature is measured using previously calibrated K-type thermocouples (uncertainty of 0.3 °C) in the inlet and outlet plenums (both in contact with the fluid). The working fluid is cooled by a condenser and then returned to the reservoir, as shown in Figure 1.
The design of the heat sink test section in different views is shown in Figure 2, including a cutaway to view internal details and elemental descriptions (Figure 2b). Five holes (1 mm diameter) were drilled in the copper block to accommodate K-type thermocouples (Figure 2a, A) to determine the wall temperature and verify the one-dimensional heat conduction along the copper block. The heat flux is provided by electrical resistance (cartridge type, 250 W/220 V) embedded in the copper block (Figure 2a, B) and controlled by a DC power supply.
The one-dimensional conduction law of Fourier was determined with the temperature readings from the thermocouples fixed along the vertical direction of the copper block; therefore, the wall temperature was obtained by extrapolating the linear temperature profile, which exhibits an R-square error of approximately 1.0 regardless of heat flux (Figure 2c). Moreover, the heat losses were lower than 15%, corroborating the one-dimensional steady-state heat flux assumption.
The heat sink (Figure 2) consists of a copper block with a 20 × 15 mm footprint with 972 micro pin fins. The square micro pin fins (300 µm in width and 250 µm of interfin space) were manufactured using a CNC precision milling machine (Hermile, model C800U). The micro fins were manufactured in an aligned array with the fluid flow direction (Figure 3), and different heights (H) of micro pin fins—160 µm named S1 and 350 µm named S2—were analyzed in the current work.
As shown in Figure 2b, the thermal insulation is made with ceramic and polytetrafluoroethylene (PTFE); the working fluid is not heated before contacting the micro pin fins since the inlet and outlet plenums are machined on the PTFE with 10 × 15 × 10 mm. Two K-type thermocouples, one in the inlet and another in the outlet, measure the working fluid temperature (Ti and To, respectively). Flow homogenization channels with a depth of 0.75 mm were manufactured between the plenums and the heat sink to minimize flow entrance turbulence. Flow visualization (using a high-speed camera Photron SA3 model with 1000 fps and 1024 × 1024 resolution) is allowed by a polycarbonate plate (8 mm thick) covering the heat sink.
The geometric characterization of the micro pin fin heat sinks was performed by Zeiss® SteREO DiscoveryV8 and SEM EVO LS15 Zeiss® (Table 1).
The experimental uncertainty was calculated using the free package developed in Python, called Uncertainties (© 2010–2016, EOL), based on the Taylor series method and standardized by the Bureau International des Poids et Mesures (BIPM). Consequently, for all tests carried out in the current study, the uncertainty of the heat flux, the heat transfer coefficient, and pressure drop varied from 4 to 16%, 7 to 21%, and 3 to 9%, respectively. It is worth mentioning that all analyses take into account the effective heat flux, determined by subtracting the heat loss to the surroundings from the power supplied; in the current study, the heat losses are less than 22% for all tests performed.

2.2. Experimental Procedure

The consistency analysis aims to verify the coherence of the results obtained experimentally; thus, the results for the single-phase flow regime were compared to those obtained from a numerical analysis considering the same conditions. The simulation was based on the mass, momentum, and energy conservation equations with the second-order upwind scheme for energy and pressure and the first-order for momentum [11]. The fluid flow was assumed to be steady-state, incompressible, and laminar, and it was solved by adopting the Finite-Volume Method implemented in ANSYS® Fluent 2020 R2. The computational domain with appropriate boundary conditions is shown in Figure 4.
As a reference pressure, atmospheric pressure was defined; considering the characteristics of a low-pressure system, the outlet pressure was set up as zero. The no-slip condition was considered on all the surfaces. The input parameters for the simulation, such as inlet mass flux and the dimensions of the micro pin fins, were taken from the experimental approach. The heat flux was distributed through the micro pin fins, except for the top side, which was thermally insulated by a polycarbonate piece; for the inlet and outlet plenums, adiabatic wall conditions were considered.
The hex-dominant meshing grid scheme with a free-face mesh type combining triangles and quadrilaterals was used to mesh the systems (for both cases), as shown in Figure 5. The mesh was accomplished in the meshing module with minimum mesh orthogonality of 0.311 (S1, H = 160 µm) and 0.346 (S2, H = 350 µm) and a maximum skewness of 0.56 (S1, H = 160 µm) and 0.61 (S2, H = 350 µm).
The convergence occurred for meshes with 511.09 k elements; the finer mesh was achieved when residuals were less than 10−5 for the continuity equation and 10−6 for momentum and energy equations. The simulations used the segregated algorithm with the SIMPLE algorithm for pressure-velocity coupling.
A study on grid independence was conducted based on wall temperature as a criterion to ensure the results were independent of the mesh. This analysis consisted of three different meshes (around 120 k; 370 k; 550 k elements), aiming to obtain a heated wall temperature range of a maximum of 1.2 K (less than 10% of the maximum wall temperature, according to [12]); it was noticed that the difference in wall temperature was around 1.2 K between the last two meshes. Hence, the mesh chosen aimed to save computational time.
The mean absolute errors ( M A E = 1 N 1 N ϕ e x p ϕ   n u m ϕ e x p × 100 %   ) of the surface temperature and total pressure drop were 5.6% and 7.1%, respectively. The computational results were consistent with the experimental data for the heat transfer coefficient; for both S1 and S2, the MAE was 5%. Therefore, the mean absolute errors of the experimental and simulation data for pressure drop and heat transfer coefficient are within the experimental uncertainty range.
After the validation analysis for the single-phase flow, two-phase flow tests were performed for two different subcooling values, 10 °C and 20 °C, for mass fluxes of 1000 and 1200 kg/m2s, and for different footprint heat fluxes from 10 kW/m2 to the system limit, characterized by intense instability in the flow (reverse flow). The gear pump’s rotation was set to achieve the desired mass flux; the preheater was adjusted until its outlet temperature was equal to the desired subcooling. A data acquisition system (Agilent 34970A) recorded the data every 2 s after the system achieved the steady-state regime, characterized by temperature variations lower than the thermocouples uncertainties (±0.3 °C). At least 250 data points were recorded, corresponding to 500 s steady-state. The pressure, temperatures, mass flux, and electrical voltage are constantly monitored. Flow visualization was carried out using a high-speed camera. The same procedure is adopted during all the experimental tests to ensure repeatability.

2.3. Data Reduction

The heat transfer coefficient is calculated based on Equations (1)–(5), similar to the approach adopted by Prajapati et al. [13]:
Q ˙ l o s s = Q ˙ i n m ˙ · c p T o T i
where m ˙ corresponds to the mass flow rate [kg/s]; cp to the specific heat capacity [J/kg·K]; and Ti and To are the coolant temperature at the inlet and outlet, respectively. In the current study, heat loss ( Q ˙ l o s s ) varied from 15 to 30% over the range of varying parameters. The heat flux, q , dissipated by the test section is given by:
q f o o t p r i n t = Q ˙ i n Q ˙ l o s s A p
where Ap is the footprint area of the heating surface. The effective heat flux, q e f f [W/m2], based on the total surface area in contact with the working fluid (At), is calculated by:
q e f f = Q ˙ i n Q ˙ l o s s A t
In order to calculate the total surface area, At, the fin parameters and efficiency (η) concepts have been calculated considering the adiabatic fin tip, since a polycarbonate plate is used to cover the heat sink. Thus, At is given by Equation (4), where N is the total number of micropillars.
A t = A p N · A c + η · N · P m a · H
where Ac is the cross-sectional area, Pma is the pin fin perimeter, and H is the height of the micro pin fins.
Therefore, it is possible to calculate the heat transfer coefficient or HTC (h) through Equation (5), where Tw is the average temperature of the heat sink provided by three K-type thermocouples fixed within the heat sink wall. The Tf is the average temperature of the fluid given by the same procedure as Leão et al. [14]
h = q e f f T w T f
Pressure transducers (at inlet and outlet plenums, P i and P o , respectively) measure the pressure drop in the region between the inlet and outlet plenums; thus, the pressure drop through the microchannels is given by Δ P = P i P o Δ P c o n t r a c t i o n Δ P e x p a n s i o n where the pressure drop due to contraction and expansion is obtained by the method described in Chalfi and Ghiaasiaan [15].

3. Results and Discussion

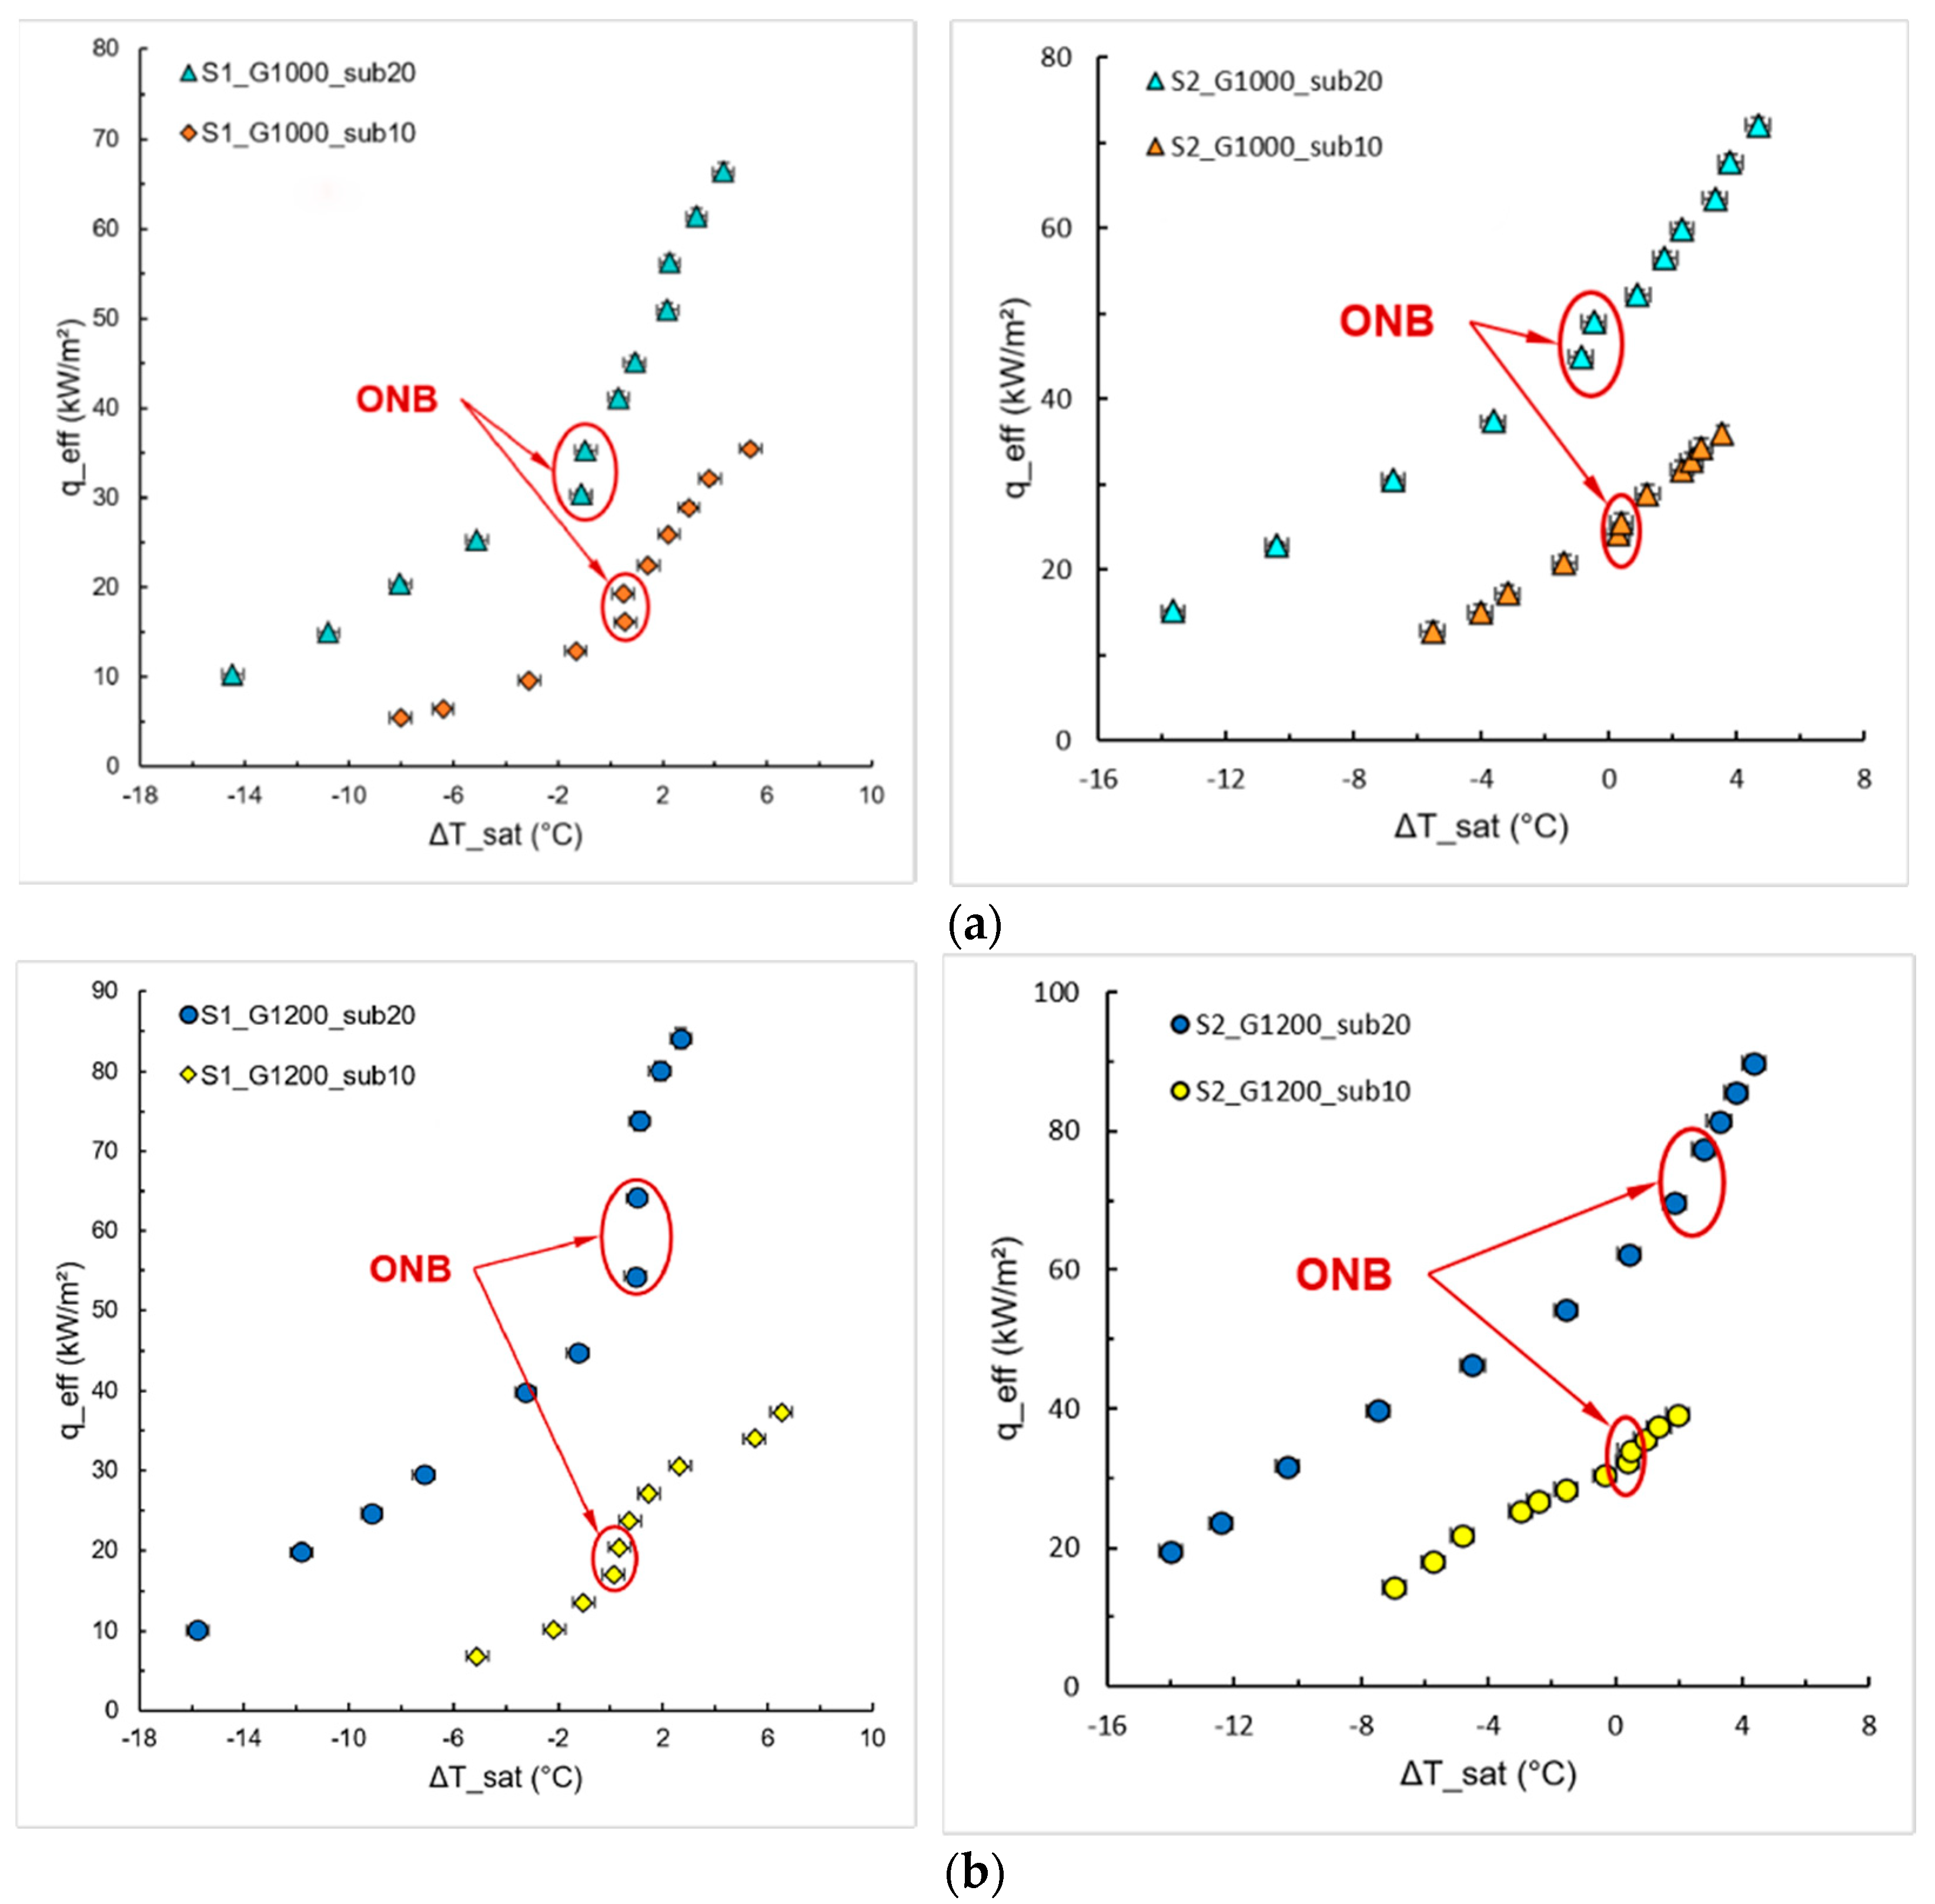
3.1. Effect of the Inlet Subcooling Temperature

Figure 6 shows the effect of different inlet subcooling temperatures (10 and 20 °C) on the flow boiling heat transfer for both surfaces (S1 and S2). The increase in subcooling shifted the boiling curve to the left regardless of micro pin fin height. The HTC continuously increased with heat flux for all mass fluxes and higher inlet subcooling temperature, while the HTC slightly decreased with high heat fluxes for lower inlet subcooling temperature. According to Yin et al. [16], such HTC behavior is due to the flow pattern transition into a confined annular flow, where partial dryout occurs on the surface as heat flux increases, leading to the rise in the wall temperature (being more pronounced for S1).
Analyzing the boiling curves of samples S1 and S2 is possible to observe the beginning of the nucleate boiling regime, indicated in Figure 6 as ONB (Onset of Nucleate Boiling), and characterized by the sudden change in the slope of the boiling curve, reducing the surface temperature.
Figure 7 shows the effect of different inlet subcooling temperatures (10 and 20 °C) on the pressure drops for both surfaces (S1 and S2). One can observe that the effect of inlet subcooling temperatures on both surfaces’ pressure drops in the single-phase flow region (for q” < 30 kW/m2) is negligible. However, in the case of the two-phase flow region, the pressure drop becomes more significant as the inlet subcooling temperature decreases, regardless of the mass flux and micro pin fin height; a lower inlet subcooling temperature leads to a higher vapor quality through the heat sink, which increases the pressure drop.

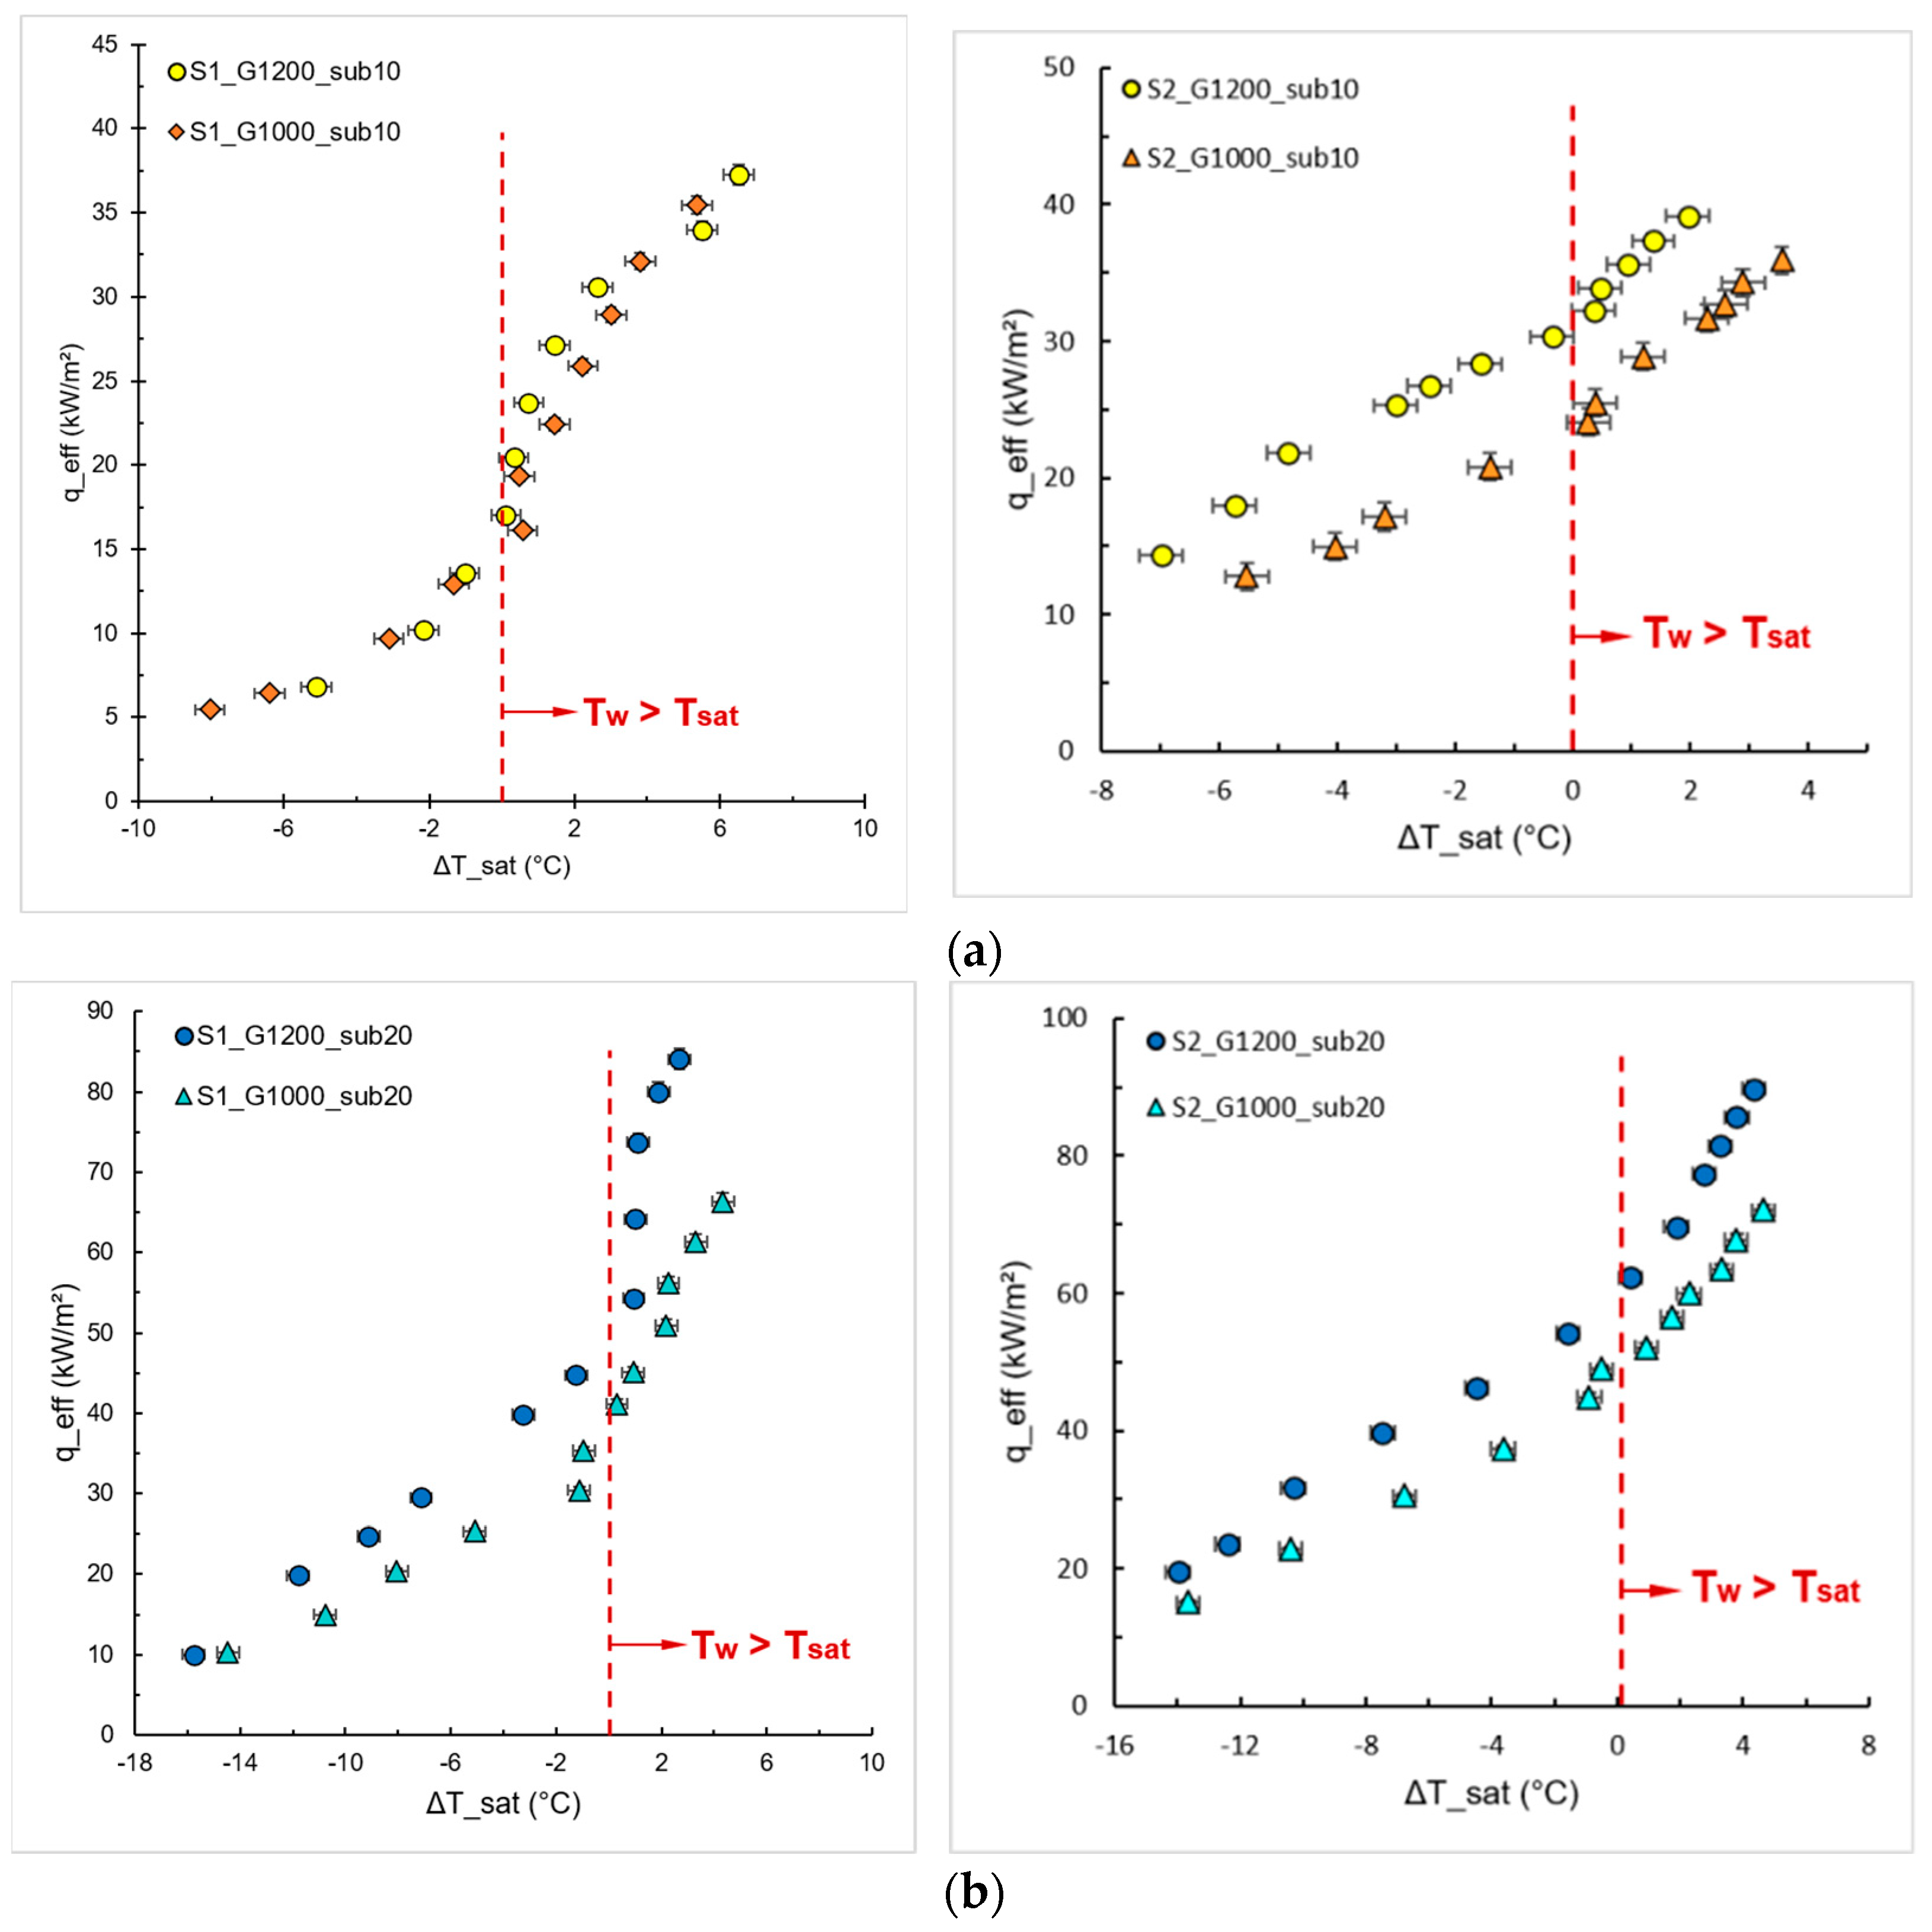
3.2. Effect of the Mass Flux

Figure 8 shows the effect of different mass fluxes on the boiling curves for S1 and S2, with different subcooling temperatures at the inlet of the heat sink. The influence of mass flux, G, on the convective flow boiling heat transfer was negligible for the inlet subcooling of 10 °C and the lowest micro pin fin height (S1). On the contrary, for the highest fin height, the fluid has more space to flow between the fins, and the convective effects (mass flux influences) are more pronounced in the single-phase flow region.
For the inlet subcooling of 20 °C, an increase in the mass flux shifted the curves to the left, characterized by an HTC enhancement. Cheng and Wu [17] indicated a gradual predominance of boiling heat transfer over convection as heat flux increases; furthermore, the micro pin fins induced flow turbulence and strengthened convection heat transfer, the primary heat dissipation component in subcooled convective boiling [18].
For both S1 and S2, increasing the mass flux increased the pressure drops for low heat flux values (single-phase flow region); however, no significant influence of mass flux on pressure drop was observed in the single-phase flow region for both inlet subcooling temperatures (10 and 20 °C). As the heat flux increased (two-phase flow region), the pressure drop became more pronounced due to the vapor mass flowing through the heat sink; thus, the pressure drop was more influenced by the void fraction than by mass flux.

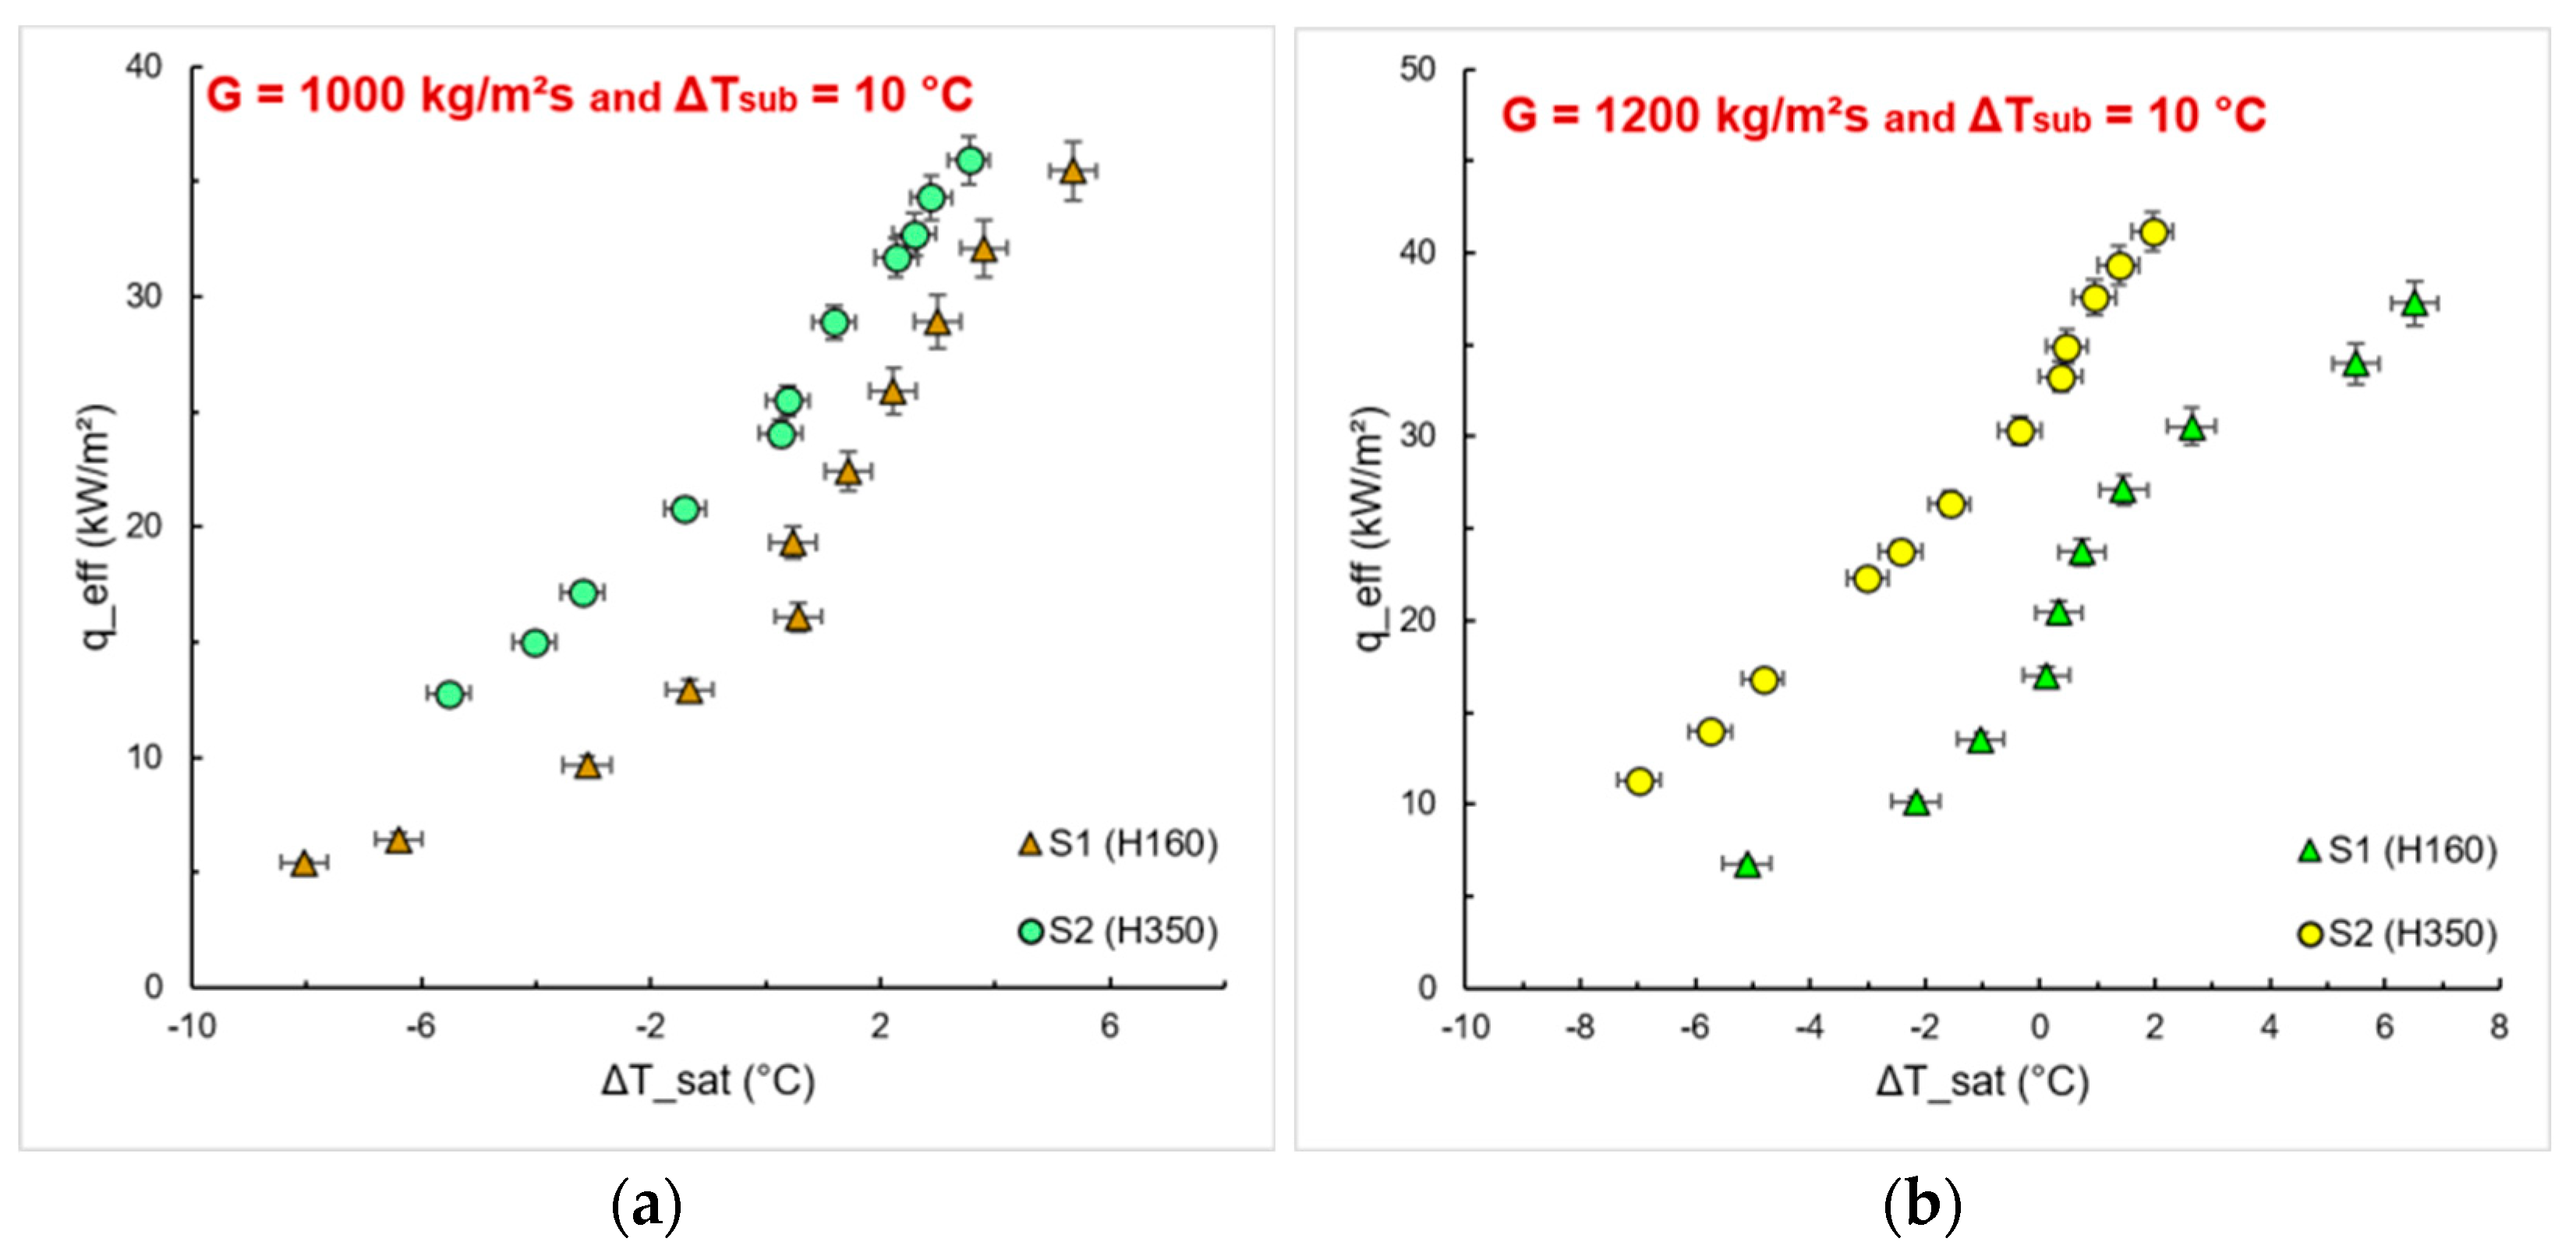
3.3. Effect of the Fin Height

Figure 9 shows the effect of pin fin height on the boiling curves for different mass fluxes and a subcooling inlet temperature of 10 °C. Considering the effective heat exchange area, we can infer that the increase in the effective area leads to an increase in the HTC, characterized by the shift of the boiling curve to the left. The same was reported by Kiyomura et al. [19], who evaluated different configurations of micro fin surfaces during pool boiling of the HFE-7100. One can observe in Figure 9 that S2 presents a better HTC, since its effective heat exchange area is approximately 55% greater than S1.
In order to discuss the flow boiling behavior, Figure 10 presents the boiling curve for S1 with G = 1200 kg/m2s and subcooling of 20 °C, with the respective visualization points. It is worth mentioning that similar behavior was observed for all test conditions. Flow boiling videos under these conditions can be found in the Supplementary Material.
Initially, the single-phase flow regime is predominant at lower heat flux, with no vapor bubbles (point (a), Figure 10). By increasing heat flux, isolated vapor bubbles nucleate preferentially between the adjacent fins, even though the working fluid temperature is lower than the saturation temperature, i.e., subcooled boiling condition (point (b), Figure 10). In the nucleate boiling region, after the ONB, nucleation sites are activated over the entire heating surface (point (c), Figure 10), increasing the departure frequency and the coalescence of vapor bubbles near the heat sink outlet. For high heat fluxes, the vapor core fills the entire length of the heat sink (point (d), Figure 10), and the annular flow regime becomes pronounced. A high void fraction is observed at the outlet of the heat sink, promoting thermal instabilities, a high pressure drop and the occurrence of reverse flow, which is mainly observed for lower inlet subcooling temperature (reverse flow visualization).

4. Conclusions

The current work experimentally studied the thermal and fluid dynamic behaviors, in terms of heat transfer coefficient and pressure drop, of convective boiling using HFE-7100 as the working fluid in a heat sink based on square micro pin fins. Different micro pin fins were tested (heights of 160 and 350 µm in an aligned array) at different mass fluxes (1000 and 1200 kg/m2s) and two levels of inlet subcooling temperatures (10 and 20 °C). The boiling heat transfer and pressure drop behaviors were evaluated for each test condition. The visualization of the experimental tests was performed using a high-speed camera to observe the transition from single-phase to two-phase flow and to identify possible flow patterns and the occurrence of reverse flow. The main conclusions are summarized below:
As the mass flux increases, HTC increases in the region where the effects of forced convection are dominant for each sample. However, when the effects of nucleate boiling overlap, the increase in mass flux does not guarantee a gain in HTC, especially for aligned arrays.
The lower the inlet subcooling temperature, the lower the heat flux for the ONB occurrence, and a larger region of the heat sink is filled with vapor, which can promote the dryout incipience (decreasing the maximum heat flux).
With a lower mass flux and inlet subcooling, the system becomes more sensitive to the effects of nucleate boiling, with significant gains in HTC due to the phase-change heat transfer (for S1 with G = 1000 kg/m2s and ΔTsub = 10 °C, the HTC was increased about 39% compared to ΔTsub = 20 °C for a heat flux of 30 kW/m2). However, this can lead to the early dryout process.
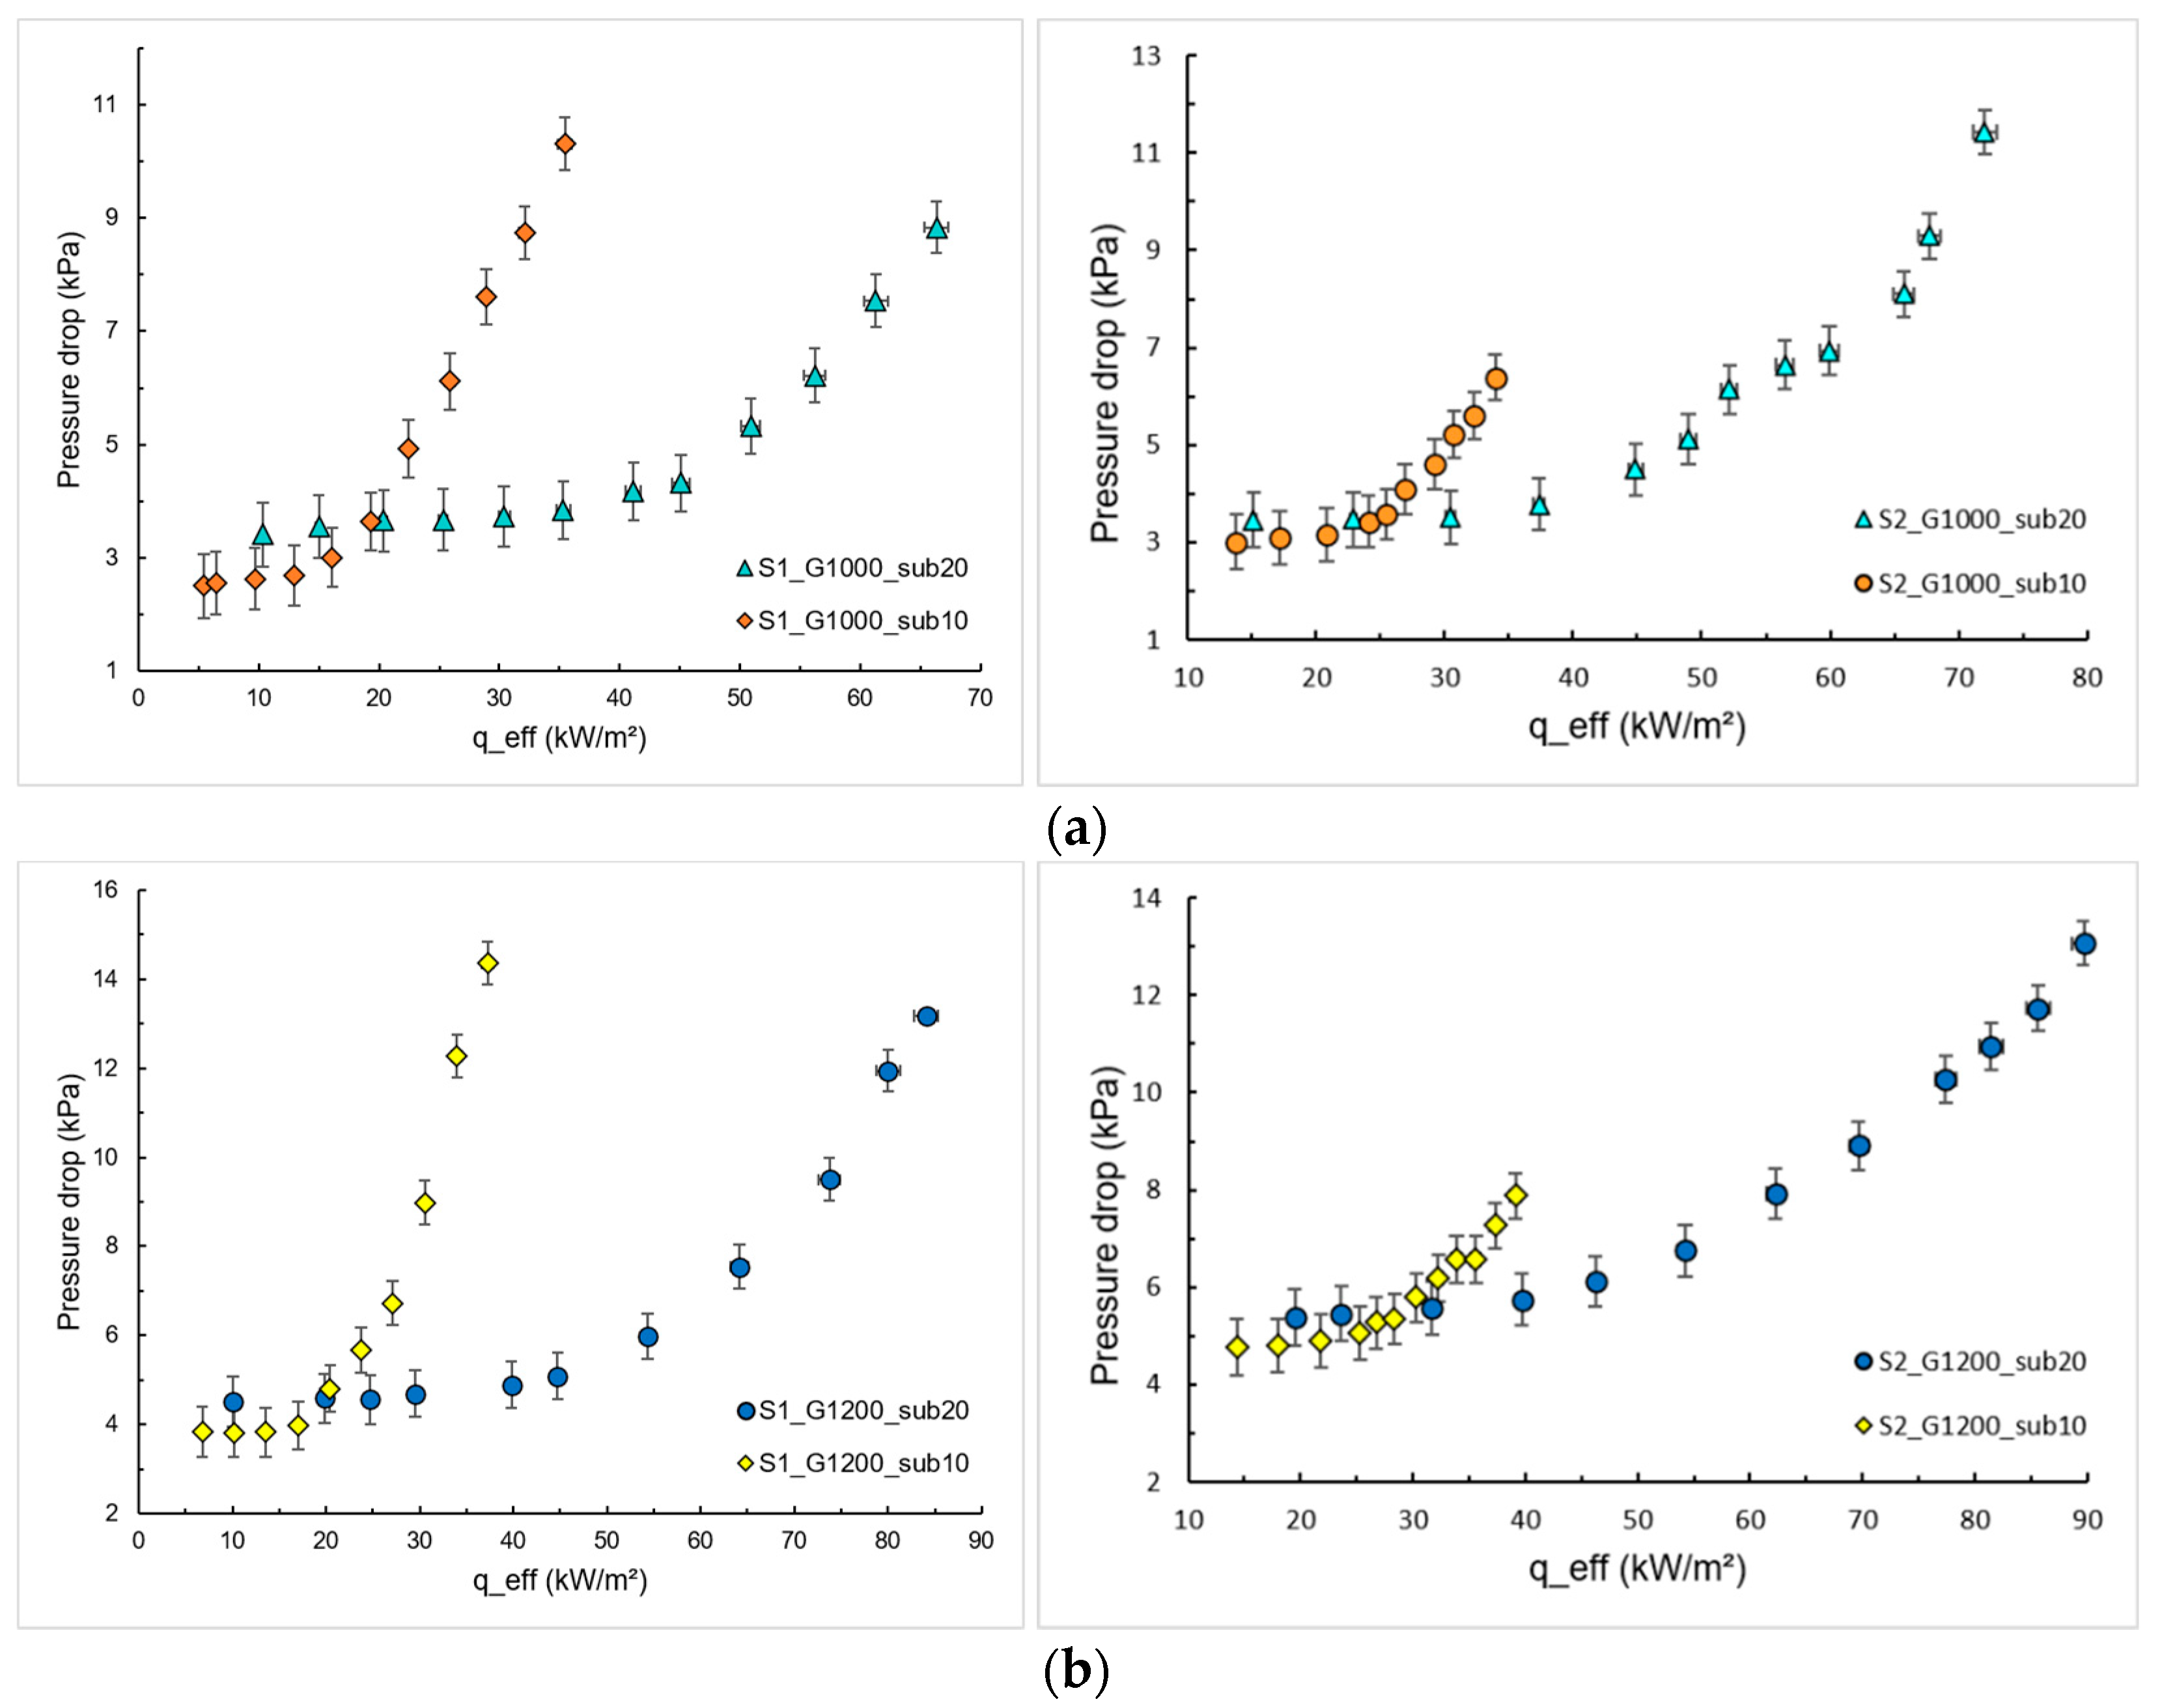
Pressure drop increases substantially with an increase of vapor amount flowing into the heat sink, which becomes more pronounced for lower subcooling, leading to the fluid dynamic limit of the system at lower heat fluxes compared to higher subcooling.
An increase in the effective area leads to an increase in the HTC; thus, the taller the micro pin fins, the higher the heat exchange area, leading to an HTC enhancement.
The reverse flow occurrence was observed more intensely for the lowest inlet subcooling temperature; the high vapor core acts as a barrier to the flow, degrading the HTC, increasing the pressure drop, and causing thermal and fluid dynamic instabilities.
This study indicates that further attention must be given concerning physical parameters (related to surface and working fluid) to the development of new technologies for thermal management systems. An isolated analysis of the effects of surface characteristics or flow parameters is not sufficient to explain the HTC and pressure drop behavior. The optimal configuration for a micro pin fin heat sink will depend on several factors, including the heat transfer requirements, the fabrication process, and the fluid flow properties. More analyses can be conducted in future works, such as developing new correlations to evaluate the HTC; for that, an extensive experimental database is needed considering different design configurations and operating conditions.

Supplementary Materials

The following supporting information can be downloaded at https://www.mdpi.com/article/10.3390/en16073175/s1: Video S1: point (a), Figure 10; Video S2: point (b), Figure 10; Video S3: point (c), Figure 10; Video S4: point (d), Figure 10; Video S5: reverse flow visualization.

Author Contributions

All authors contributed equally to developing the manuscript. All authors have read and agreed to the published version of the manuscript.

Funding

This research was funded by Conselho Nacional de Desenvolvimento Científico e Tecnológico (CNPq), grants numbers 458702/2014-5 and 309848/2020-2, and Fundação de Amparo à Pesquisa do Estado de São Paulo (FAPESP), grants numbers 2013/15431-7, 2019/02566-8, and 2022/03946-1.

Data Availability Statement

The data supporting this study’s findings are available upon request.

Acknowledgments

The authors are grateful for the financial support from the UNESP, CAPES, CNPq, and FAPESP. The authors also thank Alessandro Roger Rodrigues from Escola de Engenharia de São Carlos/USP and Ricardo Arai from IFSP/São Carlos for their important contributions to this work.

Conflicts of Interest

The authors declare no conflict of interest, and the funders had no role in the study’s design; in the collection, analyses, or interpretation of data; in the writing of the manuscript; or in the decision to publish the results.

References

  1. Tullius, J.; Tullius, T.; Bayazitoglu, Y. Optimization of short micro pin fins in minichannels. Int. J. Heat Mass Transf. 2012, 55, 3921–3932. [Google Scholar] [CrossRef]
  2. Liang, G.; Mudawar, I. Review of pool boiling enhancement by surface modification. Int. J. Heat Mass Transf. 2019, 128, 892–933. [Google Scholar] [CrossRef]
  3. Li, W.; Dai, R.; Zeng, M.; Wang, Q. Review of two types of surface modification on pool boiling enhancement: Passive and active. Renew. Sustain. Energy Rev. 2020, 130, 109926. [Google Scholar] [CrossRef]
  4. McNeil, D.A.; Raeisi, A.H.; Kew, P.A.; Hamed, R.S. An investigation into flow boiling heat transfer and pressure drop in a pin–finned heat sink. Int. J. Multiph. Flow 2014, 67, 65–84. [Google Scholar] [CrossRef] [Green Version]
  5. Deng, D.; Chen, L.; Wan, W.; Fu, T.; Huang, X. Flow boiling performance in pin fin-interconnected reentrant microchannels heat sink in different operational conditions. Appl. Therm. Eng. 2019, 150, 1260–1272. [Google Scholar] [CrossRef]
  6. Asrar, P.; Ghiaasiaan, S.M.; Joshi, Y.K. Two-Phase Heat Transfer and Flow Regimes in Pin Fin-Enhanced Microgaps—Effect of Pin Spacing. ASME J. Heat Transf. 2021, 143, 023001. [Google Scholar] [CrossRef]
  7. Asrar, P.; Zhang, X.; Green, C.E.; Bakir, M.; Joshi, Y.K. Flow boiling of R245fa in a microgap with staggered circular cylindrical pin fins. Int. J. Heat Mass Transf. 2018, 121, 329–342. [Google Scholar] [CrossRef]
  8. Woodcock, C.; Yu, X.; Plawsky, J.; Peles, Y. Piranha Pin Fin (PPF)—Advanced flow boiling microstructures with low surface tension dielectric fluids. Int. J. Heat Mass Transf. 2015, 90, 591–604. [Google Scholar] [CrossRef]
  9. Chien, L.H.; Cheng, Y.T.; Lai, Y.L.; Yan, W.M.; Ghalambaz, M. Experimental and numerical study on convective boiling in a staggered array of micro pin-fin microgap. Int. J. Heat Mass Transf. 2020, 149, 119203. [Google Scholar] [CrossRef]
  10. Jung, D.; Lee, H.; Kong, D.; Cho, E.; Jung, K.W.; Kharangate, C.R.; Iyengar, M.; Malone, C.; Asheghi, M.; Lee, H.; et al. Thermal design and management of micro-pin fin heat sinks for energy-efficient three-dimensional stacked integrated circuits. Int. J. Heat Mass Transf. 2021, 175, 121192. [Google Scholar] [CrossRef]
  11. Ortegon, J.A.A.; Souza, R.R.; Silva, J.B.C.; Cardoso, E.M. Analytical, experimental, and numerical analysis of a microchannel cooling system for high-concentration photovoltaic cells. J. Braz. Soc. Mech. Sci. Eng. 2019, 41, 255. [Google Scholar] [CrossRef]
  12. Computational Fluid Dynamics Committee. Guide for the Verification and Validation of Computational Fluid Dynamics Simulations (AIAA G-077-1998(2002)); American Institute of Aeronautics and Astronautics, Inc.: Washington, DC, USA, 1998. [Google Scholar]
  13. Prajapati, Y.K.; Pathak, M.; Khan, M.K. Bubble dynamics and flow boiling characteristics in three different microchannel configurations. Int. J. Therm. Sci. 2017, 112, 371–382. [Google Scholar] [CrossRef]
  14. Leão, H.L.S.L.; Nascimento, F.J.; Ribatski, G. Flow boiling heat transfer of r407c in a microchannels based heat spreader. Exp. Therm. Fluid Sci. 2014, 59, 140–151. [Google Scholar] [CrossRef]
  15. Chalfi, T.Y.; Ghiaasiaan, S. Pressure drop caused by flow area changes in capillaries under low flow conditions. Int. J. Multiph. Flow 2008, 34, 2–12. [Google Scholar] [CrossRef]
  16. Yin, L.; Chauhan, A.; Recinella, A.; Jia, L.; Kandlikar, S.G. Subcooled flow boiling in an expanding microgap with a hybrid microstructured surface. Int. J. Heat Mass Transf. 2020, 151, 119379. [Google Scholar] [CrossRef]
  17. Cheng, X.; Wu, H. Improved flow boiling performance in high-aspect-ratio interconnected microchannels. Int. J. Heat Mass Transf. 2021, 165, 120627. [Google Scholar] [CrossRef]
  18. Yin, L.; Jiang, P.; Xu, R.; Hu, H. Water flow boiling in a partially modified microgap with shortened micro pin fins. Int. J. Heat Mass Transf. 2020, 155, 119819. [Google Scholar] [CrossRef]
  19. Kiyomura, I.S.; Nunes, J.M.; de Souza, R.R.; Gajghate, S.S.; Bhaumik, S.; Cardoso, E.M. Effect of microfin surfaces on boiling heat transfer using HFE-7100 as working fluid. J. Braz. Soc. Mech. Sci. Eng. 2020, 42, 366. [Google Scholar] [CrossRef]
Figure 1. Schematic diagram of the experimental apparatus.
Energies 16 03175 g001
Figure 2. Design of the microfinned heat sink. (a) Isometric view; (b) front view with internal details (measurements in mm); (c) linear temperature profiles used to estimate the wall temperatures.
Energies 16 03175 g002
Figure 3. The constructive array of the micro pin fins.
Energies 16 03175 g003
Figure 4. Computational domain of the heat sink with main boundary conditions.
Energies 16 03175 g004
Figure 5. Grid view with fluid domain on the right side.
Energies 16 03175 g005
Figure 6. Effect of inlet subcooling temperature on flow boiling heat transfer of HFE-7100 for S1 and S2. (a) G = 1000 kg/m2s; (b) G = 1200 kg/m2s.
Energies 16 03175 g006
Figure 7. Effect of inlet subcooling on the pressure drops for S1 and S2. (a) G = 1000 kg/m2s; (b) G = 1200 kg/m2s.
Energies 16 03175 g007
Figure 8. Effects of mass flux on the flow boiling heat transfer of HFE-7100. (a) ΔTsub = 10 °C; (b) ΔTsub = 20 °C.
Energies 16 03175 g008
Figure 9. Effect of pin fin height on flow boiling heat transfer of HFE-7100 for ΔTsub = 10 °C. (a) G = 1000 kg/m2s; (b) G = 1200 kg/m2s.
Energies 16 03175 g009
Figure 10. Boiling curve and high-speed camera images for S1. G = 1200 kg/m2s and ΔTsub = 20 °C.
Energies 16 03175 g010
Table 1. Structural characterization of the micro pin fin heat sinks.
SurfaceSTEREOSEM (100×)
Top ViewSide View
S1
H = 160 µm
Energies 16 03175 i001Energies 16 03175 i002Energies 16 03175 i003
S2
H = 350 µm
Energies 16 03175 i004Energies 16 03175 i005Energies 16 03175 i006
Disclaimer/Publisher’s Note: The statements, opinions and data contained in all publications are solely those of the individual author(s) and contributor(s) and not of MDPI and/or the editor(s). MDPI and/or the editor(s) disclaim responsibility for any injury to people or property resulting from any ideas, methods, instructions or products referred to in the content.

