Article

Study on the Compressive and Tensile Properties of Gneiss Outcrop of Bozhong 196 Gas Field in China

1
School of Civil and Resource Engineering, University of Science and Technology Beijing, Beijing 100083, China
2
Chengdu Surveying Geotechnical Research Institute Co., Ltd. of MCC, Chengdu 610023, China
*
Author to whom correspondence should be addressed.
Energies 2023, 16(9), 3919; https://doi.org/10.3390/en16093919
Submission received: 26 March 2023 / Revised: 29 April 2023 / Accepted: 4 May 2023 / Published: 6 May 2023
(This article belongs to the Topic Petroleum and Gas Engineering)

Abstract

:
In this paper, based on the gneiss outcrop of Bozhong 196 gas field in China, uniaxial compression and Brazil splitting tests were conducted by using cores of different orientations. The following compression properties were studied: the elastic compression modulus, Poisson’s ratio and compressive strength of the gneiss outcrop. The following tensile properties were studied: the tensile modulus, the tensile strength and peak energy rate of gneiss outcrop. The results demonstrate the following: (1) The elastic compression modulus, compressive strength, tensile strength and peak energy rate of gneiss specimens with horizontal core-taking are greater than those with vertical core-taking. (2) The elastic compression modulus, Poisson’s ratio and compressive strength of horizontally cored gneiss specimens are 29.688–45.760 GPa, 0.186–0.386, and 174.94–147.80 MPa, respectively; the elastic compression modulus, Poisson’s ratio and compressive strength of the vertical gneiss specimens are 26.541–32.602 GPa, 0.429–0.476 and 169.37–134.46 MPa. (3) The tensile modulus of the horizontal gneiss specimens is 4.93–5.98 GPa. The tensile modulus of the vertical gneiss specimens is 0.96–2.11 GPa. The tensile modulus of the horizontal gneiss specimens is five times that of the vertical gneiss specimens. The elastic compression modulus of gneiss is 5–20 times that of the tensile modulus. (4) The tensile strength and peak energy rate of horizontally cored gneiss specimens are 14.33–17.55 MPa and 2598.67–4049.53 J/m2, respectively. The tensile strength of the vertical gneiss specimens is 6.12–9.65 MPa, and the peak energy rate is 715.74–1515.30 J/m2. (5) There is a good linear relationship between the peak energy rate and tensile strength of gneiss. The research results can provide a scientific and reasonable reference for in situ fracturing of Bozhong 196 gas field.

1. Introduction

The physical properties of the Ordovician granitic gneiss outcrop in Baijiafen area, Liaoning Province, China, are close to the buried-hill strata of Bozhong 196 gas field. The study of its mechanical behaviors such as compression, tensile and fracture can provide research basis for efficient hydraulic fracturing of Bozhong 196 gas field in China.
The experimental study of rock compressive and tensile properties is of great significance to the analysis of rock failure process and engineering field fracturing, etc. Scholars have conducted a significant amount of research work on rock compressive and tensile properties, and many results have been published, mainly focusing on elastic deformation coefficients, compressive strength, tensile strength, and peak energy rate. For the study of the compressive properties of gneiss, Cai et al. [1] conducted an acoustic emission characteristic test on gneiss during the uniaxial compression fracture process, and they obtained the variation of internal cracks with time, stress and strain and the corresponding acoustic emission development pattern of gneiss. Yao et al. [2] studied the anisotropic mechanical properties of vertical and parallel bedding gneiss under point load tests and uniaxial compression tests. Wang et al. [3] used uniaxial compression and acoustic emission tests to explore the damage evolution law of gneiss in different bedding directions and the AE characteristics during deformation and failure, revealing the mechanical properties and strain field evolution characteristics of gneiss in different bedding angles. Feng et al. [4] analyzed the strength characteristics of gneiss in different bedding directions by using the wave velocity test, uniaxial compression test and point load test. Wang et al. [5] and Deng et al. [6] studied the mechanical properties of gneiss under freeze–thaw cycles. Ji et al. [7] studied the compressive properties of gneiss through the uniaxial compression test, and they analyzed the evolution process of rock from microscopic cracks to macroscopic cracks via the uniaxial compression test with the help of acoustic emission technology. João et al. [8] studied the relationship between the durability index and uniaxial compressive strength of a gneissic rock at different weathering grades. Liu et al. [9] studied the influence of bedding planes on mechanical properties of bedded rock-like specimens by uniaxial compression test with acoustic emission and digital image correlation. Costa et al. [10] studied the influence of high temperatures on compressive properties of gneiss. Liu et al. [11] studied the compressive properties of layered gneiss. Wang et al. [12] explored the influence of initial ground stress on the properties of gneiss, changes in the physical properties, mechanical properties and failure mode of gneiss, which were analyzed by conducting physical and mechanical tests on gneiss in different ground stress areas. For the study of the tensile properties of gneiss and other anisotropic rocks, Istvan [13] and McLamore et al. [14] used the Brazilian splitting test to study the tensile strength of transverse isotropic rocks. Zhong et al. [15] conducted Brazilian splitting tests on rock with different bedding angles and analyzed the influence of anisotropy on the tensile resistance characteristics of rock. Hou et al. [16] conducted Brazilian splitting tests on rock with different bedding angles, and they analyzed the influence of tensile strength, splitting modulus and deformation at the stress peak of anisotropic rock, finding that there was a good linear relationship between the peak energy rate and tensile strength. Zhu et al. [17] studied the mechanical and energy properties of rock with different bedding angles under dry and saturated conditions, and they compared the peak energy rates of different laminated rock. Tan and Konietzky [18] conducted Brazilian splitting tests on gneiss at multiple loading angles to obtain the tensile strength of gneiss specimens with different bedding directions. Amadei et al. [19] established the generalized analytic formula of anisotropic material disks under vertical compression load. Chen et al. [20] proposed the stress and strain solutions for the Brazilian splitting test of transverse-isotropic materials in combination with the experimental and analytical methods. Gong and Li [21] proposed an analytical algorithm for tensile modulus in the Brazilian disc splitting test. In previous studies, substantial research was conducted on the compressive mechanical properties of gneiss in different directions, but little attention was given to the tensile mechanical properties of gneiss in different directions, focusing mainly on the tensile strength, while not considering the tensile modulus and peak energy rate parameters of gneiss. At present, there are few studies on the mechanical properties of the gneiss outcrop in Bozhong 196 gas field. Therefore, it is necessary to study the compressive and tensile properties of the gneiss outcrop in Bozhong 196 gas field in different directions.
In this paper, uniaxial compression and Brazil splitting tests are carried out on the outcropping gneiss of Bozhong 196 gas field, and the tensile and compression properties of gneiss under different core-taking directions are studied. Mechanical parameters such as elastic compression modulus, Poisson’s ratio, compressive strength, tensile modulus, tensile strength and peak energy rate are obtained under different core-taking directions, which provide a basis for the in situ fracturing of the reservoir in Bozhong 196 gas field in China.

2. Test Methods and Specimen Preparation

2.1. Test Methods

Uniaxial compression and Brazilian splitting tests were carried out on TAR-1500 rock mechanics test system. The TAR-1500 testing machine adopts full-service control, and the maximum vertical loading capacity is 600 kN; axial displacement measurement is ±100 mm; lateral displacement measurement is in the range 0–200 mm. The accuracy of the load cell is 1%. During the test, the displacement, stroke and load of the test object can be controlled. Uniaxial compression tests were carried out on the test system, as shown in Figure 1. The uniaxial compression test fixture device was installed on the base of the TAR-1500 rock mechanics test system. The bottom surface of the specimen was coated with a thin layer of lubricant and placed in the center of the base. A rigid pad was placed between the upper end of the specimen and the pressure plate of the test machine. The surface of this rigid pad was smooth. If a rough surface is used as a boundary at the loading platen, it increases friction and resists the lateral expansion of the sample, resulting in a confining stress near the loading platen that could change the mode of failure. In order to minimize lateral confinement near the loading platens, a friction-free boundary should be placed between the sample and the loading platens [22,23]. The bearing head was adjusted to ensure the rigid pad made contact with the bearing plate of the test machine evenly, so that the specimen is stressed evenly. The axial displacement control mode was adopted in the test process, and the displacement rate was constant at 2 mm/min until the specimen was fractured. The strain rate was 0.00067 s−1. The sampling rate during the test was every 0.2 s.
Disc splitting tests were conducted on the test system, as shown in Figure 2. Gneiss is a kind of brittle material. Brazilian splitting method was always used to test the tensile strength of gneiss specimens [21]. The indenter loading mode was selected in this test, which has a small test dispersion and the most regular rock failure mode [24]. The connecting rod was installed on the universal test machine and connected with the Brazilian splitting fixture. The specimen was placed in the middle of the fixture and then aligned to make the disc specimen crack in the center position.

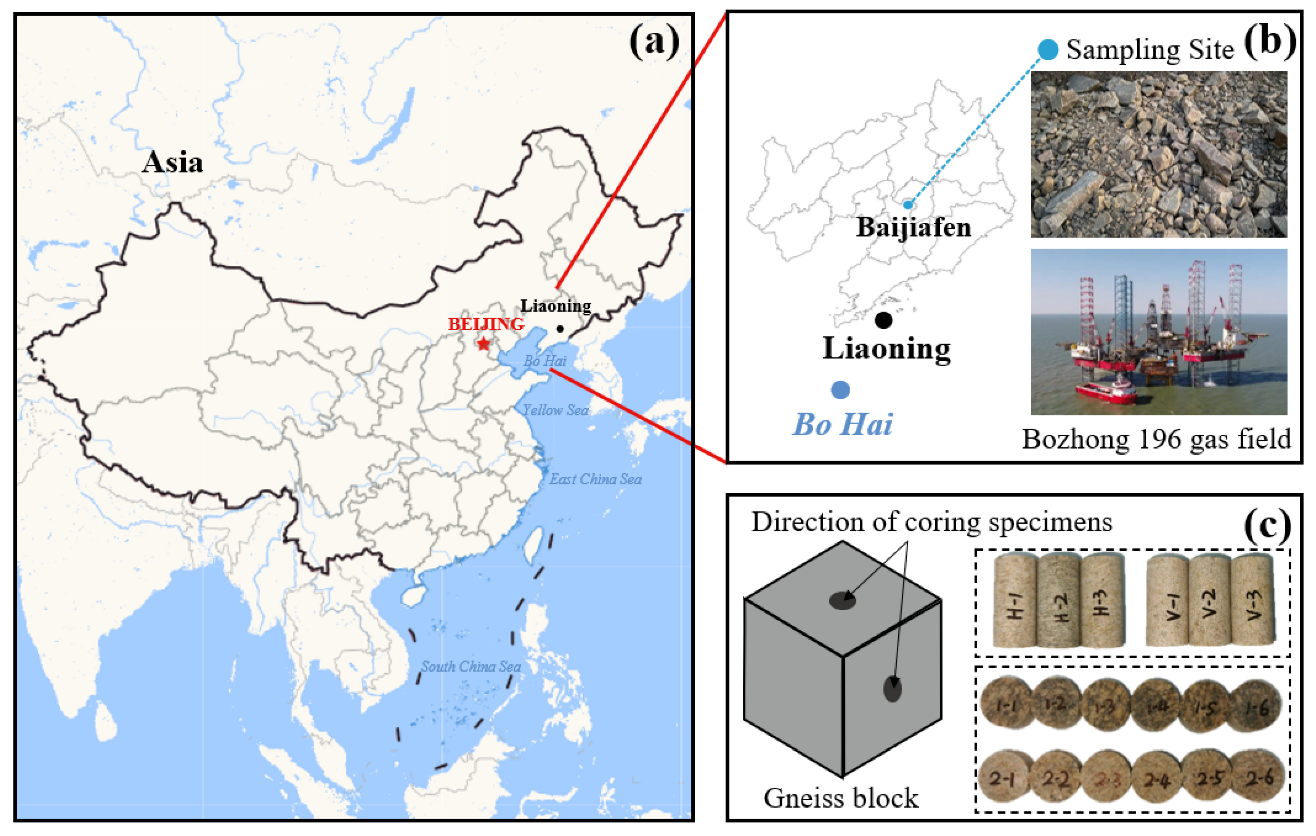
2.2. Specimen Preparation

In this paper, rock specimens were collected from the Ordovician granitic gneiss outcrop in Baijiafen, Anshan area, China (Figure 3a). The gneiss has no obvious bedding. XRD results show that the whole rock mineral content of the Gneiss specimen consists mainly of Plagioclase (36%), Quartz (29%), Potassium feldspar (15%) and phlogopite (15%) and minor amounts of Calcite (2%), Ankerite (2%) and Siderite (1%).
Since there is no obvious bedding, the core is drilled horizontally and vertically within the intact gneiss block to study the anisotropic properties. Through cutting, grinding and other processes, the compression specimens, with diameter of 25 mm and thickness of 50 mm, and the disc splitting specimens, with diameter of 25 mm and thickness of 15 mm, are made. Six uniaxial gneiss specimens were drilled, in which three specimens drilled horizontally and labeled as H-1, H-2 and H-3, three specimens were drilled vertically and labeled as V-1, V-2, V-3. According to GB/T 50266-2013 standard [25], it is specified in this standard to test 3 specimens in each compression direction. Twelve gneiss disk specimens were drilled, in which six specimens were drilled horizontally and labeled as 1-1, 1-2, 1-3, 1-4, 1-5, 1-6, six specimens drilled vertically and labeled as 2-1, 2-2, 2-3, 2-4, 2-5, 2-6 (Figure 3c). The parallelism of the upper and lower surfaces of the specimens was controlled within 0.05 mm, and the flatness of each surface was controlled within 0.02 mm. Moreover, the gneiss specimens prepared guaranteed that no natural fractures could be seen. All specimens were kept in a dry environment at room temperature.

3. Study on Mechanical Properties of Gneiss in Different Directions: Experimental Results and Discussion

3.1. Study on Compression Properties

Figure 4 shows the compression failure patterns and stress–strain curves of the horizontal gneiss specimens under uniaxial compression test. It can be observed that there was a crack through every rock specimen. At the beginning of the loading stage, the curves bend slightly upward and present a downward concave shape, which belongs to the compaction stage. At this stage, the microcracks inside the gneiss were compressed and closed. Due to the different distribution of natural cracks in the specimens, the lengths of each compaction stage are different. With the increase in load, the specimens entered the linear elastic compression stage, and the stress–strain curves of the specimens show a good linear relationship; the elastic compression modulus of the specimens was calculated at this stage, and we calculated the elastic modulus and Poisson’s ratio by calculating the average slope of the approximate straight part of the axial stress–strain curve. Then, the specimens entered the crack growth stage, during which microcracks gradually developed and formed macrocracks. The stress–strain curves of the specimens deviate from the linear segment, and failure occurs at the peak of the curves, and then the stress–strain curves decrease rapidly. A small fluctuation occurring in the linear elastic stage of the stress–strain curve of specimen H-2 is caused by natural pre-existing cracks in the gneiss. The horizontal specimens showed a zigzag or step-like stress decrease in the post-peak stage. This phenomenon is similar with the experimental results of Huang et al. [26], Xiao et al. [27] and Huang et al. [28], which is mainly due to the influence of natural cracks in the rock specimens on the characteristics of crack nucleation and propagation; that is, the stress decrease on the stress–strain curves corresponds to the crack growth behavior of the specimens. The uniaxial compression testing results of the horizontal gneiss specimens are shown in Table 1. The elastic compression modulus of the horizontal gneiss specimens is 29.688–45.760 GPa, with an average of 36.134 GPa. Poisson’s ratio is 0.186–0.386, with an average of 0.291. The compressive strength is 174.94–147.80 MPa, with an average of 163.38 MPa. The results are similar to those of previous experiments on gneiss [8].
Figure 5 shows the compression failure patterns and stress–strain curves of the vertical gneiss specimens under uniaxial compression testing. It can be seen that the fracture modes of the vertical gneiss and horizontal gneiss specimens are basically the same. At the initial loading stage and the linear elastic compression stage, the stress–strain curves of the vertical specimens are similar to those of the horizontal specimens. In the yield stage and the post-peak stage, the peak strain softens more smoothly. The stress–strain curve of specimen V-3 also has a small fluctuation in the post-peak stage caused by natural cracks in the rock specimen. The results of uniaxial compression testing of the vertical gneiss specimens are shown in Table 2. The elastic compression modulus of the vertical gneiss specimens is 26.541–32.602 GPa, with an average of 29.771 GPa. The Poisson’s ratio is 0.429–0.476, with an average of 0.454. The compressive strength is 169.37–134.46 MPa, with an average of 148.65 MPa.
Figure 6 shows each gneiss sample after uniaxial compression. Samples H-1, H-2 and H-3 have more cracks, which are mainly composed of 1-2 through cracks and 4-5 small cracks, indicating that there are natural cracks in the samples, which also explains why the stress–strain curves of samples H-1, H-2 and H-3 have many stepped shapes during the uniaxial compression experiment. The number of cracks in V-1, V-2 and V-3 samples is less than that in H-1, H-2 and H-3 samples, which are mainly composed of 1-2 through cracks and 3-4 small cracks. This explains why V-1, V-2 and V-3 samples have fewer natural cracks in the samples, which also explains why their stress–strain curves are relatively smooth in uniaxial compression tests. On the one hand, this difference reflects the dispersion of gneiss samples. On the other hand, it also reflects the anisotropy of gneiss.
By comparing the compression properties of the two groups of gneiss specimens, two obvious characteristics can be found: (1) the dispersion of each group of gneiss specimens is obvious; (2) the elastic compression modulus and compressive strength in the horizontal direction are greater than those in the vertical direction, and the Poisson’s ratio in the horizontal direction is smaller than that in the vertical direction. These fully reflect the anisotropy of the compression properties of the gneiss.

3.2. Study on Tensile Properties

For horizontal coring, we tested the specimens in the horizontal direction, and the splitting test produced fractures oriented orthogonally to the vertical direction; thus, it corresponded to vertical tensile properties. For vertical coring, we tested the specimens in the horizontal direction, and the splitting test produced fractures oriented orthogonally to horizontal directions; thus, it corresponded to horizontal tensile properties. Figure 7 shows the Brazilian fracture failure patterns of gneiss in different directions. During the fracturing testing, it can be observed that the gneiss specimens cracked at its center and rapidly expanded up and down along the vertical direction, forming a penetrating vertical fracture surface and splitting in two along the direction of the loading radial. There is no significant difference in fracture morphology of gneiss in different directions. Among them, the cracks in disc specimen 1-4 did not penetrate through the vertical direction but through the inclined direction. Considering the possibility of natural cracks in specimen 1-4, specimen 1-4 was not included in the discussion scope in the subsequent analysis of results.
Figure 8 shows the load–vertical displacement curves of the horizontal gneiss specimens under the Brazilian splitting test. It can be observed that at the initial loading stage, the curves are bending slightly upward in a concave shape. Before reaching the peak strength, the yield stage is not obvious. After reaching the peak strength, the curves decrease rapidly in a straight line and directly enter the failure stage, which corresponds to the fracture expansion state of the disk specimens. Differently from the uniaxial compressive stress–strain curve, the post-peak stage of the Brazilian splitting load–vertical displacement curve is shorter, which reflects the different compressive and tensile properties of the gneiss. The Brazilian splitting testing results of the horizontal gneiss are shown in Table 3. The failure limit load of the horizontal gneiss specimens is between 8609 and 10,492 N, with an average value of 9427.40 N.
Figure 9 shows the load–vertical displacement curves of the vertical gneiss specimens under the Brazilian splitting test, which is similar with the curve of the horizontal gneiss specimens, and the ultimate load of the vertical gneiss specimens is smaller than that of the horizontal gneiss specimens. The Brazilian splitting testing results of the vertical gneiss are shown in Table 4. The failure limit load of the vertical gneiss specimens is between 3645 and 5837 N, with an average value of 4605.83 N.
In the Brazilian splitting tests, after the ultimate load of a specimen in the splitting test is measured, the tensile strength of the gneiss specimens is calculated by the following formula:
σ t = 2 P m a x π D H ,
where σ t is the tensile strength, Pmax is the ultimate load, D is the diameter of the specimen, and H is the thickness of the specimen.
The tensile strength of the horizontal and vertical gneiss specimens calculated by Equation (1) is shown in Table 5. The tensile strength of the horizontal gneiss specimens is 14.33–17.55 MPa, with an average of 15.72 MPa. The tensile strength of the vertical gneiss specimens is 6.12–9.65 MPa, with an average value of 7.64 MPa.
According to the research of the Brazilian splitting test by Liu et al. [29], the tensile modulus of the specimens can be obtained by the Brazilian splitting test. The Brazilian splitting stress component can be expressed as:
σ x = P m a x π D H q x x σ y = P m a x π D H q y y τ x y = P m a x π D H q x y } ,
where q x x ,     q y y and q x y are stress concentration factors. When the Brazilian splitting is on an isotropic plane, according to the research of Liu et al. [30] on solving methods of anisotropic tensile modulus at different angles, the stress concentration factors q x x ,     q y y and q x y are approximately equal to −2, 6, and 0, respectively. In this case, the tensile modulus E t h can be solved as follows:
π D H P m a x h { ε x h ε y h γ x y h } = [ 1 / E t h v h / E t h 0 v h / E t h 1 / E t h 0 0 0 2 ( 1 + v h ) / E t h ] { 2 6 0 } ,
where v h comes from the average value of uniaxial compression experiment in Section 3.1.
As shown in Table 6, the tensile modulus of the horizontal gneiss specimens is 4.93–5.98 GPa, with an average value of 5.50 GPa.
When the Brazilian splitting is perpendicular to the isotropic plane, the tensile modulus E t v can be solved as follows [14]:
π D H P m a x v { ε x v ε y v γ x y v } = [ 1 / E t v v v / E t v 0 v v / E t v 1 / E t h 0 0 0 0 ] { 2 6 0 } ,
where E t h is taken from the average of Table 6, and v h comes from the average value of uniaxial compression experiment in Section 3.1.
Table 7 shows that the tensile modulus of the vertical gneiss specimens is 0.96–2.11 GPa, with an average value of 1.28 GPa.
By comparing the tensile modulus of gneiss in different directions, it can be seen that the tensile modulus of the horizontal gneiss specimens is five times that of the vertical gneiss specimens. Moreover, by comparing the elastic compression modulus and tensile modulus of gneiss, it can be found that the elastic compression modulus of gneiss is 5–20 times that of the tensile modulus.
As we know, in hydraulic fracturing simulation, besides tensile strength, energy characteristics represent an important parameter of rock damage and fracture in the process of hydraulic fracturing.
The gneiss specimen accumulates energy continuously in the process of loading until the specimen is destroyed. In this process, the accumulated energy can be determined by the area of the load–vertical displacement graph [17]:
G = 0 δ P d δ ,
where G is the energy stored at a certain time, P is the vertical load at this moment, and δ is the vertical displacement measured by the Brazilian splitting test at that moment. In order to eliminate the differences caused by the size of the gneiss sample, the cumulative energy accumulated per unit fracture area is used. The formula is:
W = G m a x D H ,
where W is the peak energy rate, and G m a x is the total stored energy.
The peak energy rate of the horizontal and vertical gneiss specimens calculated by Equation (6) are shown in Table 8. The peak energy rate of the horizontal gneiss specimens is 2598.67–4049.53 J/m2, with an average value of 3137.08 J/m2. The peak energy rate of the vertical gneiss specimens is 715.74–1515.30 J/m2, with an average value of 1153.94 J/m2.
By comparing the tensile properties of the two groups of gneiss specimens, it can be found that the failure limit load, tensile strength and peak energy rate in the horizontal direction are greater than those in the vertical direction. The anisotropy of the gneiss tensile properties is obvious.
There is a certain relationship between the tensile strength and peak energy rate of gneiss specimens. The experimental tensile strength and peak energy rate were fitted, and the results are shown in Figure 10 and Figure 11. It can be seen that the tensile strength of gneiss specimens has a strong linear relationship with the peak energy rate. The peak energy rate of gneiss specimens increases with the increase in tensile strength.

4. Conclusions

In this paper, uniaxial compression and Brazilian splitting tests were conducted, respectively, for horizontal and vertical core-taking of gneiss specimens from outlying reservoirs of Bozhong 196 gas field in China, and the mechanical parameters of compression and tensile properties of gneiss were obtained. The elastic compression modulus, Poisson’s ratio, compressive strength, tensile modulus, tensile strength and peak energy rate of gneiss in different directions were calculated and compared, and the main conclusions were obtained as follows:
(1)
There is no obvious bedding for the gneiss specimens, but the anisotropy is clearly observed. The elastic compression modulus and compressive strength of gneiss specimens in the horizontal direction are greater than those in the vertical direction, while the Poisson’s ratio of gneiss specimens in the horizontal direction is smaller than that in the vertical direction. The elastic compression modulus, Poisson’s ratio and compressive strength of gneiss specimens in the horizontal direction are 29.688–45.760 GPa, 0.186–0.386, and 174.94–147.80 MPa, respectively. The corresponding elastic compression modulus of the vertical gneiss specimens is 26.541–32.602 GPa, the Poisson’s ratio is 0.429–0.476 and the compressive strength is 169.37–134.46 MPa.
(2)
The anisotropy of gneiss tensile properties is significant. The tensile modulus of the horizontal gneiss specimens is 4.93–5.98 GPa. The tensile modulus of the vertical gneiss specimens is 0.96–2.11 GPa. The tensile modulus of the horizontal gneiss specimens is five times that of the vertical gneiss specimens. The elastic compression modulus of gneiss is 5–20 times that of the tensile modulus.
(3)
The tensile strength and peak energy rate of gneiss specimens in the horizontal direction are greater than those in the vertical direction. The tensile strength of the horizontal gneiss specimens is 14.33–17.55 MPa, and the peak energy rate is 2598.67–4049.53 J/m2. The tensile strength of the vertical gneiss specimens is 6.12–9.65 MPa, and the peak energy rate is 715.74–1515.30 J/m2.
(4)
The peak energy rate of gneiss has a good linear relationship with the tensile strength, and the peak energy rate of gneiss increases with the increase in the tensile strength.
(5)
The results in this paper can provide simulation parameters for the hydraulic fracturing simulations of Bozhong 196 gas field in China.

Author Contributions

Writing—review and editing, L.Y.; Writing—original draft, T.N.; Validation, F.H.; Investigation, Z.S. All authors have read and agreed to the published version of the manuscript.

Funding

The work is supported by the National Natural Science Foundation of China (No. 51704015).

Data Availability Statement

Not applicable.

Conflicts of Interest

The authors declare no conflict of interest.

References

  1. Cai, G.; Huang, R.; Xu, Q.; Lin, F.; Tang, M. AE characteristics of gneiss fracture process under uniaxial compression. J. Eng. Geol. 2011, 19, 472–477. [Google Scholar]
  2. Yao, J.; Yao, H.; Dai, L.; Bian, H. Study on the mechanical characteristics of anisotropic gneiss under point load and uniaxial compression. Chin. J. Undergr. Space Eng. 2021, 17, 1038–1044+1062. [Google Scholar]
  3. Wang, X.; Jiang, P.; Yan, S.; Zhan, S.; Huang, F. Mechanical properties and deformation field evolution of layered gneiss. J. Min. Saf. Eng. 2020, 37, 1255–1262. [Google Scholar]
  4. Feng, X.; Dai, L.; Yao, H.; Hu, H.; Zhang, Z.; Li, H. Experimental study on anisotropic characteristics of gneiss. Sci. Technol. Eng. 2019, 19, 233–239. [Google Scholar]
  5. Wang, S.; Chen, Y.; Ni, J.; Fernández, T.M.; Xu, C. Mechanical Characteristics and Mechanism of Granite Subjected to Coupling Effect of Acidic Corrosion and Freeze-Thaw Cycles. J. Earth Sci. 2021, 32, 1202–1211. [Google Scholar] [CrossRef]
  6. Deng, X.; Zhang, Y.; Wang, R.; Yuan, D. Study on mechanical properties and damage mechanism of strongly weathered gneiss under freeze–thaw cycles. Arab. J. Geosci. 2022, 15, 428. [Google Scholar] [CrossRef]
  7. Ji, D.; Yang, Z.; Peng, C. Numerical Simulation Research on mechanism of gneisses fracture evolution by particle flow code. Chin. J. Undergr. Space Eng. 2013, 9, 825–830+877. [Google Scholar]
  8. João, P.; Rogério, R.; Marcos, F. Relationship between durability index and uniaxial compressive strength of a gneissic rock at different weathering grades. Bull. Eng. Geol. Environ. Off. J. IAEG 2020, 79, 1381–1397. [Google Scholar]
  9. Liu, H.; Jing, H.; Yin, Q.; Meng, Y.; Zhu, G. Effect of bedding plane on mechanical properties, failure mode, and crack evolution characteristic of bedded rock-like specimen. Theor. Appl. Fract. Mech. 2023, 123, 103681. [Google Scholar] [CrossRef]
  10. Costa, K.; Xavier, G.; Marvila, M.; Alexandre, J.; Azevedo, A.; Monteiro, S. Influence of high temperatures on physical properties and microstructure of gneiss. Bull. Eng. Geol. Env. 2021, 80, 7069–7081. [Google Scholar] [CrossRef]
  11. Liu, K.; Liu, Q.; Zhu, Y.; Liu, B. Experimental study of coal considering directivity effect of bedding plane under Brazilian splitting and uniaxial compression. Chin. J. Rock Mech. Eng. 2013, 32, 308–316. [Google Scholar]
  12. Wang, R.; Wang, Y.; Deng, X.; Qin, Y.; Xie, B. Investigation on the properties of gneiss under different ground stresses. Sensors 2022, 22, 1591. [Google Scholar] [CrossRef]
  13. Istvan, J.A.; Evans, L.J.; Weber, J.H.; Devine, C. Rock mechanics for gas storage in bedded salt caverns. Int. J. Rock Mech. Min. Sci. 1997, 34, 142.e1–142.e12. [Google Scholar] [CrossRef]
  14. McLamore, R.; Gray, E.K. The mechanical behavior of anisotropic sedimentary rocks. J. Eng. Ind. 1967, 89, 62–73. [Google Scholar] [CrossRef]
  15. Zhong, S.; Zuo, S.; Luo, S. Brazilian tensile strength and tensile damage anisotropy of laminated limestone. Sci. Technol. Eng. 2020, 20, 6578–6584. [Google Scholar]
  16. Hou, P.; Gao, F.; Yang, Y.; Zhang, Z.; Gao, Y.; Zhang, X.; Zhang, J. Effect of bedding plane direction on acoustic emission characteristics of shale in Brazilian tests. Rock Soil Mech. 2016, 37, 1603–1612. [Google Scholar]
  17. Zhu, S.; Li, J. Energy research on slates with bedding structure under Brazilian splitting tests in dry and saturated condition. J. Cent. South Univ. 2018, 49, 2024–2030. [Google Scholar]
  18. Tan, X.; Konietzky, H. Brazilian split tests and numerical simulation by discrete element method for heterogeneous gneiss with bedding structure. Chin. J. Rock Mech. Eng. 2014, 33, 938–946. [Google Scholar]
  19. Amadei, B.; Rogers, J.D.; Goodman, R.E. Elastic constants and tensile strength of the anisotropic rocks. In Proceedings of the Fifth Congress of International Society of Rock Mechanics, Melbourne, VIC, Australia, 10 April 1983; pp. 189–196. [Google Scholar]
  20. Chen, C.; Pan, E.; Amadei, B. Determination of deformability and tensile strength of anisotropic rock using Brazilian tests. Int. J. Rock Mech. Min. Sci. 1998, 35, 43–61. [Google Scholar] [CrossRef]
  21. Gong, F.; Li, X. Analytical algorithm to estimate tensile modulus in Brazilian disk splitting tests. Chin. J. Rock Mech. Eng. 2010, 29, 881–891. [Google Scholar]
  22. Carl, E.R.; Erland, M.S.; Daniel, I.; Andrii, M. Increased fractured rock permeability after percolation despite limited crack growth. J. Geophys. Res. Solid Earth 2020, 125, e2019JB019240. [Google Scholar]
  23. Carl, E.R.; Andrii, M.; Erland, M.S. Experimental verification of the isotropic onset of percolation in 3d crack networks in polycrystalline materials with implications for the applicability of percolation theory to crustal rocks. J. Geophys. Res. Solid Earth 2021, 126, e2021JB023092. [Google Scholar]
  24. Yang, T.; Wang, B.; Sun, L.; Gao, Q. Effects of various spacer methods for rock split tests. Site Investig. Sci. Technol. 2002, 01, 3–7. [Google Scholar]
  25. GB/T 50266-2013. Standard for Tests Method of Engineering Rock Mass. General Administration of Quality Supervision. Inspection and Quarantine of the People’s Republic of China: Beijing, China, 2013.
  26. Huang, D.; Gu, D.; Yang, C.; Huang, R.; Fu, Y. Investigation on mechanical behaviors of sandstone with two preexisting flaws under triaxial compression. Rock Mech. Rock Eng. 2016, 49, 375–399. [Google Scholar] [CrossRef]
  27. Xiao, T.; Li, X.; Jia, S. Failure characteristics of rock with two pre-existing transfixion cracks under triaxial compression. Chin. J. Rock Mech. Eng. 2015, 34, 2455–2462. [Google Scholar]
  28. Huang, Y.; Yang, S.; Ju, Y.; Zhou, X.; Gao, F. Experimental study on mechanical behavior of rock-like materials containing pre-existing intermittent fissures under triaxial compression. Chin. J. Geotech. Eng. 2016, 38, 1212–1220. [Google Scholar]
  29. Liu, Y.; Fu, H.; Rao, J.; Dong, H.; Cao, Q. Research on Brazilian disc splitting tests for anisotropy of slate under influence of different bedding orientations. Chin. J. Rock Mech. Eng. 2012, 31, 785–791. [Google Scholar]
  30. Liu, T.; Wan, W.; Wang, Y.; Luo, S.; Tang, J. Experimental study on the influence of rock tensile strength based on Brazilian test. Miner. Eng. Res. 2016, 31, 1–7. [Google Scholar]
Figure 1. Uniaxial compression test by TAR-1500 Rock mechanics test system.
Energies 16 03919 g001
Figure 2. Brazilian splitting test by TAR-1500 Rock mechanics test system.
Energies 16 03919 g002
Figure 3. Baijiafen gneiss sampling site and processing of specimens. (a) Baijiafen gneiss sampling site (b) Gneiss outcrop of Bozhong 196 gas field (c) Processing of specimens.
Energies 16 03919 g003
Figure 4. Stress–strain curves of horizontal gneiss specimens.
Energies 16 03919 g004
Figure 5. Stress–strain curves of vertical gneiss specimens.
Energies 16 03919 g005
Figure 6. The gneiss specimens after compression. (The red lines are cracks).
Energies 16 03919 g006
Figure 7. The gneiss specimens after splitting.
Energies 16 03919 g007
Figure 8. Load–vertical displacement curves of horizontal gneiss specimens by Brazil splitting tests.
Energies 16 03919 g008
Figure 9. Load–vertical displacement curves of vertical gneiss specimens by Brazil splitting tests.
Energies 16 03919 g009
Figure 10. Relationship between tensile strength and peak energy rate of horizontal gneiss specimens.
Energies 16 03919 g010
Figure 11. Relationship between tensile strength and peak energy rate of vertical gneiss specimens.
Energies 16 03919 g011
Table 1. Uniaxial compression testing results of horizontal gneiss specimens.
Specimen NumberLength L
(mm)
Diameter   D (mm) Weight   W (N) Density   ρ (g/cm3)Deformation
d
(mm)
Compressive   Strength   σ b c h
(MPa)
Elastic   Compression   Modulus   E h
(GPa)
Poisson s   Ratio   v h
H-150.2325.260.652.620.30167.3932.9550.301
H-250.2425.310.652.640.25174.9445.7600.186
H-350.2325.260.652.620.29147.829.6880.386
Mean value 50.2325.280.652.630.28163.3836.1340.291
Table 2. Uniaxial compression testing results of vertical gneiss specimens.
Specimen NumberLength L (mm)Diameter D
(mm)
Weight W
(N)
Density   ρ (g/cm3)Deformation
d
(mm)
Compressive   Strength   σ b c v
(MPa)
Elastic   Compression   Modulus   E v
(GPa)
Poisson s   Ratio   v v
V-149.9225.260.642.630.27142.1130.1700.456
V-249.9325.190.642.630.30169.3732.6020.429
V-349.9425.270.642.610.29134.4626.5410.476
Mean value 49.9325.240.642.620.29148.6529.7710.454
Table 3. Brazilian splitting testing results of horizontal gneiss specimens.
Specimen NumberDiameter D (mm)Thickness H (mm)Weight W (N) Ultimate   Load   P m a x h   ( kN )
1-125.2915.060.3810.49
1-225.2615.240.399.44
1-325.2915.070.389.85
1-4----
1-525.2915.130.398.61
1-625.2715.060.388.76
Mean value 25.2815.110.389.43
Table 4. Brazilian splitting testing results of vertical gneiss specimens.
Specimen NumberDiameter D (mm)Thickness H (mm)Weight W (N) Ultimate   Load   P m a x v   ( kN )
2-125.2015.260.394.65
2-225.2115.480.394.63
2-325.2015.210.394.25
2-425.1915.140.394.62
2-525.2115.050.383.65
2-625.2115.280.395.84
Mean value 25.2015.240.394.61
Table 5. Calculation results of tensile strength of horizontal and vertical gneiss specimens.
Specimen Number1-11-21-31-41-51-6 Mean Value Variance
Tensile strength σ t h (MPa)17.5515.6116.45-14.3314.6515.721.40
Specimen Number2-12-22-32-42-52-6 Mean Value Variance
Tensile strength σ t v (MPa)7.707.577.067.726.129.657.641.11
Table 6. Calculation results of tensile modulus of horizontal gneiss specimens.
Specimen Number1-11-21-31-41-51-6 Mean Value Variance
Tensile Modulus E t h (GPa)5.275.985.64-5.684.935.500.13
Table 7. Calculation results of tensile modulus of vertical gneiss specimens.
Specimen Number2-12-22-32-42-52-6 Mean Value Variance
Tensile Modulus E t v (GPa)0.961.221.011.061.332.111.280.15
Table 8. Calculation results of peak energy rate of horizontal and vertical gneiss specimens.
Specimen Number1-11-21-31-41-51-6 Mean Value Variance
Peak energy rate W h (kJ/m2)4.052.843.20-2.602.993.140.25
Specimen Number2-12-22-32-42-52-6 Mean Value Variance
Peak energy rate W v (kJ/m2)1.281.131.051.240.721.521.150.06
Disclaimer/Publisher’s Note: The statements, opinions and data contained in all publications are solely those of the individual author(s) and contributor(s) and not of MDPI and/or the editor(s). MDPI and/or the editor(s) disclaim responsibility for any injury to people or property resulting from any ideas, methods, instructions or products referred to in the content.

