Article

Experimental Study of Mass Transfer in a Plug Regime of Immiscible Liquid–Liquid Flow in a T-Shaped Microchannel

by
Semyon Vostretsov
1,2,
Anna Yagodnitsyna
1,2,*,
Alexander Kovalev
1,2 and
Artur Bilsky
1,*
1
Kutateladze Institute of Thermophysics SB RAS, 630090 Novosibirsk, Russia
2
Physics Department, Novosibirsk State University, 630090 Novosibirsk, Russia
*
Authors to whom correspondence should be addressed.
Energies 2023, 16(10), 4059; https://doi.org/10.3390/en16104059
Submission received: 10 April 2023 / Revised: 10 May 2023 / Accepted: 11 May 2023 / Published: 12 May 2023
(This article belongs to the Special Issue Heat Transfer and Fluid Dynamics in Boiling Systems)

Abstract

:
In the presented work, the influence of parameters such as the total flow rate of phases, the ratio of flow rates, and residence time on mass transfer during the two-phase flow of immiscible liquids in a T-shaped microchannel was investigated using the micro-LIF technique. The study focused on the plug flow regime, where a 70% water–glycerol solution was used as the dispersed phase, and tri-n-butyl phosphate (TBP) was used as the carrier phase. We determined the transition boundary between the dispersed and parallel flow patterns and calculated the plug length and velocities to develop a mass transfer model. Furthermore, we measured the partition coefficient for the set of liquids used in the experiments and analyzed the concentration fields inside the slugs of the continuous phase at various distances downstream of the T-junction. Using the obtained data, we determined the extraction efficiency and overall volumetric mass transfer coefficient and established dependencies demonstrating the effect of the flow-rate ratio, total flow rate, and the residence time on mass transfer rate and extraction efficiency. Finally, we developed a model for the overall volumetric mass transfer coefficient corresponding to the set of liquids used with an R-squared value of 0.966.

1. Introduction

Microchannels are ubiquitous in various fields under their unique properties. Owing to their small size, microchannels exhibit a high surface-to-volume ratio, which allows for achieving high efficiency in heat and mass transfer processes. Therefore, microchannels have found their application as micro-heat exchangers, micromixers, microextractors [1,2,3,4,5], and integrated systems for screening and sorting biological objects [6]. Standard mass transfer equipment, such as columns and settlers, used in these processes have several significant disadvantages, including high reagent consumption, low process intensity, and potential danger to personnel in the case of leaks. In contrast, microchannels are devoid of these disadvantages and can intensify mass transfer. Therefore, studying the influence of various parameters on mass transfer in microchannels is necessary.
The increasing demand for low-carbon, cost-effective energy sources has led to the intensive development of new power plants worldwide [7,8]. As a result, the amount of spent nuclear fuel is constantly growing, and its regeneration is most acute for radiochemical technology. Typically, uranium(VI) and plutonium(IV) are recovered from nitric acid solutions of spent nuclear fuel through the PUREX process, with mixtures of organic solvents with tributylphosphate (TBP) as an extractant [9]. By using microchannels as reservoirs for extraction, the technology can be improved in terms of the safety and efficiency of the extraction process.
The slug regime is of great interest for extraction in a microchannel with a two-phase flow of immiscible liquids. This is because plugs and slugs provide a greater interfacial area-to-volume ratio. In addition, due to vortices in slugs and plugs, mass transfer intensification occurs both inside the phases and between them [10]. Thus, various models have been developed to assess mass transfer for gas–liquid [11,12] and liquid–liquid [13,14,15,16] systems in this flow regime. Based on the results obtained in [17,18,19,20], conclusions can be drawn regarding the dependence of mass transfer efficiency in microchannels on the residence time, temperature, and viscosity of the liquids used, as well as the shape of the microchannel. A review conducted by Ganguli and Pandit [21] summarized the effect of microchannel size on mass transfer. It was concluded that reducing the size of the cross section of the microchannel increases the intensity of mass transfer. Kashid et al. [17] investigated the influence of microchannel geometry on mass transfer efficiency and found that the microchannels with obstacles inside could intensify mass transfer due to additional flow circulation.
The influence of temperature on mass transfer in a liquid–liquid system was described by Zhang et al. [18]. The highest mass transfer coefficients corresponded to the highest temperatures studied, however, circulation within the phases decreased. The authors suggest that this effect was caused by the lower viscosity of the continuous phase, which led to a lower shear stress acting on the dispersed phase. The influence of the viscosity of working liquids on mass transfer was studied in [18,19]. Based on experiments using various sets of liquids, it was found that the viscosity of the dispersed phase had a negligible effect on mass transfer, in contrast to the viscosity of the continuous phase.
The effect of residence time on mass transfer in the slug flow regime was investigated by Angeli et al. [20]. The authors concluded that mass transfer mainly occurs at short residence times. At longer times, it becomes noticeable that the extraction efficiency increases more with a higher total flow rate, indicating the influence of the flow structure inside the slugs and plugs on mass transfer. Thus, it is possible to distinguish two main stages of mass transfer in the two-phase flow of immiscible liquids. At short residence times, there is a high solute concentration gradient between phases, so the diffusion coefficient determines the mass transfer. At long residence times, the layer near the interfacial boundary becomes poorer, and the hydrodynamics of the flow becomes decisive to ensure the inflow of solute to the interfacial boundary.
There are different approaches to assessing mass transfer in microchannels which can be classified as local and integral techniques. In local measurements, the values characterizing the mass transfer are determined based on concentration fields obtained by the microresolution laser-induced fluorescence technique (micro-LIF) or colorimetric techniques. In micro-LIF measurements, the transferred solute itself is used as a fluorescent dye [20,22]. In colorimetric techniques, the dye added to the flow changes color due to the reaction with the transferred solute or pH change occurring when the compound in the flow reacts with the solute [14,19,23]. However, integral measurements of the solute concentration in phases are often performed. For example, gas chromatography was used by Kashid et al. [17]. After phase separation, chromatography of the examined liquid is carried out, and the amount of solute is determined. Another method of integral measurement is UV spectroscopy, performed by Priest et al. [5] but, in this case, it is necessary to separate the phases before analysis. Moreover, integral techniques are not applicable if the residence time in microchannels is much lower than the phase separation time.
Currently, existing studies on mass transfer in the flow of immiscible liquids in microchannels aim to determine the influence of parameters such as microchannel geometry, flow pattern, total flow rate, the flow rate ratio of the continuous and dispersed phases, and residence time. However, mass transfer studies using local measurement techniques are limited to a narrow range of flow rates and phase flow ratios. The present work uses a micro-LIF technique to study the effect of flow parameters and residence time on the efficiency of mass transfer in the slug flow regime of immiscible liquids in a T-shaped microchannel.

2. Materials and Methods

2.1. Mass Transfer Characteristics

Extraction is a process of transferring a solute between two non-miscible media. In our experiment, the dye is extracted from the dispersed phase into the continuous phase, so the equations presented in this article refer to the slugs of the continuous phase. The main parameters studied during mass transfer are the overall volumetric mass transfer coefficient (1) and extraction efficiency (2):
k L a = ln C c i n C c * C c o u t C c * τ ,
% E = C c o u t C c * ,
where C c i n and C c o u t —the solute concentration in the continuous phase at the microchannel inlet and outlet, respectively, C c * —equilibrium concentration, and τ—residence time.
The ratio of equilibrium concentrations of the solute in the phases is called partition coefficient K :
K = C o r g * C a q * = C c * C d *
where subscripts org and aq denote organic and aqueous phases.
The equilibrium concentration for various flow rates is determined from the following considerations. Initially, the solute is presented only in the dispersed phase. Its amount N i n entering the channel is determined by the flow rate of the dispersed phase Q d and the initial concentration of the solute in it C 0 :
N i n = Q d · C 0
At the outlet of the channel, the solute is presented in both phases in concentrations C c and C d . Due to the conservation of the amount of solute at the inlet and outlet of the microchannel, it is possible to write:
Q d · C 0 = Q d · C d + Q c · C c
Assuming that equilibrium is established between the phases in the microchannel with respect to mass transfer, we substitute the equilibrium concentrations and express the equilibrium concentration in the continuous phase:
C c * = C 0 1 K + Q c Q d
Thus, to obtain the extraction efficiency and the overall volumetric mass transfer coefficient, it is necessary to have values of the partition coefficient K , the concentration of the solute in the inlet and outlet of the measurement area of the microchannel C i n and C o u t , and the residence time τ.

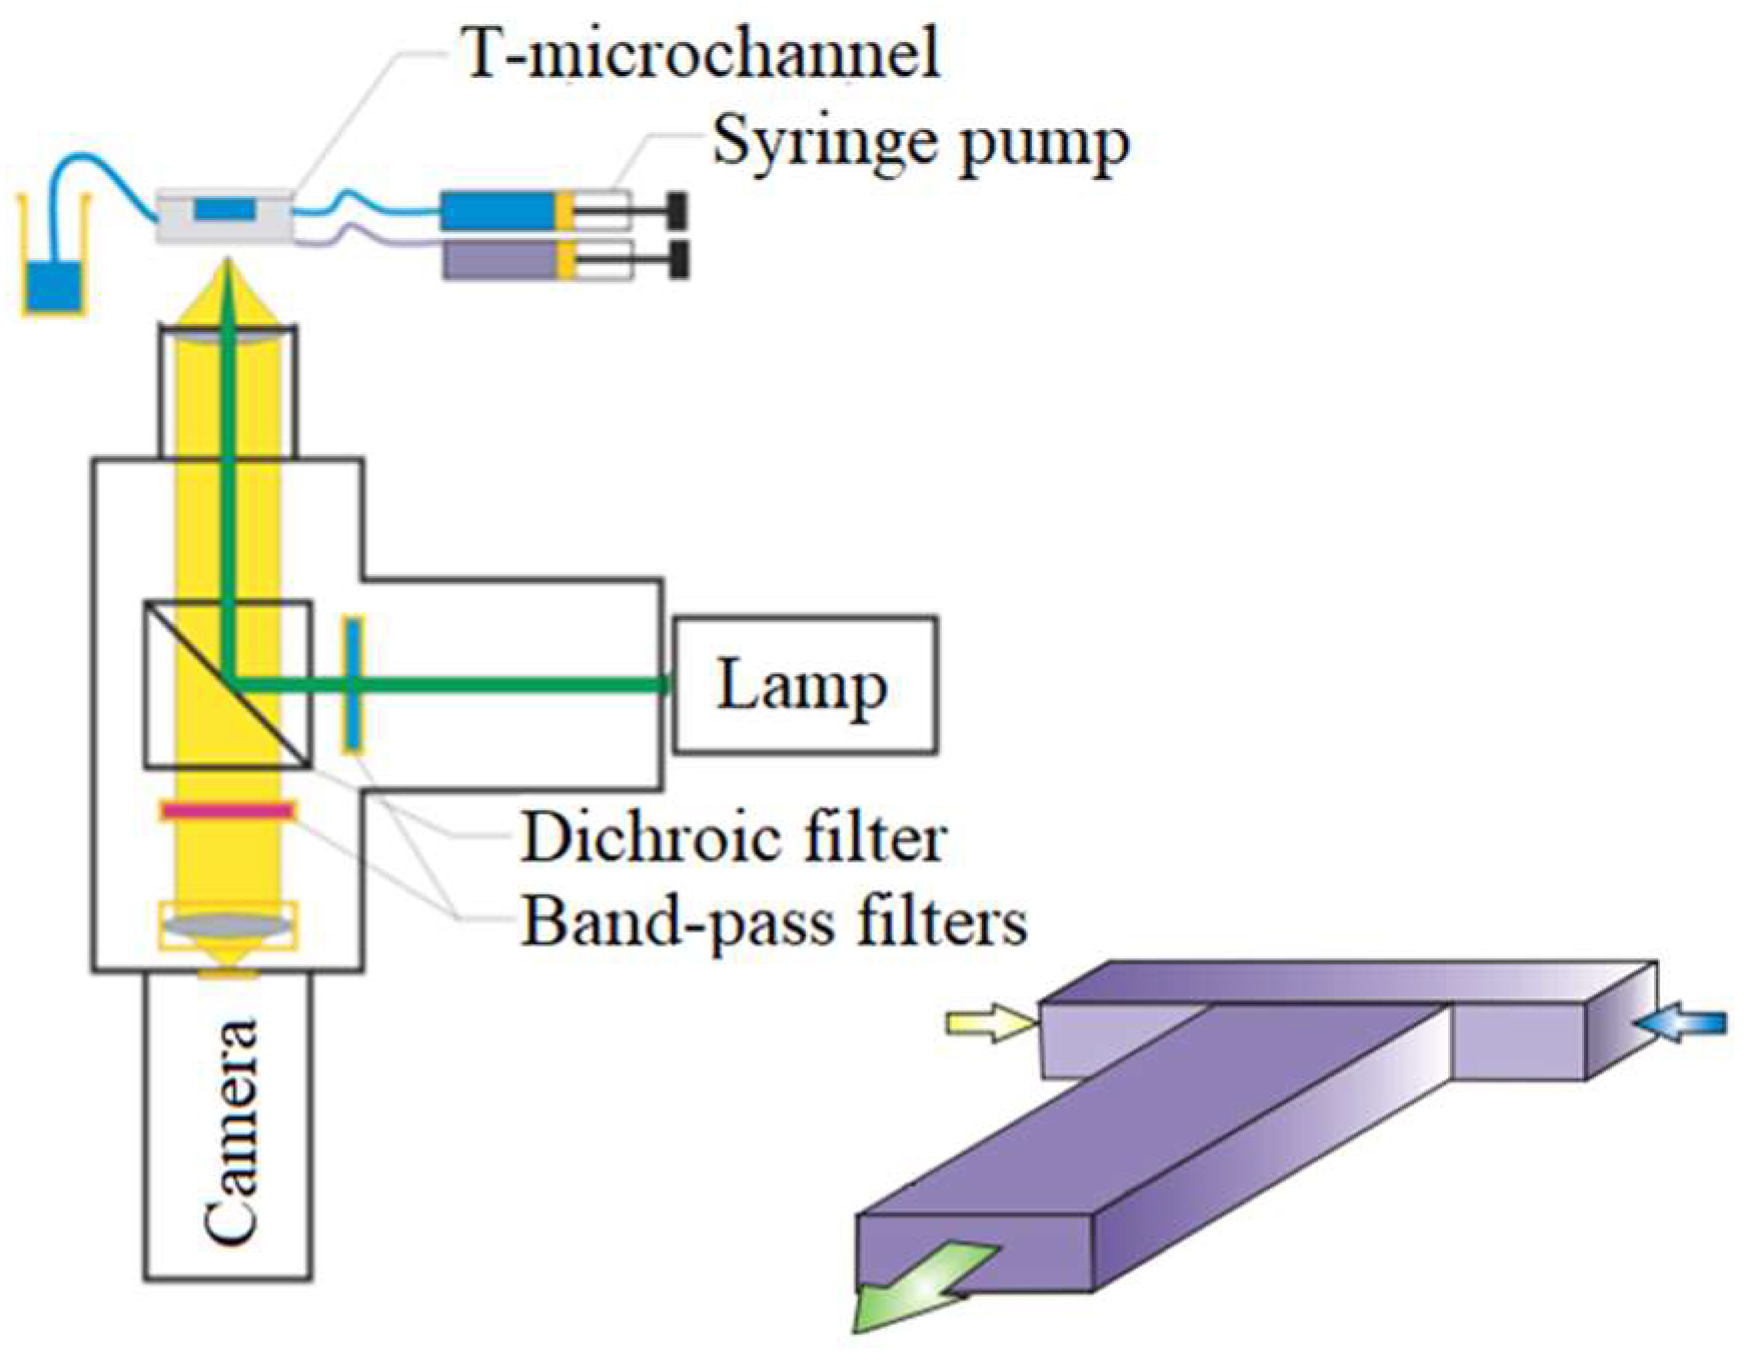
2.2. Experimental Setup and Techniques

The mass transfer was studied in a plug regime of immiscible liquids in a T-shaped microchannel with a square cross-section of 370 μm × 200 μm. The schemes of the experimental setup and the microchannel are presented in Figure 1. The experimental setup consisted of a Carl Zeiss Axio Observer.Z1 microscope with a lens magnification of M = 10× and a numerical aperture of NA = 0.25. A T-shaped microchannel was mounted on the microscope stage. Liquid flow rates were set using a KDS Gemini 88 double syringe pump with an accuracy of 0.3%. The experiments were performed at room temperature T = 23 °C.
The microresolution laser-induced fluorescence technique was applied to measure the solute concentration fields. The method is based on the relation between dye concentration in the fluid and its fluorescence intensity. In the standard LIF method at the macroscale, the flow is illuminated with a laser sheet, hence the concentration field is determined by the emission intensity of the fluorescent dye in the measurement plane. However, creating a thin laser sheet is impossible on the microscale; therefore, the entire flow volume was illuminated by a mercury lamp, obtaining the concentration field averaged over the channel depth. Rhodamine 6G fluorescent dye was used as a solute added initially to the dispersed phase. The solute concentration measurements were performed in the slugs of the continuous phase since the measurements in the plugs of the dispersed phase are unreliable due to the presence of the film of the continuous phase on the bottom and top walls of the microchannel. The light from the mercury lamp passed through a band-pass filter of 546 ± 12 nm, reflected from a dichroic mirror with 560 nm edge wavelength, and illuminated the measurement area of the microchannel. The re-emitted light from the solute passed through the dichroic mirror and a band-pass filter of 575–640 nm. Fluorescence intensity was recorded by an IMPERX CCD camera with a resolution of 4 MPix in a 16-bit format. The spatial resolution was 0.43 µm/pixel. The fluorescence images were processed in ActualFlow software, and the calculated concentration fields were analyzed with the help of a script written in Python.
The concentration field calculation during the experiment requires a calibration curve to determine the dependence of the registered light intensity on the dye concentration in the flow. Calibration was performed pixel by pixel, so the measurement area retained the same position during the curve construction and the experiment. For calibration, the microchannel was filled with the liquid with known fluorescent dye concentrations including zero concentration. One hundred fluorescence intensity images were registered for each concentration and averaged before proceeding to the calibration step. Additionally, the dark noise of the camera was captured and subtracted from the calibration images and the fluorescence images of the slugs.
To reveal the flow patterns and plug properties, high-speed flow visualization was performed. The flow was illuminated by a halogen lamp. A microscope lens with a magnification of M = 5× and a numerical aperture of NA = 0.12 was used. Flow images were recorded by a high-speed PCO camera with 1 MPix resolution and a frame rate of up to 1 kHz. The spatial resolution was 2.17 µm/pixel.
An aqueous solution was used as the dispersed phase, and tri-n-butyl phosphate (TBP) was used as the continuous phase. The properties of liquids are presented in Table 1. Water–glycerol solution properties were calculated by the parametrization in [24] with adjustments described in [25]. The physical properties of TBP are provided by the supplier. The interfacial tension of the liquids was evaluated using Antonov’s rule [26], the calculated value coincides well with the measured value in [27]. The percentage for the water–glycerol solution was chosen so that its refractive index nd = 1.428 was close to the refractive index of the carrier phase nc = 1.425. Therethrough, the distortion of the rays of the re-emitted light is avoided, significantly reducing the measurement error.

3. Results

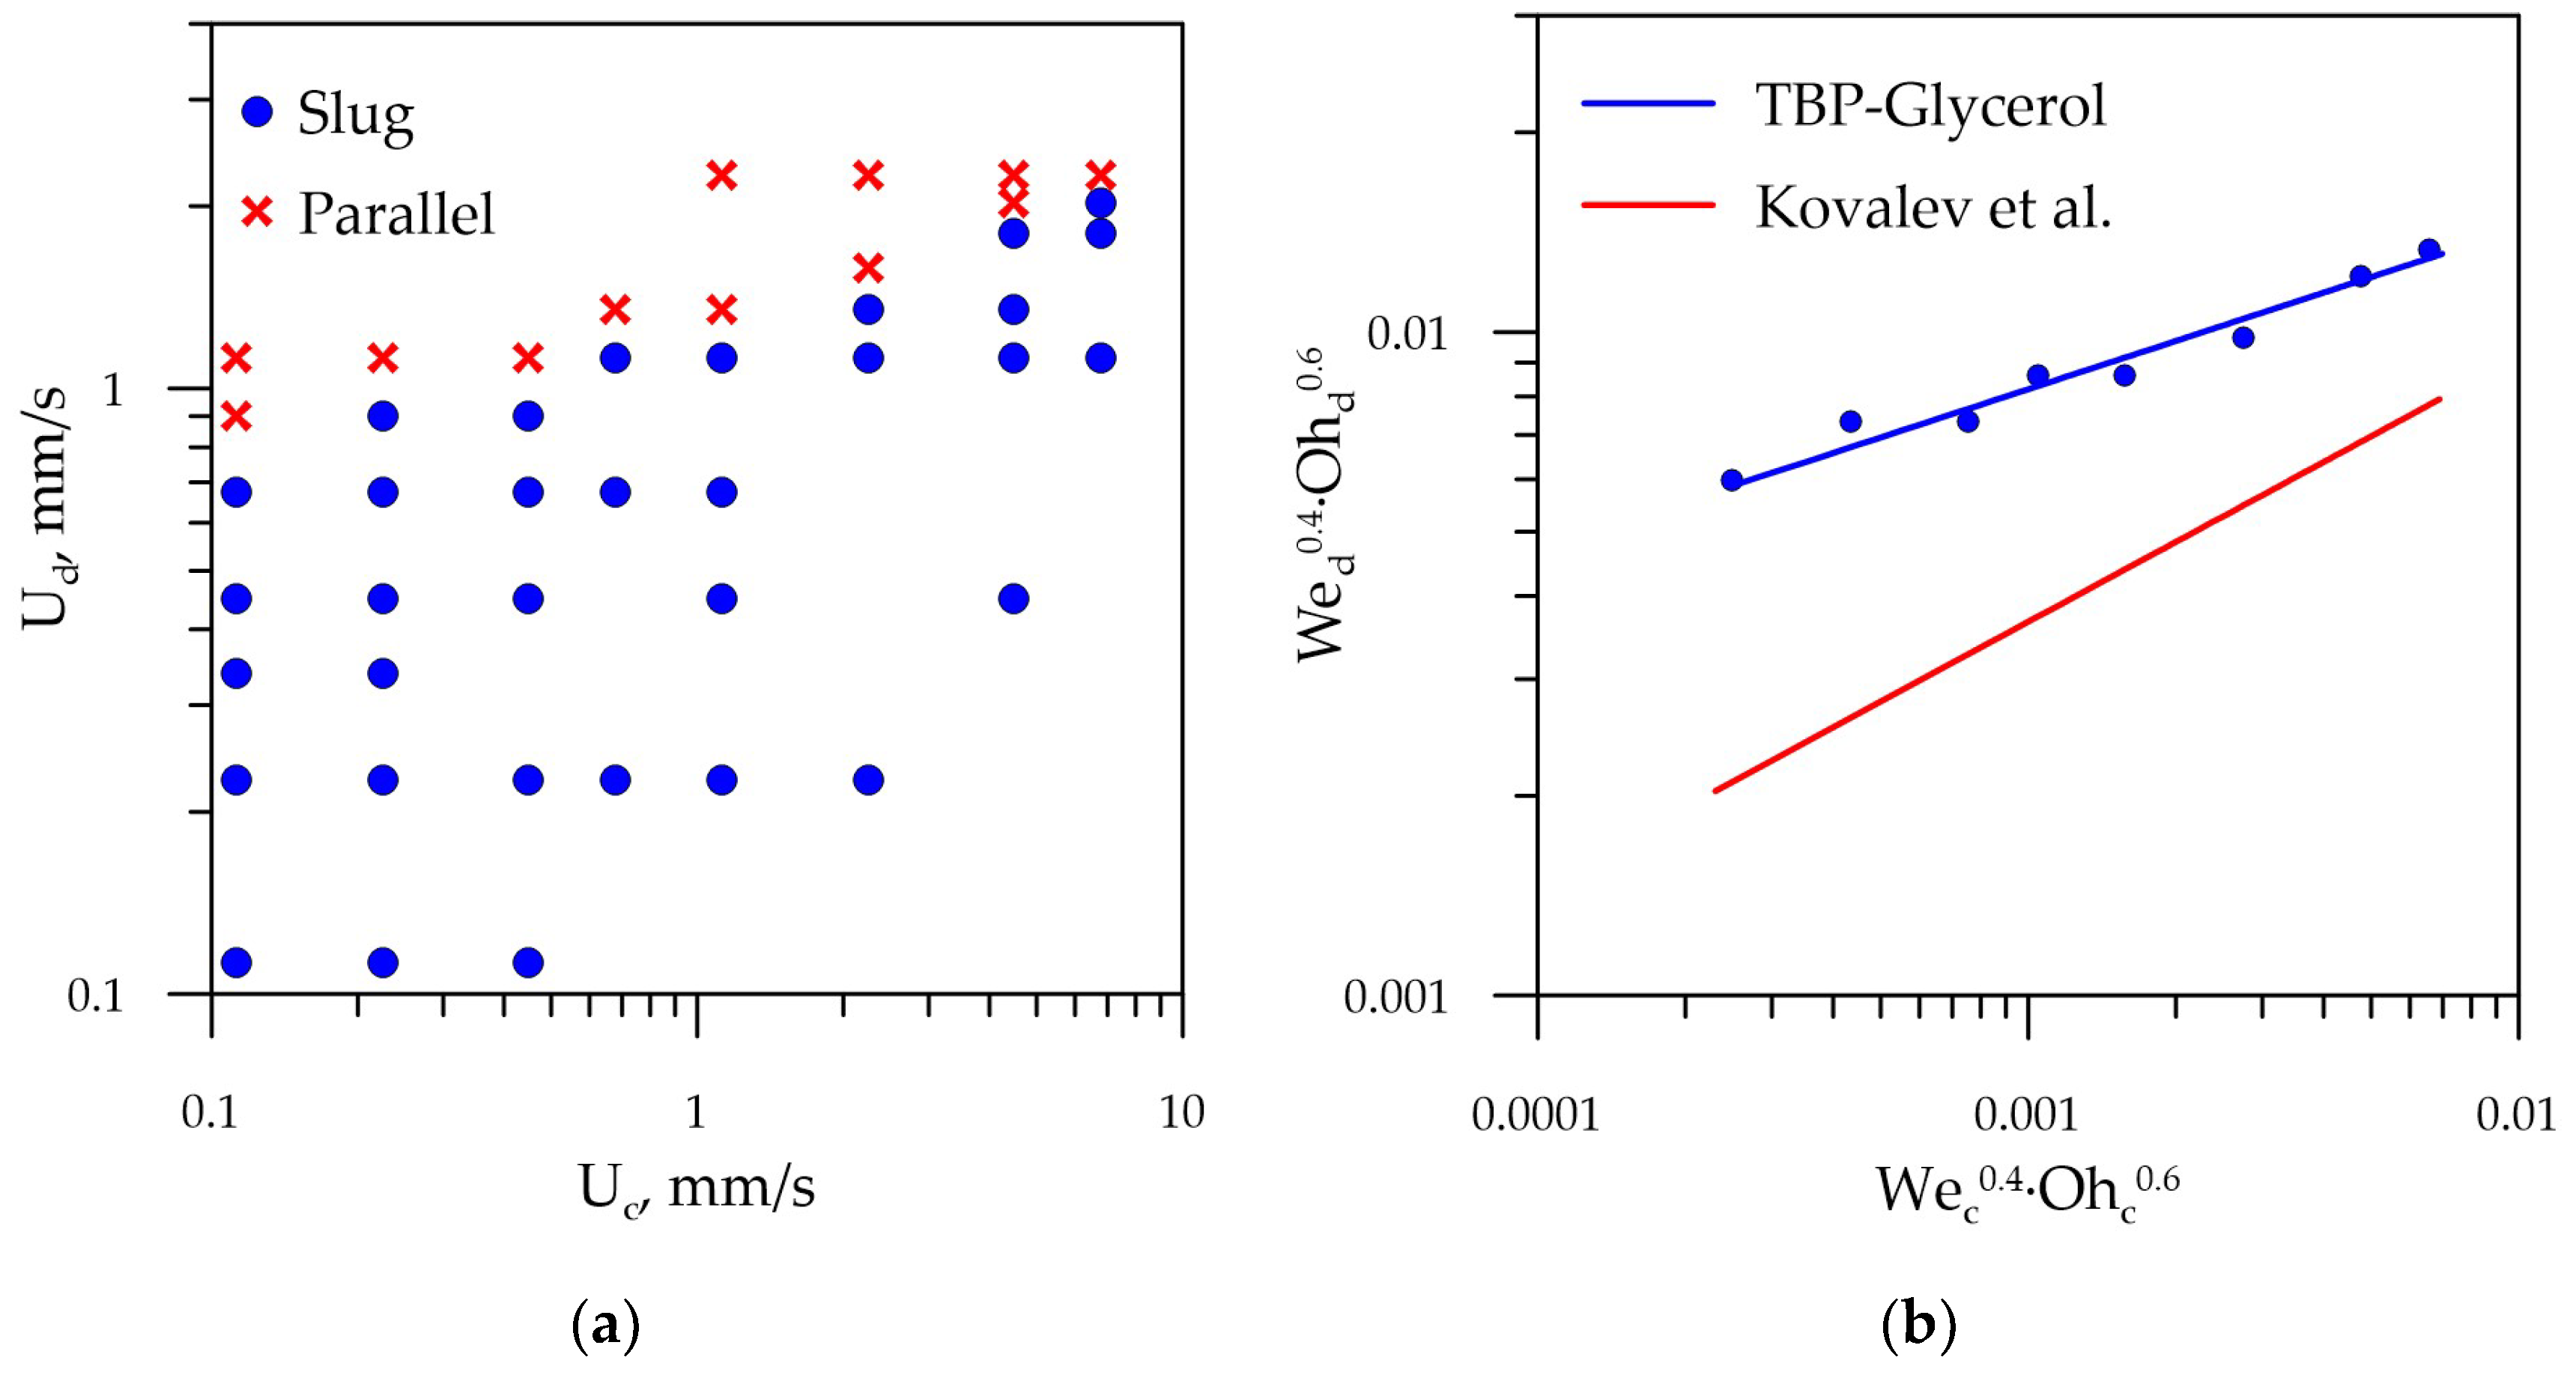
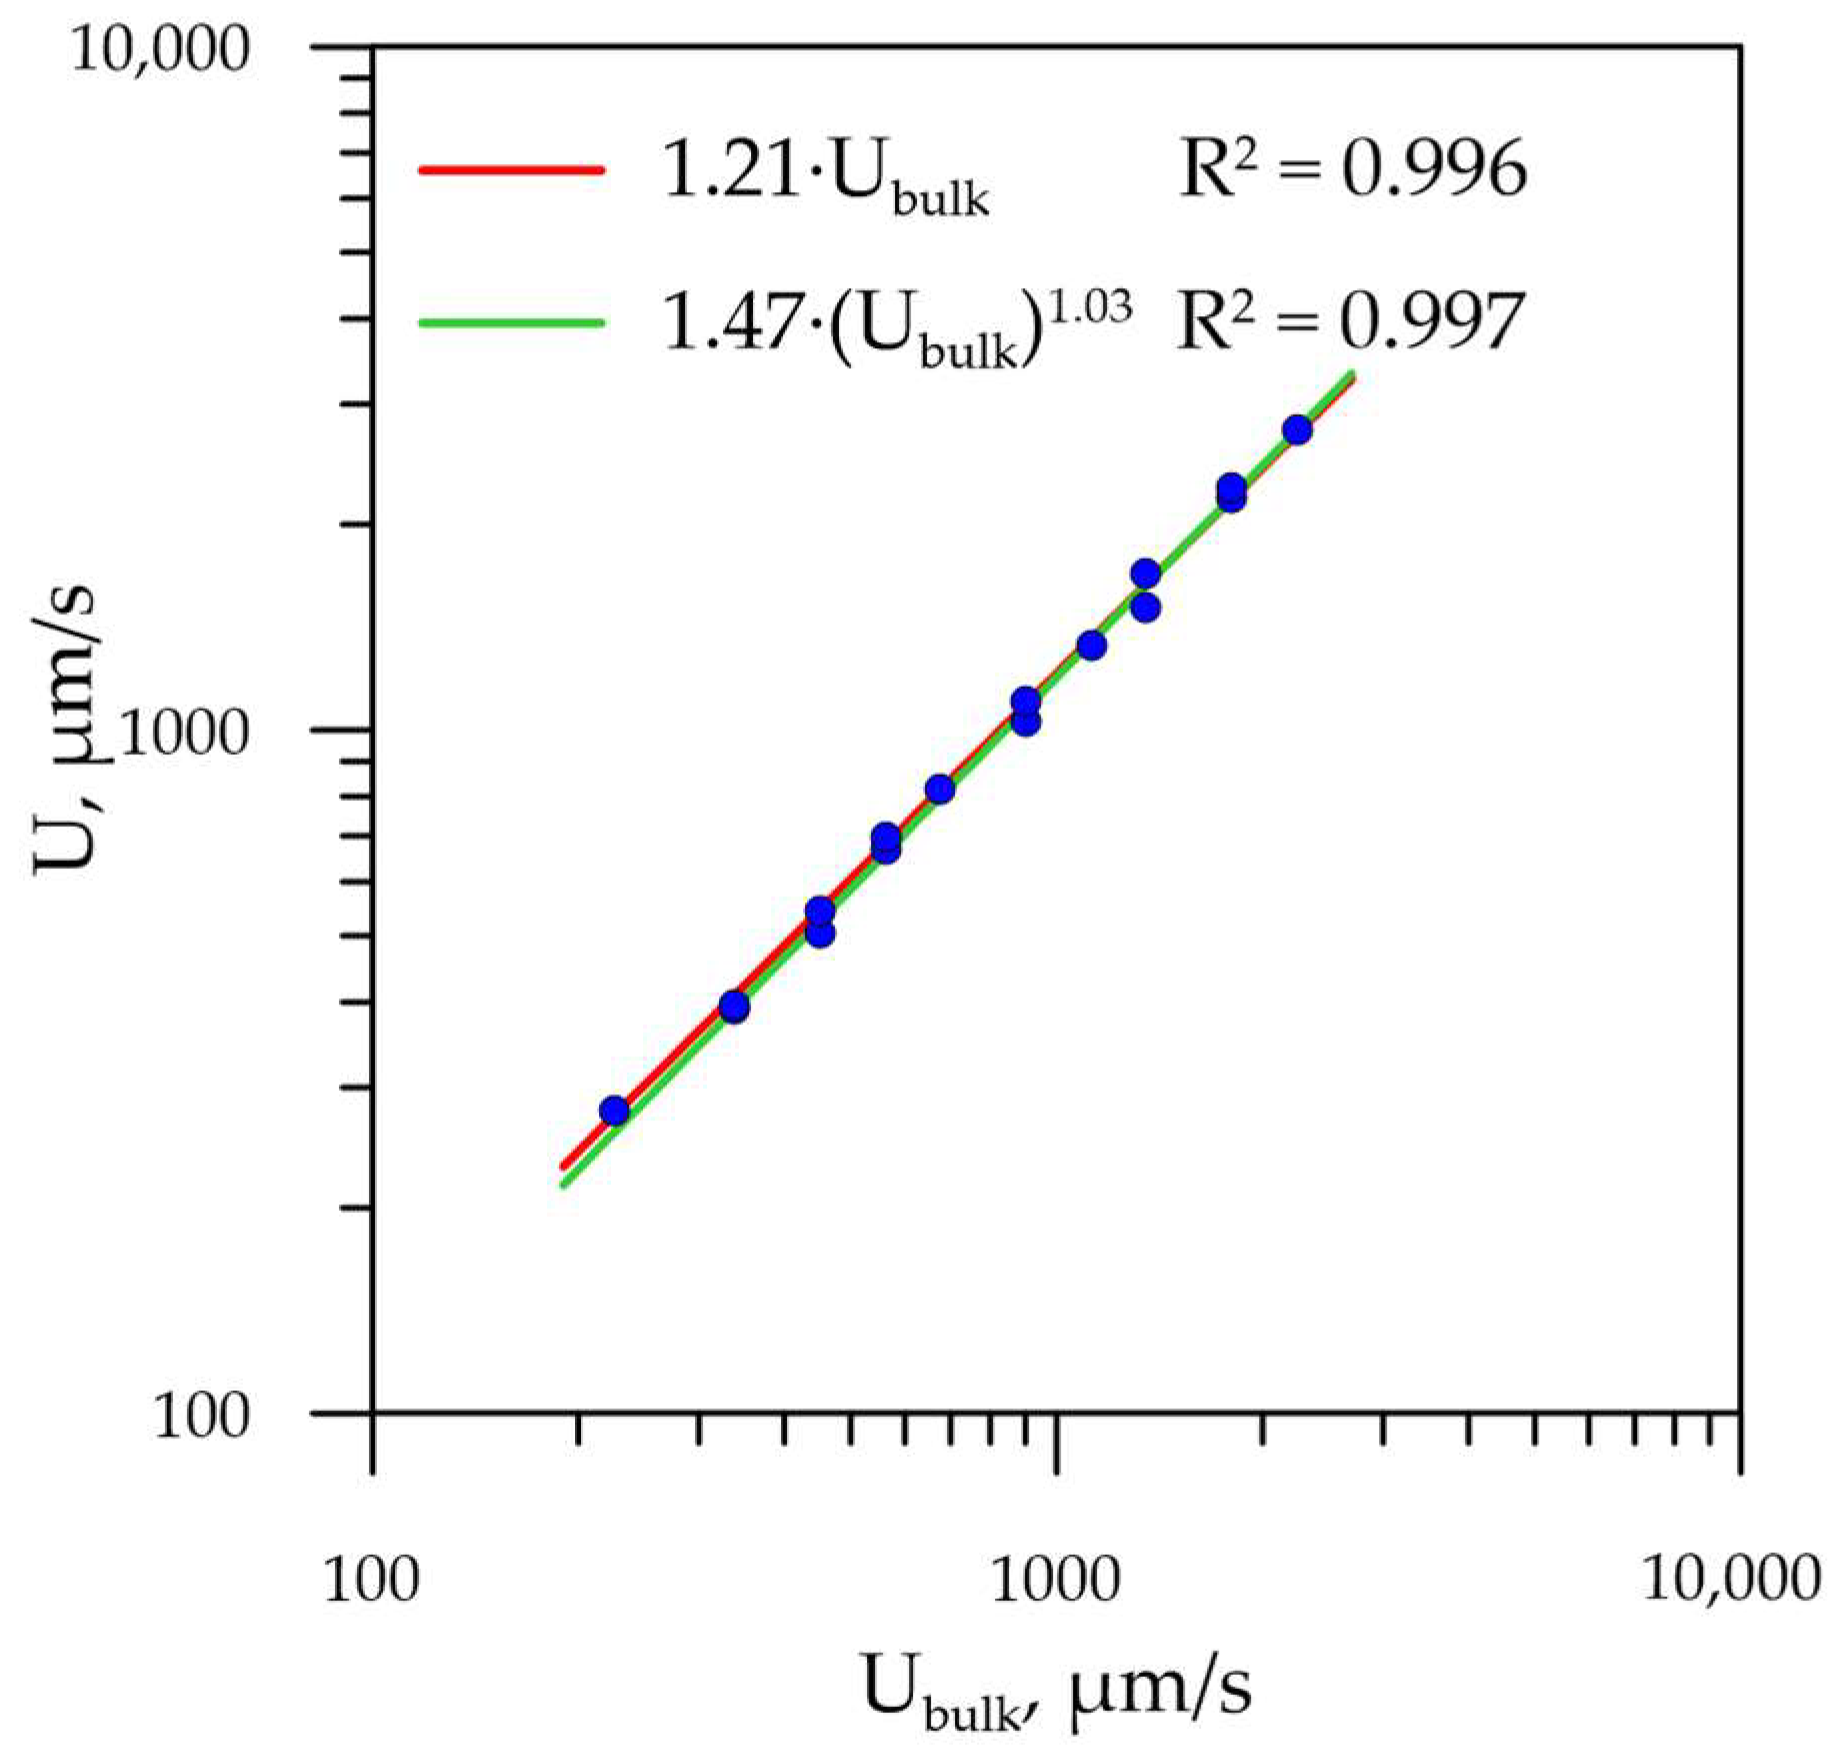
3.1. Slug Flow Properties

To distinguish the boundary between parallel and dispersed flow patterns high-speed visualization was performed in the range of superficial velocities of the continuous phase (100 μm/s ≤ Uc ≤ 6700 μm/s) and dispersed phase (100 μm/s ≤ Ud ≤ 2200 μm/s). Subsequently, a flow pattern map was created, as shown in Figure 2a. Initially, the flow rate of the continuous phase was kept constant, after which the flow rate of the dispersed phase was increased until a parallel flow pattern was established in the channel.
The dimensionless criterion W e α · O h b is suitable for unifying flow pattern maps. Here, We is the Weber number, which expresses the ratio of inertia forces to interfacial tension forces, and Oh is the Ohnesorge number, which characterizes the properties of liquids in a two-phase flow [28]. In works by Kovalev et al. [29,30], the parameters a = 0.4 and b = 0.6 were proposed to draw a universal flow pattern map. Additionally, the equation for the boundary between the segmented and continuous flow patterns was suggested as W e d 0.4 · O h d 0.6 = 0.052 · W e c 0.4 O h c 0.6 0.4 , which describes the transition between flow patterns for liquid–liquid sets with different properties. We compared the boundary between slug and parallel flow in our experiment with the equation by Kovalev et al. in Figure 2b. The boundary is located at the higher values of the W e d 0.4 · O h d 0.6 which coincides with the findings by Kovalev et al. that the proposed equation works well for pairs of liquids with a viscosity ratio of less than unity. In our case, the viscosity ratio is 6.8.
Figure 2. (a) Flow pattern map in terms of superficial velocities of the phases; (b) the boundaries between parallel and dispersed flow patterns [29,30].
Energies 16 04059 g002
Based on the flow images obtained during high-speed visualization, we measured the lengths and velocities of plugs, which are necessary for further developing the mass transfer model. For each flow rate of the continuous and dispersed phase, the averaging was performed among at least ten slugs. The slug lengths were approximated by models from the works of Garstecki et al. [31] (7) and Xu et al. [32] (8). The first approximation corresponds to the ‘squeezing’ mechanism of plug breakup, which depends crucially on the blockage of the channel by a liquid plug. Xu’s model is designed for the so-called ‘dripping’ regime of plug formation dominated by the balance between shear force and interfacial force.
L p l u g = 1 + 1.33 · Q d Q c
L p l u g = 2.34 Q d Q c 0.42 1 C a 0.02
where C a = μ c   U b u l k / σ —the capillary number based on the dynamic viscosity of the continuous phase and bulk velocity. The parity plots of the measured plug lengths and approximated data according to Equations (7) and (8) are presented in Figure 3a,b. The R-squared was 0.76 and 0.86 for each of the models, respectively. As we obtained good results for plug approximation by the Xu model, we can conclude that the capillary number of the continuous phase influences the plug length, and the formation of plugs is in the ‘dripping’ regime.
The plug velocity was approximated using linear and power functions of bulk velocity. We obtained nearly equal R-squared for each approximation: 0.996 for the linear approximation and 0.997 for a power function. The function plots are presented in Figure 4. Further, we used a linear approximation of the plug length.

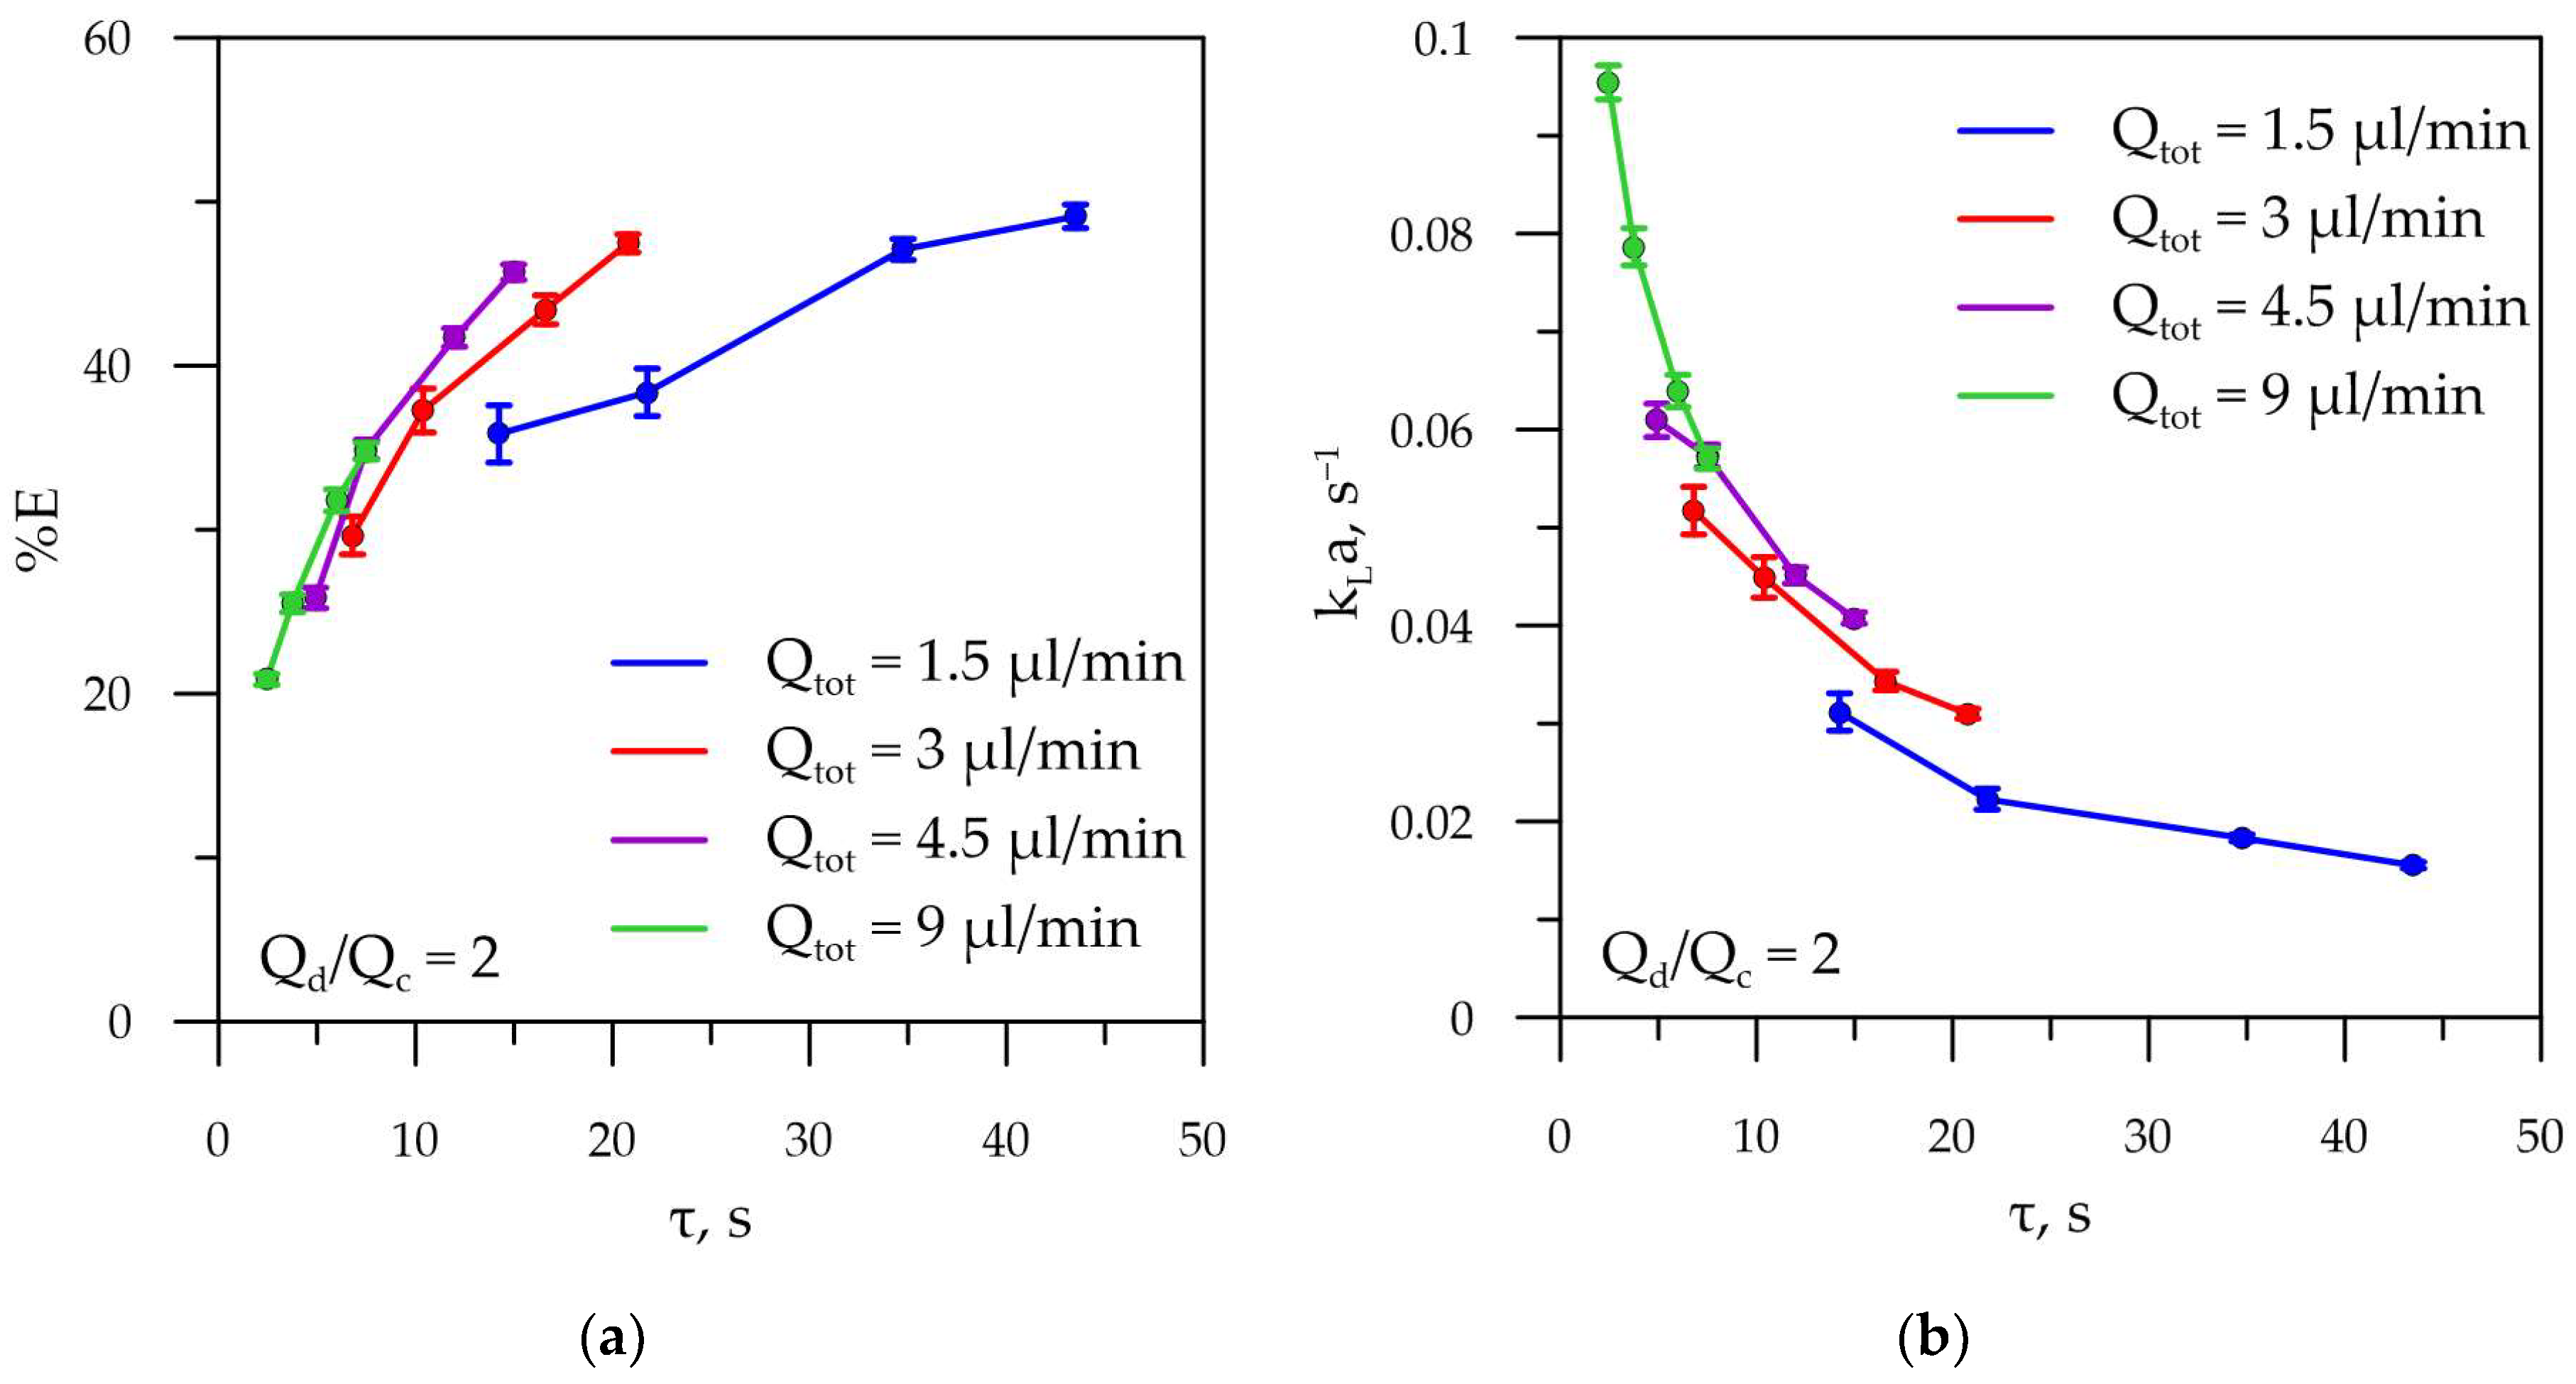
3.2. Mass-Transfer Assessment

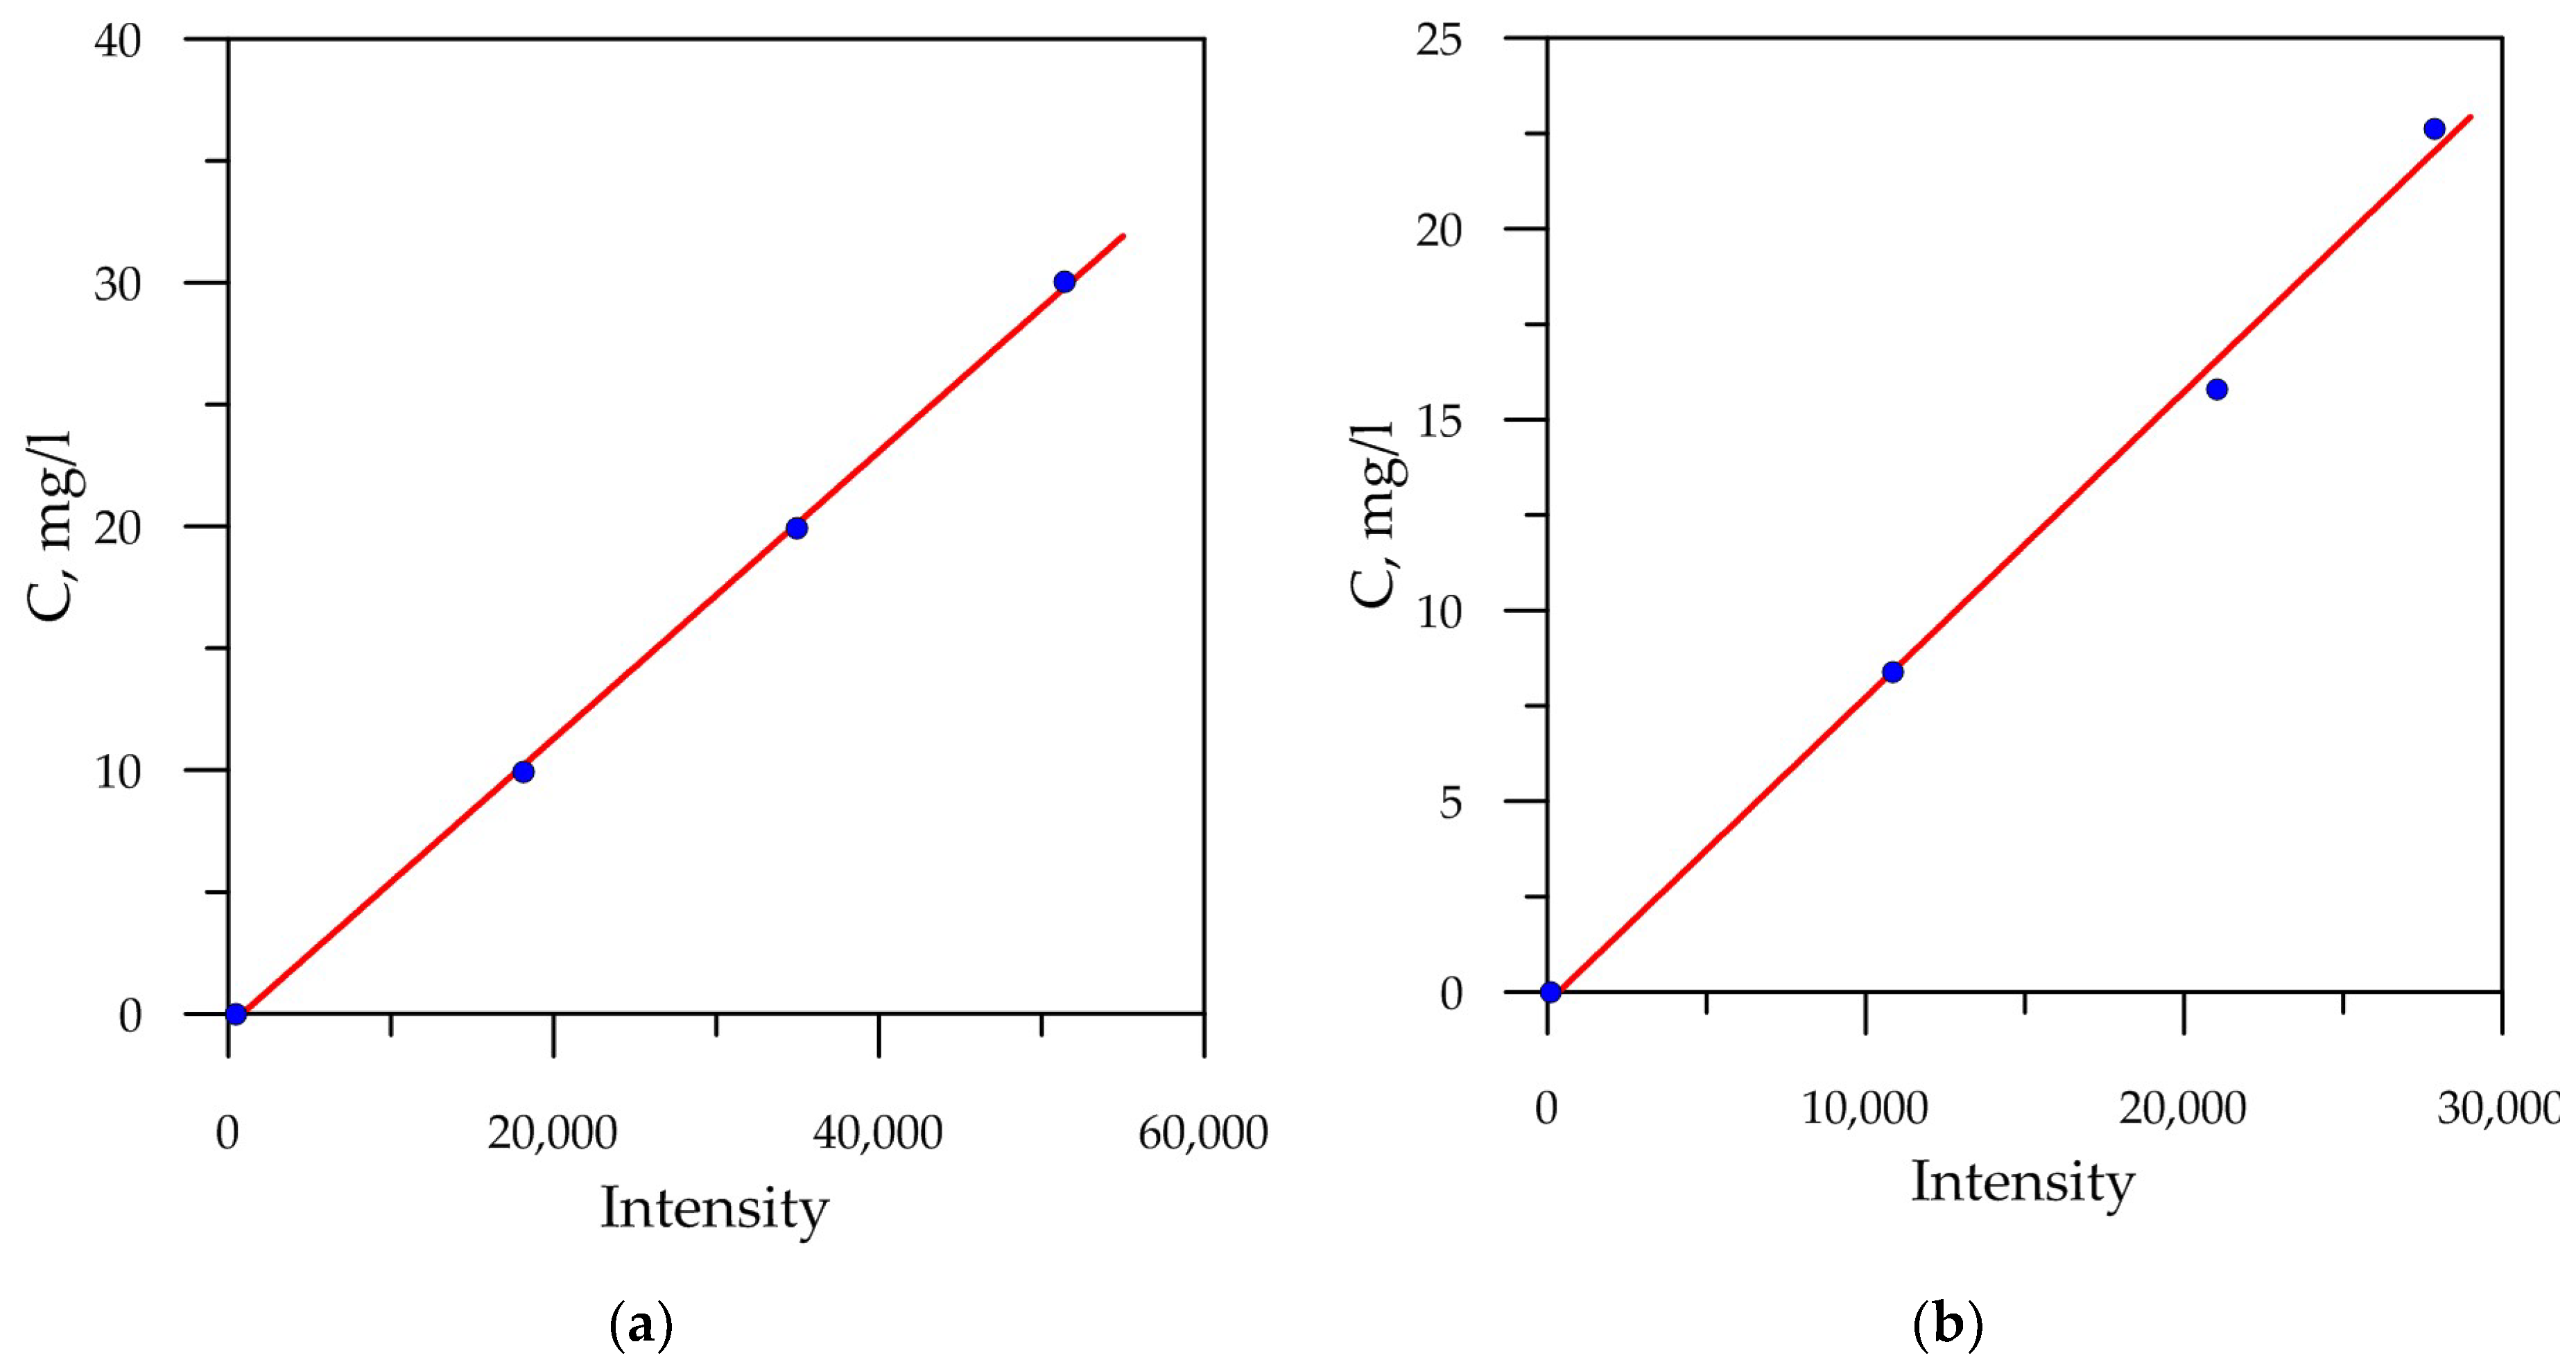
3.2.1. Partition Coefficient Measurement

Three samples were prepared to determine the partition coefficient K . These samples were mixtures of equal volumes of TBP and water–glycerol solution, 30 mL each. The initial concentrations of the fluorescent dye in the dispersed phase were 10 mg/L, 20 mg/L, and 30 mg/L, corresponding to the linear part of the dependence of the emitted light intensity on the dye concentration according to the work of Zehentbauer et al. [33]. Each sample was mixed on a magnetic stirrer for 72 h and allowed to settle until the interfacial layer became completely uniform, indicating complete coalescence of the droplets. The liquids were then manually separated.
The residual concentration of the solute in the aqueous phase was determined using the micro-LIF technique in a microchannel. To construct the calibration curve, the microchannel was filled with prepared samples of the aqueous phase with the known fluorescent-dye concentrations: 0 mg/L, 10 mg/L, 20 mg/L, and 30 mg/L. Based on the obtained intensity values corresponding to specific concentrations, a calibration curve for the aqueous phase was constructed (Figure 5a). The residual concentrations in the separated samples of the aqueous phase were determined using the calibration curve. Since equal volumes of water–glycerol solution and TBP were used, it was possible to calculate the volume concentration of the solute in the TBP samples:
C o r g * = C 0   a q C a q *
The partition coefficient was calculated according to Equation (3). Its average value was K = 3.9   ± 0.7 .

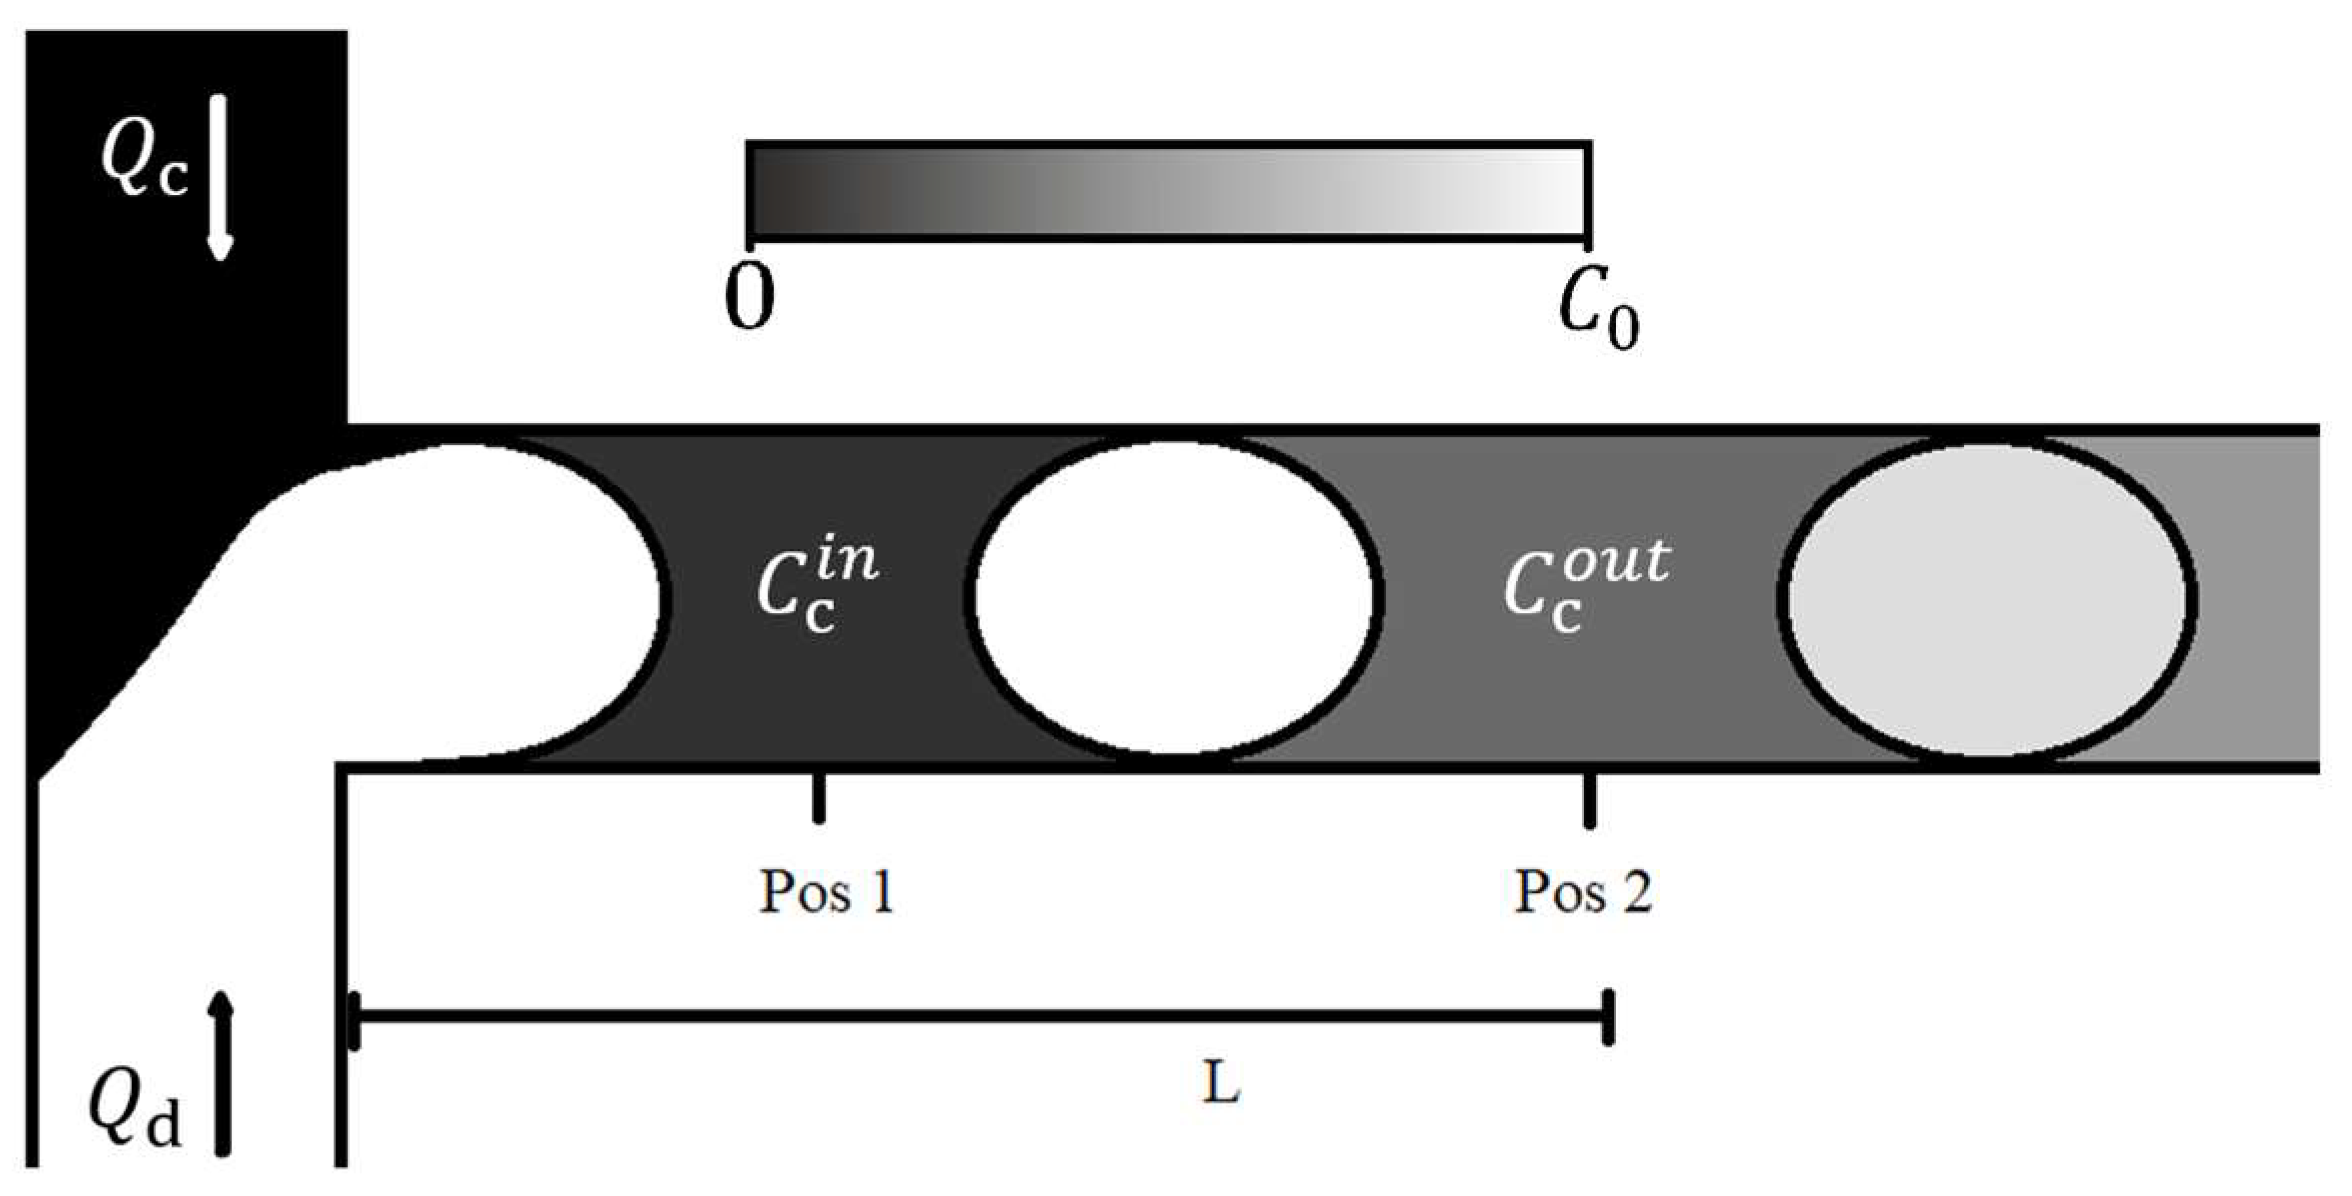
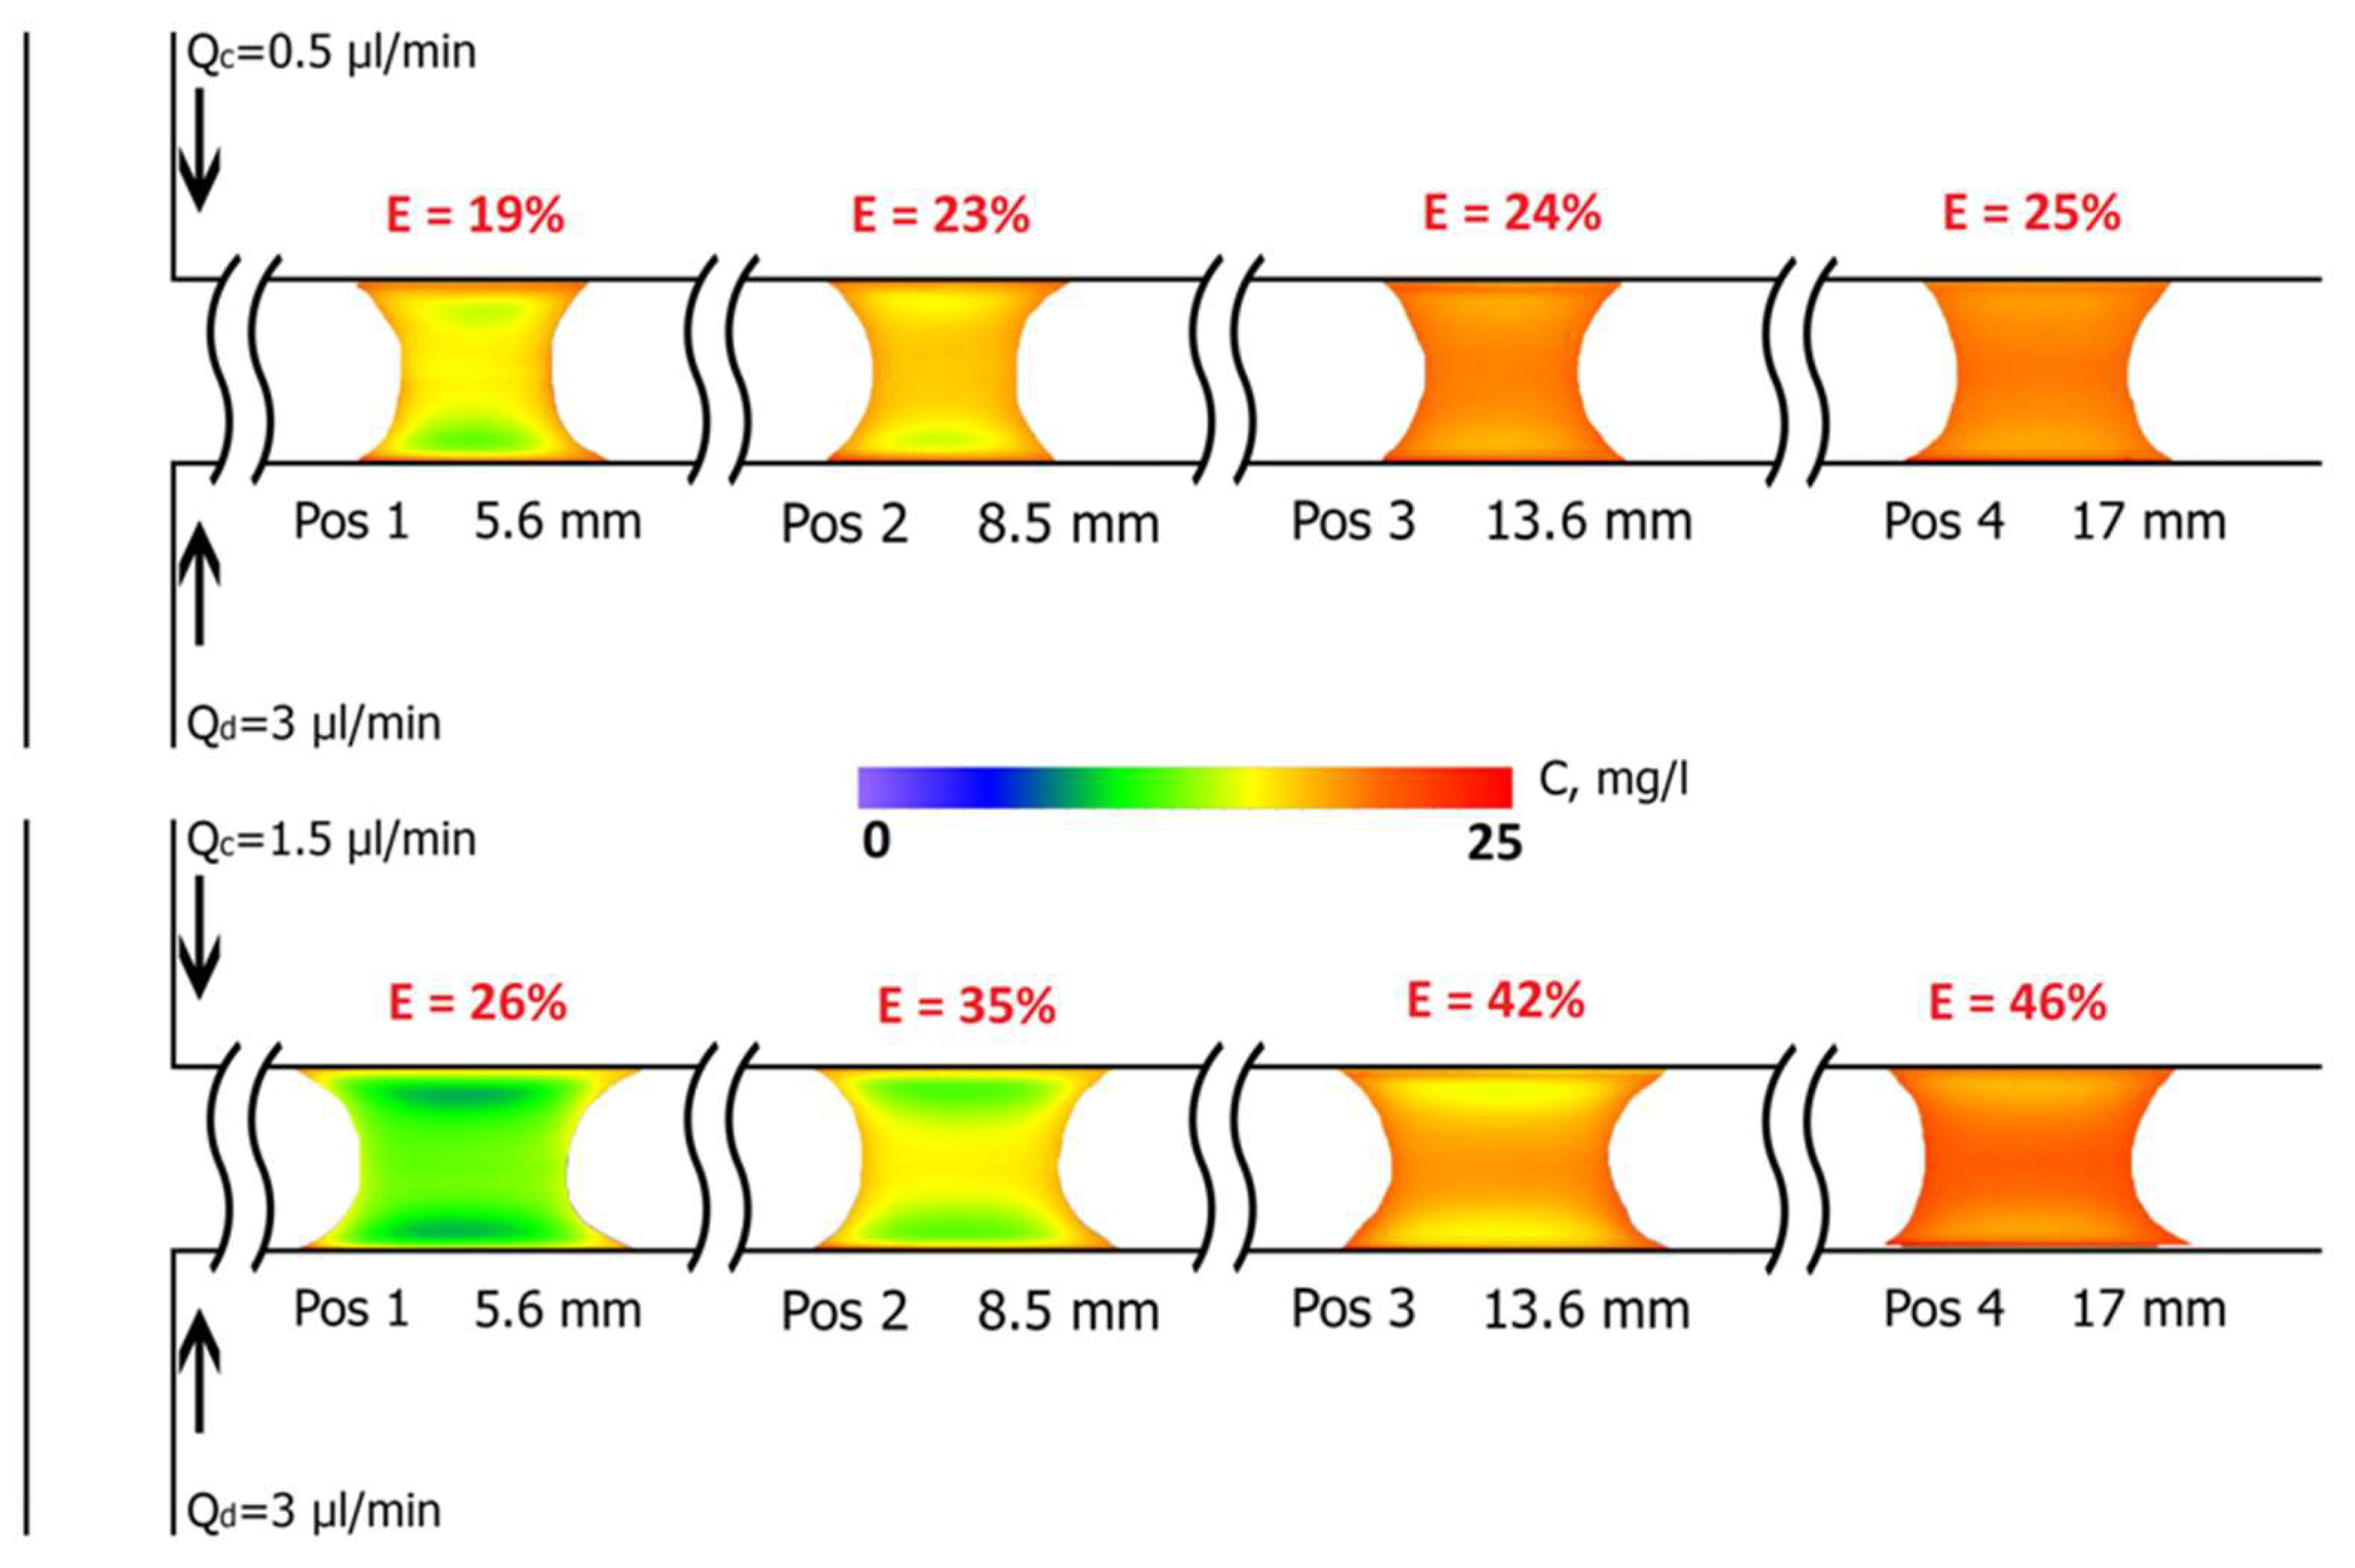
3.2.2. Solute Concentration Measurements in Slugs of the Continuous Phase
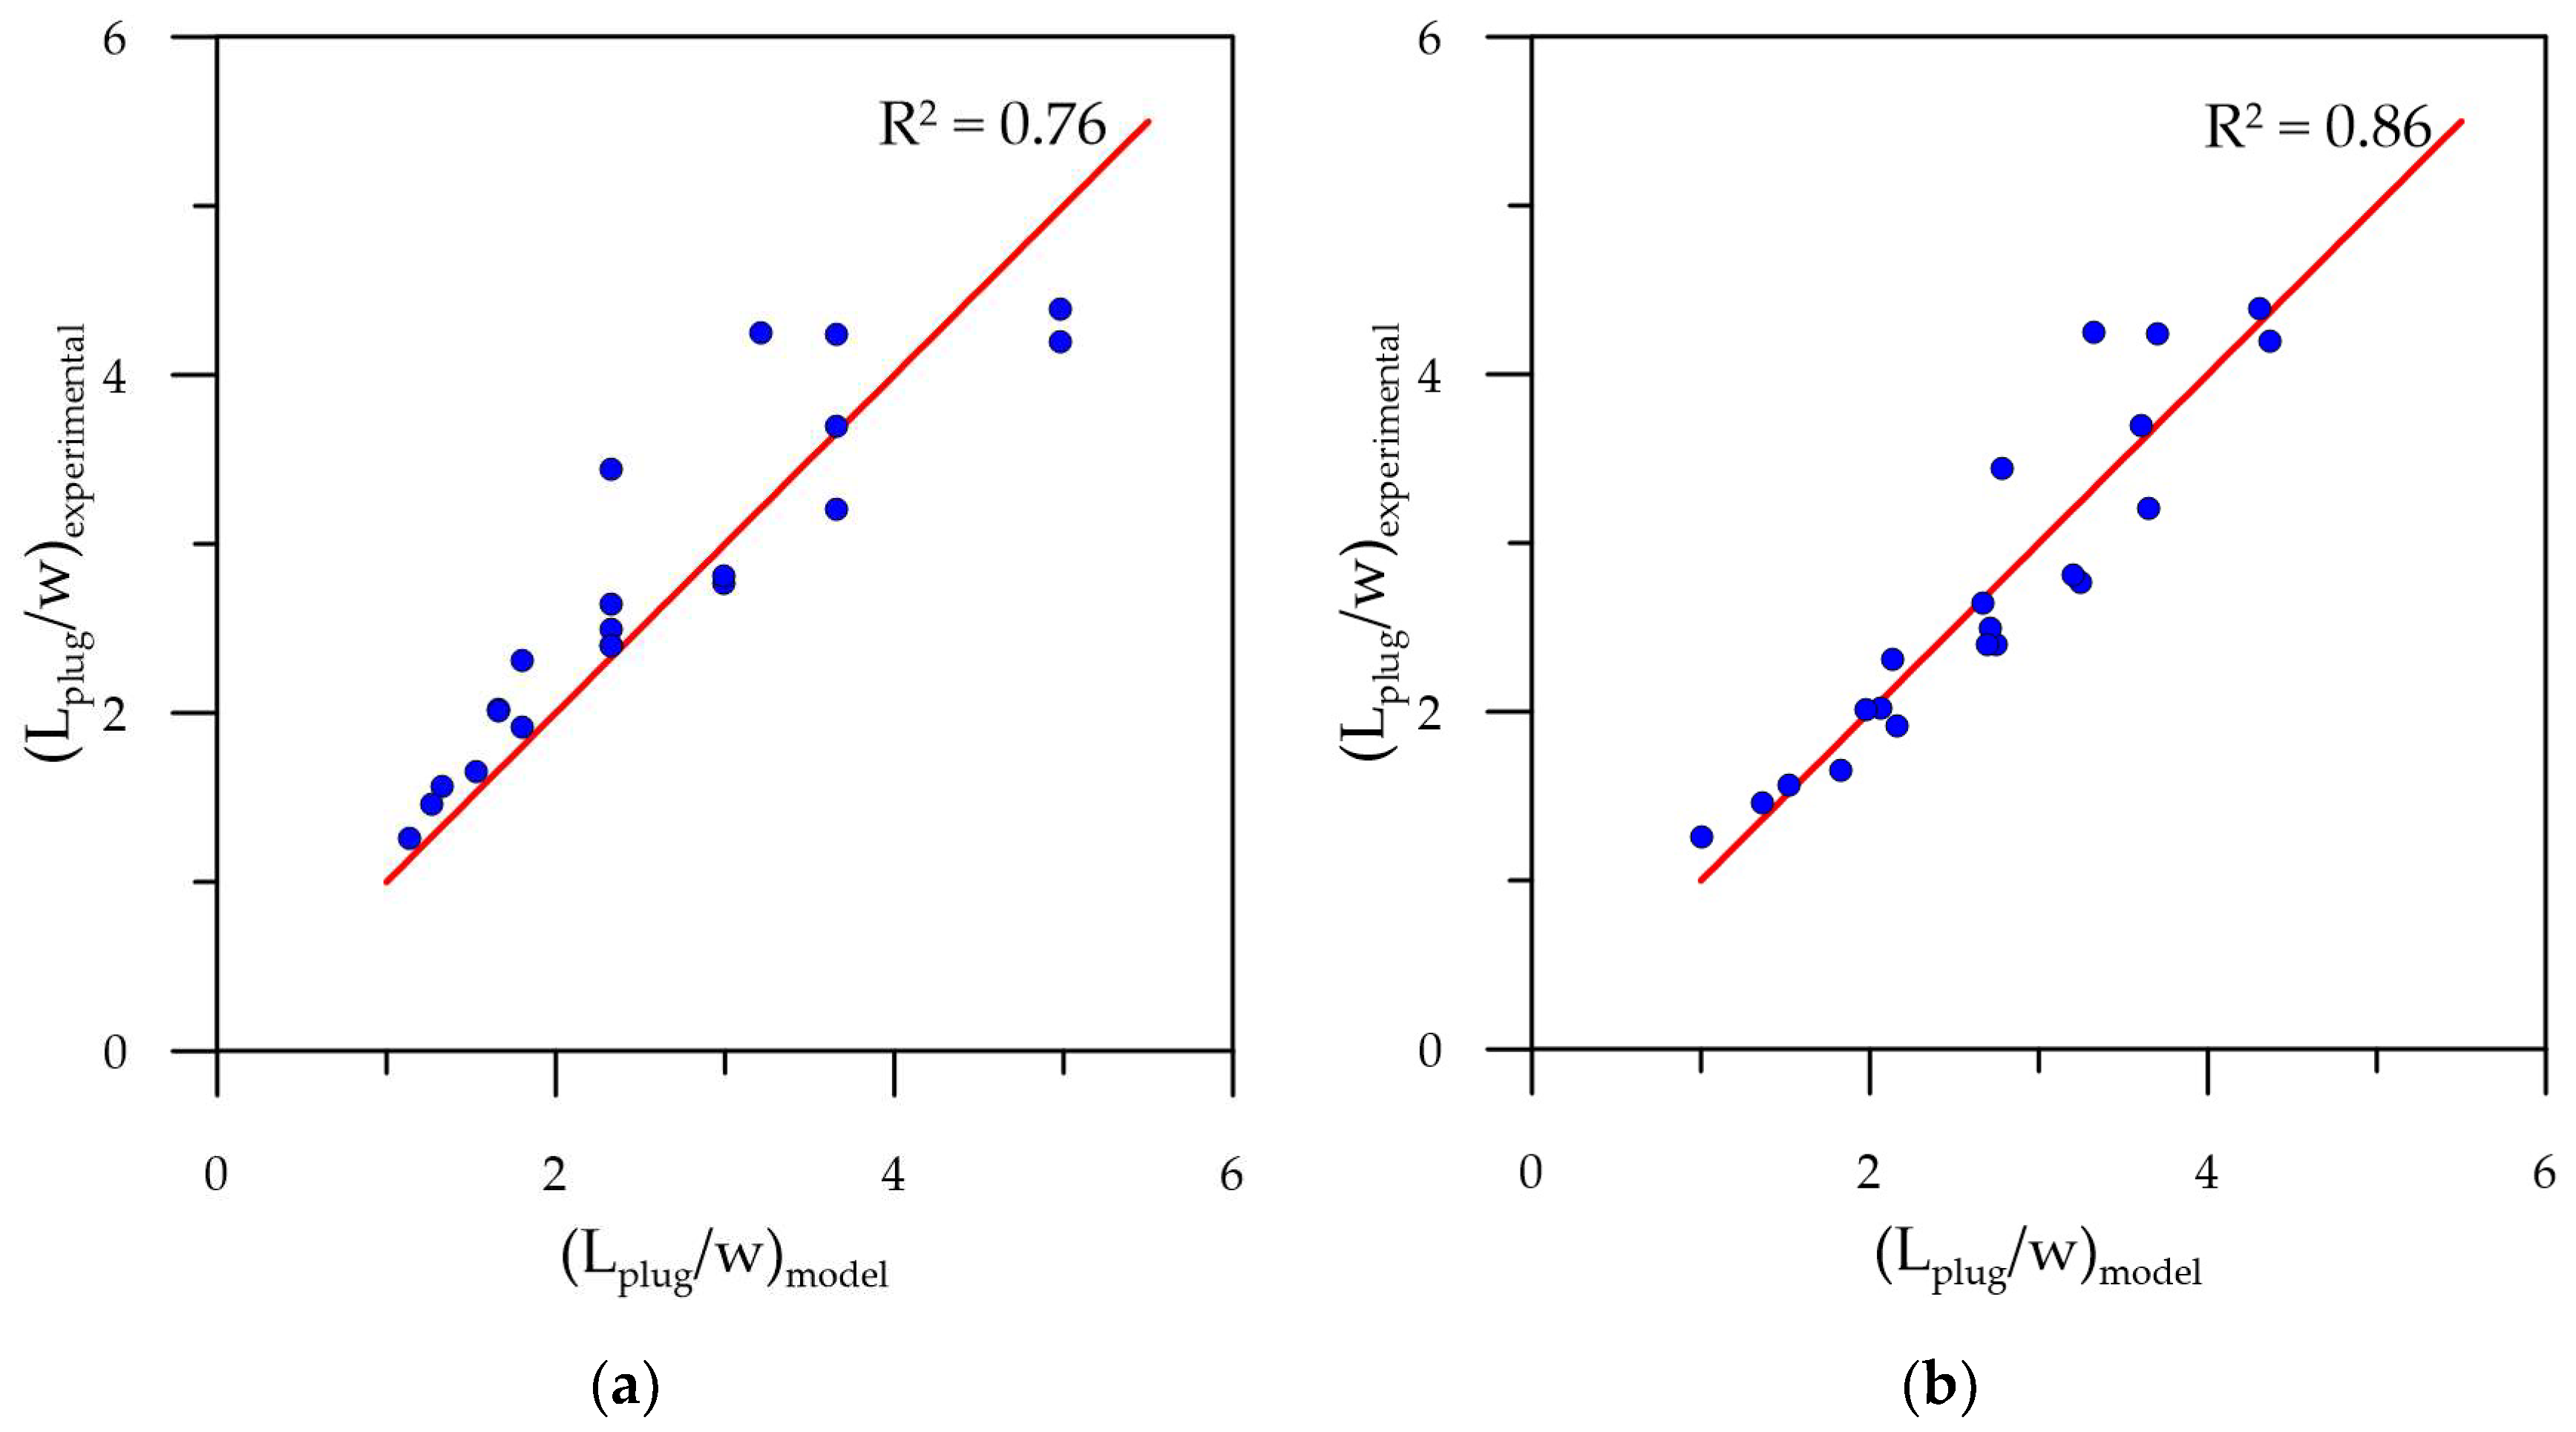
To measure solute concentration in slugs of the continuous phase in two-phase flow, the calibration curve of the dependence of Rhodamine 6G fluorescence intensity on its concentrations was derived using TBP samples obtained after phase separation in the measurements of the partition coefficient. The calibration curve is presented in Figure 5b. The maximum deviation of the points from the approximating linear function was 4.6%, and the random measurement error did not exceed 1.2%.
The measurement scheme of solute concentration in TBP in two-phase flow is presented in Figure 6. The continuous phase without a fluorescent dye and the dispersed phase with a Rhodamine 6G concentration of 30 mg/L were fed to the microchannel inlets, which formed slugs and plugs in the mixing zone. The flow rates of the continuous and dispersed phases were chosen according to the plug regime in the flow pattern map obtained during high-speed visualization and the condition that slugs of the continuous phase fit entirely into the CCD camera frame. Thus, the flow rate ranges of the dispersed and continuous phases were 0.5 µL/min ≤ Qd ≤ 6 µL/min and 0.5 µL/min ≤ Qc ≤ 3 µL/min, and the flow rate ratio Qd/Qc varied in the range of 1–6.
A series of fluorescence images were recorded at points located at distances of 5.6 mm, 8.5 mm, 13.6 mm, and 17 mm, which corresponded to 20, 32, 52, and 65 hydraulic diameters downstream of the T-junction. At least 15 slugs of the continuous phase were recorded for each studied regime and position. Then, concentration fields in the slugs were calculated according to the calibration curve, and averaging was performed over 15 concentration fields for the studied flow rates in each position. Afterward, with the help of a script written in Python, the average values of the concentrations in the slugs and their standard deviations were calculated. Since the measured concentration field in the slug is depth-averaged, we numerically averaged concentration fields point by point, obtaining the average volumetric concentration. An example of the evolution of concentration fields of solute in slugs of the continuous phase for the fixed dispersed phase flow rate Qd = 3 µL/min and different flow rates of the continuous phase downstream from the flow is shown in Figure 7.

4. Discussion

As a result of the measurement of the concentration fields in the slugs of the continuous phase, the dependences of the extraction efficiency and the overall volumetric mass transfer coefficient on the residence time and the total flow rate of the phases were obtained. The calculation was made using Equations (1) and (2) and the equilibrium solute concentration in the continuous phase for the studied flow rates was determined by Equation (6). The residence time τ was assessed as the distance from the T-junction to the measurement area L divided by plug velocity U p l u g .
Figure 8 shows the dependence of the extraction efficiency and the mass transfer coefficient at a fixed flow rate ratio Qd/Qc = 2. The error bars correspond to the standard deviation of the values calculated based on 15 slugs. The extraction efficiency and the overall volumetric mass transfer coefficient were found to increase with an increase in the total flow rate. We assume that is due to the increasing intensity of vortices inside the slugs and plugs, providing a higher concentration gradient at the interfacial area between phases.
Figure 9 shows the dependence of the extraction efficiency at 17 mm downstream of the T-junction and the overall volumetric mass transfer coefficient at the distance of 5.6 mm from the T-junction on the total flow rate of the phases for various flow rate ratios. Increasing the flow rate ratio Qd/Qc at a fixed total flow rate Qtot decreases the extraction efficiency and mass transfer coefficient, possibly due to the fact that increasing Qd/Qc leads to an increase in the equilibrium concentration but the average concentration in the slug remains approximately the same. For the range of studied flow rates, the highest mass transfer efficiency was achieved at a minimal studied flow rate ratio Qd/Qc close to unity.
We correlated the obtained values of the total volume mass transfer coefficient with the model from Kashid et al. [13], which was developed to assess the mass transfer intensity between microchannel input and output. The authors used a fixed flow rate ratio and considered the part containing the length of the plug to be a constant. In our case, the flow rate ratio is changing, so we cannot neglect this part of the model:
k L a · τ = a ·   C a   b ·   R e c · D h L d · L p l u g D h e
where C a = μ M U p l u g σ —capillary number and R e = ρ M U p l u g D h μ M —Reynolds number, which includes dynamic viscosity ( μ M ) and density ( ρ M ) of the mixture, D h —hydraulic diameter of the microchannel, L —length between the beginning of the channel and a point downstream of the T-junction, and L p l u g —plug length. Mixture properties were calculated by the following equations:
μ M = ε c μ c + ε d μ d 1
ρ M = ε c ρ c + ε d ρ d 1 ,
where ε c and ε d —phase fraction of the continuous and dispersed phases.
Constants a e are adjustable parameters determined by fitting experimental data to the correlation (10) using the Levenberg–Marquardt algorithm. As a result, the following parameter values were obtained:
k L a · τ = 0.042 ·   C a 0.92 ·   R e 0.64 · D h L 0.59 · L p l u g D h 0.04
The experimental data versus the model prediction are plotted in Figure 10. The R-squared value was 0.966. The median deviation between the experimental and predicted data was 8%. The analysis of the obtained parameters shows the dependence on the residence time and the total flow rate to be aligned with the experimentally obtained results and previously conducted studies [20,34]. The obtained coefficients correspond to the dependencies on the flow-rate ratio and total flow rate in Bai et al. [11]. At the same time, compared to the values of the parameters in Kashid et al. [7], the discrepancy in the dependence from the Reynolds number is observed.

5. Conclusions

Experiments were conducted to investigate mass transfer during the flow of immiscible liquids in a T-type microchannel using the micro-LIF method. The concentration fields of the fluorescent dye in the slugs of the continuous phase were measured. To calculate the extraction efficiency and the overall volumetric mass transfer coefficient, the partition coefficient for the studied set of liquids was experimentally determined.
The results of the experiments led to conclusions regarding the effect of the total flow rate and the phase flow ratio on the efficiency of mass transfer and overall volumetric mass transfer coefficient. It was found that an increase in the flow rate ratio leads to a decrease in mass transfer efficiency. Meanwhile, an increase in the total flow rate results in an increase in both the extraction efficiency and mass transfer coefficient. A model for the overall volumetric mass transfer coefficient was also developed with an R2 value of 0.966. This model supports the conclusions about the impact of the total flow rate and flow-rate ratio on the intensity of mass transfer between phases.

Author Contributions

Conceptualization, A.Y.; methodology, A.Y. and A.K.; investigation, S.V.; resources, A.Y.; data curation, S.V.; writing—original draft preparation, S.V. and A.Y.; writing—review and editing, A.B. and A.K.; supervision, A.B.; project administration, A.Y.; funding acquisition, A.Y. and A.B. All authors have read and agreed to the published version of the manuscript.

Funding

The slug flow properties study (Section 3.1) was supported by a grant from the Russian Science Foundation (project No 21-79-10307). Mass transfer measurements (Section 3.2) have been financially supported by the Ministry of Science and Higher Education of the Russian Federation, Project No 075-15-2022-1043.

Data Availability Statement

The data that support the findings of this study are available from the corresponding author upon reasonable request.

Conflicts of Interest

The authors declare no conflict of interest.

References

  1. Abdollahi, A.; Sharma, R.N.; Vatani, A. Fluid flow and heat transfer of liquid-liquid two phase flow in microchannels: A review. Int. Commun. Heat Mass Transf. 2017, 84, 66–74. [Google Scholar] [CrossRef]
  2. Kandlikar, S.G.; Garimella, S.; Li, D.; Colin, S.; King, M.R. Heat Transfer and Fluid Flow in Minichannels and Microchannels; Elsevier: Amsterdam, The Netherlands, 2014; ISBN 9780080983462. [Google Scholar]
  3. Chen, G.-B.; Chao, Y.-C.; Chen, C.-P. Enhancement of hydrogen reaction in a micro-channel by catalyst segmentation. Int. J. Hydrogen Energy 2008, 33, 2586–2595. [Google Scholar] [CrossRef]
  4. Wang, K.; Li, L.; Xie, P.; Luo, G. Liquid–liquid microflow reaction engineering. React. Chem. Eng. 2017, 2, 611–627. [Google Scholar] [CrossRef]
  5. Priest, C.; Zhou, J.; Klink, S.; Sedev, R.; Ralston, J. Microfluidic Solvent Extraction of Metal Ions and Complexes from Leach Solutions Containing Nanoparticles. Chem. Eng. Technol. 2012, 35, 1312–1319. [Google Scholar] [CrossRef]
  6. Tran, T.M.; Lan, F.; Thompson, C.S.; Abate, A.R. From tubes to drops: Droplet-based microfluidics for ultrahigh-throughput biology. J. Phys. D Appl. Phys. 2013, 46, 114004. [Google Scholar] [CrossRef]
  7. Chen, R.; Su, G.H.; Zhang, K. Analysis on the high-quality development of nuclear energy under the goal of peaking carbon emissions and achieving carbon neutrality. Carbon Neutrality 2022, 1, 1–12. [Google Scholar] [CrossRef]
  8. Voumik, L.C.; Science, N. Impact of Renewable and Non-Renewable Energy on EKC in SAARC Countries: Augmented Mean Group Approach. Energies 2023, 16, 2789. [Google Scholar] [CrossRef]
  9. Swanson, J.L. PUREX Process Flowsheets. In Science and Technology of Tributyl Phosphate; Schulz, W.W., Burger, L.L., Navratil, J.D., Bender, K.P., Eds.; CRC Press: Boca Raton, FL, USA, 1984; p. 55. [Google Scholar]
  10. Ma, S.; Sherwood, J.M.; Huck, W.T.S.; Balabani, S. On the flow topology inside droplets moving in rectangular microchannels. Lab Chip 2014, 14, 3611–3620. [Google Scholar] [CrossRef]
  11. Abiev, R.S.; Butler, C.; Cid, E.; Lalanne, B.; Billet, A.-M. Mass transfer characteristics and concentration field evolution for gas-liquid Taylor flow in milli channels. Chem. Eng. Sci. 2019, 207, 1331–1340. [Google Scholar] [CrossRef]
  12. Butler, C.; Cid, E.; Billet, A.-M. Modelling of mass transfer in Taylor flow: Investigation with the PLIF-I technique. Chem. Eng. Res. Des. 2016, 115, 292–302. [Google Scholar] [CrossRef]
  13. Kashid, M.N.; Gupta, A.; Renken, A.; Kiwi-Minsker, L. Numbering-up and mass transfer studies of liquid–liquid two-phase microstructured reactors. Chem. Eng. J. 2010, 158, 233–240. [Google Scholar] [CrossRef]
  14. Dietrich, N.; Loubière, K.; Jimenez, M.; Hébrard, G.; Gourdon, C. A new direct technique for visualizing and measuring gas–liquid mass transfer around bubbles moving in a straight millimetric square channel. Chem. Eng. Sci. 2013, 100, 172–182. [Google Scholar] [CrossRef]
  15. van Baten, J.M.; Krishna, R. Corrigendum to “CFD simulations of mass transfer from Taylor bubbles rising in circular capillaries”. Chem. Eng. Sci. 2004, 59, 2535–2545. [Google Scholar] [CrossRef]
  16. Yue, J.; Luo, L.; Gonthier, Y.; Chen, G.; Yuan, Q. An experimental study of air–water Taylor flow and mass transfer inside square microchannels. Chem. Eng. Sci. 2009, 64, 3697–3708. [Google Scholar] [CrossRef]
  17. Kashid, M.; Renken, A.; Kiwi-Minsker, L. Influence of Flow Regime on Mass Transfer in Different Types of Microchannels. Ind. Eng. Chem. Res. 2011, 50, 6906–6914. [Google Scholar] [CrossRef]
  18. Zhang, Q.; Liu, H.; Zhao, S.; Yao, C.; Chen, G. Hydrodynamics and mass transfer characteristics of liquid–liquid slug flow in microchannels: The effects of temperature, fluid properties and channel size. Chem. Eng. J. 2019, 358, 794–805. [Google Scholar] [CrossRef]
  19. Yao, C.; Ma, H.; Zhao, Q.; Liu, Y.; Zhao, Y.; Chen, G. Mass transfer in liquid-liquid Taylor flow in a microchannel: Local concentration distribution, mass transfer regime and the effect of fluid viscosity. Chem. Eng. Sci. 2020, 223, 115734. [Google Scholar] [CrossRef]
  20. Angeli, P.; Tsaoulidis, D.; Weheliye, W.H. Studies on mass transfer of europium(III) in micro-channels using a micro Laser Induced Fluorescence technique. Chem. Eng. J. 2019, 372, 1154–1163. [Google Scholar] [CrossRef]
  21. Ganguli, A.A.; Pandit, A.B. Hydrodynamics of Liquid-Liquid Flows in Micro Channels and Its Influence on Transport Properties: A Review. Energies 2021, 14, 6066. [Google Scholar] [CrossRef]
  22. Bai, L.; Zhao, S.; Fu, Y.; Cheng, Y. Experimental study of mass transfer in water/ionic liquid microdroplet systems using micro-LIF technique. Chem. Eng. J. 2016, 298, 281–290. [Google Scholar] [CrossRef]
  23. Kuhn, S.; Jensen, K.F. A pH-Sensitive Laser-Induced Fluorescence Technique to Monitor Mass Transfer in Multiphase Flows in Microfluidic Devices. Ind. Eng. Chem. Res. 2012, 51, 8999–9006. [Google Scholar] [CrossRef]
  24. Cheng, N.-S. Formula for the Viscosity of a Glycerol−Water Mixture. Ind. Eng. Chem. Res. 2008, 47, 3285–3288. [Google Scholar] [CrossRef]
  25. Volk, A.; Kähler, C.J. Density model for aqueous glycerol solutions. Exp. Fluids 2018, 59, 75. [Google Scholar] [CrossRef]
  26. Demond, A.H.; Lindner, A.S. Estimation of interfacial tension between organic liquids and water. Environ. Sci. Technol. 1993, 27, 2318–2331. [Google Scholar] [CrossRef]
  27. Rader, C.A.; Schwartz, A.M. The Migration of Liquids in Textile Assemblies: Two-Component and Two-Phase Liquid Systems. Text. Res. J. 1962, 32, 140–153. [Google Scholar] [CrossRef]
  28. Yagodnitsyna, A.A.; Kovalev, A.V.; Bilsky, A.V. Flow patterns of immiscible liquid-liquid flow in a rectangular microchannel with T-junction. Chem. Eng. J. 2016, 303, 547–554. [Google Scholar] [CrossRef]
  29. Kovalev, A.V.; Yagodnitsyna, A.A.; Bilsky, A.V. Viscosity Ratio Influence on Liquid-Liquid Flow in a T-shaped Microchannel. Chem. Eng. Technol. 2020, 44, 365–370. [Google Scholar] [CrossRef]
  30. Kovalev, A. The Influence of Viscosity on the Hydrodynamics of Immiscible Liquid-Liquid Flows in Rectangular Microchannels. Ph.D. Thesis, Kutateladze Institute of Thermophysics SB RAS, Novosibirsk, Russia, 2022. [Google Scholar]
  31. Garstecki, P.; Fuerstman, M.J.; Stone, H.A.; Whitesides, G.M. Formation of droplets and bubbles in a microfluidic T-junction—Scaling and mechanism of break-up. Lab Chip 2006, 6, 437–446. [Google Scholar] [CrossRef]
  32. Xu, J.H.; Li, S.W.; Tan, J.; Luo, G.S. Correlations of droplet formation in T-junction microfluidic devices: From squeezing to dripping. Microfluid. Nanofluidics 2008, 5, 711–717. [Google Scholar] [CrossRef]
  33. Zehentbauer, F.M.; Moretto, C.; Stephen, R.; Thevar, T.; Gilchrist, J.R.; Pokrajac, D.; Richard, K.L.; Kiefer, J. Fluorescence spectroscopy of Rhodamine 6G: Concentration and solvent effects. Spectrochim. Acta Part A Mol. Biomol. Spectrosc. 2014, 121, 147–151. [Google Scholar] [CrossRef]
  34. Qian, J.-Y.; Li, X.-J.; Wu, Z.; Jin, Z.-J.; Sunden, B. A comprehensive review on liquid–liquid two-phase flow in microchannel: Flow pattern and mass transfer. Microfluid. Nanofluidics 2019, 23, 1–30. [Google Scholar] [CrossRef]
Figure 1. The schemes of the experimental setup and a T-shaped microchannel.
Energies 16 04059 g001
Figure 3. Comparison of experimental plug lengths with models (a) Equation (7); (b) Equation (8).
Energies 16 04059 g003
Figure 4. The dependence of plug velocity on bulk velocity.
Energies 16 04059 g004
Figure 5. Calibration curves of the registered fluorescent intensity on fluorescent dye concentration: (a) water–glycerol solution; (b) TBP at first measurement area.
Energies 16 04059 g005
Figure 6. The measurement scheme of the solute concentration in slugs of the continuous phase.
Energies 16 04059 g006
Figure 7. The evolution of concentration fields with increasing Qc at a fixed Qd = 3 µL/min.
Energies 16 04059 g007
Figure 8. (a) Extraction efficiency and (b) overall volumetric mass transfer coefficient as a function of residence time at a fixed flow rate ratio.
Energies 16 04059 g008
Figure 9. (a) Extraction efficiency at 17 mm from the T-junction as a function of the total phase flow rate at different phase ratios; (b) overall volumetric mass transfer coefficient at 5.6 mm from the T-junction as a function of the total phase flow at different phase ratios.
Energies 16 04059 g009
Figure 10. Experimental data of overall volumetric mass-transfer coefficient versus the data predicted by the model.
Energies 16 04059 g010
Table 1. Physical properties of the liquids.
Water–Glycerol SolutionTBP
density, kg/m31181973
dynamic viscosity, mPa·s233.4
interfacial tension, mN/m12.6
Disclaimer/Publisher’s Note: The statements, opinions and data contained in all publications are solely those of the individual author(s) and contributor(s) and not of MDPI and/or the editor(s). MDPI and/or the editor(s) disclaim responsibility for any injury to people or property resulting from any ideas, methods, instructions or products referred to in the content.

