Article

Design, Technical and Economic Optimization of Renewable Energy-Based Electric Vehicle Charging Stations in Africa: The Case of Nigeria

1
Department of Electrical and Computer Engineering, Faculty of Engineering, King Abdulaziz University, Jeddah 21589, Saudi Arabia
2
Department of Electrical Engineering, Tsinghua University, Beijing 100190, China
*
Authors to whom correspondence should be addressed.
Energies 2023, 16(1), 397; https://doi.org/10.3390/en16010397
Submission received: 25 November 2022 / Revised: 11 December 2022 / Accepted: 23 December 2022 / Published: 29 December 2022
(This article belongs to the Special Issue Electrical Power Engineering and Renewable Energy Technologies)

Abstract

:
The transportation sector accounts for more than 70% of Nigeria’s energy consumption. This sector has been the major consumer of fossil fuels in the past 20 years. In this study, the technical and economic feasibility of an electrical vehicle (EV) charging scheme is investigated based on the availability of renewable energy (RE) sources in six sites representing diverse geographic and climatic conditions in Nigeria. The HOMER Pro® microgrid software with the grid-search and proprietary derivative-free optimization techniques is used to assess the viability of the proposed EV charging scheme. The PV/WT/battery charging station with a quantity of two WT, 174 kW of PV panels, a quantity of 380 batteries storage, and a converter of 109 kW located in Sokoto provide the best economic metrics with the lowest NPC, electricity cost, and initial costs of USD547,717, USD0.211/kWh, and USD449,134, respectively. The optimal charging scheme is able to reliably satisfy most of the EV charging demand as it presents a small percentage of the unmet load, which is the lowest when compared with the corresponding values of the other charging stations. Moreover, the optimal charging system in all six locations is able to sufficiently meet the EV charge requirement with maximum uptime. A sensitivity analysis was conducted to check the robustness of the optimum charging scheme. This sensitivity analysis reveals that the technical and economic performance indicators of the optimum charging station are sensitive to the changes in the sensitivity variables. Furthermore, the outcomes ensure that the hybrid system of RE sources and EVs can minimize carbon and other pollutant emissions. The results and findings in this study can be implemented by all relevant parties involved to accelerate the development of EVs not only in Nigeria but also in other parts of the African continent and the rest of the world.

1. Introduction

The overall increase in population worldwide, accompanied by the contemporary technological revolution, has given rise to an excessively high rate of electricity consumption, a critical problem that necessitates sustainable energy solutions [1,2]. In the Nigerian power sector, most of the electricity supply is being secured through fossil fuels, namely natural gas, which accounts for about 80% of the total fossil sources, and oil, from which most of the remaining fossil power generation originates [3]. In fact, 80% of the country’s energy mix takes the form of thermal generation sources, with the remaining 20% being derived from hydropower and other renewable energy (RE) sources. The per capita CO2 emissions in Nigeria had dramatically risen from about 0.08 metric tons in 1960 (when Nigeria attained independence from Britain) to 0.67 metric tons in 2018 [4]. In fact, the contribution of the country to the global pollutant emissions level has increased considerably over the past few decades. Nigeria’s total energy consumption in 2020 is about 164,013 kilotonne of oil equivalent (ktoe), with the transportation sector alone contributing about 16,554 ktoe [5]. The transportation sector accounted for over 70% of Nigeria’s energy use [6]. This sector has been the major consumer of fossil fuels in the past 20 years. Many countries, including Nigeria, are looking toward mitigating the usage of conventional energy sources where greenhouse gas (GHG) emission poses serious climate and environmental challenges. The Nigerian government strives to promote the use of electric vehicles (EVs) in the country to mitigate noise and air pollution, and in its effort toward that end, it is incorporating Evs in its development plan for the National Automotive Industry [7]. Environmental and noise pollution concerns, unstable cost and supply of petroleum products as well as efficiency are the driving factors for the development and implementation of alternative means of running vehicles in Nigeria.
Furthermore, the EV named Kona, which was the first one assembled in Nigeria, was unveiled in 2020 [8], and it was stated [9] that it can be charged anywhere within the five-year life of its storage device. The Nigerian JET Motor firm (JMF) launched its electric van JET EV [10,11] with a moving range of more than 250 km [12], and meanwhile, the Nigerian Siltech company introduced its electric bikes with a battery swapping technology. Recently, the National Automotive Design and Development Council (NADDC) of Nigeria, under the EV pilot program, has launched two solar energy-based EV charging stations (EVCSs) in the western Nigerian cities of Lagos and Sokoto with a capacity of 86.4 kilowatts per hour each [13]. The EVCS in the southeastern Nigerian city of Enugu is expected to be unveiled soon to boost the Nigerian government’s commitment to efficient, cost-effective, and eco-friendly vehicles [14,15]. The Lagos state government has given assurance towards providing EVCSs to support the full utilization of EVs in the state [16]. The partnership between JMC and GIG logistics (the country’s leading logistics company) to introduce the first electric vans (Jet Mover) has resulted in the installation of EV charging station infrastructures on the premises of this latter company. A charging station is capable of charging two EVs at the same time to full capacity with two hours of charging. Each EV van has a 107.8 kWh lithium-ion battery and can go a distance of about 300 km [17]. This shows that the government and the private sectors are highly committed to the establishment of EV pilot projects that support carbon neutrality. However, insufficiency in electrical power supply, which is essential for the utilization of EVs, and the shortage in EV charging station (CS) infrastructures are obstacles to a bright future for EVs in Nigeria.
In addition, wind and solar power have become essential and common technologies for electricity production due to the recent technological advancements in power electronic storage systems as well as the price reduction of the required devices [18]. According to Aliyu et al. [19], with an average of 6 h of daily sunshine being captured over 1% of land size for the solar photovoltaic (PV) system, Nigeria has the potential to generate annual electrical energy of about 1,850,000 GWh. The coastal and offshore regions, hilly areas of the north, middle belt mountainous terrains, as well as northern fringes of the country are windy with the potential for harvesting great wind power all over the year [20]. Moreover, it was indicated by Nehrir et al. [21] that renewable energy sources (RESs) such as solar energy (SE) and wind energy (WE) have more benefits in terms of electricity generation compared to other sources in addition to being freely available in nature. The integration of solar and wind systems with storage devices, either as standalone microgrids or with a utility grid network, has proven to save a substantial amount of carbon dioxide (CO2) and other pollutant emissions, thereby making such microgrids environment-friendly [22]. The microgrid could serve as a green solution for the EVCS energy demand. The utilization of solar and wind energies incorporated with a better end-use efficiency will almost definitely be needed to cope with the increasing energy charging demand from EVs for sustainable, eco-friendly, and affordable power supply as the use of fossil fuels is gradually destroying the atmosphere and creating adverse and alarming climatic conditions.
Additionally, to solve the problem of everyday power outages, which could affect the operational time and efficiency of EVs in the country due to insufficient generation, the Nigerian government has unveiled plans to increase the power generation from fossil fuels to 18,200 MW [23] and targeted 30% of the gross electricity generation from renewable energy (RE) resources by the year 2030 [24]. This shows that the future energy plan still targets enormous electricity generation from resources that pollute the environment and put the ecosystem in danger [25]. The sustainable development goal of the country can be accomplished via the adequate provision of reliable and affordable electricity supply from RE sources for various applications, including EVCS systems, in addition to preserving environmental integrity [26].

2. Literature Review

Various studies have been carried out to optimally design and techno-enviro-economically investigate the performance of EVCS systems and the Vehicle-to-Grid (V2G) technology strategy using different techniques and tools. Among the works assessed in the literature, few have simultaneously considered locations with diverse geographical characteristics and climatic conditions for the design and analysis of EVCS systems. The system topology, operating mode, locations, sensitivity, and evaluation variables using different optimization strategies and methodologies for electric vehicle charging station (EVCS) design in many other parts of the world are given in Table 1. Both grid-tied, hybrid models and standalone systems for meeting EV charge demand have been effectively studied for EV charging applications, but at a smaller number in a few locations around the world. Some studies have shown the technical and economic advantages of using an off-grid system based on RESs for EV charging to mitigate the burden and protect the utility grid network [14], while others have indicated the environmental benefits of a standalone EVCS [26]. Observation of the various system designs in Table 1 for the power supply of an EVCS conforms to our belief that no study has been conducted so far in the whole of Africa, particularly in the Nigerian context, to design and conduct a detailed performance assessment of a standalone system based on available RESs for EV charging. Furthermore, a few studies (Table 1) have performed a sensitivity analysis to check the resilience of the optimized system against uncertain variables. However, none of the few studies that actually performed some sort of sensitivity evaluation has performed so as an in-depth sensitivity analysis considering variations in diverse, uncertain, and critical parameters against the technical and economic performance of the selected EV charging system.
By utilizing bio-gas sources, Karmaker et al. [27] designed a 20 kW EVCS with a detailed feasibility assessment. The technical, environmental, and financial perspectives relating to their proposed EV charging points were studied with the aid of the HOMER optimization tool. Their outcome reveals the economic and environmental benefits of the proposed EVCS system as compared to the utility grid-based charging points in Bangladesh. The design and viability study of a specialized EV charging station model was investigated using the grid analysis software tool known as HOMER (short for “Hybrid Optimization of Multiple Energy Resources”). Based on three various cases of EV charging points analyzed, a yearly profit of USD63,680 was provided in addition to recovering the charging station’s installation costs in less than three years. The level-2 EVSE is the most effective, reducing greenhouse gas emissions by 104 t [28]. The investigation of the environmental effect of the carbon dioxide (CO2) emissions point of view embedded in green off-grid power schemes and the assessment of the environmental impact of their execution in the electricity supply of EVCS was conducted by Filote and Felseghi [29]. Their outcomes show that the clean power schemes represent viable solutions for the autonomous electricity support of EVCSs, being capable of supplying electric power based on 100% availability of on-site alternative energy resources. Moreover, the mean cost of 1 kWh of energy produced by the evaluated configurations is 4.3 times the mean unit cost of the EU electric distribution network electricity. Machado et al. [30] investigated the techno-economic viability evaluation on EV and RE integration as a case study, where three possible scenarios varying between a grid-alone operation, the integration of RESs for providing electric power to the EVs and a utility grid, together with the vehicle-to-grid (V2G) strategy were presented. The V2G scheme and the RE integration outcome indicated cost benefits along with minimal power intake during the peak loading time of the design. The HOMER software was used by Boddapati and Venkatesh [31] for the design of an EVCS by utilizing hybrid power sources such as solar photovoltaic, wind, and diesel plants (DG). They indicated that the utility power network-tied EVCS is more cost-effective than the standalone charging scheme. Moreover, they also conducted a sensitivity evaluation to check the impact of some variable parameters on the EVCS.
Furthermore, another study by Ye et al. [32] assessed the feasibility of a solar-based EVCS model for application in Shenzhen City in China. The results of this study reveal prospects of the proposed model in terms of emissions minimization and the satisfaction of the huge demand needed for electric vehicles. The study also recommends that carbon pricing promotes RE only when the cost of carbon is more than USD20/t. Moreover, a technical and economic investigation of a standalone renewables-based EVCS to find the optimum system to produce the needed charging demand per day was performed [33]. The outcomes of this investigation revealed that the optimized solution for the chosen locations comprises a 250-kilowatt wind system with a 60 m hub height. Furthermore, the optimum scenarios’ gross net present cost (NPC) varies between USD2.53M to USD2.92M, while the cost of energy (COE) varies between USD0.285 and USD0.329 per kWh. Based on the change in the feed-in tariff technique, a techno-economic performance investigation of the V2G system model in Indonesia’s largest electricity grid network was performed [1]. The investigation indicated that the utilization of EVs can potentially reduce the peak hour supply by about 2.8% and 8.8%, respectively, for coal and gas. From the electricity company’s point of view and because of fuel replacement, the annual revenue can be improved by around 3.65% with the vehicle-to-grid approach. The design and viability evaluation of a RE-based hybrid EVCS system was carried out to lessen the stress on the electric utility network system owing to the fast rise in electrical vehicles in Bangladesh [34]. The EVCS system in [32] is designed using solar PV and a biogas system. The system configuration estimates an energy cost of USD0.1302/kWh and a gross net present cost of USD56,202 at a running cost of USD2540. Moreover, the system model minimizes carbon dioxide emission by 34.68% in comparison to a traditional electric utility network-based CS.
Efficient, reliable, and cost-effective EV charging infrastructure is one of the main factors that can facilitate the utilization and adoption of electric vehicles in Africa, particularly in Nigeria, to support the decarbonization of the economy and environment. It is difficult to achieve an efficient and reliable EVCS in Nigeria with the current utility grid network because of the so-far erratic and unreliable nature of that network. Therefore, an autonomous RE-based system could provide clean, reliable, and cost-effective electricity for EV charging. Moreover, since the adequate and effective use of RE sources for power generation depends on the climatic conditions of a place and the massive and successful roll-out of EVs is a function of the availability of reliable and cost-effective EV charging infrastructures, it is important to come up with an alternative approach to designing an efficient EVCS that can generate reliable, clean and cost-effective electricity. Currently, there is no grid-independent hybrid EV charging station scheme under Nigerian conditions that are readily available in the open literature. Therefore, this study strives to carry out the design and performance assessment of a hybrid RE-based system to provide reliable, eco-friendly, cost-effective electricity with enhanced efficiency for EV charging stations. The proposed robust methodology intends to accurately investigate the establishment of EV charging stations in Nigeria. This methodology is examined by considering different optimal system configurations across the six geo-political zones with diverse geographical characteristics and climatic conditions.
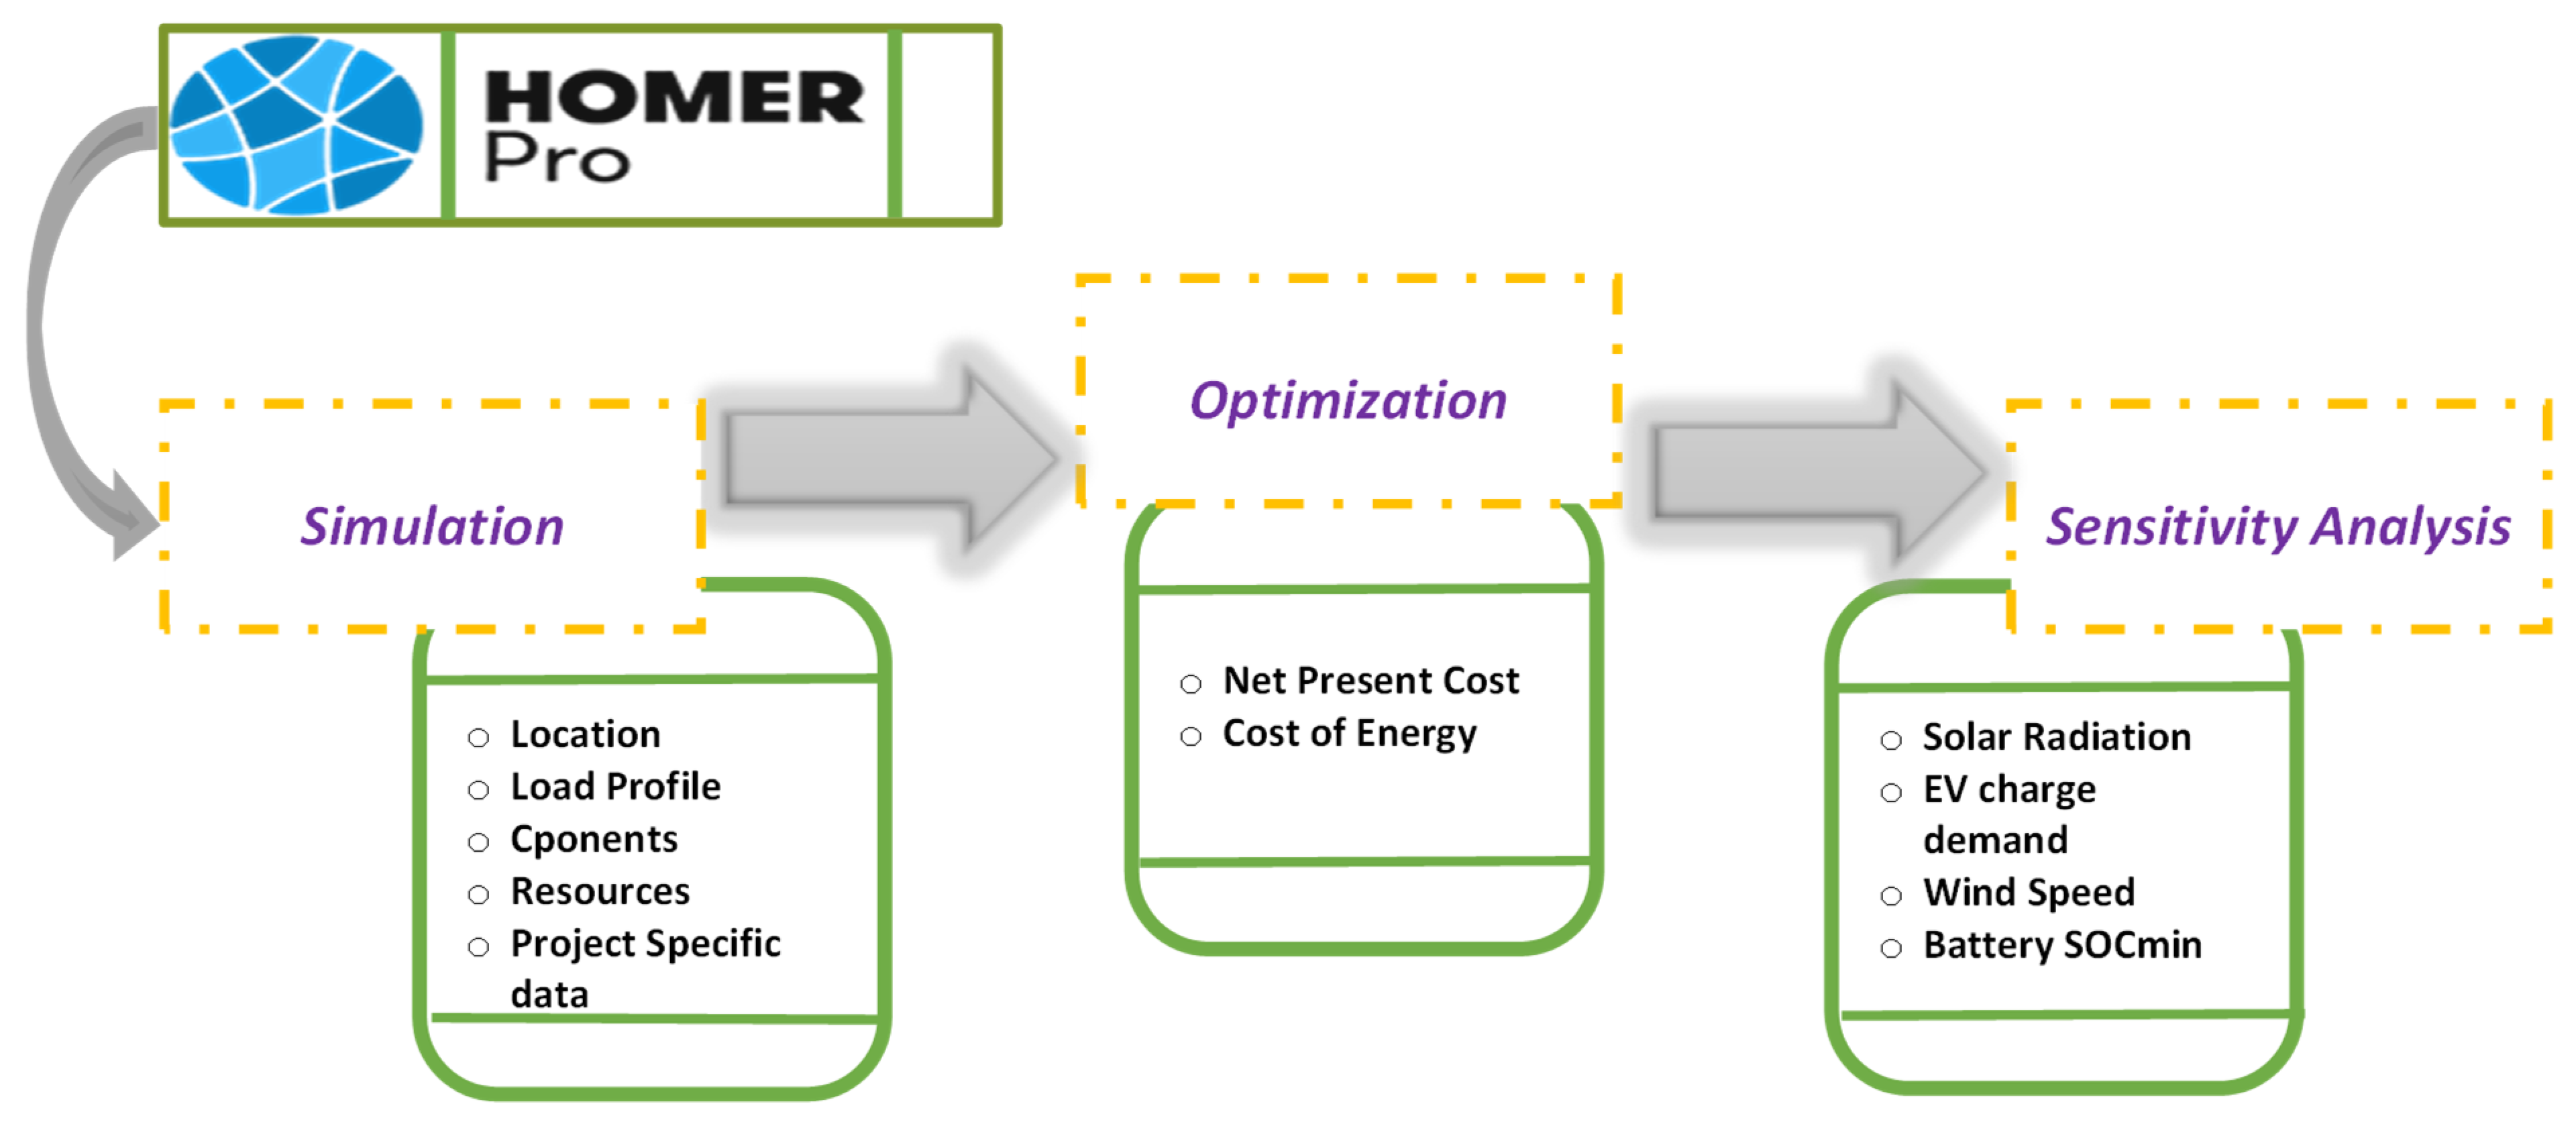
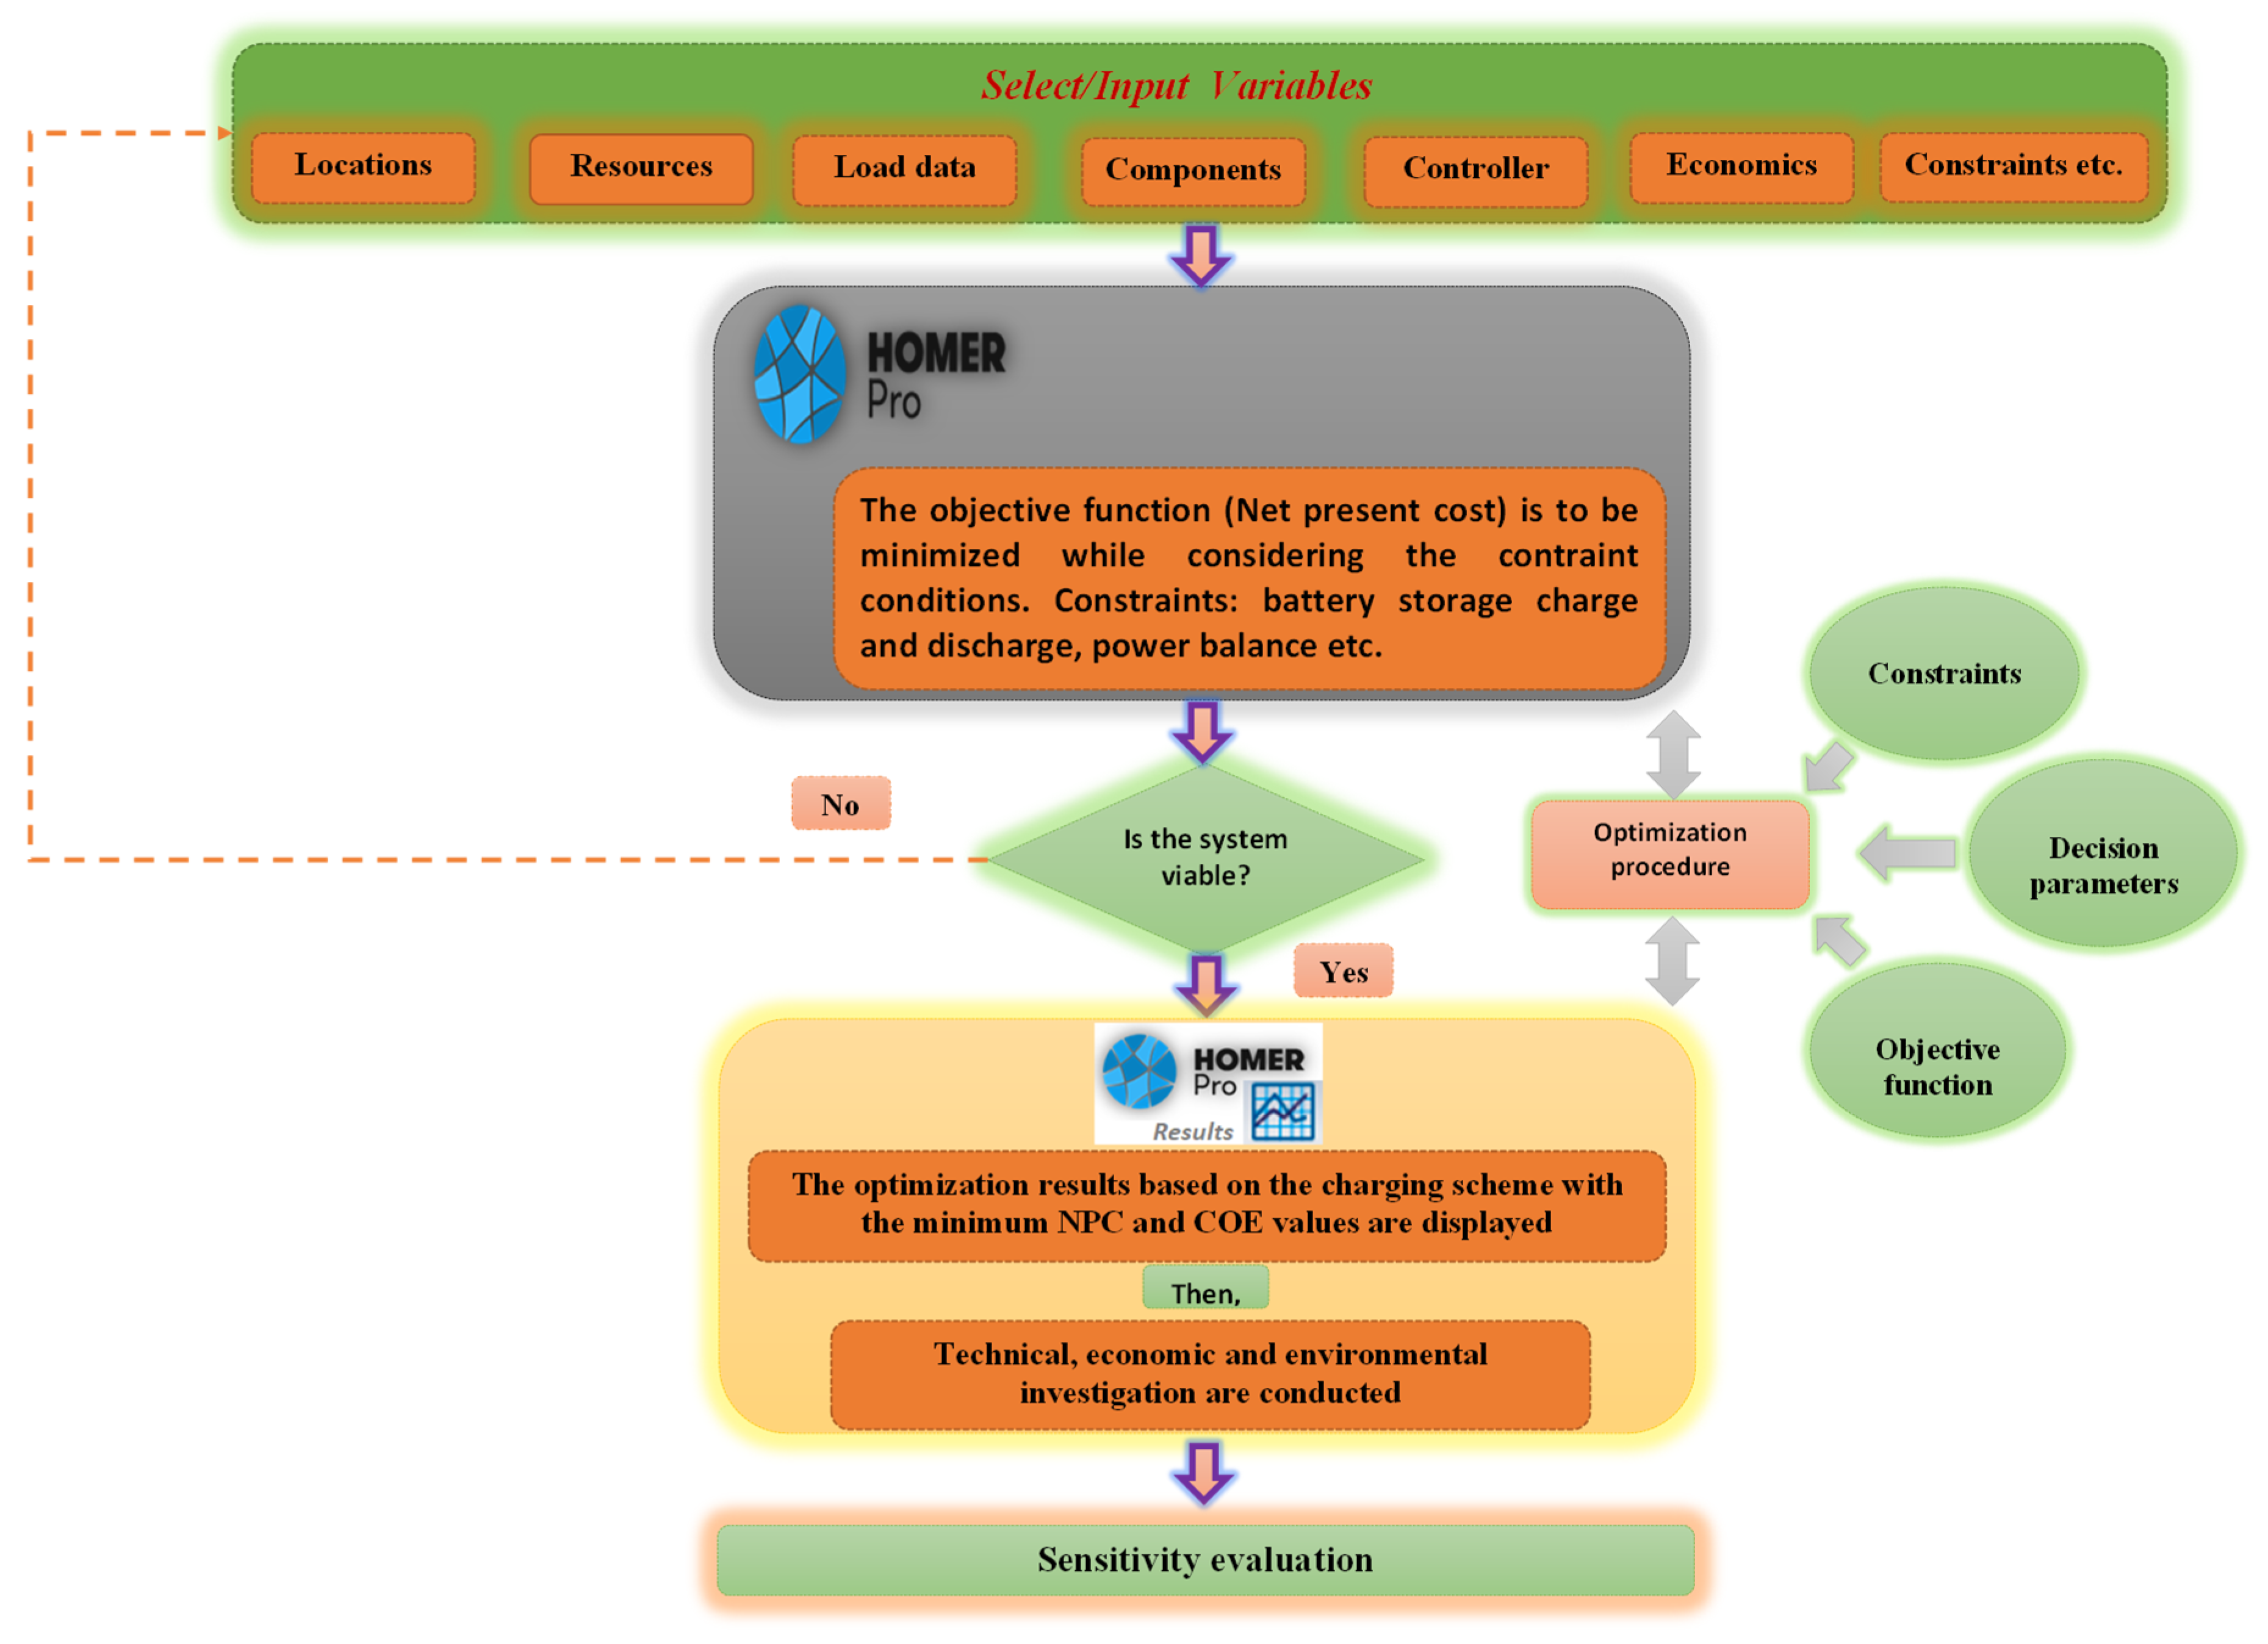
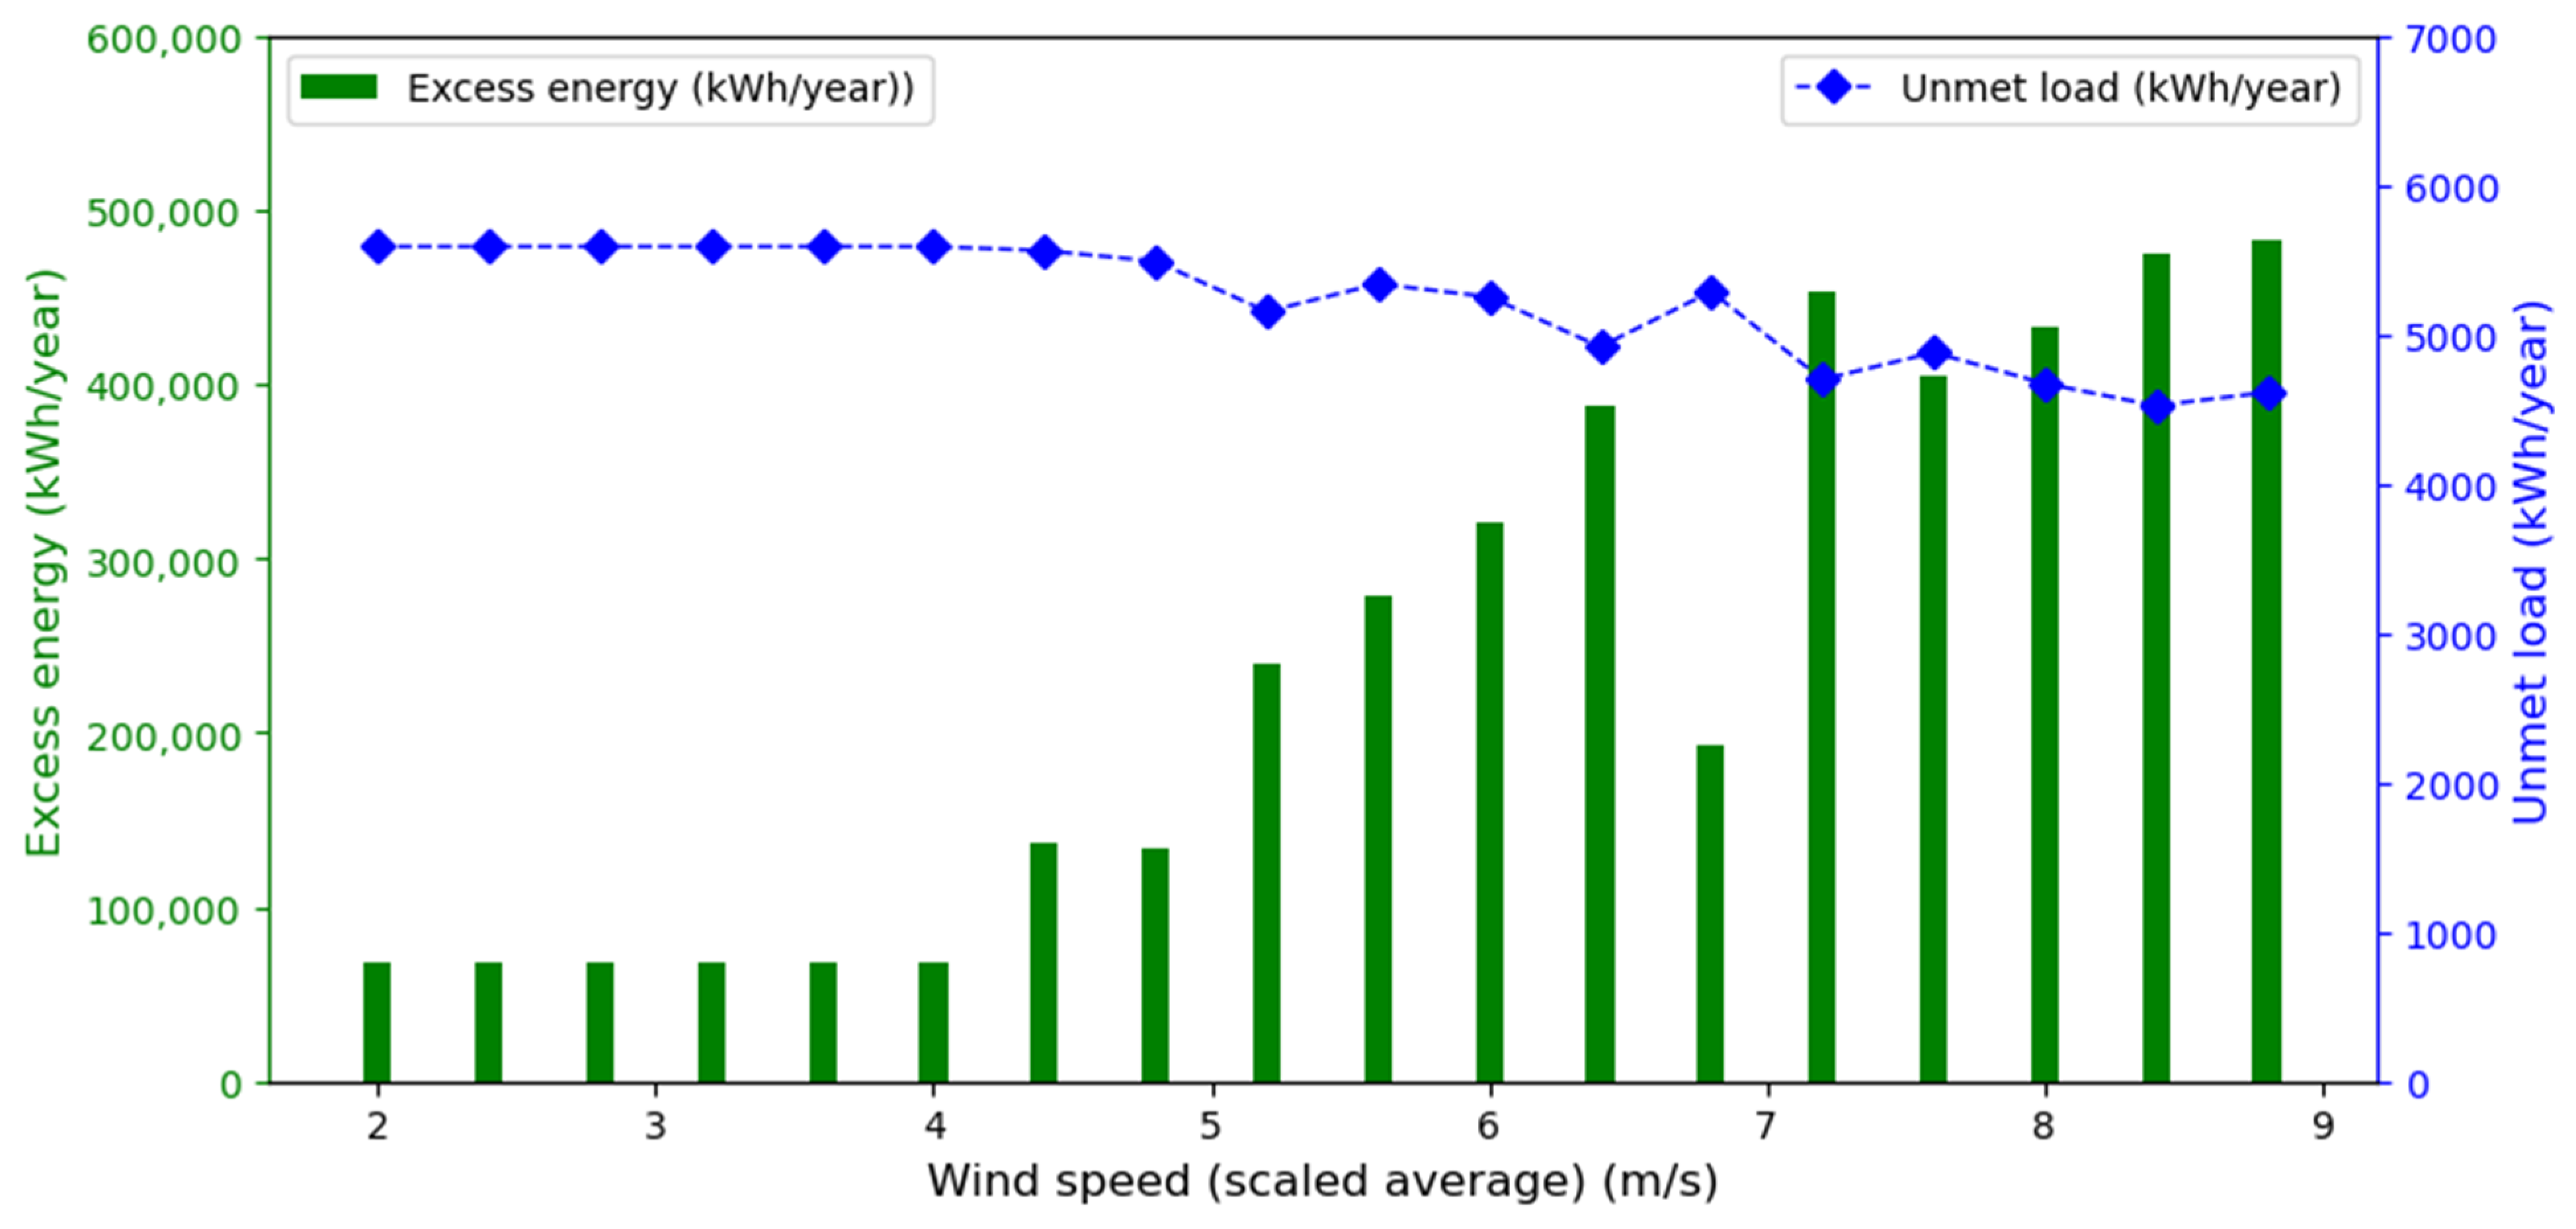
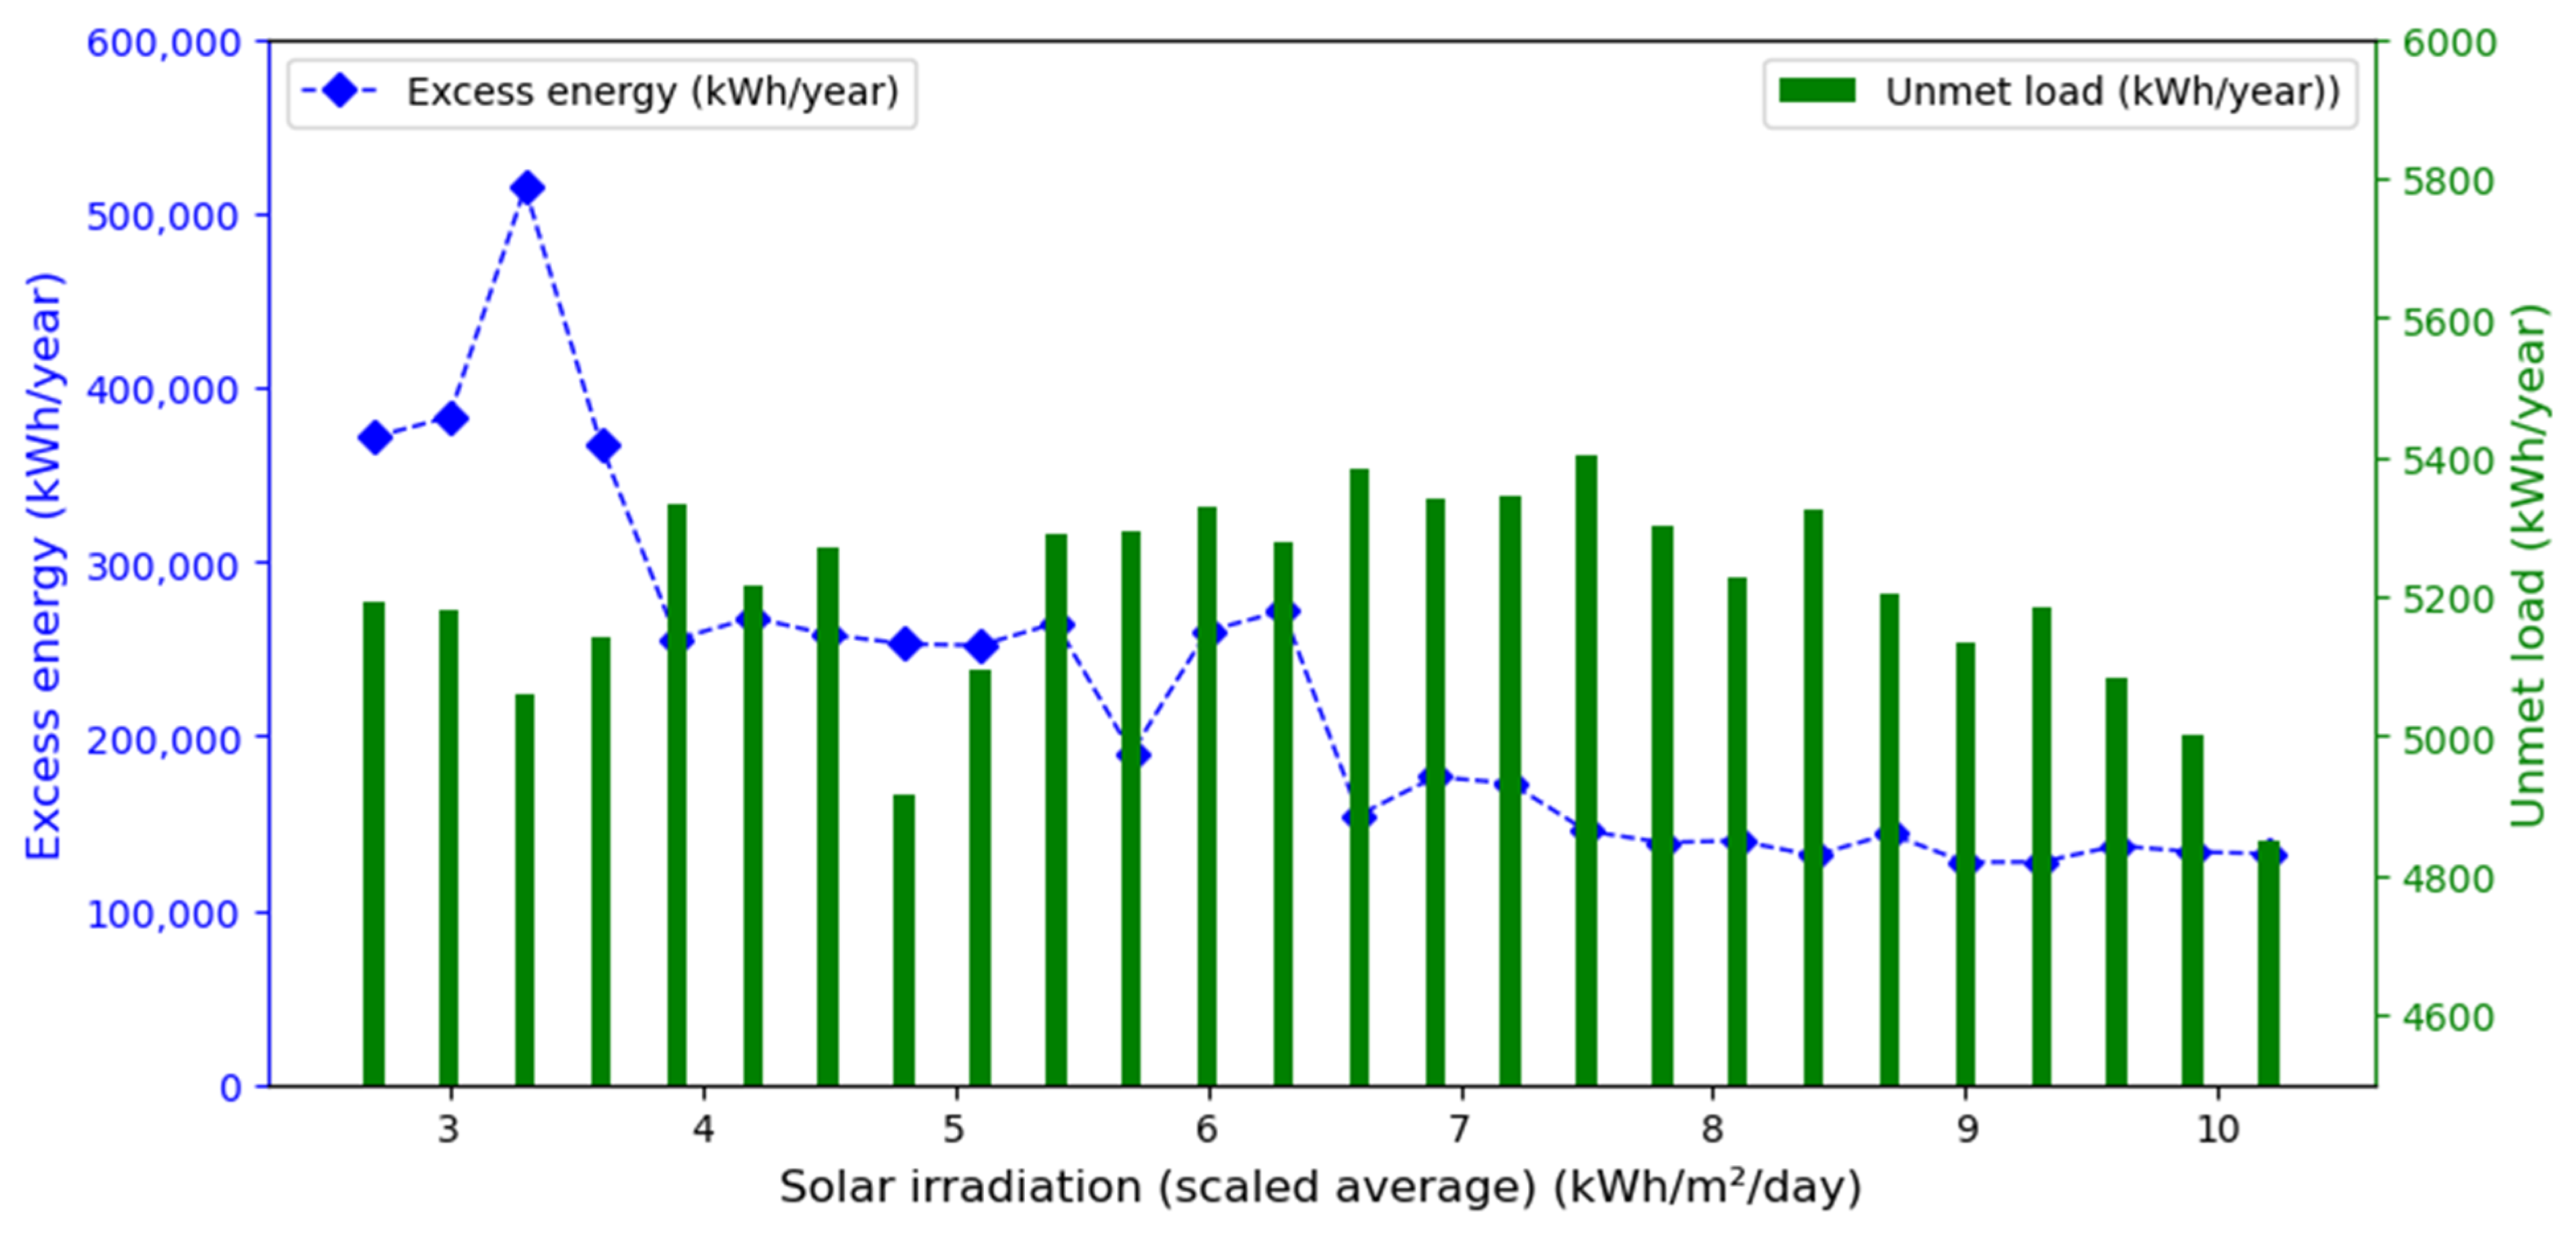
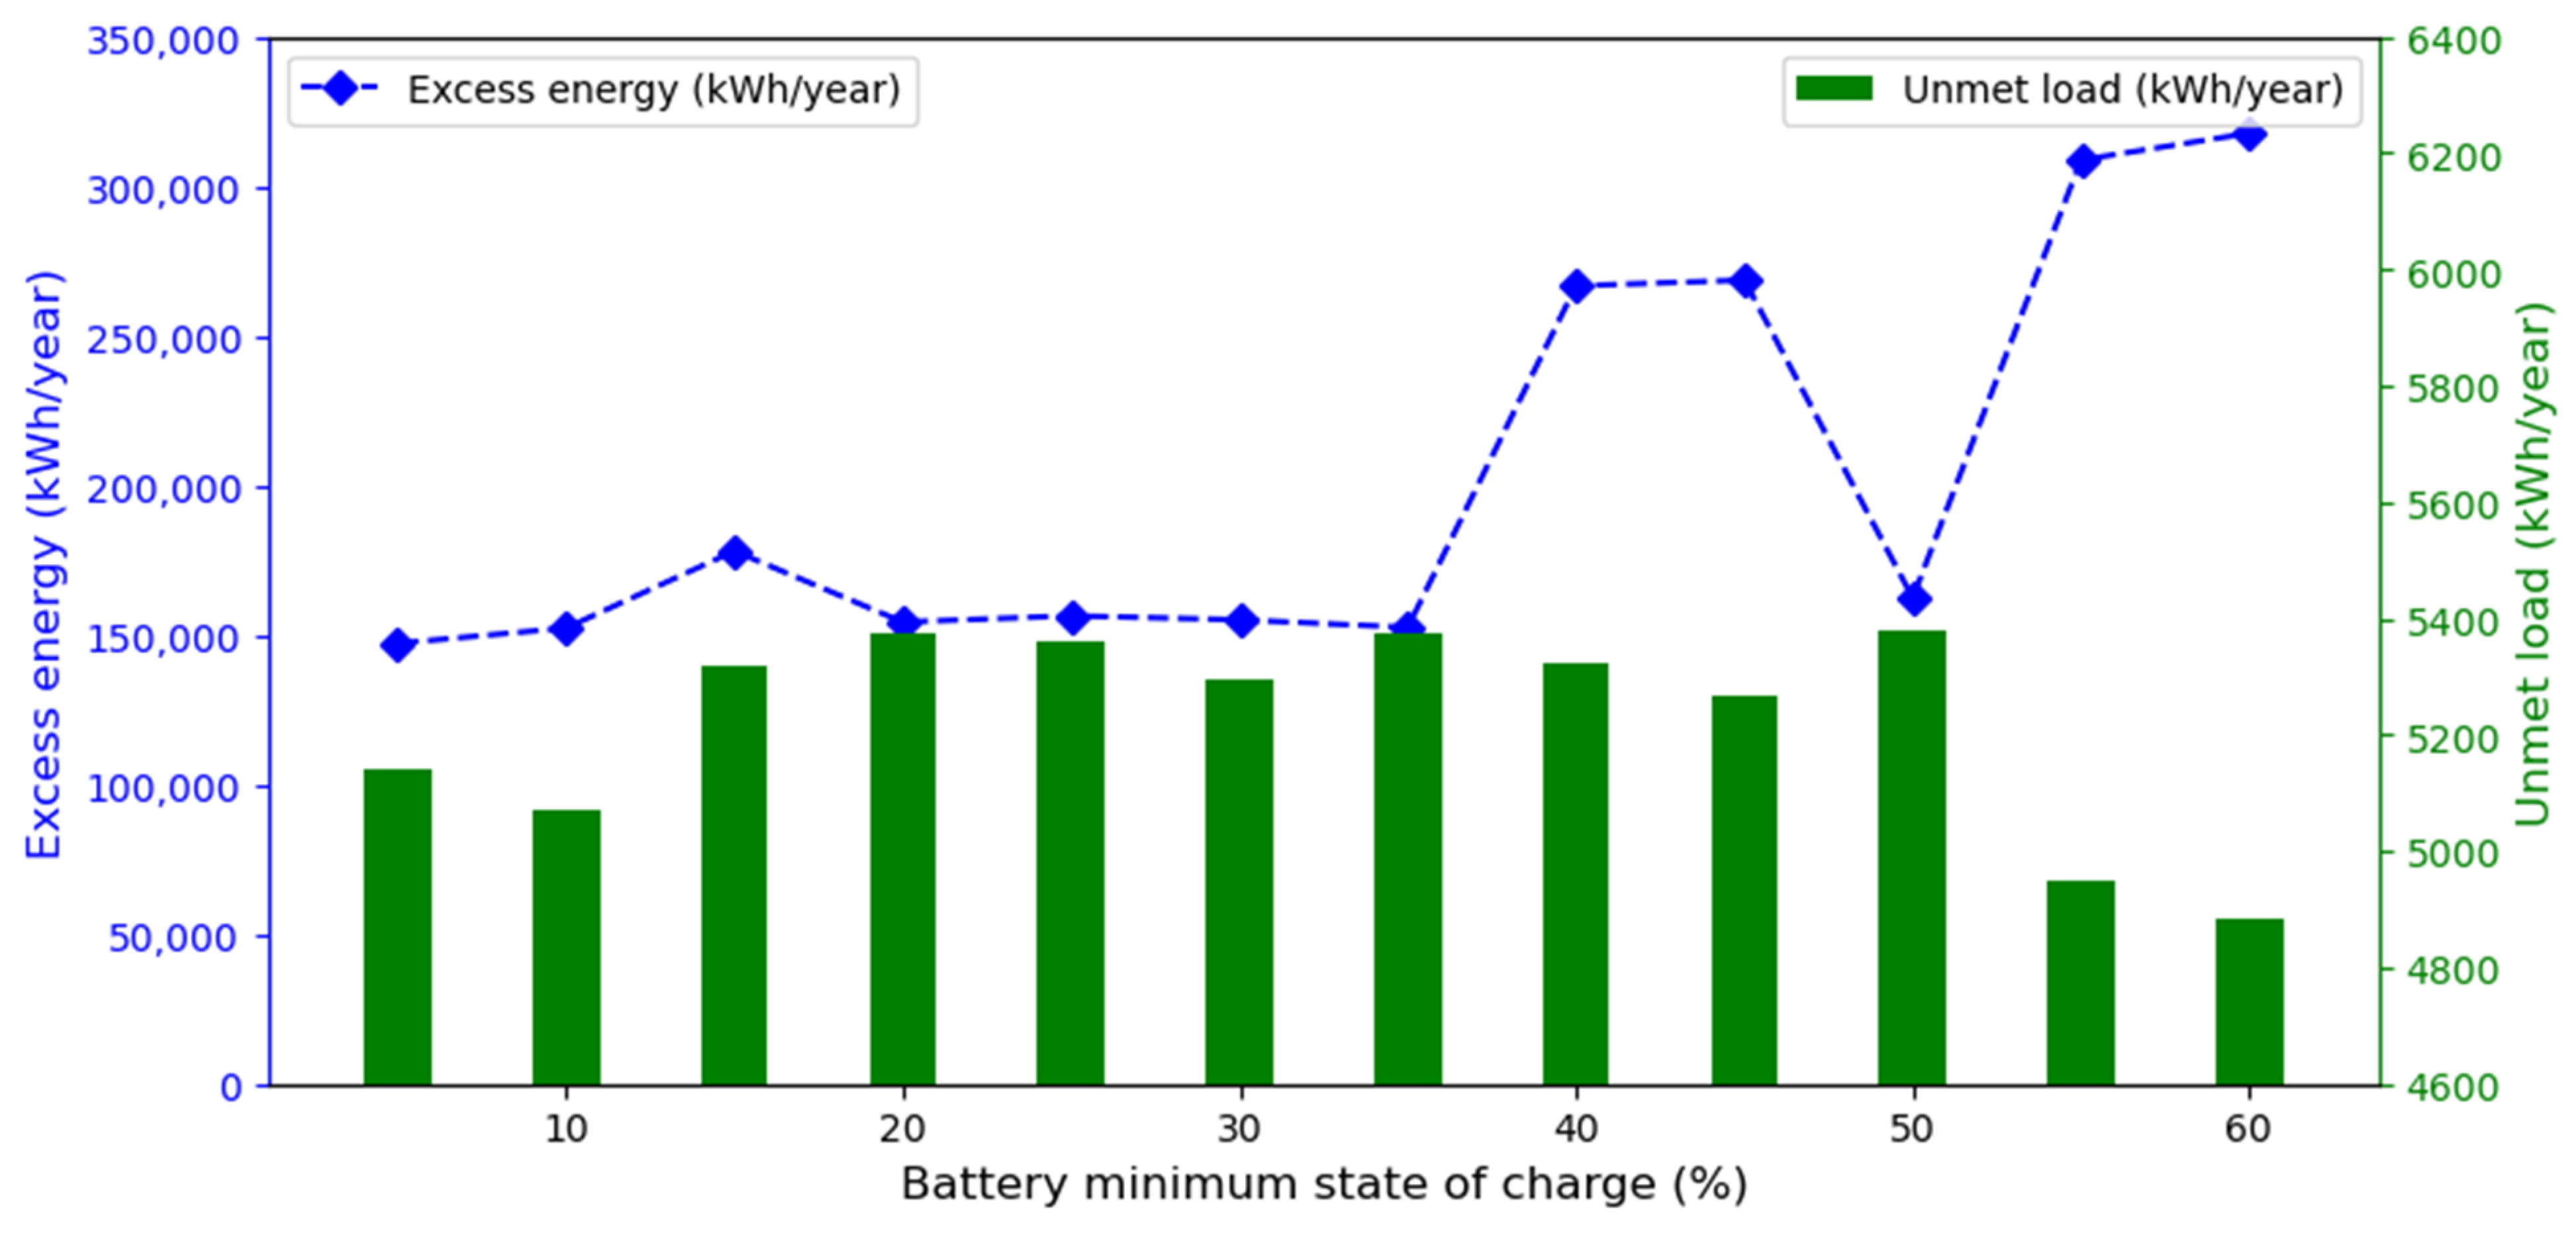
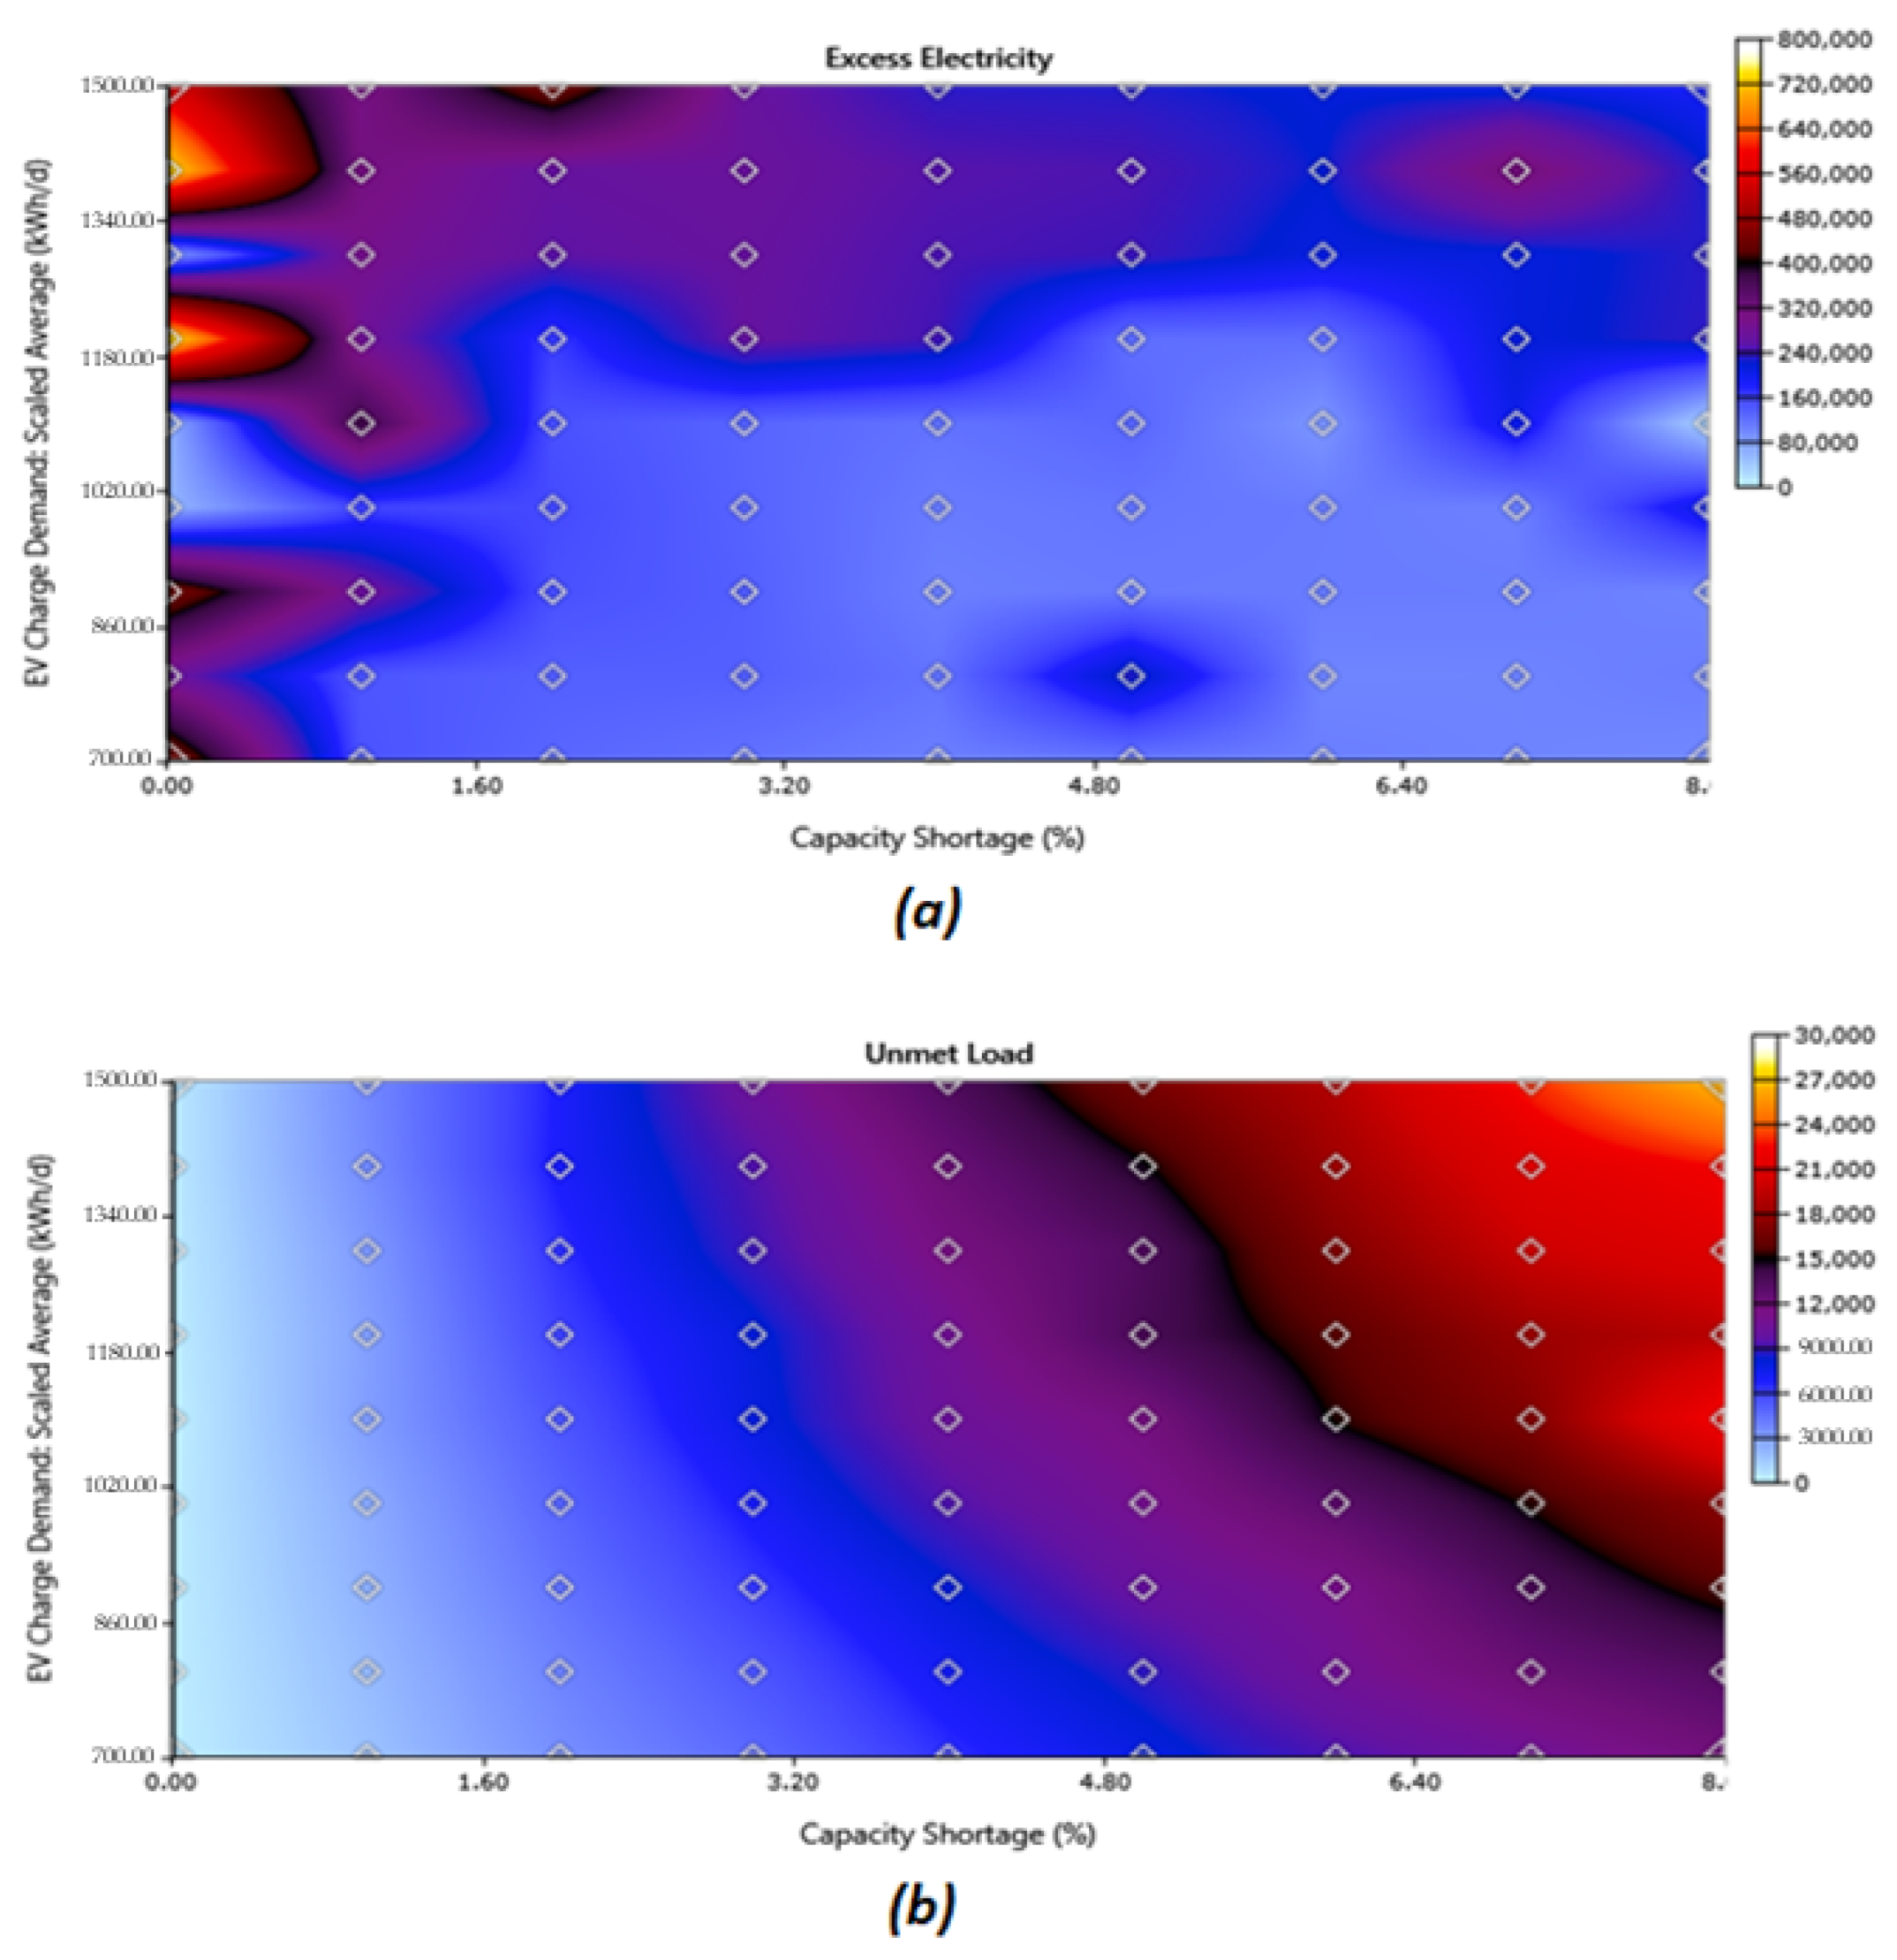
The operational behavior of the charging system was tested via sensitivity analysis to check the robustness of the optimal charging scheme by varying some critical sensitivity parameters. The HOMER Pro® software has been employed for the sizing and performance assessment of the proposed charging station scheme owing to its precision, performance, and efficiency in evaluating the optimum hybrid energy system configuration [35]. The grid-search and proprietary derivative-free optimization (GPDO) techniques were used in the microgrid analysis tool to obtain the cost-effective, viable charging system.
Table 1. The EVCS system designs and sensitivity analyses conducted in previous works in the open literature.
System ConfigurationOperating ModeCountrySensitivity VariablesYearEvaluation ParametersRefs
PV/Wind/Fuel cell/batteryOff gridIndiaNil2022NPC/OPEX/COE[36]
PV/Grid/batteryOn/Off-gridVietnamSolar EVCS2021NPC/COE/RF[37]
CPV/WT/Bio-Gen/FC/BatteryStand-aloneQatarWT hub heights.2021NPC/COE/Unmet load[33]
PV/Grid/BatteryGrid-basedIndiaNil2021RF/COE/Prod./GHG[28]
Wind/PV/batteryStand-aloneTurkeyNil2020NPC/Prod./COE [38]
PV/Wind/Fuel cell/batteryOff gridRomaniaNil2020COE/NPC/GHG[29]
PV/WT/Grid/V2GGrid-tied/V2GBrazilNil2020LCOE/Prod./NPV[30]
V2G technologyGrid-basedIndonesiaNil2020GHG/Energy-supply/cost[1]
PV/Biogas Gen/Grid/BatteryOn/Off-gridBangladeshNil2018NPC/COE/GHG[34]
DG/PV/Grid/BatteryOn/Off-gridCanadaNil2017NPC/COE/GHG[39]
PV/Grid/BatteryGrid-tiedBulgariaNil2016COE/NPC/GHG[40]
PV-Grid basedGrid-tiedChinaEconomic variables2015COE/GHG/NPC[32]

3. Methodology

3.1. Microgrids Design and Optimization Tool (HOMER)

The hybrid optimization model for electric renewable (HOMER) simulation tool is an important and widely used simulation software tool. It was developed in 1993 by the National Renewable Energy Laboratory (NREL) in the USA [41]. The software is utilized for analyzing various system design alternatives for both standalone and grid-tied designs in a simplified way for different applications. The optimal evaluation simulation procedure of the charging station models in the HOMER Pro® software is illustrated in Figure 1. Three major tasks are accomplished here: simulation, optimization, and sensitivity evaluation. For the simulation, HOMER models hourly the performance of each of the system subunits to ensure the optimal possible matching between the energy demand and supply. It models various system designs in the optimization section to find the systems that meet the technical constraints as well as fulfill the charge demand at a low life-cycle cost.
Lastly, HOMER performs numerous optimization operations with various ranges of input variables to check the effects of changes in input parameters on the selected system in the sensitivity analysis section [42]. The input data required by HOMER are load profile, meteorological resources, economic constraints, and system component specifications (prices and sizes), which are used to provide a list of ranked feasible systems according to the least total NPC and energy cost [43]. The modeling and optimization of different hybrid energy systems were previously studied in the literature in terms of diverse techno-economic and environmental parameters. Such a study was accomplished with the aid of the HOMER analysis tools for both grid-connected and off-grid applications in different parts of the world are presented in Table 2. This shows that HOMER software is an important and widely used tool for the design and assessment of hybrid energy systems worldwide. Therefore, the HOMER Pro® simulation tool is employed in the present analysis for the optimal design and techno-economic viability analysis of the proposed renewable energy-based EV charging station. In order to obtain a cost-effective feasible system, the simulation tool utilizes the GPDO techniques [44].
Table 2. Hybrid renewable energy-based system models that were studied in different parts of the world with the aid of the HOMER simulation tool.
System ConfigurationApplicationCountrySimulation Tool/YearParametersRefs.
PV/WT/DG/BESRural loadNigeriaHOMER2021NPC/COE/GHG[45]
WT/DG/FC/BESStandaloneSaudi ArabiaHOMER2021NPC/COE[46]
WT/BES/PV/DGOff-gridMalawiHOMER2021COE/RF/NPV[47]
PV/BES/GRIDOn/Off GridIraqHOMER2020NPC/GHG/RF[48]
PV/BESOff-gridMoroccoPVsyst/HOMER2019LCC/RF/COE[49]
WT/DG/BESOff-gridPakistanHOMER/MATLAB2019THD/GHG/COE[50]
WT/PV/BES/DGOff-gridBangladeshHOMER2018NPC/COE/GHG/[51]
GRID/PVOn-gridSaudi ArabiaHOMER2018RF/NPC/COE[52]
PV/WT/BES/FCOff-gridUAEHOMER2017NPC/COE/GHG[53]
WT/PV/DG/BESOff-gridCanadaHOMER2016GHGepc/COE[54]
WT/PV/BES/DGOff/On-gridSri LankaHOMER2015TNPC/LCOE[55]
PV/DG/BESOff-gridIndiaHOMER2014NPC/RF[56]
PV/DG/BESOff-gridSaudi ArabiaHOMER2010COE/RF[57]

3.2. Sites Details and Operating Strategy

The six locations selected in this study for the set-up of the proposed EV charging station are shown on the map of Nigeria displayed in Figure 2. The considered case study sites were selected from the North-Central (Minna), North-East (Maiduguri), North-West (Sokoto), South-West (Ikeja), South-East (Enugu), and South-South (Port-Harcourt) geo-political zones. The geographical coordinates of the case study sites are given in Table 3. The selected and investigated locations are among the sites that the National Automotive Design and Development Council (NADDC) of Nigeria is considering for the EV pilot program initiatives.
The power flow diagram of the proposed hybrid RE-EV charging station is depicted in Figure 3. The wind turbines (WTs) are integrated into the hybrid charging station system via the alternating current (AC) link, while the PV panels and the batteries storage are connected through the direct current (DC) bus. The bi-directional converter keeps the flow of electric power between the AC bus and DC link devices. It converts the electrical power from DC to AC. In the inverter mode, it changes the electricity from DC to AC and from AC to DC while operating as a rectifier.
The flowchart for the assessment and the optimization evaluation utilized in the HOMER Pro® microgrid software is illustrated in Figure 4. The objective function is to find the sizes and working scenarios with the least lifespan and set up running costs among the viable systems that satisfy the charging point demand. The minimization of the objective function is based on certain constraint conditions. In this study, the following constraints are considered: the maximum yearly capacity shortage, the minimum renewable fraction, the renewable energy power output, and other standard technical constraints. The decision parameters explored in this analysis are the sizes of the integrated components, including the RE components, the battery storage device, and the converter. The values and specifications of the system control variables, economics, and constraints utilized in the analysis tool are given in Table 4. Because of the large financial cost produced by the battery device replacement, a charging control technique and control approach is needed to protect the storage device from over-charging and over-discharging [58]. The optimization evaluation and the outcomes are based on the constraints, objective function, and decision parameters. After calculating and modeling the load profile, inputting the resource data based on the geographical location of the case study sites, and identifying and specifying the predefined constraints and system components’ technical and cost details, the analysis tool begins the simulation procedure. The simulation process ensured (via the optimization section) that the charging station models that satisfy the technological constraints and meet the EV charge demand at a low total net present costs are realized.
The other part of this study assesses and discusses sensitivity evaluation through the variation of some system variables. Sensitivity analysis is capable of identifying the most important variables of an investment due to the possibility of knowing in advance the effect of input parameters with uncertainty on the system cost variables and can be utilized in different contexts as well as in the assessment of investment projects [61]. The intermittent nature of RESs [62] and the change in load demand are the two major parameters that influence the reliability and consistency in the power generation of any renewable-based energy system. These variables can also impact the present and future financial aspects of the system. Hence, sensitivity analysis is a more realistic and easier technique for determining whether a specific investment is feasible or not. In the present study, the wind speed, solar radiation, battery energy storage minimum state of charge (BES SOCmin), maximum yearly capacity shortage, and EV charge demand are used as sensitivity parameters.

3.3. Renewable Sources at the EVCS Case Study Locations

3.3.1. Wind Power Sources

In Nigeria, coastal, mountainous, and offshore sites are endowed with huge wind power resources. The wind speed over the complex landscapes and the plain surface ranges between 3.60 and 5.40 m per second in the north, whereas the south is characterized by small wind resources with speeds ranging between 1.4 to 3.0 m per second. The wind speed (WS) information obtained from the NASA Prediction of Worldwide Energy Resources (POWER) database [63] over thirty years is given in Table 5. The wind data show that there is a great change in the wind speed reported from November to March of each year in the different locations. Observation of the wind speed information reveals that the minimum and maximum wind speeds are reported in different months due to distinctions in the geographical characteristics and climatic conditions of each site. The lowest wind speed recorded in Sokoto is 3.78 m/s (September), while those of Ikeja, Enugu, Port-Harcourt, Maiduguri, and Minna were obtained at 2.65 m/s (December), 2.83 m/s (November), 2.43 m/s (December), 3.96 m/s (September), and 2.75 m/s (October), respectively. Furthermore, the highest average wind speed values of 7.25 m/s (January), 4.9 m/s (August), 5.03 m/s (August), 4.0 m/s (August), 7.12 m/s (February), and 5.69 m/s (January) were reported in Sokoto, Ikeja, Enugu, Port-Harcourt, Maiduguri and Minna, respectively with a yearly average of 5.44 m/s, 3.81 m/s, 4.09 m/s, 3.15 m/s, 5.50 m/s, and 3.97 m/s, respectively.

3.3.2. Solar Power Resources

Nigeria lies between latitudes 4° and 14° N (slightly north of the equator), and longitudes 2° and 15° E (slightly east of the prime meridian). The whole country falls within an area where sunshine is plentiful. Due to its location, the country’s solar radiation is relatively well distributed, and the yearly daily mean varies from about 3.5 kWh/m2 in the coastal part to 7.0 kWh/m2 in the far northern part [64]. The solar irradiation details of the selected sites are again retrieved from the NASA POWER database (for a period of twenty-two years) [63] by specifying the coordinates of the selected zones for the planned installation of RE-based EV charging schemes. The changes in the monthly mean solar irradiation of the different locations are presented in Table 6. The annual average values of 6.24, 4.74, 4.93, 4.13, 5.90, and 5.49 kWh/m2/day were obtained for Sokoto, Ikeja, Enugu, Port-Harcourt, Maiduguri, and Minna, respectively. The corresponding minimum and maximum radiations of 5.25, 3.95, 3.91, 3.11, 5.14, and 4.36 kWh/m2/day at a clearness index of 0.64, 0.394, 0.381, 0.315, 0.491, and 0.419 and 7.15, 5.49, 5.74, 5.24, 6.7, and 6.26 kWh/m2/day at a clearness index of 0.678, 0.556, 0.58, 0.550, 0.661, and 0.611 were reported in various months. Moreover, the yearly mean air temperatures of 27.92, 25.92, 25.21, 25.59, 28.00, and 25.01 °C were reported for Sokoto, Ikeja, Enugu, Port-Harcourt, Maiduguri, and Minna for about 30 years [63] as depicted in Table 7.

3.4. Mathematical Representation and Specifications of the Hybrid System Components

3.4.1. Wind Turbine System

The detailed technical information of the considered wind turbine (WT) is given in Table 8, while its cost data are presented in Table 9 [44]. The Weibull k parameter is a measure of the long-period distribution of wind speed (WS) for a year, taken herein as 2. The diurnal pattern strength, specified as 0.25, is a measure of how strong WS depends on the daytime, while the 1 h autocorrelation factor in the HOMER Pro® software is a measure of the hour–hour randomness of WS, considered as 0.85. The hour of peak WS is taken as 15. The quantities of WTs needed to reliably satisfy the EV charging requirement at a low cost are optimized. The relationship between the output power and the WS is illustrated via the WT power curve in Figure 5. The mechanical power P m of the WT with regard to the air density ρ (1.22 kg/m3), surface area A swept by the rotor (m2), and velocity V are evaluated as:
P m = 1 2 × ρ × A × V 3
The electrical power P e in terms of the power coefficient C p is given as:
P e = 1 2 × ρ × C p × A × V 3 × 10 3 ,

3.4.2. Solar Photovoltaic System

In this study, the SunPower X21-335-BLK PV panel was selected due to its high efficiency. The details of the cost variables associated with the PV panel are given in Table 9. The mean efficiency of the solar panel is 21%. The technical specification of the solar photovoltaic is presented in Table 10 [41]. The panel has 96 monocrystalline cells at nominal power and operating cell temperature of 0.335 kW and 43 °C, respectively. The sizes of PV panels needed to efficiently meet the EV charge demand are optimized. The output power P P V of the PV module is analyzed in terms of the solar irradiation, de-rating factor, and temperature influence as follows [65]:
P P V = Y P V ƒ P V ( G T G T , S T C ) [ 1 + α P ( T C T C , S T C ) ]
where Y P V refers to the PV power output under standard test conditions (STC) in kW, ƒ P V represents the PV de-rating factor (%), G T is the solar radiation incident on the PV panel in the current time step (kW/m2), G T , S T C refers to the incident radiation under standard test conditions (1 kW/m2), α P is the temperature coefficient of power (%/degree Celsius), T C is the temperature of the PV cell (_C), and T C , S T C is the PV cell temperature at STC (25 degree Celsius) [42].

3.4.3. Battery System

The economic data and technical specifications, including the storage properties of the selected battery bank, are presented in Table 9 and Table 11 respectively. The string of the battery storage consists of 20 batteries per string. The maximum capacity of the battery is 408 Ah at a capacity ratio of 0.0699. The peak charge and discharge current are 74 A and 300 A at a maximum charge rate of 1 A/Ah. The SOCminimum value of 20% was considered in the study. The battery capacity C B a t is calculated by utilizing the daily load energy E L and autonomy days (AD) as stated in Equation (4) below [49,66]. The battery state of charge (SOC) S O C B ( % ) is determined as a percentage of the ratio of its charge q b to its maximum charge q b m using Equation (5) [67].
C B a t = E L A D η i n v D O D η b a t
where η i n v denotes inverter efficiency, DOD is the battery’s depth of discharge and η b a t refer to the battery efficiency.
S O C B ( % ) = q b q b m × 100

3.4.4. Converter

The converter keeps the flow of electric power between the alternating current (AC) link and direct current (DC) link devices. It converts the electrical power from DC to AC. In the inverter mode, it changes the electricity from DC to AC and from AC to DC while operating as a rectifier. The costs of the economic variables of the power converter are given in Table 9. The technical data of the selected converter are given in Table 12 [50]. The converter capacity level is obtained using:
C = ( 3 × L i ) + L r
Here, L i and L r refer to the inductive and resistive loads.

3.5. Evaluation Criteria

3.5.1. The Net Present Cost (NPC)

The NPC comprises the initial cost, cost of replacement of individual devices, operation cost, maintenance cost, etc. It is an economic variable used to assess the optimum system of different combinations of system configurations. The following equation is used to analyze the NPC (for convenience, denoted as C N P C ) [68]:
C N P C = T A C C R F ( i , N )
Here, the total annualized cost (USD/year) is denoted by TAC, N represents the number of years, and i refers to the yearly real discount rate in percent. The capital recovery factor (CRF) is calculated using Equation (8) below:
C R F ( i , N ) = i ( 1 + i ) N ( 1 + i ) N 1
The yearly real discount rate with regard to the anticipated inflation rate (ƒ) and nominal discount rate (i′) is obtained from Equation (9) below:
i = i f 1 + f

3.5.2. The Cost of Energy (COE)

The COE is defined as the mean cost per unit of effective electricity generated by the system configuration [69] over the system’s whole lifespan. The COE is computed with regard to the total annualized cost (USD/year) (TAC) and total annual load (kWh) served by the system (Eanloadserved) as:
C O E = T A C E a n l o a d s e r v e d

3.5.3. The Renewable Fraction (RF)

The RF is the gross amount of electricity produced by sustainable resources compared to the gross energy generated from the whole hybrid EV charging scheme [70]. The RF is computed with regard to the output power of the sustainable resources as illustrated below:
R F ( % ) = ( 1 P d i e s e l P r e n ) × 100

3.5.4. The Unsatisfied Load

The unsatisfied load is the electric charging load that the hybrid EV charging station system model cannot fulfill. This occurs when the load requirement is greater than the electric supply. The unfulfilled load is computed as a ratio of the annual non-served load to the gross annual demand as given below [67]:
Unfulfilled   load = Annual   Non served   Load Annual   Entire   Load

4. Results Analysis and Discussion

In this study, an EV charging scheme based on renewable energy resources and storage devices is designed and analyzed using the HOMER Pro® software. The simulation software utilizes the GPDO techniques to secure the most economically feasible system configurations that can sufficiently supply the EV charging demand. Nigeria is divided into six geo-political zones with different meteorological features, and the renewable energy resources are weather dependent. Therefore, to conduct a more comprehensive investigation and to have a detailed overview of the operational performance of the proposed system, six different locations, each from one of the six geo-political regions, are considered. Furthermore, three different combinations of energy sources with storage systems were investigated for the hybrid EV charging station system in the six sites.

4.1. Load Data Estimation

In this study, the electric load analyzed is implemented under hypothetical states. The load profile of small-scale charging stations for the six locations is illustrated in Figure 6. The demand profile of the EV charging schemes is forecasted due to the small number (below 10 charging points) of EVCSs presently installed in Nigeria at the moment. According to the hypothetical daily, seasonal and annual load description of the selected six locations, about 20–30 EVs can be charged in a station. In the morning till the afternoon, between 06:00 and 16:00, up to 20 EVs can be recharged at an average load of 80 kW, whereas the hybrid charging scheme can provide energy to charge about 10 EVs averaged at 40 kW in the latter hours of the day from 16:00 until 22:00. The daily capacity of each EV was assumed to be 35 kWh of battery energy; therefore, the total average and peak load demand of 30 EVs is 1050 kWh/day and 104.99 kW at a load factor of 0.42. To establish an accurate estimation of the highest demand and depict a realistic load requirement of the proposed charging system, a time-step and day-to-day random variability of 10% and 5% were used in the EV load data analysis.

4.2. Performance Assessment of the Proposed Charging Station Schemes

The economic and technical outcomes, including the optimum component sizes of different feasible charging station models in the six considered sites, are illustrated in Table 13 and Table 14. The combination of PV and WT with battery storage is economically the best system architecture for the charging station in all six sites. It is clear from Table 13 that the PV/WT/battery charging station had the least energy cost in all the simulated sites. The COE and NPC are also very competitive, even if it is difficult to install WT in the considered locations, as seen with the PV/battery charging station scenario. However, the unavailability of a PV system in the PV/WT/battery design architecture is not economically viable, as indicated in the case of the WT/battery changing station, which has the maximum NPC and COE values of USD3,318,763 and USD1.28/kWh in the Port-Harcourt site. In general, the PV/WT/battery charging station (2 qty. of WT, 174 kW of PV panels, 380 qty. of batteries storage, and a converter of 109 kW) in Sokoto provide the best economic metrics with the lowest NPC, electricity cost, and initial costs of USD547,717, USD0.211/kWh, and USD449,134, respectively. Moreover, the charging station presented competitive annual operating and maintenance costs of USD14,344 and USD67,195.
The wind energy-based charging stations in all the case study sites had the highest operating and maintenance costs because of the large number of WTs needed to fulfill the EV charging requirement. Most of the WTs need maintenance once every two years at the minimum. Therefore, the maintenance of the key parts of the WTs by carrying out tasks such as turbine inspecting, lubricating, repairing, and cleaning also contributed to high maintenance costs. The optimal charging station (PV/WT/battery in Sokoto) model had the lowest PV Levelized cost (USD0.118/kWh) with a competitive WT Levelized cost (USD0.0594/kWh). The battery wear cost is constant at USD0.1/kWh throughout the simulated year in all the sites considered.
Furthermore, according to Table 14, the highest and lowest values of the maximum penetration of renewables were reported in Minna and Sokoto. Therefore, the maximum total annual electricity is produced at 2,204,533 kWh by the WT/battery-based charging station in Minna, whereas the minimum is generated at 495,306 kWh in Sokoto by the PV/battery charging station at a capacity shortage of only about 2%. The PV/WT/battery CS at the Sokoto site was able to reliably satisfy most of the EV charge demand as it presented a small percentage of the unmet load of 1.38%, which is the lowest when compared with the corresponding values of the other charging stations. Moreover, the optimal charging station schemes in all six locations were able to sufficiently meet the EV demand with a maximum uptime as the percentages of the unfulfilled electric load were below 2% with a capacity shortage of only approximately 2%.
The monthly electric generation by the PV/WT/battery-based charging station in the six case study sites is illustrated in Figure 7. Generally, the solar PV panel generated most of the electricity needed to meet the EV charging requirement in Ikeja, Port-Harcourt, and Minna as compared to the WT production. However, in Ikeja and Port-Harcourt, the WT electric production was only competitive between June and September. The overall energy production (from both PV panel and WT) in Sokoto and Maiduguri were low from April until October. The total electric production started to increase in November and maintained a continuous maximum value until March. The gross monthly electricity generated in Enugu maintained a constant value for the whole of the simulated year, with the highest production reported in July and August. Furthermore, the annual electricity production of the optimal charging station schemes (PV/WT/battery) in the case study sites is illustrated in Figure 8, where the highest excess electricity and gross electric energy is produced in Sokoto due to the enormous presence of RE resources. The surplus electricity can be sold directly to the utility grid via a CS-to-grid connection. Moreover, since the proposed charging stations are located in cities/urban areas, this will facilitate any future connection of the charging stations to the grid network to enable the buy/sell electricity approach.
In addition, Figure 8 reveals that the maximum PV production (506,181 kWh/year) is encountered in Minna, while the Maiduguri site reported the minimum PV generation at 319,137 kWh/year. The Maiduguri site recorded the highest annual electricity production from WT at 348,860 kWh, whereas a small yearly minimum value of about 73,484 kWh from the WT was reported in the Minna site. The environmental benefit of the proposed EV charging stations is that there is no carbon footprint and there is zero greenhouse gas while other harmful emissions are mitigated. This kind of system can be used to facilitate the global adoption of electric vehicles, which are often used to support economic decarbonization. Moreover, the provision of EV charge demand via the utilization of freely and readily available renewable energy resources will help to effectively promote the use of EVs as a mechanism to bring about a green solution in the transportation sector.
The optimal EVCS system designed in this study is further compared with the results of the existing EVCS designs for diverse application places using various simulation tools and approaches in the literature. The different combinations of energy resources and storage equipment and the economic and environmental results are presented in Table 15. Observation of the outcomes of the various studies revealed that the net present cost ranges approximately between USD21,000 and USD3,580,000, while the energy cost varies between about USD0.06/kWh and USD0.90/kWh. For comparison, the NPC and COE of the optimal EVCS system obtained in this study are USD547,717 and USD0.211/kWh, respectively. This provides evidence that the proposed standalone EVCS system presented herein is acceptable and possesses competitive economic metrics when compared with the previously published EVCS systems shown in Table 15. As regards the environmental benefits of the proposed standalone EV charging station, the majority of the existing works presented in Table 15 reported some non-negligible figures for greenhouse gas emissions. This highlights the drawbacks of some of the previously designed EVCS systems in terms of environmental preservation from carbon emissions. This study is claimed to be environmentally friendly indeed, as it presents no greenhouse gas emissions (i.e., no carbon footprint) whatsoever. This could facilitate the decarburization of the economy via the adoption of electric vehicles by providing fully renewable energy charging points for EVs in different parts of the country.

4.3. Sensitivity Evaluation

The sensitivity assessment was conducted in this analysis to examine the effect of some important variables on the technical and economic performance of the PV/WT/battery charging system in Sokoto. The sensitivity analysis was investigated and discussed via the variation of key system variables. Sensitivity evaluation is capable of identifying the most important variables of an investment due to the possibility of knowing in advance the effect of input parameters with uncertainty on the system cost variables and can be utilized in different contexts as well as in the assessment of investment projects [61]. The wind speed, solar radiation, battery energy storage minimum state of charge (BES SOCmin), maximum yearly capacity shortage, and EV charge demand varied at different minimum and maximum levels with respect to the base value, as sensitivity variables are shown in Table 16. The techno-economic impact of the sensitivity variables on the PV/WT/battery-based charging scheme in the Sokoto site is further elucidated below.

4.3.1. Economic Impact of Sensitivity Variables

The influence of the sensitivity parameters on the cost of the charging station in Sokoto is discussed in this section. The examined economic metrics of the optimal EV charging scheme are the NPC and COE. The overall outcome of the investigations shows that the economic parameters change with the variation in the value of the sensitivity variables. For instance, in Figure 9, the NPC of the charging scheme rises from USD288,592 to USD864,954 when the EV charge demand rises from 550 kWh/day to 1600 kWh/day. During this process, the cost of electricity remains unstable as it alternates around USD0.212/kWh. Nonetheless, the minimum COE value was realized at USD0.208/kWh when the EV load reached 1500 kWh/day, whereas the maximum COE value was obtained at USD0.218/kWh as the load rose further to 1600 kWh/day. It can be observed here that the charging station becomes more economically unattractive as the number of EVs increases. However, the system at some certain load demand would become economically feasible.
The effect of wind speed change on the system costs of the charging scheme in Sokoto (Figure 10) reveals that both the NPC and the COE experience a cost drop as the wind speed at the selected location increases. The COE, for example, reduces from USD0.273/kWh to USD0.138/kWh, while the NPC reduces from USD708,751 to USD360,653 as the wind speed rises from 2 m/s to 8.8 m/s. This means that the NPC and the COE decreased by about 47.1% and 47.2%. Similarly, it is clear from the influence of solar radiation change on the economic viability of the charging station depicted in Figure 11 that both the NPC and COE decrease due to a rise in the values of solar irradiation. It is clear from the results that with more renewable energy resources penetration, the charging station will become more economically competitive and will provide more cost benefits to both the developers and the users as the economic feasibility status has improved.
Furthermore, the effect of varying the battery SOCminimum on the NPC and the electricity cost of the charging station in Sokoto has illustrated in Figure 12. The increase in the value of this sensitivity variable resulted in a rise in the values of the NPC and the COE. The NPC increases from USD541,550 to USD612,854, and the COE rises from USD0.208/kWh to USD0.236/kWh as the battery minimum state of charge rises from 5% to 60%. Increasing the battery’s minimum state of charge, therefore, makes the charging station more expensive, which could create difficulties during the development and installation phase as the initial capital cost and the NPC increase due to this impact.
Finally, the change in the maximum annual capacity shortage and EV charge demand on the total NPC and the cost of electricity of the optimum EV charging scheme is depicted in Figure 13. At a particular value of the load demand, the rise in the percent value of the capacity shortage causes a reduction in the NPC and the COE values of the charging system. It is clear from the chart interface that the NPC reduces from USD730,640 to USD442,148, while the electricity cost, on the other hand, reduces from USD0.292/kWh to USD0.185/kWh as the capacity shortage increases from 0% to 8%. This has indicated that the increase in the capacity shortage can enhance the economic feasibility of the EV charging station. However, this can also create some reliability issues for the system as the charging system might not be able to adequately meet some charge demand of some EVs.

4.3.2. Technical Impact of Sensitivity Variables

The influence of sensitivity variables on the technical performance behavior of the optimum EV charging station is investigated via the excess electricity and unmet electric load. The overall results show that the excess energy and the unmet load are sensitive to the change in wind speed, solar radiation, battery minimum state of charge, capacity shortage, and EV charge demand. The effect of variation in the EV charge demand on the excess energy and unmet load of the optimal charging station in Sokoto (Figure 14) reveals that the annual unmet load rises from 2823 kWh to 7623 kWh when the daily charging station load increases from 550 kWh to 1600 kWh. The excess electricity, on the other hand, remains constant at certain numbers of EVs before varying around 250,000 kWh/year. Its minimum value (125,123 kWh/year) was obtained at 900 kWh daily load, while its maximum value of 480,473 kWh/year was achieved when the daily EV load peaked at 1600 kWh. We can deduct from this that the greater the number of electric vehicles, the less reliable the charging system becomes.
Figure 15 illustrates the effect of wind speed change on the technological performance of the optimal charging scheme. The unmet load decreases from 5588 kWh/year to 4612 kWh/year when the average wind speed rises from 2 m/s to 8.8 m/s. In the beginning, the excess energy maintains a constant minimum value before a slight fluctuation occurs around 200,000 kWh/year. The wind speed range of 2–4 m/s gives the lowest annual excess energy of 68,133 kWh, while the highest annual excess electricity of 483,326 kWh is obtained at 8.8 m/s. The excess energy and the unmet load experience fluctuation due to the impact of the solar radiation variation, as shown in Figure 16. The unmet load fluctuates around 5200 kWh/year, while the excess energy varies around 260,000 kWh/year. The annual value of the excess energy and unmet load decreases from 371,453 kWh to 132,401 kWh and from 5191 kWh to 4848 kWh when the solar irradiation rises from 2.7 to 10.2 kWh/m²/day. This indicates an improvement in the EV charging station utility as the system becomes able to meet more EV demand.
Figure 17 illustrates the impact of changing the battery SOCmin value on the technological performance of the optimum charging system. The figure shows that the yearly excess energy increases from 147,256 to 317,796 kWh, whereas the annual unmet load reduces from 5140 kWh to 4884 kWh when the battery SOCmin increases from 5% to 60%. Finally, the chart interface showing the variation in the EV load and the capacity shortage (Figure 18) reveals that at a certain EV load and when the capacity shortage rises from 0 to 8%, the annual unmet load rises from 286 kWh to 18,151 kWh, while the excess electricity in this condition increases from 59,135 kWh/year to 210,334 kWh/year. It can be deduced from the outcomes that increasing the capacity shortage would lower the utility of the optimal charging scheme.

5. Conclusions

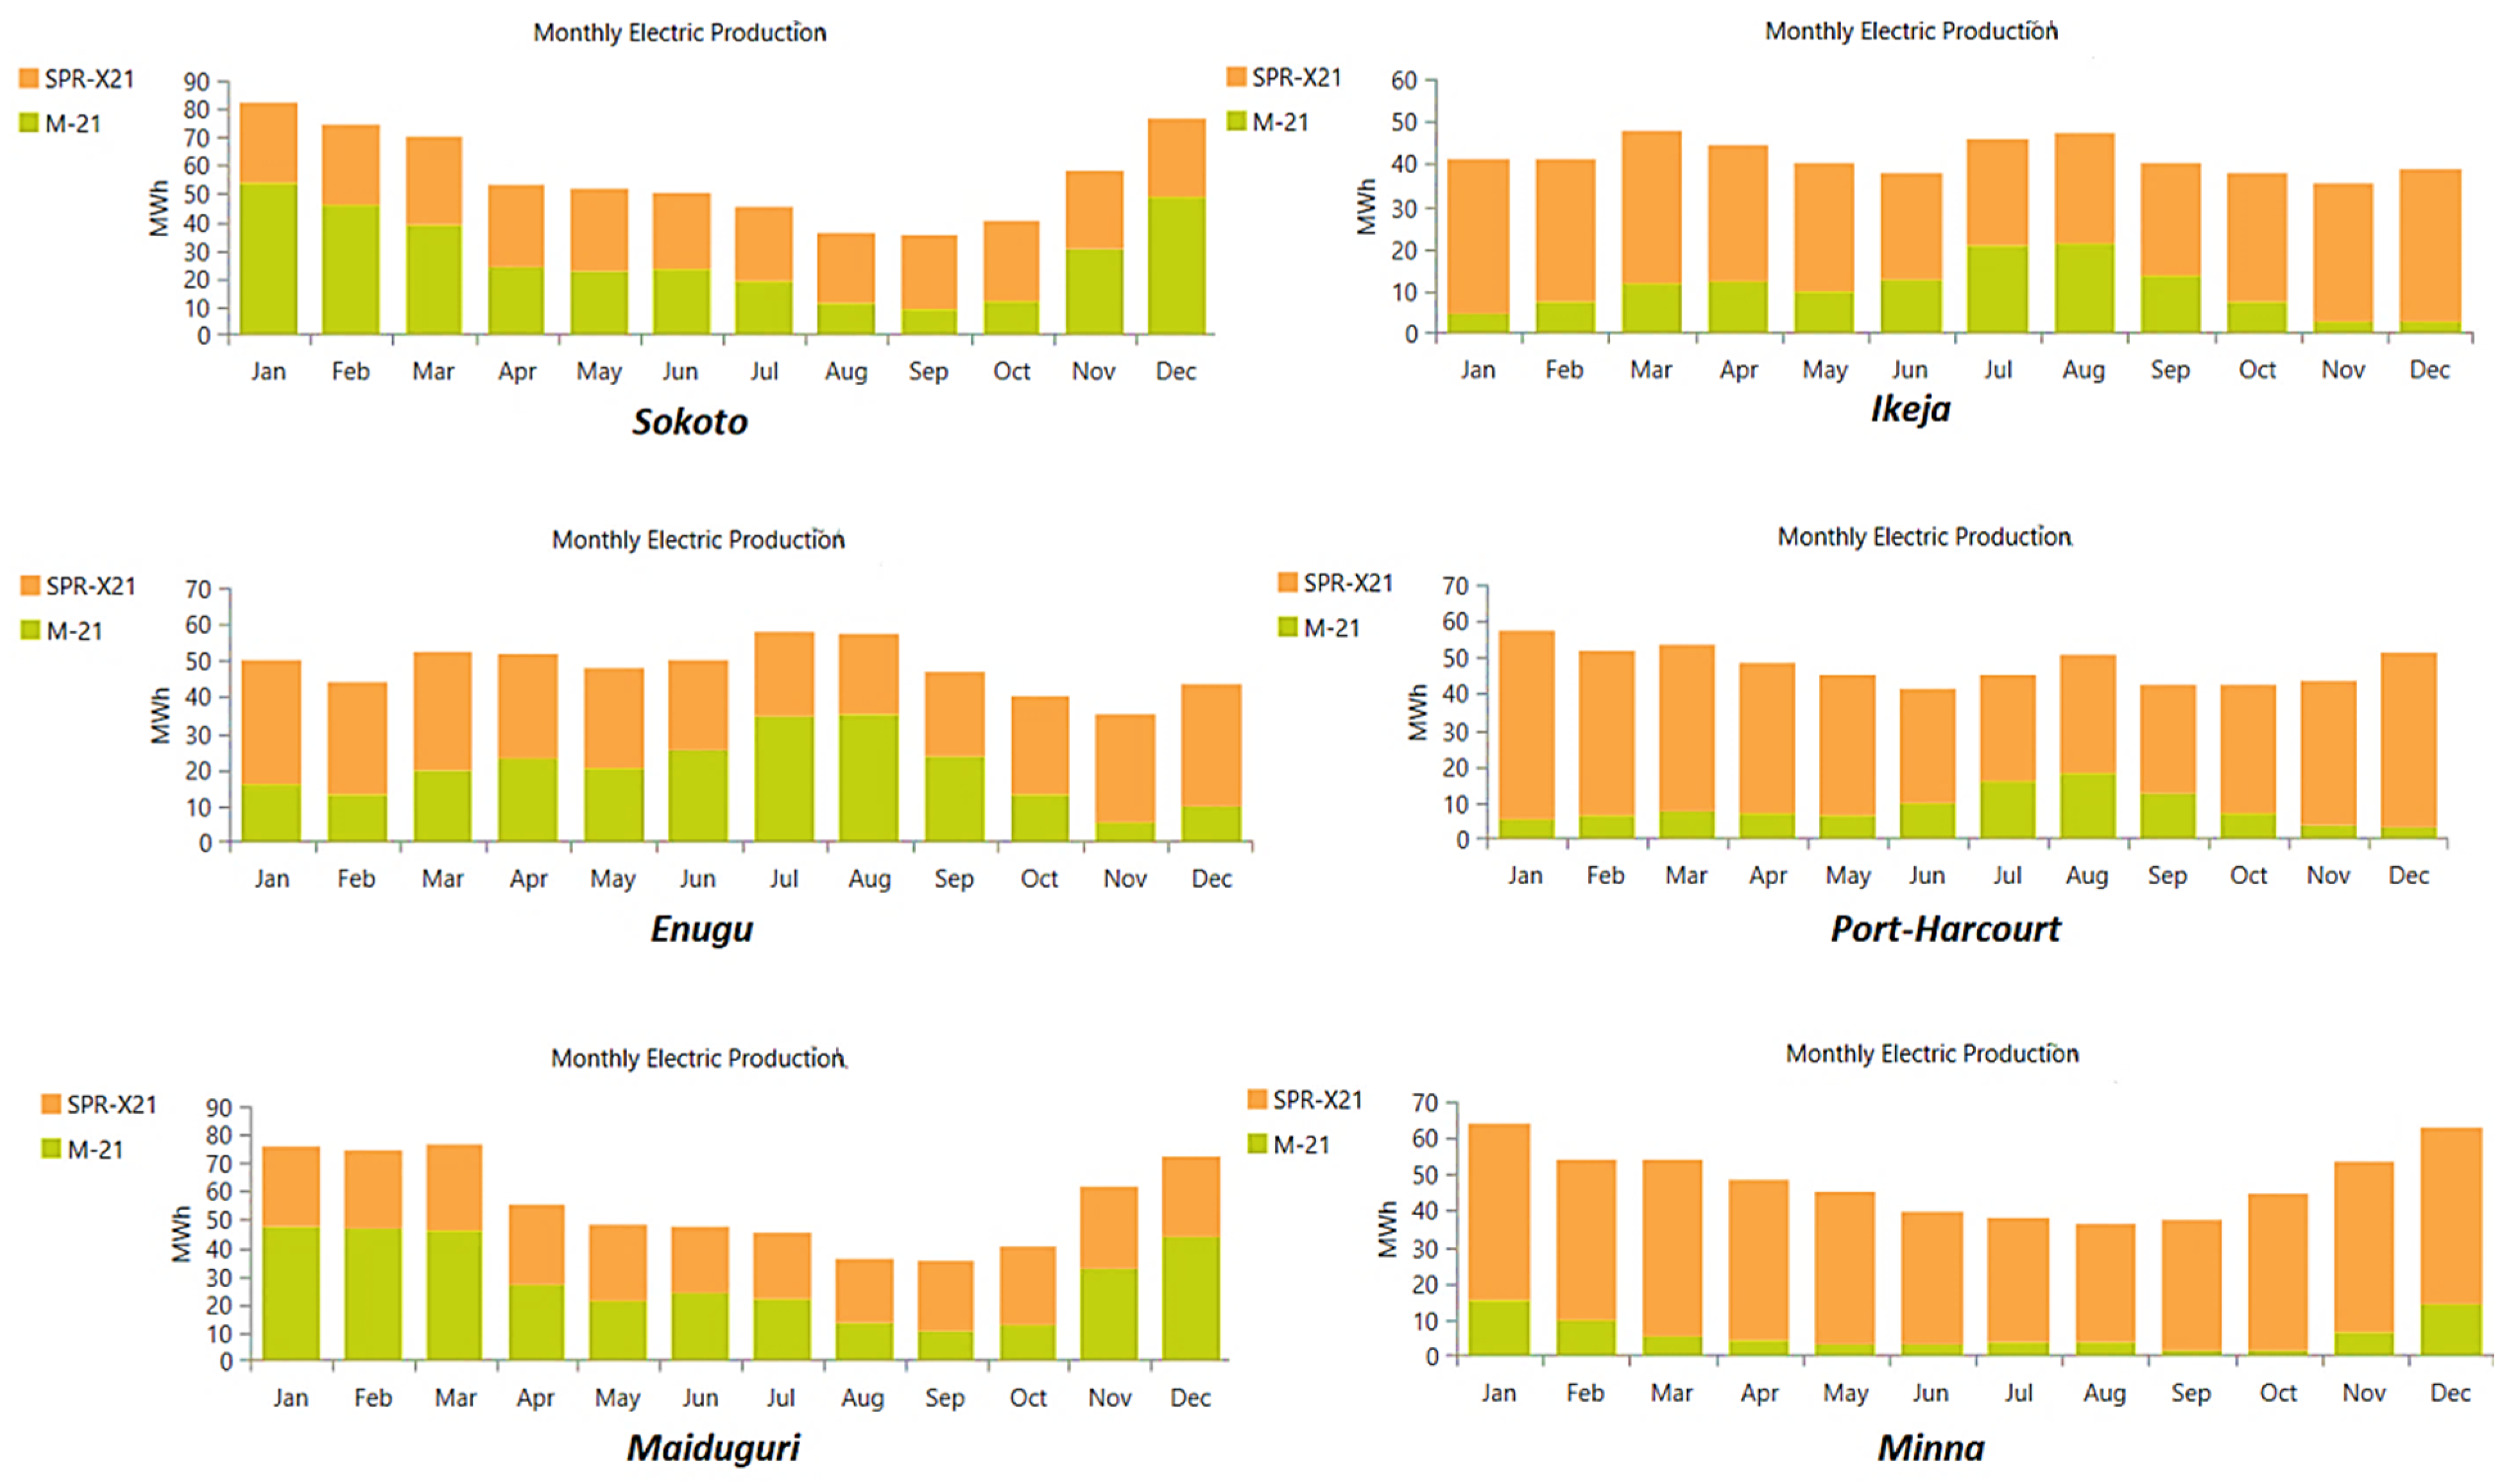
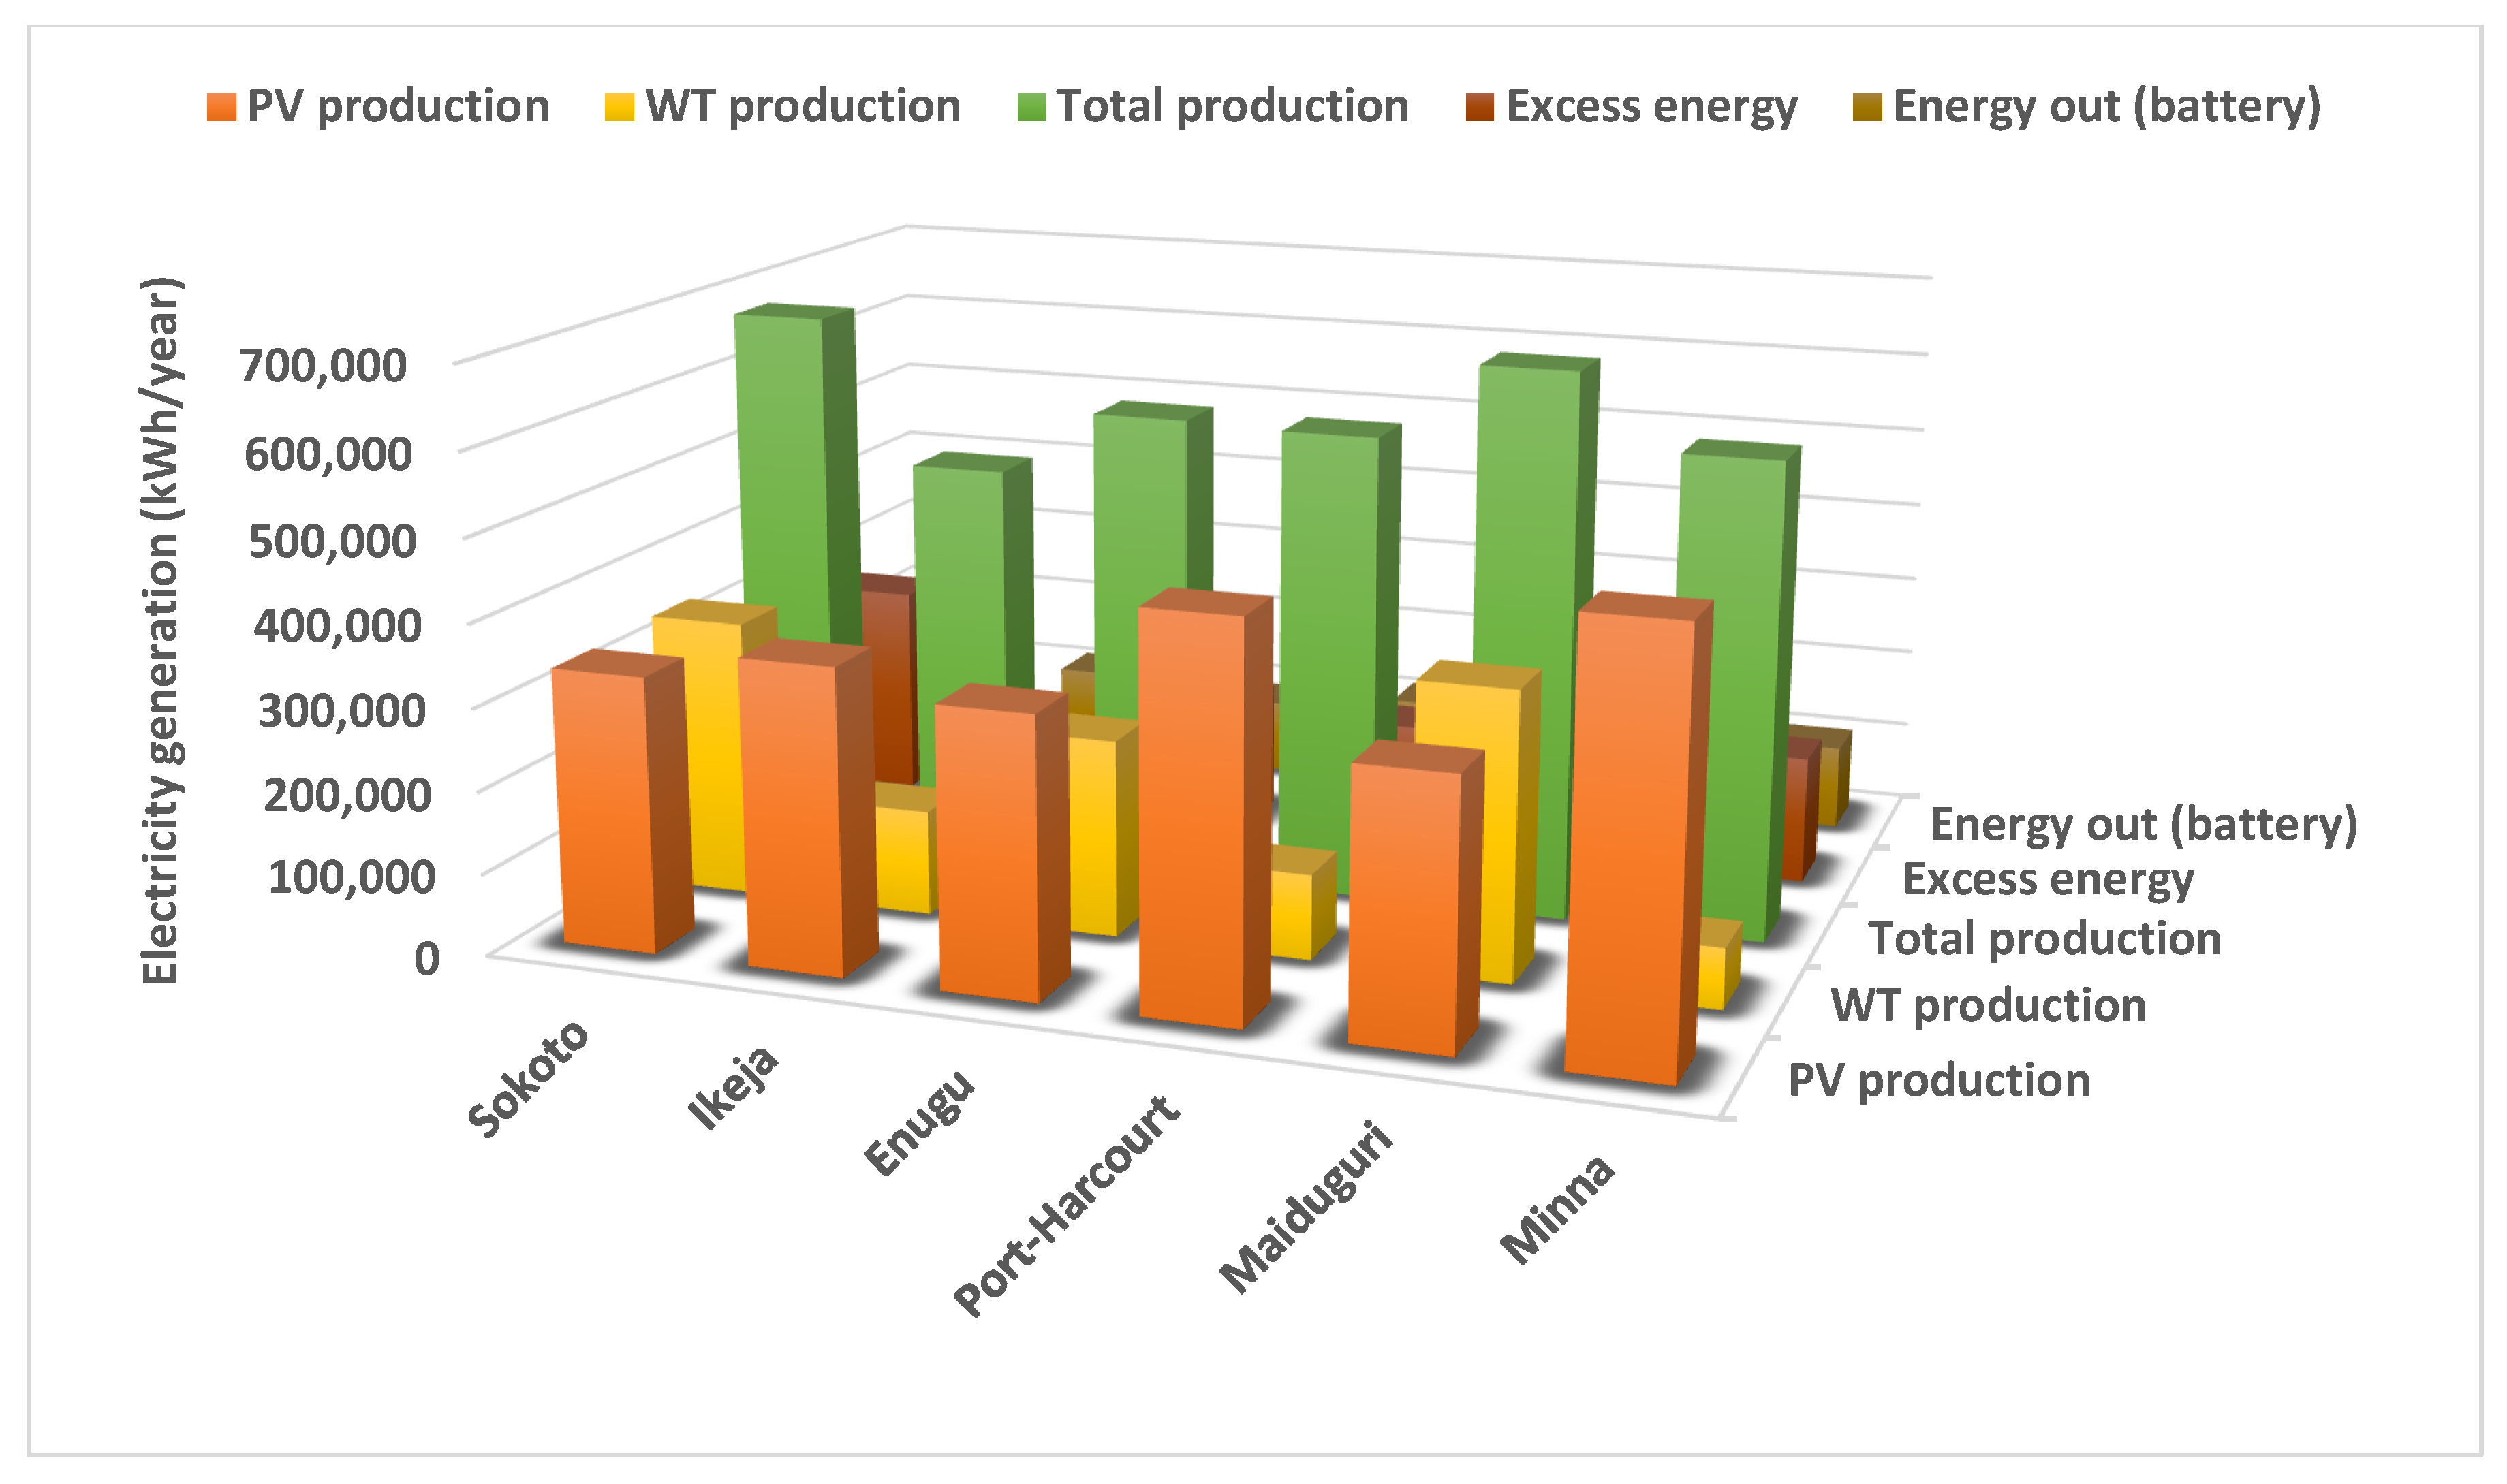
This paper has investigated the feasibility of EV charging stations based on RE sources in Nigeria using the HOMER optimization software by considering six different locations with diverse geographical characteristics and climatic conditions. The hybrid charging station system is configured by solar and wind resources with storage devices to charge about 20–30 EVs with a daily capacity of 35 kWh each and applied in different locations in Nigeria, namely, Sokoto, Minna, Port-Harcourt, Enugu, Maiduguri, and Ikeja. The annual average solar radiations and wind speeds used to investigate the optimum hybrid system are 6.24, 4.74, 4.93, 4.13, 5.90, and 5.49 kWh/m2/day and 5.44, 3.81, 4.09, 3.15, 5.50 and 3.97 m/s for Sokoto, Ikeja, Enugu, Port-Harcourt, Maiduguri and Minna, respectively. The feasibility of the hybrid charging station system is assessed by using appropriate technical performance indicators, namely, unmet electric load, capacity shortage, excess electricity, monthly electric generation, individual system components electric production, battery energy out, and maximum renewable penetration, as well as pertinent economic performance indicators, namely, NPC, COE, operating cost, initial capital cost, the battery wear cost and Levelized cost of system components.
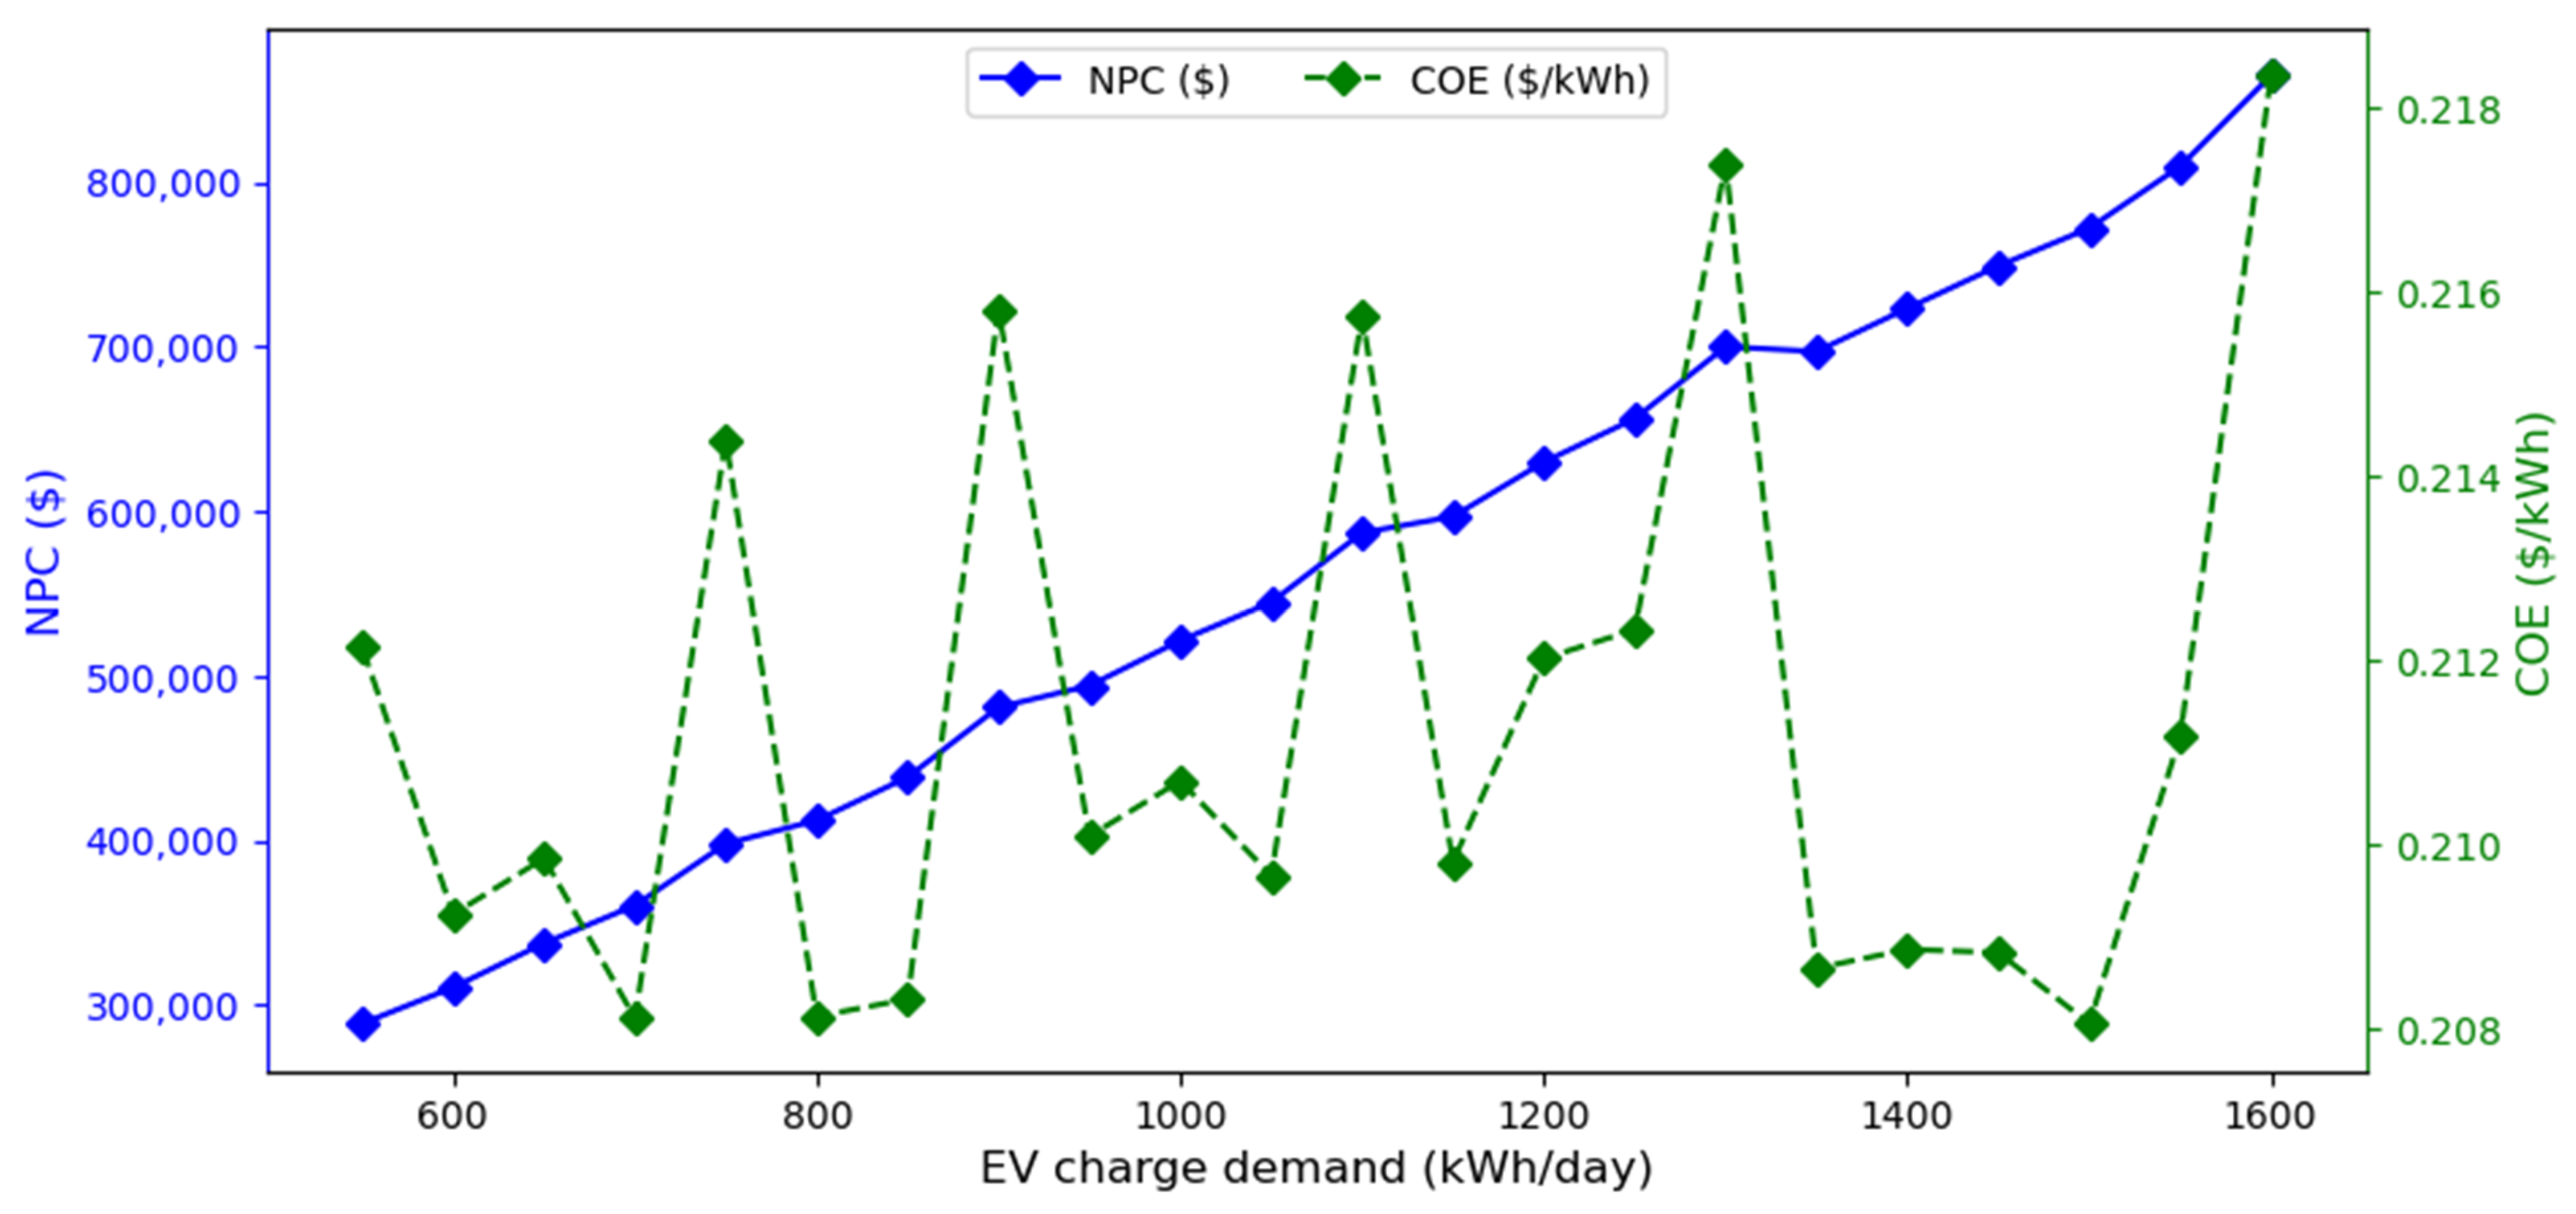
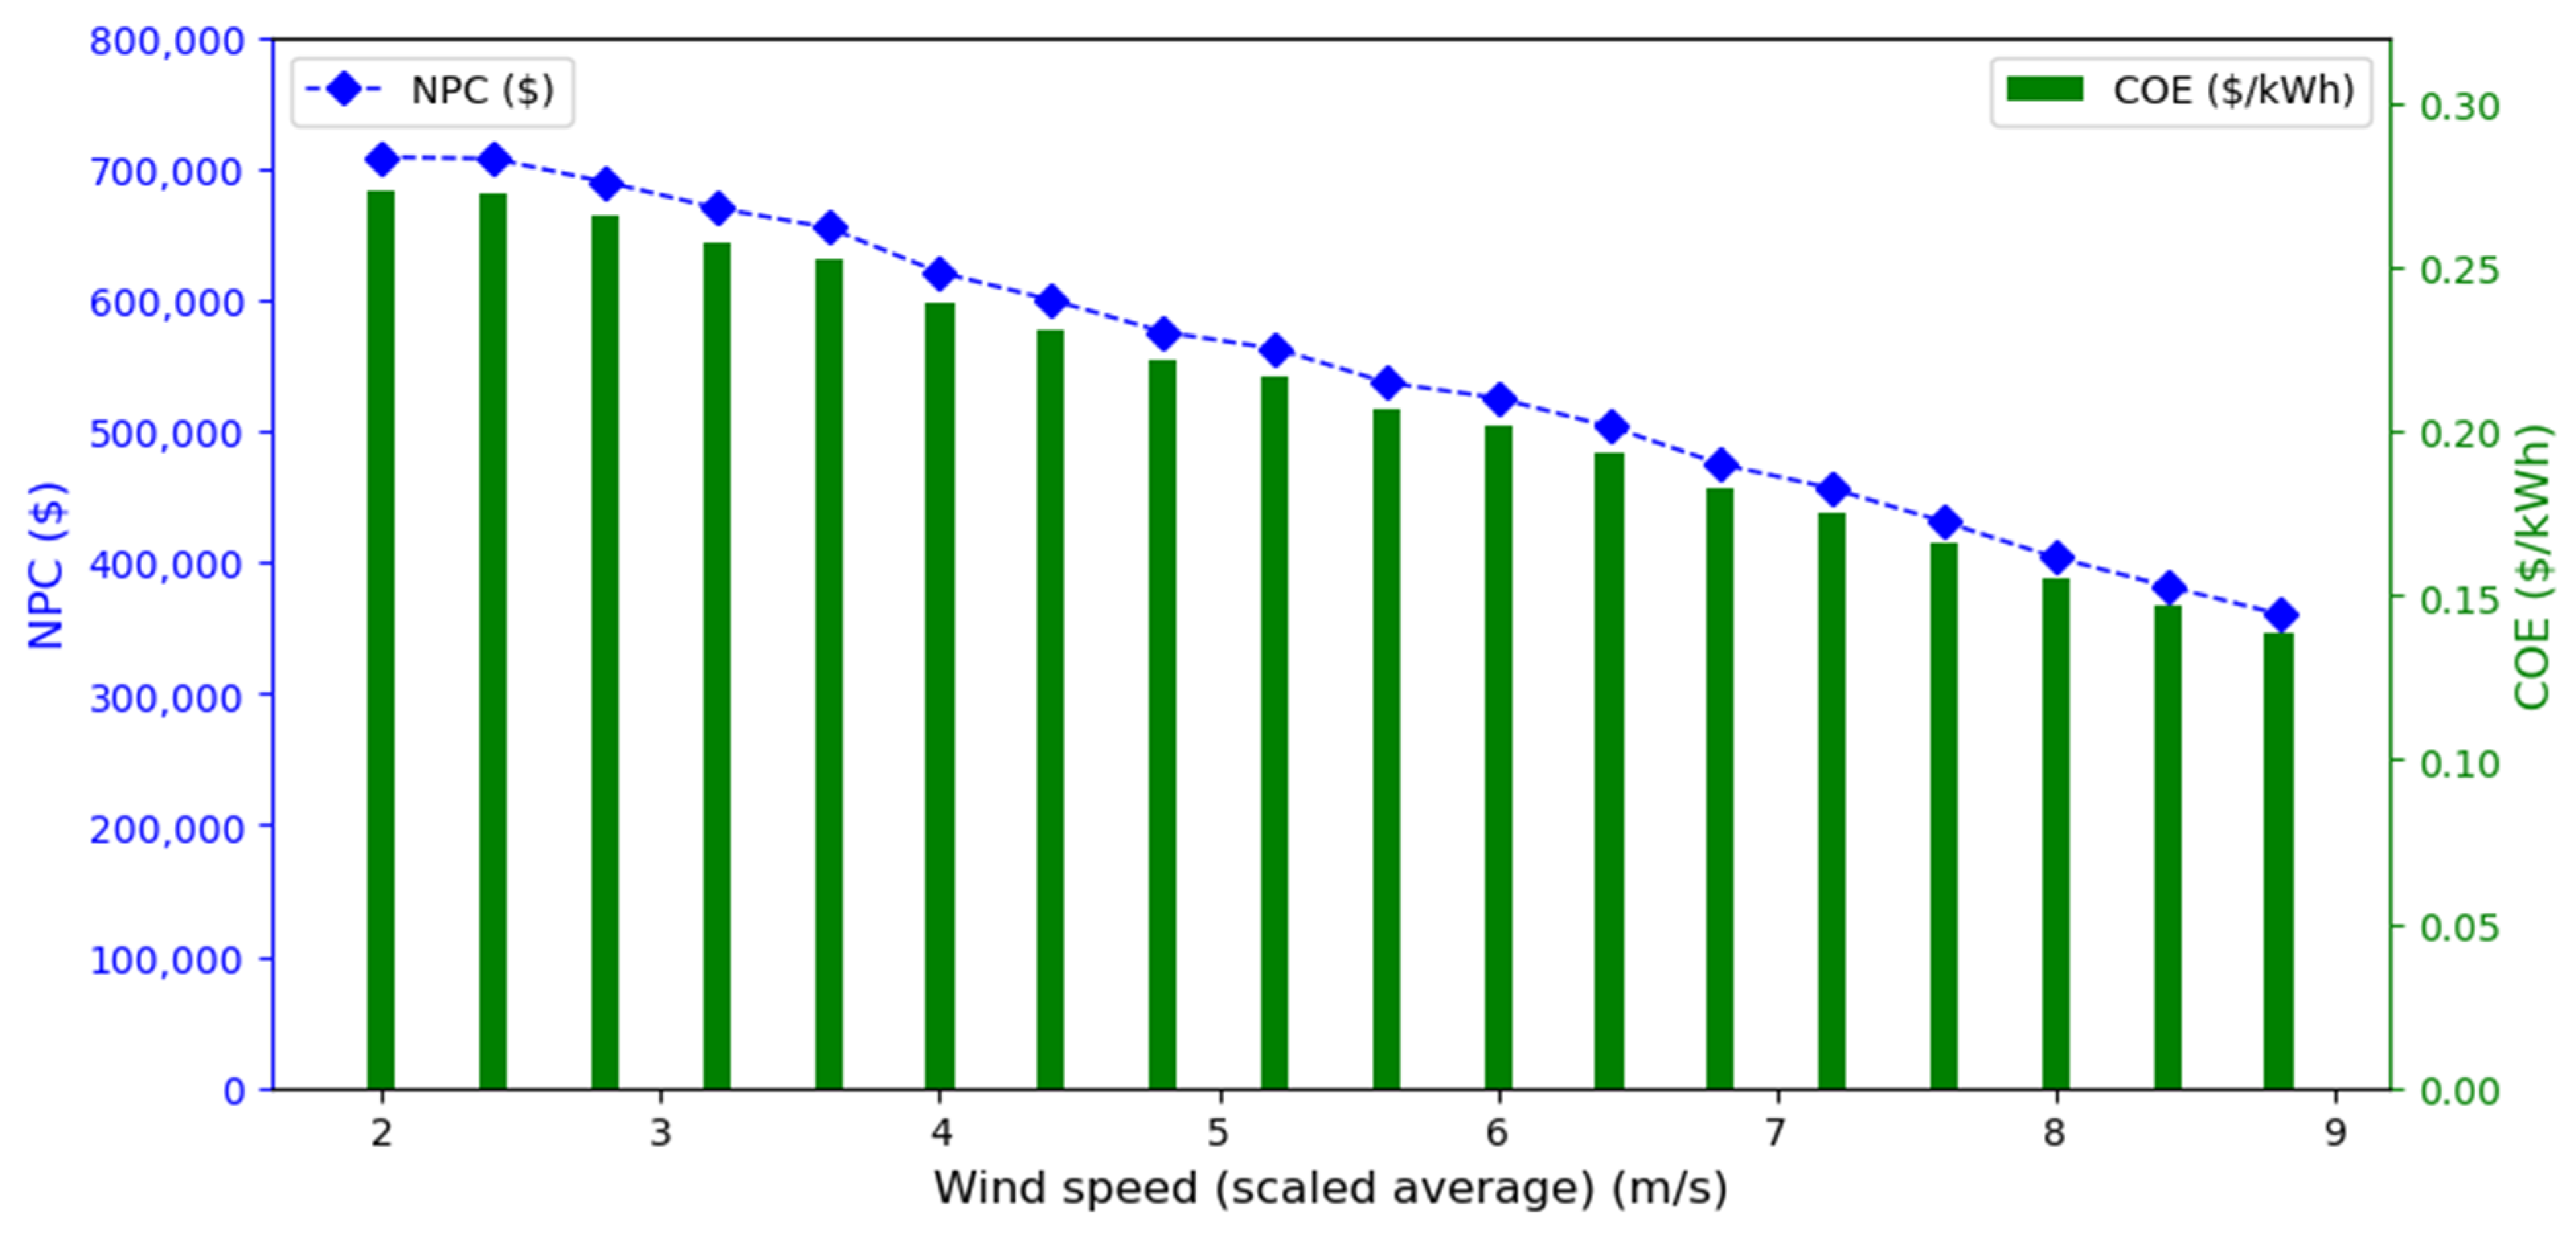
The optimization results showed that the combination of PV and WT with battery storage is economically the best system architecture for a charging station in all six sites. The PV/WT charging scheme integrated with battery storage had the least energy cost of all the simulated sites. The COE and the NPC are also very competitive even when it is difficult to install WTs in the considered locations, as seen with the PV/battery charging station scenario. However, the unavailability of a PV system in the PV/WT/battery system architecture is not economically feasible, as indicated in the case of the WT/battery charging station, which has the maximum NPC and COE values of USD3,318,763 and 1.28 USD/kWh in Port-Harcourt site. In general, the PV/WT/battery charging station (2 qty. of WT, 174 kW of PV panels, 380 qty. of batteries storage, and a converter of 109 kW) in Sokoto provides the best economic metrics with the lowest NPC, energy cost, and initial capital costs of USD547,717, USD0.211/kWh, and USD449,134, respectively. Moreover, the charging station presented competitive annual operating and maintenance costs of USD14,344 and USD67,195. The PV/WT/battery CS at the Sokoto site was able to reliably satisfy most of the EV charge demand as it presented a small percentage of the unmet load of 1.38% (In fact, the lowest when compared with corresponding values for the other charging stations). Moreover, the optimal charging station schemes in all six locations were able to sufficiently meet the EV demand with maximum uptime as the percentages of the unfulfilled electric load were below 2% with a capacity shortage of only approximately 2%. The surplus energy produced can be sold directly to the utility grid via a CS-to-grid connection. Moreover, since the proposed charging stations are located in cities/urban areas, this will facilitate any future connection of the charging stations to the grid network to enable the buying/selling electricity approach. The sensitivity analysis conducted to check the robustness of the optimal charging scheme reveals that the technical and economic performance indicators of the optimum charging station are sensitive to the changes in the sensitivity variables.
Furthermore, the outcomes ensure that the hybrid system of RE sources and EVs can minimize carbon and other pollutant emissions. As for further research, the feasibility of the hybrid charging station system can be investigated by considering distributed generation and load uncertainties. The major limitation of this study is the high initial investment cost needed to install the proposed charging system in the suggested locations. This is often the major obstacle that hinders the widespread use of a standalone renewable energy-based system in most parts of the world, particularly those parts with limited finances, such as most countries in Africa. However, with the recent technological breakthrough in renewable energy technologies as well as the numerous initiated governmental economic programs, this obstacle could be surmounted in the near future.

Author Contributions

J.O.O.: Conceptualization, Methodology, Validation, Formal analysis, Software, Investigation, Resources, Data curation, Writing—original draft preparation and editing. A.M.: Investigation, Writing—review, and editing, Validation, Resources. A.A.I.: Investigation, Writing—review, and editing, Validation, Resources. A.M.R.: Writing—review and editing, Investigation, Validation, Data curation, Visualization. All authors have read and agreed to the published version of the manuscript.

Funding

This research received no external funding.

Data Availability Statement

Not applicable.

Conflicts of Interest

The authors declare no conflict of interest.

References

  1. Huda, M.; Koji, T.; Aziz, M. Techno Economic Analysis of Vehicle to Grid (V2G) Integration as Distributed Energy Resources in Indonesia Power System. Energies 2020, 5, 1162. [Google Scholar] [CrossRef] [Green Version]
  2. Ganapaneni, S.; Pinni, S.V.; Reddy, C.R.; Aymen, F.; Alqarni, M.; Alamri, B.; Kraiem, H. Distribution System Service Restoration Using Electric Vehicles. Energies 2022, 15, 3264. [Google Scholar] [CrossRef]
  3. International Energy Agency. Nigeria Energy Outlook. Available online: https://www.iea.org/articles/nigeria-energy-outlook (accessed on 28 October 2021).
  4. Bank, T.W. The World Bank in Nigeria. Available online: https://data.worldbank.org/indicator/EG.ELC.ACCS.ZS?end=2019&locations=NG&start=1990&view=chart (accessed on 31 October 2021).
  5. EnerData. Nigeria Energy Information. Available online: https://www.enerdata.net/estore/energy-market/nigeria/ (accessed on 17 July 2022).
  6. Green Environment& Energy Conservation Initiative. Energy Consumption in Transport Sector in Nigeria. Available online: https://geeci.org/html/news/energy-transport-nigeria.html (accessed on 19 September 2022).
  7. Alade, B. FG to Incorporate Electric Vehicles in Revised NAIDP. Available online: https://guardian.ng/features/fg-to-incorporate-electric-vehicles-in-revised-naidp/ (accessed on 2 November 2021).
  8. Daka, T. Osinbajo Unveils First Made-in-Nigeria Electric Car. Available online: https://guardian.ng/news/osinbajo-unveils-first-made-in-nigeria-electric-car/ (accessed on 1 November 2021).
  9. Ajimotokan, O. Stallion Motor Unveils Nigeria’s First Electric Car in Abuja. Available online: https://www.thisdaylive.com/index.php/2021/02/06/stallion-motor-unveils-nigerias-first-electric-car-in-abuja/ (accessed on 1 November 2021).
  10. JET Motor Company. Heralding the African Electric Future. Available online: https://www.jetmotorcompany.com/jet-mover-ev/ (accessed on 3 November 2021).
  11. Onu, E. Chinese Parts Help JET Motor Assemble First EV Vans in Nigeria. Available online: https://www.bloomberg.com/news/articles/2021-07-29/chinese-parts-help-jet-motors-assemble-first-ev-vans-in-nigeria (accessed on 3 November 2021).
  12. Idajili, A. Meet the JET EV, Nigeria’s First Electric-Powered van by Jet Motor Company. 2021. Available online: https://www.techcityng.com/meet-jet-ev-nigerias-first-electric-powered-van-by-jet-motor-company/ (accessed on 3 November 2021).
  13. Echewofun, S.; Aliyu, A.; Ugwuezuoha, Y. FG Commissions Solar-Powered Charging Station for Electric Vehicles. Available online: https://dailytrust.com/fg-commissions-solar-powered-charging-station-for-electric-vehicles (accessed on 3 November 2021).
  14. Vanguard. NADDC Inaugurates 1st Nigeria Electric Vehicle Charging Station in Sokoto. Available online: https://www.vanguardngr.com/2021/04/naddc-inaugurates-1st-nigeria-electric-vehicle-charging-station-in-sokoto/ (accessed on 1 November 2021).
  15. Odunsi, W. Nigerian Govt Commissions Electric Vehicle Charging Station in Lagos. Available online: https://dailypost.ng/2021/07/13/nigerian-govt-commissions-electric-vehicle-charging-station-in-lagos/ (accessed on 1 November 2021).
  16. Olisah, C. Sanwo-Olu Launches Nigeria’s First Electric Car, to Complete Lagos-Badagry Expressway. Available online: https://nairametrics.com/2020/11/13/sanwo-olu-launches-nigerias-first-electric-car-to-complete-lagos-badagry-expressway/ (accessed on 1 November 2021).
  17. Alade, B. GIG Logistics, Jet Motor Partner on Electric Vehicles. Available online: https://guardian.ng/features/gig-logistics-jet-motor-partner-on-electric-vehicles/ (accessed on 3 November 2021).
  18. Singh, S.; Chauhan, P.; Singh, N.J. Feasibility of Grid-Connected Solar-Wind Hybrid System with Electric Vehicle. J. Mod. Power Syst. Clean Energy 2021, 9, 295–306. [Google Scholar] [CrossRef]
  19. Aliyu, A.K.; Modu, B.; Tan, C.W. A Review of Renewable Energy Development in Africa: A Focus in South Africa, Egypt and Nigeria. Renew. Sustain. Energy Rev. 2018, 81, 2502–2518. [Google Scholar] [CrossRef]
  20. Ajayi, O.O. Assessment of Utilization of Wind Energy Resources in Nigeria. Energy Policy 2009, 37, 750–753. [Google Scholar] [CrossRef]
  21. Nehrir, M.H.; Wang, C.; Strunz, K.; Aki, H.; Ramakumar, R.; Bing, J.; Miao, Z.; Salameh, Z. A Review of Hybrid Renewable/Alternative Energy Systems for Electric Power Generation: Configurations, Control, and Applications. IEEE Trans. Sustain. Energy 2011, 2, 392–403. [Google Scholar] [CrossRef]
  22. Ma, T.; Yang, H.; Lu, L. A Feasibility Study of a Stand-Alone Hybrid Solar–Wind–Battery System for a Remote Island. Appl. Energy 2014, 121, 149–158. [Google Scholar] [CrossRef]
  23. Okere, R. Government Plans 45,101 MW Electricity Generation by 2030. Available online: https://guardian.ng/business-services/government-plans-45101mw-electricity-generation-by-2030/ (accessed on 30 October 2021).
  24. Nigeria-Punch Newspaper. Renewable Energy Mix. Available online: https://punchng.com/fg-targets-30-per-cent-in-renewable-energy-mix-by-2030-fashola/ (accessed on 30 October 2019).
  25. Akikur, R.K.; Saidur, R.; Ping, H.W.; Ullah, K.R. Comparative Study of Stand-Alone and Hybrid Solar Energy Systems Suitable for off-Grid Rural Electrification: A Review. Renew. Sustain. Energy Rev. 2013, 27, 738–752. [Google Scholar] [CrossRef]
  26. Oyedepo, S.O. Energy and Sustainable Development in Nigeria: The Way Forward. Energy Sustain. Soc. 2012, 2, 15. [Google Scholar] [CrossRef] [Green Version]
  27. Karmaker, A.K.; Hossain, A.; Kumar, N.M. Analysis of Using Biogas Resources for Electric Vehicle Charging in Bangladesh: A Techno-Economic-Environmental Perspective. Sustainability 2020, 12, 2579. [Google Scholar] [CrossRef]
  28. Nigam, K. Feasibility Analysis of a Solar-Assisted Electric Vehicle Charging Station Model Considering Differential Pricing. Energy Storage 2021, 3, e237. [Google Scholar] [CrossRef]
  29. Filote, C.; Felseghi, R. Environmental Impact Assessment of Green Energy Systems for Power Supply of Electric Vehicle Charging Station. Int. J. Energy Res. 2020, 44, 10471–10494. [Google Scholar] [CrossRef]
  30. Machado, A.; Daniel, S.; Nogueira, H.; Soares, B.; César, M.; Diogo, G. Techno-Economic Feasibility Study on Electric Vehicle and Renewable Energy Integration: A Case Study. Energy Storage 2020, 2, e197. [Google Scholar] [CrossRef]
  31. Venkatesh, B.; Daniel, S.A. Design and Feasibility Analysis of Hybrid Energy-Based Electric Vehicle Charging Station. Distrib. Gener. Altern. Energy J. 2022, 37, 41–72. [Google Scholar] [CrossRef]
  32. Ye, B.; Jiang, J.; Miao, L.; Yang, P.; Li, J.; Shen, B. Feasibility Study of a Solar-Powered Electric Vehicle Charging Station Model. Energies 2015, 8, 13265–13283. [Google Scholar] [CrossRef] [Green Version]
  33. Al Wahedi, A.; Bicer, Y. Techno-Economic Optimization of Novel Stand-Alone Renewables-Based Electric Vehicle Charging Stations in Qatar. Energy 2022, 243, 123008. [Google Scholar] [CrossRef]
  34. Kumar, A.; Ahmed, R.; Hossain, A.; Sikder, M. Feasibility Assessment & Design of Hybrid Renewable Energy Based Electric Vehicle Charging Station in Bangladesh. Sustain. Cities Soc. 2018, 39, 189–202. [Google Scholar] [CrossRef]
  35. Manwell, J.M.; McGowan, J.G. Lead Acid Battery Storage Model for Hybrid Energy Systems. Sol. Energy 2003, 50, 399–405. [Google Scholar] [CrossRef]
  36. Syed Mohammed, A.; Anuj; Lodhi, A.S.; Murtaza, Q. Techno-Economic Feasibility of Hydrogen Based Electric Vehicle Charging Station: A Case Study. Int. J. Energy Res. 2022, 46, 14145–14160. [Google Scholar] [CrossRef]
  37. Minh, P.V.; Le Quang, S.; Pham, M. Technical Economic Analysis of Photovoltaic-Powered Electric Vehicle Charging Stations under Different Solar Irradiation Conditions in Vietnam. Sustainability 2021, 13, 3528. [Google Scholar] [CrossRef]
  38. Ekren, O.; Canbaz, C.H.; Güvel, Ç.B. Sizing of a Solar-Wind Hybrid Electric Vehicle Charging Station by Using HOMER Software. J. Clean. Prod. 2021, 279, 123615. [Google Scholar] [CrossRef]
  39. Hafez, O.; Bhattacharya, K. Optimal Design of Electric Vehicle Charging Stations Considering Various Energy Resources. Renew. Energy 2017, 107, 576–589. [Google Scholar] [CrossRef]
  40. Ilieva, L.M.; Iliev, S.P. Feasibility Assessment of a Solar-Powered Charging Station for Electric Vehicles in the North Central Region of Bulgaria. Renew. Energy Environ. Sustain. 2016, 1, 12. [Google Scholar] [CrossRef]
  41. HOMER Pro Software. Available online: www.homerenergy.com (accessed on 3 September 2022).
  42. Oladigbolu, J.O. Economic Evaluation and Determination of Optimal Hybrid Energy Supply Systems for Residential and Healthcare Facilities in Rural and Urban Areas. Ph.D. Thesis, King Abdulaziz University, Jeddah, Saudi Arabia, 2020. [Google Scholar]
  43. Sinha, S.; Chandel, S.S. Review of Software Tools for Hybrid Renewable Energy Systems. Renew. Sustain. Energy Rev. 2014, 32, 192–205. [Google Scholar] [CrossRef]
  44. Li, C.; Shan, Y.; Zhang, L.; Zhang, L.; Fu, R. Techno-Economic Evaluation of Electric Vehicle Charging Stations Based on Hybrid Renewable Energy in China. Energy Strateg. Rev. 2022, 41, 100850. [Google Scholar] [CrossRef]
  45. Oladigbolu, J.O.; Al-turki, Y.A.; Olatomiwa, L. Comparative Study and Sensitivity Analysis of a Standalone Hybrid Energy System for Electrification of Rural Healthcare Facility in Nigeria. Alex. Eng. J. 2021, 60, 5547–5565. [Google Scholar] [CrossRef]
  46. Seedahmed, M.M.A.; Ramli, M.A.M.; Bouchekara, H.R.E.H.; Shahriar, M.S.; Milyani, A.H.; Rawa, M. A Techno-Economic Analysis of a Hybrid Energy System for the Electrification of a Remote Cluster in Western Saudi Arabia. Alex. Eng. J. 2021, 61, 5183–5202. [Google Scholar] [CrossRef]
  47. Malanda, C.; Makokha, A.B.; Nzila, C.; Zalengera, C. Techno-Economic Optimization of Hybrid Renewable Electrification Systems for Malawi’s Rural Villages. Cogent Eng. 2021, 8, 1910112. [Google Scholar] [CrossRef]
  48. Aziz, A.S.; Tajuddin, M.F.N.; Adzman, M.R.; Mohammed, M.F.; Ramli, M.A.M. Feasibility Analysis of Grid-Connected and Islanded Operation of a Solar PV Microgrid System: A Case Study of Iraq. Energy 2020, 191, 116591. [Google Scholar] [CrossRef]
  49. El-houari, H.; Allouhi, A.; Rehman, S.; Buker, M.S. Design, Simulation, and Economic Optimization of an Off-Grid Photovoltaic System for Rural Electrification. Energies 2019, 12, 4735. [Google Scholar] [CrossRef]
  50. Ur, H.; Habib, R.; Wang, S.; Elkadeem, M.R.; Elmorshedy, M.F. Design Optimization and Model Predictive Control of a Standalone Hybrid Renewable Energy System: A Case Study on a Small Residential Load in Pakistan. IEEE Access 2019, 7, 117369–117390. [Google Scholar]
  51. Mandal, S.; Das, B.K.; Hoque, N. Optimum Sizing of a Stand-Alone Hybrid Energy System for Rural Electrification in Bangladesh. J. Clean. Prod. 2018, 200, 12–27. [Google Scholar] [CrossRef]
  52. Al Garni, H.Z.; Awasthi, A.; Ramli, M.A.M. Optimal Design and Analysis of Grid-Connected Photovoltaic under Different Tracking Systems Using HOMER. Energy Convers. Manag. 2018, 155, 42–57. [Google Scholar] [CrossRef]
  53. Aziz, A.S. Techno-Economic Analysis Using Different Types of Hybrid Energy Generation for Desert Safari Camps in UAE. Turk. J. Electr. Eng. Comput. Sci. 2017, 25, 2122–2135. [Google Scholar] [CrossRef]
  54. Rahman, M.M.; Khan, M.M.U.H.; Ullah, M.A.; Zhang, X.; Kumar, A. A Hybrid Renewable Energy System for a North American Off-Grid Community. Energy 2016, 97, 151–160. [Google Scholar] [CrossRef]
  55. Kolhe, M.L.; Ranaweera, K.M.I.U.; Gunawardana, A.G.B.S. Techno-Economic Sizing of off-Grid Hybrid Renewable Energy System for Rural Electrification in Sri Lanka. Sustain. Energy Technol. Assess. 2015, 11, 53–64. [Google Scholar] [CrossRef]
  56. Suresh Kumar, U.; Manoharan, P.S. Economic Analysis of Hybrid Power Systems (PV/Diesel) in Different Climatic Zones of Tamil Nadu. Energy Convers. Manag. 2014, 80, 469–476. [Google Scholar] [CrossRef]
  57. Rehman, S.; Al-Hadhrami, L.M. Study of a Solar PV-Diesel-Battery Hybrid Power System for a Remotely Located Population near Rafha, Saudi Arabia. Energy 2010, 35, 4986–4995. [Google Scholar] [CrossRef]
  58. Banguero, E.; Correcher, A.; Pérez-Navarro, Á.; Morant, F.; Aristizabal, A. A Review on Battery Charging and Discharging Control Strategies: Application to Renewable Energy Systems. Energies 2018, 11, 1021. [Google Scholar] [CrossRef] [Green Version]
  59. Trading-Economics. Economic Rates. Available online: https://tradingeconomics.com (accessed on 27 September 2022).
  60. Dalton, G.J.; Lockington, D.A.; Baldock, T.E. Feasibility Analysis of Stand-Alone Renewable Energy Supply Options for a Large Hotel. Renew. Energy 2008, 33, 1475–1490. [Google Scholar] [CrossRef]
  61. Orrico, A.C.A.; Schwingel, A.W.; Gimenes, R.M.T.; Souza, S.V.; Orrico, M.A.P.; Maciel, T.T.; Borquis, R.R.A.; de Vargas, F.M. Can Adding Liquid Hatchery Waste to Sheep Manure Potentialize Methane Production and Add Value to Sheep Farming? Environ. Technol. Innov. 2021, 24, 101866. [Google Scholar] [CrossRef]
  62. Adaramola, M.S.; Paul, S.S.; Oyewola, O.M. Assessment of Decentralized Hybrid PV Solar-Diesel Power System for Applications in Northern Part of Nigeria. Energy Sustain. Dev. 2014, 19, 72–82. [Google Scholar] [CrossRef]
  63. NASA/SSE. Surface Meteorology and Solar Energy. Available online: https://power.larc.nasa.gov/ (accessed on 15 December 2021).
  64. Ohunakin, O.S.; Adaramola, M.S.; Oyewola, O.M.; Fagbenle, R.O. Solar Energy Applications and Development in Nigeria: Drivers and Barriers. Renew. Sustain. Energy Rev. 2014, 32, 294–301. [Google Scholar] [CrossRef]
  65. Oladigbolu, J.O.; Ramli, M.A.M.; Al-turki, Y.A. Techno-Economic and Sensitivity Analyses for an Optimal Hybrid Power System Which Is Adaptable and Effective for Rural Electrification: A Case Study of Nigeria. Sustainability 2019, 11, 4959. [Google Scholar] [CrossRef] [Green Version]
  66. Agarwal, N.; Kumar, A.; Varun. Optimization of Grid Independent Hybrid PV-Diesel-Battery System for Power Generation in Remote Villages of Uttar Pradesh, India. Energy Sustain. Dev. 2013, 17, 210–219. [Google Scholar] [CrossRef]
  67. Khan, F.A.; Pal, N.; Saeed, S.H. Optimization and Sizing of SPV/Wind Hybrid Renewable Energy System: A Techno-Economic and Social Perspective Hybrid Optimization of Multiple Energy Resources. Energy 2021, 233, 121114. [Google Scholar] [CrossRef]
  68. Oladigbolu, J.O.; Ramli, M.A.M.; Al-Turki, Y.A. Optimal Design of a Hybrid PV Solar/Micro-Hydro/Diesel/Battery Energy System for a Remote Rural Village under Tropical Climate Conditions. Electronics 2020, 9, 1491. [Google Scholar] [CrossRef]
  69. Imam, A.A.; Oladigbolu, J.O.; Mustafa, M.A.S.; Imam, T.A. The Effect of Solar Photovoltaic Technologies Cost Drop on the Economic Viability of Residential Grid-Tied Solar PV Systems in Saudi Arabia. In Proceedings of the 2022 International Conference on Electrical, Computer and Energy Technologies (ICECET), Prague, Czech Republic, 20–22 July 2022; pp. 1–5. [Google Scholar] [CrossRef]
  70. Lambert, T.; Gilman, P.; Lilienthal, P. Micropower System Modeling. Integr. Altern. Sources Energy 2006, 1, 379–418. [Google Scholar]
Figure 1. The evaluation process of the hybrid RE-based charging stations in HOMER Pro®.
Energies 16 00397 g001
Figure 2. The map of Nigeria showing the case study sites. The star in the middle denote Abuja, the Capital of Nigeria.
Energies 16 00397 g002
Figure 3. The energy flow schematic diagram of the suggested hybrid RE-based charging stations.
Energies 16 00397 g003
Figure 4. Assessment flowchart and optimization process utilized in the HOMER Pro® microgrid tool.
Energies 16 00397 g004
Figure 5. The WT power curve.
Energies 16 00397 g005
Figure 6. EV charging station system load profile.
Energies 16 00397 g006
Figure 7. Monthly electricity generated by the PV/WT/battery-based charging station in the six selected sites.
Energies 16 00397 g007
Figure 8. Yearly electric generation of the optimal charging station schemes (PV/WT/battery) in the considered locations.
Energies 16 00397 g008
Figure 9. The effect of variation in the number of EVs or charge demand on the economic metrics NPC and COE of the PV/WT/battery charging system in Sokoto.
Energies 16 00397 g009
Figure 10. The effect of wind speed variation on the system costs of the Sokoto PV/WT/battery charging scheme.
Energies 16 00397 g010
Figure 11. Impact of change in solar radiation value on the PV/WT/battery charging station costs in Sokoto.
Energies 16 00397 g011
Figure 12. Effect of varying the battery SOCminimum on the NPC and the COE of the optimal charging system.
Energies 16 00397 g012
Figure 13. Effect of the sensitivity parameters on the (a) total NPC, and (b) cost of electricity of the optimal charging station.
Energies 16 00397 g013
Figure 14. The effect of charge demand or EV number variation on the technical performance of the optimal charging system.
Energies 16 00397 g014
Figure 15. The effect of wind speed variation on the technical performance of the Sokoto PV/WT/battery EV charging model.
Energies 16 00397 g015
Figure 16. The impact of changing the solar radiation value on the excess energy and unfulfilled electric load of the optimal EV charging scheme.
Energies 16 00397 g016
Figure 17. The effect of varying the battery SOCminimum percent value on the technical performance of the optimal charging system.
Energies 16 00397 g017
Figure 18. Impact of the sensitivity parameters on (a) the excess energy, and (b) the unmet electric load of the optimal charging station.
Energies 16 00397 g018
Table 3. Geographical coordinates of the case study sites.
StateCityGeo-Political ZoneLatitude (°N)Longitude (°E)Altitude (m)
SokotoSokotoNorth-West13.00595.2476293.00
LagosIkejaSouth-West6.60183.351546.00
EnuguEnuguSouth-East6.44837.5139200.00
RiversPort-HarcourtSouth-South4.84726.974613.00
BornoMaiduguriNorth-East11.831113.1510325.00
NigerMinnaNorth-Central9.58366.5463446.00
Table 4. The control variables, economics, and constraints utilized in the optimization tool [41,59,60].
VariablesUnitValue
Initial state of charge (SOCinitial)%100
Minimum SOC (SOCminimum)%20
Consider ambient temperature impactYesYes
Tracking systemNoNo
Considered PV panel slopeYesYes
Allowing system with multiple sourcesYesYes
System design precision-0.010
NPC precision-0.010
Economics
Real discount rate%14
Project lifetimeyears25
Constraints
Minimum renewable fraction (RFminimum)%0
Load in current time step%10
Solar power output%25
Wind power output%50
Table 5. Wind speed data of the case study sites for EVCS (m/s) [40].
MonthLocations
SokotoIkejaEnuguPort-HarcourtMaiduguriMinna
January7.253.073.832.816.785.69
February7.073.613.763.017.125.01
March6.254.044.143.126.774.00
April5.234.104.403.055.493.75
May5.103.784.182.954.963.45
June5.194.164.553.365.203.37
July4.794.845.003.834.973.54
August3.974.905.034.004.213.51
September3.784.284.413.603.962.86
October4.093.503.653.054.112.75
November5.682.742.832.565.864.23
December6.902.653.332.436.565.48
Average5.443.814.093.155.503.97
Table 6. Solar radiation data of the case study sites for EVCS (kWh/m2/day) [40].
MonthLocations
SokotoIkejaEnuguPort-HarcourtMaiduguriMinna
January5.475.285.685.245.615.72
February6.415.495.745.136.306.01
March6.875.465.574.736.706.26
April7.155.215.254.506.626.12
May7.034.764.944.096.365.73
June6.914.044.543.455.975.17
July6.263.954.143.115.434.64
August5.733.983.913.425.144.36
September6.014.094.193.225.574.82
October6.034.554.573.605.895.42
November5.794.955.114.185.845.85
December5.255.175.464.885.355.73
Average6.244.744.934.135.905.49
Table 7. Air temperature data of the case study sites for EVCS (degree celsius) [40].
MonthLocations
SokotoIkejaEnuguPort-HarcourtMaiduguriMinna
January23.0325.9024.0225.4023.3522.90
February25.9126.9425.6826.4326.1625.19
March29.7127.2226.6026.7329.9827.20
April32.8426.9926.6226.5332.7727.49
May33.0026.5326.1626.1932.7726.52
June31.0625.5925.2925.3130.9425.41
July28.4824.6524.6024.6128.1724.48
August26.8024.4124.5824.5226.6124.23
September27.0924.9224.7824.8327.2324.82
October27.8625.5525.0525.2628.2225.19
November25.9126.2725.2725.7726.1624.04
December23.3726.0123.9225.5323.6422.65
Average27.9225.9225.2125.5928.0025.01
Table 8. Technical specification of the WT.
Wind TurbineValues
Name/ModelXANT M-21
Rated capacity100 kW
Rotor diameter21 m
Hub height31.8 m
Cut-in WS3 m/s
Rated WS11 m/s
Lifetime 20 years
Table 9. Economic data of the hybrid energy system components.
ComponentsCapital CostCost of ReplacementMaintenance CostReference
PV panelsUSD1500/kWUSD1000/kWUSD10/kW/year[65]
Wind turbineUSD50,000/unitUSD50,000/unitUSD2500/year/unit[44]
ConverterUSD200/kWUSD200/kW-[50]
BatteriesUSD176/unitUSD176/unitUSD8/unit/year[50]
Table 10. Technical data of the PV panel.
PV PanelValues
Name/modelSunPower SPR X21
Panel typeFlat plate
Rated capacity335 W
Temperature coefficient−0.3
Operating temperature43 °C
Efficiency21%
De-rating factor88%
Ground reflectance20%
Tracking system-
Lifetime 25 years
Table 11. Technical details of the selected battery.
Battery StorageValues
Nominal voltage6 V
Nominal capacity2.45 kWh
Roundtrip efficiency80%
Maximum capacity408 Ah
Lifetime (Throughput)1958 kWh
Capacity ratio0.0699
Rate constant (1/h)6.01
Minimum state of charge 20%
Table 12. The technical data of the selected converter.
System ConverterValues
Inverter input
        Efficiency95%
        Lifespan15 years
Rectifier input
        Relative capacity100%
        Efficiency85%
Rated capacity 1 kW
Table 13. Summarized cost details of the optimal systems for the proposed charging stations.
LocationsSystem DesignNPC
(USD)
COE
(USD/kWh)
Initial Capital
(USD)
Operating Cost
(USD/year)
Replacement Cost (USD)O&M Cost (USD)Salvage (USD)PV Levelized Cost (USD/kWh)Battery Wear Cost (USD/kWh)WT Levelized Cost (USD/kWh)
SokotoWT-Battery950,1640.366689,56137,91756,285222,408(18,090)0.0000.1000.0594
PV-WT-Battery547,7170.211449,13414,34435,38367,195(3995)0.1180.1000.0594
PV-Battery601,3810.232504,05614,16152,58948,435(3699)0.1180.1000.0000
IkejaWT-Battery2,527,1370.9761,853,46698,018108,684607,567(42,580)0.0000.1000.1570
PV-WT-Battery769,3600.296638,56019,03143,45795,645(8302)0.1550.1000.1570
PV-Battery916,4800.354800,97316,80634,57182,231(1295)0.1550.1000.0000
EnuguWT-Battery1,723,8740.6661,258,56067,70389,363412,238(36,287)0.0000.1000.1260
PV-WT-Battery745,5740.287609,43019,80943,97299,752(7580)0.1500.1000.1260
PV-Battery892,2000.344775,54616,97326,92594,599(4871)0.1500.1000.0000
Port-HarcourtWT-Battery3,318,7631.2802,448,673126,597135,871790,937(56,717)0.0000.1000.2920
PV-WT-Battery1,039,6600.400879,55223,29640,380125,193(5464)0.1790.1000.2920
MaiduguriPV-Battery 1,119,7270.432995,94318,01031,95694,090(2263)0.1790.1000.0000
WT-Battery871,5960.336630,22835,11953,334204,126(16,092)0.0000.1000.0579
PV-WT-Battery563,5270.217466,22214,15630,69772,731(6122)0.1250.1000.0580
MinnaPV-Battery 683,4090.264587,21913,99545,80650,910(526)0.1250.1000.0000
WT-Battery2,405,5580.9301,734,75297,601138,853578,151(46,198)0.0000.1000.1370
PV-WT-Battery758,2480.292648,58815,95532,18079,281(1801)0.1330.1000.1370
PV-Battery774,6790.299669,71915,27233,21372,593(845)0.1330.1000.0000
Table 14. Optimal sizes and technical performance results of the optimized systems for the EV charging station.
LocationsSystem DesignWT
(Qty.)
PV
(kW)
Converter
(kW)
Batteries
(Qty.)
Total Renewable Production (kWh/Year)Total EV Consumption (kWh/Year)Capacity Shortage (%)Unmet Electric Load (%)Maximum Renewable
Penetration
(%)
SokotoWT-Battery10-1389201,699,130377,3692.101.533310
PV-WT-Battery2174109380674,904377,9452.071.38763
PV-Battery-257102560495,306377,6622.061.46441
IkejaWT-Battery28-24323001,795,360376,8582.061.677409
PV-WT-Battery2252102800497,701377,9012.061.40675
PV-Battery-3961521000582,115377,1102.091.60652
EnuguWT-Battery19-17015601,523,727376,5452.091.755574
PV-WT-Battery3221109600578,502377,8422.091.41943
PV-Battery-3521081280537,915377,1392.081.59597
Port-HarcourtWT-Battery34-43537601,176,967376,1522.101.856419
PV-WT-Battery3368117880573,566377,8812.101.40667
MaiduguriPV-Battery -5211391060665,846377,1102.081.60849
WT-Battery9-1099001,569,870377,5142.101.503020
PV-WT-Battery2174102480667,997377,8942.101.40707
MinnaPV-Battery -309145540565,530377,2902.091.56526
WT-Battery30-17111402,204,533376,5632.081.748872
PV-WT-Battery1296108760579,666377,5702.101.48618
PV-Battery-320137920548,455377,1072.081.60550
Table 15. Comparison of the proposed EVCS system with other existing EVCS.
Optimal SystemCountryMethodologyEmissionsNPCCOEReferences
Wind/CPV/FC/Bio-Gen/Battery QatarHOMER ProxxxxUSD2.53M–USD2.92 MUSD0.285–USD0.329/kWh[33]
PV/Battery systemRomaniaiHOGACO2 (430 kg/year)USD135,524USD 0.9//kWh[29]
PV/Wind/BatteryChinaHOMER ProxxxxUSD831,540USD0.294/kWh[44]
PV/Wind/Fuel cell/BatteryIndiaHOMERHydrogen (0.198 kg/h)USD1,519,040USD0.264/kWh[36]
PV/Biogas-Gen/BatteryBangladeshHOMER ProCO2 (222 G/kWh)USD56,202USD0.1302/kWh[34]
Diesel/PV/Battery systemCanadaHOMERTotal (73,450 kg/year)USD0.835/0.945 MUSD0.551/0.625/kWh[39]
PV-based systemBulgariaMathematical ApproachxxxxUSD21,0340.111/kWh[40]
PV/Grid/BatteryVietnamHOMER GRIDCO2 (28,456–42,021 kg/year)USD97,227–113,785USD0.08–0.102/kWh[37]
PV-basedChinaHOMERTotal (463,091 kg/year)USD3,579,236USD0.098/kWh[32]
Wind/PV/BatteryTurkeyHOMER ProxxxxUSD697,704USD0.064/kWh[38]
PV/WT/BatteryNigeriaHOMER ProxxxxUSD547,717USD0.211/kWhThis study
Table 16. Ranges of the sensitivity analysis parameters considered for the optimal charging station.
Sensitivity ParametersUnitVariation Range Values
EV charge demandkWh/day550:50:1600
Wind speed (Annual average)m/s2:0.4:8.8
Solar radiation (Annual average) kWh/m2/day2.7:0.3:10
Battery minimum state of charge Maximum yearly capacity shortage%5:5:60
%0:1:8
Disclaimer/Publisher’s Note: The statements, opinions and data contained in all publications are solely those of the individual author(s) and contributor(s) and not of MDPI and/or the editor(s). MDPI and/or the editor(s) disclaim responsibility for any injury to people or property resulting from any ideas, methods, instructions or products referred to in the content.

