Article

Modeling and Simulation of Modified MPPT Techniques under Varying Operating Climatic Conditions

1
Faculty of Engineering and Technology, Future University in Egypt, Cairo 11835, Egypt
2
Engineering, Systems and Applications Laboratory, ENSA, SMBA University, Fez 30000, Morocco
3
Energy and Renewable Energy Department, Faculty of Engineering, Egyptian Chinese University, Cairo 11724, Egypt
4
Engineering Physics and Mathematics Department, Faculty of Engineering, Ain Shams University, Cairo 11517, Egypt
5
Computer and Systems Engineering Department, Faculty of Engineering, Ain Shams University, Cairo 11517, Egypt
6
Electronics and Electrical Communications Department, Faculty of Engineering, Ain Shams University, Cairo 11517, Egypt
7
Electrical Engineering Department, Future University in Egypt, Cairo 11835, Egypt
*
Author to whom correspondence should be addressed.
Energies 2023, 16(1), 549; https://doi.org/10.3390/en16010549
Submission received: 17 October 2022 / Revised: 12 December 2022 / Accepted: 29 December 2022 / Published: 3 January 2023
(This article belongs to the Special Issue Electrical Power Engineering and Renewable Energy Technologies)

Abstract

:
Enhancing the performance of photovoltaic (PV) systems has recently become a key concern because of the market demand for green energy. To obtain the most possible power from the solar module, it is imperative to allow the PV system to operate at its maximum power point (MPP) regardless of the climatic conditions. In this study, a comparison of distinctive Maximum Power-Point Tracking (MPPT) techniques is provided, which are Perturb and Observe (P&O) and Modified Variable Step-Size P&O, as well as Incremental Conductance (INC) and Modified Variable Step-Size INC, using a boost converter for two types of solar panels. Using MATLAB software, simulations have been performed to assess the efficiency of the solar module under several environmental conditions, standard test conditions (STCs), and sudden and ramp variations in both solar irradiance and temperature. The output power efficiency, time response, and steady-state power oscillations have all been taken into account in this study. The simulation results of the improved algorithms demonstrate an enhancement in the PV module performance over conventional algorithms in many factors including steady-state conditions, tracking time, and converter efficiency. Furthermore, a boost in the dynamic response in monitoring the MPP is observed in a variety of climatical circumstances. Moreover, the proposed P&O MPPT algorithm is implemented in a hardware system and the experimental results verified the effectiveness, regarding both fast-tracking speed and lower oscillations, of the proposed Variable Step-Size P&O algorithm and its superiority over the conventional P&O technique.

1. Introduction

Undoubtedly, finding sustainable and renewable energy sources alternative to fossil fuel resources is a necessity. Amongst the various resources, solar energy is considered the most demanding thanks to its reliability, abundance, and effectiveness in alleviating global warming problems [1,2]. One significant advantage of using photovoltaic (PV) systems is that they can produce clean energy and are free of pollution [3]. Furthermore, PV panels are low-cost and require minimal maintenance [4]. Recently, photovoltaic panels are used in numerous applications, including water-pumping systems, battery chargers, and aeronautical applications [5]. Notably, the output energy of the panel is influenced by both ambient temperature and solar radiation, which consequently results in the nonlinear behavior of the PV panel [1,6]. In addition, the output energy is affected by the internal parameters of the panel, which, in turn, causes the load to impose its characteristics on the output power [7,8]. Hence, acquiring the maximum accessible power from a PV panel, particularly under fluctuating weather conditions, while maintaining high reliability and lower cost is a considerable concern in research. Therefore, much effort has been devoted to obtaining solutions [9,10,11,12,13]. The primary proposed key solution to conquer this issue is to add an MPPT controller to the photovoltaic system to boost the obtained power in any conditions [14,15].
Various techniques have been proposed for MPPT [13,16], including Perturbation and Observation (P&O) [13], Incremental Conductance (INC) [17], Fractional Open Circuit Voltage (FOCV) [18], Fractional Short Circuit Current (FSCC) [19], Fuzzy Logic [20], and Neural Networks [21]. These MPPT algorithms vary in many aspects, including the steady-state-oscillations, the response time of tracking the MPP, cost, effectiveness, implementation complexity, and the accurate tracking of the peak point regardless of unpredictable abrupt changes of solar radiation or temperature under the conditions of partial shading [15,16]. Of the MPPT algorithms, P&O and INC techniques are considered the most common commercialized ones that are utilized in tackling the MPP [22,23,24,25], attributed to the algorithms’ medium complexity and their simple implementation due to the low hardware requirements. Despite these advantages, P&O techniques suffer shortcomings that are mainly attributed to the oscillations around the MPP because the perturbation size added to the control signal in both directions is continually changing to remain in the MPP position. Furthermore, when the level of incident irradiance changes rapidly, the direction of perturbation may be incorrectly determined by the algorithm, resulting in increased power losses [26,27].
To overcome the drawbacks and shortcomings of the traditional P&O, various developments and implementations regarding the P&O technique have been addressed in the literature, such as the implementation of P&O, by using a variable duty cycle instead of a classical constant one as in [26] and proposing an adaptive P&O control algorithm that has a rapid dynamic response as presented in [27]. Another implementation of the conventional P&O was suggested in [28,29] to enhance the effectiveness of the system by employing an embedded microcontroller-based real-time algorithm with a combination of hardware-in-the-loop (HIL) along with embedded C language. Conversely, by obtaining the slope of the power–voltage curve identified and comparing it against zero at the MPP, the INC technique that has a fixed step size was introduced to minimize the oscillations of the targeted MPP [30]. On the other hand, the INC technique turns out to be much more complex when compared to P&O since it utilizes a set of divisional computations that require a calculation procedure and a stronger microcontroller [25]. Thus, upon utilizing a fixed step size, the algorithm has a low-speed response. Furthermore, in P&O and INC techniques, the tracing of the MPP may fail when solar radiation is abruptly changed or when partial shadowing occurs [15]. Consequently, modifying the INC algorithm was necessary [5,31].
Although some proposed modifications were conducted for both conventional algorithms in the literature, most of them do not achieve a fast and precise response to the first step change in the duty cycle when subjected to abrupt environmental fluctuations [25]. Moreover, to ensure the effectiveness of any of these MPPT algorithms, testing them under various operating circumstances is required. However, it is challenging to achieve the optimal test case since it is hard to control weather variations [32]. Researchers use MATLAB-Simulink [33] and other simulation environments to implement and ensure the accuracy of various MPPT algorithms before their hardware implementation because of the problems associated with the hardware components [34,35].
In the current study, modified variable step-size-based Perturb and Observe and Incremental Conductance (abbreviated as M-VSS-P&O and M-VSS-INC) algorithms are proposed to overcome the limitations of their corresponding traditional algorithms. MATLAB-Simulink software has been applied on two kinds of PV modules, namely, the polycrystalline MSX60 and the thin-film ST40 to investigate the effectiveness of the two modified MPPT algorithms in tracing the MPP under Standard Test Conditions (STC) and three different variation profiles of climatic variations regardless of the PV panel category.
The paper is organized as follows. After the introduction, Section 2 includes the PV system configuration while the model specifications details and the modified algorithms are presented in Section 3 and Section 4, respectively. Section 5 is devoted to the results and discussion. Finally, Section 6 represents the conclusions of this simulation study.

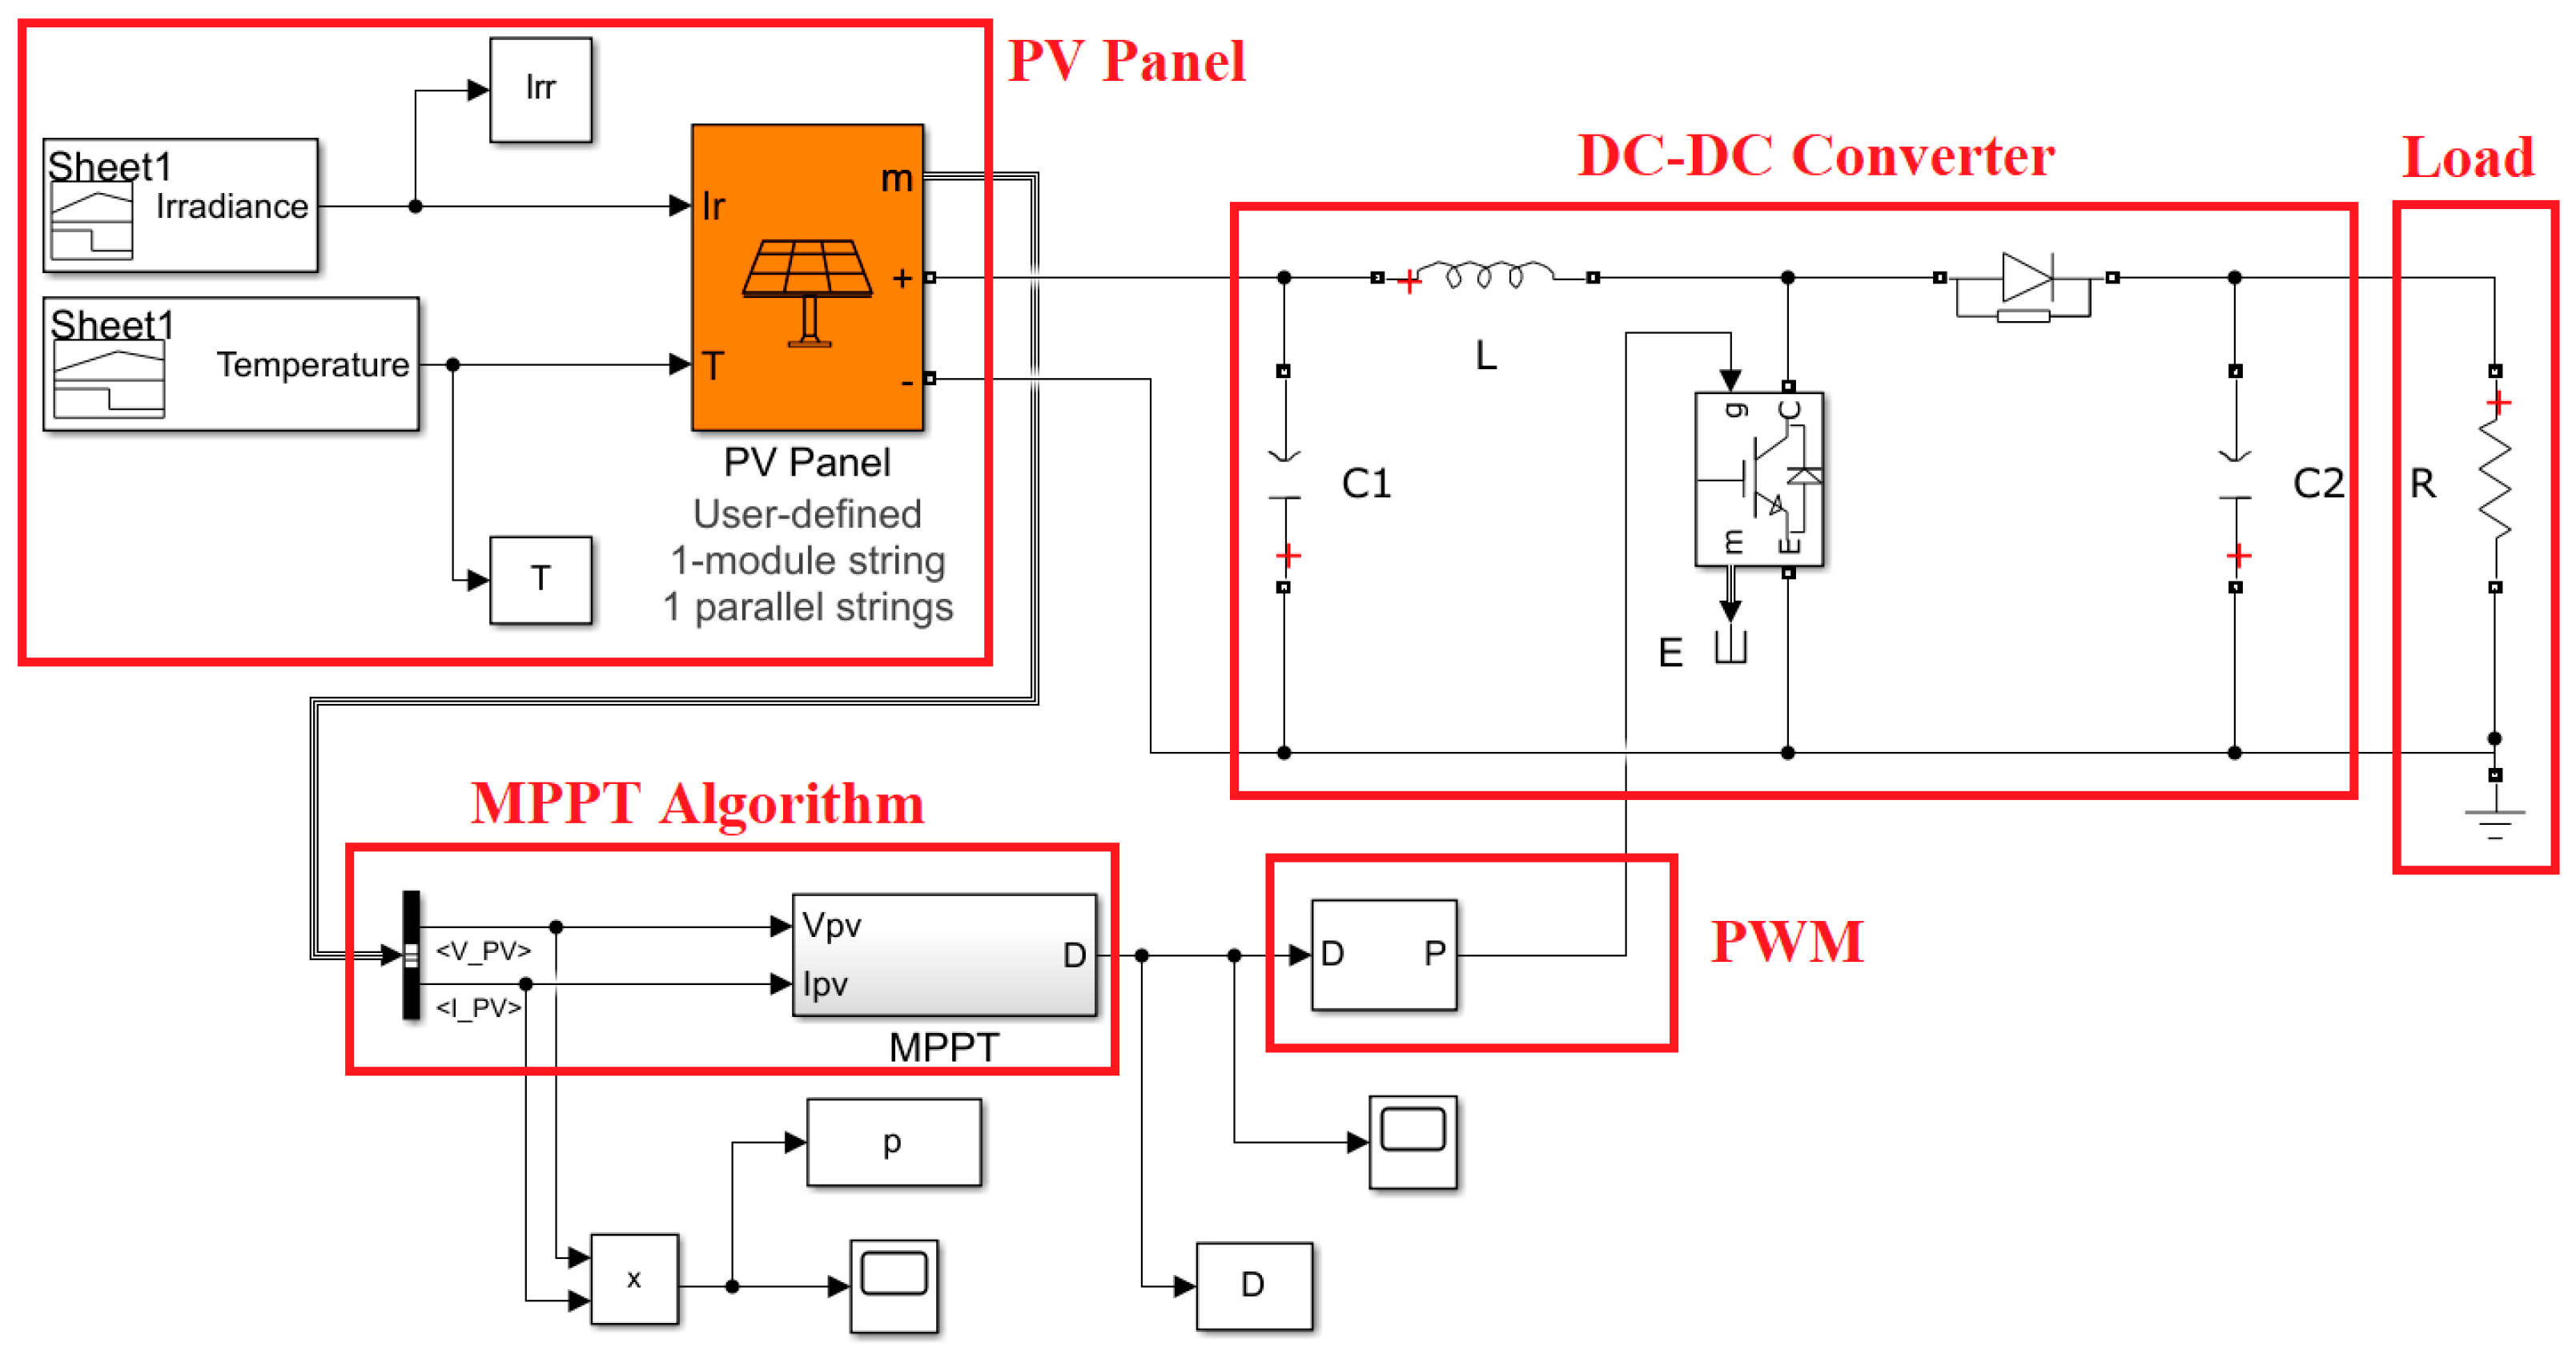
2. System Configuration and Models

2.1. Main System Configuration

The main objective of the system configuration illustrated in Figure 1 is to control the PV panel’s MPP and force the system to work at this point [16]. This point changes according to the variation of the atmosphere status, including solar radiation and temperature. The PV array’s output is linked to the DC-DC converter, which plays a fundamental function in the MPPT process. The circuit component design and the parameter values are given in Table 1. The MPPT controller controls the converter’s duty cycle, which in turn controls the array voltage from which the maximum power is acquired and maintained. The output of the systems is connected to a 30 Ω resistive load.

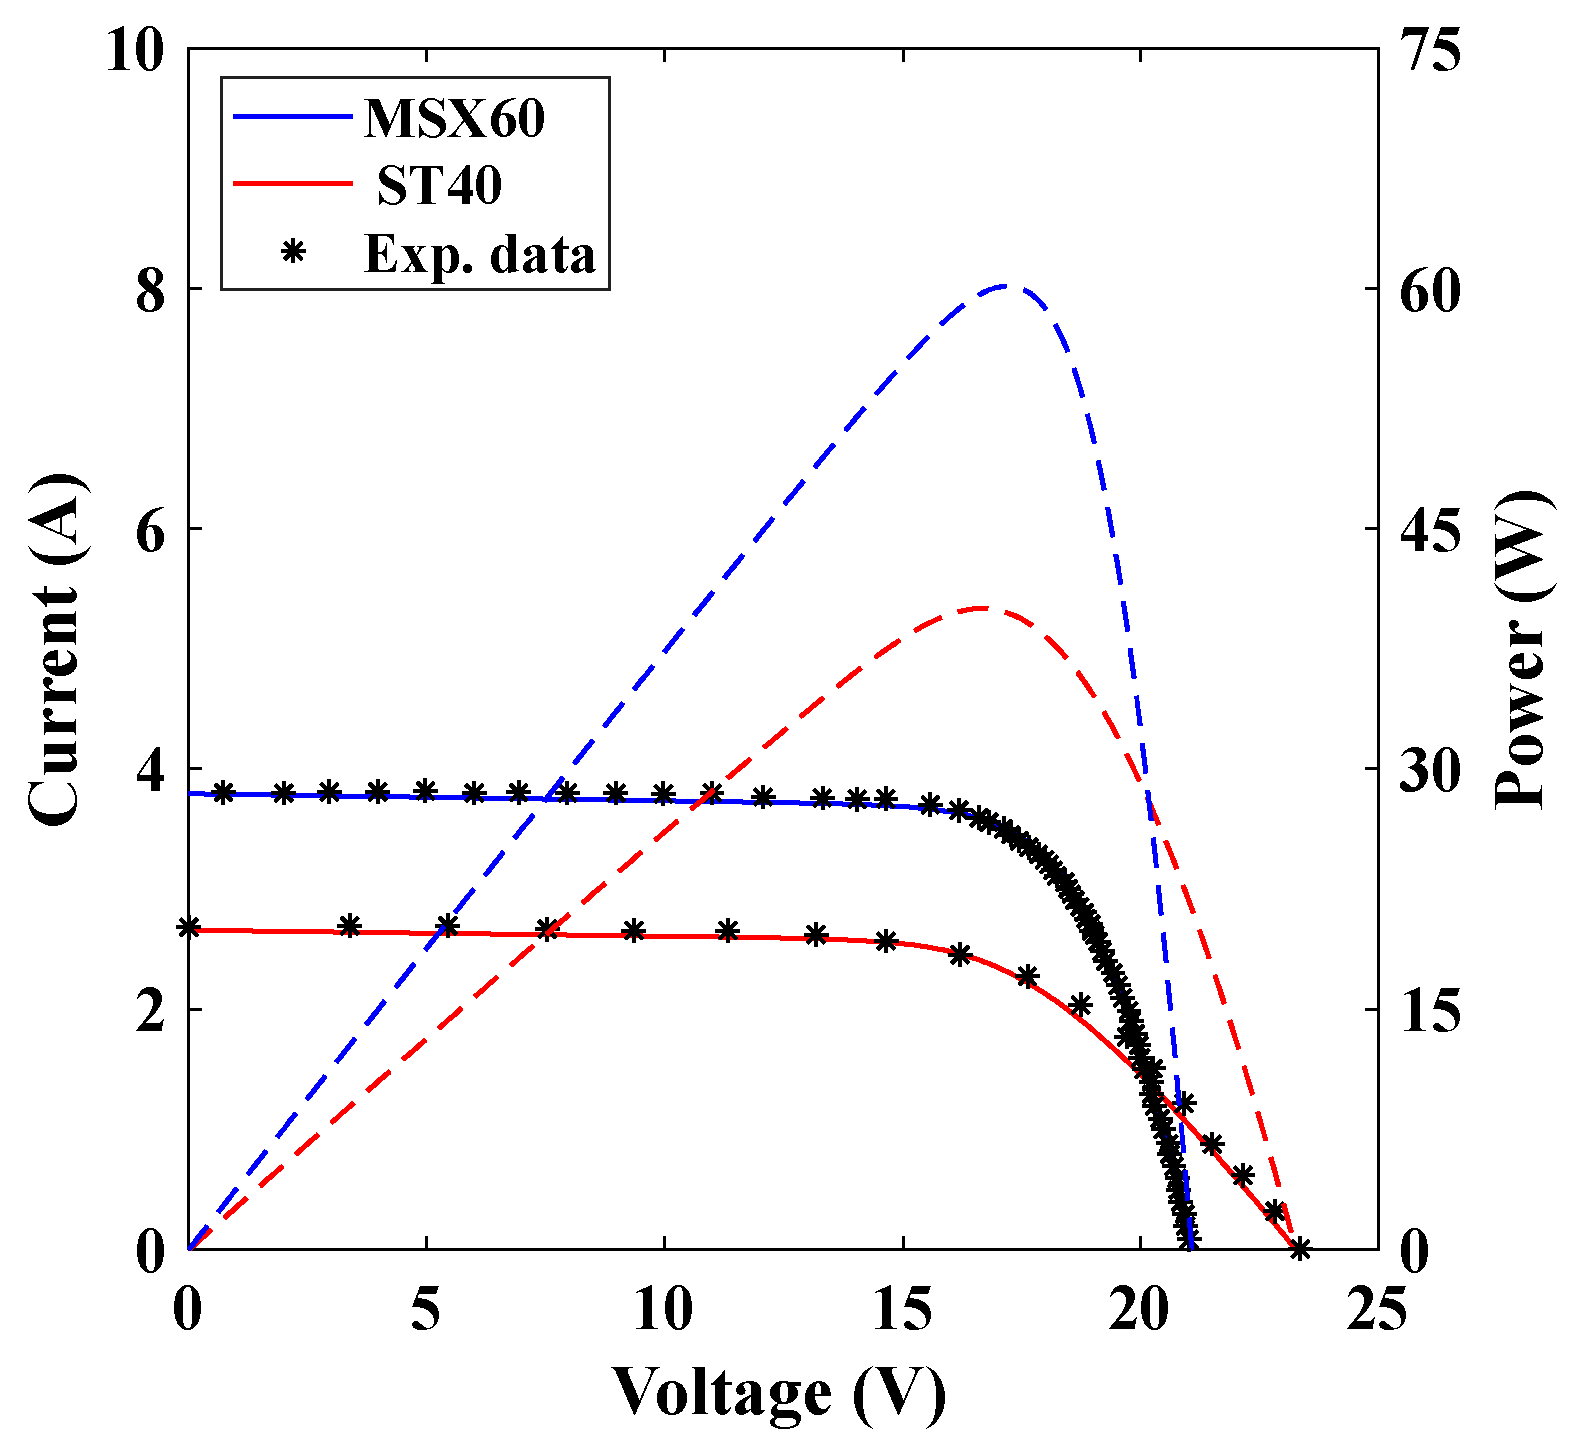
2.2. Models Specifications

The simulations performed in this work are linked to the manufacturer’s specifications specified at STC for the two cell modules, as mentioned in Table 2. The Current-Voltage and Power-Voltage curves for both cells are presented in Figure 2. As is apparent in P-V characteristics, the required MPPs where the maximum power is extracted from the panel are positioned in the curve’s peaks.
The incident solar irradiance and temperature influence these characteristic curves. Consequently, a non-linear PV characteristic is observed due to the variation in climatic conditions. This, in turn, causes a considerable change in the MPP position. Notably, the load also influences the MPP. Hence, an MPPT algorithm is highly required to be implemented in the PV system to trace the MPP under varying conditions. Further, to examine the effect of the temperature and solar irradiance fluctuations, the two PV modules are tested and simulated for distinctive temperature and irradiance values. The photocurrent (Iph) and the reverse saturation current (Is) are formulated by Equations (1) and (2):
I p h = G G S T C ( I s c + K i ( T T S T C ) )
I s = I s c + K i ( T T S T C ) exp ( V o c + K V ( T T S T C ) A V T ) 1
where A is the diode ideality factor while VT is the thermal voltage and T is the temperature in Kelvin. The constants Ki and Kv are the temperature coefficients of the short-circuit current Isc and the open circuit voltage Voc, respectively. The solar radiation (W/m2) and the Standard Test Condition (1000 W/m2 and 25 °C) are denoted by G and STC, respectively. GSTC is the solar irradiance under STC (1000 W/m2) and TSTC is the temperature under STC (25 °C). It can be deduced from the above equations that the photocurrent primarily depends on both the temperature and incident irradiance. On the other hand, the reverse saturation current only depends on temperature. Thus, the variation in irradiance and temperature strongly impacts the current and voltage levels. These implications are displayed in Figures S1 and S2, respectively (see Supplementary Materials).

3. MPPT Algorithms

The crucial concern for a good MPPT is to guarantee that the DC-DC converter’s input and output power does not change and remains the same even if the load changes. Many MPPT strategies have been proposed in an attempt to best determine the MPP. As mentioned earlier, because of their medium complexity and simple implementation, the traditional INC and P&O techniques are the most widely utilized algorithms.

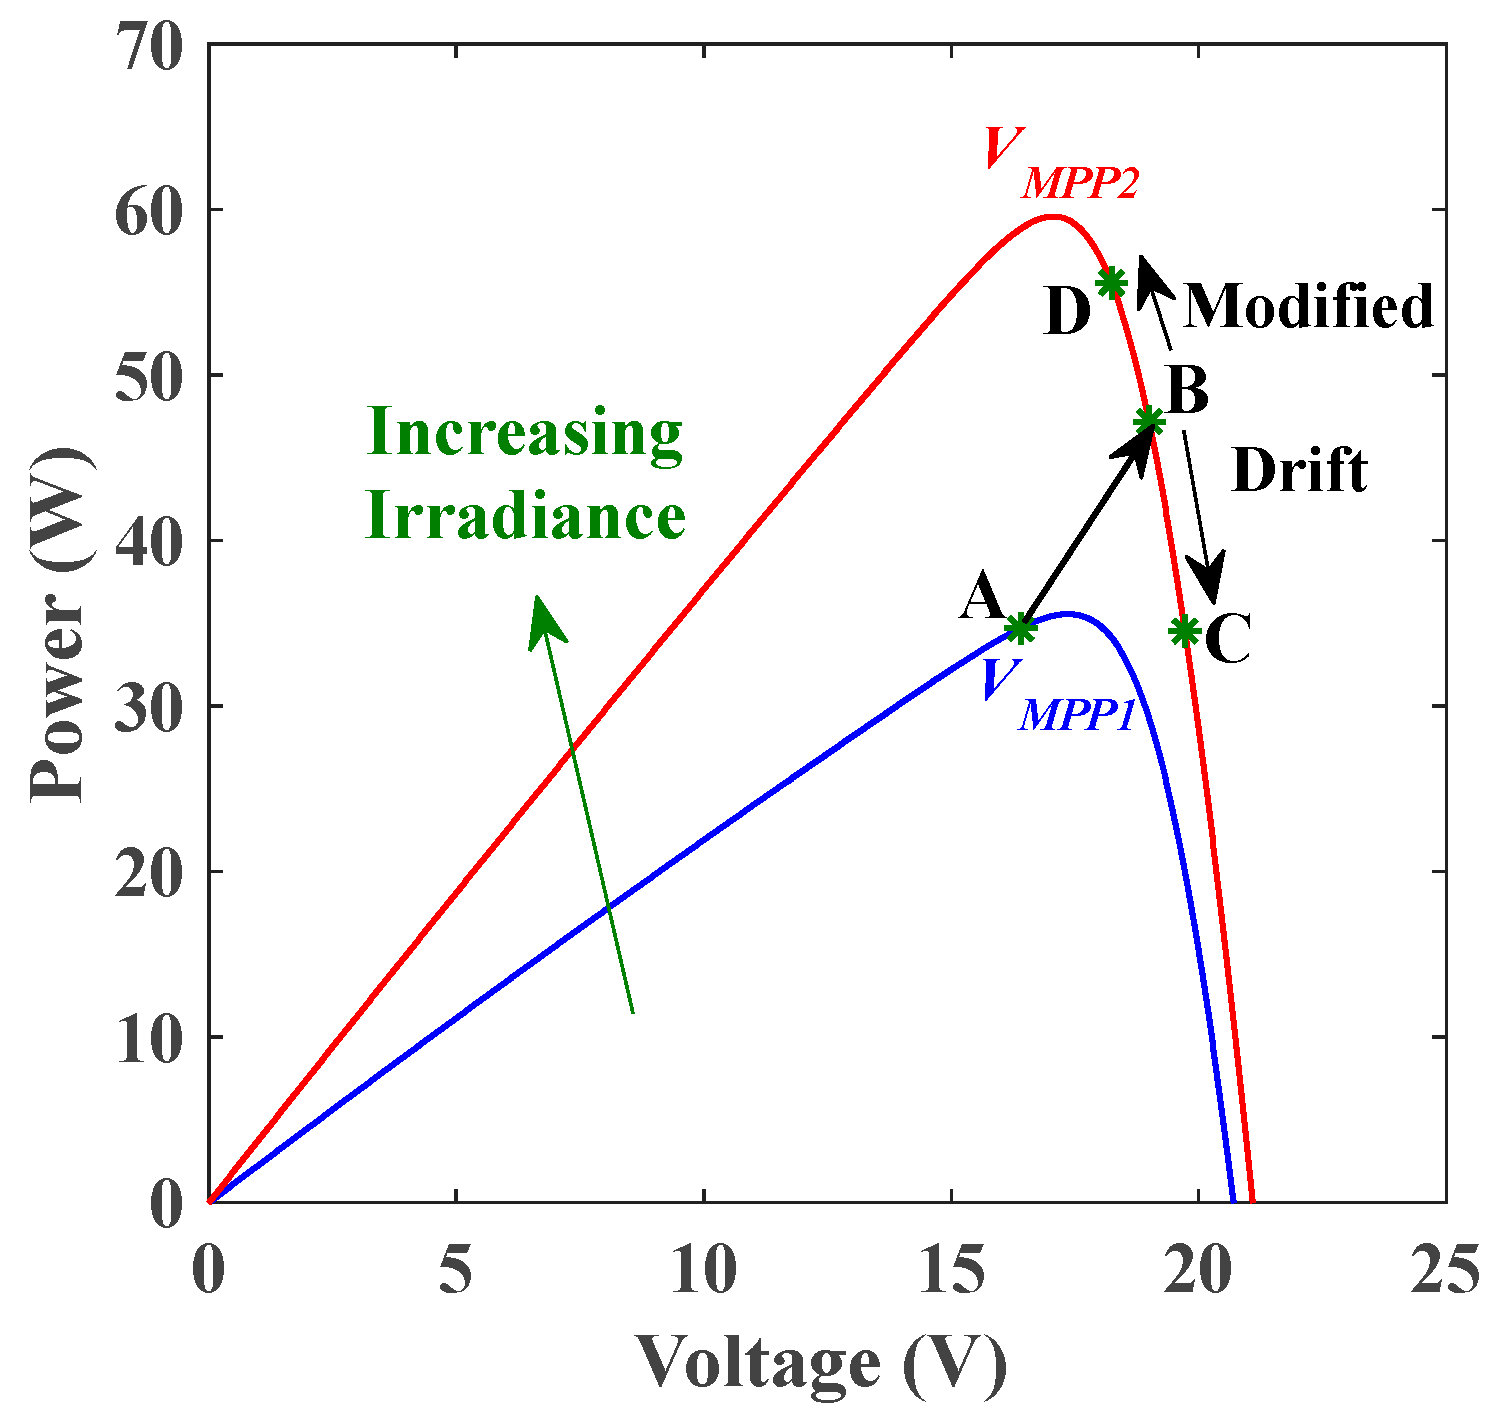
3.1. Issues Related to Conventional P&O and INC Algorithms

The P&O and INC techniques utilize the (P-V) characteristics of the PV panel in the tracking procedure, fulfilling the requirement dP/dV = 0. Essentially, it is difficult to determine the zero point on the P-V curve’s slope as in P&O and the truncation error in digital processing as in the INC. Therefore, both approaches turned out to be entirely inaccurate in tracing the MPP owing to the resulting steady-state oscillations in the vicinity of the MPP and higher response time. The perception of the P&O algorithm is centered on modulating the duty cycle. If the peak of the P-V characteristic is detected, there will be no more additional perturbations to the duty cycle. This process, however, causes the system operation to be adjacent to the MPP, but not at the point itself. Therefore, contentious duty cycle modifications must be employed to maintain the MPP position resulting in oscillations that are proportional to the step size. The larger step size is translated to higher oscillations while slower tracking is the result of the small step size.
In contrast, the concept of the INC algorithm depends on determining the slope of the power curve by employing the incremental conductance of the PV panel. When the incremental conductance has the same value as its instantaneous one, the maximum power can be successfully traced. Unlike the P&O algorithm, the INC process requires a powerful microcontroller which increases the system cost [5]. As a result of these issues raised for both P&O and INC algorithms, they are not the best choice when sudden changes occur in solar irradiance and/or temperature.

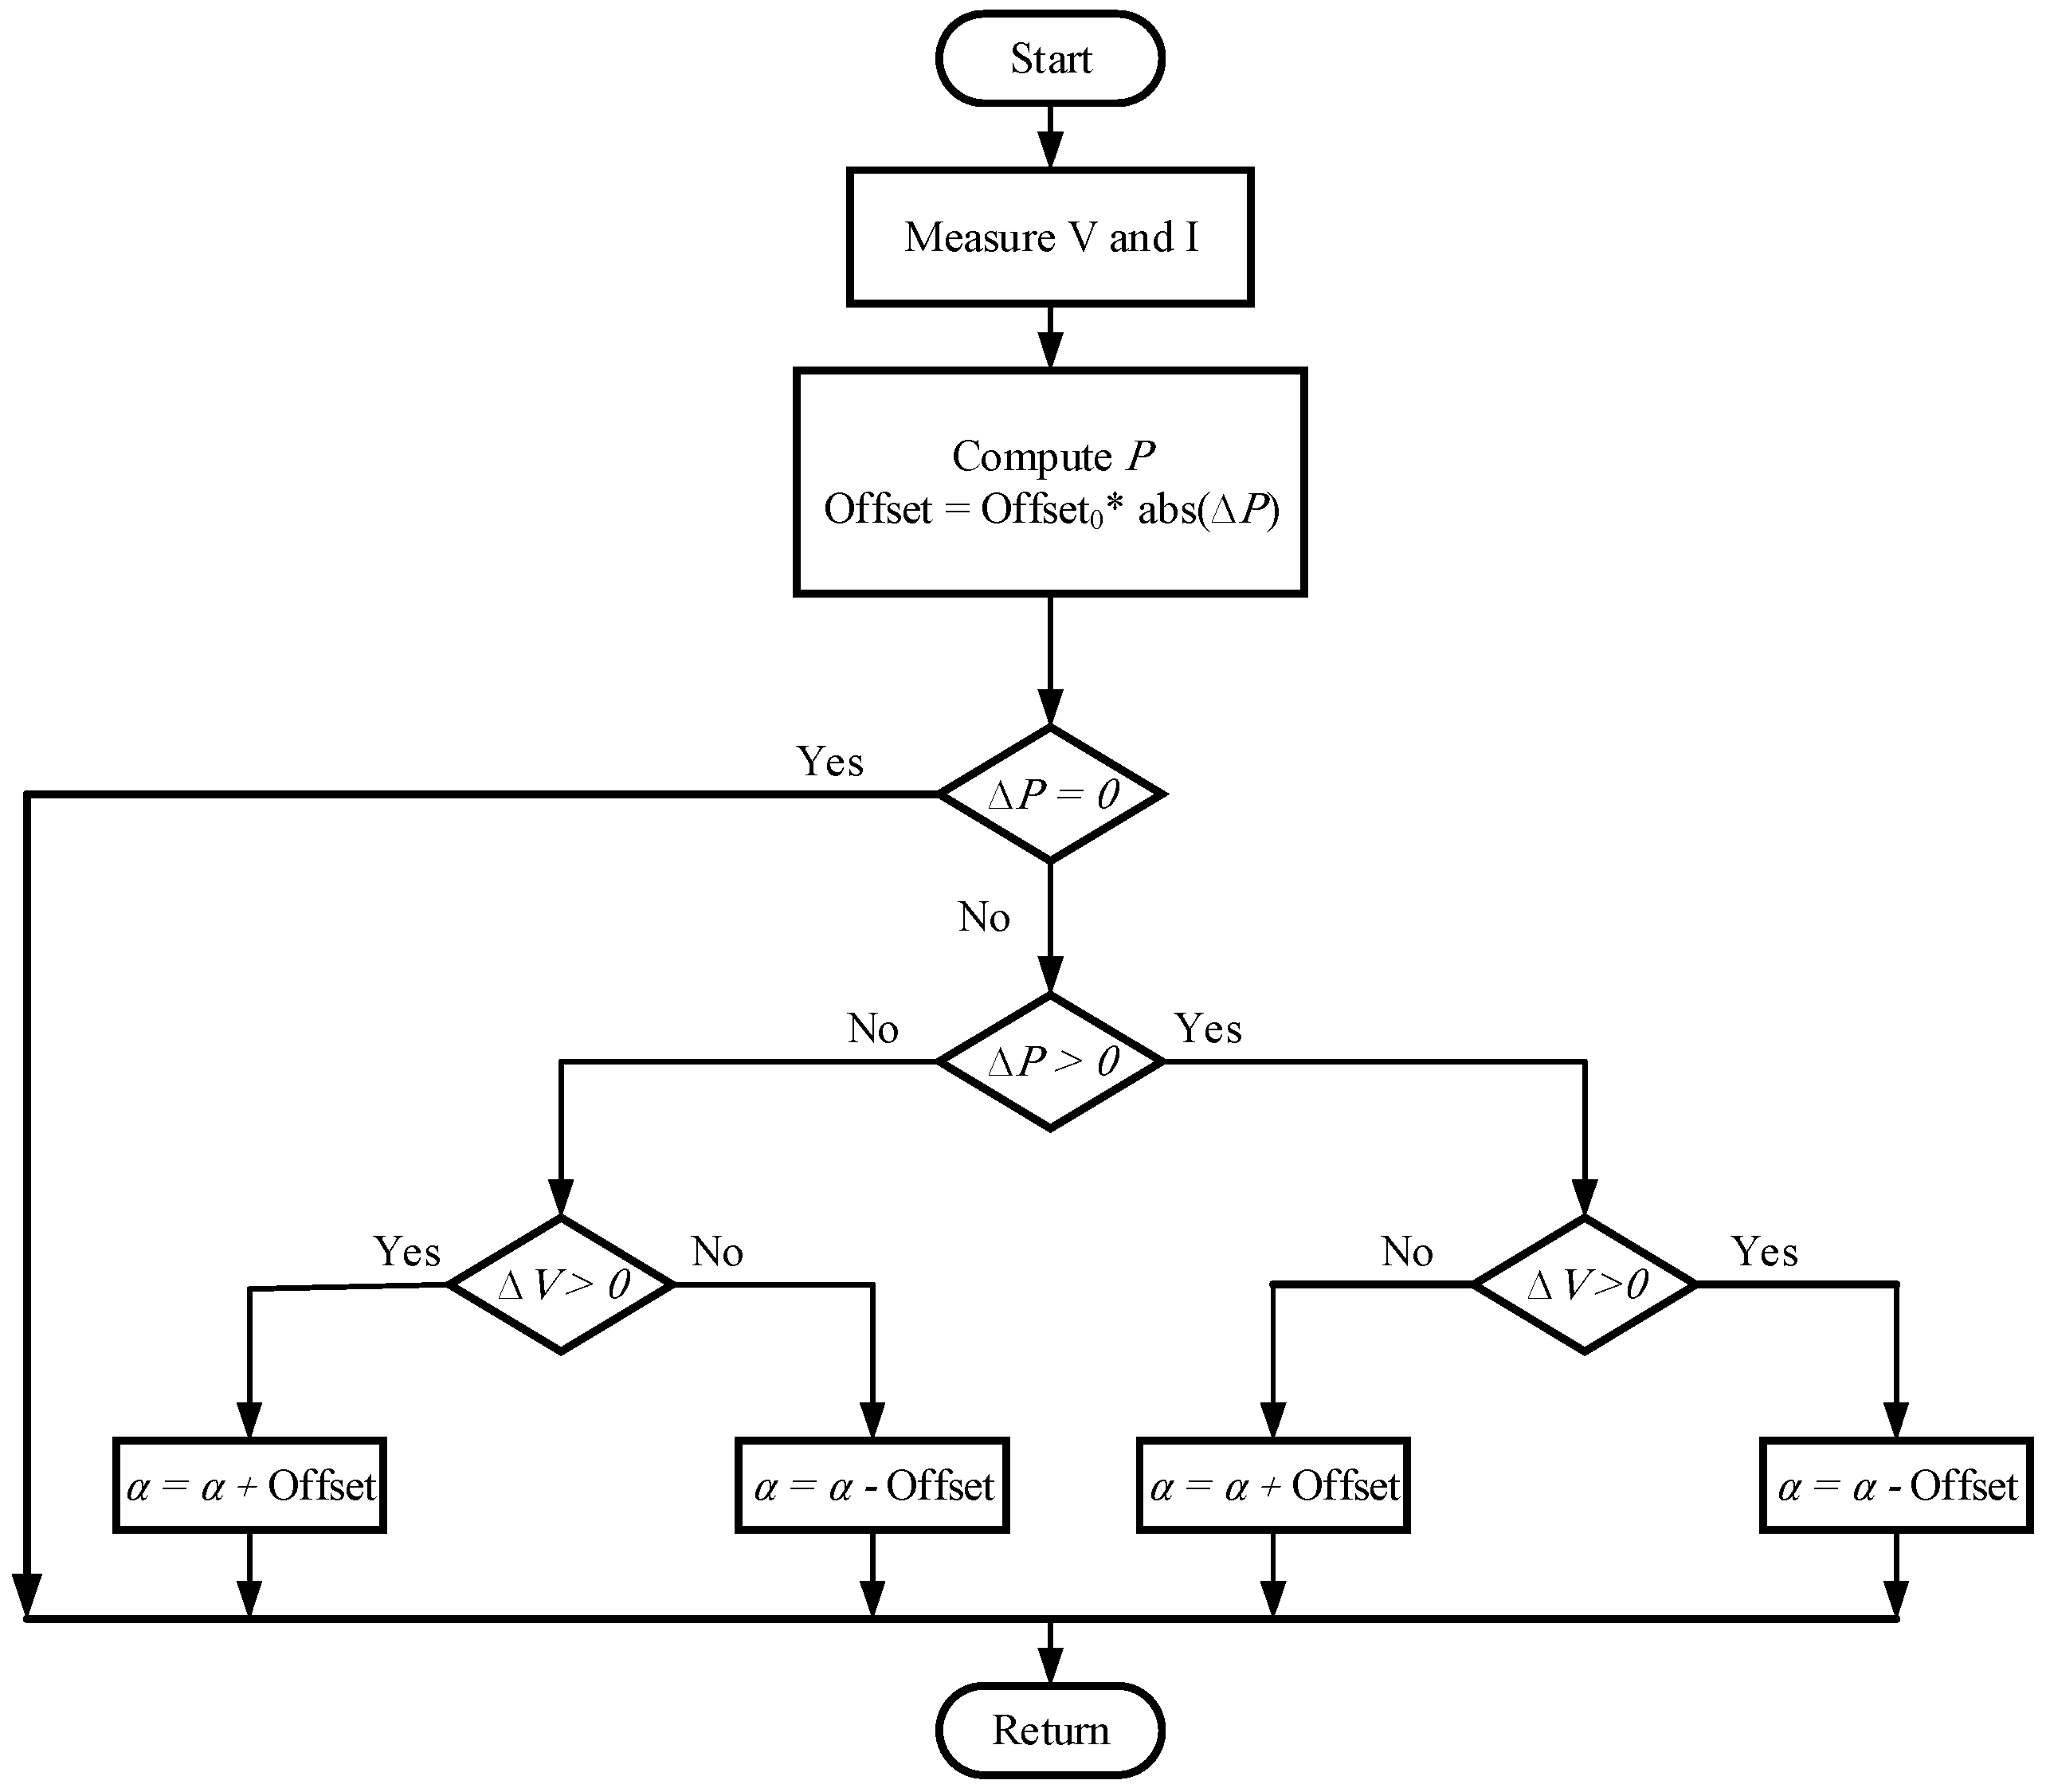
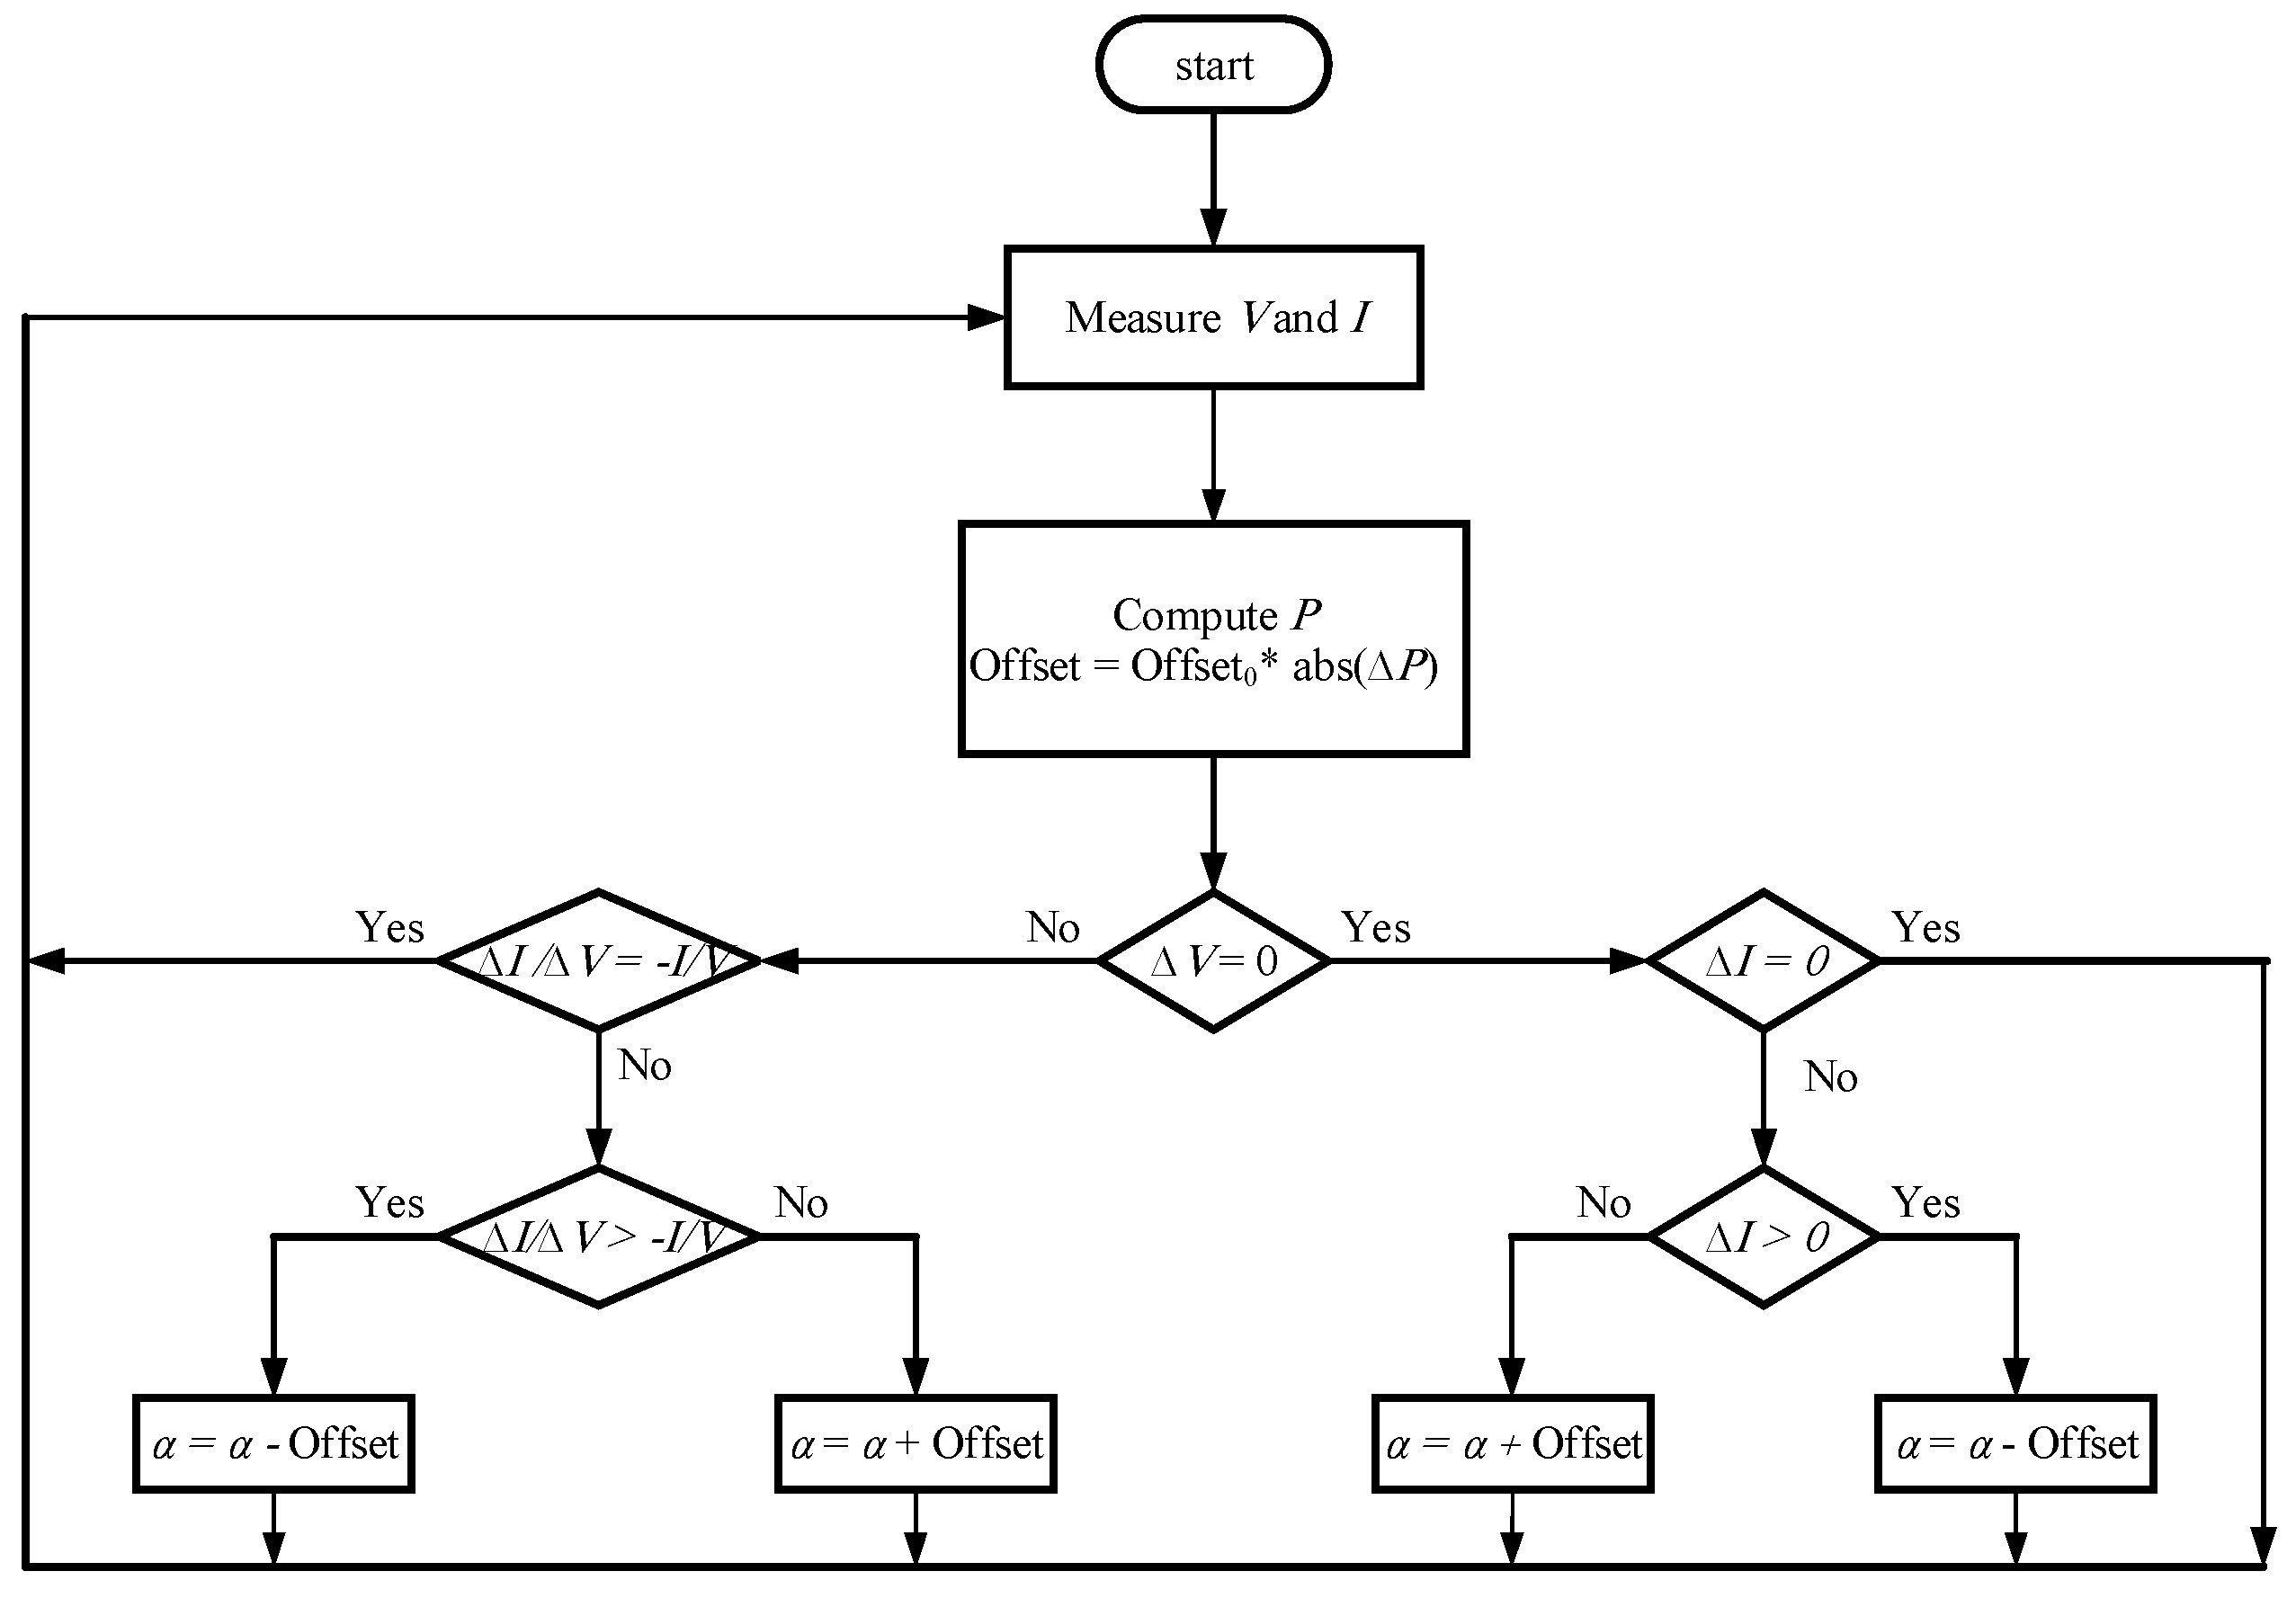
3.2. Modified MPPT Algorithms

Based on the discussion mentioned above, in this subsection, we present modified algorithms to address the issues related to the traditional P&O and INC techniques. The modification is based on the variable-step size as an alternative to using a fixed-step size. Additionally, a comptonization between fast response and steady-state oscillations will be met. The approach of variable step size adjustment was previously outlined in [37,38]. It used a scaling factor reliant on the variation in power (ΔP) and voltage (ΔV). Nevertheless, this modification may not display good tracing capabilities in abrupt irradiance variation [5]. So, to swamp this problem, we follow the modified algorithms presented in [5] using Matlab-Simulink, depending on an enhanced variable step size that relies solely on the power change (ΔP) with a scaling factor accustomed to the settlement of the response time and decreasing the steady-state oscillations in such a way as to reduce the oscillations of the output PV power as given in Figure 3 and Figure 4, which illustrate the flow chart of M-VSS-P&O and M-VSS-INC techniques, respectively. The power (P) is calculated from V × I, while the change in power is calculated as the difference between the new and old values (i.e., ΔP = Pnew − Pold).
It is well known, for the conventional P&O algorithm, that when irradiance increases, a drift problem occurs, which causes a delay in tracing the MPP. This is indicated in Figure 5, which displays the P-V curves for two cases of irradiance. If the operating point is at A, and there is an abrupt increase in insolation and the point will settle to point B. At point B, ΔP > 0 and ΔV > 0, so the algorithm imposes a lower duty cycle resulting in moving the operating point to C, which is separate from the MPP in the new curve. On the other hand, when using our modified P&O technique, it is noted when ΔP > 0 and ΔV > 0, ΔV will be negative because the offset is positive (see the flowchart in Figure 3) causing the duty cycle to decrease and, consequently, the voltage to decrease as indicated in Figure 5, which shows the new operating point at D implying a faster response toward the new MPP. The previous discussion demonstrates that our modified P&O algorithm is a drift-free technique.

4. Results and Discussion
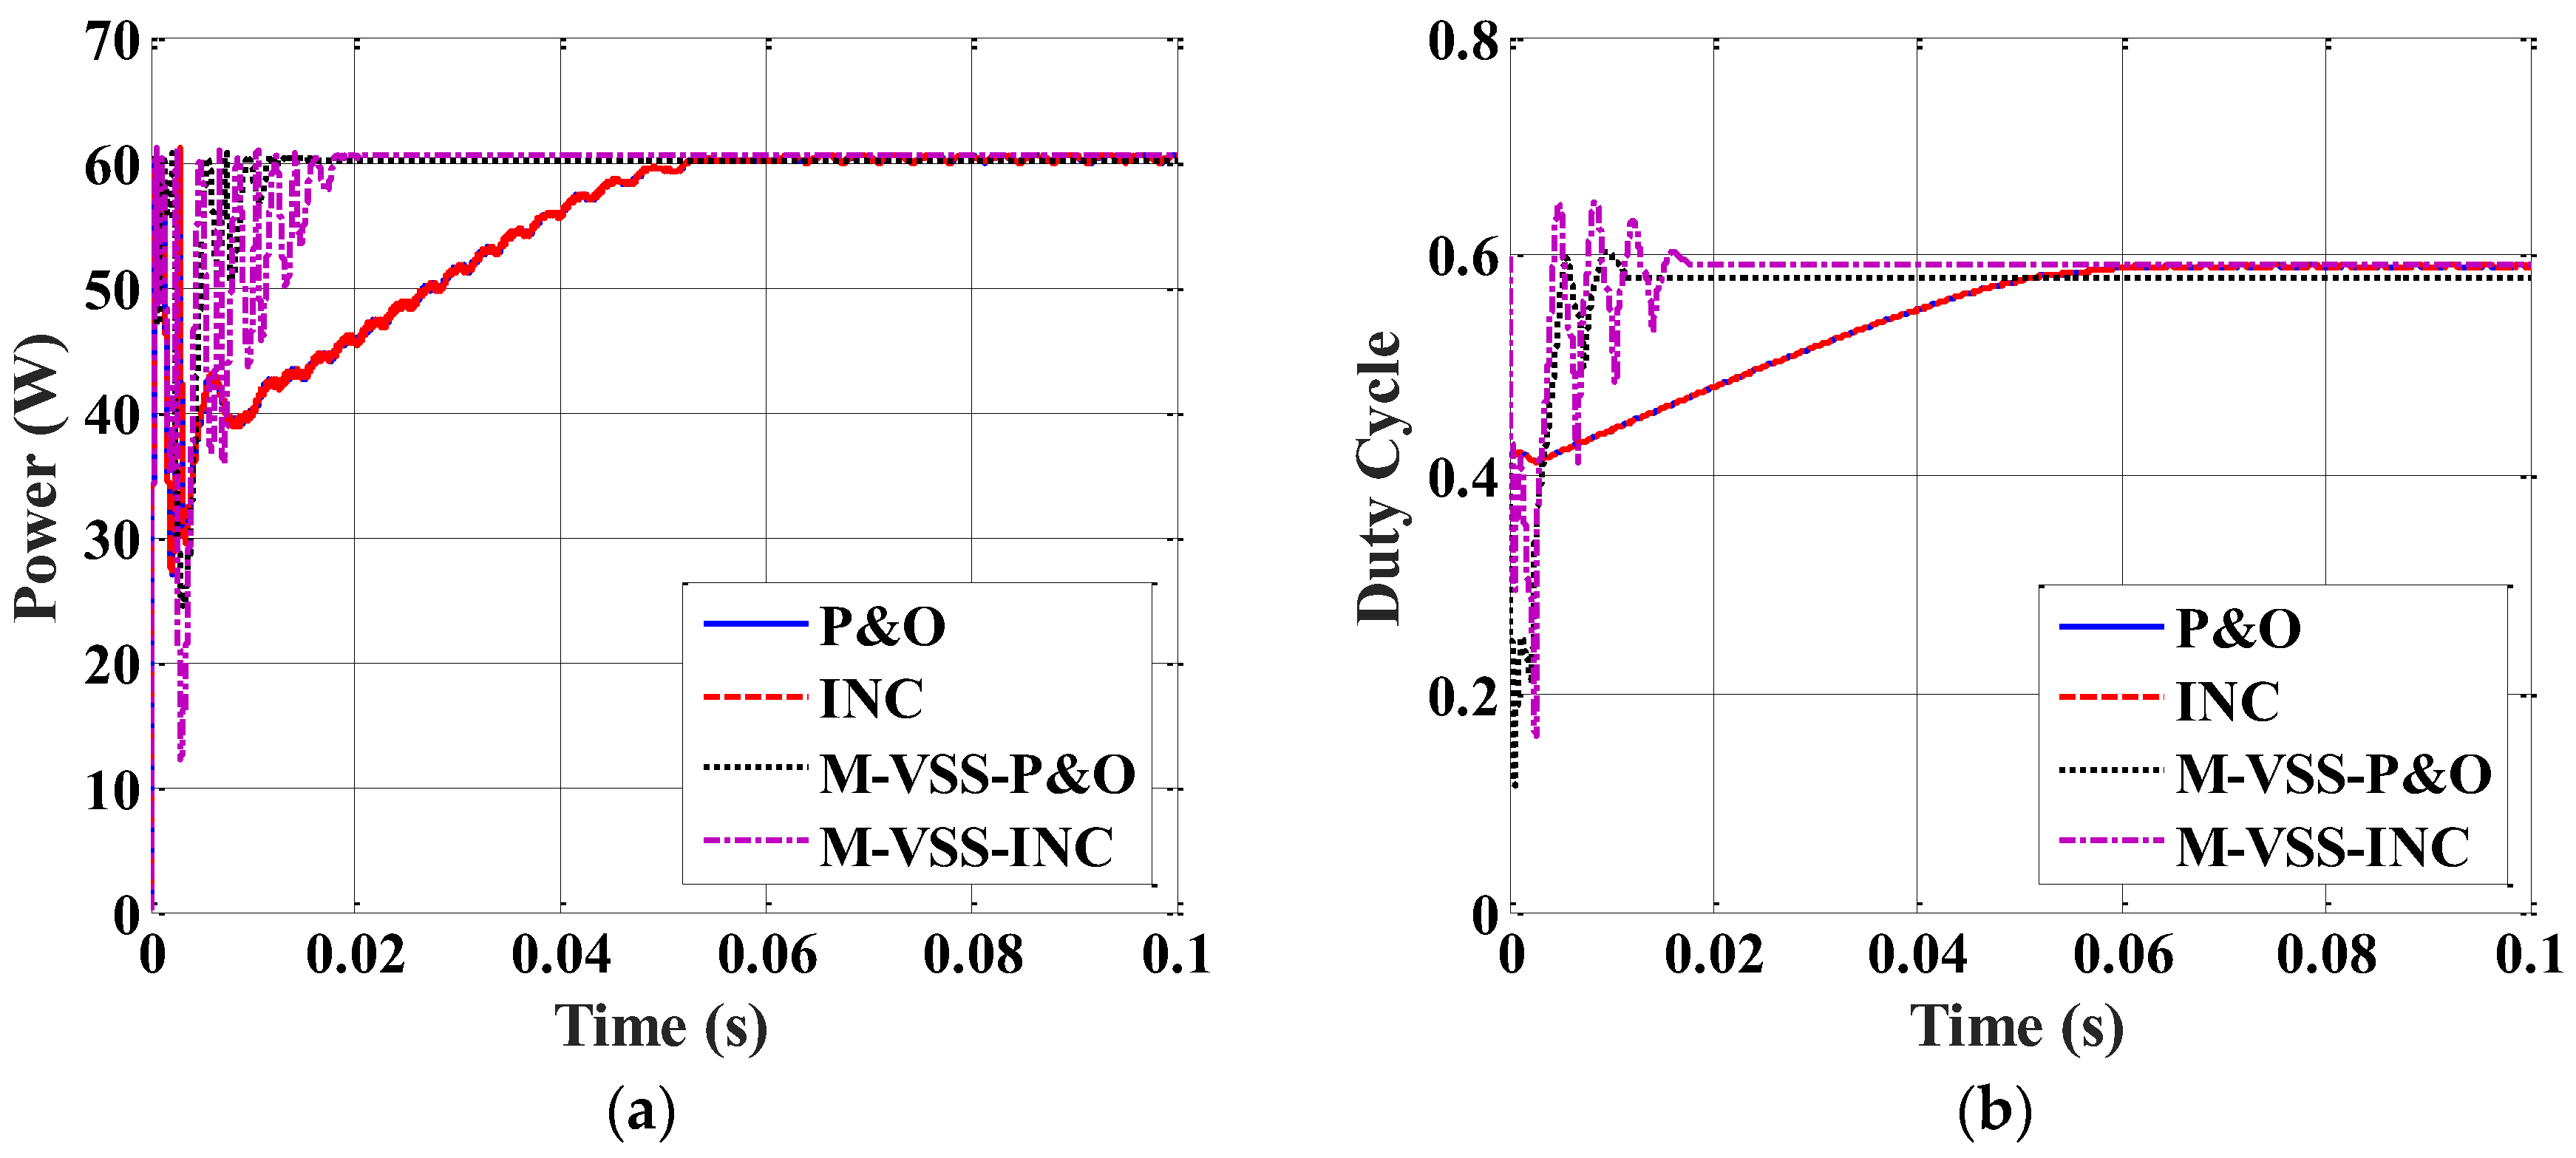
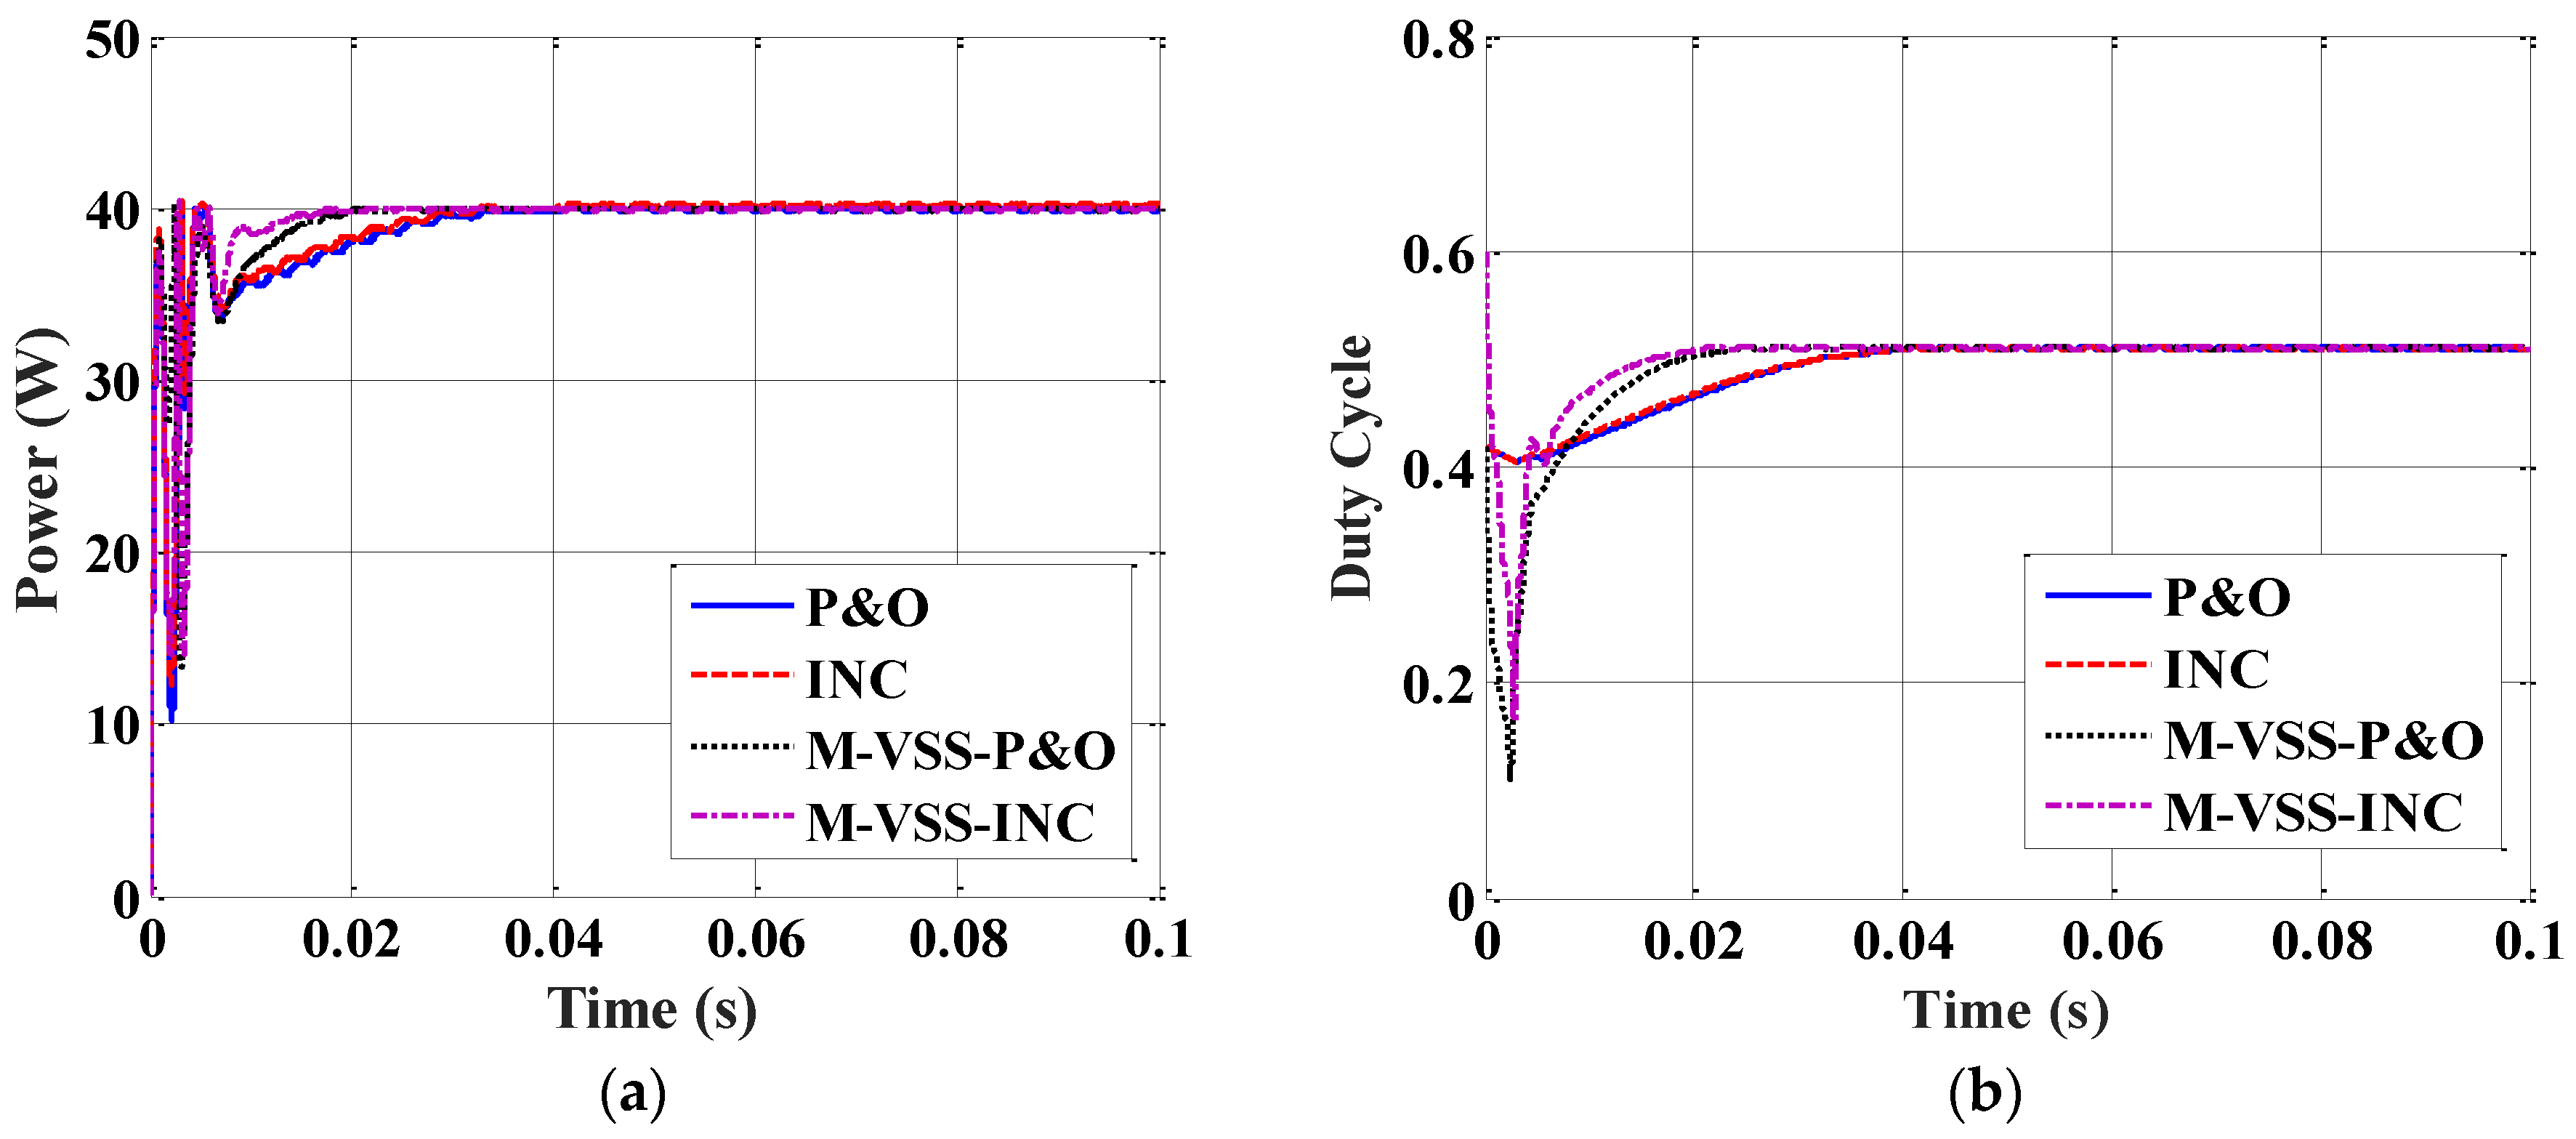
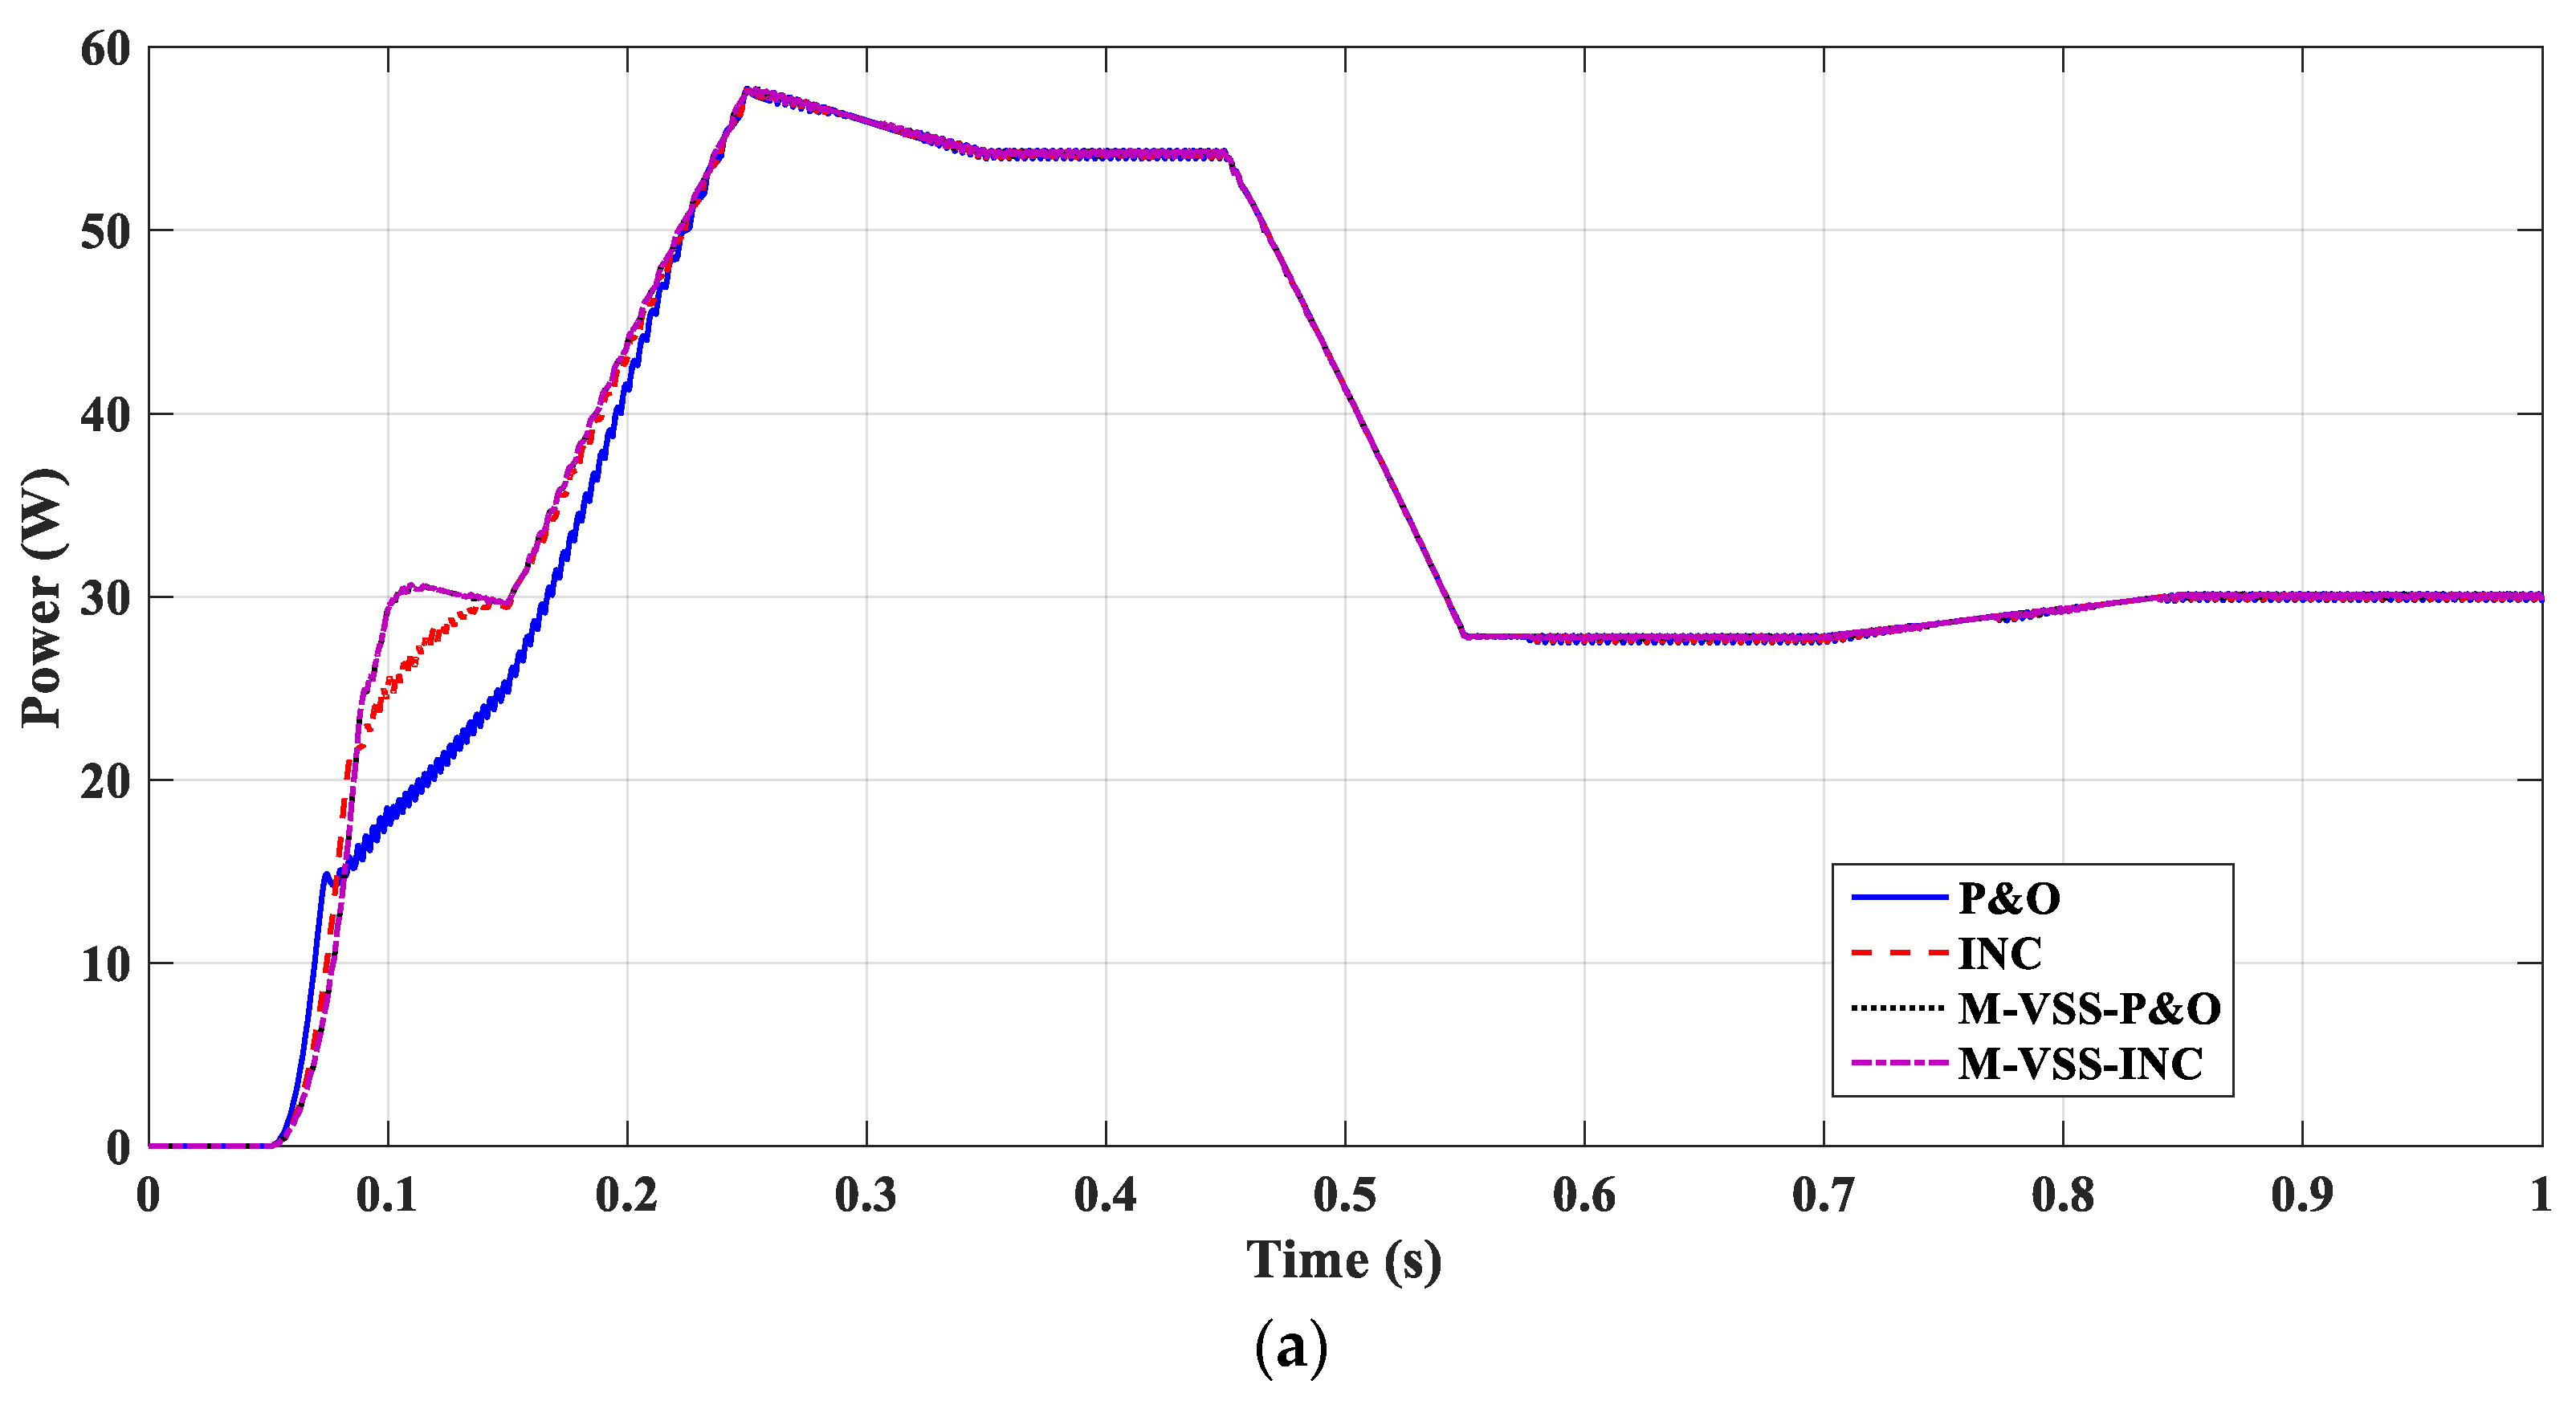
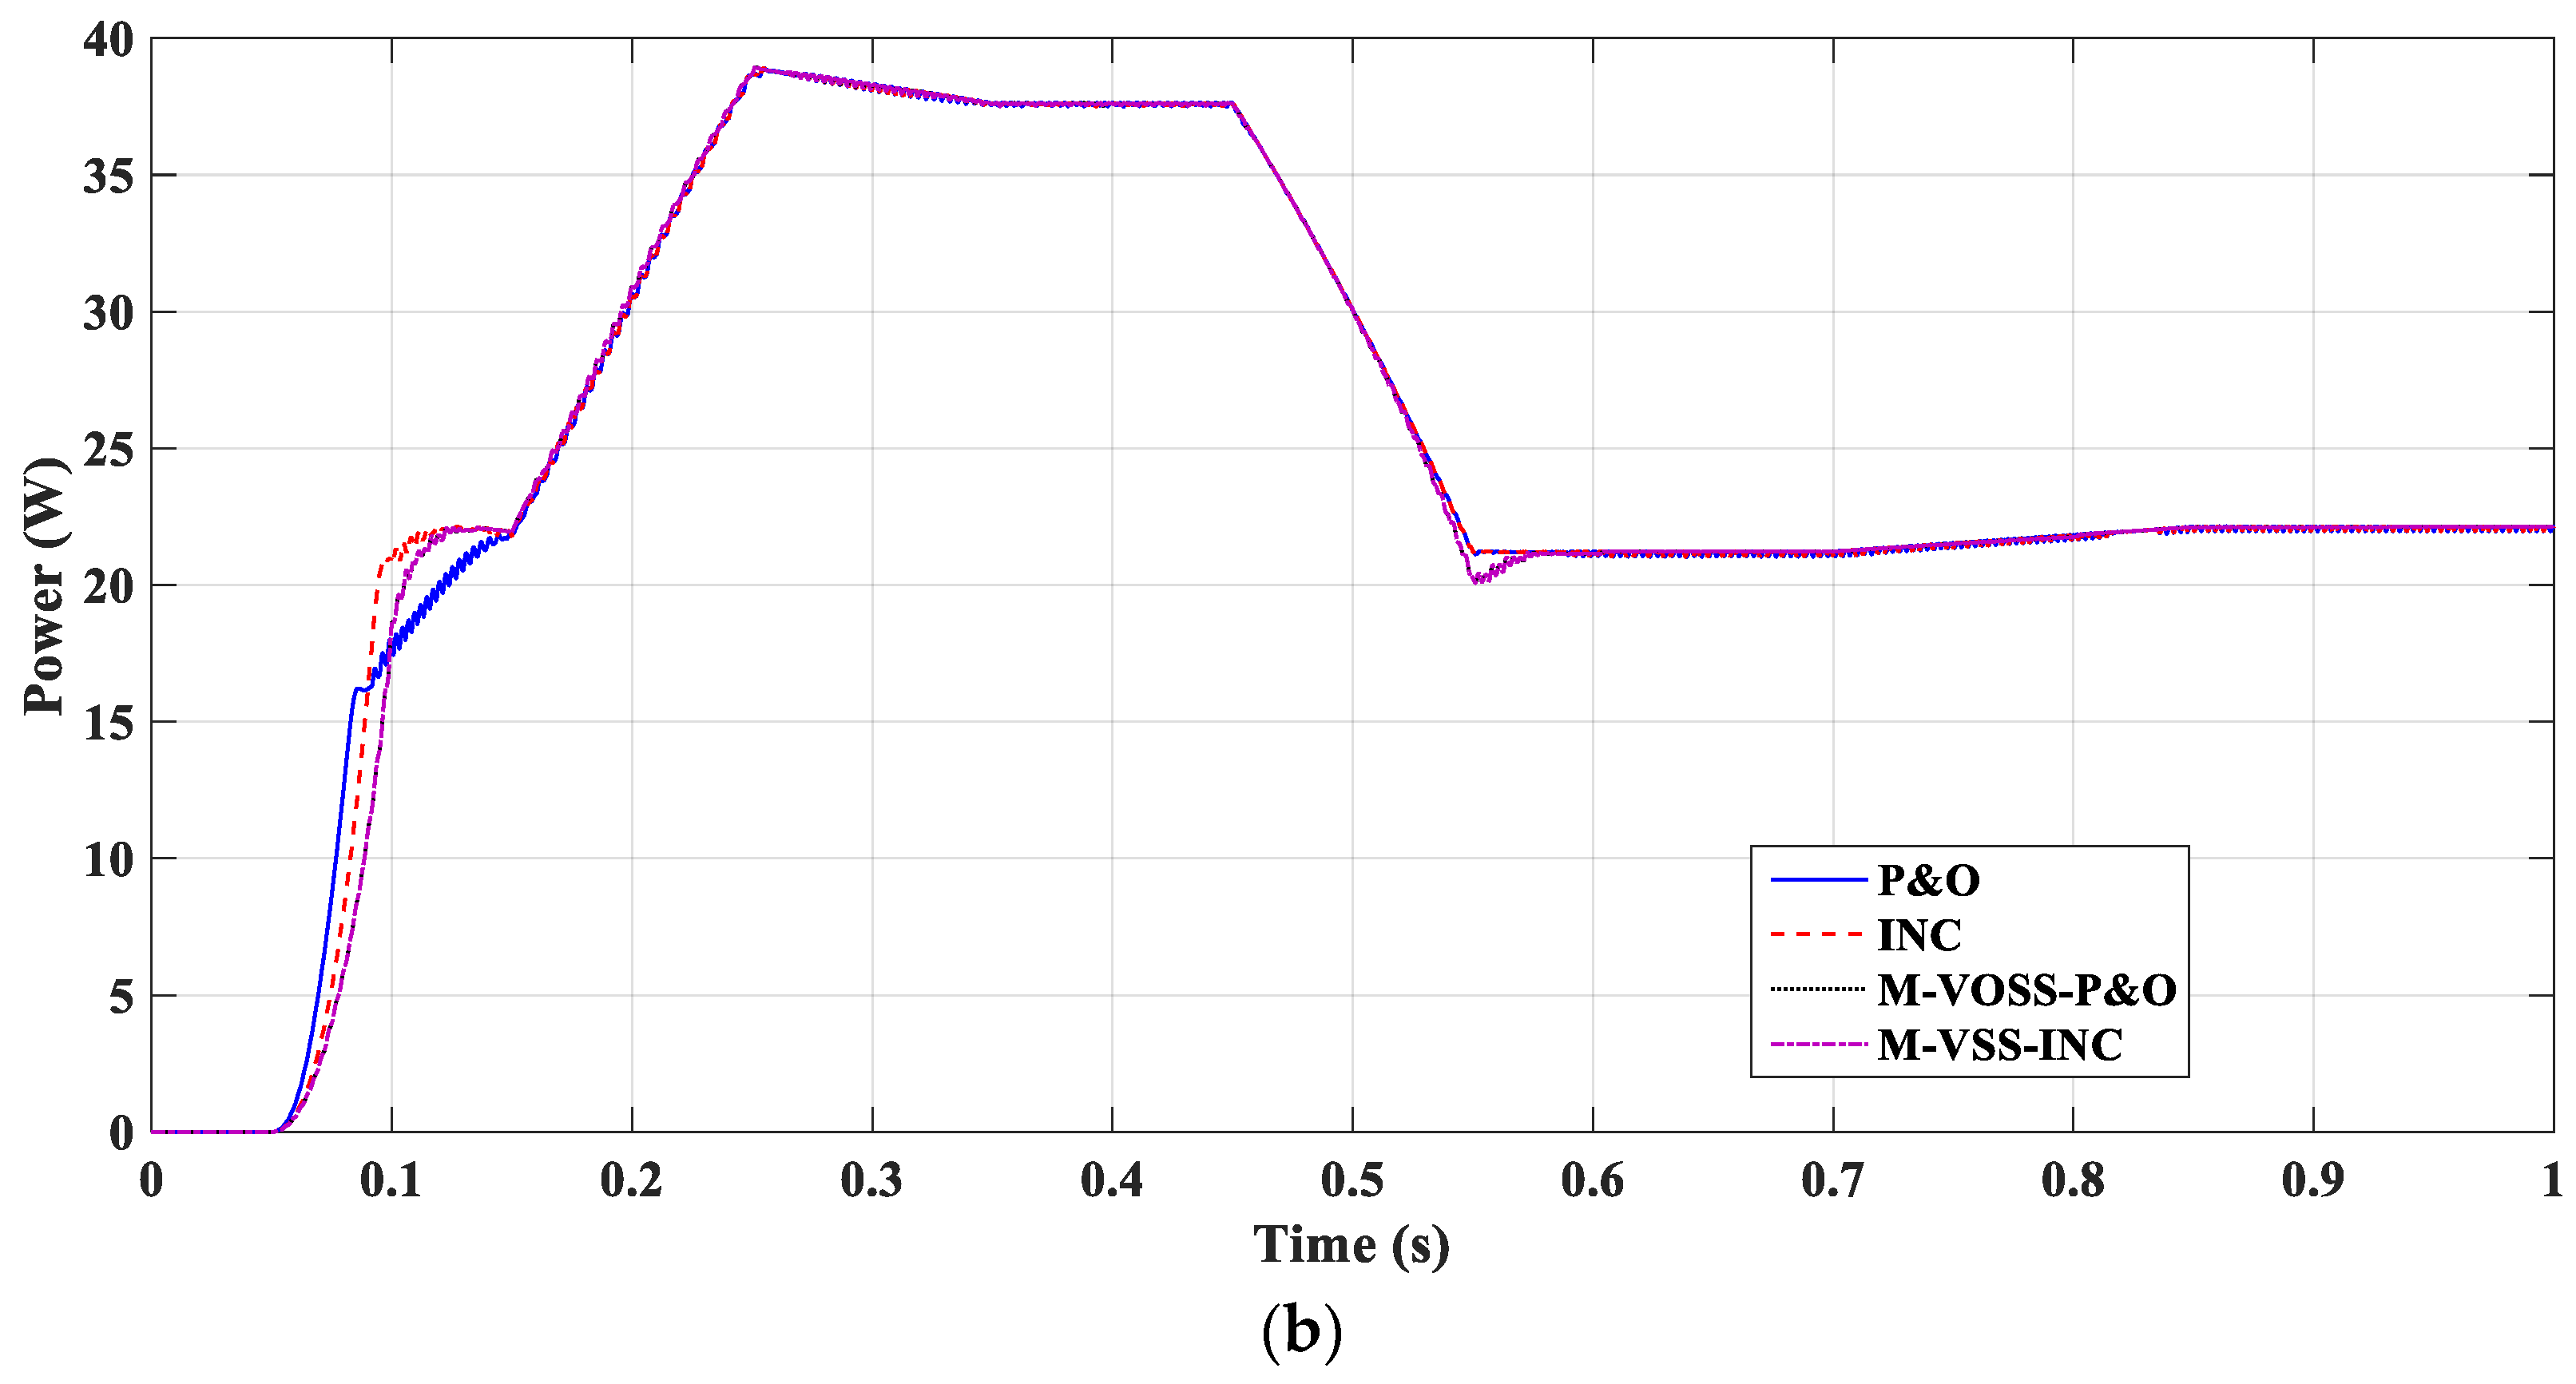
This section is concerned with presenting the tests of traditional and enhanced techniques: P&O, INC, and the modified P&O and INC, using MATLAB-Simulink to explore the steady-state and dynamic performance results by utilizing two distinct kinds of solar panels, MSX60 and ST40, whose types are polycrystalline thin films, respectively. Simulations are carried out and presented for standard test conditions and varying operating circumstances in ambient temperature and incident solar irradiation to investigate and compare the algorithm’s efficiency regarding the response time desired to trace the peak power point and steady-state power oscillations and converter tracking efficiency.

4.1. Test under STC

Figure 6 shows the polycrystalline cell MSX60 performance using the four MPPT algorithms. All simulations are performed at an irradiance of 1000 W/m2 and 25 °C. According to the simulations observed in the figure, the MPP was reached using both traditional P&O and INC algorithms, but the output power had a high percentage of oscillations (see Figure 6a). In contrast, the efficiency of the cell performance can be enhanced using the modified versions of the classical methods, M-VSS-P&O and M-VSS-INC. As observed in the figure, the M-VSS-P&O algorithm (58% duty cycle) was the faster algorithm among the four algorithms to obtain the MPP with the same o/p power of P&O and INC techniques (see Figure 6b). While the Modified Variable Step Size INC algorithm (59% duty cycle) reached the MPP with a quicker response time (18.22 ms) than the classical methods, it was the only algorithm among the four algorithms that achieved 100% power efficiency with negligible steady-state oscillations.
In the same manner, and according to the results presented in Figure 7, another solar cell (thin-film ST40) was used to test the four algorithms’ performance. A comparison between the performances of the four MPPT algorithms using both cells is listed in Table 3. Accordingly, the performance efficiency of the traditional P&O in both cells can be noted as the lowest efficiency compared to the other algorithms. The algorithm also presents a higher level of oscillations to arrive at the MPP. Furthermore, the INC algorithm typically operates in the same way as P&O in the MSX60 panel in tracking the MPP. Nevertheless, corresponding to the ST40 cell simulations, it is obvious that all trackers could achieve a conversion efficiency of approximately 100%; both traditional techniques require a similar duration to operate at the same point (~34.0 ms). In contrast, the updated modified algorithms in MSX60 cell simulations were able to improve the efficiency of the solar cell to achieve the panel’s full available power to hit the MPP with negligible oscillations quicker than traditional high oscillation algorithms. In addition, the M-VSS-INC improved the performance of the MPPT controller to 100% in 18.22 ms.
In summary, under STCs, the adjustments performed for both traditional P&O and INC algorithms increased the steady-state efficiency of both solar cells to achieve the full usable o/p power from the panel and grasp the MPP quicker than traditional algorithms that have low oscillations for both cells. However, according to the observations of both cells, the M-VSS-INC was proven to be the most efficient algorithm among the three algorithms.

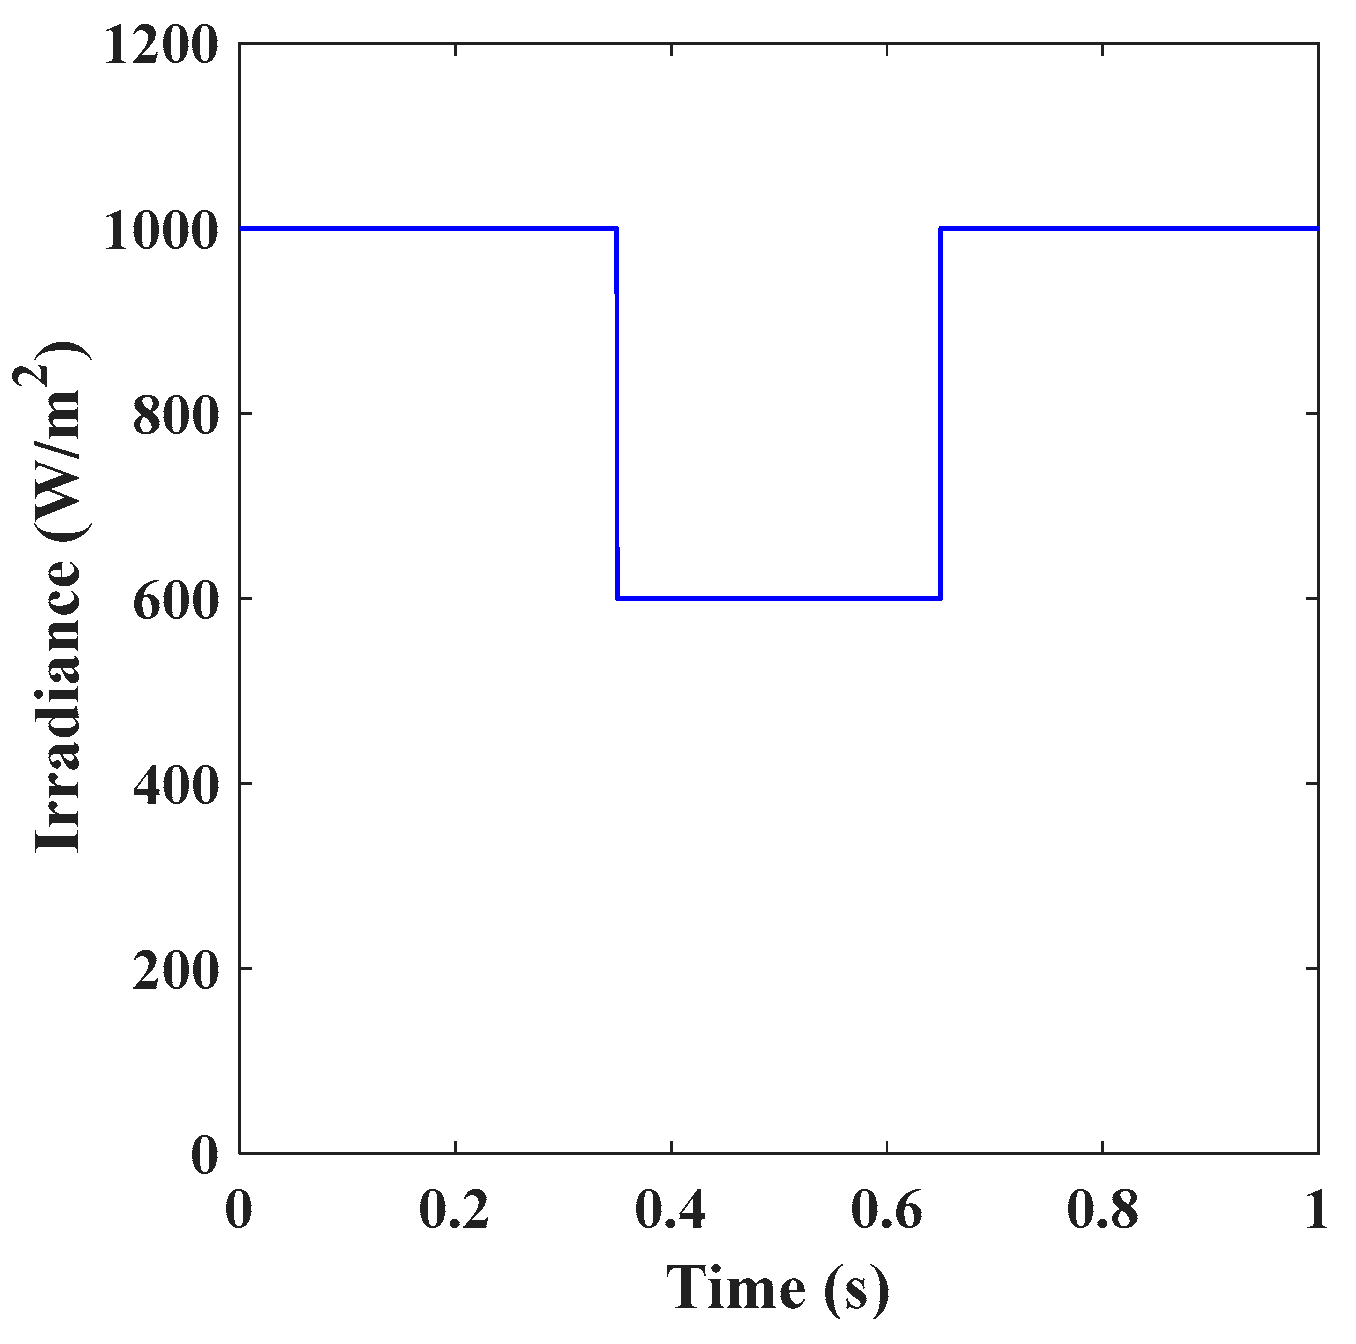
4.2. Test under an Abrupt Variation in Irradiance with Constant STC Temperature

To extend our analysis to the four mentioned MPPT techniques under a constant STC temperature, a sudden variation in irradiance was examined for both solar cells as follows (Figure 8): The irradiance was initially 1000 W/m2 but was unexpectedly reduced to 600 W/m2 at t = 0.35 s; then, upon reaching 0.65 s, an extra variation from 600 W/m2 to 1000 W/m2 was abruptly applied; eventually, the radiation remained steady at 1000 W/m2 until the completion of the simulation time at t = 1 s.
In conjunction with [39], simulations were carried out to ensure the performance and efficiency of the algorithms, in particular, the updated algorithms to meet the MPP. Checking the MSX60 cell, as seen in Figure 9a, the four MPPTs were initially performed in the STC case addressed above. When the irradiance was abruptly reduced to 600 w/m2, both classical algorithms were able to detect the MPP but many oscillations occurred, exhibiting the same phenomena with a response time of 379.6 ms and an output power of 37.13 W, displaying an approximate error of 26.9 ms.
In contrast, with a faster response time of 367.5 ms and a minor error of 17.5 ms, both modified strategies could congregate to 37.14 W, almost the equivalent MPP of the conventional algorithms. Moreover, the enhanced algorithms succeeded in minimizing the steady-state oscillations around the MPP. In comparison to both P&O and INC (60.14 W), both modified MPPTs can perceive the abrupt spike in solar irradiance even better and faster, with an inaccuracy of just 7.2 ms and a minor reduction in power (59.52 W) in 690.4 ms.
A similar evaluation of the four controllers on the ST40 solar cell is indicated in Figure 9b. Both P&O and INC algorithms were able to monitor and detect the MPP for solar radiation unexpectedly reduced to 600 W/m2, but with a high percentage of oscillations, demonstrating identical behavior with a performance power of 26.4 W in a response time of 381.8 ms, with almost 34.8 ms error. In comparison, both modified algorithms can converge to an approximately identical highest power of 26.43 W but quicker than the classical algorithms with a response time of 363.4 ms and a smaller error of 13.4 ms.
Furthermore, the improved algorithms minimized steady-state oscillations all over the MPP. Furthermore, with a quicker reaction time, the enhanced algorithms could also recognize the abrupt rise in solar radiation with just a 25.2 ms error with an almost equivalent o/p power of 40.02 W related to P&O and INC with a time of 45.2 ms. Similar to the performance in the polycrystalline cell, the output power curves of the improved techniques showed better performance and fewer oscillation levels than the output power of the other conventional MPPT approaches. However, in the thin-film solar cell simulations, both modified algorithms were better in the MPP tracking process with a sudden increase and sudden reduction in irradiance. In contrast, the polycrystalline solar cell simulations showed different behavior in tracking as M-VSS-P&O and M-VSS-INC prospered in tracking the sudden increase in the irradiance, but they gave slightly less power than the conventional algorithms; however, they were very fast with almost no oscillations around the MPP.

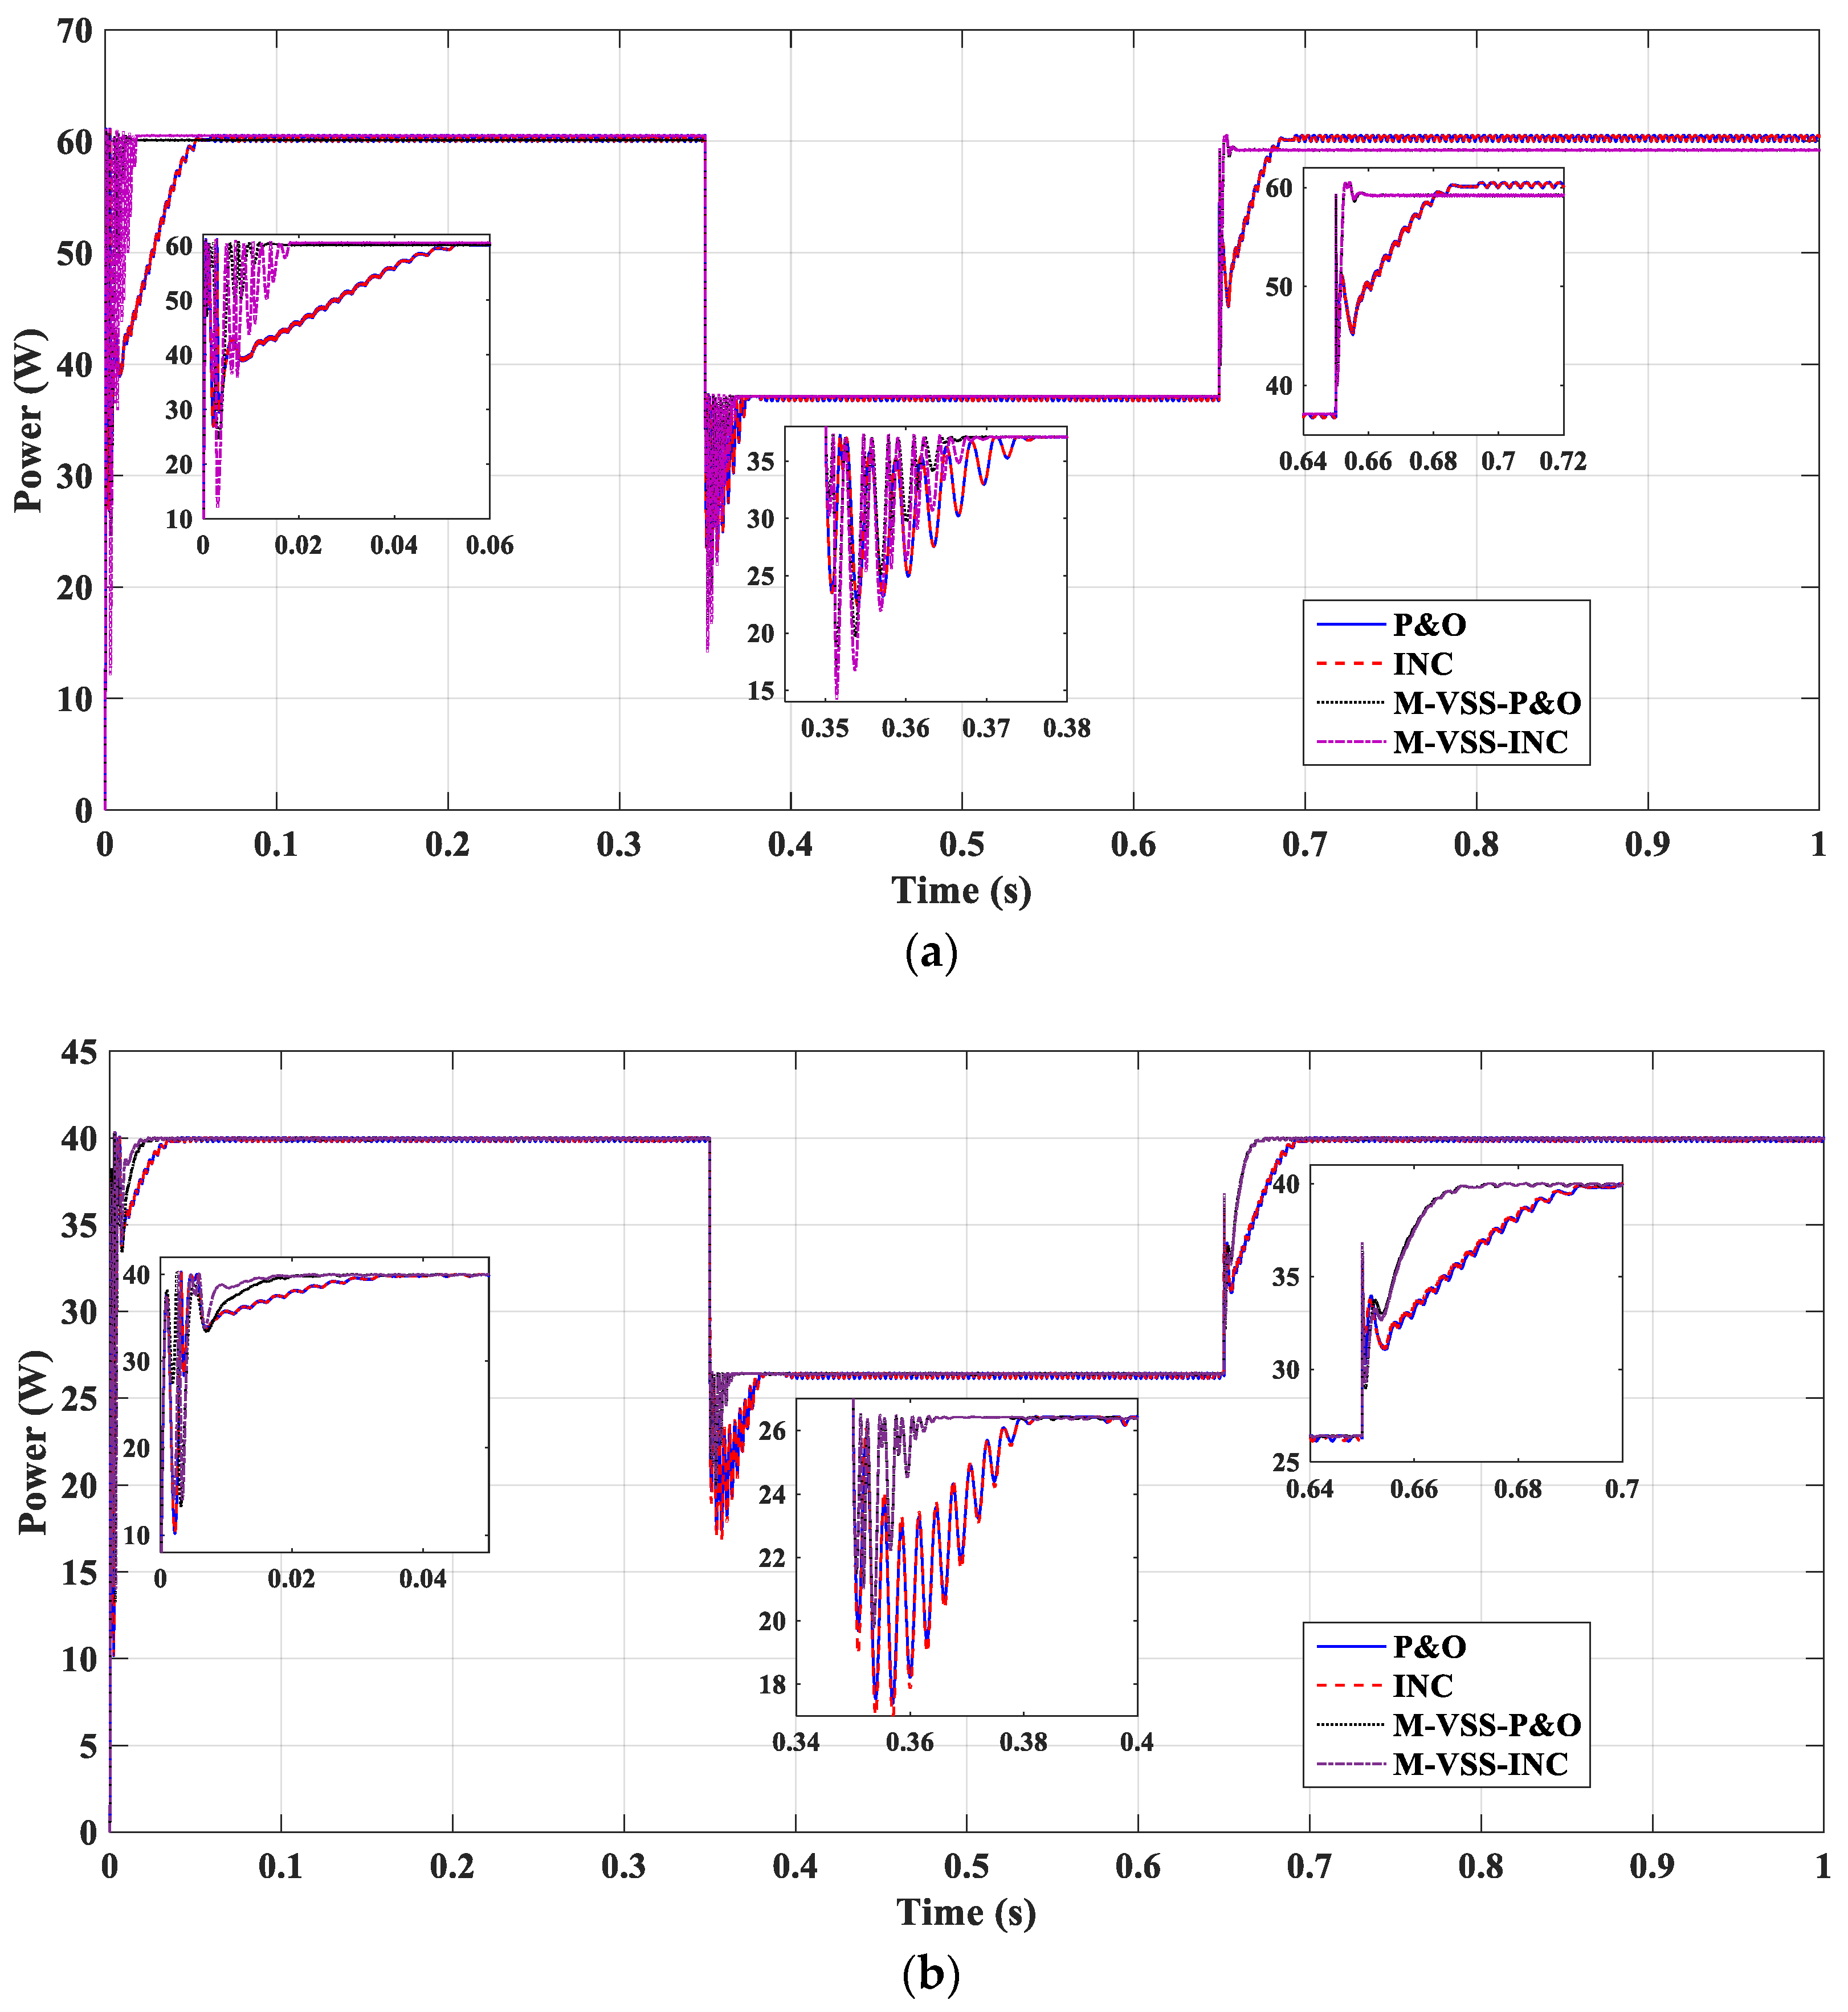
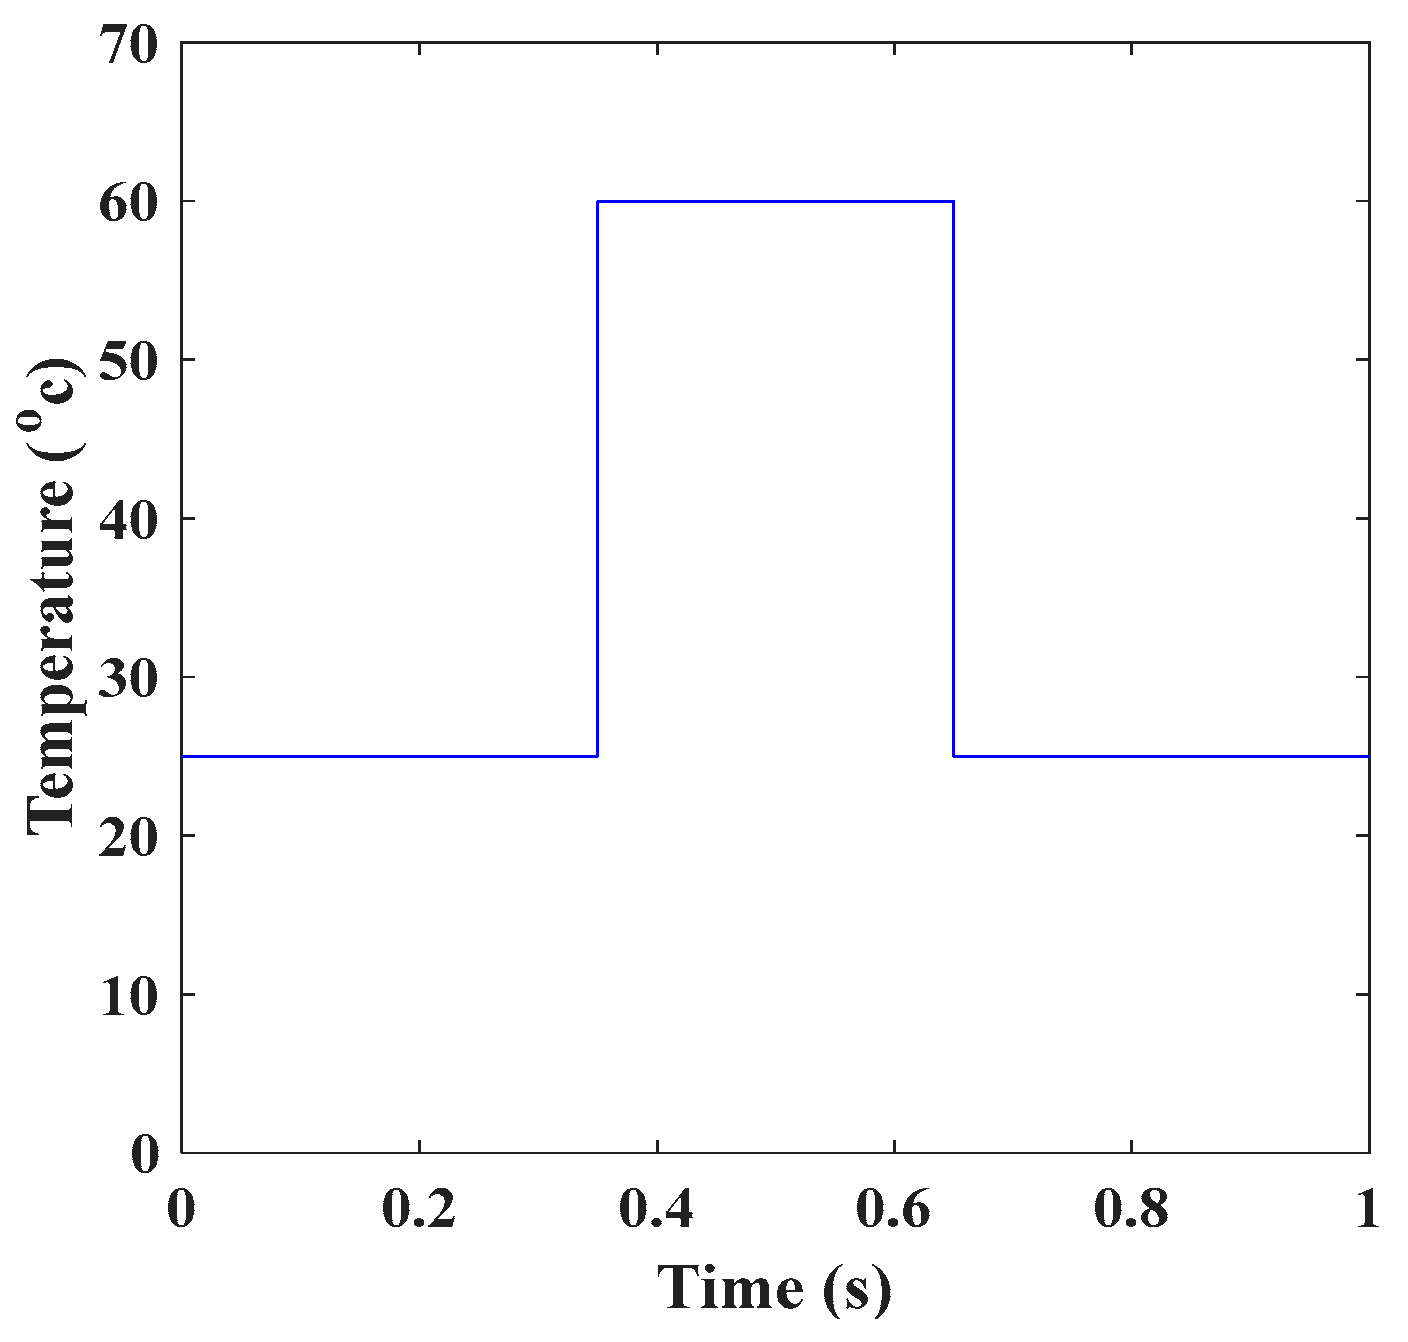
4.3. Test under an Abrupt Variation in Temperature with Constant STC Irradiance

Extending our study, to ensure the validity of the MPPTs in reaching the MPP, especially by the modified ones, another operating condition was inspired by [40] and performed on both solar cells using the four MPP tracking algorithms. Specifically, a sudden variation in temperature with a constant STC irradiance (1000 W/m2) was tested, as shown in Figure 10.
With the same value of irradiation (1000 W/m2), the temperature was initially at 25 °C and then it suddenly increased to 60 °C at t = 0.35 s; then, at 0.65 s, a drop in temperature from 60 °C to 25 °C was applied abruptly; eventually, the temperature was kept steady at 25 °C until the simulation time ended at 1 s. In the MSX60 solar cell test, as seen in Figure 11a, first, before 0.35 s, the algorithms completed the STC case as analyzed herein. At 0.35 s, when temperature increased to 60 °C, P&O and INC algorithms could track the MPP, with identical reactions in 362 ms with 53.88 W output power, with an approximate error of 12 ms. Furthermore, both modified algorithms converged to a higher MPP of 54.22 W and responded faster than the classical methods, with a similar response time of 356.5 ms and a slight error of 6.5 ms. Moreover, with negligible steady-state oscillations, the updated algorithms can also detect the abrupt drop in temperature that occurred at 0.65 s with a 7.5 ms error and a minor reduction in the power (60.18 W) relative to P&O and INC (60.48 W) in 656.5 ms.
Moreover, as presented in the simulation results related to the ST40 panel as seen in Figure 11b, as the temperature increased abruptly to 60 °C, all algorithms succeeded in tracking the peak point. The P&O algorithm could reach the MPP of 37.62 W in 357.7 ms. However, the INC algorithm succeeded in tracking the MPP slightly quicker than the P&O algorithm with a tracking time of 357.3 ms but with lower power of 37.03 W. In contrast, both improved techniques can converge faster than the traditional algorithms to the same MPP as P&O had the same response in 354.2 ms and a small error of only 4.2 ms and could minimize the oscillations in the vicinity of the MPP.
Furthermore, the enhanced techniques could also reveal approximately the same power of 40.02 W with a very fast response and a sudden decrease in the temperature with only 0.6 ms. In addition, P&O could reach its MPP of 39.97 W with a response time of 652.5 ms, whereas INC could achieve an MPP of 40.1 W but slower with a time of 654.7 ms. P&O and INC algorithms were able to monitor the peak point, showing the same behavior in the MSX60 cell, while both M-VSS-P&O and M-VSS-INC functioned superiorly with approximately the same response. However, in the ST40 solar cell, according to the observations, both M-VSS-P&O and M-VSS-INC algorithms showed better performance than both P&O and INC in the two sudden temperature changes; but in the case of the temperature increment, the INC algorithm gave slightly less power than the other three algorithms and slightly higher power than the other algorithms when a decrement in the temperature occurred.

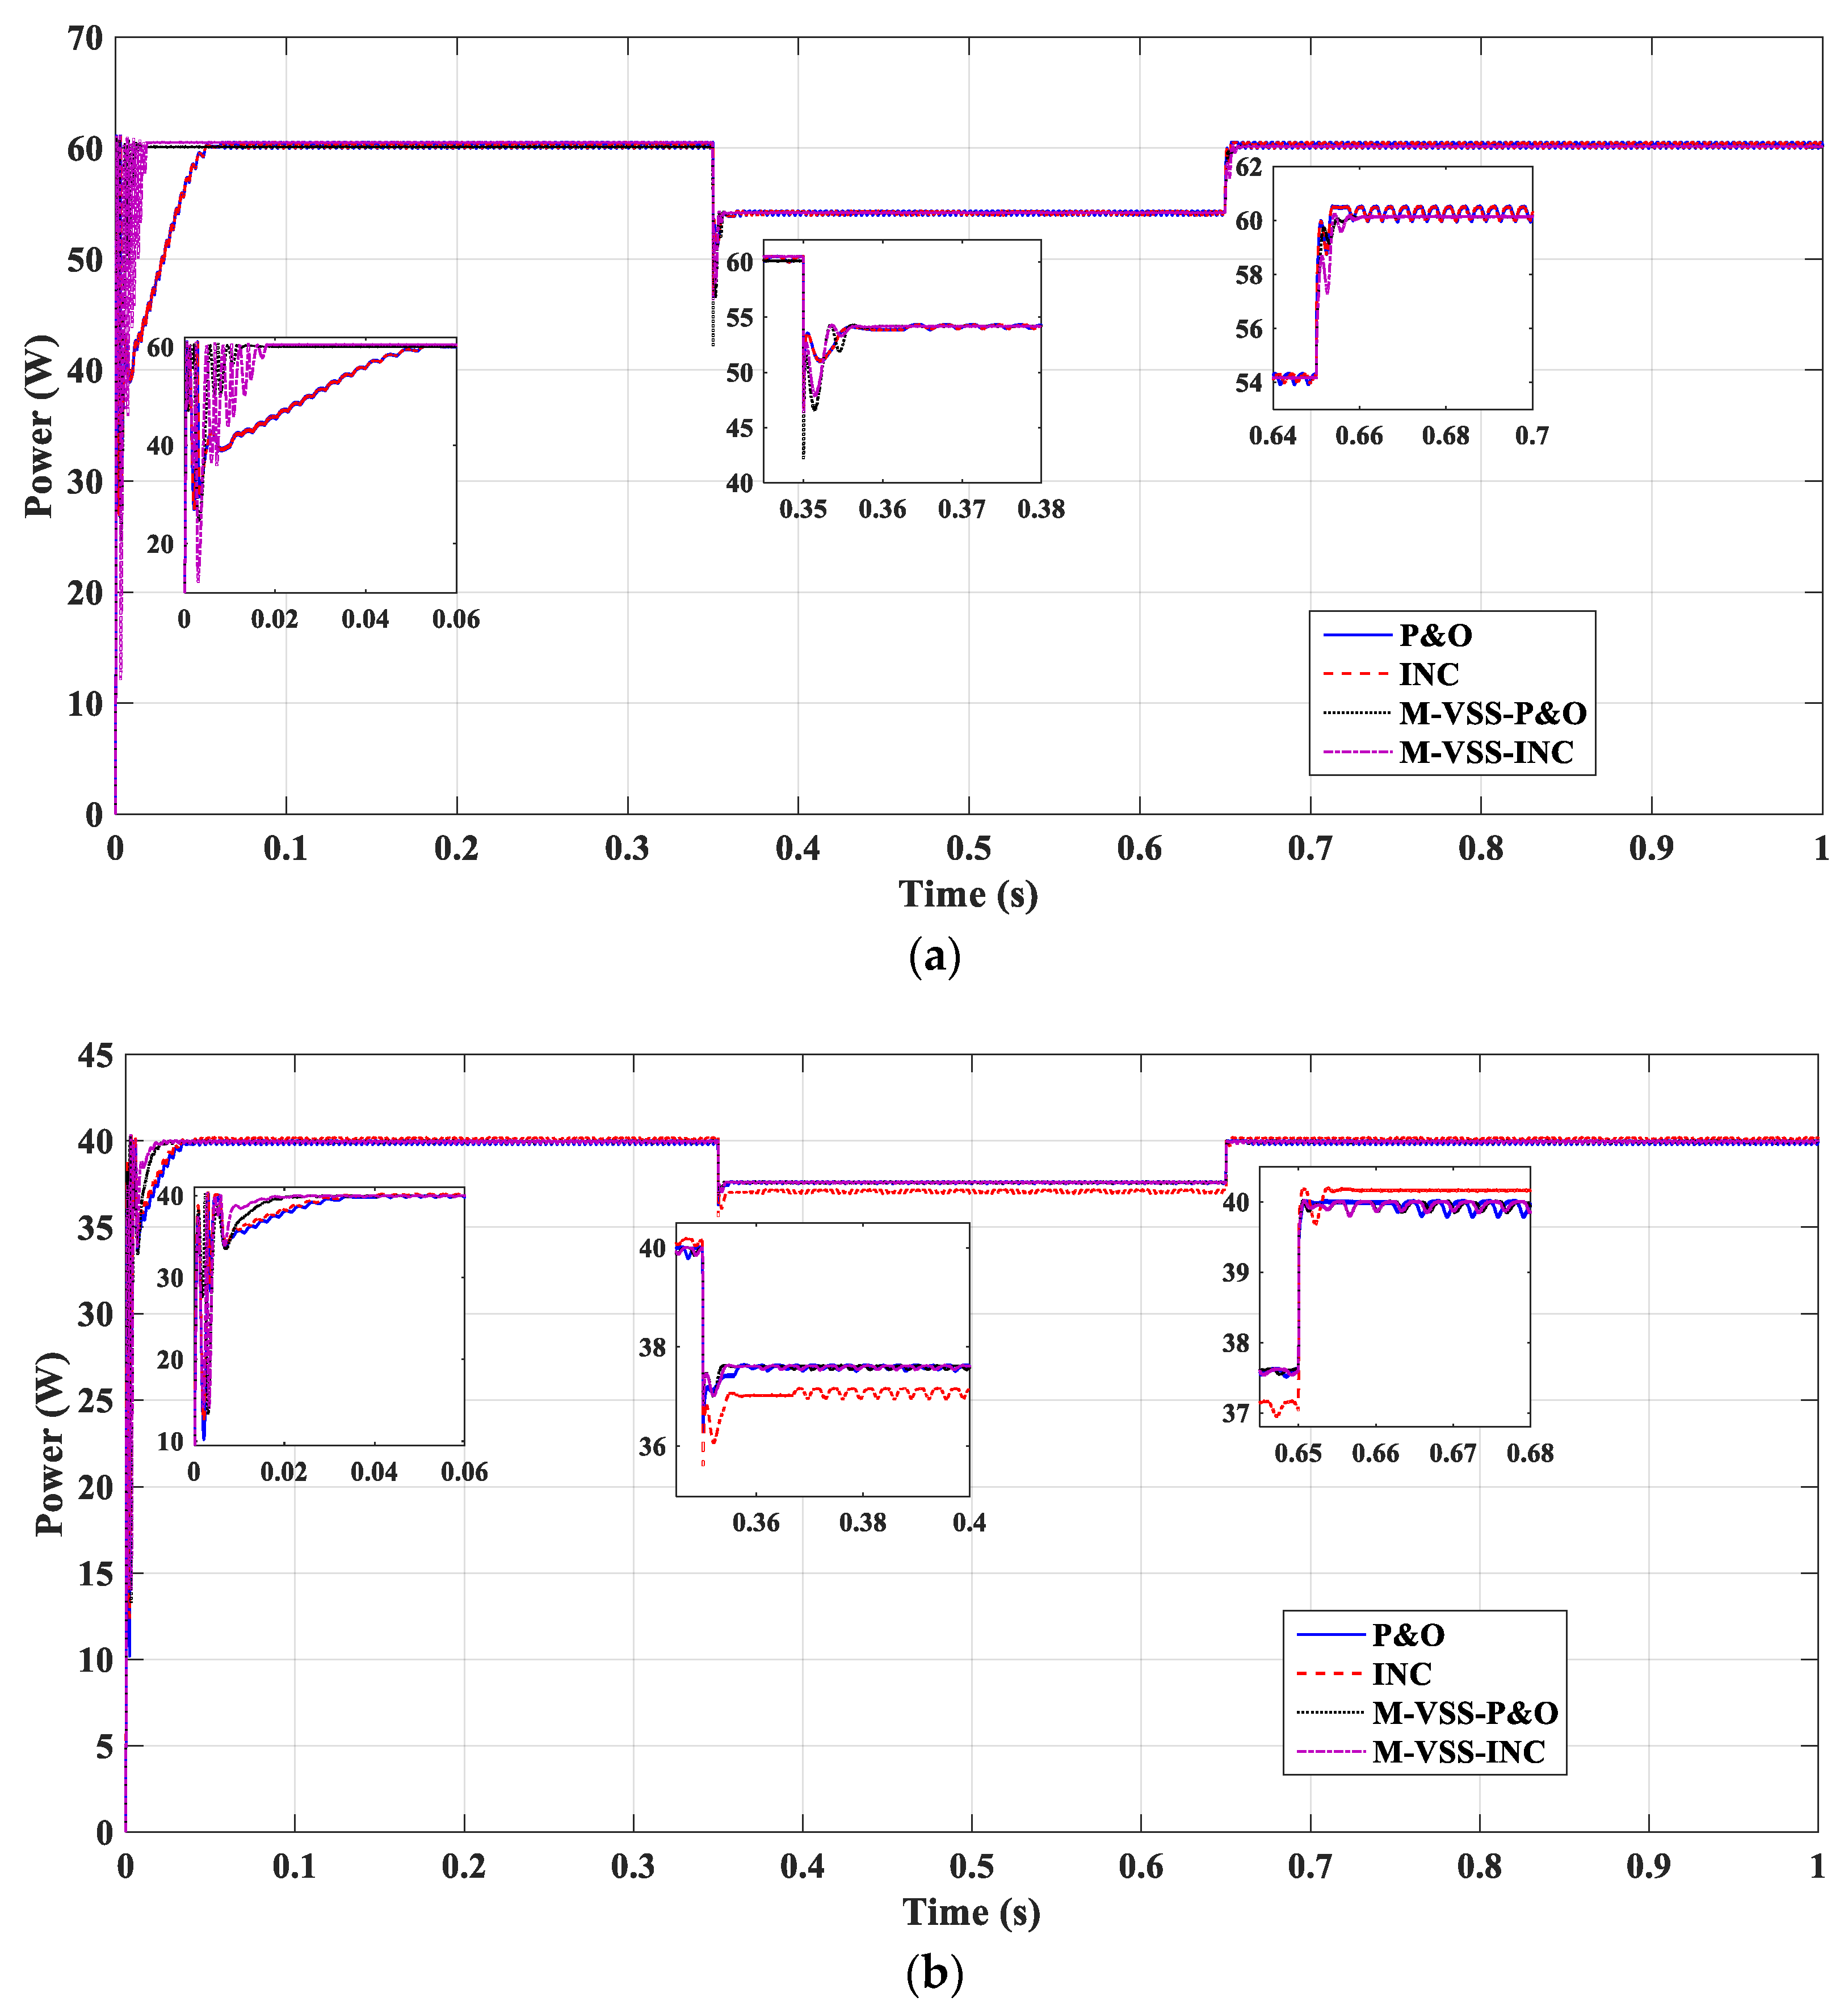
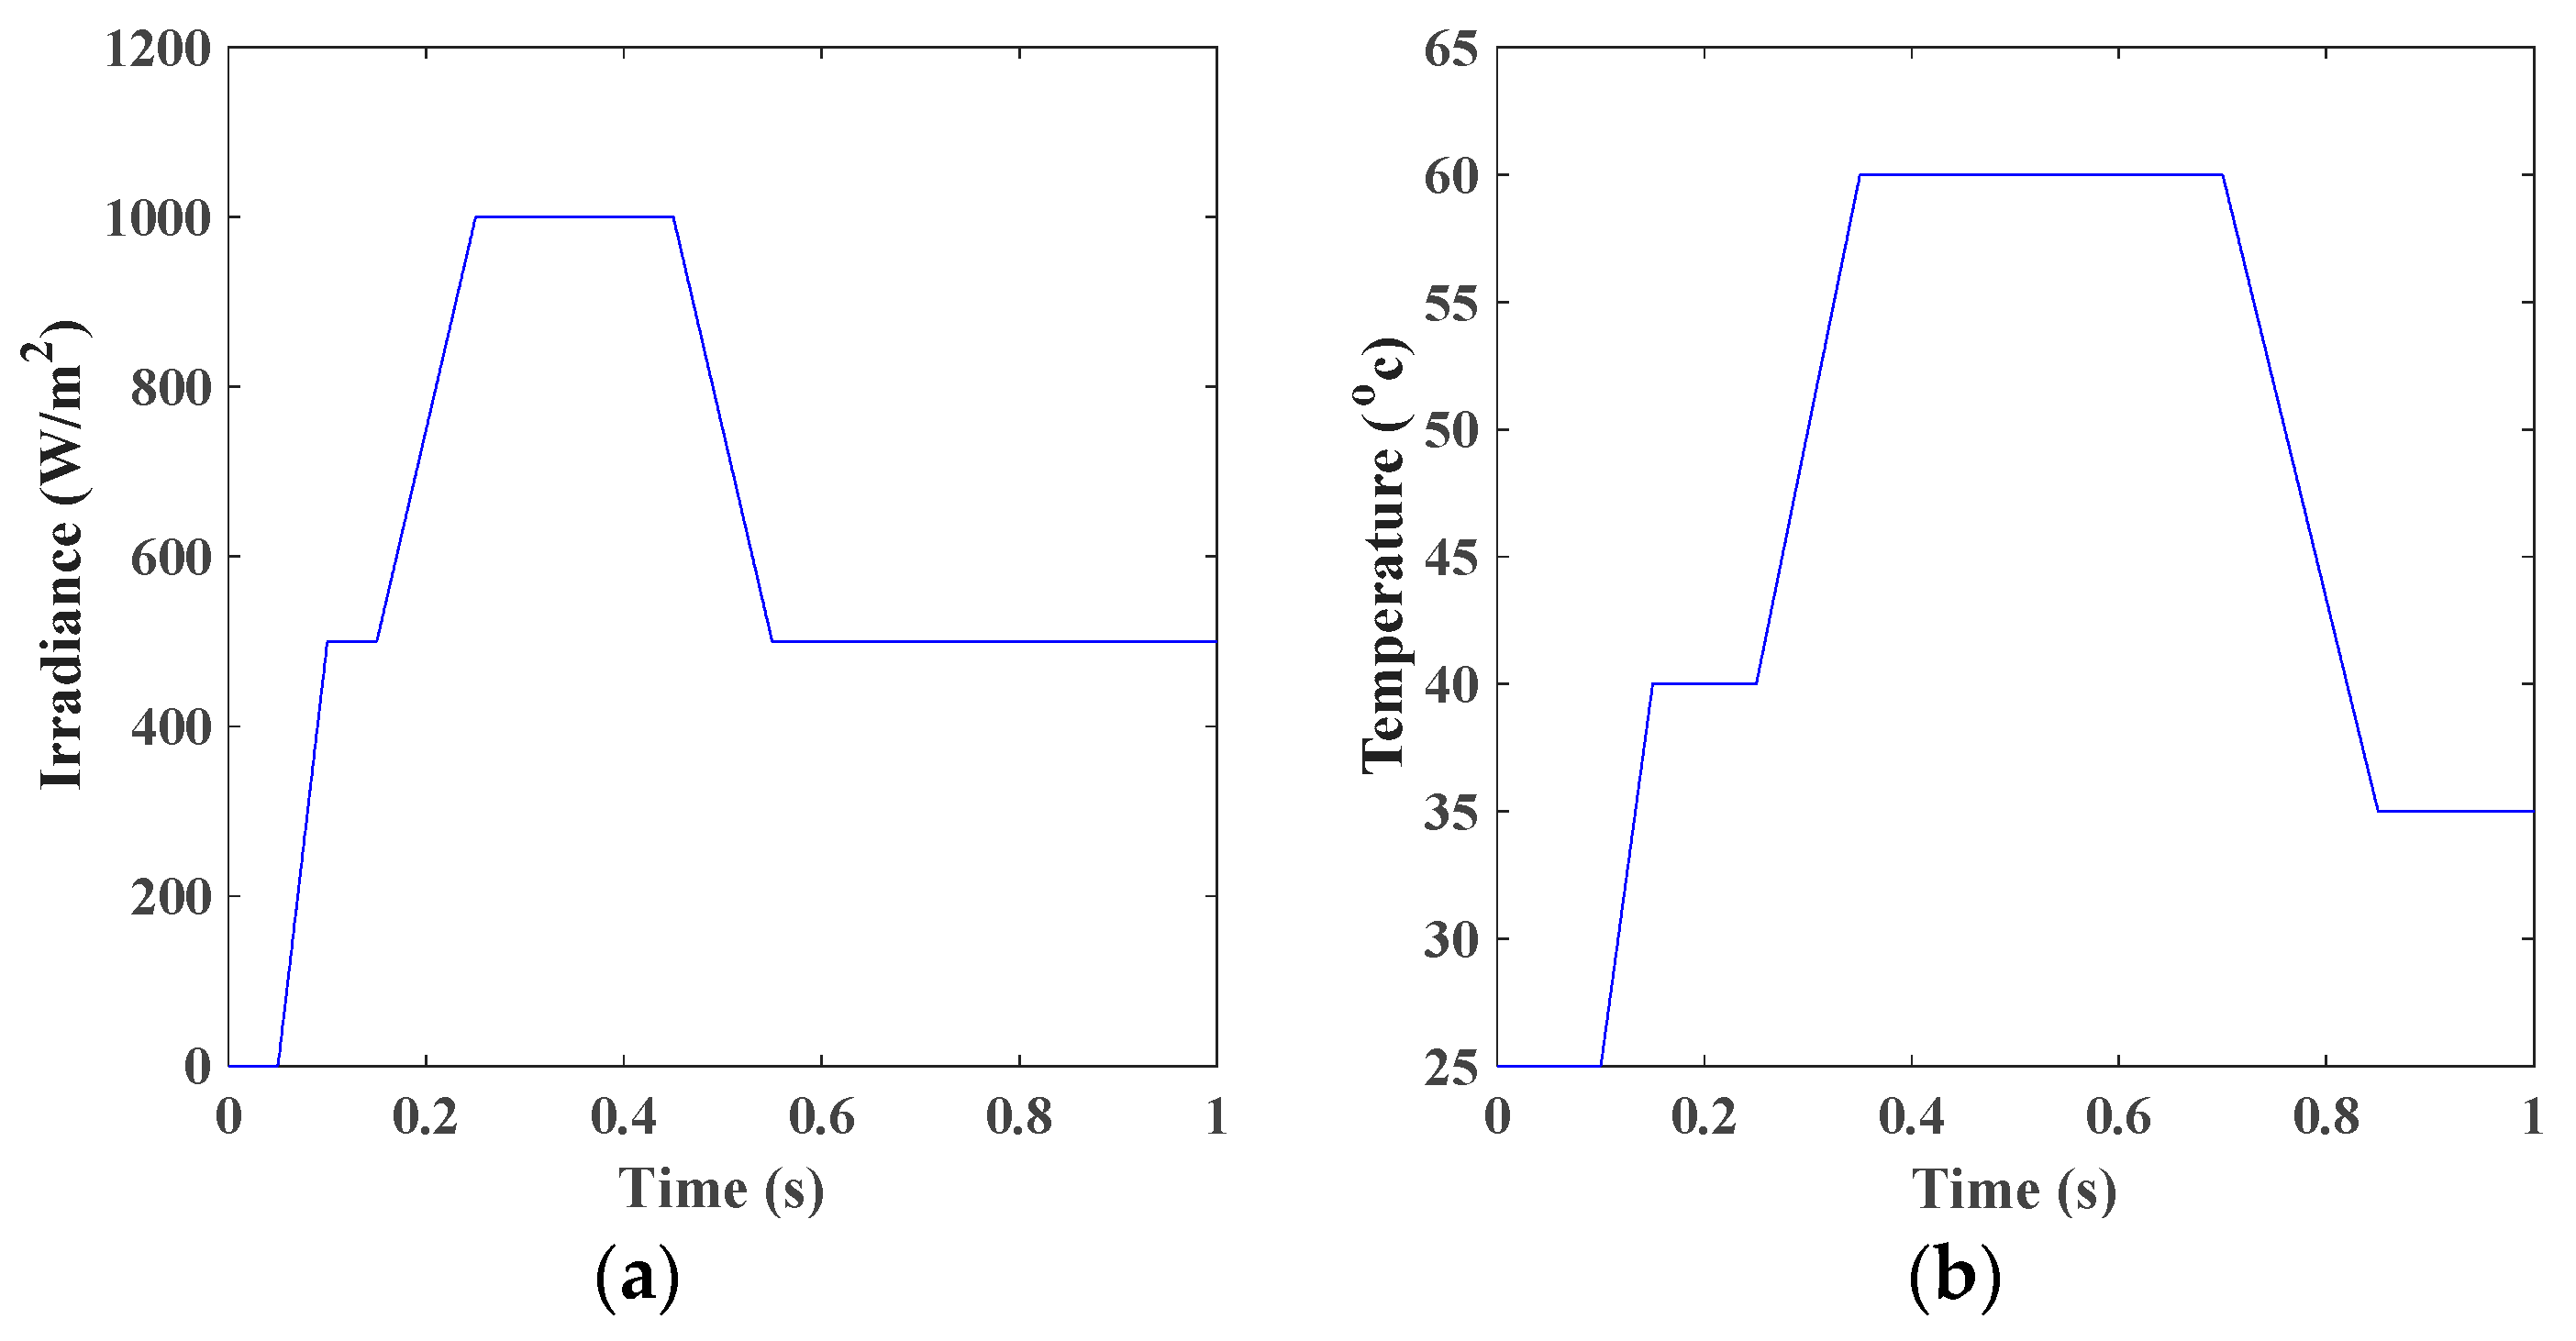
4.4. Test under Ramp Variation in Both Irradiance and Temperature

Solar radiation and ambient temperature changed simultaneously with random changes during the 1 s period, as presented in Figure 12, to examine the MPPTs process. Before 0.15 s, the irradiation and temperature rose almost simultaneously. After that, at 0.25 s, the irradiation value was maintained at 1000 W/m2 and the temperature increased from 40 °C until it reached 60 °C. Reaching 0.54 s, the radiation started to decline until it reached 500 W/m2 at 0.55 s and the system operated at that irradiance until the end of the simulation. At 0.7 s, the temperature started to change and decreased from 60 °C to reach 35 °C at 0.85 s and remained constant until the end of the simulation time.
In Figure 13, the performances associated with these changes in irradiance and temperature are presented for both cells. From the observations of the output power curve for both cells, it is observed that the P&O algorithm was less efficient in dealing with these simultaneous ramp changes among the two cells. At the same time, the modified approaches were able to track the MPP through these operating conditions, showing a better dynamic response performance than both traditional P&O and INC algorithms and consequently improving the system efficiency.

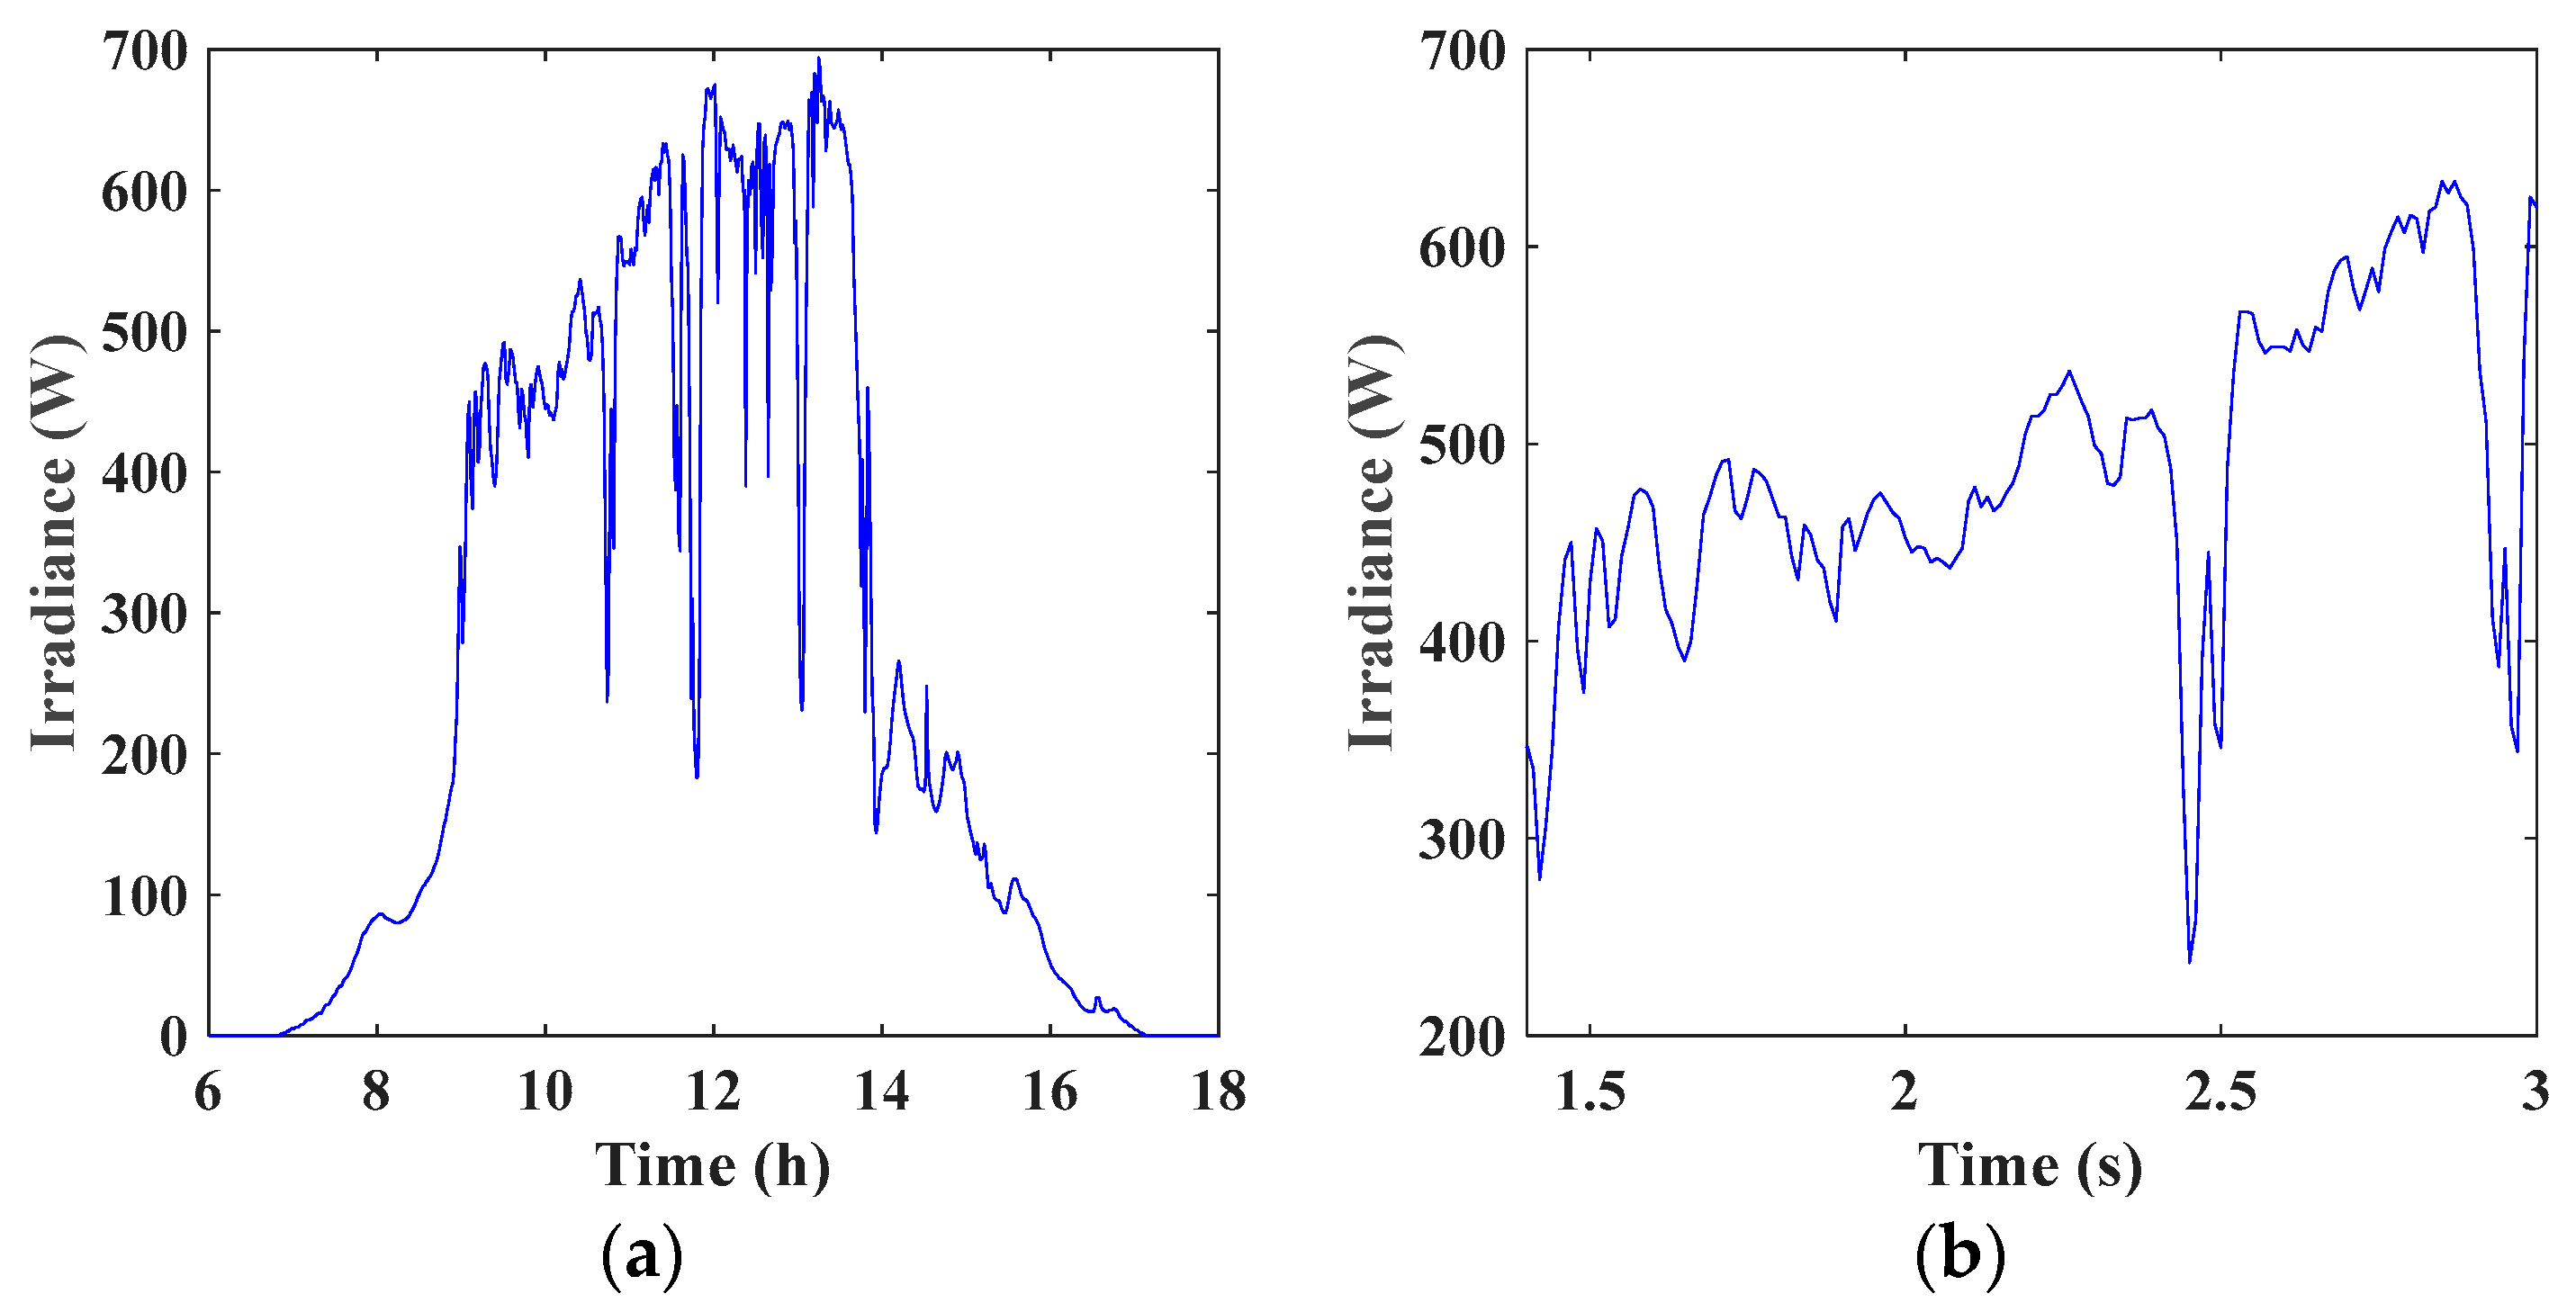
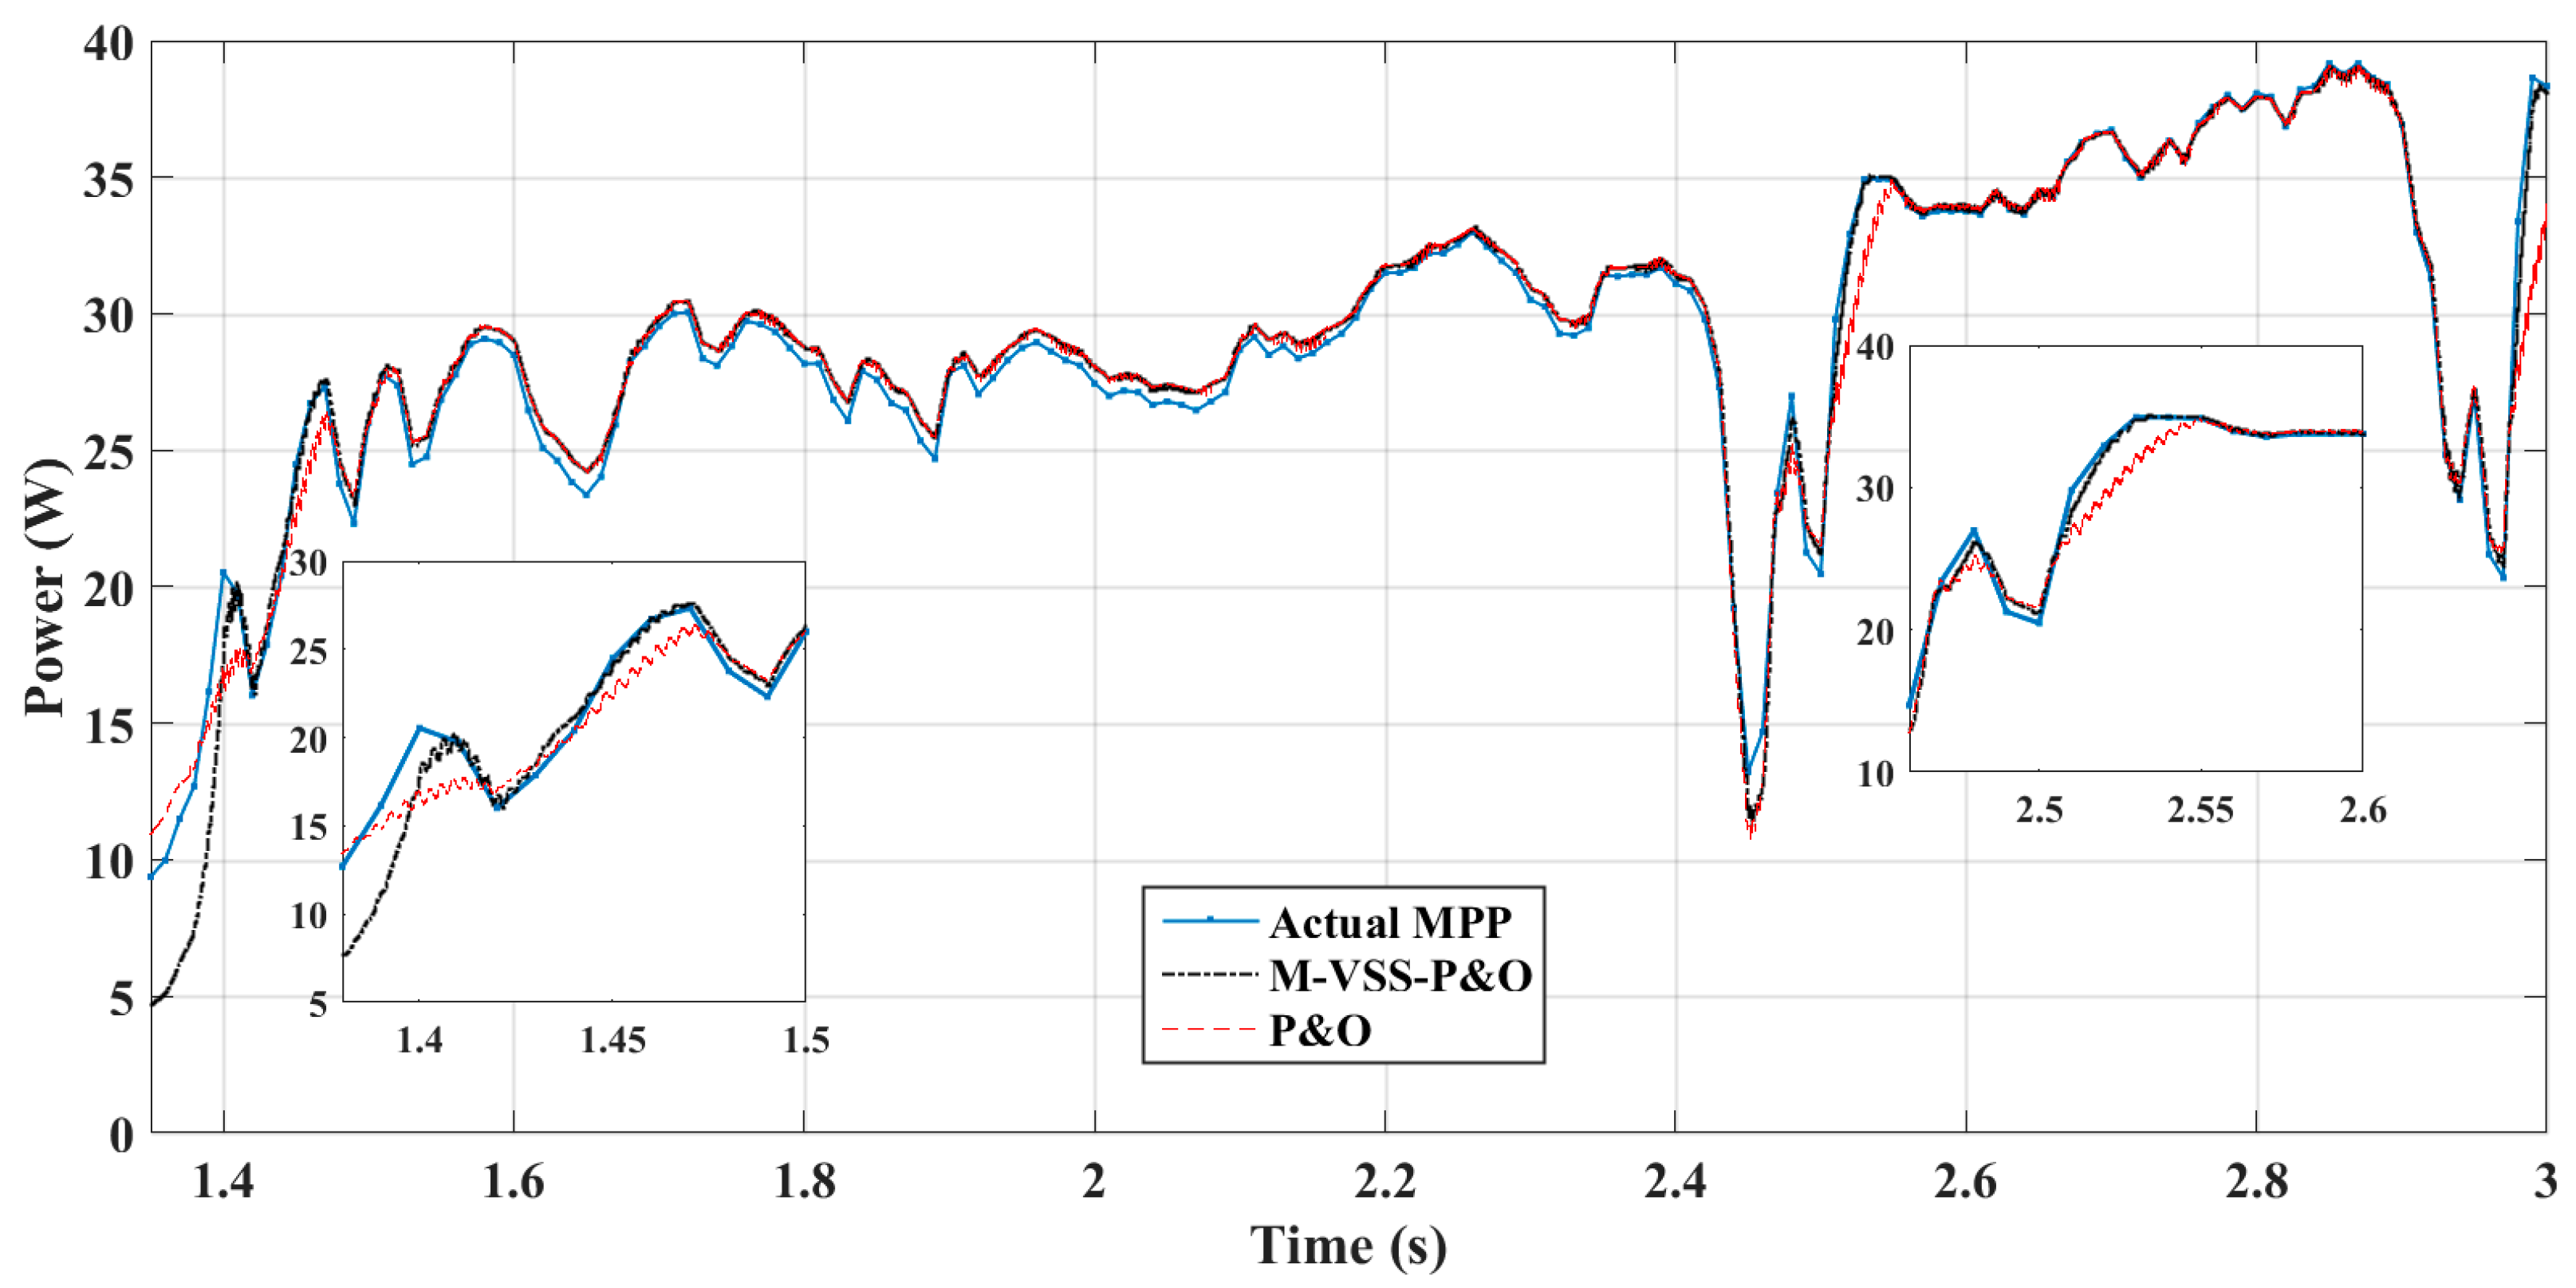
4.5. Test under Real Solar Radiation Measurements

Finally, a test using practical measurement during a relatively dusty or cloudy day was studied. The actual radiation, extracted from REF [41], is shown in Figure 14a, while a focused scaling down of this radiation is shown in Figure 14b, which is used as an input to the simulation. The scaling down is performed due to the limitation of the simulation time. Figure 15 shows the performance of the modified P&O algorithm versus the conventional P&O for the MSX60 module. Furthermore, the theoretical maximum power is shown for comparison. The figure demonstrates the effectiveness of the modified technique, especially for critical times of a sudden increase in irradiation.
Moreover, we performed a comparative study of our modified algorithms and other techniques published in the literature. Table 4 summarizes the comparison in terms of the oscillation level, efficiency, response time during an abrupt increase in irradiation, complexity of implementation, and cost. As illustrated, the proposed methodologies show very fast tracking speeds, higher efficiencies, and neglected oscillations around the MPP. Other techniques may provide a faster response and possible tracking capabilities for partial shading but at the expense of complex implementation and high cost. Furthermore, our proposed techniques can be extended to include the tracking of partial shading as has been proposed in [42]. Regarding future work, adding this feature will be considered to enhance the capabilities of the presented MPPT techniques.

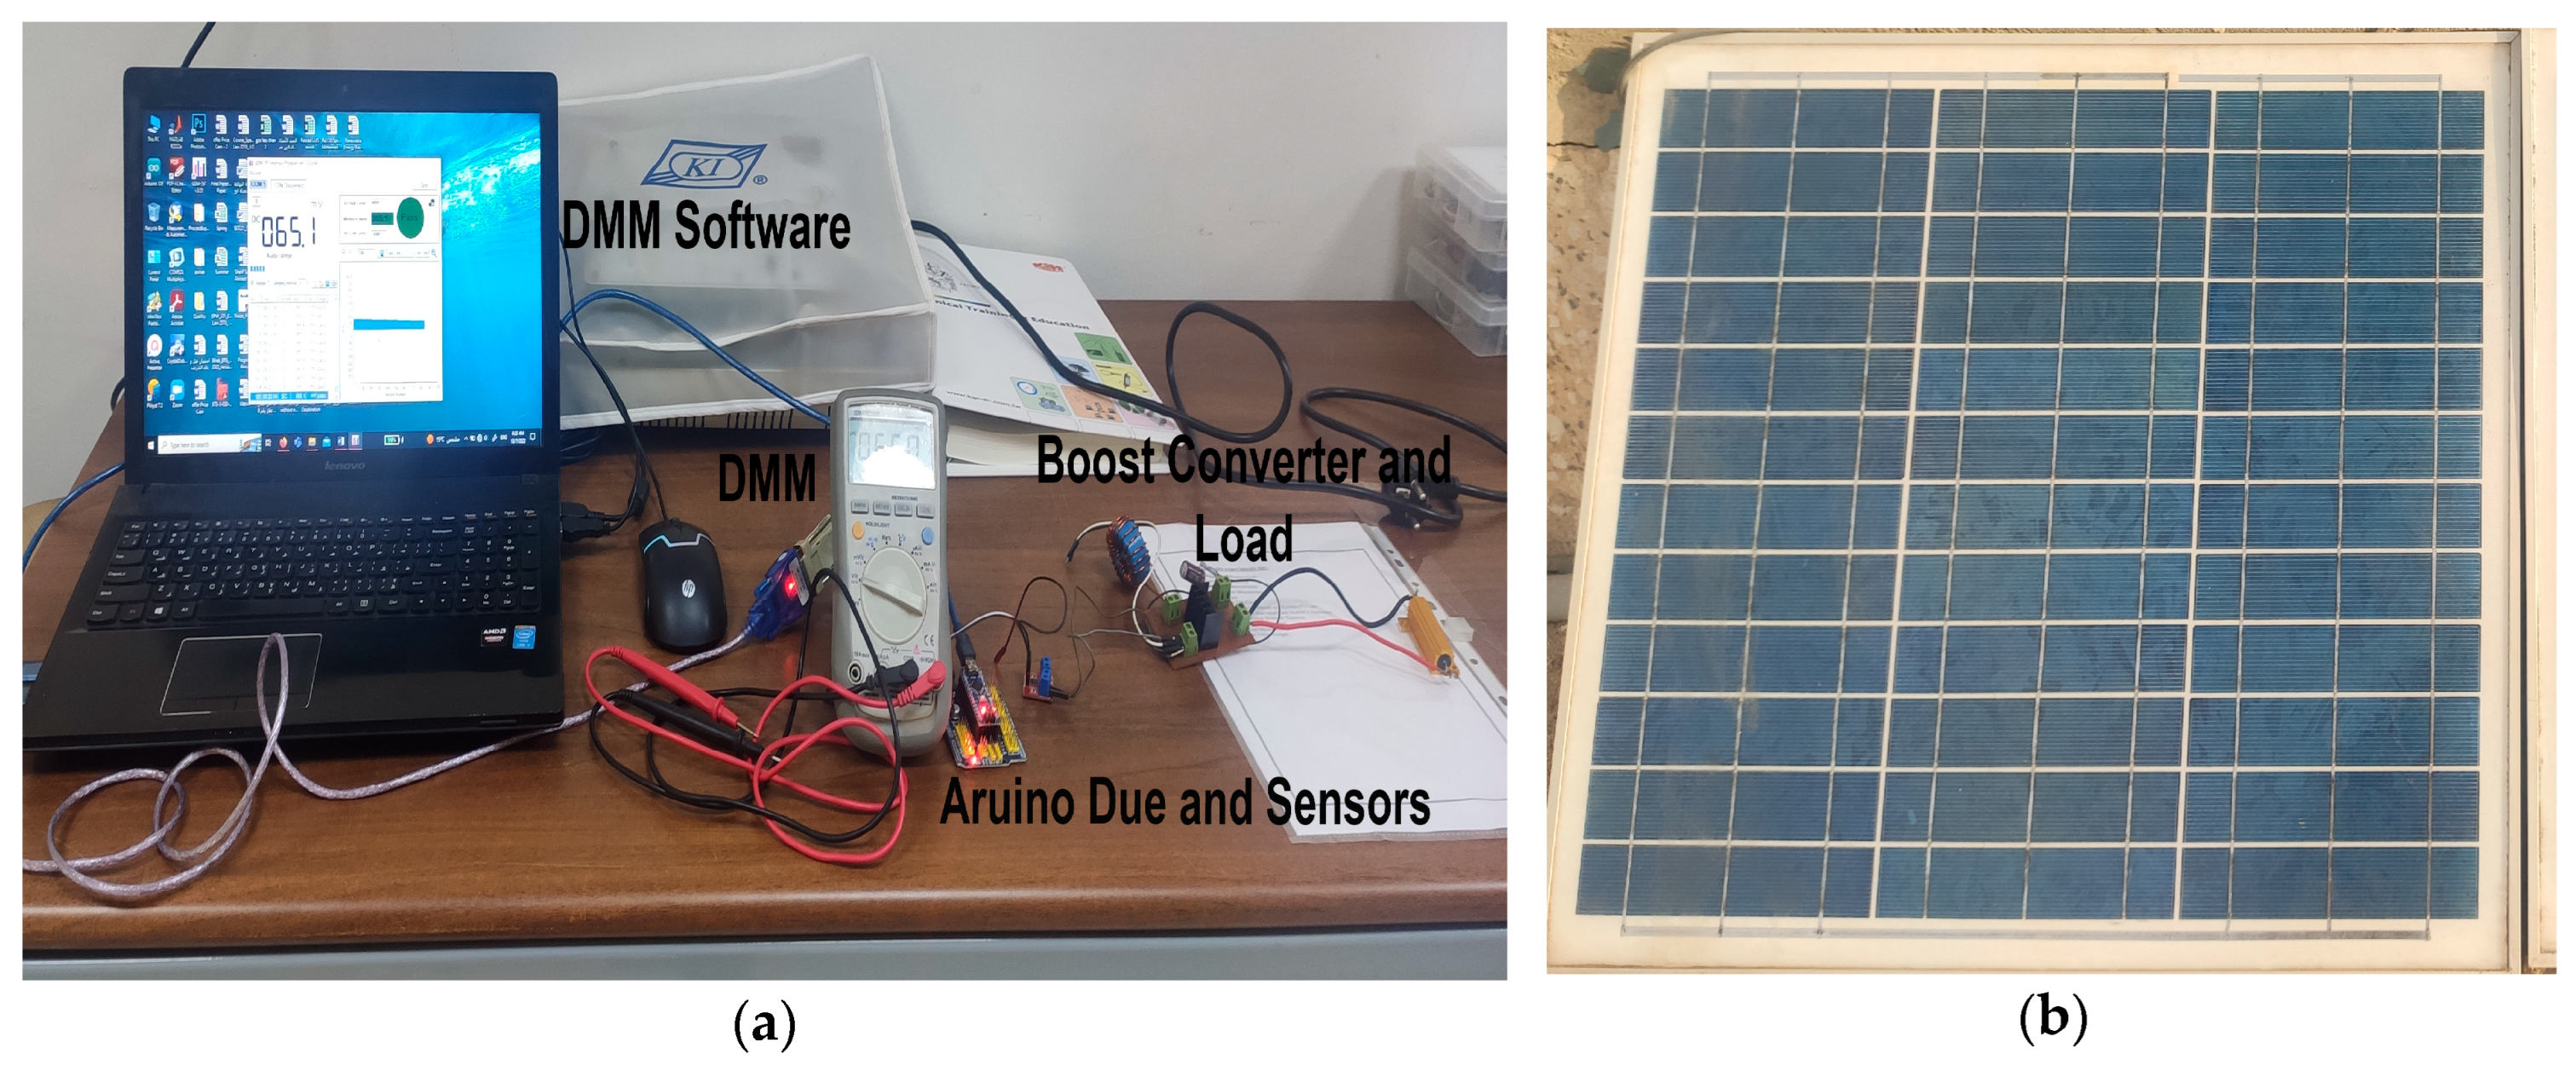
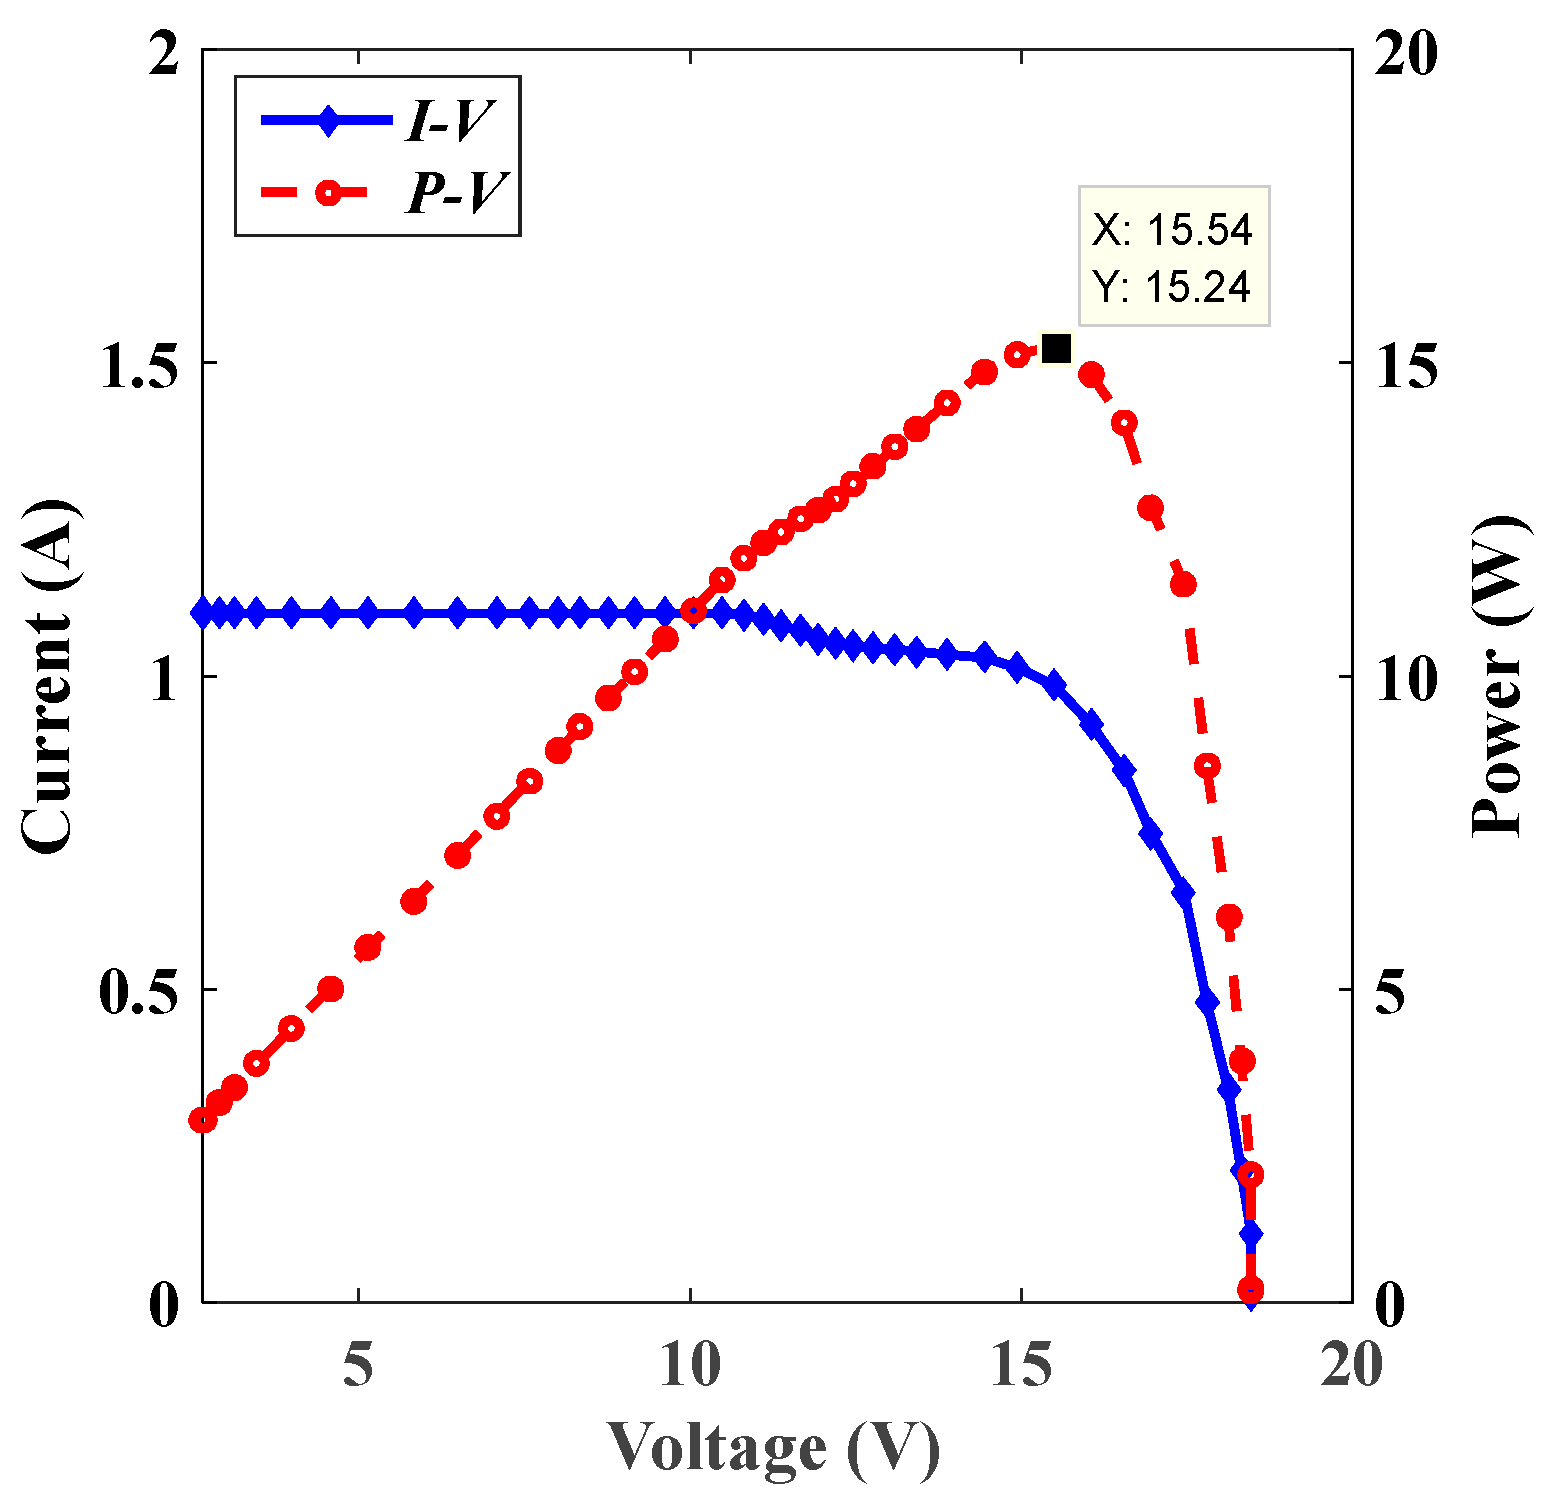
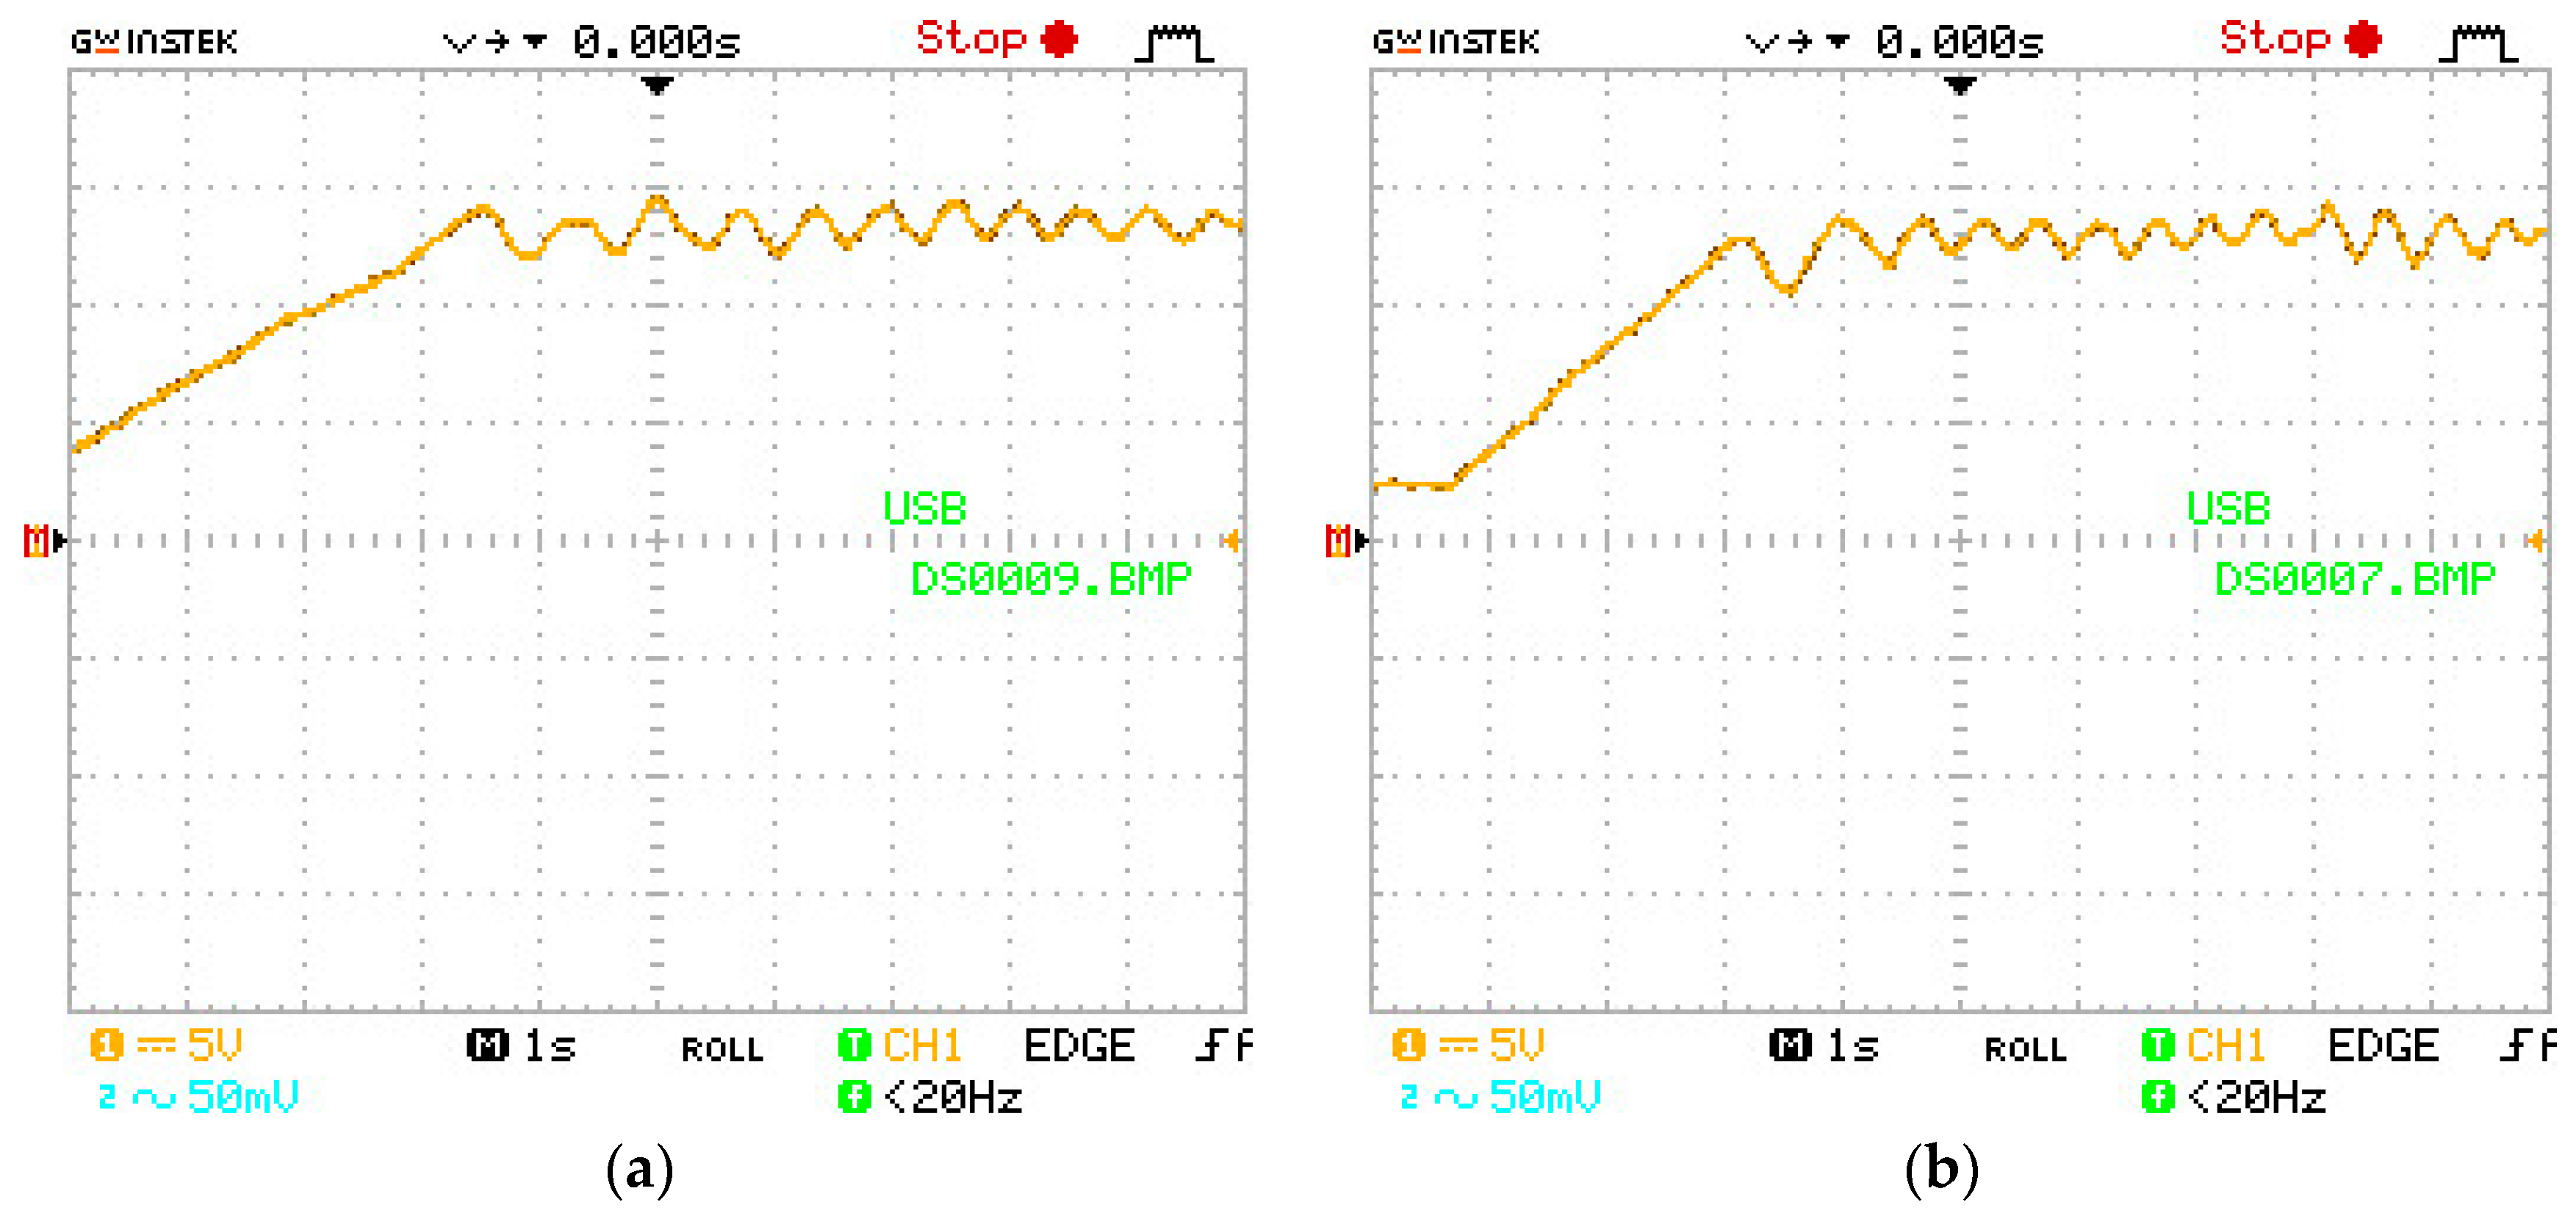
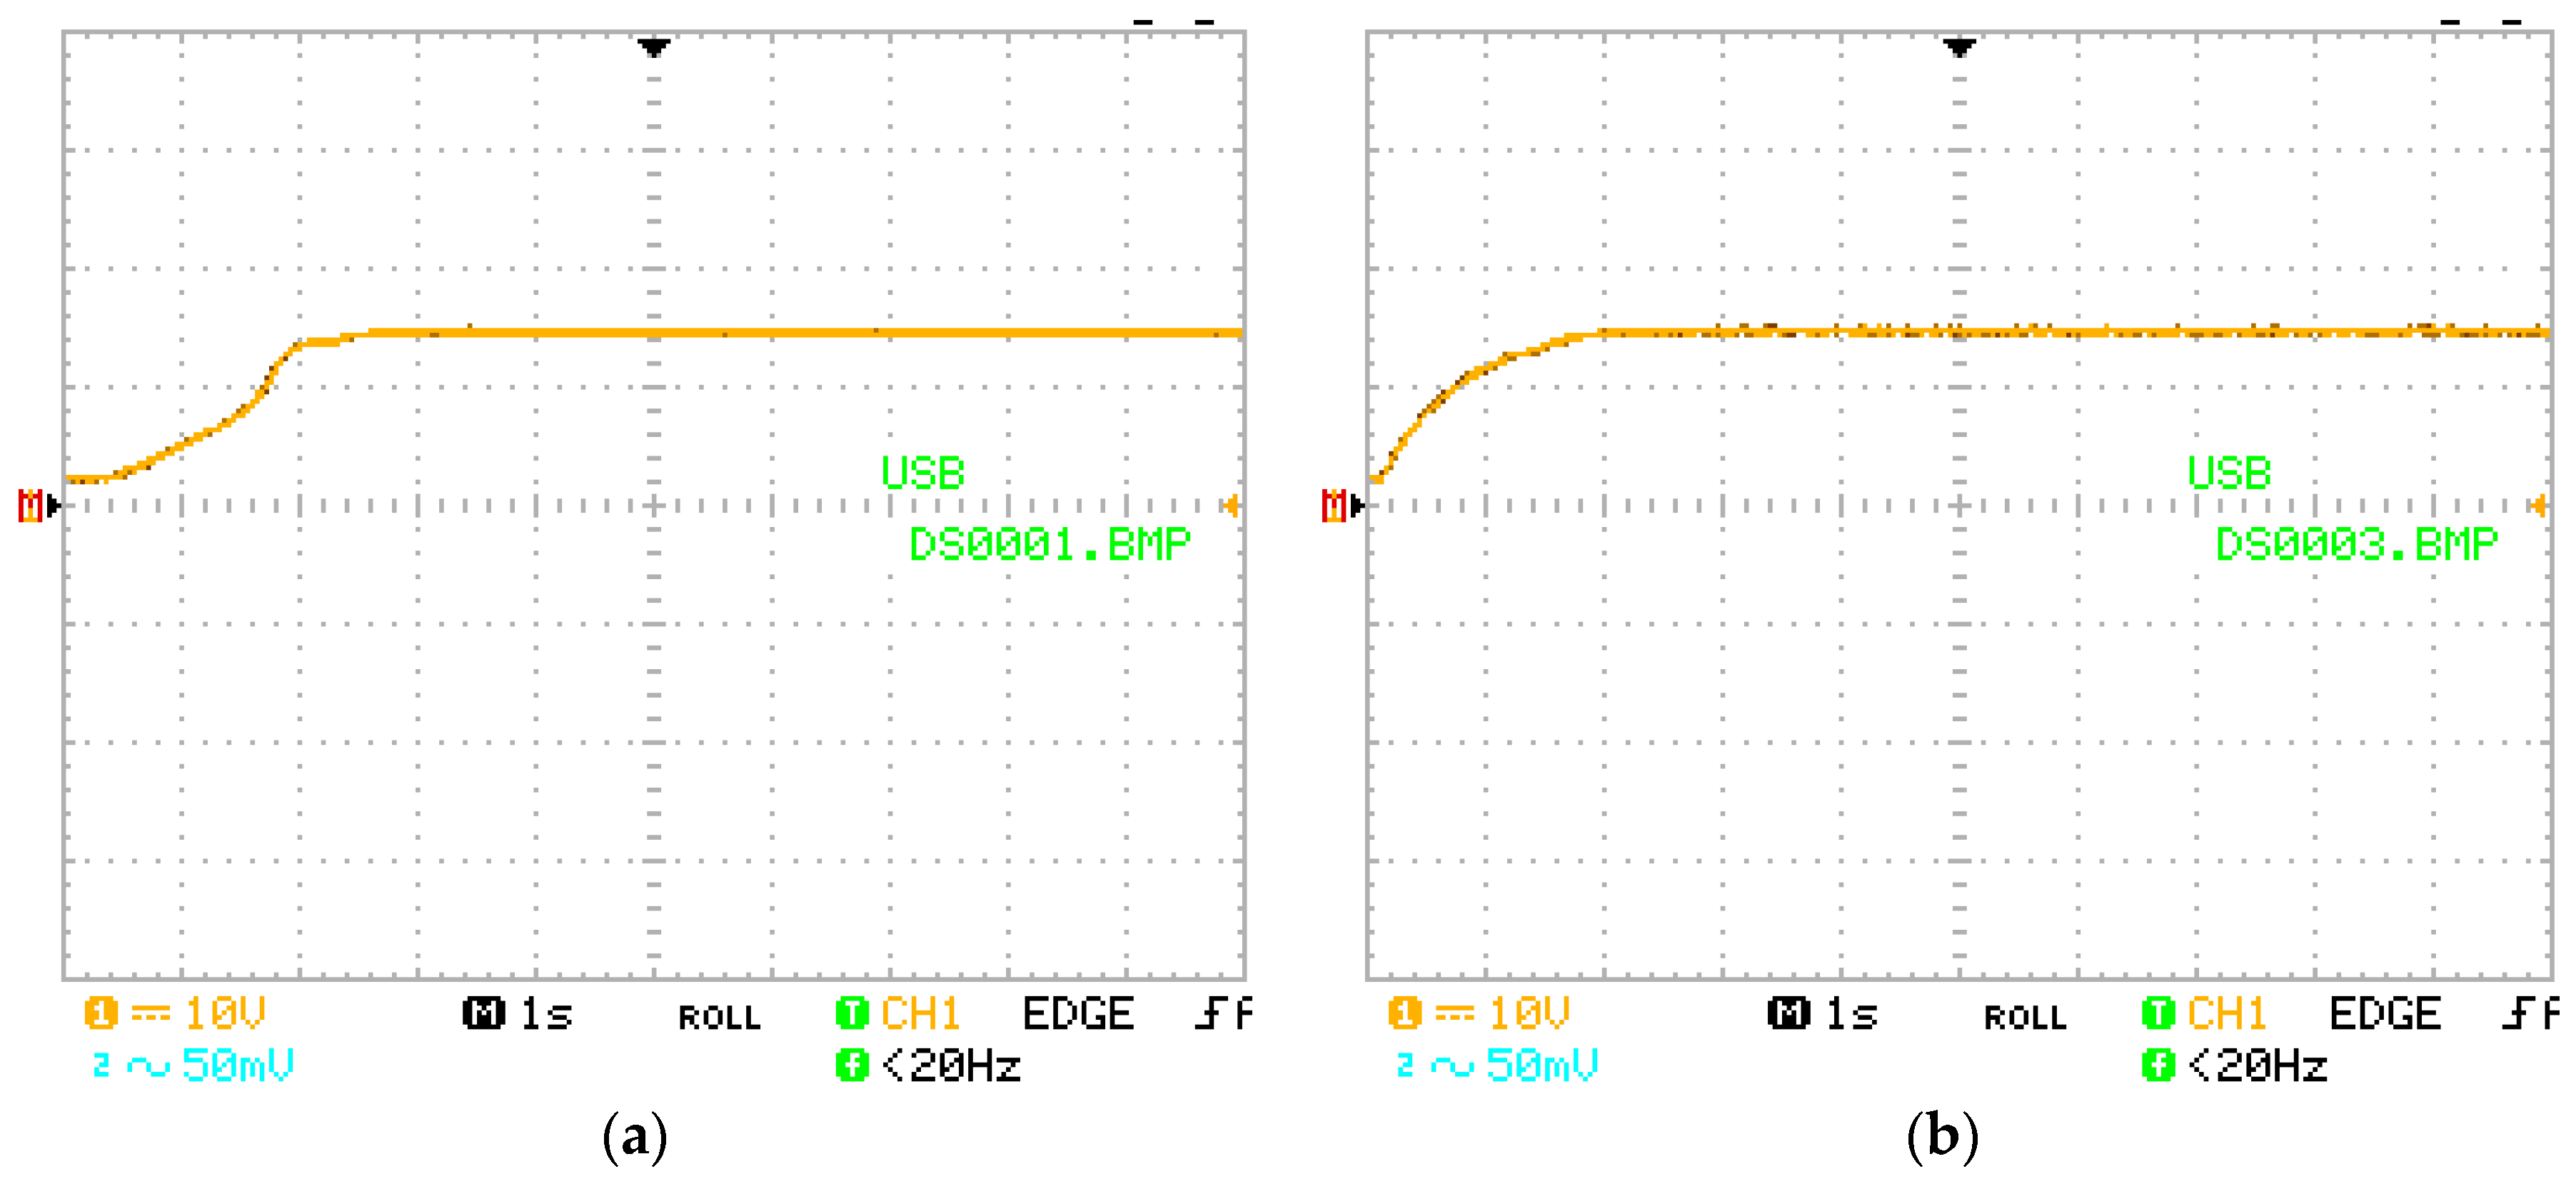
5. Hardware Implementation

The complexity and cost of the proposed algorithms are promising factors that pave the way for real implementation. Therefore, as a proof-of-concept, the M-VSS-P&O algorithm is implemented on hardware to validate the usefulness of the proposed algorithm. The proposed M-VSS-P&O algorithm is implemented for a low-voltage PV module using Arduino Due, which is equipped with a Cortex-M3 CPU. To analyze and visualize the output voltage and current of the PV module, the output data are exported using GDM Digital Multi Meter (DMM) software through the serial port. DMM software receives the data from the DMM and saves it in an MS Excel sheet. The experimental setup of the MPPT technique is demonstrated in Figure 16a. The setup includes Arduino Due, a voltage and current sensor (MAX471), a boost converter, and a 30-Ω load. The PV module used in the experimental study is shown in Figure 16b while the STC outputs of the module are shown in the datasheet in Figure S3 in the Supplementary Materials.
Figure 17 shows the characteristic curves of the PV module used, as it was tested before using the MPPT algorithm in order to acquire the I-V and P-V curves. The PV module is tested by recording the current and voltage using DMM software. The maximum power that PV modules can deliver is measured as 15.24 W at a voltage of 15.4 V and a current of 0.98 A as is depicted in Figure 17.
The response of the conventional P&O is shown in Figure 18 where the PV voltage is plotted in Figure 18a while the PV power is plotted in Figure 18b. As can be inferred from the figure, there is a certain delay in tracking the maximum power in addition to the obvious oscillations. On the other hand, the modified P&O algorithm tracked the maximum power on the P-V curve of the solar panel and continued to operate the PV modules at that point as evident in Figure 19. Figure 19a displays the PV voltage while Figure 19b shows the PV power waveforms of the modified algorithm. The figure clearly indicates the improvement in the M-VSS-P&O algorithm as there are no oscillations around the MPP in addition to the response time being reduced. The modified technique tracks the power of the PV module to 14 W, which exhibits an efficiency of 92%. The main reason for the difference in efficiency between the simulation and practical implementation can be attributed to the resolution of sensors.

6. Conclusions

The performance analysis of two MPPT Algorithms, namely the P&O and INC, against their enhanced versions, the Modified-Variable-Step Size P&O and Modified-Variable-Step Size INC (M-VSS-P&O and M-VSS-INC), is discussed within this simulation study. Within the context of this paper, the algorithms were implemented and simulated on two distinct PV modules, namely, the polycrystalline MSX60 and the ST40 thin coupled with a boost converter, to examine their performances under varying environmental statuses. All the simulations were carried out utilizing MATLAB-Simulink software. The tracker’s efficiency was analyzed in light of the STCs, an abrupt change in solar irradiance with a stable temperature, an abrupt change in temperature with stable solar irradiance, under simultaneous ramp changes in both irradiance and temperature, and finally, under real solar radiation measurements. The simulation results generally prove that both modified MPPTs controllers enhance steady-state and dynamic PV system performances regarding efficiency, oscillations, and tracking speed MPP compared to the traditional MPPT techniques (P&O and INC). Generally, the same case studies presented in this work could be applied to other algorithms as a measure of their effectiveness. Moreover, the hardware implementation of conventional and modified P&O was performed. A substantial improvement of the modified P&O algorithm over the conventional algorithm was experimentally observed in terms of lower oscillations around the MPP in addition to a faster tracking response.

Supplementary Materials

The following supporting information can be downloaded at: https://www.mdpi.com/article/10.3390/en16010549/s1, Figure S1: Solar Irradiance variation (at fixed T = 25 °C) impact on (a) Voc and Isc and (b) voltage and current at MPP. Figure S2: Temperature variation (at fixed G = 1000 W/m2) impact on (a) Voc and Isc and (b) voltage and current at MPP. Figure S3: Datasheet of the PV module used in the hardware implementation.

Author Contributions

Conceptualization, S.M., A.S. (Ahmed Saeed), A.S. (Ahmed Shaker) and H.A.E.M.; methodology, D.K., S.M., A.S. (Ahmed Shaker) and M.A.; software, H.H.M., D.K., S.M. and A.S. (Ahmed Shaker); validation, D.K. and S.M.; formal analysis, D.K.; investigation, D.K., S.M. and H.H.M.; resources, A.S. (Ahmed Saeed), H.H.M., H.A.E.M. and M.A.; writing—original draft preparation, D.K. and A.S. (Ahmed Shaker); writing—review and editing, D.K., S.M., H.H.M., A.S. (Ahmed Saeed), A.S. (Ahmed Shaker), H.A.E.M. and M.A.; supervision, A.S. (Ahmed Saeed), A.S. (Ahmed Shaker), H.A.E.M. and M.A. All authors have read and agreed to the published version of the manuscript.

Funding

This research received no external funding.

Data Availability Statement

Not applicable.

Conflicts of Interest

The authors declare no conflict of interest.

References

  1. Pervez, I.; Antoniadis, C.; Massoud, Y. Advanced Limited Search Strategy for Enhancing the Performance of MPPT Algorithms. Energies 2022, 15, 5650. [Google Scholar] [CrossRef]
  2. Martinez Lopez, V.A.; Žindžiūtė, U.; Ziar, H.; Zeman, M.; Isabella, O. Study on the Effect of Irradiance Variability on the Efficiency of the Perturb-and-Observe Maximum Power Point Tracking Algorithm. Energies 2022, 15, 7562. [Google Scholar] [CrossRef]
  3. Akram, N.; Khan, L.; Agha, S.; Hafeez, K. Global Maximum Power Point Tracking of Partially Shaded PV System Using Advanced Optimization Techniques. Energies 2022, 15, 4055. [Google Scholar] [CrossRef]
  4. Marinic-Kragic, I.; Nižetic, S.; Grubišic-Cabo, F.; Papadopoulos, A.M. Analysis of flow separation effect in the case of the free-standing photovoltaic panel exposed to various operating conditions. J. Clean. Prod. 2018, 174, 53–64. [Google Scholar] [CrossRef]
  5. Motahhir, S.; El Ghzizal, A.; Sebti, S.; Derouich, A. MIL and SIL and PIL tests for MPPT algorithm. Cogent Eng. 2017, 1, 1378475. [Google Scholar] [CrossRef]
  6. El Hammoumi, A.; Motahhir, S.; Chalh, A.; El Ghzizal, A.; Derouich, A. Low-cost virtual instrumentation of PV panel characteristics using Excel and Arduino in comparison with traditional instrumentation. Renew. Wind WaterSol. 2018, 5, 3. [Google Scholar] [CrossRef]
  7. Patel, H.; Agarwal, V. MATLAB-Based Modeling to Study the Effects of Partial Shading on PV Array Characteristics. IEEE Trans. Energy Convers. 2008, 23, 302–310. [Google Scholar] [CrossRef]
  8. Motahhir, S.; El Ghzizal, A.; Sebti, S.; Derouich, A. Proposal and implementation of a novel perturb and observe algorithm using embedded software. In Proceedings of the 3rd International Renewable and Sustainable Energy Conference (IRSEC), Marrakech, Morocco, 10–13 December 2015; pp. 1–5. [Google Scholar]
  9. Barker, L.; Neber, M.; Lee, H. Design of a low-profile two-axis solar tracker. Sol. Energy 2013, 97, 569–576. [Google Scholar] [CrossRef]
  10. Rambhowan, Y.; Oree, V. Improving the Dual Axis Solar Tracking System Efficiency via Drive Power Consumption Optimization1. Appl. Sol. Energy 2014, 50, 74–80. [Google Scholar] [CrossRef]
  11. Visconti, P.; Costantini, P.; Orlando, C.; Lay-Ekuakille, A.; Cavalera, G. Software solution implemented on hardware system to manage and drive multiple bi-axial solar trackers by PC in photovoltaic solar plants. Measurement 2015, 76, 80–92. [Google Scholar]
  12. Kawamoto, H.; Shibata, T. Electrostatic cleaning system for removal of sand from solar panels. J. Electrost. 2015, 73, 65–70. [Google Scholar] [CrossRef]
  13. Hafeez, M.A.; Naeem, A.; Akram, M.; Javed, M.Y.; Asghar, A.B.; Wang, Y. A Novel Hybrid MPPT Technique Based on Harris Hawk Optimization (HHO) and Perturb and Observer (P&O) under Partial and Complex Partial Shading Conditions. Energies 2022, 15, 5550. [Google Scholar] [CrossRef]
  14. Saharia, B.J.; Manas, M.; Talukdar, B.K. Comparative evaluation of photovoltaic MPP trackers: A simulated approach. Cogent Eng. 2016, 3, 1137206. [Google Scholar] [CrossRef]
  15. Verma, D.; Nema, S.; Shandilya, A.M.; Dash, S.K. Maximum power point tracking (MPPT) techniques: Recapitulation in solar photovoltaic systems. Renew. Sustain. Energy Rev. 2016, 54, 1018–1034. [Google Scholar] [CrossRef]
  16. El-Khozondar, H.J.; El-Khozondar, R.J.; Matter, K.; Suntio, T. A review study of photovoltaic array maximum power tracking algorithms. Renew. Wind. Water Sol. 2016, 3, 1. [Google Scholar] [CrossRef] [Green Version]
  17. Gupta, A.; Chauhan, Y.K.; Pachauri, R.K.; Yin, X.; Pickert, V. A comparative investigation of maximum power point tracking methods for solar PV system. Sol. Energy 2016, 136, 236–253. [Google Scholar] [CrossRef]
  18. Ahmed, J. A fractional open circuit voltage based maximum power point tracker for photovoltaic arrays. In Proceedings of the 2nd International Conference on Software Technology and Engineering (ICSTE), San Juan, PR, USA, 3–5 October 2010; Volume 1, pp. V1–V247. [Google Scholar]
  19. Sher, H.A.; Murtaza, A.F.; Noman, A.; Addoweesh, K.E.; Chiaberge, M. An intelligent control strategy of fractional short circuit current maximum power point tracking technique for photovoltaic applications. J. Renew. Sustain. Energy 2015, 7, 013114. [Google Scholar] [CrossRef]
  20. Kottas, T.L.; Boutalis, Y.S.; Karlis, A.D. New maximum power point tracker for PV arrays using fuzzy controller in close cooperation with fuzzy cognitive networks. IEEE Trans. Energy Convers. 2006, 21, 793–803. [Google Scholar] [CrossRef]
  21. Miloudi, L.; Acheli, D.; Kesraoui, M. Application of Artificial Neural Networks for Forecasting Photovoltaic System Parameters. Appl. Sol. Energy 2017, 53, 85–91. [Google Scholar] [CrossRef]
  22. Sellami, A.; Kandoussi, K.; El Otmani, R.; Eljouad, M.; Mesbahi, O.; Hajjaji, A. A Novel Auto-Scaling MPPT Algorithm based on Perturb and Observe Method for Photovoltaic Modules under Partial Shading Conditions. Appl. Sol. Energy 2018, 54, 149–158. [Google Scholar] [CrossRef]
  23. Elgendy, M.A.; Zahawi, B.; Atkinson, D.J. Assessment of Perturb and Observe MPPT Algorithm Implementation Techniques for PV Pumping Applications. IEEE Trans. Sustain. Energy 2012, 3, 21–33. [Google Scholar] [CrossRef]
  24. Elgendy, M.A.; Zahawi, B.; Atkinson, D.J. Assessment of the Incremental Conductance Maximum Power Point Tracking Algorithm. IEEE Trans. Sustain. Energy 2013, 4, 108–117. [Google Scholar] [CrossRef]
  25. Khodair, D.; Shaker, A.; El Munim, A.H.E.; Saeed, A.; Abouelatta, M. A Comparative Study Between Modified MPPT Algorithms Using Different Types of Solar Cells. In Proceedings of the 2020 2nd International Conference on Smart Power & Internet Energy Systems (SPIES), Bangkok, Thailand, 15–18 September 2020; pp. 215–218. [Google Scholar] [CrossRef]
  26. Femia, N.; Granozio, D.; Petrone, G.; Spagnuolo, G.; Vitelli, M. Predictive & Adaptive MPPT Perturb and Observe Method. IEEE Trans. Aerosp. Electron. Syst. 2007, 43, 934–950. [Google Scholar] [CrossRef]
  27. Piegari, L.; Rizzo, R. Adaptive perturb and observe algorithm for photovoltaic maximum power point tracking. IET Renew. Power Gener. 2010, 4, 317–328. [Google Scholar] [CrossRef]
  28. Elbaset, A.A.; Ali, H.; Sattar, M.; Khaled, M. Implementation of a modified perturb and observe maximum power point tracking algorithm for photovoltaic system using an embedded microcontroller. IET Renew. Power Gener. 2016, 4, 551–560. [Google Scholar] [CrossRef]
  29. Motahhir, S.; El Ghzizal, A.; Sebti, S.; Derouich, A. Shading effect to energy withdrawn from the photovoltaic panel and implementation of DMPPT using C language. Int. Rev. Autom. Control. (IREACO) 2016, 2, 88–94. [Google Scholar] [CrossRef]
  30. Ishaque, K.; Salam, Z.; Lauss, G. The performance of perturb and observe and incremental conductance maximum power point tracking method under dynamic weather conditions. Appl. Energy 2014, 119, 228–236. [Google Scholar] [CrossRef]
  31. Farayola, A.M.; Hasan, A.N.; Ali, A. Implementation of Modified Incremental Conductance and Fuzzy Logic MPPT Techniques Using MCUK Converter under Various Environmental Condition. Appl. Sol. Energy 2017, 53, 173–184. [Google Scholar] [CrossRef]
  32. Elbreki, A.M.; Alghoul, M.A.; Al-Shamani, A.N.; Ammar, A.A.; Yegani, B.; Aboghrara, A.M.; Rusaln, M.H.; Sopian, K. The role of climatic-design-operational parameters on combined PV/T collector performance: A critical review. Renew. Sustain. Energy Rev. 2016, 57, 602–647. [Google Scholar] [CrossRef]
  33. Matlab. Version 9.11 (R2021b); The MathWorks Inc.: Natick, MA, USA, 2021. [Google Scholar]
  34. Motahhir, S.; Chalh, A.; Ghzizal, A.; Sebti, S.; Derouich, A. Modeling of photovoltaic panel by using proteus. J. Eng. Sci. Technol. Rev. 2017, 10, 8–13. [Google Scholar] [CrossRef]
  35. Mukti, R.; Islam, A. Modeling and Performance Analysis of PV Module with Maximum Power Point Tracking in Matlab/Simulink. Appl. Sol. Energy 2015, 51, 245–252. [Google Scholar] [CrossRef]
  36. Ayop, R.; Tan, C.W. Design of boost converter based on maximum power point resistance for photovoltaic applications. Sol. Energy 2018, 160, 322–335. [Google Scholar] [CrossRef]
  37. Al-Diab, A.; Sourkounis, S. Variable step size P&O MPPT algorithm for PV systems. In Proceedings of the International Conference on Optimization of Electrical and electronic Equipment, Brasov, Romania, 20–22 May 2010. [Google Scholar]
  38. Zakzouk, N.E.; Elsaharty, M.A.; Abdelsalam, A.K.; Helal, A.A.; Williams, B.W. Improved performance low-cost incremental conductance PV MPPT technique. IET Renew. Power Gener. 2016, 10, 561–574. [Google Scholar] [CrossRef] [Green Version]
  39. Zhang, L.; Yu, S.S.; Fernando, T.; Ho-Ching IU, H.; Wong, K.P. An online maximum power point capturing technique for high efficiency power generation of solar photovoltaic systems. J. Mod. Power Syst. Clean Energy 2019, 2, 357–368. [Google Scholar] [CrossRef] [Green Version]
  40. Wang, Y.; Yang, Y.; Fang, G.; Zhang, B.; Wen, H.; Tang, H.; Fu, L.; Chen, X. An advanced Maximum Power Point Tracking Method for Photovoltaic Systems by Using Variable Universe Fuzzy Logic Control Considering Temperature Variability. Electronics 2018, 7, 355. [Google Scholar] [CrossRef] [Green Version]
  41. Hassan, M.A.; Khalil, A.; Kaseb, S.; Kassem, M.A. Machine Learning Models for Generating Synthetic Solar Radiation Data at Cairo, Egypt; Mendeley Data: Amsterdam, The Netherlands, 2017. [Google Scholar] [CrossRef]
  42. Mahmod, A.N.; Mohd, M.A.; Azis, N.; Shafie, S.; Atiqi, M.A. An enhanced adaptive perturb and observe technique for efficient maximum power point tracking under partial shading conditions. Appl. Sci. 2020, 10, 3912. [Google Scholar] [CrossRef]
  43. Belkaid, A.; Colak, I.; Isik, O. Photovoltaic maximum power point tracking under fast varying of solar radiation. Appl. Energy 2016, 179, 523–530. [Google Scholar] [CrossRef]
  44. Sher, H.A.; Murtaza, A.F.; Noman, A.; Addoweesh, K.E.; Al-Haddad, K.; Chiaberge, M. A new sensorless hybrid MPPT algorithm based on fractional short-circuit current measurement and P&O MPPT. IEEE Trans. Sustain. Energy 2015, 6, 1426–1434. [Google Scholar]
  45. Sekhar, P.C.; Mishra, S. Takagi–Sugeno fuzzy-based incremental conductance algorithm for maximum power point tracking of a photovoltaic generating system. IET Renew. Power Gener. 2014, 8, 900–914. [Google Scholar] [CrossRef]
  46. Kaced, K.; Larbes, C.; Ramzan, N.; Bounabi, M.; Dahmane, Z. Bat algorithm based maximum power point tracking for photovoltaic system under partial shading conditions. Sol. Energy 2017, 158, 490–503. [Google Scholar] [CrossRef]
Figure 1. System General Configuration illustrated by Simulink model.
Energies 16 00549 g001
Figure 2. I-V (Solid lines) and P-V (Dashed lines) characteristics for both MSX60 and ST40 modules.
Energies 16 00549 g002
Figure 3. Flowchart of modified P&O algorithm.
Energies 16 00549 g003
Figure 4. Flowchart of Modified INC algorithm.
Energies 16 00549 g004
Figure 5. Drift analysis of conventional P&O versus modified P&O algorithms when considering a rapid increase in irradiance.
Energies 16 00549 g005
Figure 6. STC test of MSX60 solar cell performance: (a) Output power and (b) duty cycle variation.
Energies 16 00549 g006
Figure 7. STC test of ST40 solar cell performance: (a) Output power and (b) duty cycle variation.
Energies 16 00549 g007
Figure 8. Sudden Irradiance change at 25 °C.
Energies 16 00549 g008
Figure 9. Cell performance under irradiance sudden variation for (a) MSX60 and (b) ST40.
Energies 16 00549 g009
Figure 10. Sudden temperature change at 1000 W/m2.
Energies 16 00549 g010
Figure 11. Cell performance under temperature sudden variation for (a) MSX60 and (b) ST40.
Energies 16 00549 g011
Figure 12. Simultaneous ramp changes in both (a) solar irradiance and (b) temperature.
Energies 16 00549 g012
Figure 13. Performance under simultaneous ramp changes in both solar irradiance and temperature: (a) MSX60 (b) ST40.
Energies 16 00549 g013aEnergies 16 00549 g013b
Figure 14. Measured solar irradiance during a cloudy weather day: (a) Whole day and (b) scaling down of solar irradiance to cope with simulation.
Energies 16 00549 g014
Figure 15. Performance under influence of scaled measured solar radiation for MSX60. The actual theoretical maximum power is also shown.
Energies 16 00549 g015
Figure 16. (a) Hardware Implementation and (b) PV module.
Energies 16 00549 g016
Figure 17. Practical I-V and P-V curves of the PV module.
Energies 16 00549 g017
Figure 18. (a) PV Voltage and (b) PV Power of conventional P&O algorithm.
Energies 16 00549 g018
Figure 19. (a) PV Voltage and (b) PV Power of modified P&O algorithm.
Energies 16 00549 g019
Table 1. Boost converter design parameters [36].
ParameterDefinitionValue
LInductor3 mH
C1Input capacitor100 μF
C2Output capacitor100 μF
Table 2. PV panels’ electrical specifications under standard test conditions (STC).
ParameterDefinitionPolycrystalline MSX60Thin Film ST40
Voc (V)Open-Circuit voltage21.123.3
Isc (A)Short-Circuit current3.802.68
Vmp (V)Voltage at MPP17.116.6
Imp (A)Current at MPP3.52.41
Kv (V/°C)Temperature coefficient of the Voc−0.08−0.1
Ki (A/°C)Temperature coefficient of the Isc0.003000.00035
NsNumber of cells per module3636
Table 3. Performance of the MPPT algorithms under STC conditions.
ModuleMPPT AlgorithmMPP (W)Power (W)Tracking Time (ms)Oscillations (W)Eff. (%)
MSX60P&O60.5360.1554.760.5299.37
INC60.5360.1554.760.5299.37
M-VSS-P&O60.5360.1516.34Neglected99.37
M-VSS-INC60.5360.5318.22Neglected100
ST40P&O40.00634.1934.190.2199.78
INC40.00633.7133.710.15100
M-VSS-P&O40.00626.2126.210.1100
M-VSS-INC40.00623.0223.020.1100
Table 4. Comparison of the proposed algorithms with other algorithms proposed in the literature.
MPPT TechniquePV PanelOscillation Level (W)Eff. (%)Response Time during Sudden Changes in IrradianceComplexityCostREF
M-VSS-P&OMSX60Neglected99.37Very fastSimpleMediumOur Work
M-VSS-INCMSX60Neglected100Very fastSimpleMediumOur Work
Modified INCMSX60196.50FastSimpleMedium[43]
Fractional Short-Circuit and P&OPB-115Neglected97.56FastMediumMedium[44]
Fuzzy INCNA197.50MediumComplexExpensive[45]
PSOSM55Neglected99.90Very fastComplexVery Expensive[46]
Disclaimer/Publisher’s Note: The statements, opinions and data contained in all publications are solely those of the individual author(s) and contributor(s) and not of MDPI and/or the editor(s). MDPI and/or the editor(s) disclaim responsibility for any injury to people or property resulting from any ideas, methods, instructions or products referred to in the content.

