An Economic Penalty Scheme for Optimal Parking Lot Utilization with EV Charging Requirements


Abstract
:1. Introduction
2. Orderly Operation Modeling of Charging Facilities in Parking Lot
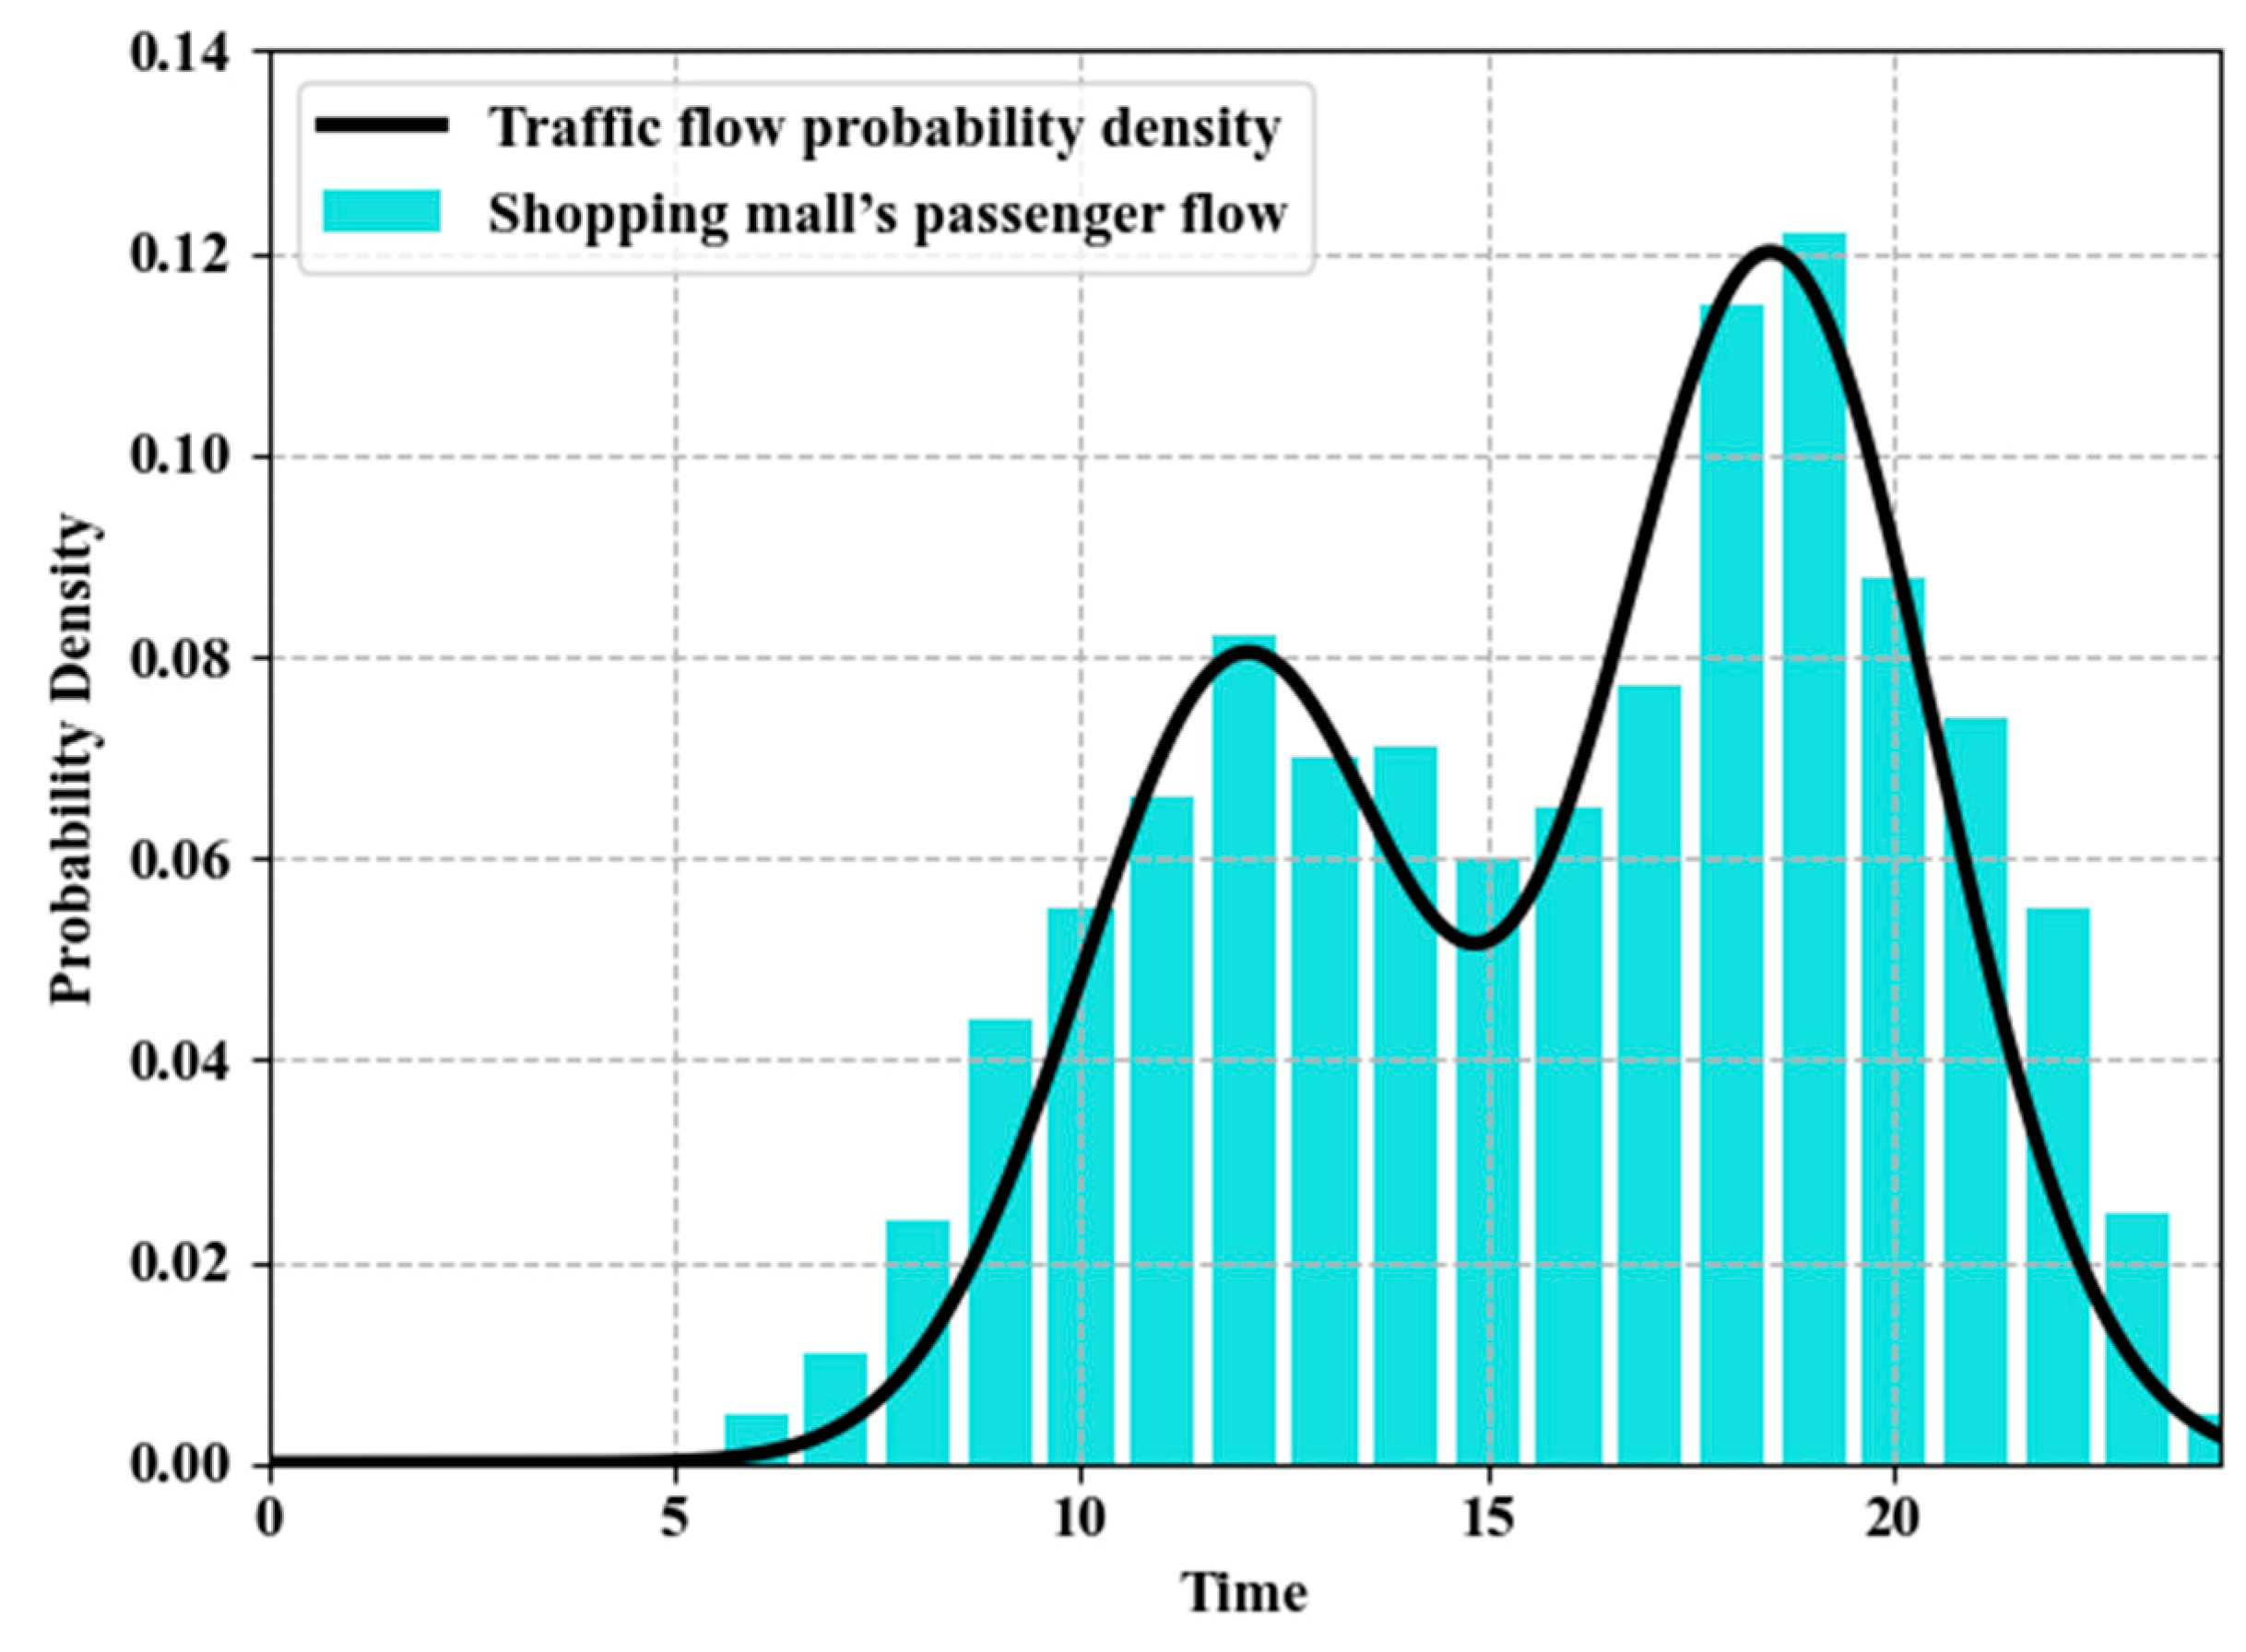
2.1. Traffic Flow Model in Public Commercial Area
2.2. Parking Space Probability Model
2.3. Parking Response Willingness Model
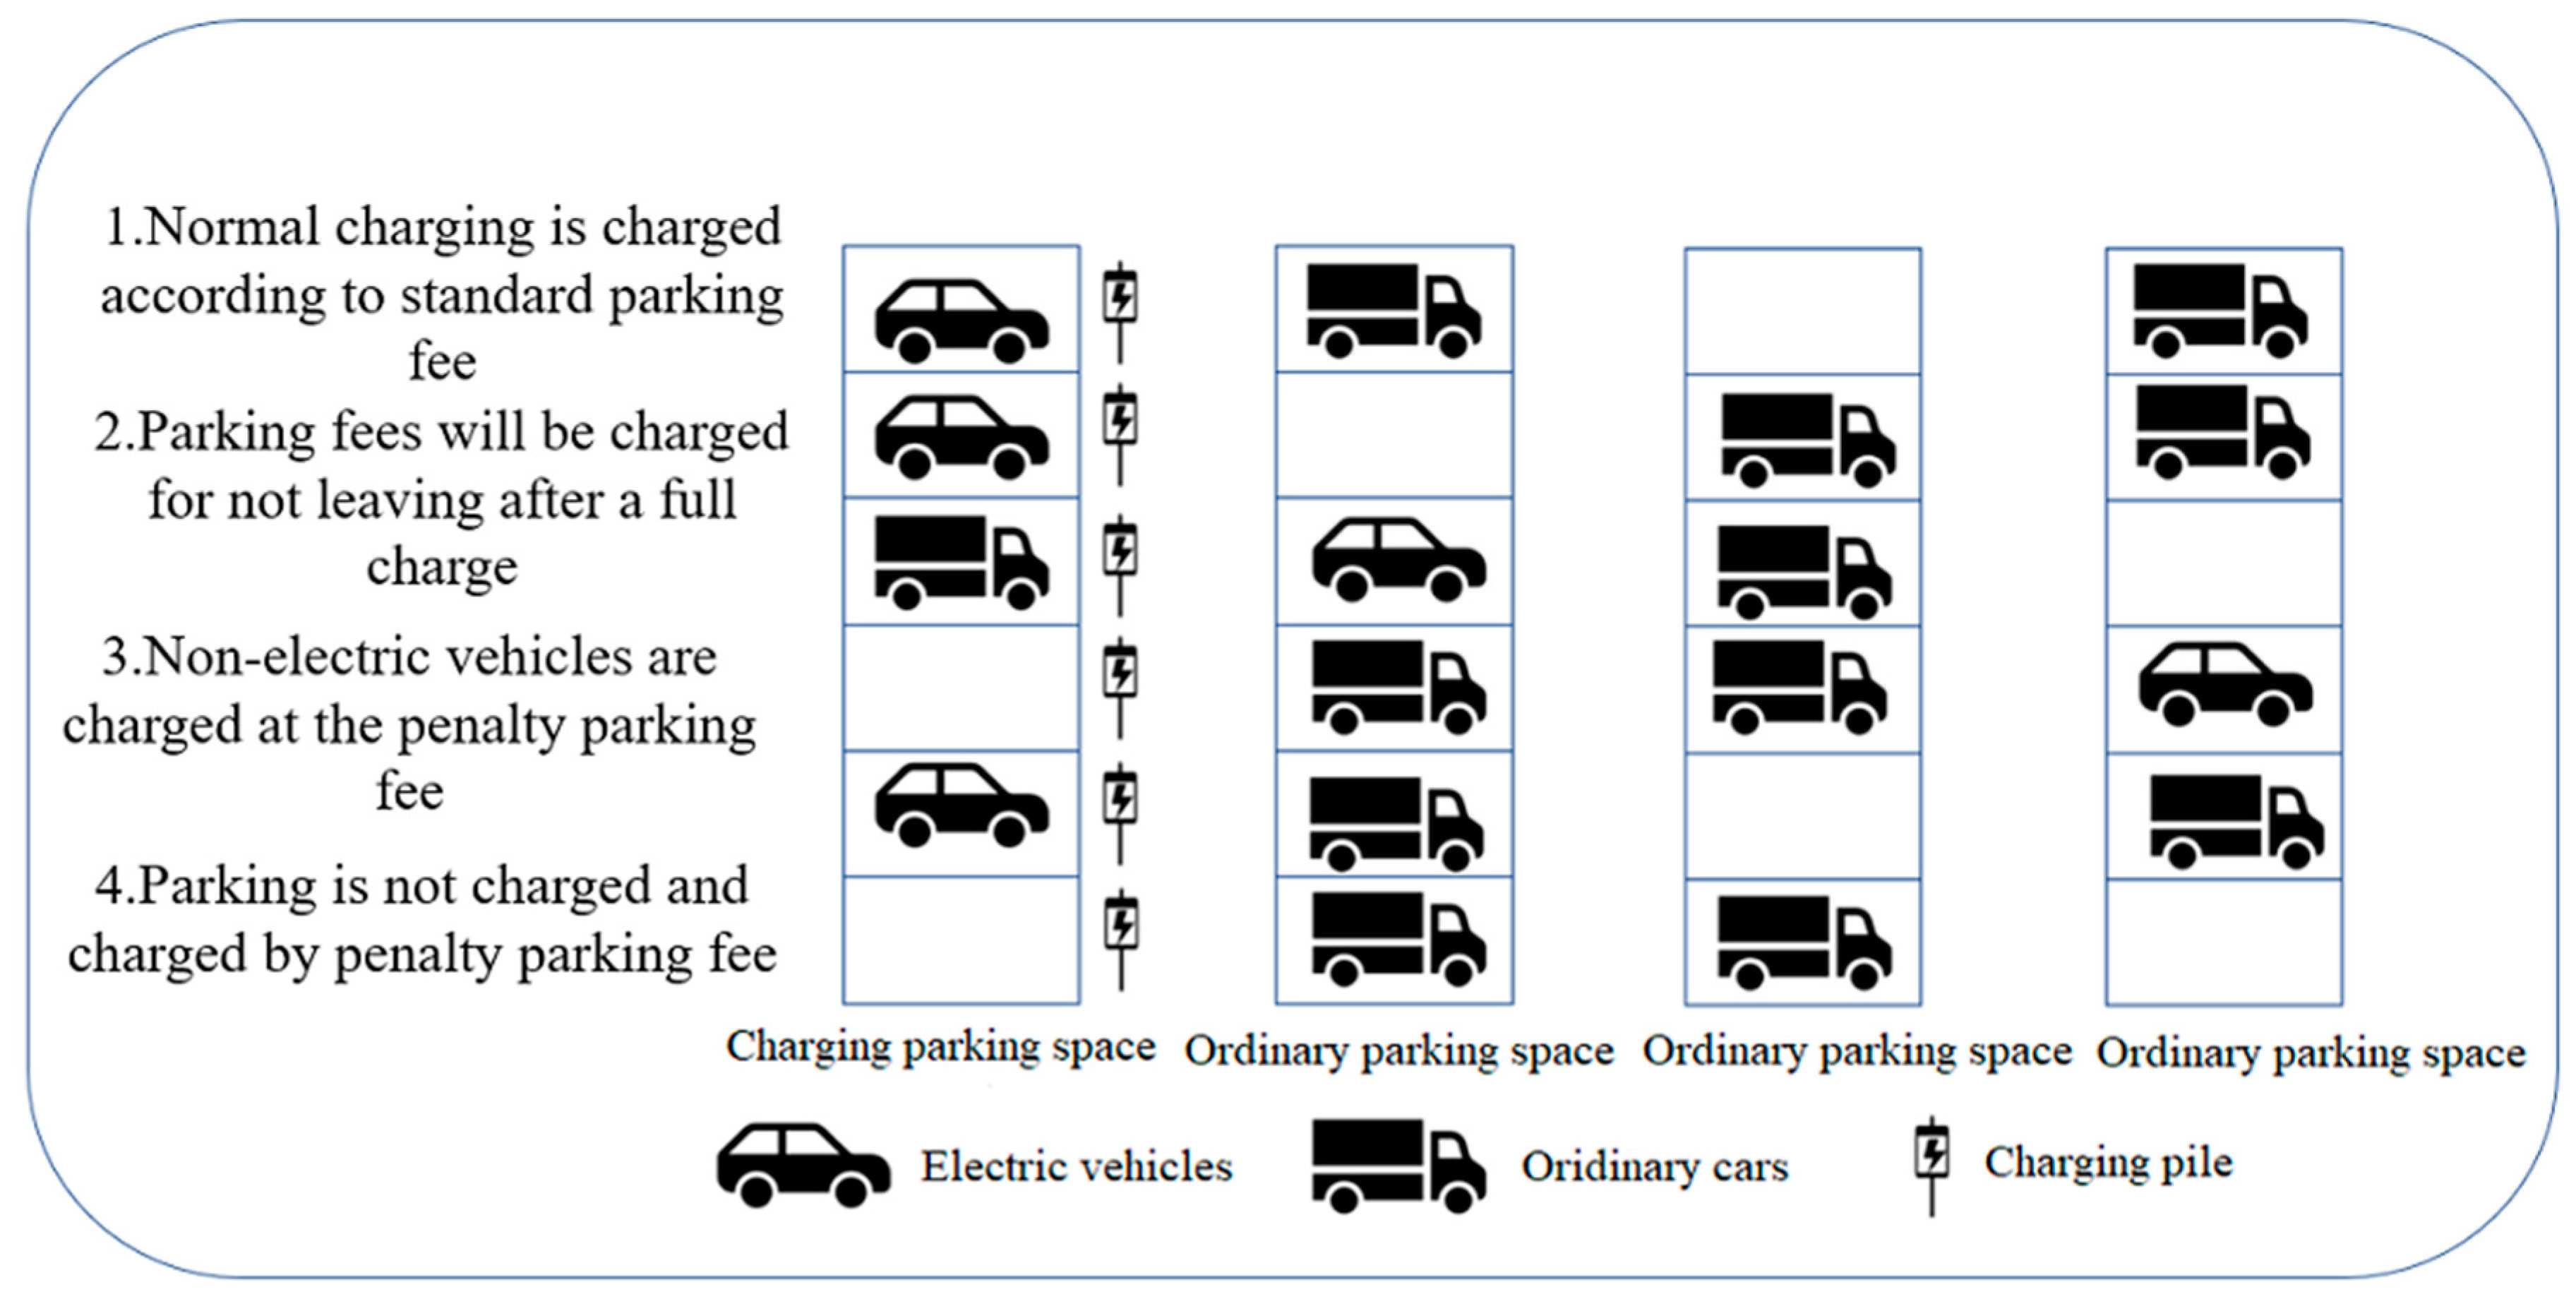
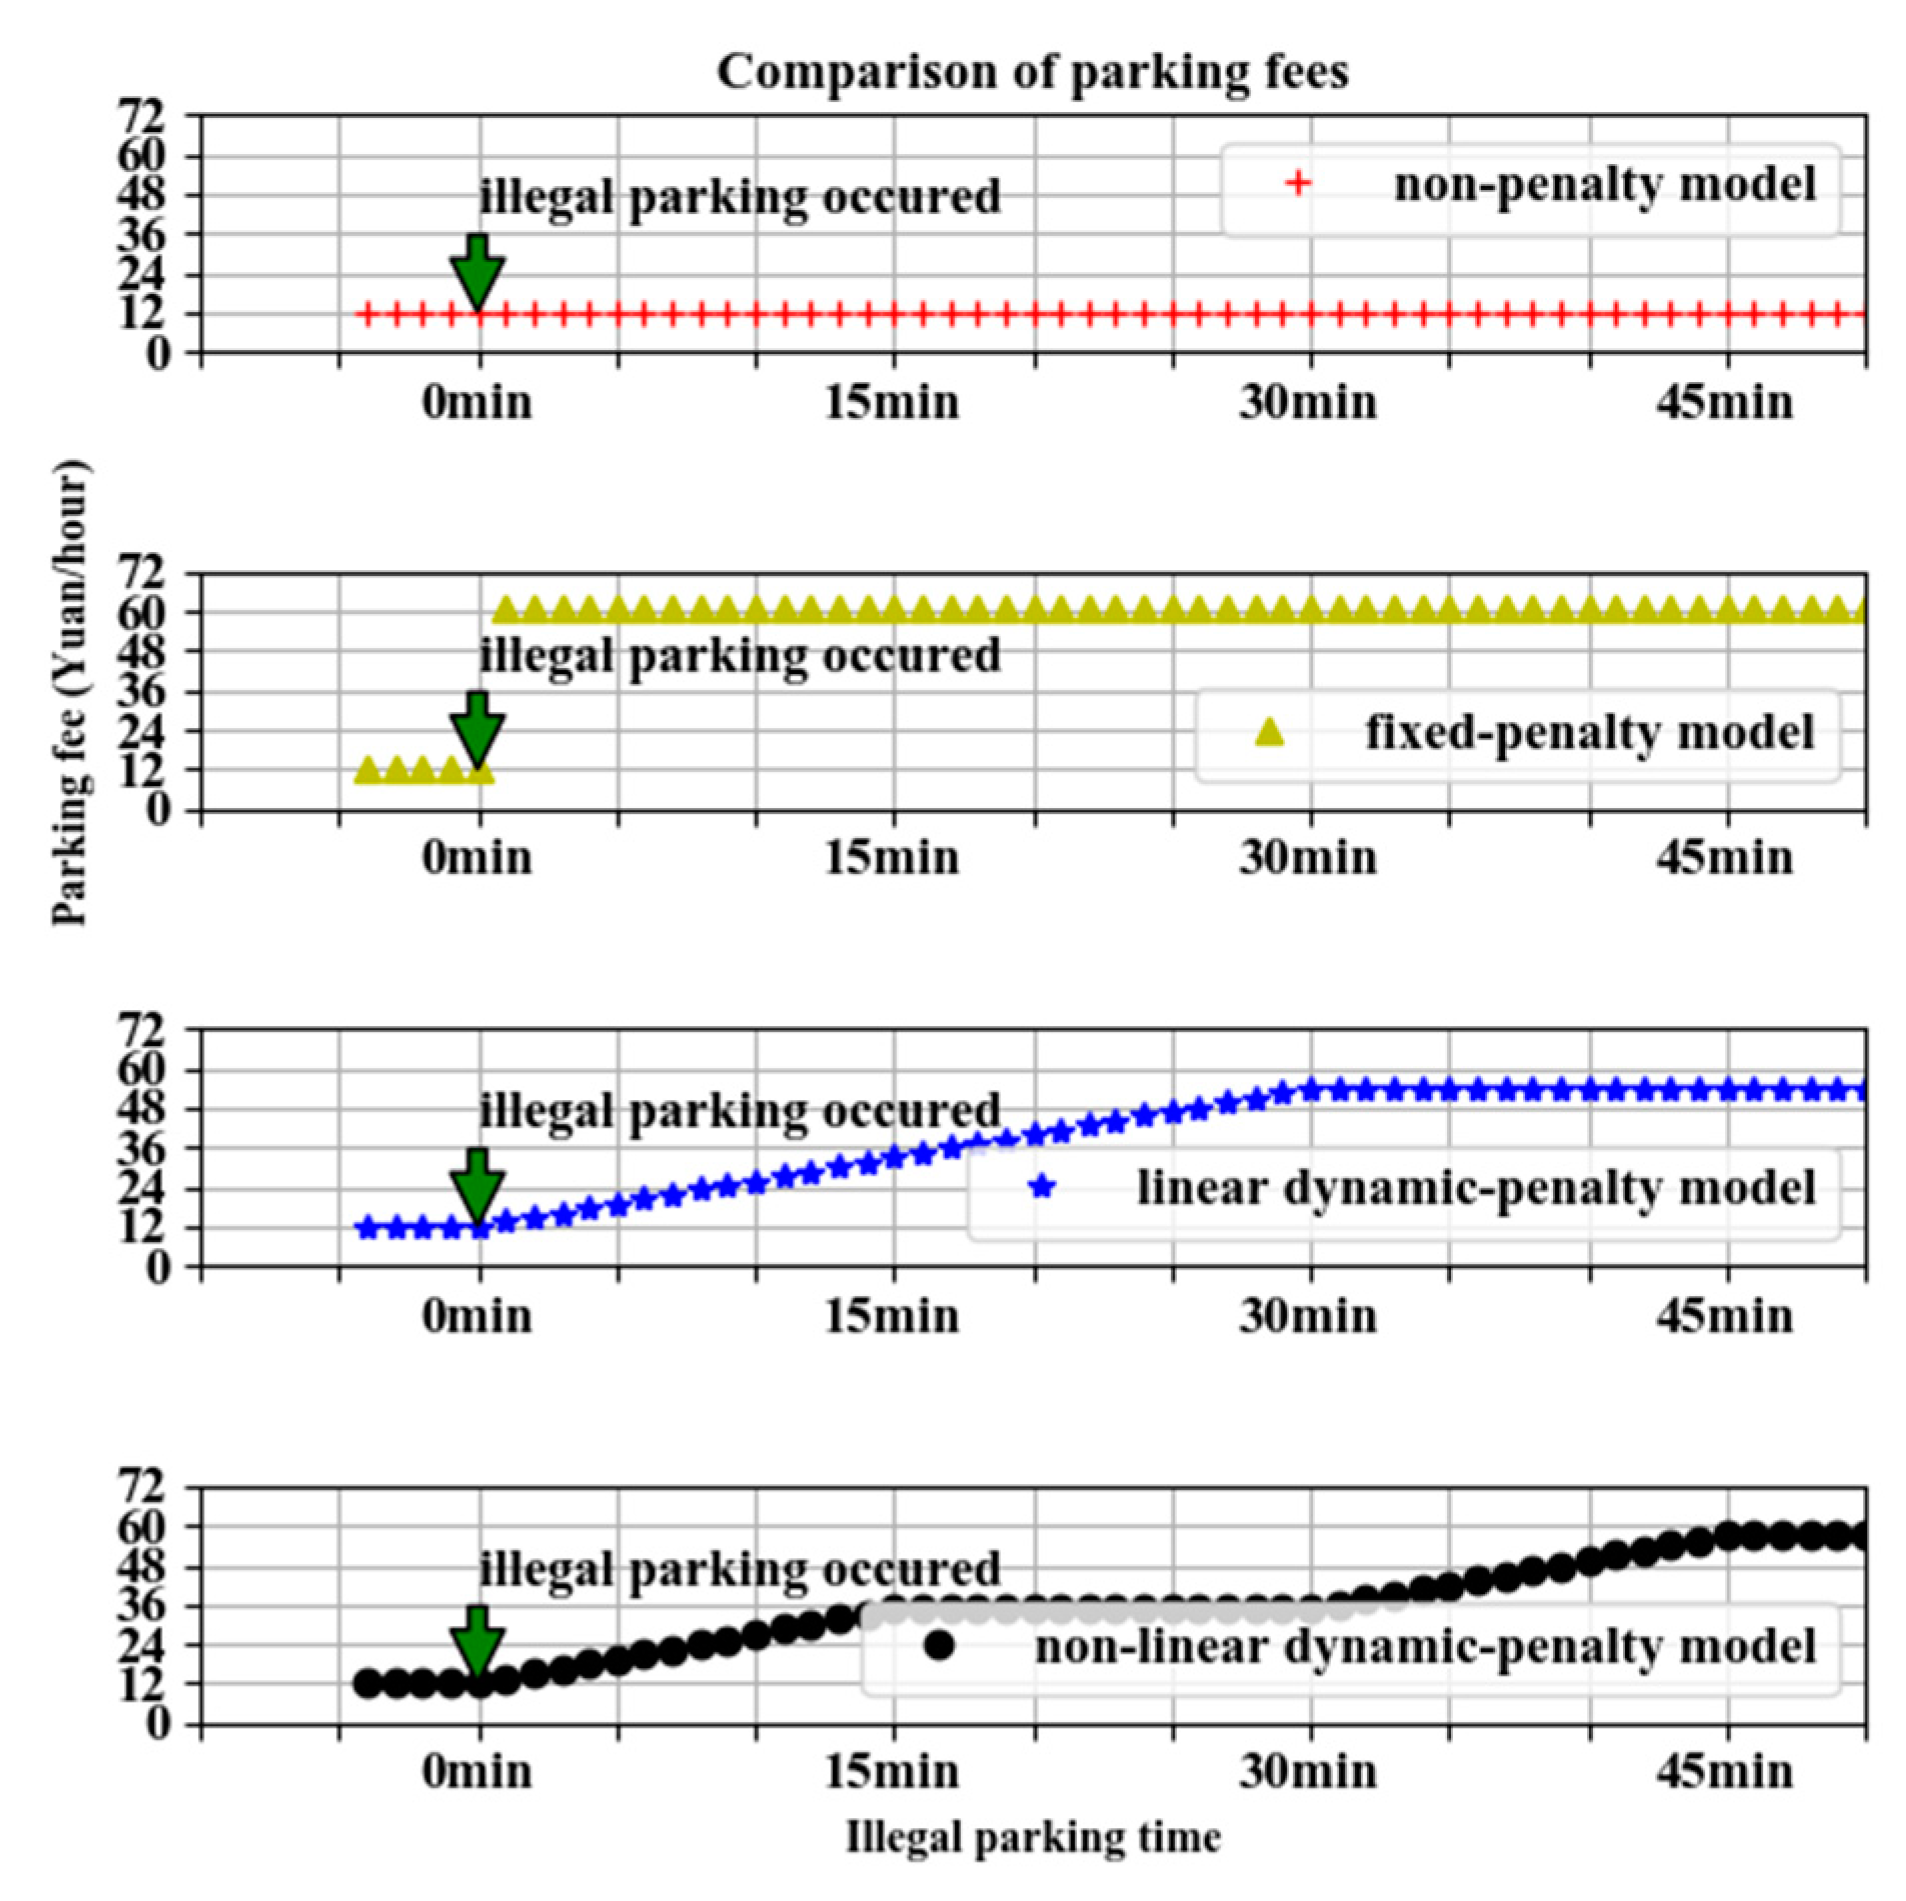
2.4. Penalty Strategy Model
2.4.1. Non-Penalty Model
2.4.2. Fixed-Penalty Model
2.4.3. Dynamic-Penalty Model
3. Optimization Model
3.1. Objective Functiaon
3.2. Partical Swarm Optimization Algorithm
- Step1: Initialize the population, the particle length is [penalty factor, the cost of moving the car], and the population size is 50.
- Step2: Initialize the particle fitness, randomly generate the penalty factor and the cost of moving the car, calculate the average parking lot utilization according to the particle state, and calculate the optimal fitness of the population and the fitness of each particle.
- Step3: Update particle velocity.
- Step4: Update particle position.
- Step5: Update the particle individual optimal and global optimal.
- Step6: If the termination condition is met, return to the optimal particle position; otherwise, loop to Step3.
4. Numerical Case Studies
4.1. Problem Description
4.2. Parameter Settings
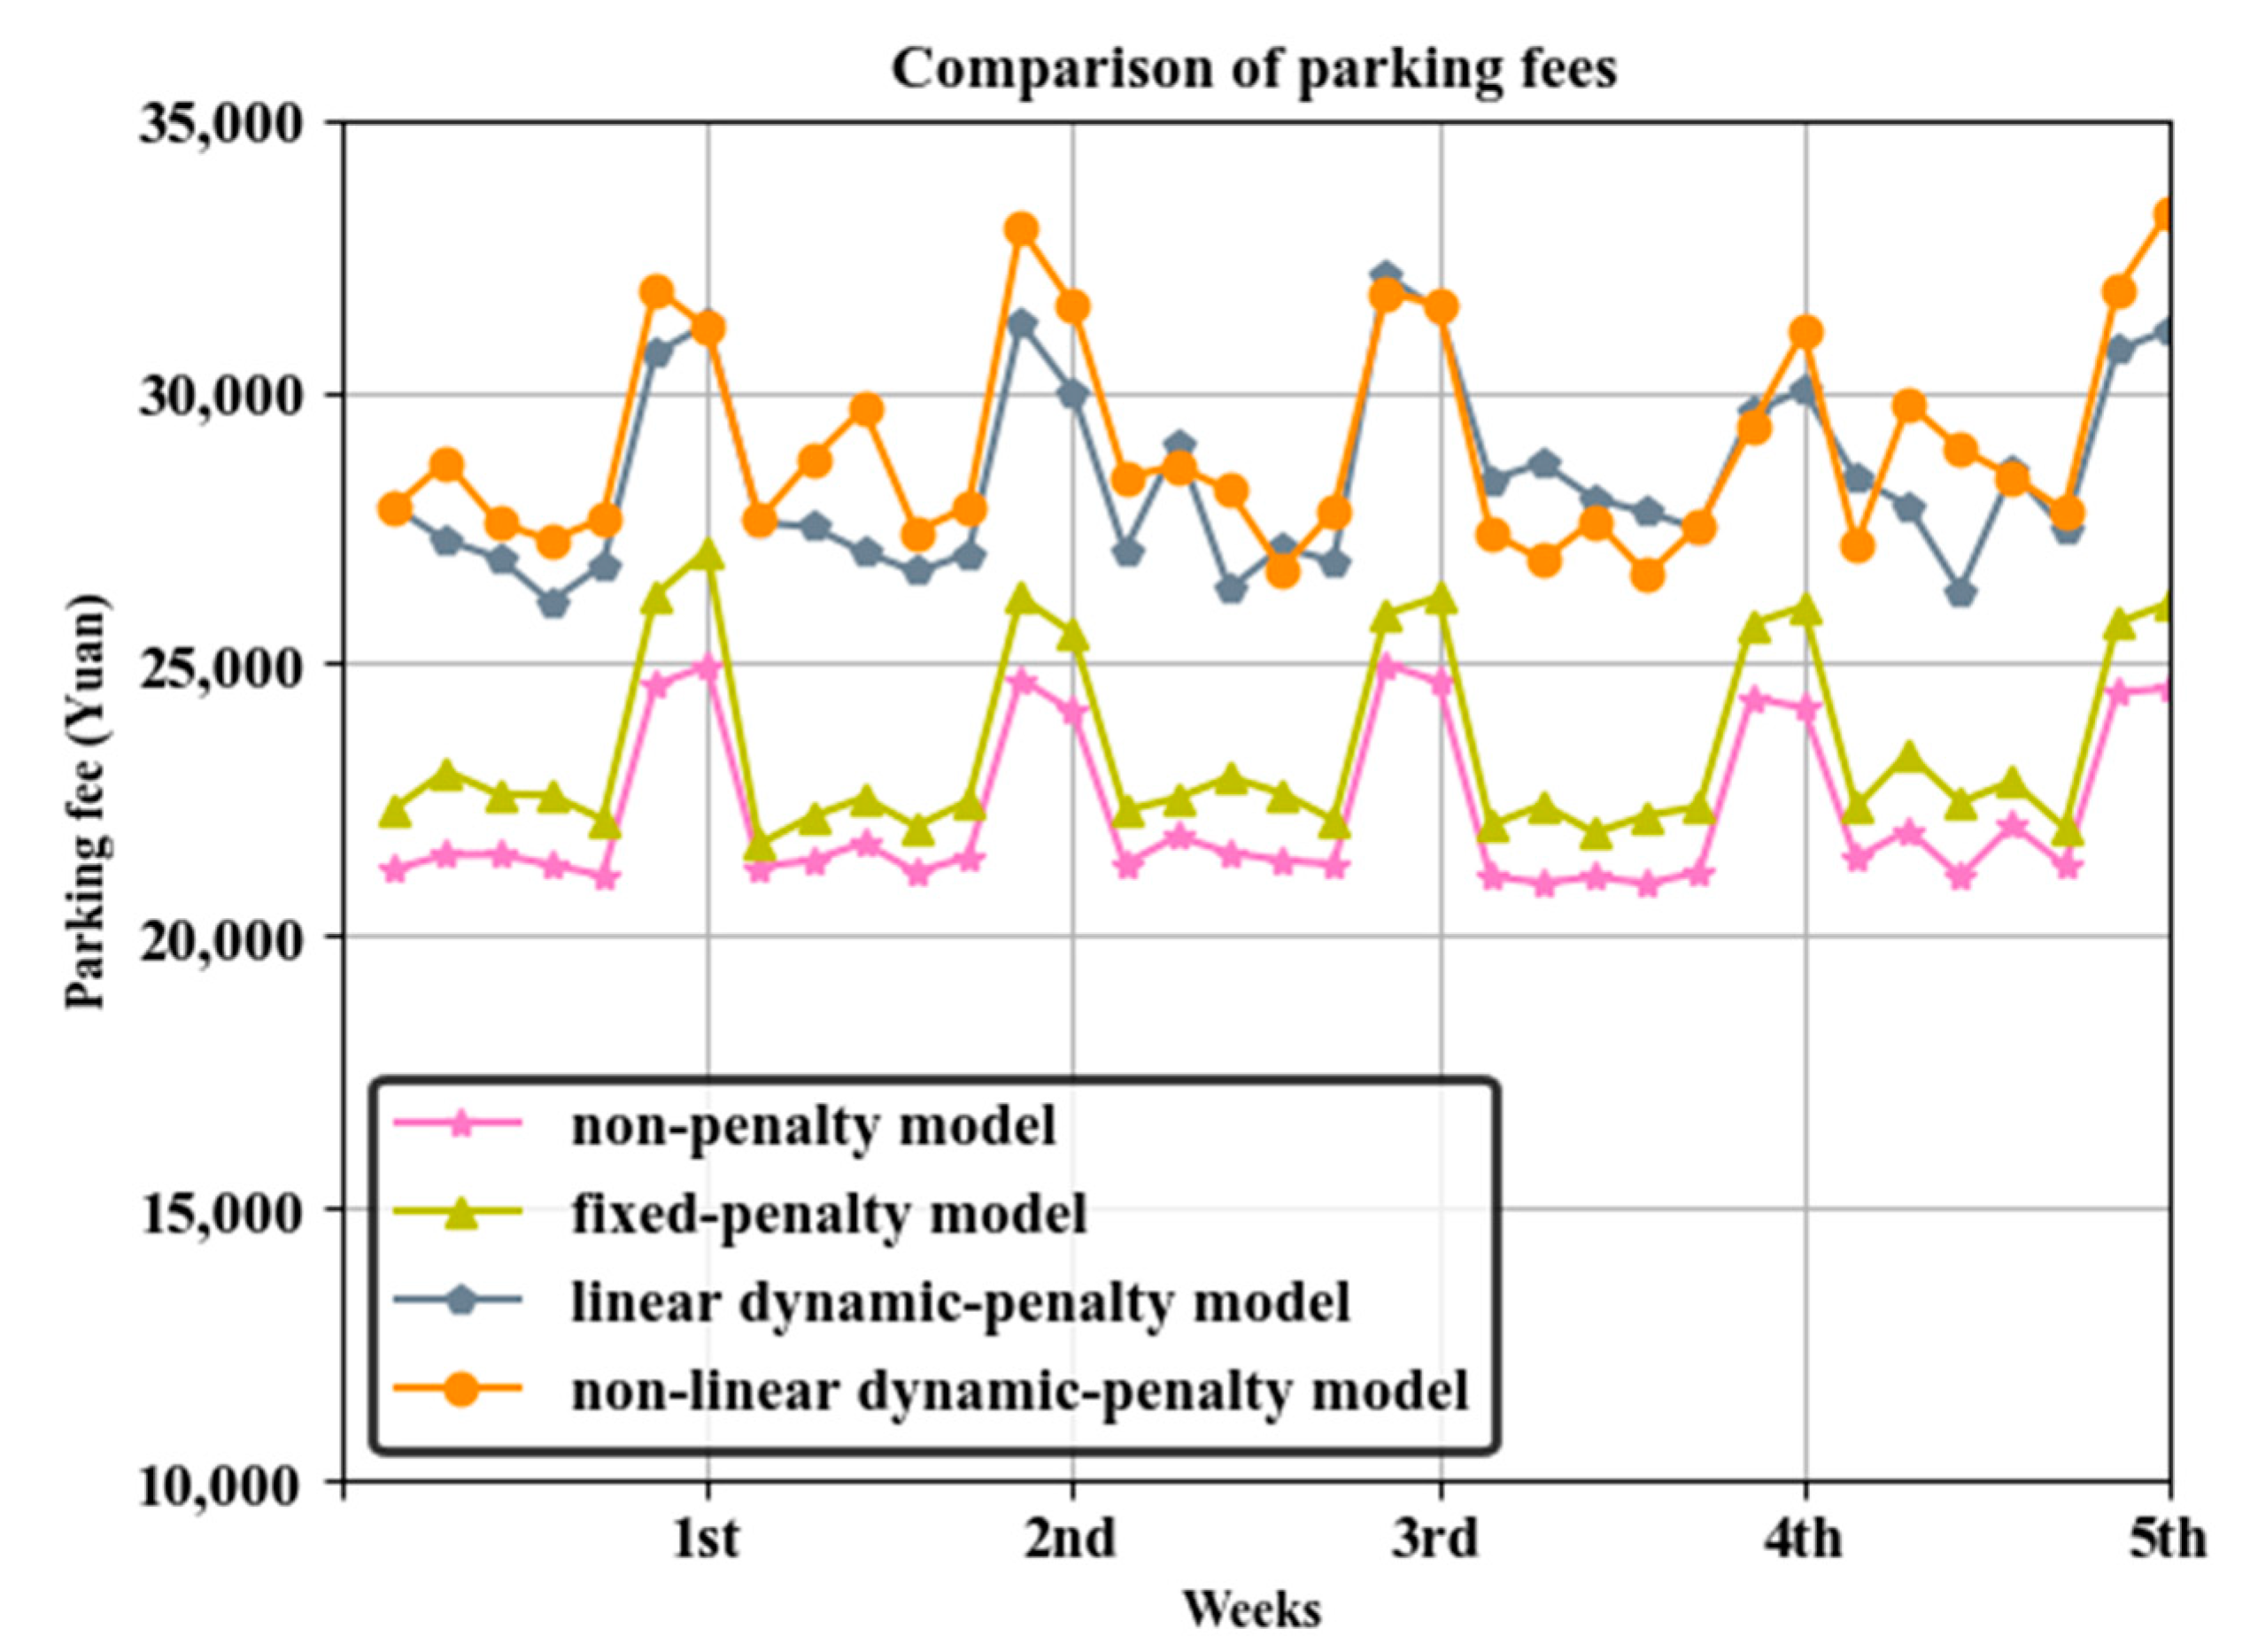
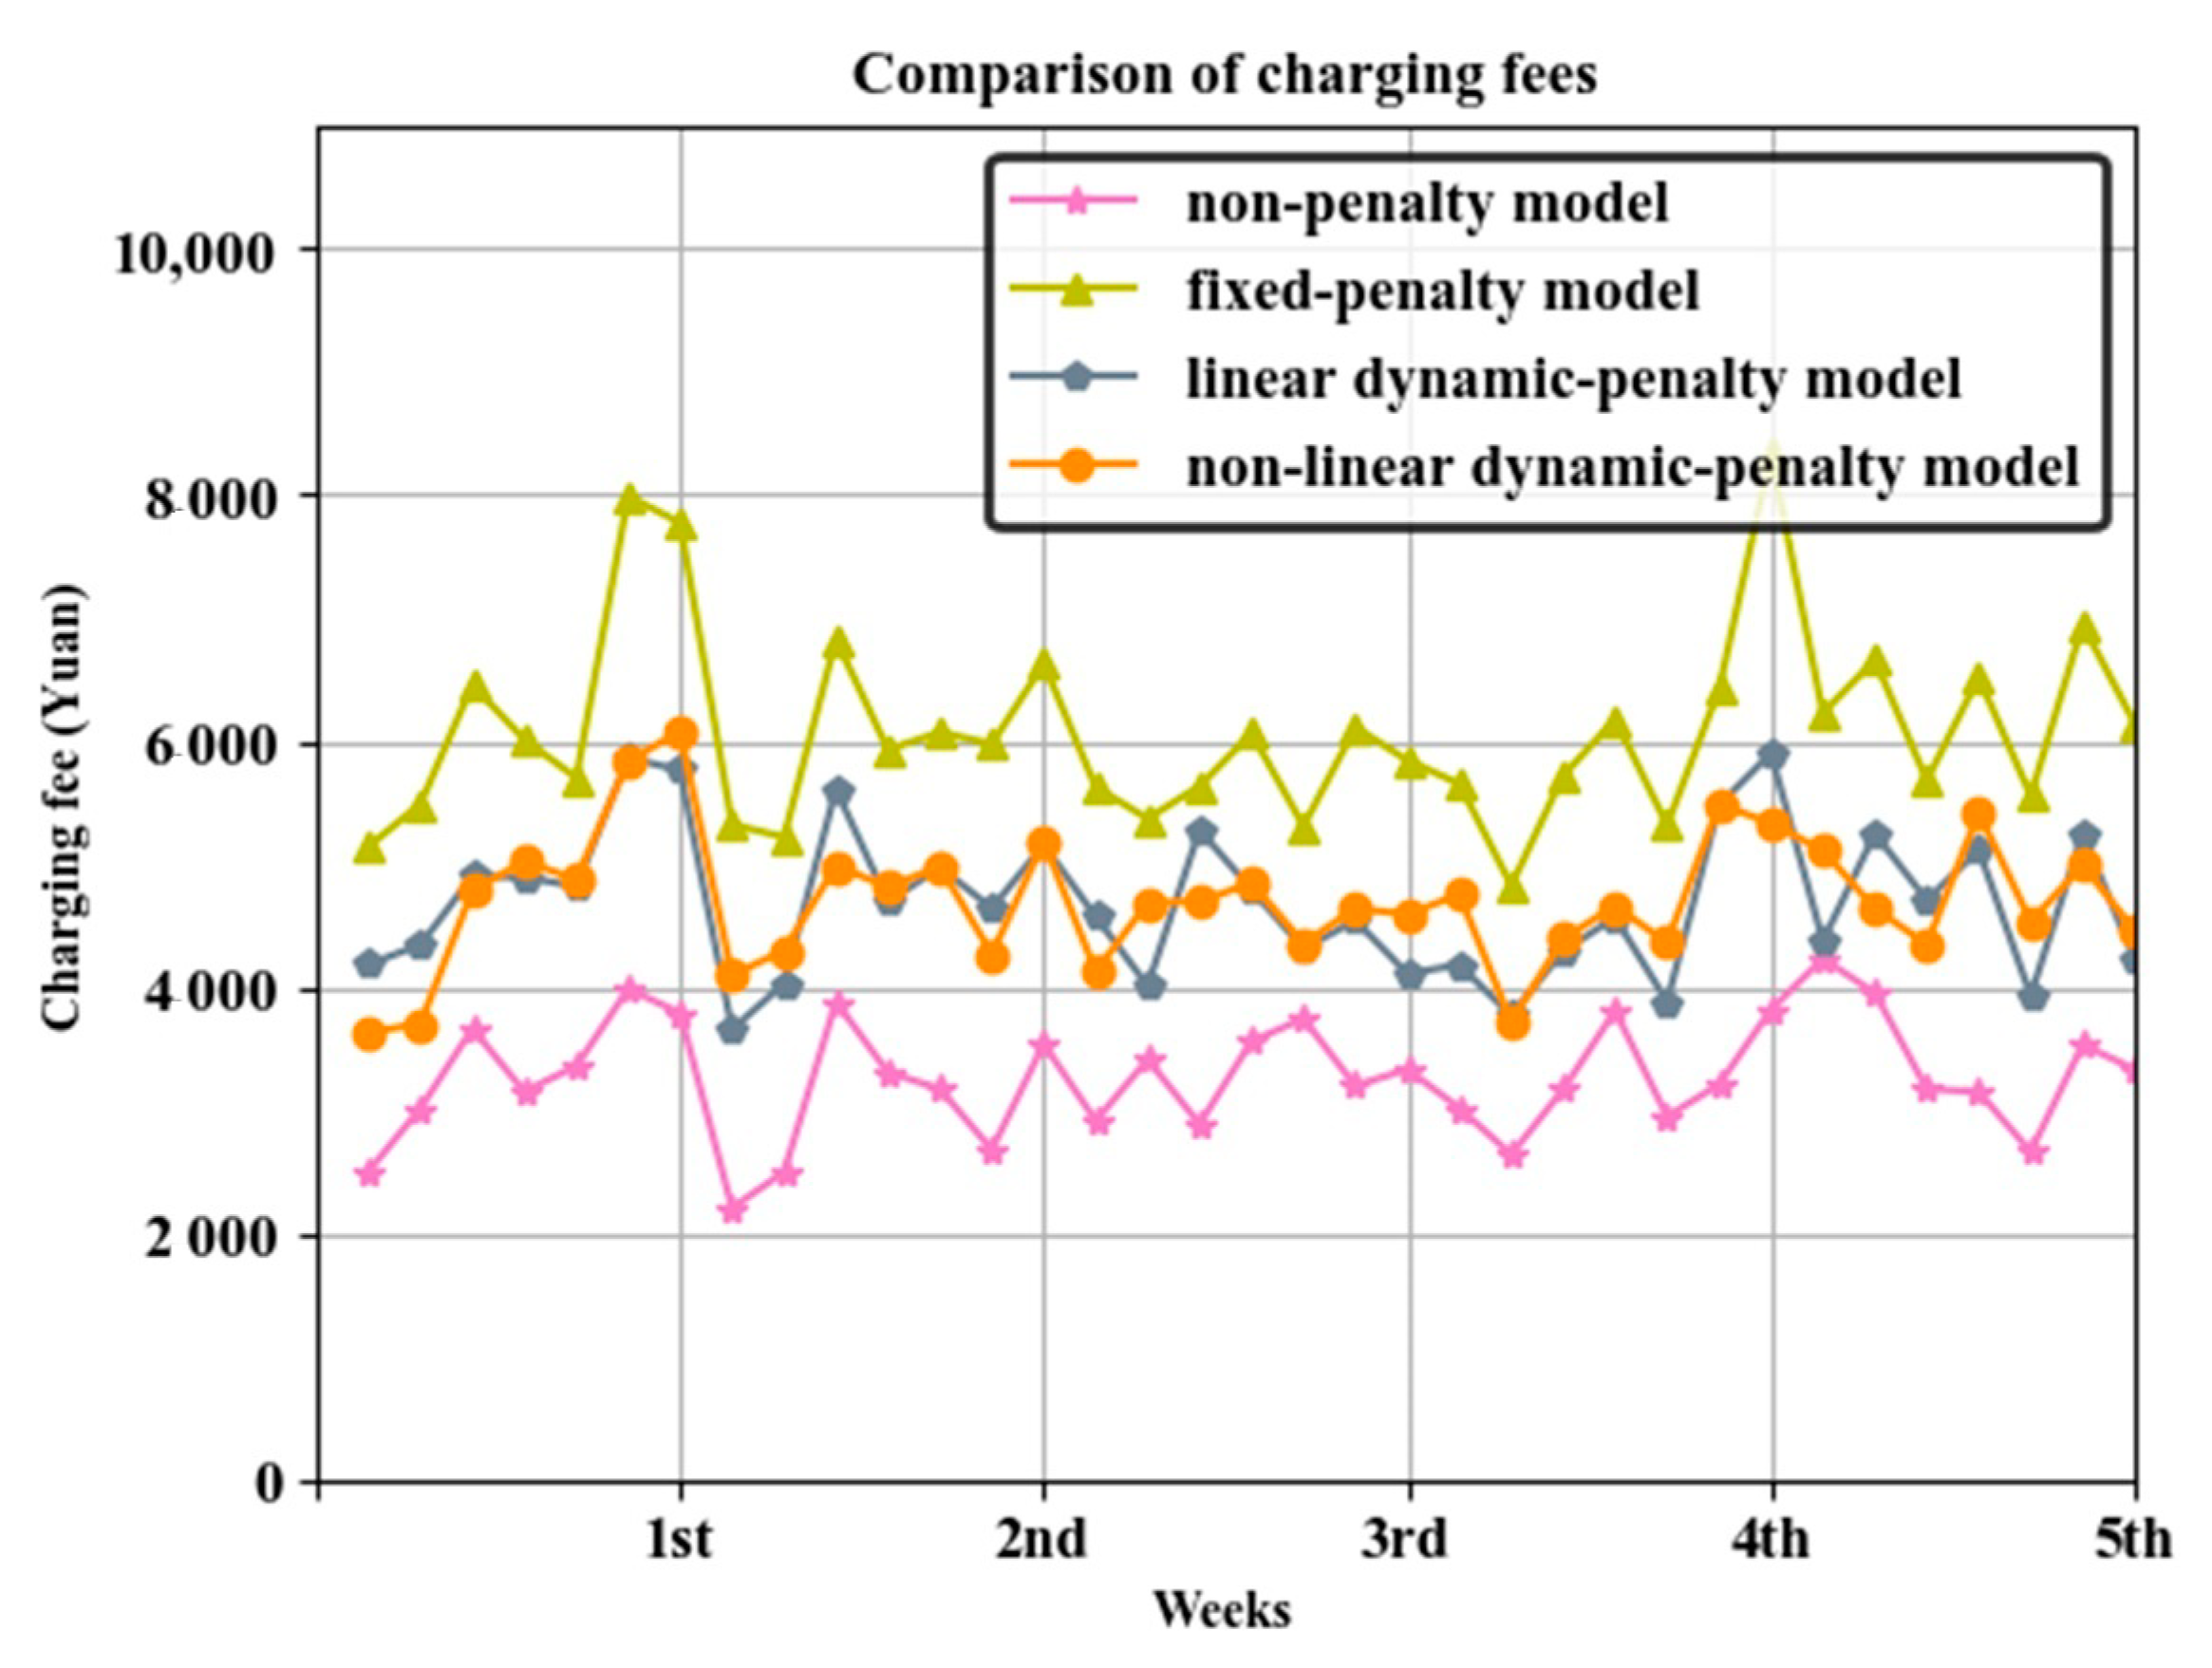
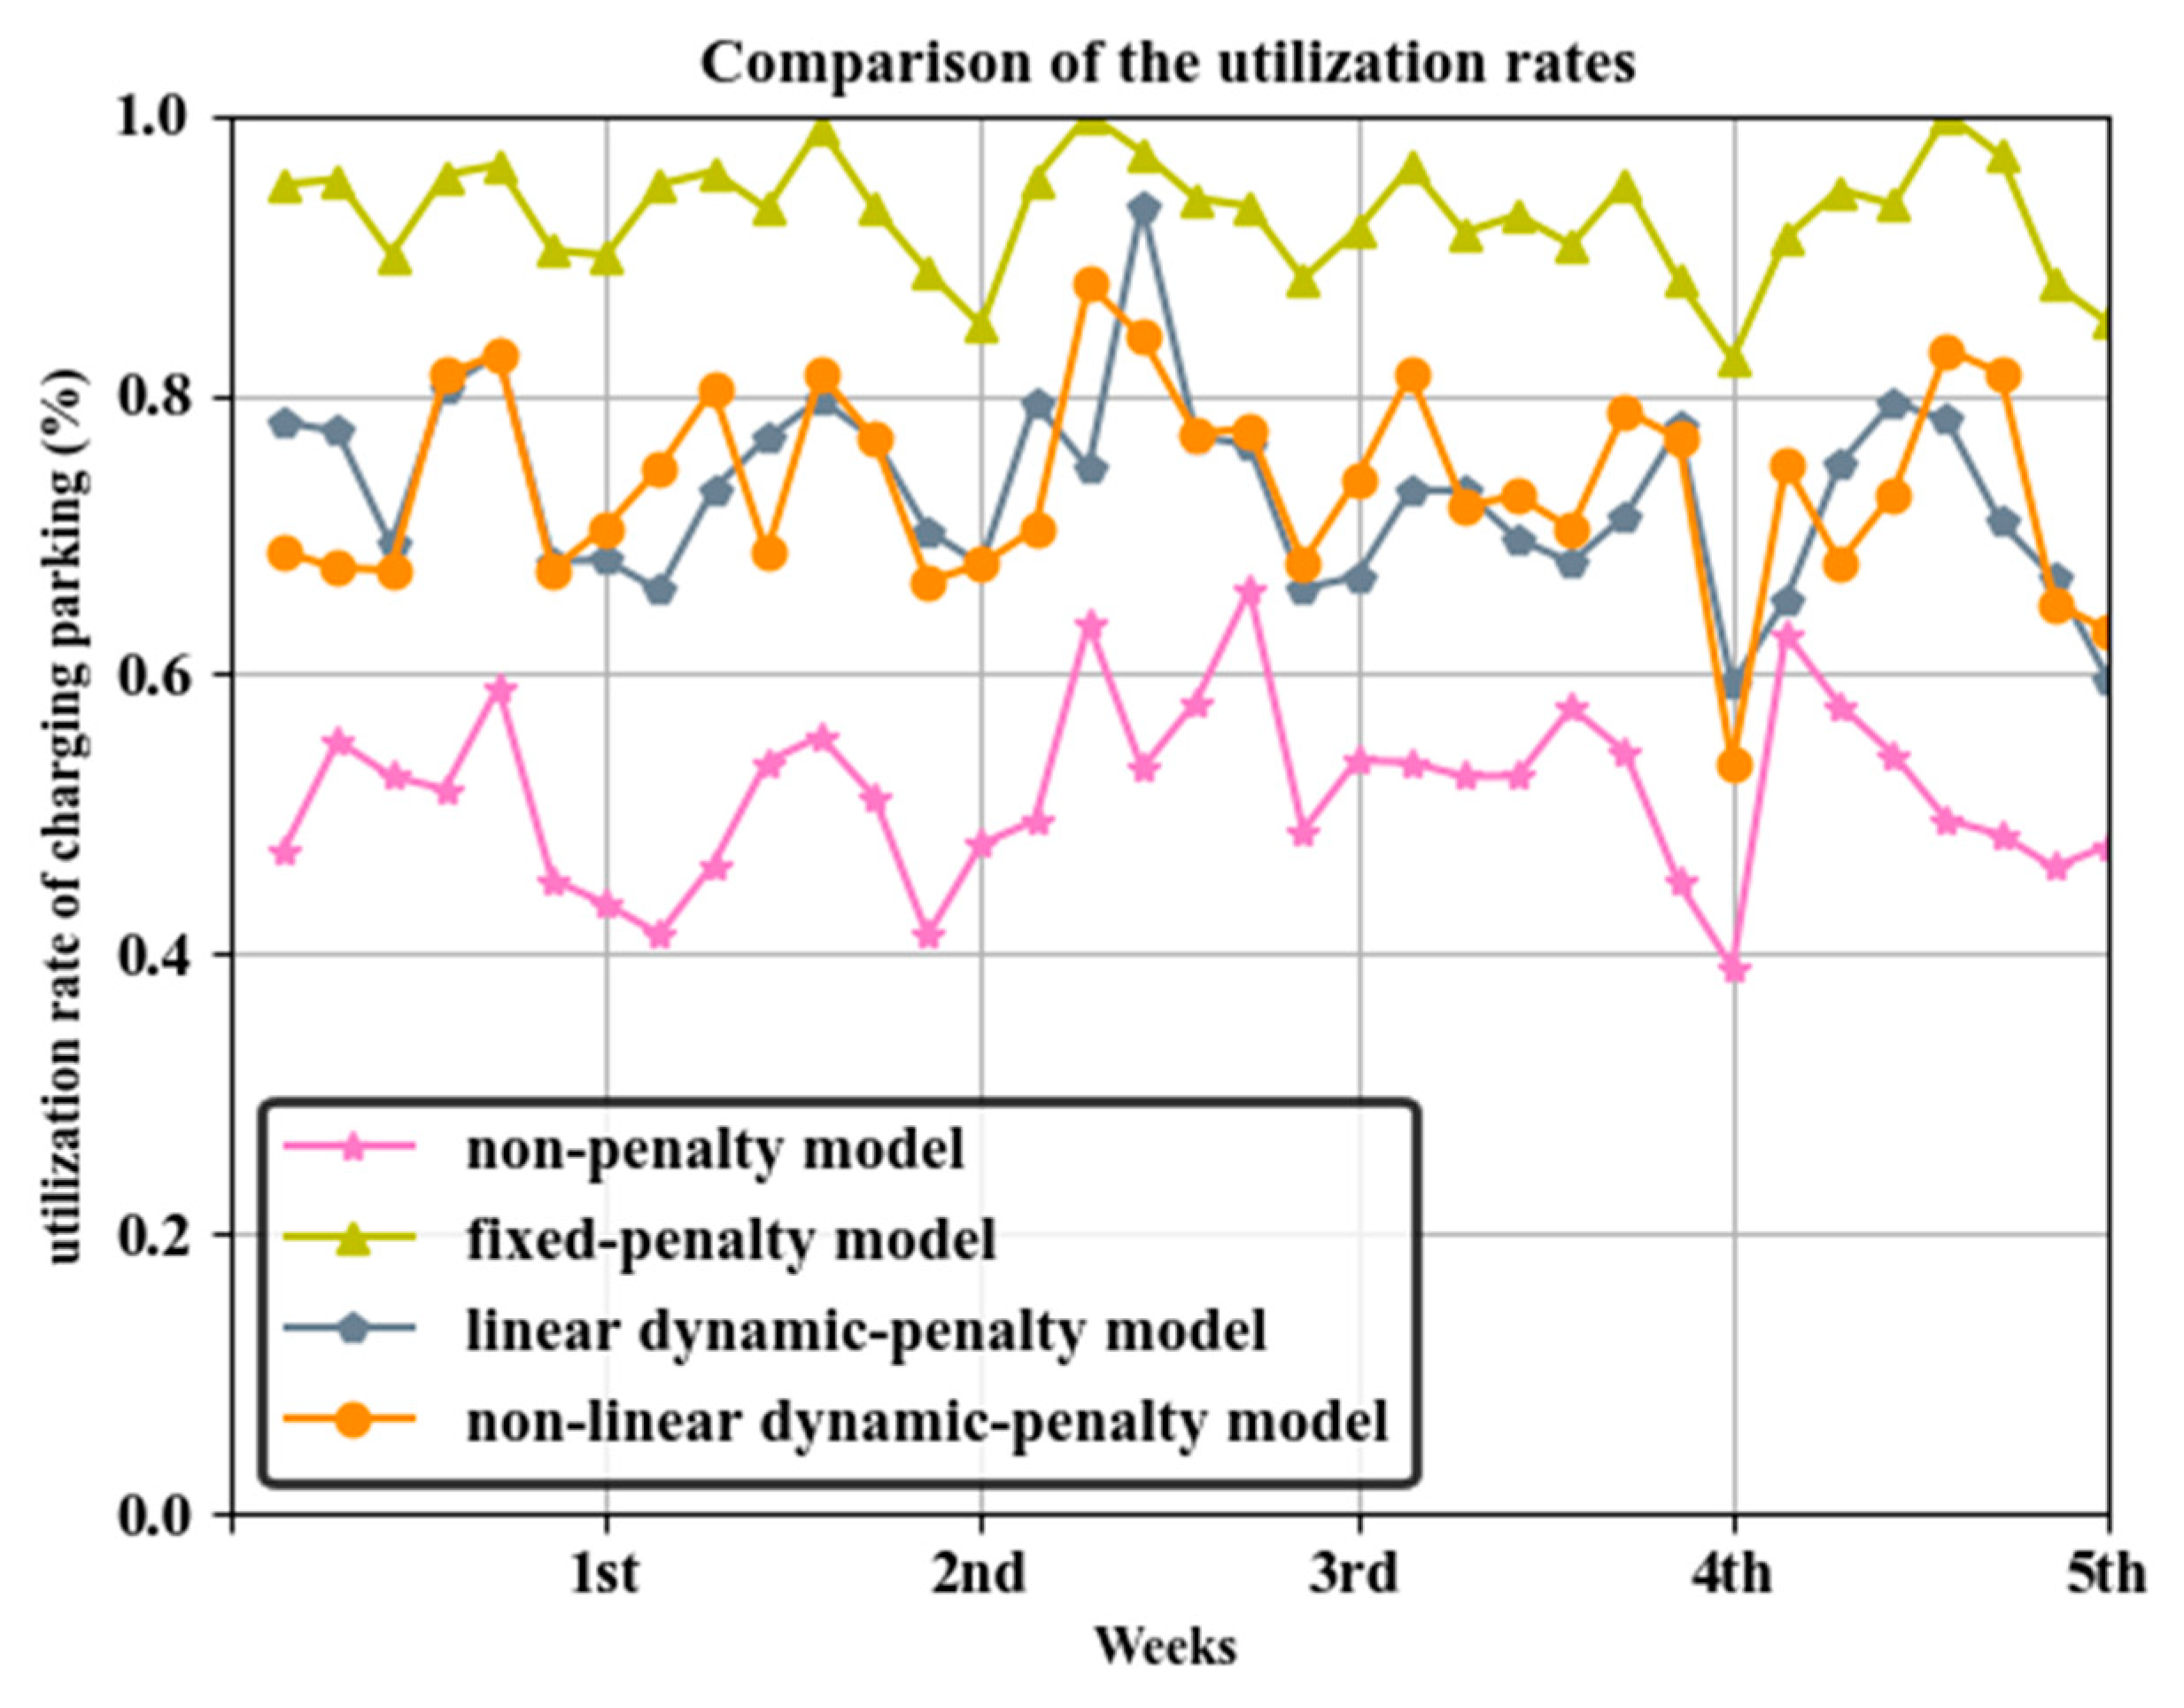
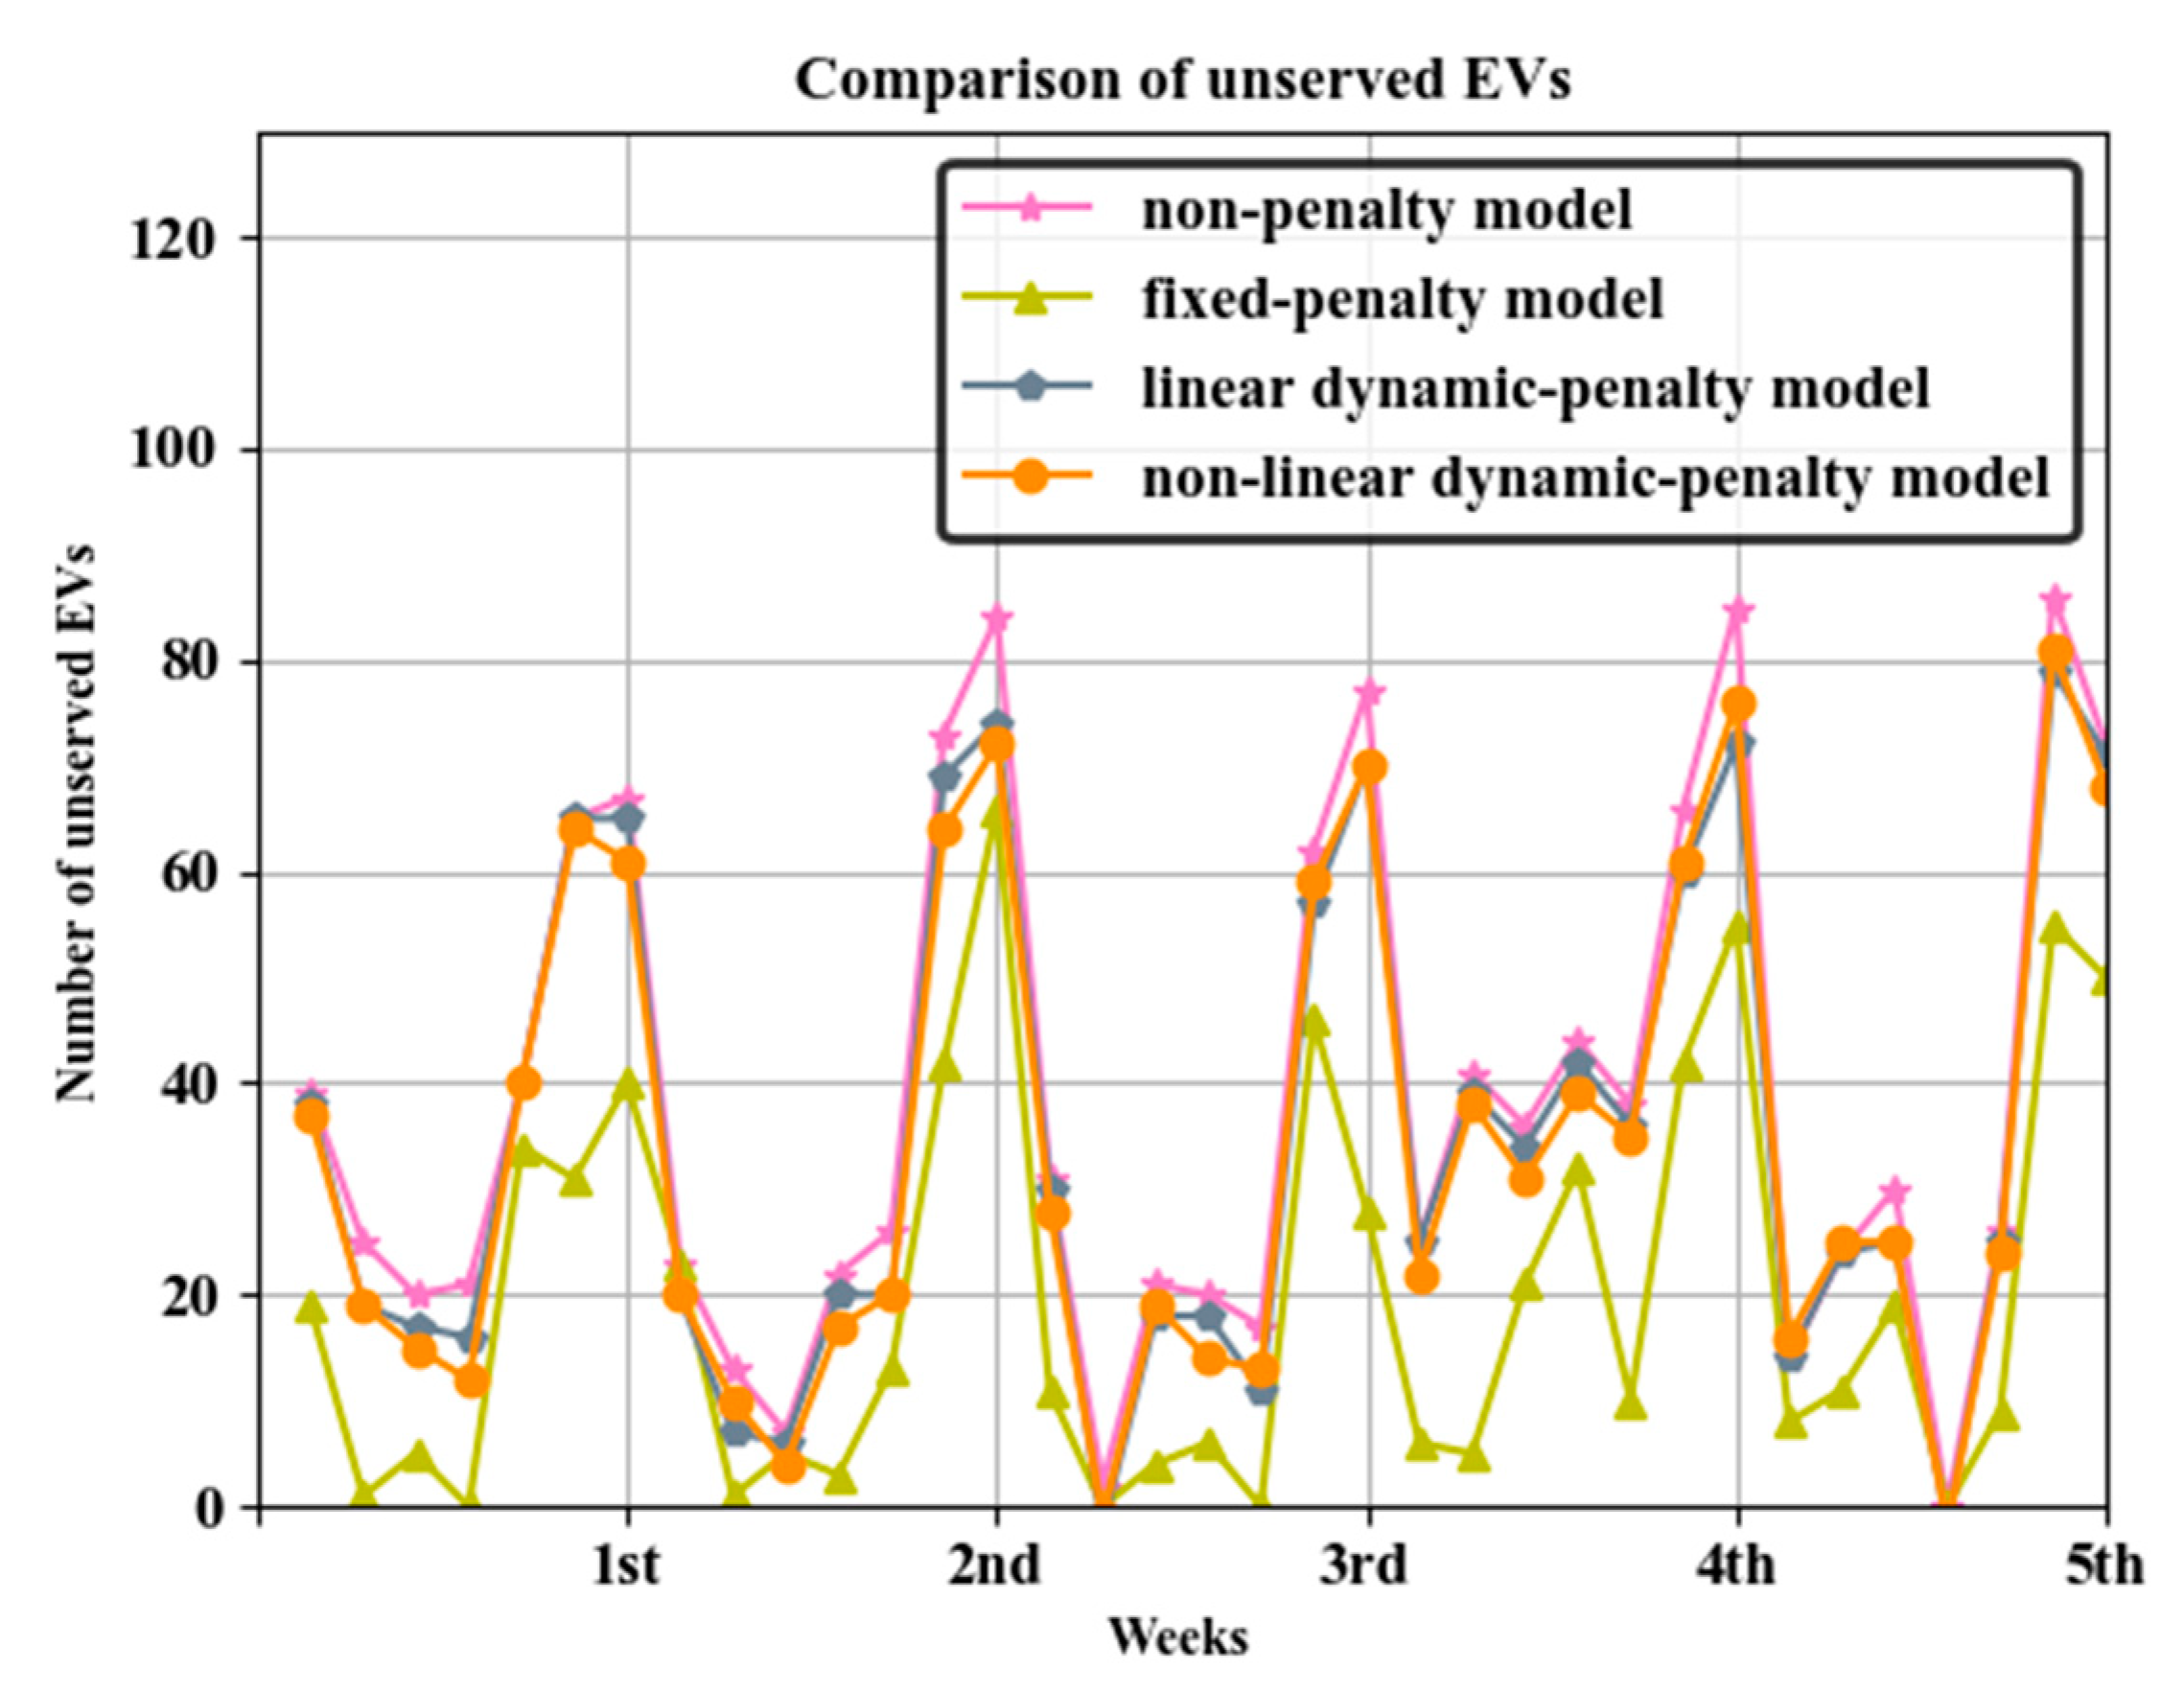
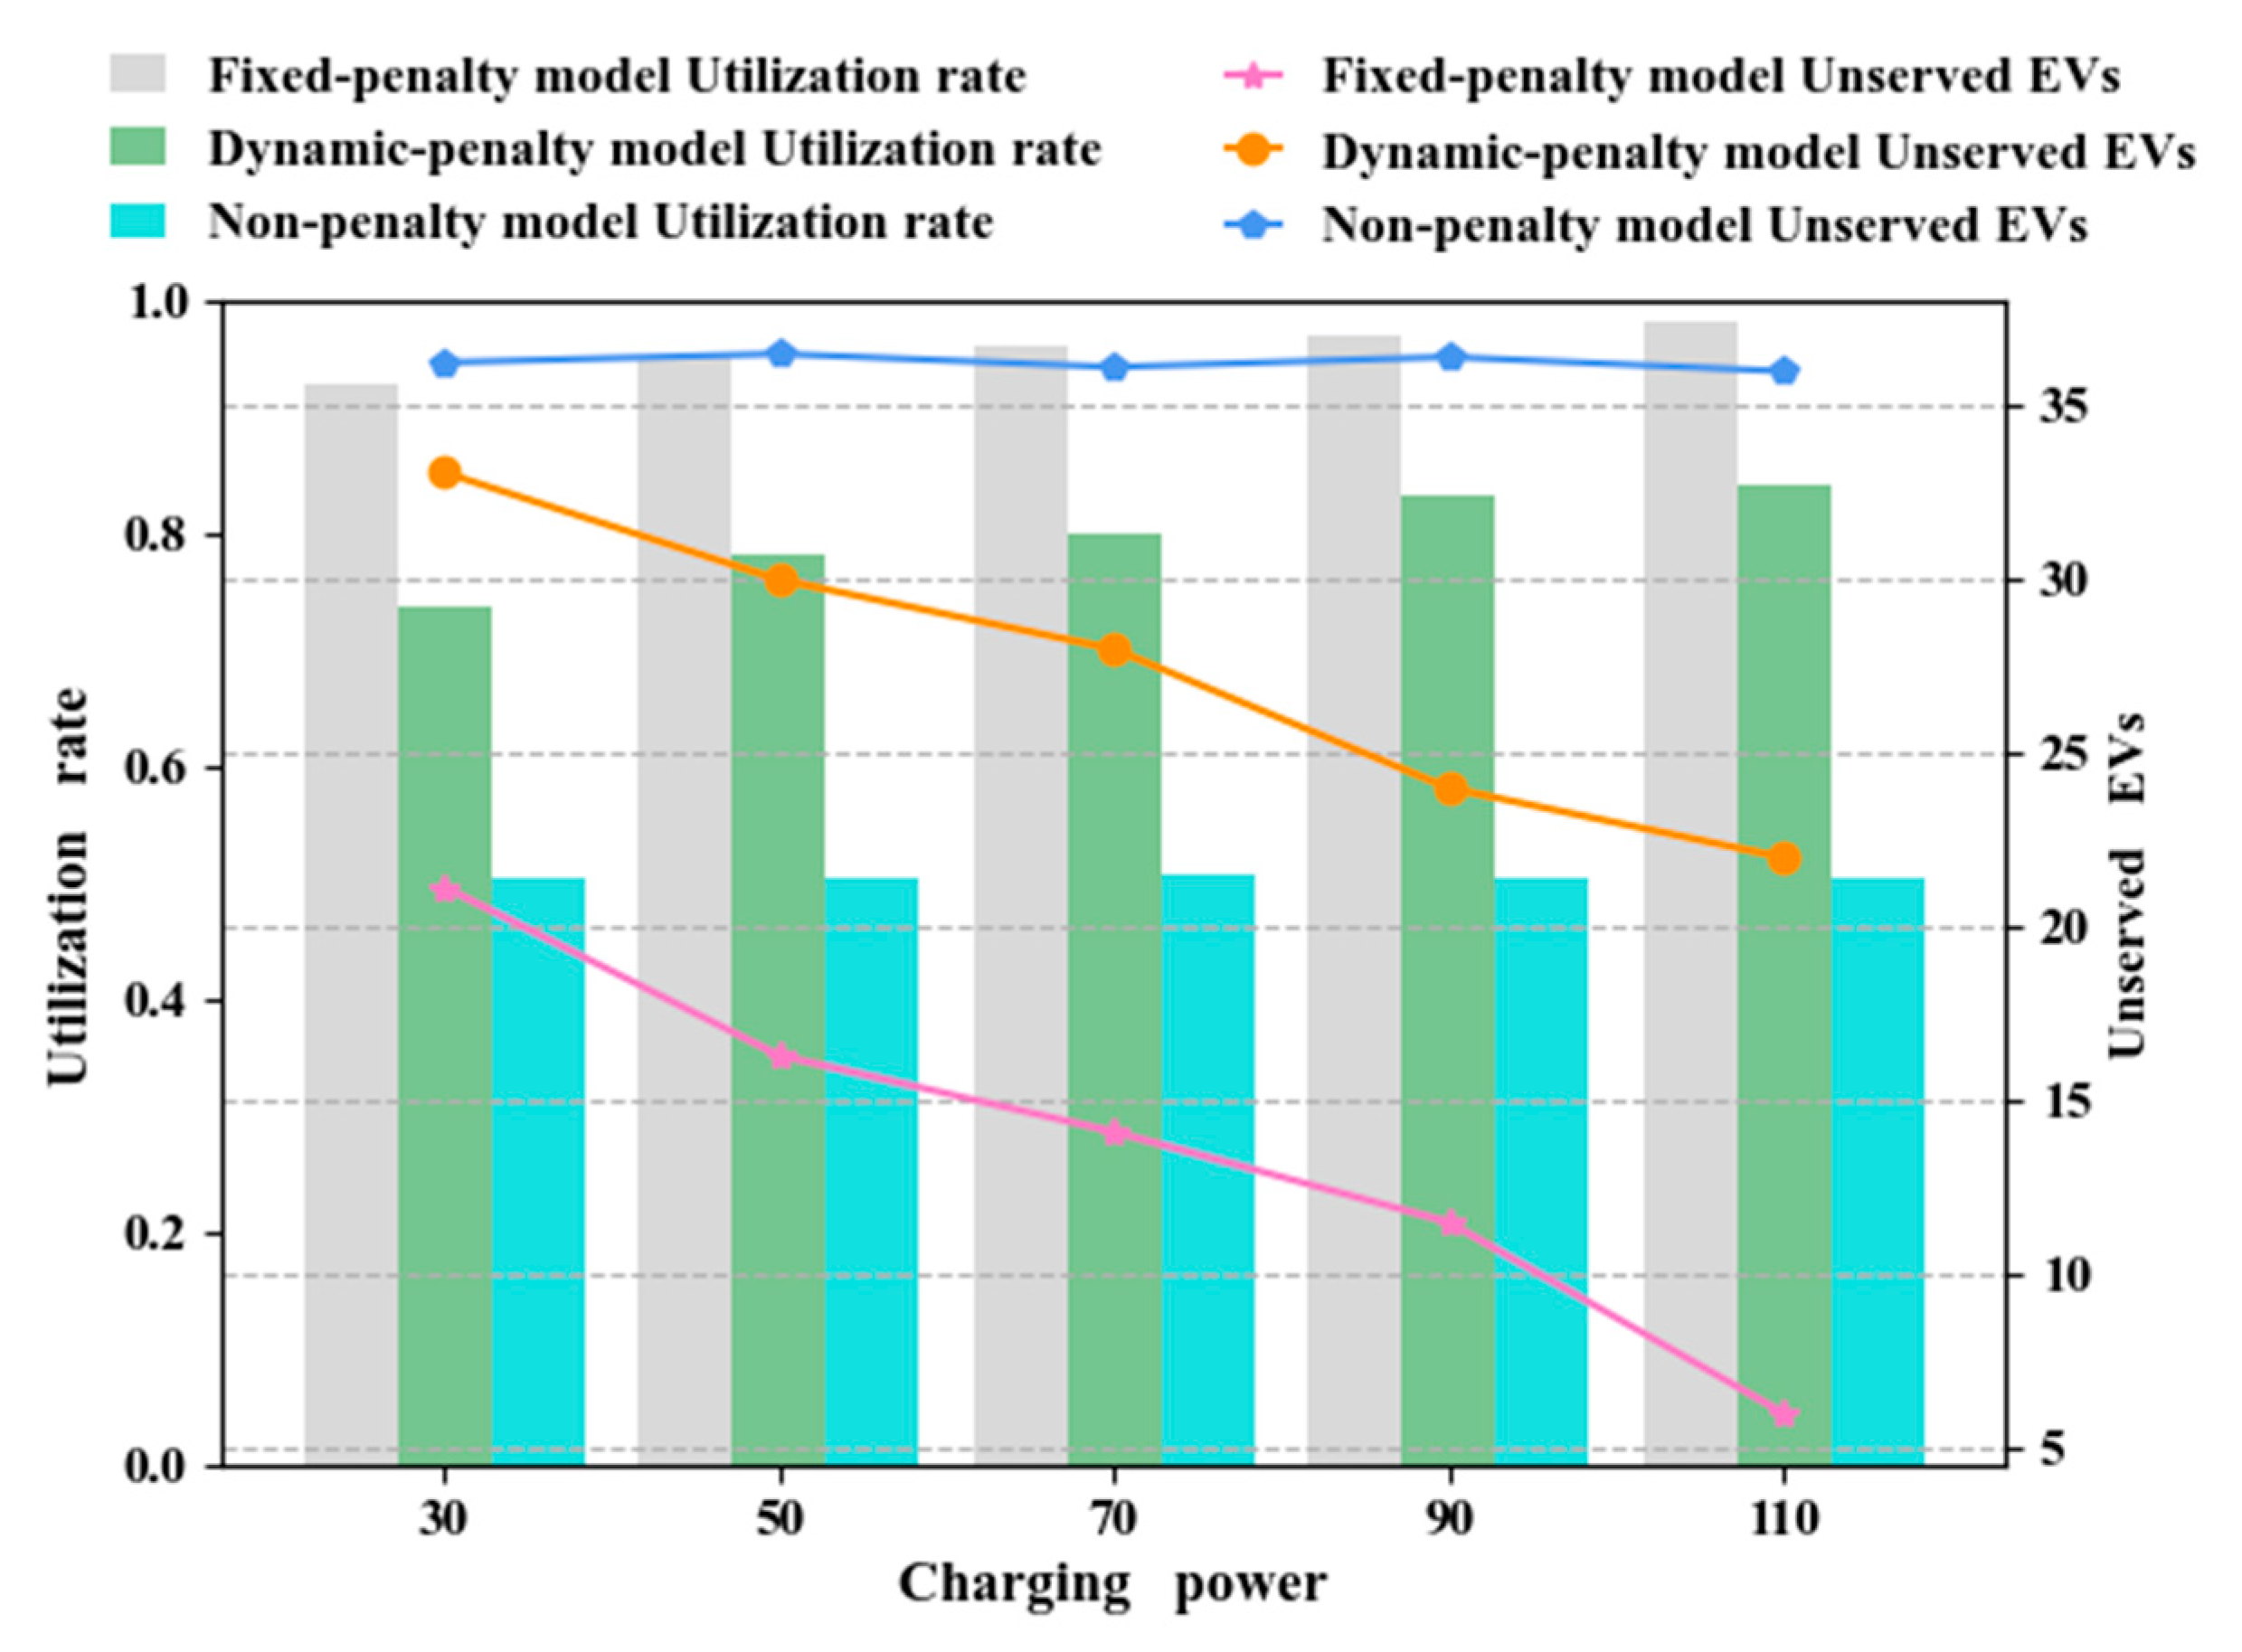
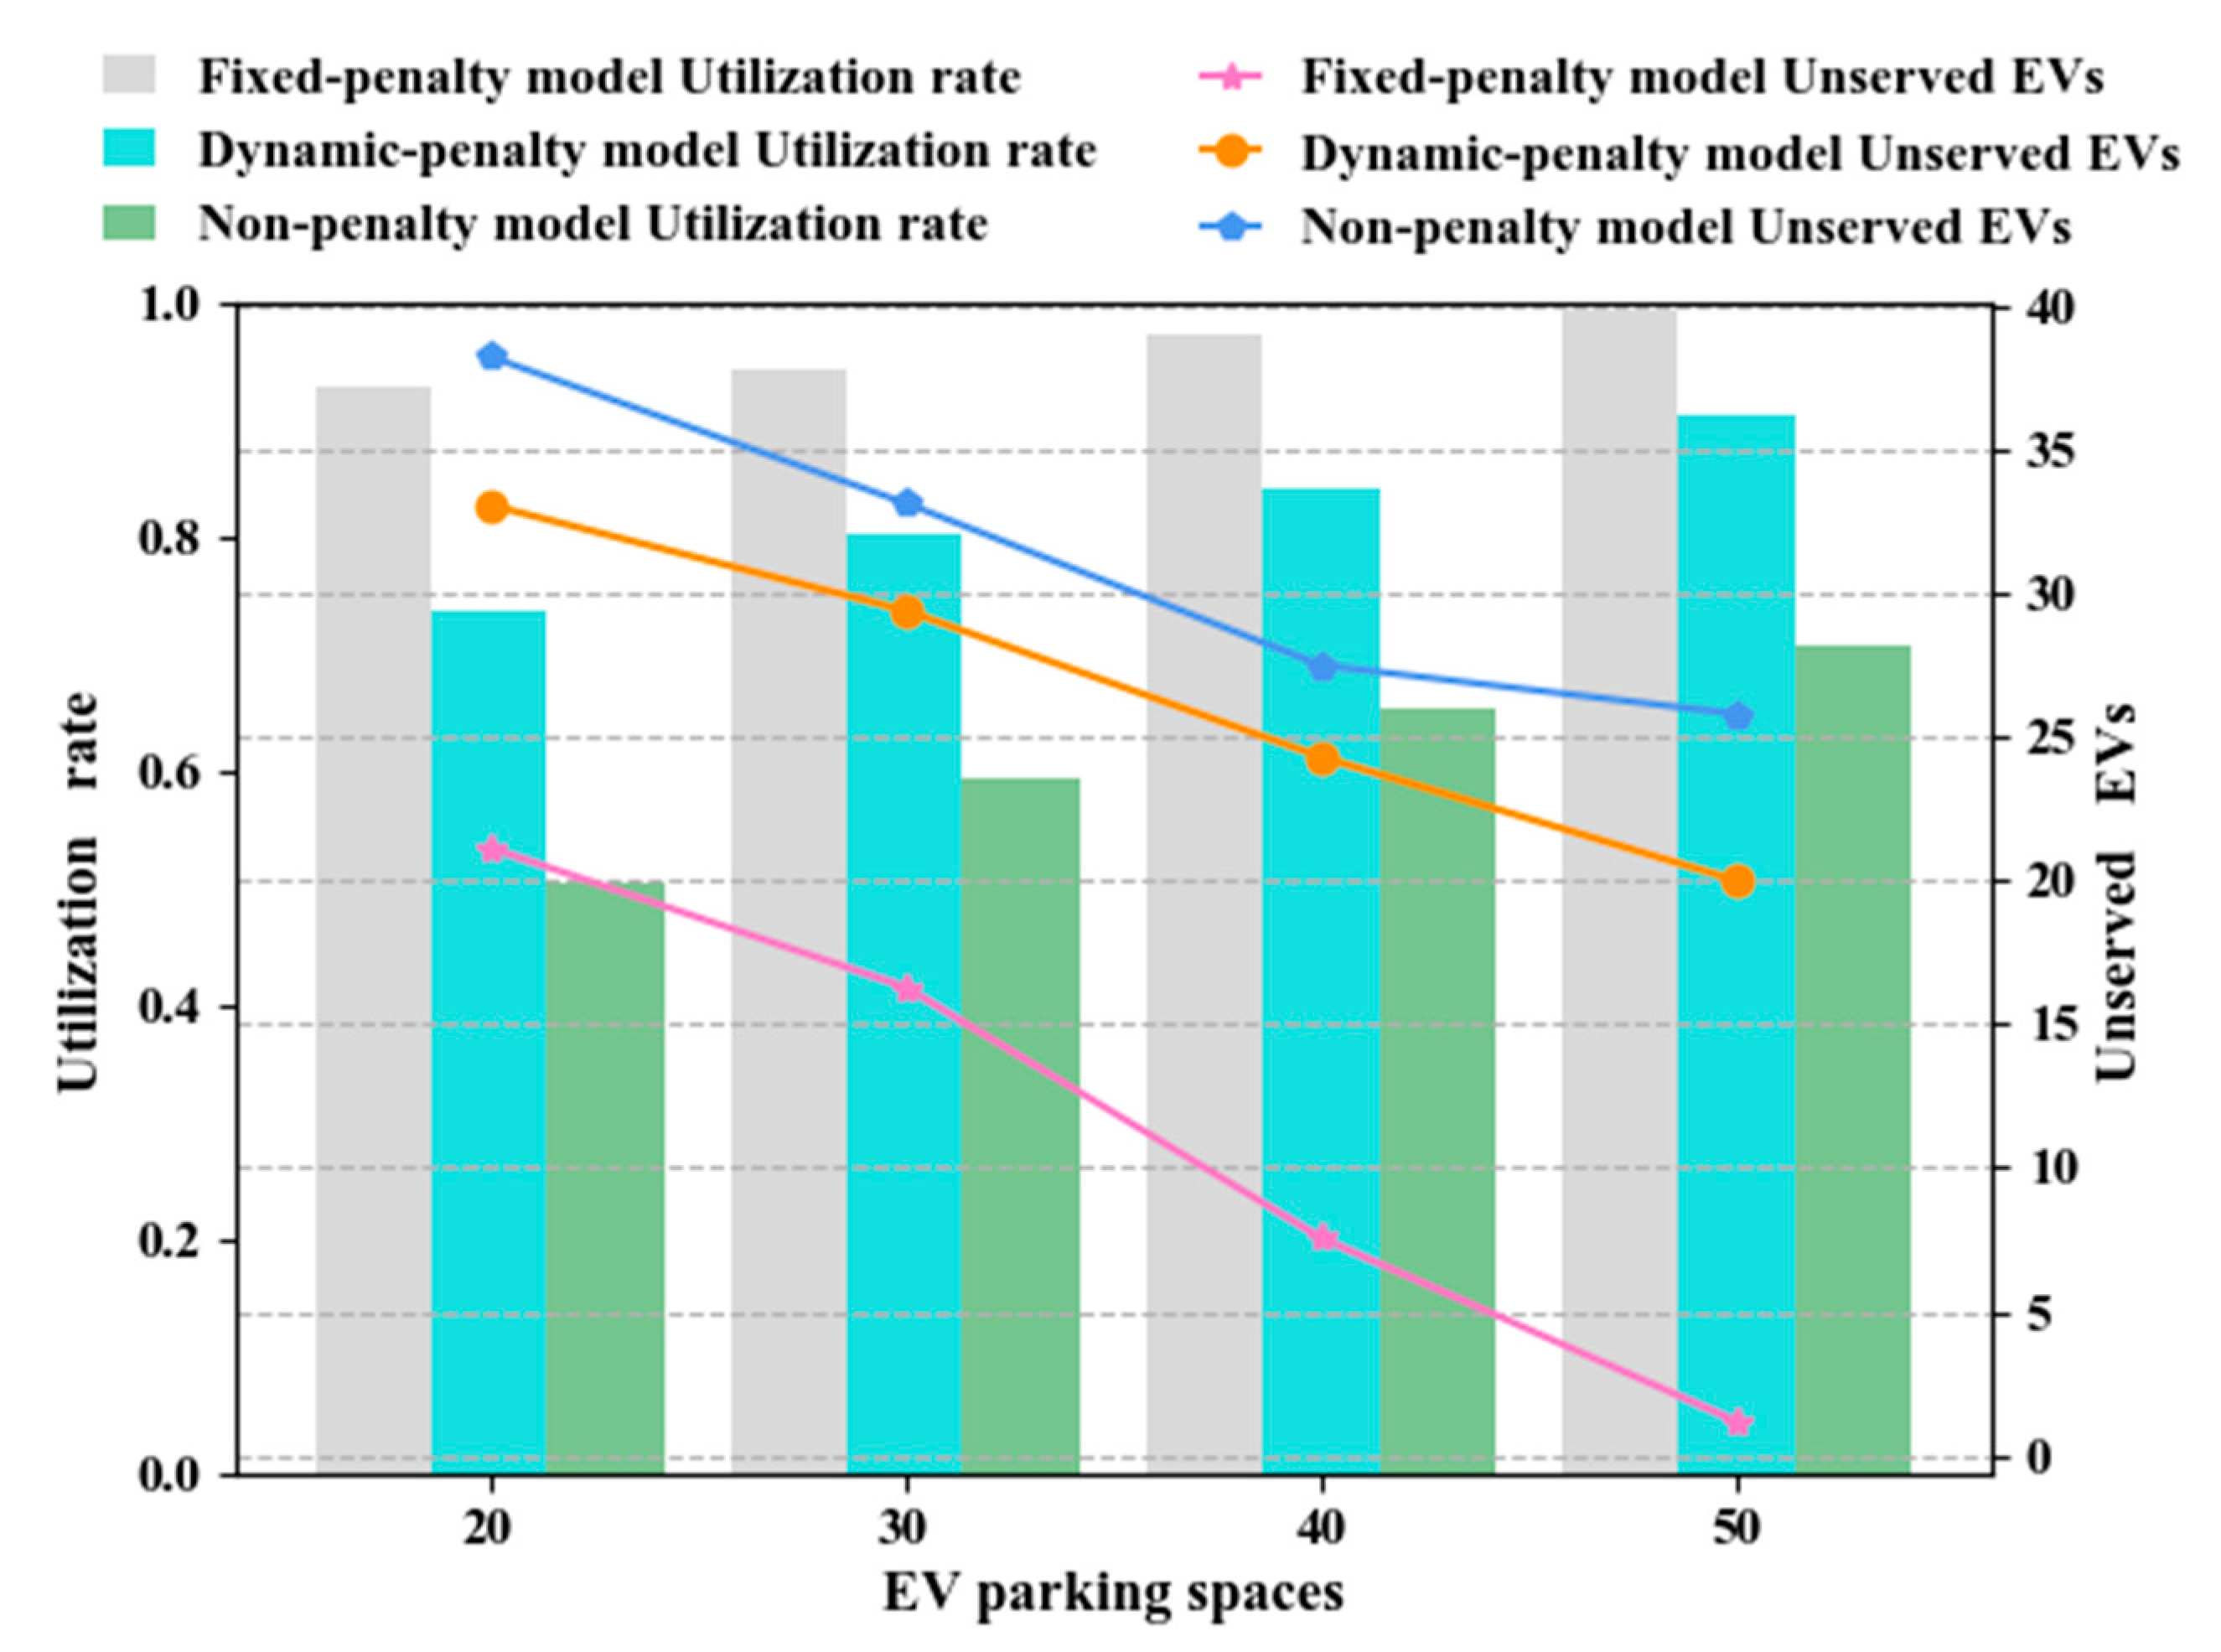
4.3. Result Analysis and Discussion
5. Conclusions
Author Contributions
Funding
Conflicts of Interest
Nomenclature
| A. Nouns and numbers | |
| EV | electric vehicle |
| PSO | particle swarm optimization |
| EVs | electric vehicles |
| AFVs | alternative fuel vehicles |
| V2G | vehicle-to-grid |
| V2B | vehicle-to-building |
| ISO | International Standards Organization |
| PSO | particle swarm optimization |
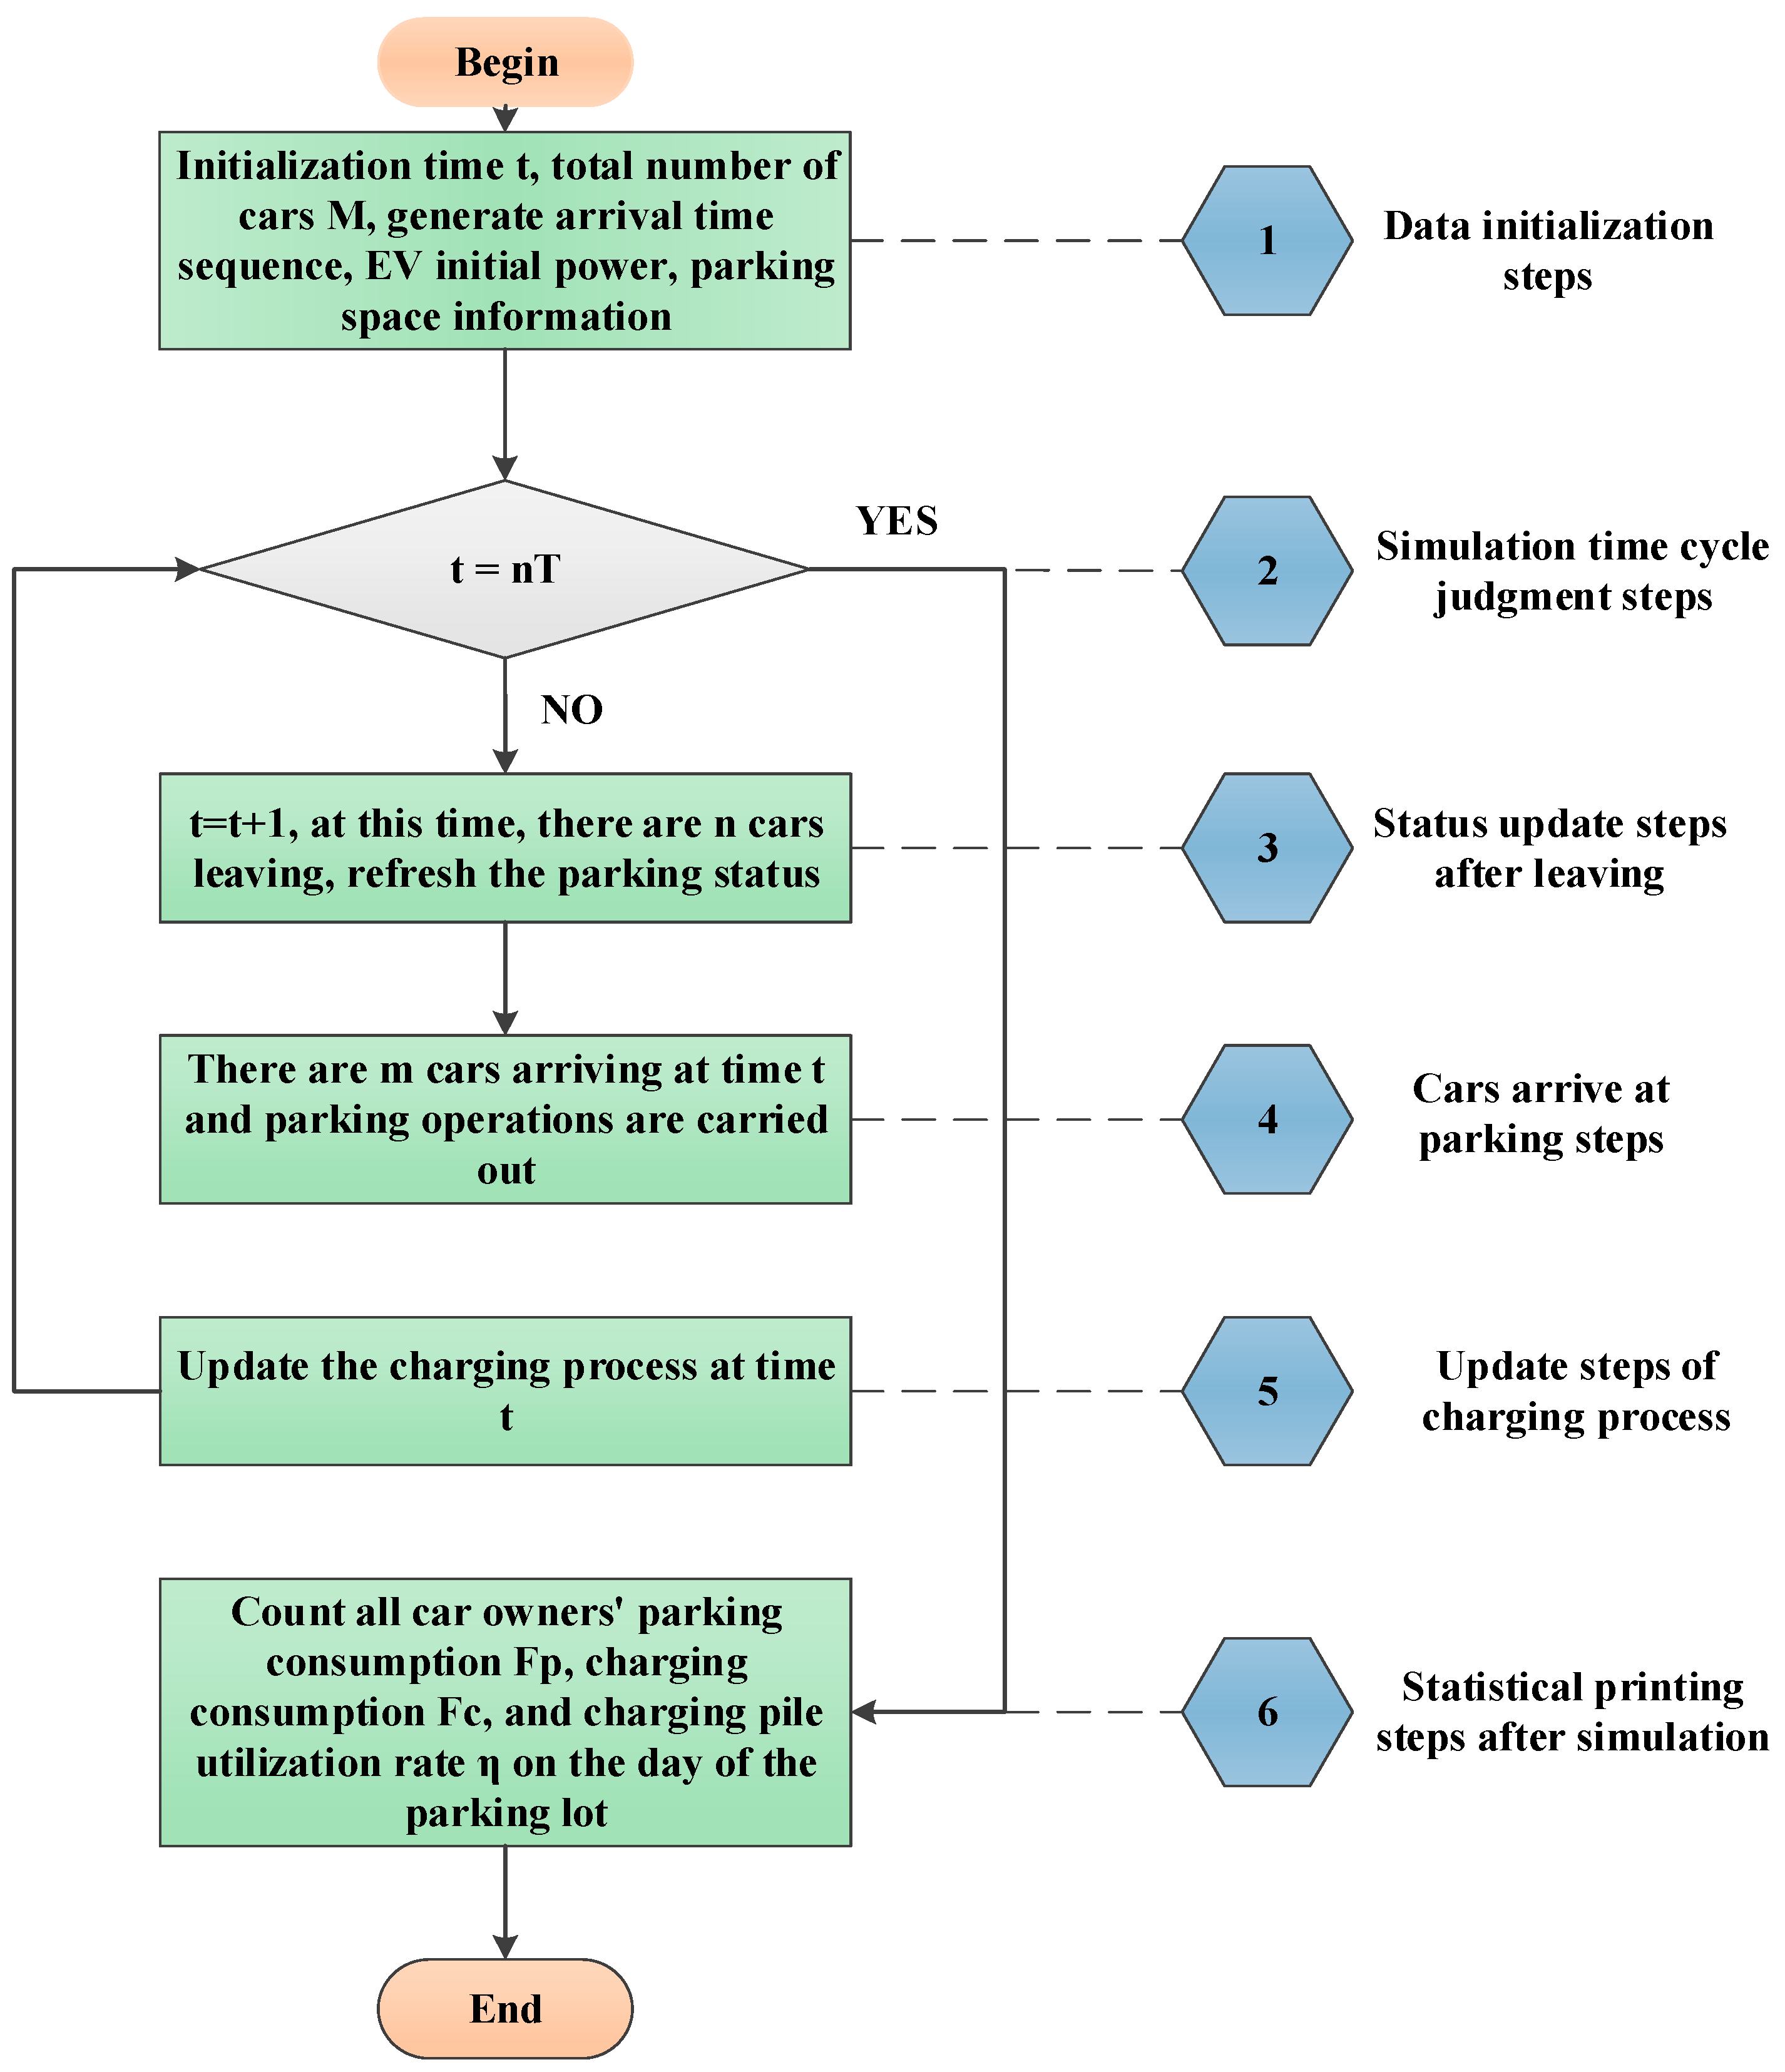
| N | the number of simulations |
| NT | the total simulation time |
| n | the number of EVs leaving at |
| B. Function parts | |
| there are k cars arriving in the parking lot per hour | |
| The average number of vehicles arriving in the parking lot | |
| the first small peak | |
| the second small peak | |
| the distribution of traffic flow in shopping malls in one day | |
| the probability of parking an ordinary car in a charging space | |
| the cost of an ordinary car parked in an ordinary parking space | |
| the cost of ordinary cars parked in a charging space | |
| the cost of total parking fee under different parking models | |
| parking fees per unit of time in this model | |
| the arrival time of the car | |
| the leave time of the car | |
| the probability of moving out | |
| the cost of moving a car from the charging space to other appropriate parking space | |
| the cost of penalty | |
| the cost without penalty | |
| current moment | |
| the parking fee that users should pay when they accept penalty | |
| the probability that the user enters the charging parking piles to park based on the parking time | |
| the illegal parking time | |
| the parking fee of non-penalty model | |
| the parking fee of fixed-penalty model | |
| the fixed-penalty factor | |
| the linear dynamic-penalty model | |
| the linear dynamic-penalty factor | |
| the non-linear dynamic-penalty model | |
| , | the non-linear dynamic-penalty factors. |
| the objective function | |
| the utilization of charging parking spaces | |
| the total number of EVs that have been charged | |
| the total number of EVs that needed charging | |
| s.t | constraints to be satisfied |
| the property of the i-th car | |
| the status of the i-th normal parking space | |
| the status of the i-th charging parking space | |
| the charging state of the charging parking space | |
| the power of the i-th EV | |
| , | Learning factor |
| the inertia weight factor | |
| Kmax | Maximum number of iterations |
| Population size | |
| , | random numbers in [0, 1] |
References
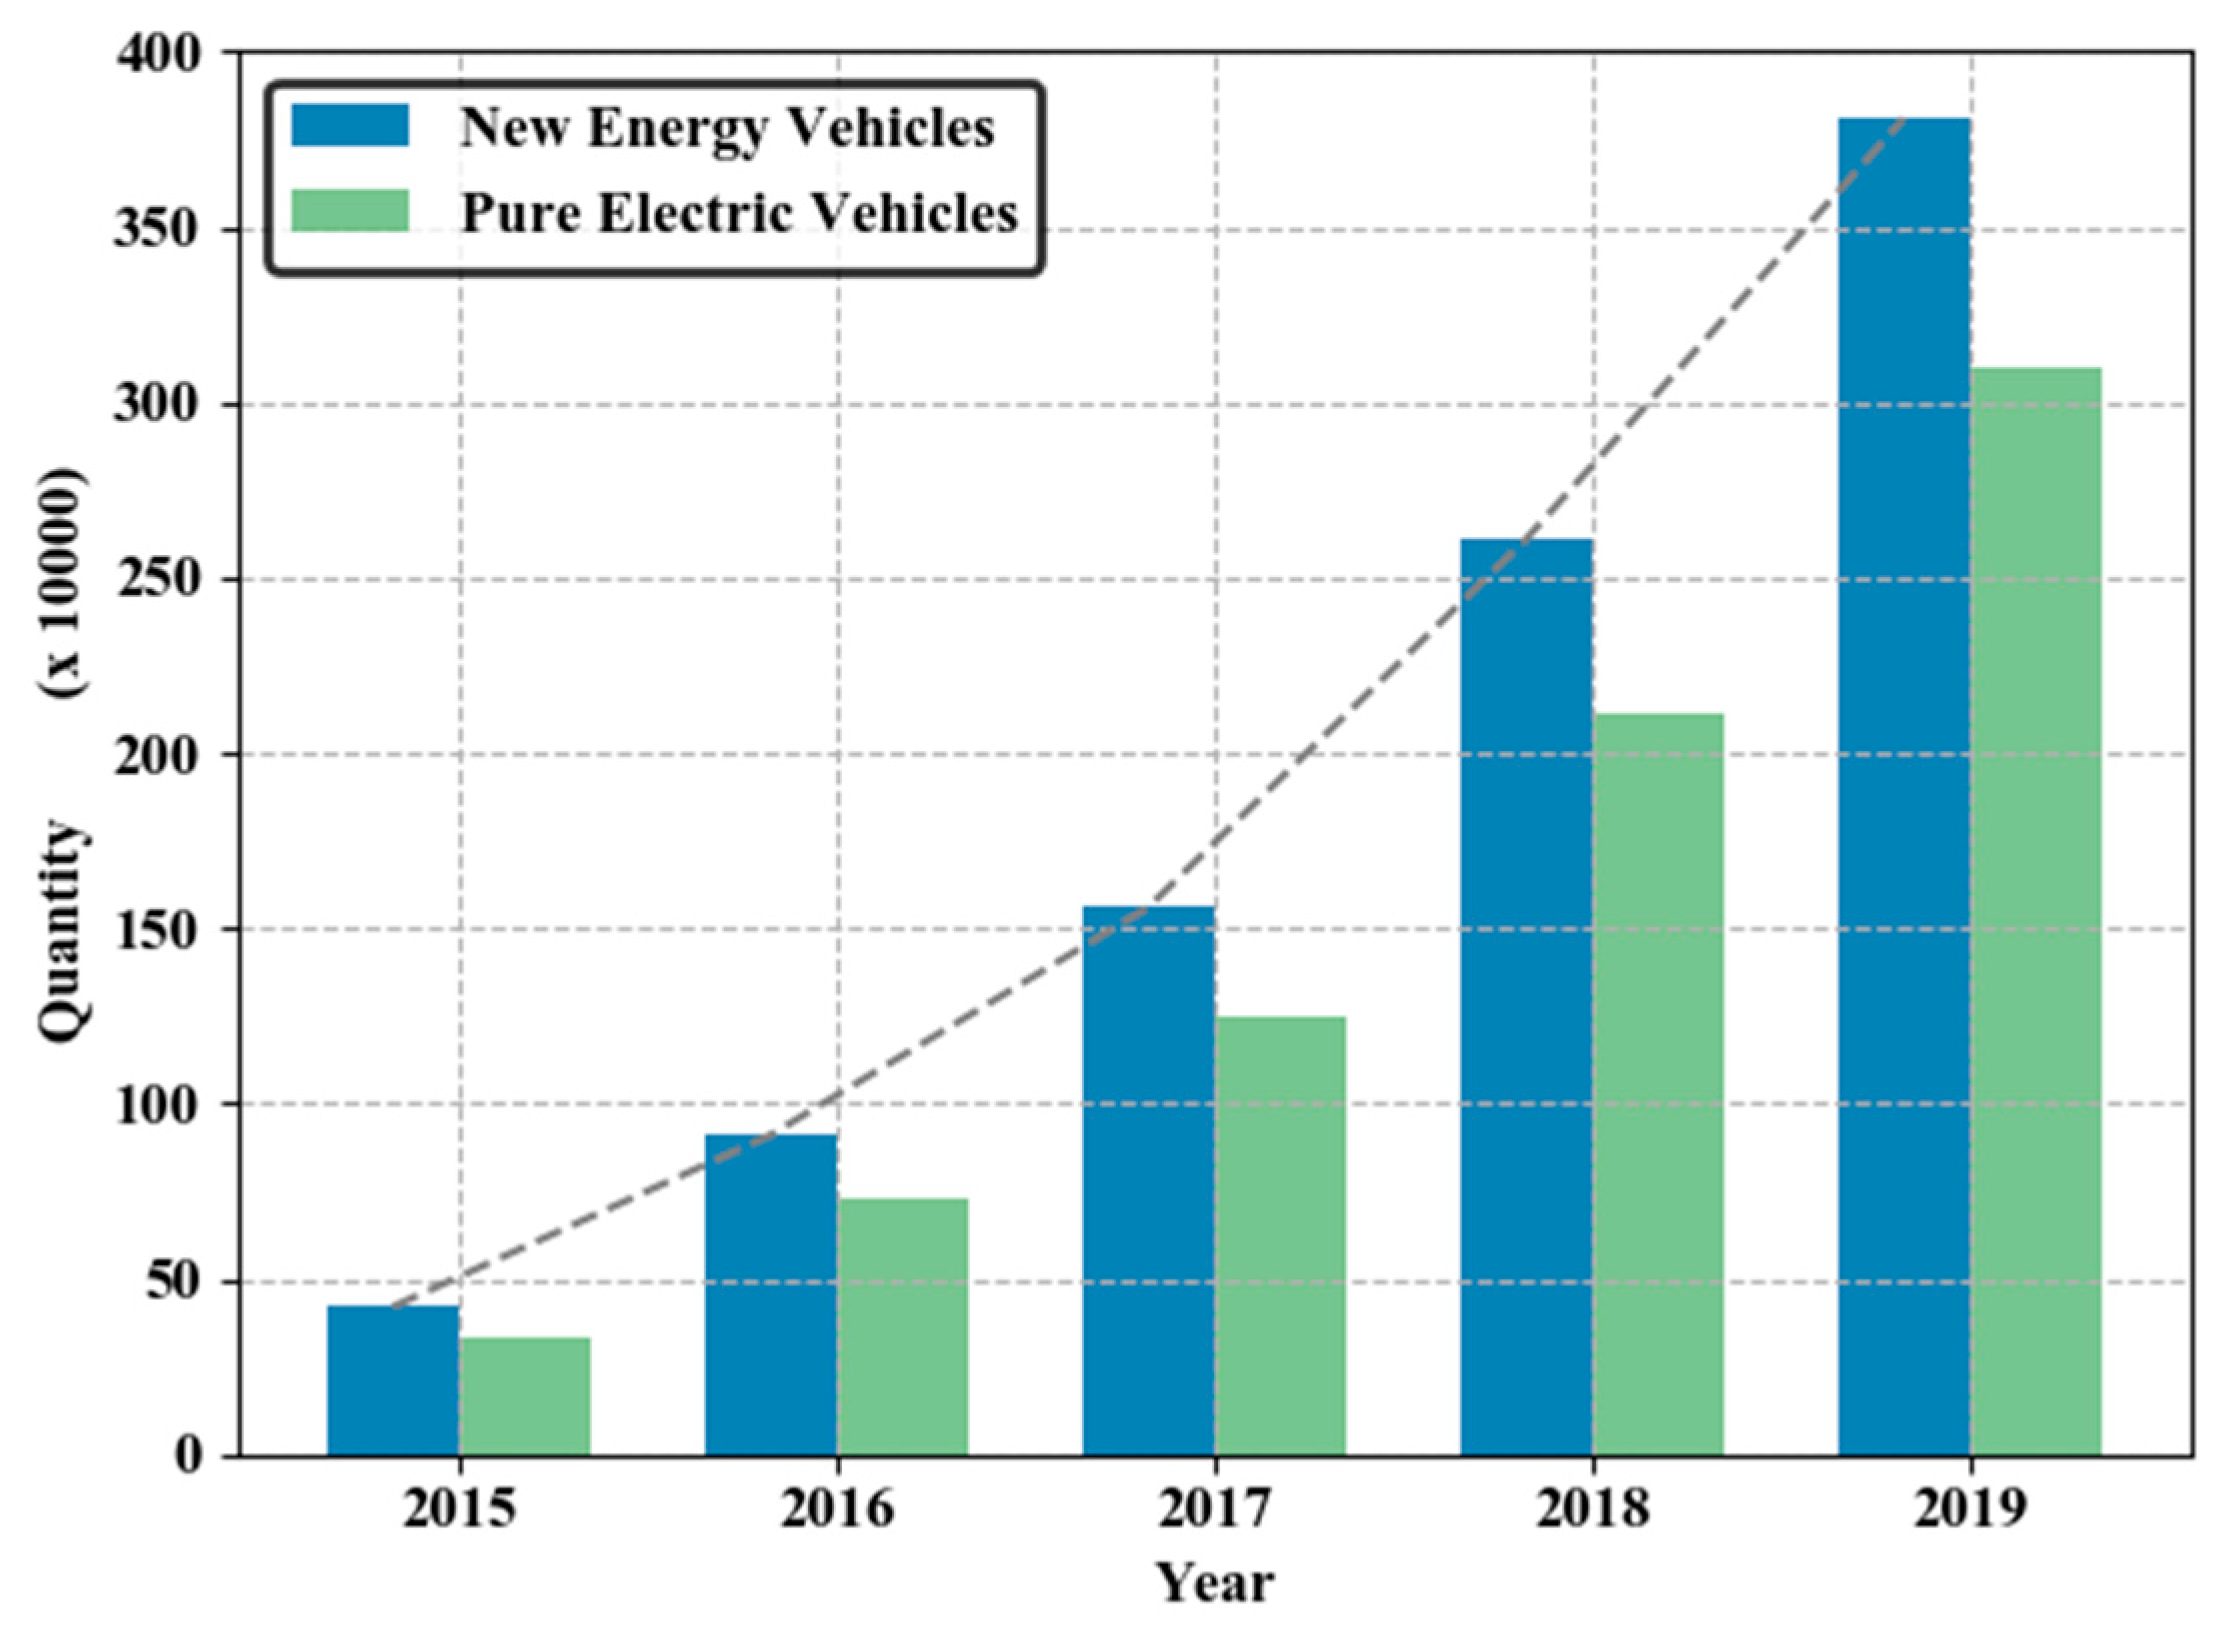
- The Number of Private Cars Nationwide Exceeded 200 Million for the First Time, and New Energy Vehicles Reached 3.81 Million. Available online: http://www.ce.cn/xwzx/gnsz/gdxw/202001/07/t20200107_34064649.shtml (accessed on 25 August 2020).
- Chu, W.; Im, M.; Song, M.R.; Park, J. Psychological and behavioral factors affecting electric vehicle adoption and satisfaction: A comparative study of early adopters in China and Korea. Transp. Res. Part D Transp. Environ. 2019, 76, 1–18. [Google Scholar] [CrossRef]
- Yang, W.; Yan, Z.; Xinyang, H.; Yangjia, L.; Jun, Y.; Yingqing, R. Prediction of electric vehicle market based on market segmentation and regional gradient development. In Proceedings of the IEEE Conference on Energy Internet and Energy System Integration (EI2), Beijing, China, 26–28 November 2017. [Google Scholar]
- National Development and Reform Commission. Electric Vehicle Charging Infrastructure Development Guidelines (2015–2020). Available online: http://www.gov.cn/zhengce/2015-10/09/content_5076250.htm (accessed on 25 August 2020).
- The General Office of the Beijing Municipal People’s Government. Implementation Opinions on Further Strengthening the Construction and Management of Electric Vehicle Charging Infrastructure. Available online: http://www.beijing.gov.cn/zhengce/zhengcefagui/201905/t20190522_60384.html (accessed on 25 August 2020).
- Liu, D.; Wang, Y.; Shen, Y. Electric Vehicle Charging and Discharging Coordination on Distribution Network Using Multi-Objective Particle Swarm Optimization and Fuzzy Decision Making. Energies 2016, 9, 186. [Google Scholar] [CrossRef]
- King, C.; Datta, B. EV charging tariffs that work for EV owners, utilities and society. Electr. J. 2018, 31, 24–27. [Google Scholar] [CrossRef]
- Honma, Y.; Kuby, M. Node-based vs. path-based location models for urban hydrogen refueling stations: Comparing convenience and coverage abilities. Int. J. Hydrog. Energy 2019, 44, 15246–15261. [Google Scholar] [CrossRef]
- An, K.; Song, K.-B.; Hur, K. Incorporating Charging/Discharging Strategy of Electric Vehicles into Security-Constrained Optimal Power Flow to Support High Renewable Penetration. Energies 2017, 10, 729. [Google Scholar] [CrossRef]
- Xu, P.; Li, J.; Sun, X.; Zheng, W.; Liu, H. Dynamic Pricing at Electric Vehicle Charging Stations for Queueing Delay Reduction. In Proceedings of the 37th IEEE International Conference on Distributed Computing Systems (ICDCS), Atlanta, GA, USA, 5–8 June 2017. [Google Scholar]
- Wen, Y.; Mackenzie, D.; Keith, D.R. Modeling the charging choices of battery electric vehicle drivers by using stated preference data. Transp. Res. Rec. J. Transp. Res. Board 2016, 2572, 47–55. [Google Scholar] [CrossRef]
- Helmus, J.; Van Den Hoed, R. Unraveling User Type Characteristics: Towards a Taxonomy for Charging Infrastructure. World Electr. Vehicle J. 2015, 7, 589–604. [Google Scholar] [CrossRef] [Green Version]
- Franke, T.; Krems, J.F. Understanding charging behaviour of electric vehicle users. Transp. Res. Part F Traffic Psychol. Behav. 2013, 21, 75–89. [Google Scholar] [CrossRef]
- Tanguy, K.; Dubois, M.R.; Lopez, K.L.; Gagné, C. Optimization model and economic assessment of collaborative charging using Vehicle-to-Building. Sustain. Cities Soc. 2016, 26, 496–506. [Google Scholar] [CrossRef]
- Zheng, Y.; Niu, S.; Shang, Y.; Shao, Z.; Jian, L. Integrating plug-in electric vehicles into power grids: A comprehensive review on power interaction mode, scheduling methodology and mathematical foundation. Renew. Sust. Energy Rev. 2019, 112, 424–439. [Google Scholar] [CrossRef]
- Pearre, N.S.; Ribberink, H. Review of research on V2X technologies, strategies, and operations. Renew. Sust. Energy Rev. 2019, 105, 61–70. [Google Scholar] [CrossRef]
- Li, Y.; Li, K.; Xie, Y.; Liu, J.; Fu, C.; Liu, B. Optimized charging of lithium-ion battery for electric vehicles: Adaptive multistage constant current–constant voltage charging strategy. Renew. Energy 2020, 146, 2688–2699. [Google Scholar] [CrossRef]
- Zhang, W.; Gandhi, O.; Quan, H.; Rodríguez-Gallegos, C.D.; Srinivasan, D. A multi-agent based integrated volt-var optimization engine for fast vehicle-to-grid reactive power dispatch and electric vehicle coordination. Appl. Energy 2018, 229, 96–110. [Google Scholar] [CrossRef]
- Modarresi Ghazvini, A.; Olamaei, J. Optimal sizing of autonomous hybrid PV system with considerations for V2G parking lot as controllable load based on a heuristic optimization algorithm. Sol. Energy 2019, 184, 30–39. [Google Scholar] [CrossRef]
- Liu, K.; Wang, J.; Yamamoto, T.; Morikawa, T. Exploring the interactive effects of ambient temperature and vehicle auxiliary loads on electric vehicle energy consumption. Appl. Energy 2018, 227, 324–331. [Google Scholar] [CrossRef]
- Barone, G.; Buonomano, A.; Forzano, C.; Giuzio, G.F.; Palombo, A. Increasing self-consumption of renewable energy through the Building to Vehicle to Building approach applied to multiple users connected in a virtual micro-grid. Renew. Energy 2020, 159, 1165–1176. [Google Scholar] [CrossRef]
- Doroudchi, E.; Alanne, K.; Okur, Ö.; Kyyrä, J.; Lehtonen, M. Approaching net zero energy housing through integrated EV. Sust. Cities Soc. 2018, 38, 534–542. [Google Scholar] [CrossRef] [Green Version]
- Thomas, D.; Deblecker, O.; Ioakimidis, C.S. Optimal operation of an energy management system for a grid-connected smart building considering photovoltaics’ uncertainty and stochastic electric vehicles’ driving schedule. Appl. Energy 2018, 210, 1188–1206. [Google Scholar] [CrossRef]
- Quddus, M.A.; Shahvari, O.; Marufuzzaman, M.; Usher, J.M.; Jaradat, R. A collaborative energy sharing optimization model among electric vehicle charging stations, commercial buildings, and power grid. Appl. Energy 2018, 229, 841–857. [Google Scholar] [CrossRef]
- Buonomano, A.; Calise, F.; Cappiello, F.L.; Palombo, A.; Vicidomini, M. Dynamic analysis of the integration of electric vehicles in efficient buildings fed by renewables. Appl. Energy 2019, 245, 31–50. [Google Scholar] [CrossRef]
- Schurmann, D.; Timpner, J.; Wolf, L. Cooperative Charging in Residential Areas. IEEE Trans. Intellig. Transp. Syst. 2017, 18, 834–846. [Google Scholar] [CrossRef]
- Dong, X.; Mu, Y.; Xu, X.; Jia, H.; Wu, J.; Yu, X.; Qi, Y. A charging pricing strategy of electric vehicle fast charging stations for the voltage control of electricity distribution networks. Appl. Energy 2018, 225, 857–868. [Google Scholar] [CrossRef]
- Chang, F.; Huang, M.; Zhang, W.; Bao, Y.; Sun, B. A coordinated charging strategy for PV-Assisted charging station of electric vehicles based on charging service price. In Proceedings of the IEEE Asia-Pacific Transportation Electrification Conference and Exposition (ITEC Asia-Pacific), Harbin, China, 2–5 August 2017. [Google Scholar]
- Xu, Z.; Su, W.; Hu, Z.; Song, Y.; Zhang, H. A Hierarchical Framework for Coordinated Charging of Plug-In Electric Vehicles in China. IEEE Trans. Smart Grid 2016, 7, 428–438. [Google Scholar] [CrossRef]
- Qi, W.; Xu, Z.; Shen, Z.-J.M.; Hu, Z.; Song, Y. Hierarchical Coordinated Control of Plug-in Electric Vehicles Charging in Multifamily Dwellings. IEEE Trans. Smart Grid 2014, 5, 1465–1474. [Google Scholar] [CrossRef]
- US. Department of Transportation Federal Administration. Available online: http://nhts.ornl.gov/download.shtml (accessed on 2 November 2020).
- Coello Coello, C.A.; Reyes-Sierra, M. Multi-Objective Particle Swarm Optimizers: A Survey of the State-of-the-Art. Int. J. Computat. Intel. Res. 2006, 2, 287–308. [Google Scholar] [CrossRef]
- Billings, R.B.; Agthe, D.E. Price Elasticities for Water: A Case of Increasing Block Rates: Reply. Land Econ. 1981, 57, 276. [Google Scholar] [CrossRef]
- Collin, A.J.; Xu, X.; Djokic, S.Z.; Moller, F.; Meyer, J.; Kutt, L.; Lehtonen, M. Survey of harmonic emission of electrical vehicle chargers in the European market. In Proceedings of the International Symposium on Power Electronics, Electrical Drives, Automation, and Motion (SPEEDAM), Anacapri, Italy, 22–24 June 2016. [Google Scholar]
- Charging Service Fees for Electric Vehicles Everywhere. Available online: https://www.sohu.com/a/57149794_377299 (accessed on 2 November 2020).
- National Development and Reform Commission Promulgated Electricity Price Policy for Electric Vehicles. Available online: http://www.gov.cn/xinwen/2014-07/30/content_2726804.htm (accessed on 2 November 2020).
- Zhang, L.; Yang, M.; Zhao, Z. Game analysis of charging service fee based on benefit of multi-party participants: A case study analysis in China. Sustain. Cities Soc. 2019, 48, 101528. [Google Scholar] [CrossRef]
- Yang, J.; He, L.; Fu, S. An improved PSO-based charging strategy of electric vehicles in electrical distribution grid. Appl. Energy 2014, 128, 82–92. [Google Scholar] [CrossRef]
- Clerc, M. The swarm and the queen: Towards a deterministic and adaptive particle swarm optimization. In Proceedings of the 1999 Congress on Evolutionary Computation-CEC99 (Cat. No. 99TH8406), Washington, DC, USA, 6–9 July 1999. [Google Scholar]


| Model Parameters | Value |
|---|---|
| Number of ordinary parking spaces | 180 |
| Number of charging parking spaces | 20 |
| Charging pile rated power | 30 kW |
| Electric vehicle battery capacity | 60 kW |
| Workday traffic | 1000 |
| Workday traffic distribution | |
| Weekend traffic | 1200 |
| Weekend traffic distribution | |
| Parking time distribution |
| Regions | Regionl Policies |
|---|---|
| Beijing Shanghai | Operators set charging service fee on their own since April 2018 No more than 1.6 yuan/kWh. On a trial basis for one year |
| Tianjin | Electric bus charge service fee: 06 yuan/kWh. Other electric vehicle charge service fee: 1.0 yuan/kWh |
| Jinan Wuhan | charging service fee: 0.60 yuan/kWh charging service fee: 0.95 yuan/kWh |
| Hefei | Direct current (DC) fast charge pile service fee 0.90 yuan/kWh. The alternating current (AC) charge pile service fee is 30% up and down in the quasi-price base of DC fast charge pile, about 0.63 yuan/kWh |
| Period | Price | Schedule |
|---|---|---|
| Peak time | 1.044 Yuan/kWh | 10:00–15:00 |
| 18:00–21:00 | ||
| Normal time | 0.6950 Yuan/kWh | 7:00–10:00 |
| 15:00–18:00 | ||
| 21:00–23:00 | ||
| Valley time | 0.3946 Yuan/kWh | 23:00–7:00 |
| Parameter | Symbol | Value |
|---|---|---|
| Learning factor | 1.49 | |
| Learning factor | 1.49 | |
| Population size | 50 | |
| Maximum number of iterations | Kmax | 100 |
| Inertia weight | 0.5 |
| Penalty Strategy Model | Parameter |
|---|---|
| Fixed-penalty model | Qs = 49 |
| Linear dynamic-penalty model | Qdl = 42 |
| Non-linear dynamic-penalty model | Qdn1 = 43, Qdn2 = 47 |
| Orderly Parking Charging Strategy | Parking Fee (Yuan) | Charging Fee (Yuan) | Utilization Rate (%) | Unserved EVs |
|---|---|---|---|---|
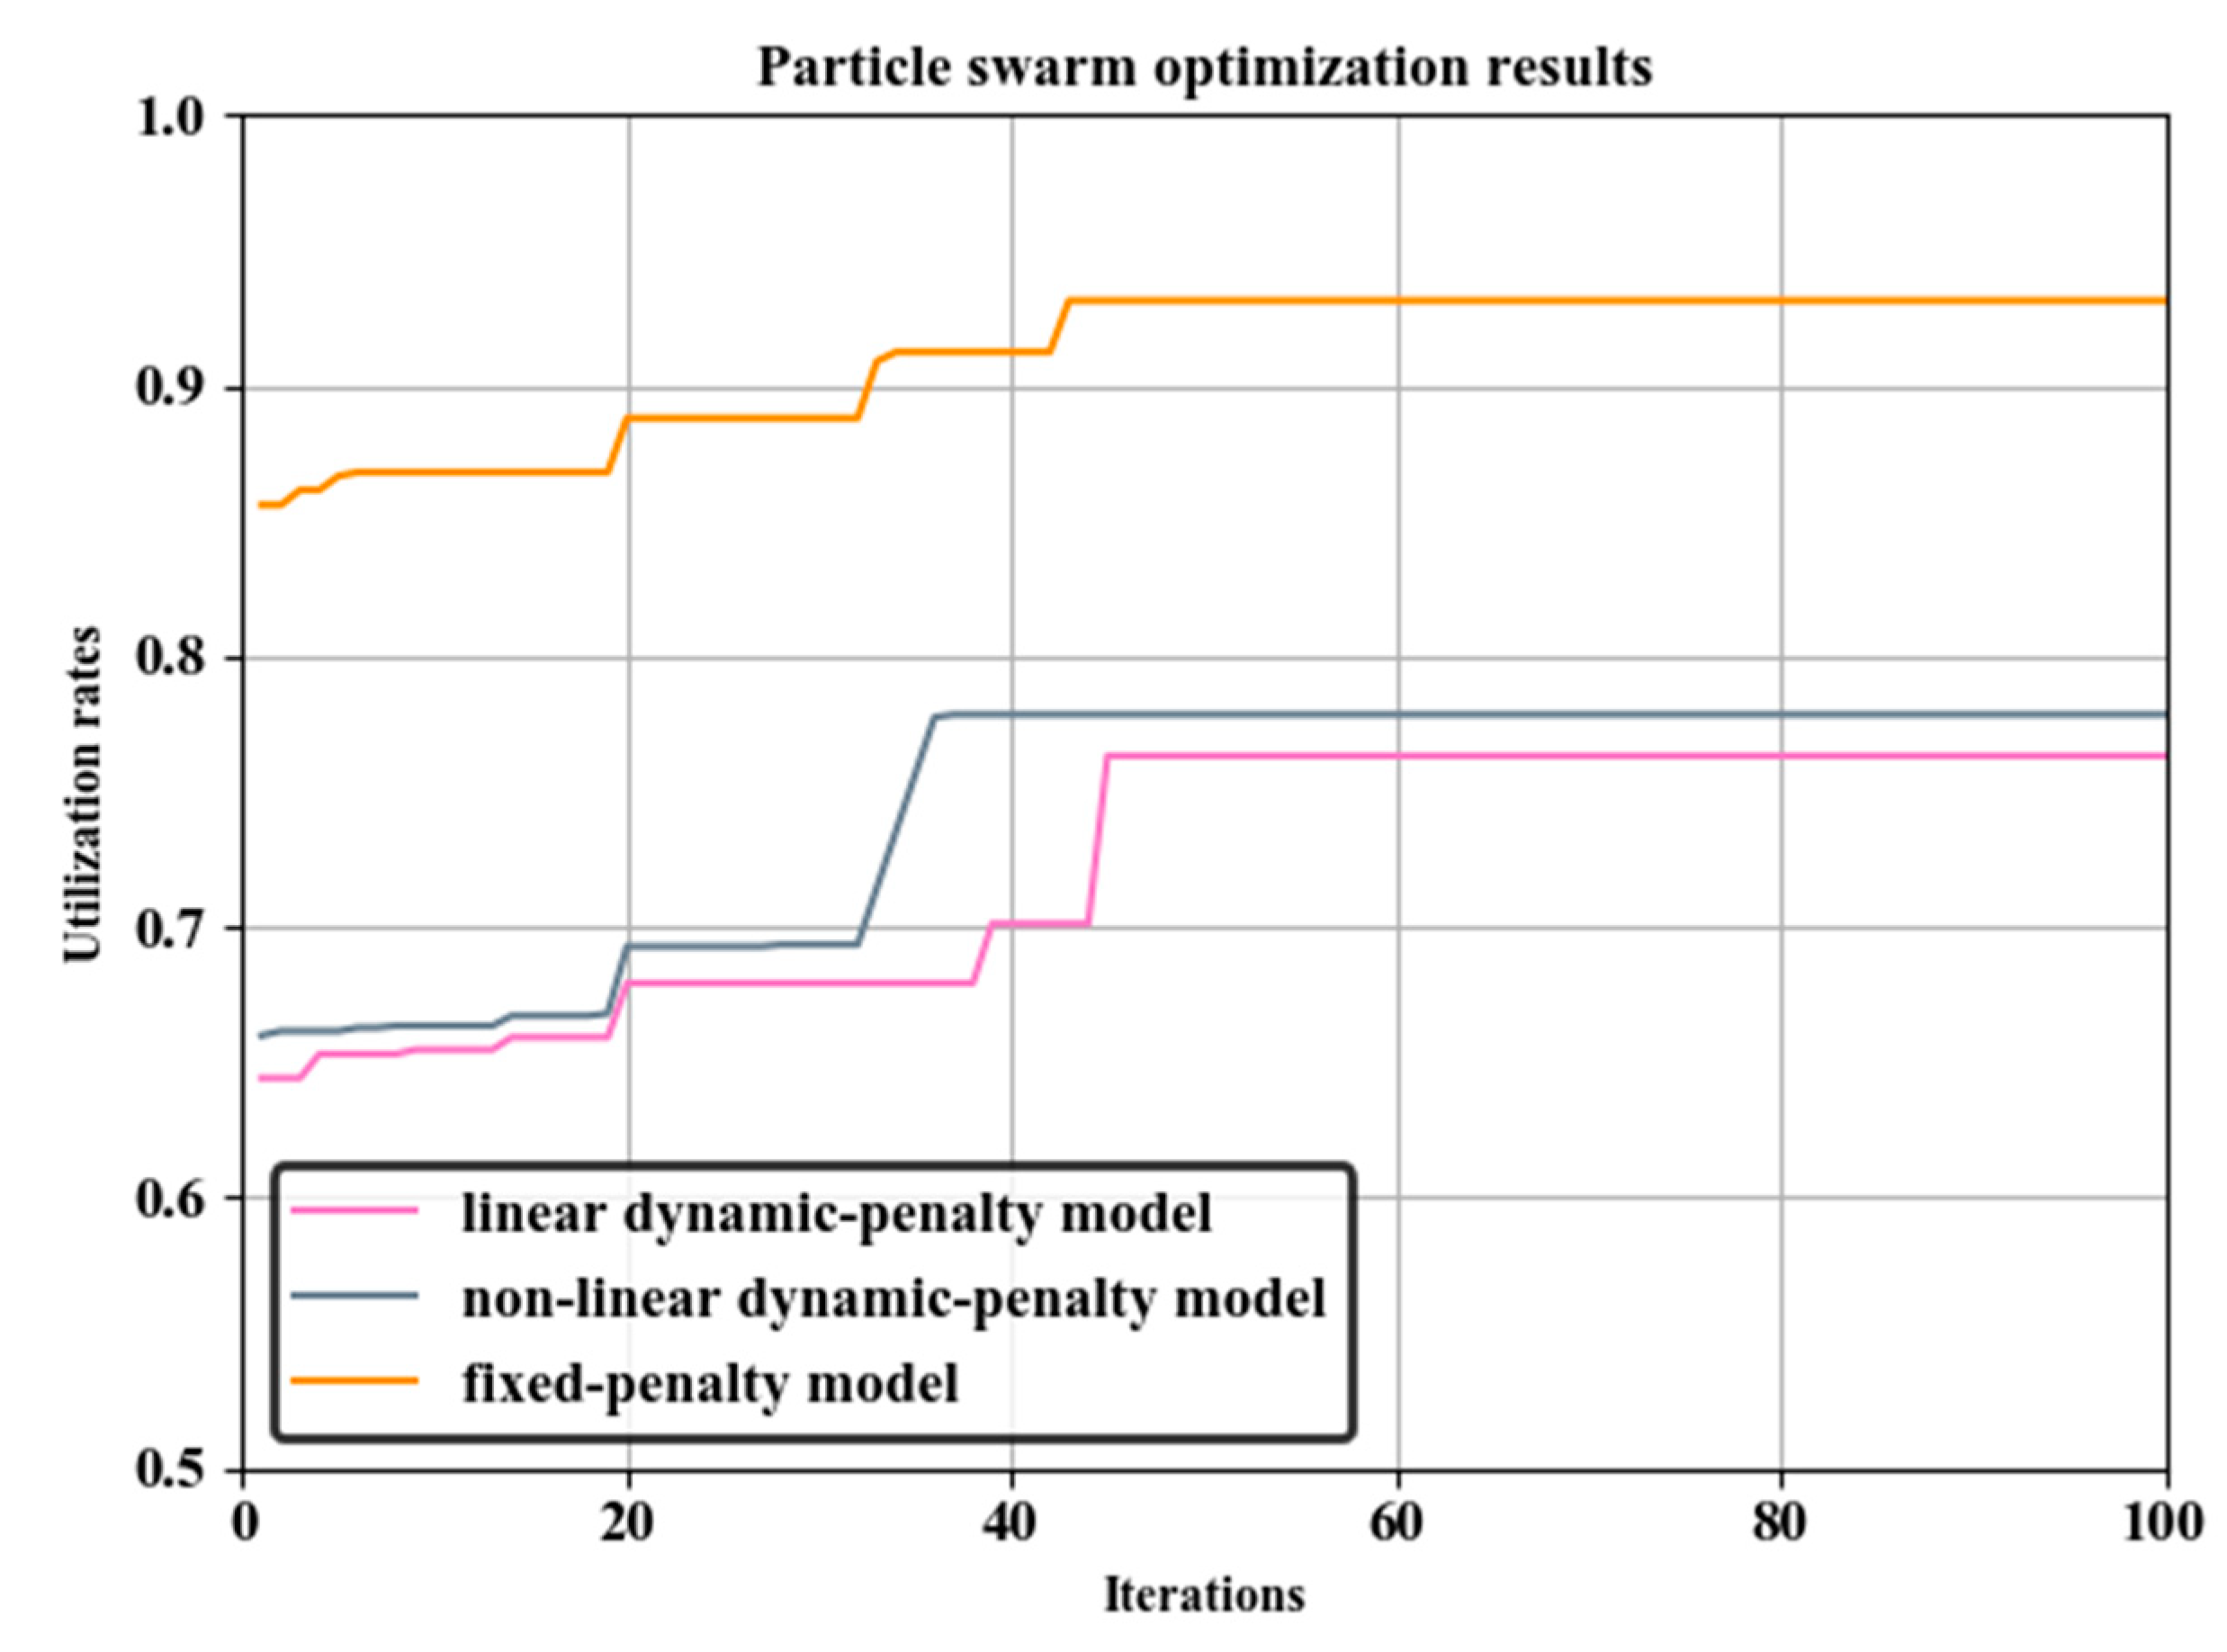
| Non-penalty model | 24546.00 | 3341.82 | 50.677 | 36.13 |
| Fixed-penalty model | 26102.00 | 6146.85 | 92.543 | 22.37 |
| Dynamic-penalty model | 32213.50 | 4467.86 | 73.351 | 33.54 |
Publisher’s Note: MDPI stays neutral with regard to jurisdictional claims in published maps and institutional affiliations. |
© 2020 by the authors. Licensee MDPI, Basel, Switzerland. This article is an open access article distributed under the terms and conditions of the Creative Commons Attribution (CC BY) license (http://creativecommons.org/licenses/by/4.0/).
Share and Cite
Shi, R.; Zhang, J.; Su, H.; Liang, Z.; Lee, K.Y. An Economic Penalty Scheme for Optimal Parking Lot Utilization with EV Charging Requirements. Energies 2020, 13, 6155. https://doi.org/10.3390/en13226155
Shi R, Zhang J, Su H, Liang Z, Lee KY. An Economic Penalty Scheme for Optimal Parking Lot Utilization with EV Charging Requirements. Energies. 2020; 13(22):6155. https://doi.org/10.3390/en13226155
Chicago/Turabian StyleShi, Ruifeng, Jie Zhang, Hao Su, Zihang Liang, and Kwang Y. Lee. 2020. "An Economic Penalty Scheme for Optimal Parking Lot Utilization with EV Charging Requirements" Energies 13, no. 22: 6155. https://doi.org/10.3390/en13226155