1. Introduction
With the advent of the fourth industrial revolution, data are the key for future industrial development and their importance and activation plans have been actively discussed [
1]. Since data have been generated in large quantities due to the expansion of new businesses, such as cloud, big data, artificial intelligence (AI), and the Internet of Things (IoT), the importance of data centers to process the data has been increasing [
2,
3]. Hyper-scale data centers are increasing at a global level. Hyper-scale data centers are significantly larger than the existing legacy data centers and they have organic structures. A hyper-scale data center generally operates approximately 100,000 information technology (IT) servers and has a size of more than 20,000 m
2 with flexible scalability [
4]. The number of hyper-scale data centers worldwide in 2017 increased by 14.2% in comparison with the previous year. The number of hyper-scale data centers increased to 448 in 2018 and it is expected to increase by 10.17% in 2021 in comparison with the data for 2020 [
5]. If data centers move towards the concept of hyper-scale data centers, it is necessary to prepare for the different modes of operation. In other words, changes in non-IT infrastructures for maintaining the operating IT environments of data centers, such as cooling the IT equipment as well as the power distribution and storage (UPS), are inevitable. Among them, changes in cooling systems are expected to be the largest due to the operation of high-density IT equipment [
6,
7].
In the hyper-scale data center environment, cooling system standards that can respond to changes in IT industries are required due to the increase in the density of IT equipment (more than 15 kW/rack). The conversion of cooling methods for high-density data centers is in progress. Cooling for removing heat from high-density IT equipment is a key consideration for data centers. To maintain the proper operating environment of IT equipment, the recommended temperature range specified by the American Society of Heating, Refrigerating, and Air-Conditioning Engineers (ASHRAE) [
8] must be maintained throughout the year, which leads to a significant energy cost.
The increase in the energy cost and energy consumption has prompted data centers to consider hot aisle containment (HAC) and cold aisle containment (CAC) strategies [
9,
10,
11]. Separating hot aisles from cold aisles is one of the most essential energy-saving methods that can be applied to new and existing data centers. The use of containment strategies can improve the energy efficiency and maintain the inlet air temperature to IT equipment at a constant level. It can also solve local overheating (hot spots) that can be observed in the existing non-containment data centers to some degree [
12]. Both methods minimize the mixing of hot and cold air; however, they significantly affect the air-conditioning IT environment conditions, the power usage effectiveness (PUE), and the economizer time due to the difference in the actual implementation and operation. The HAC system can save 40% of the annual cooling energy consumption in comparison with the CAC system, and this led to a case in which the annual PUE was reduced by 13% [
13,
14].
In this study, the IT environment of the HAC system, which recently has been considered an essential solution for high-density data centers, was analyzed to compare two air distribution systems equipped with HAC to observe any differences in the IT cooling environment for the same geometry of server racks in the IT room. To this end, the thermal performance of each system was analyzed in a reference data center. Computational fluid dynamics (CFD) analysis was conducted to compare the operating performance of the cooling systems that are applied to the raised floor and hard floor and to examine the difference in the IT environment between the server rooms. Therefore, the results of this study were analyzed with a focus on the following three points.
First, the sustainability of the IT environment under the application of the HAC was examined. Second, the thermal performance of the raised floor and hard floor were analyzed. Finally, an analysis was conducted on the difference in the thermal performance between a state in which the cooling system was normally operating and another in which one cooling unit was not operating due to failure. The potential contribution of this paper is that it facilitates the realistic implementation of the effectiveness of the existing theoretically simple comparison of the HAC systems. This is achieved by performing accurate numerical modeling of the actual situation in the data center for a high-density IT environment and applying the operating conditions. It is essential to verify the results of this study through field measurements in the future, as it targets a reference data center in operation.
3. Numerical Analysis Results
The thermal performance of each alternative was evaluated by comparing the temperature distribution, airflow distribution, inlet air temperatures of the server racks, and the recirculation ratio from the outlet to the inlet.
3.1. Normal Cooling Conditions (ALT-1 and ALT-2)
Regarding the normal cooling operation, an evaluation was performed for the thermal performance of the HAC with the raised floor (ALT-1) and the hard floor (ALT-2) under the normal condition in which all of the six CRAH units operated. This numerical analysis considered the HAC to be tightly sealed. This assumption allows calculating the maximum efficiency of the CRAH units and ensures a fair comparison. However, cold air leakage always occurs in a HAC, requiring the CRAH fan airflow to be greater than the IT equipment airflow.
3.1.1. Temperature Distribution in an IT Server Room
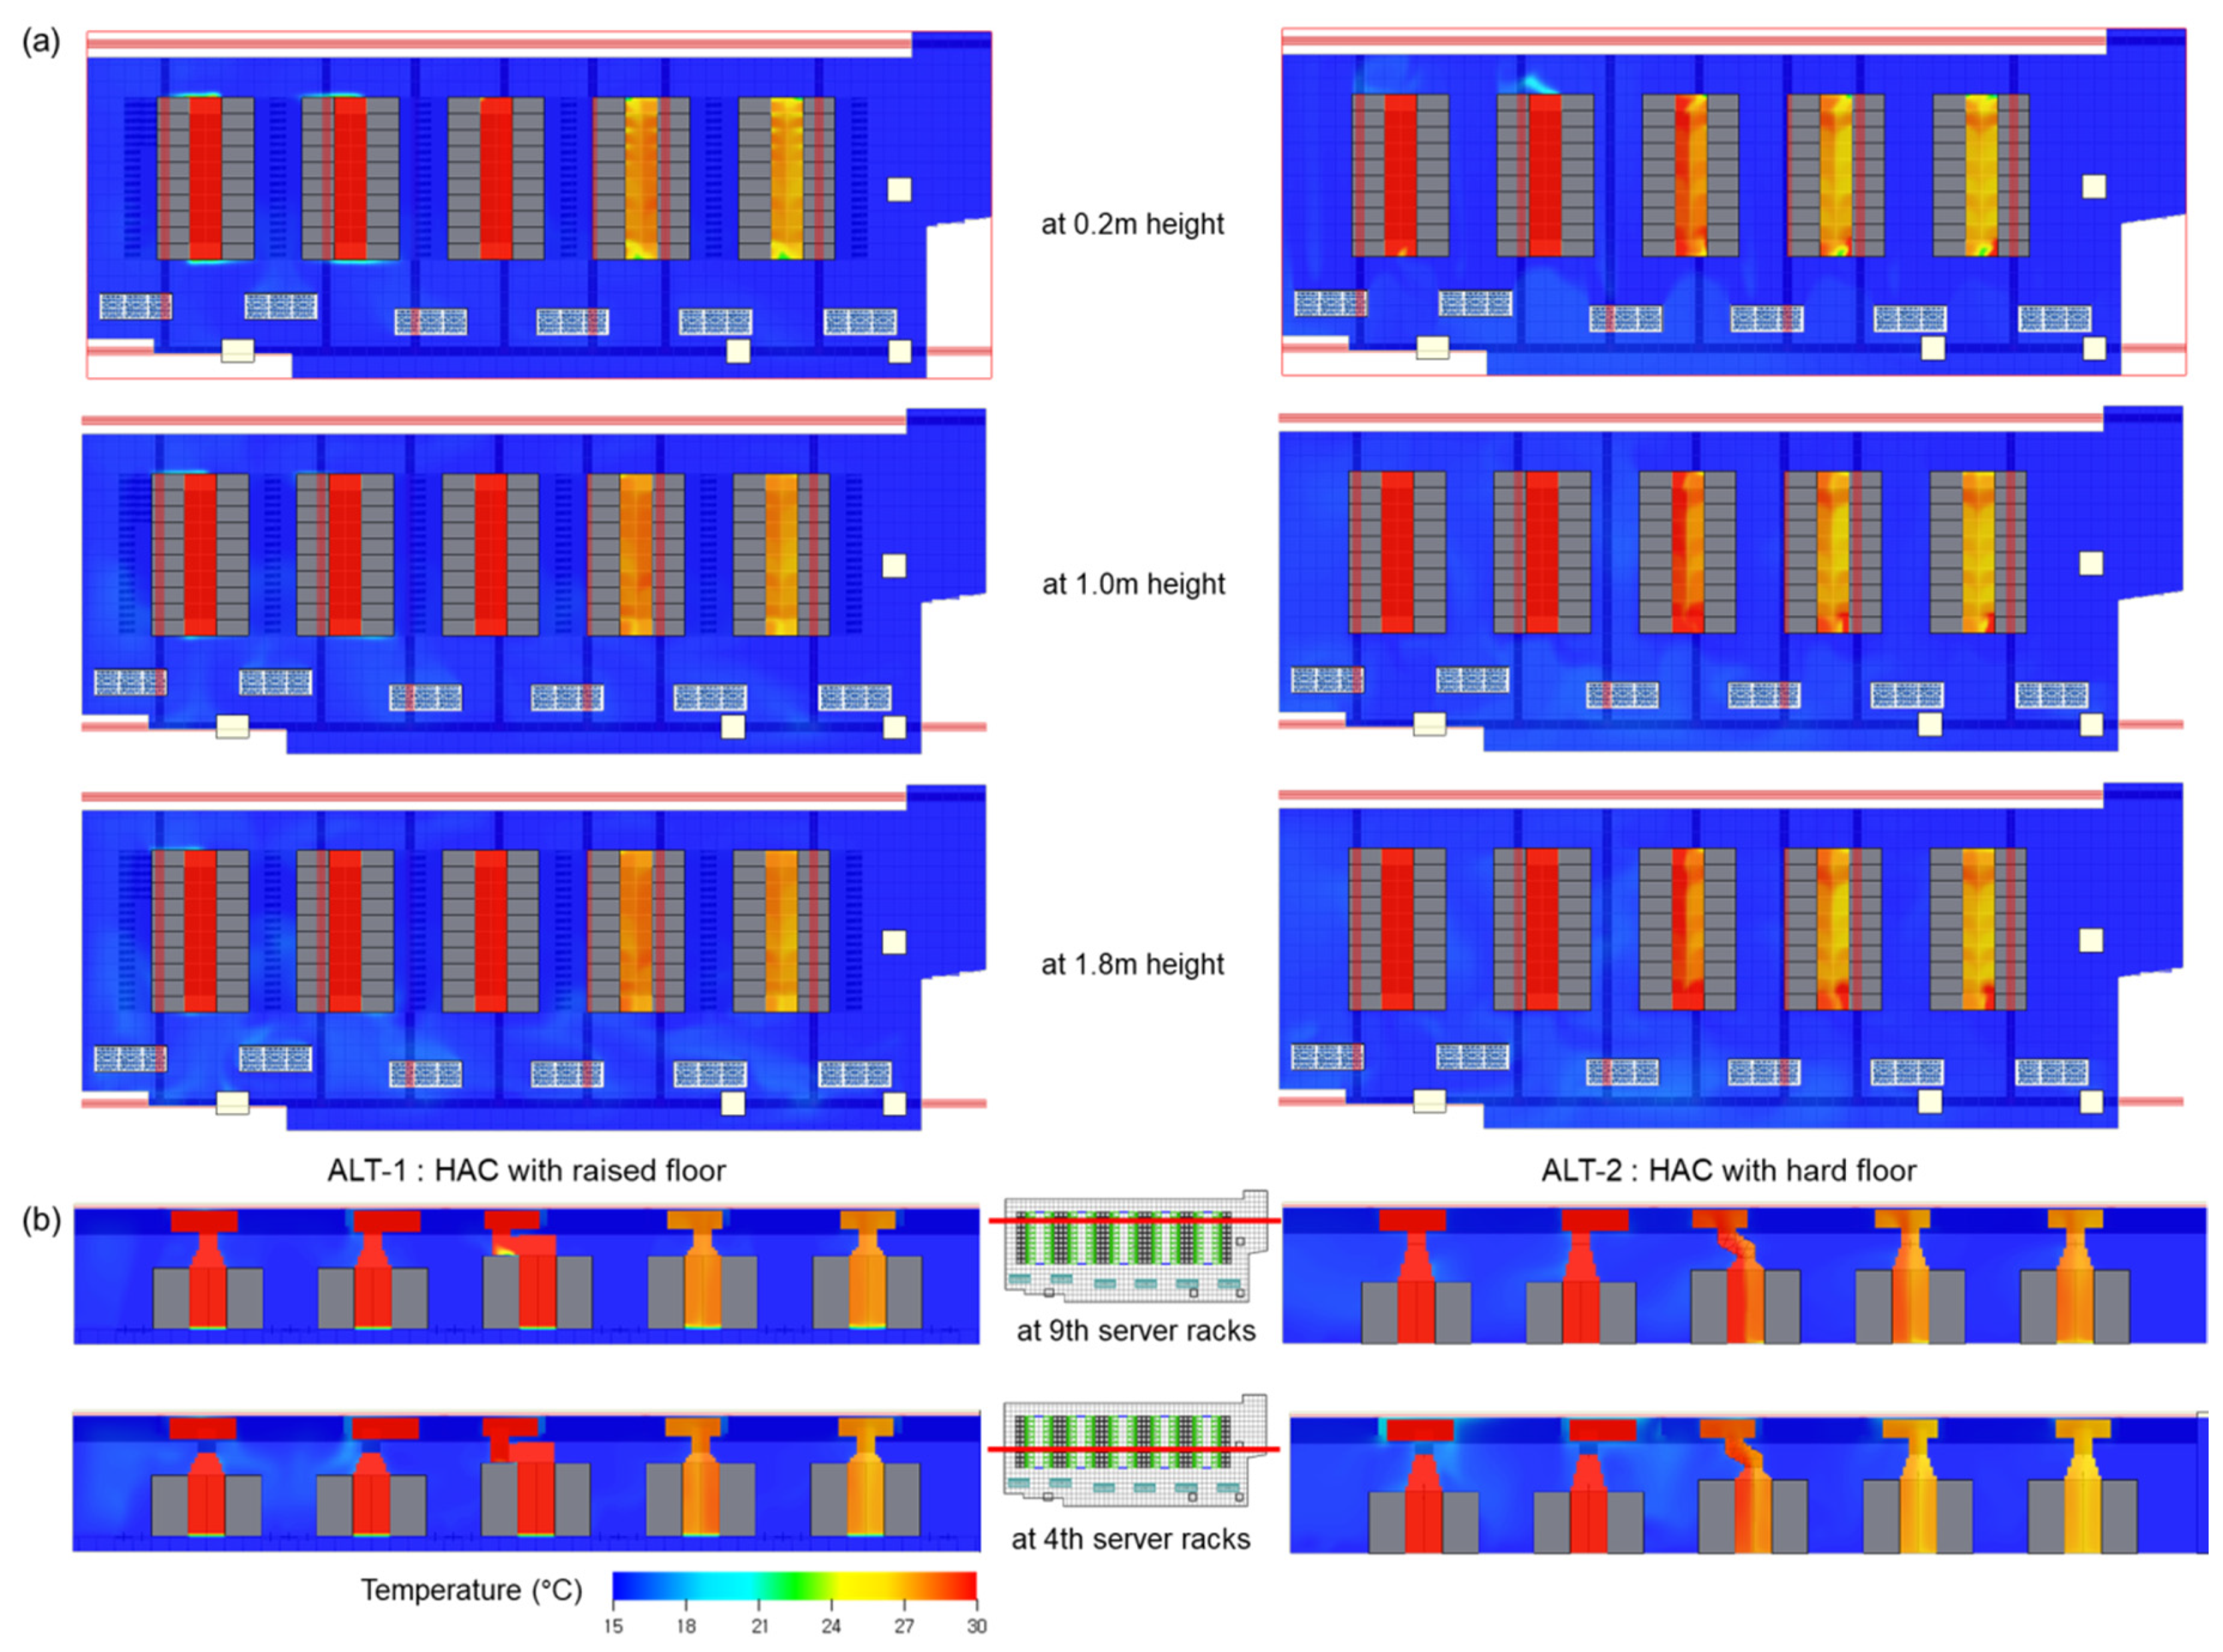
Figure 6a depicts the air temperature distribution around the server racks at heights of 0.2 m (bottom), 1.0 m (middle), and 1.8 m (top) from the floor. For ALT-1 and ALT-2, the air temperature distribution for most of the cold aisles was maintained at approximately 16 °C. This was less than 1 °C higher than the supply air (SA) temperature of the CRAH units (15 °C), which indicates that the temperature rise was under excellent control. This demonstrates that the air cooled in the CRAH units was well distributed with little heat loss in the paths to each server. In other words, air recirculation was well prevented as originally intended by the HAC system. The vertical section views of the IT server room in
Figure 6b show the air temperature distribution in the vertical sections of the ninth and fourth server rack positions and in the cross-section of the RA chamber. A uniform distribution was observed in the cold aisles in a manner similar to the air temperature distribution in the horizontal sections of each height, but an air temperature difference of 26–30 °C was observed in the hot aisles. In the section where the A-type high-density server racks were installed, the hot aisle air temperature distribution was higher, which affected some of the surrounding areas. The CFD analysis results showed that the air temperature distribution of the hot and cold aisles in the IT server room were similar for the raised floor (ALT-1) and hard floor (ALT-2).
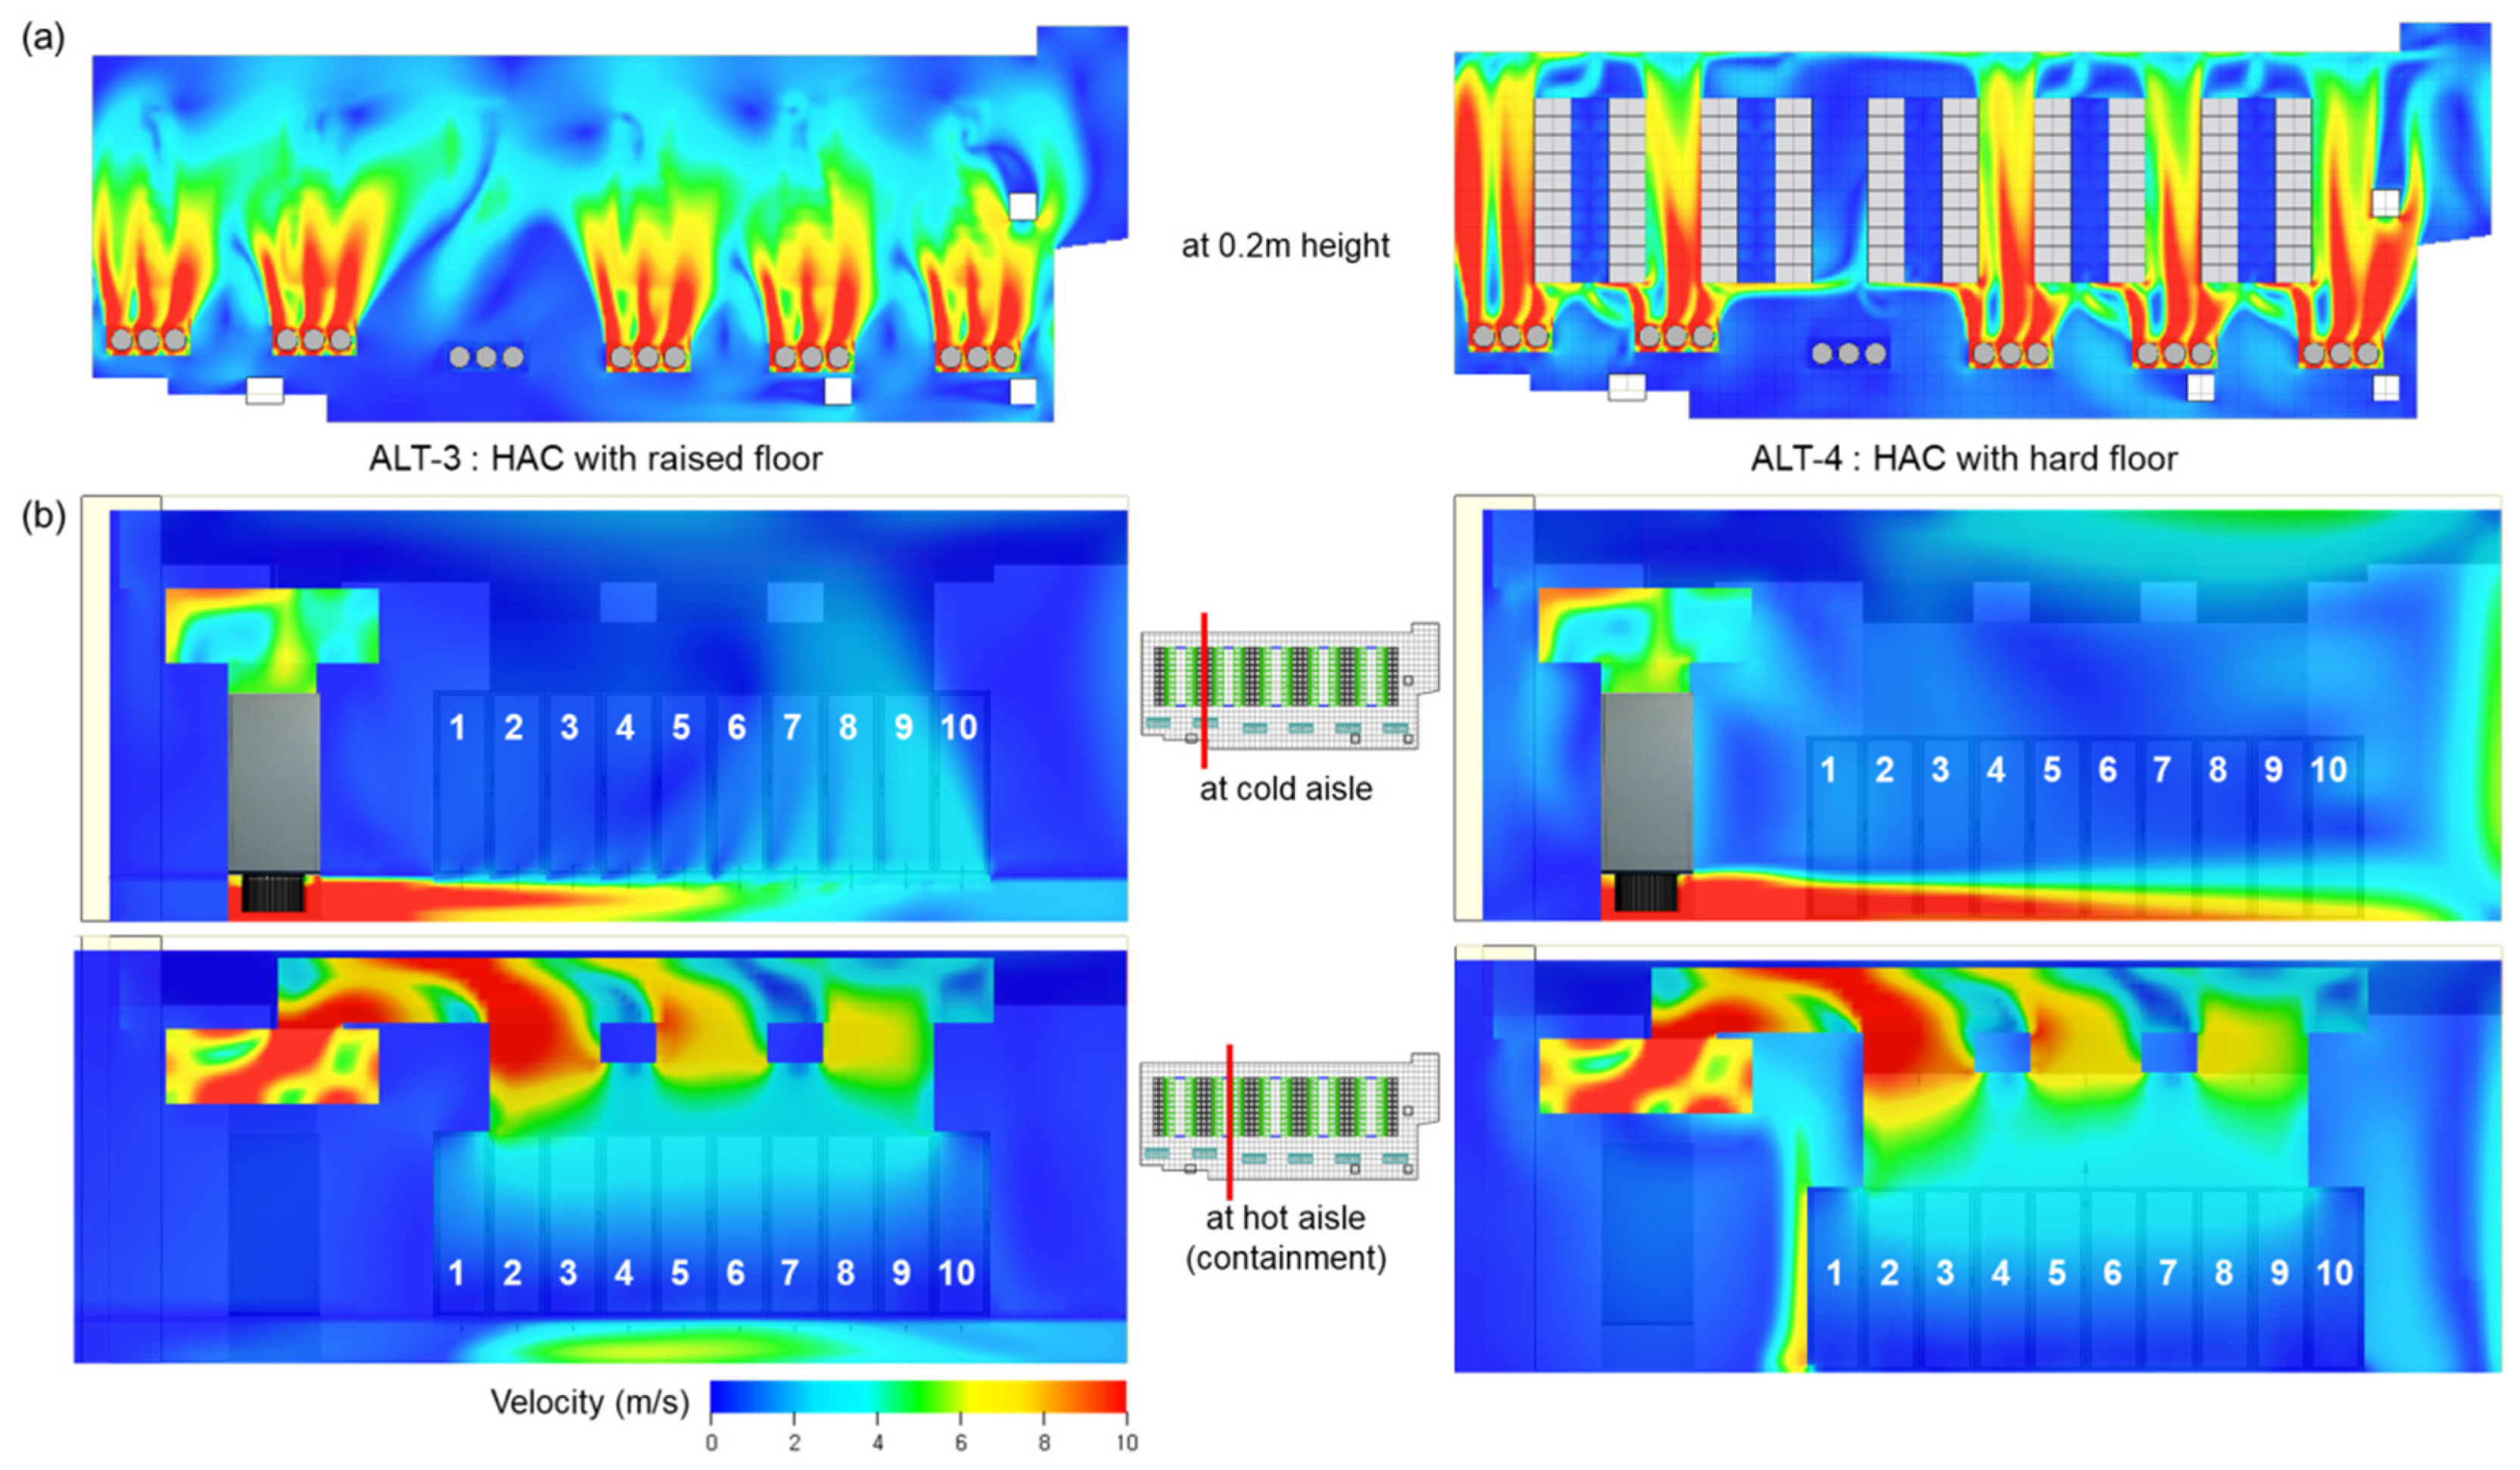
3.1.2. Airflow Distribution in an IT Server Room
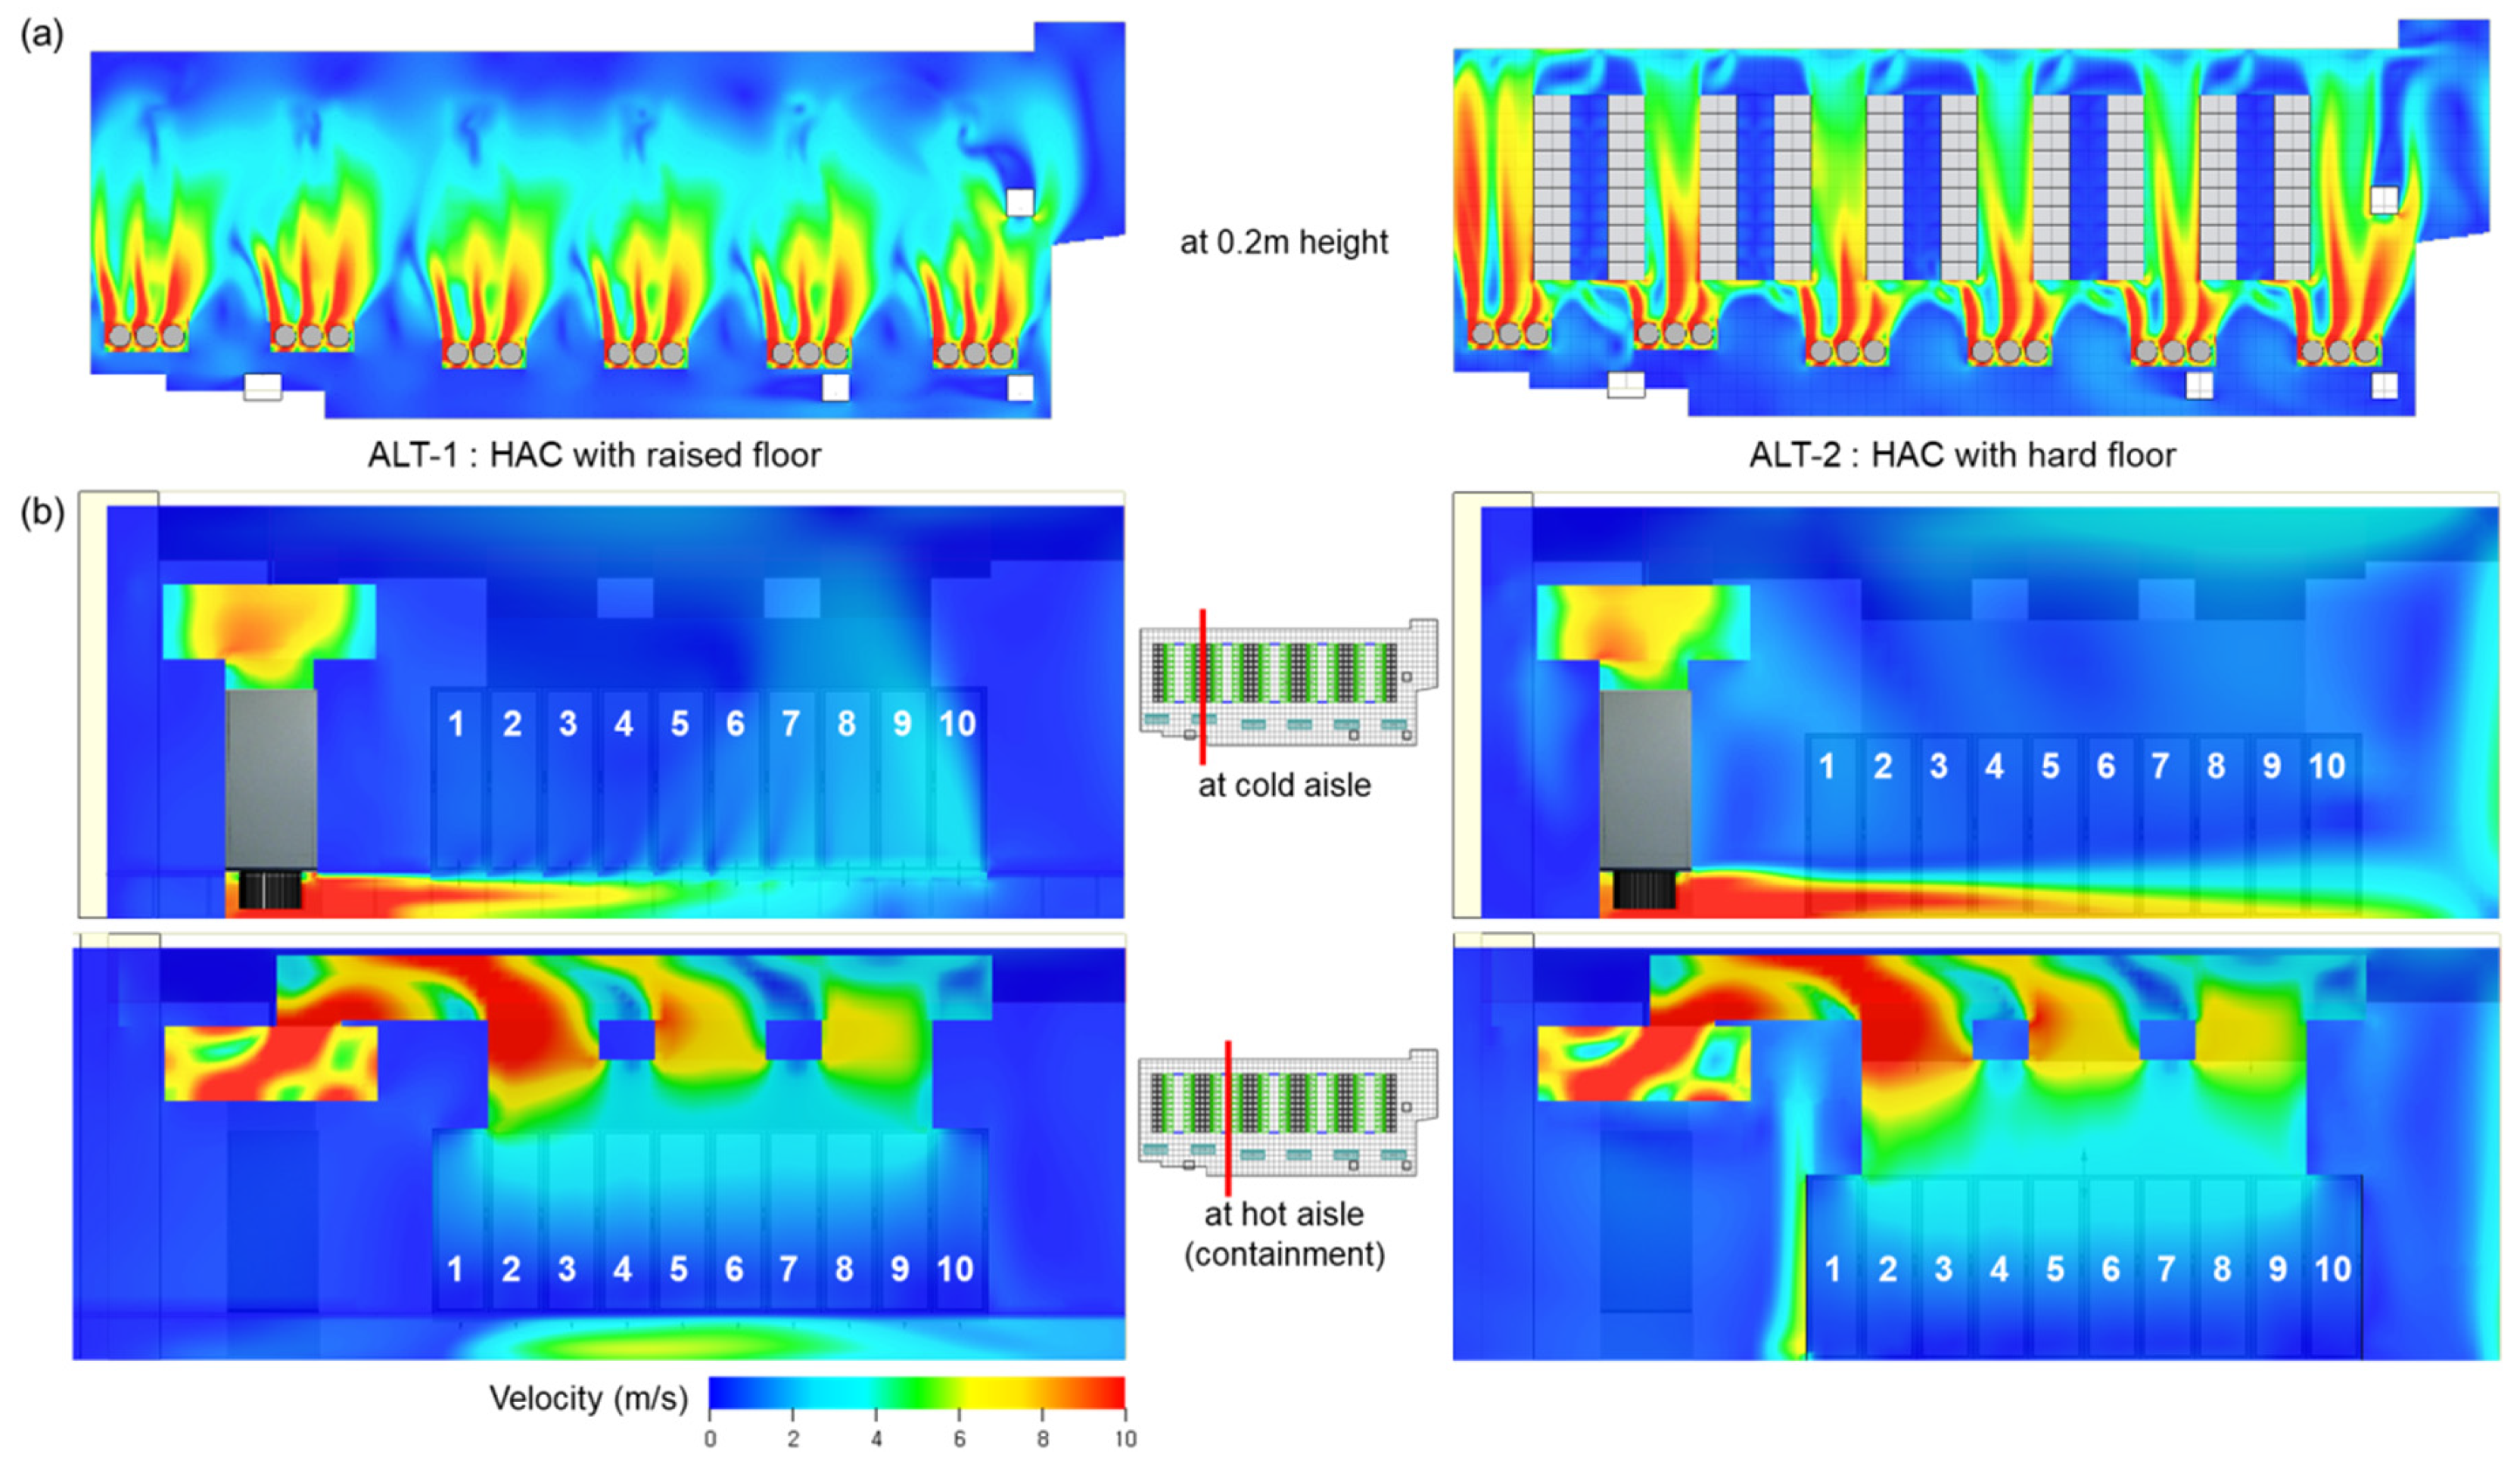
Figure 7a shows the distribution of the airflow that is discharged from the CRAH units at 0.2 m height from the floor. This height is inside the raised floor for ALT-1 and it is just above the hard floor for ALT-2. The vertical section view of the cold aisle in
Figure 7b illustrates that high airflow velocity of more than 10 m/s to the third server rack position is maintained in ALT-1. The airflow velocity to the sixth server rack position is approximately 6 m/s, and it is less than 4 m/s for the rest. On the other hand, in ALT-2, high airflow velocity of more than 10 m/s is maintained to the sixth server rack position. The airflow velocity to the last server rack is maintained at approximately 6 m/s, and it exhibits relatively high-speed airflow distribution in comparison with ALT-1. A relatively low airflow velocity of less than 2 m/s was maintained in the hot aisles for ALT-1 and ALT-2 due to the containment structure. It appears that the heat was effectively discharged through the ducts that are connected to the upper part. The simulation analysis results showed that ALT-2 exhibited a relatively higher airflow speed than ALT-1 for the cold aisles in the IT server room. In particular, a high airflow velocity of more than 10 m/s caused a negative relative pressure, making it difficult to supply a proper air volume to the inlet of the server racks.
3.1.3. Inlet Air Temperature of the Server Racks
The most essential aspect in evaluating the thermal performance of a cooling system in a data center is the distribution of the inlet air temperature of the server racks. If it is too low, energy is wasted. If it is too high, the heat of the server cannot be effectively removed [
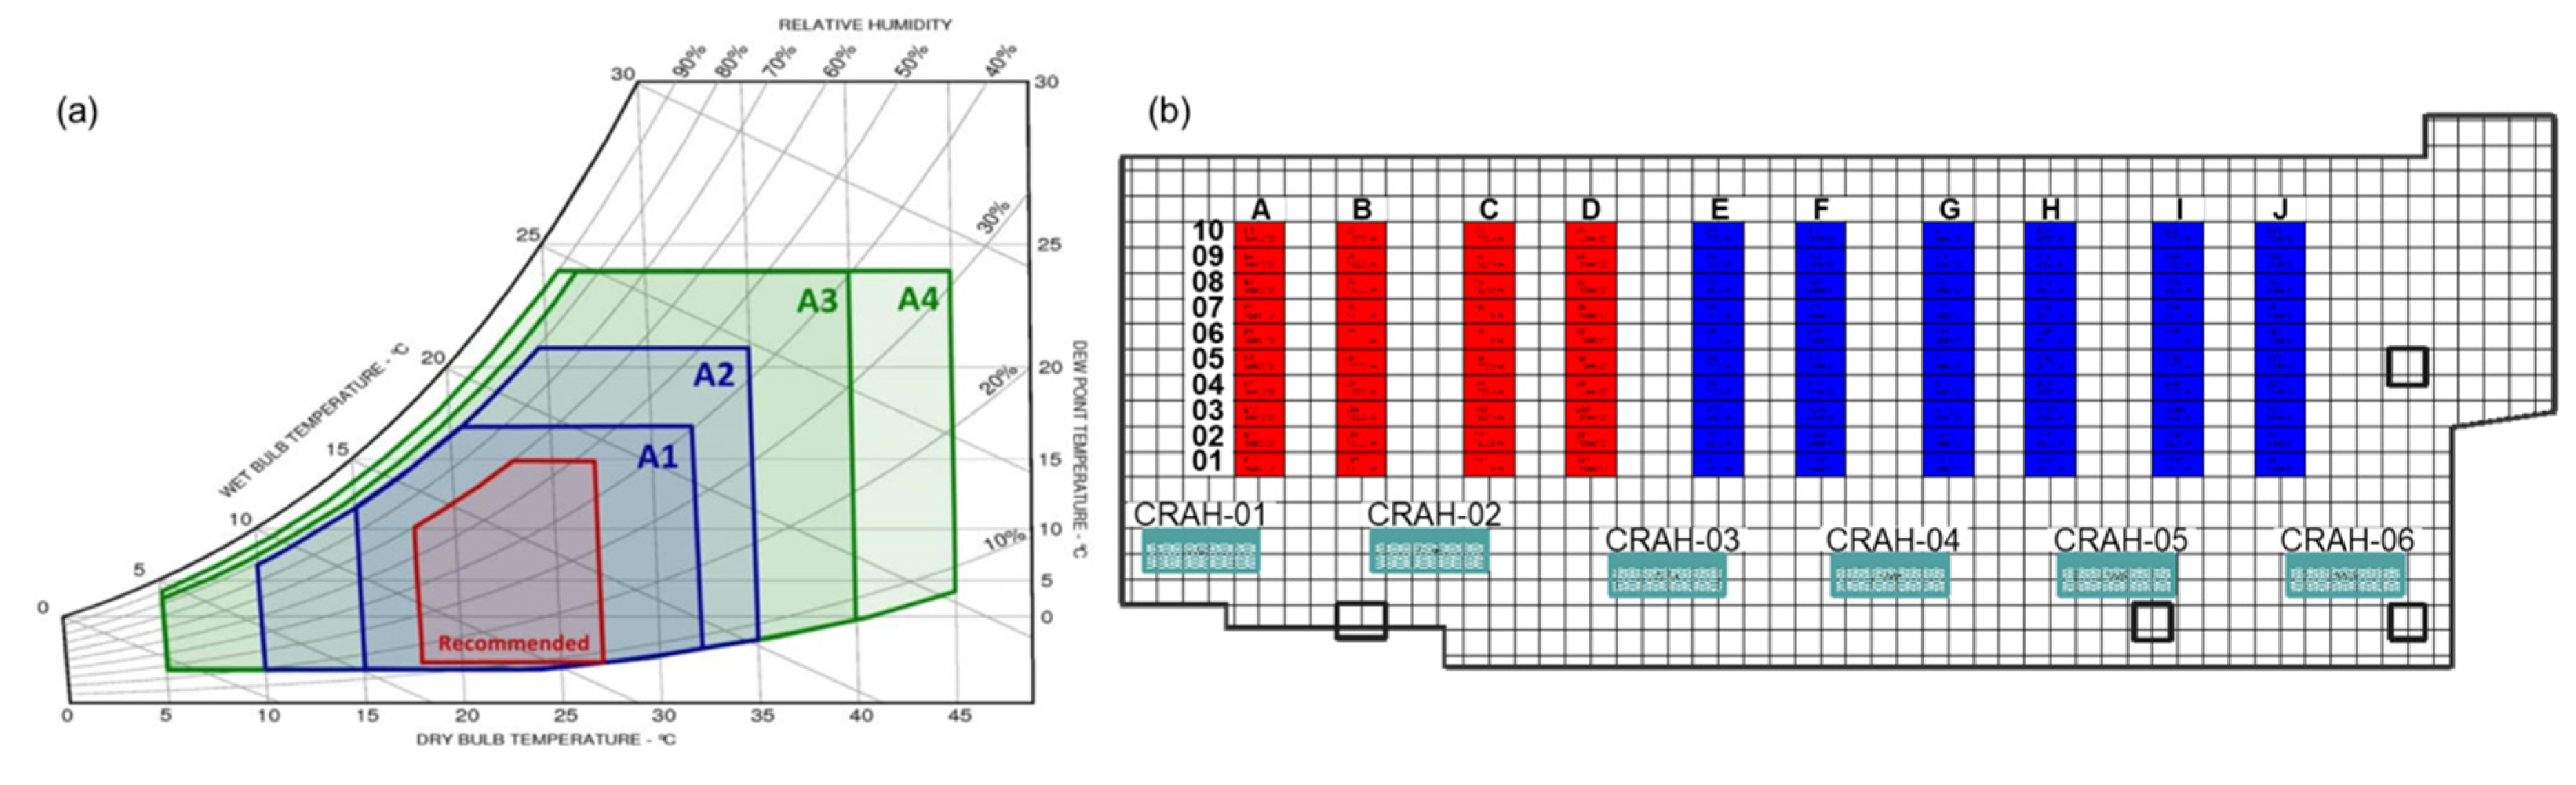
30]. At the rack level, systems have the ability to shut down when a rise in temperature threatens their functioning. To avoid this, ASHRAE suggests monitoring the inlets at the bottom, middle, and top of the rack, maintaining the recommended (18 °C to 27 °C) as well as allowable (15 °C to 32 °C) thermal ranges (
Figure 8a). The ASHRAE thermal guidelines [
8] have been widely used as the IT environment classes for data centers, and they propose standards on the proper server inlet air temperature. The adequacy of the results for this study was determined by applying the temperature ranges.
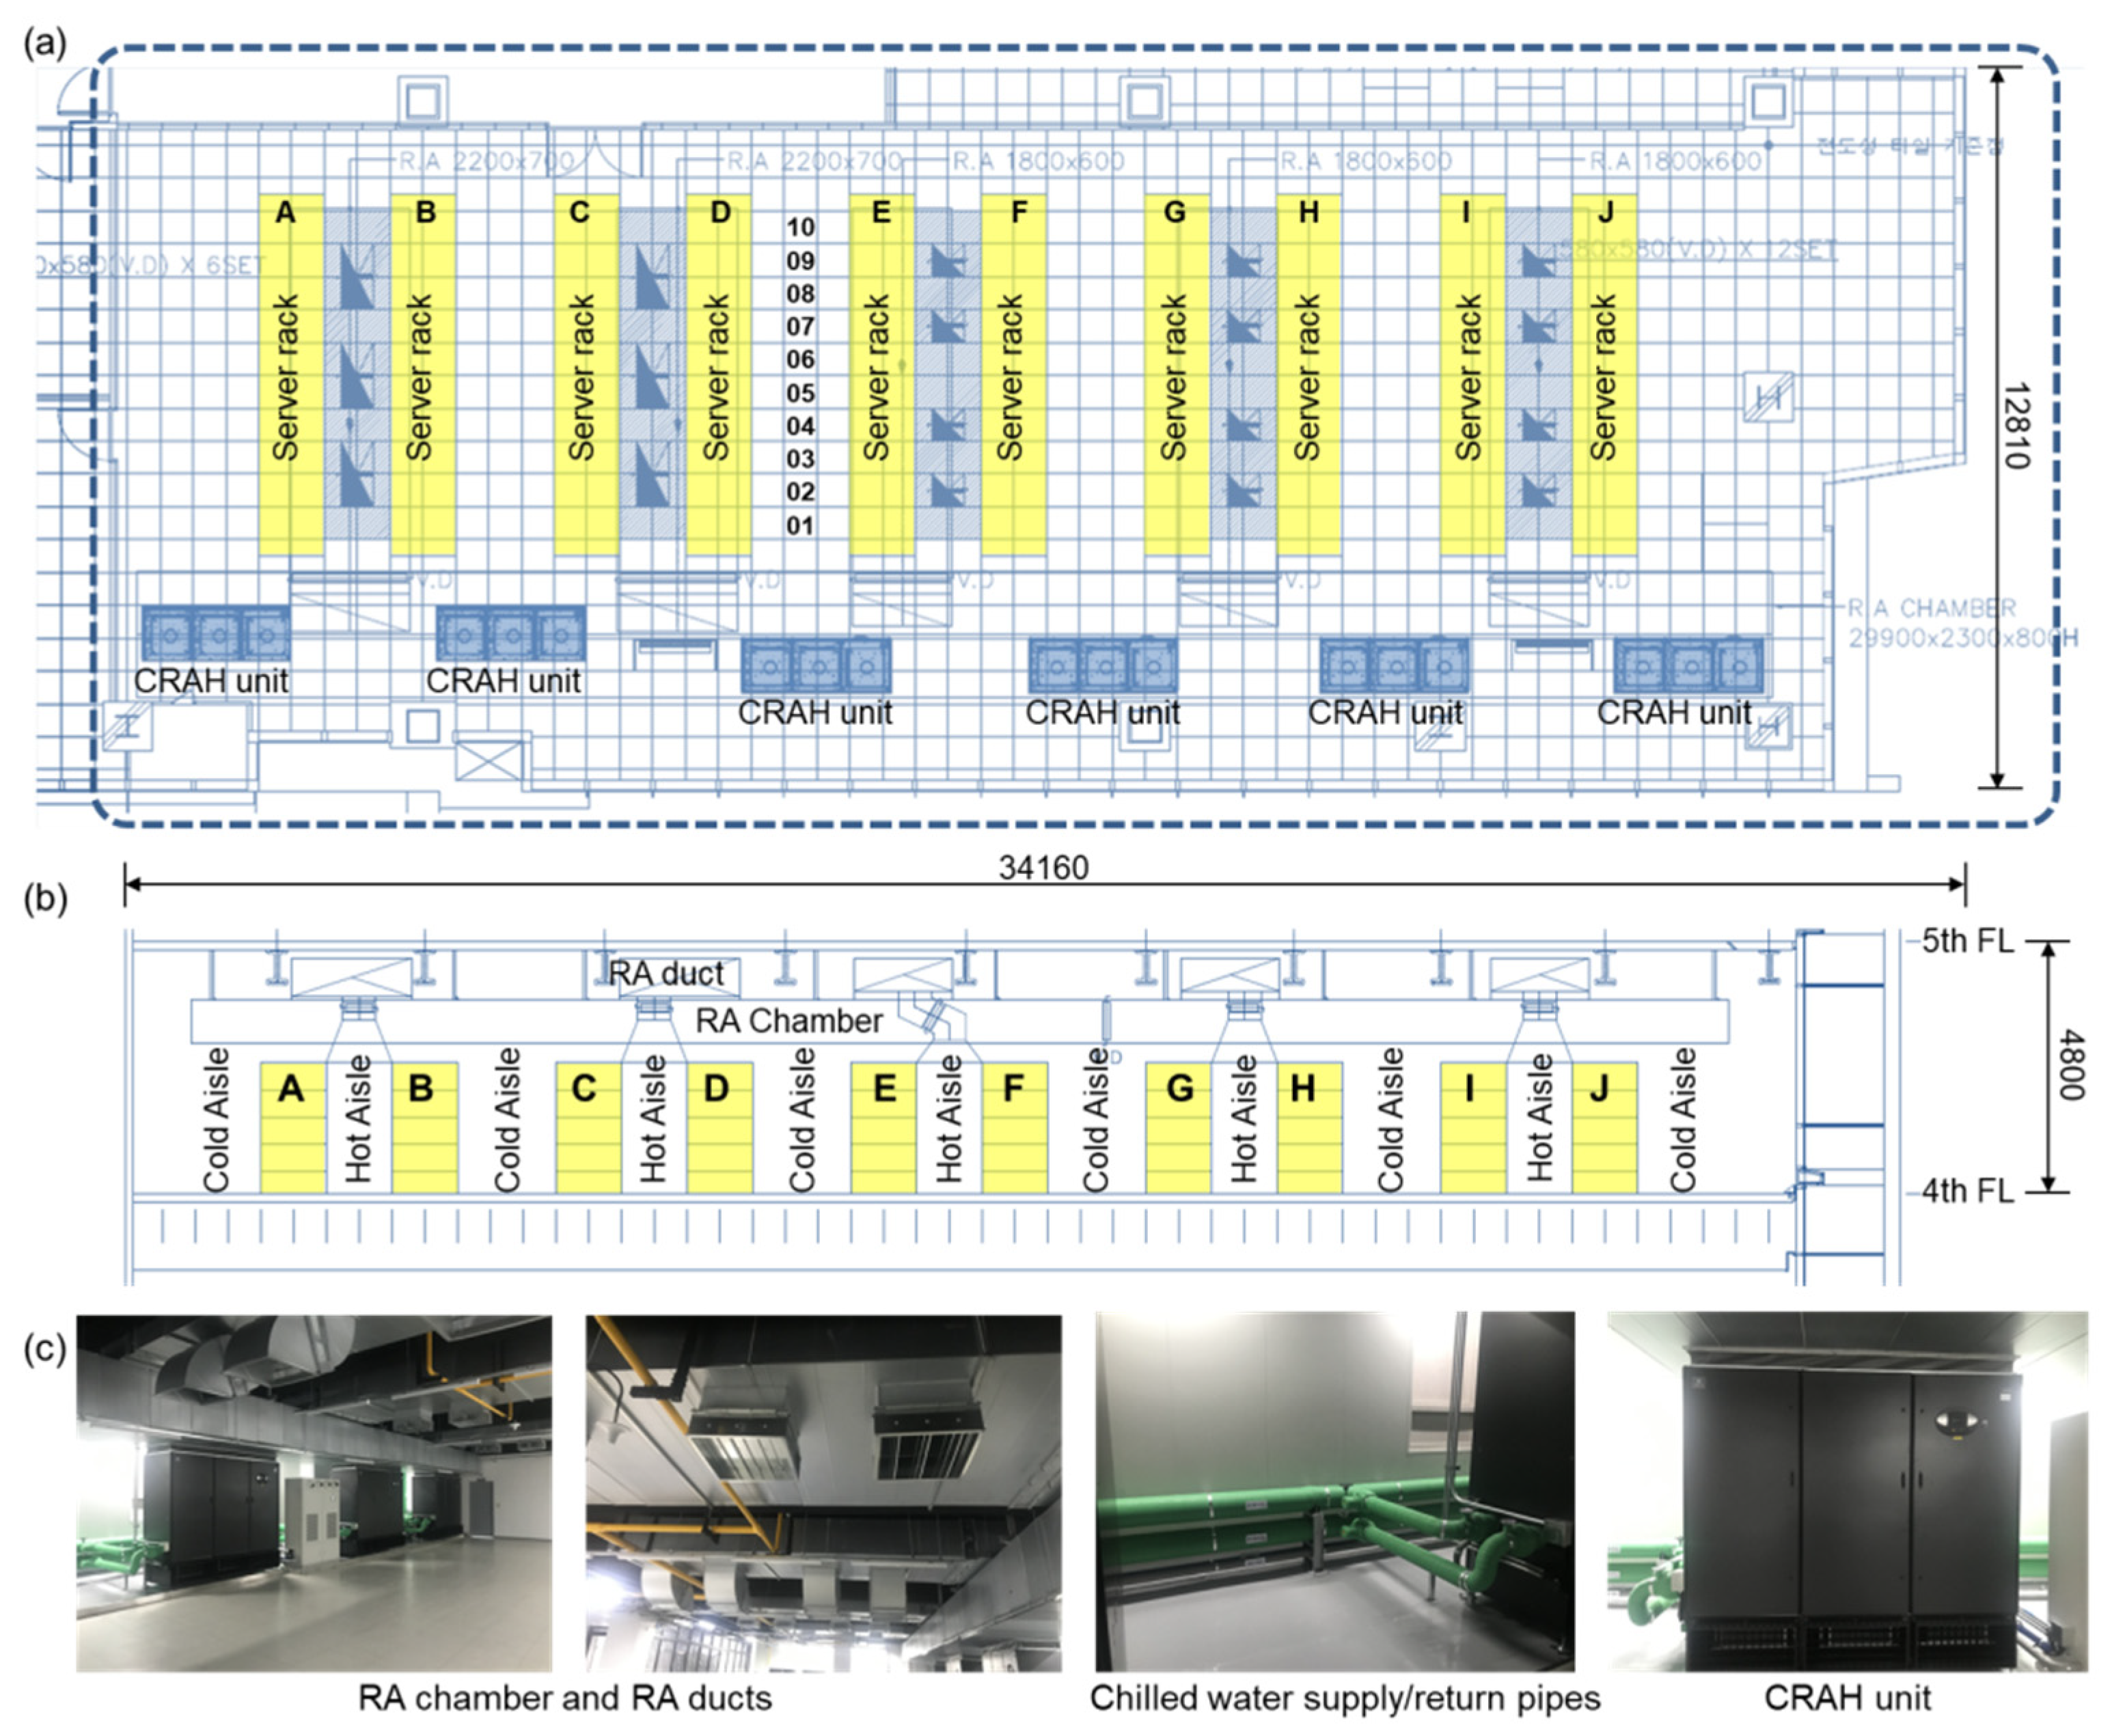
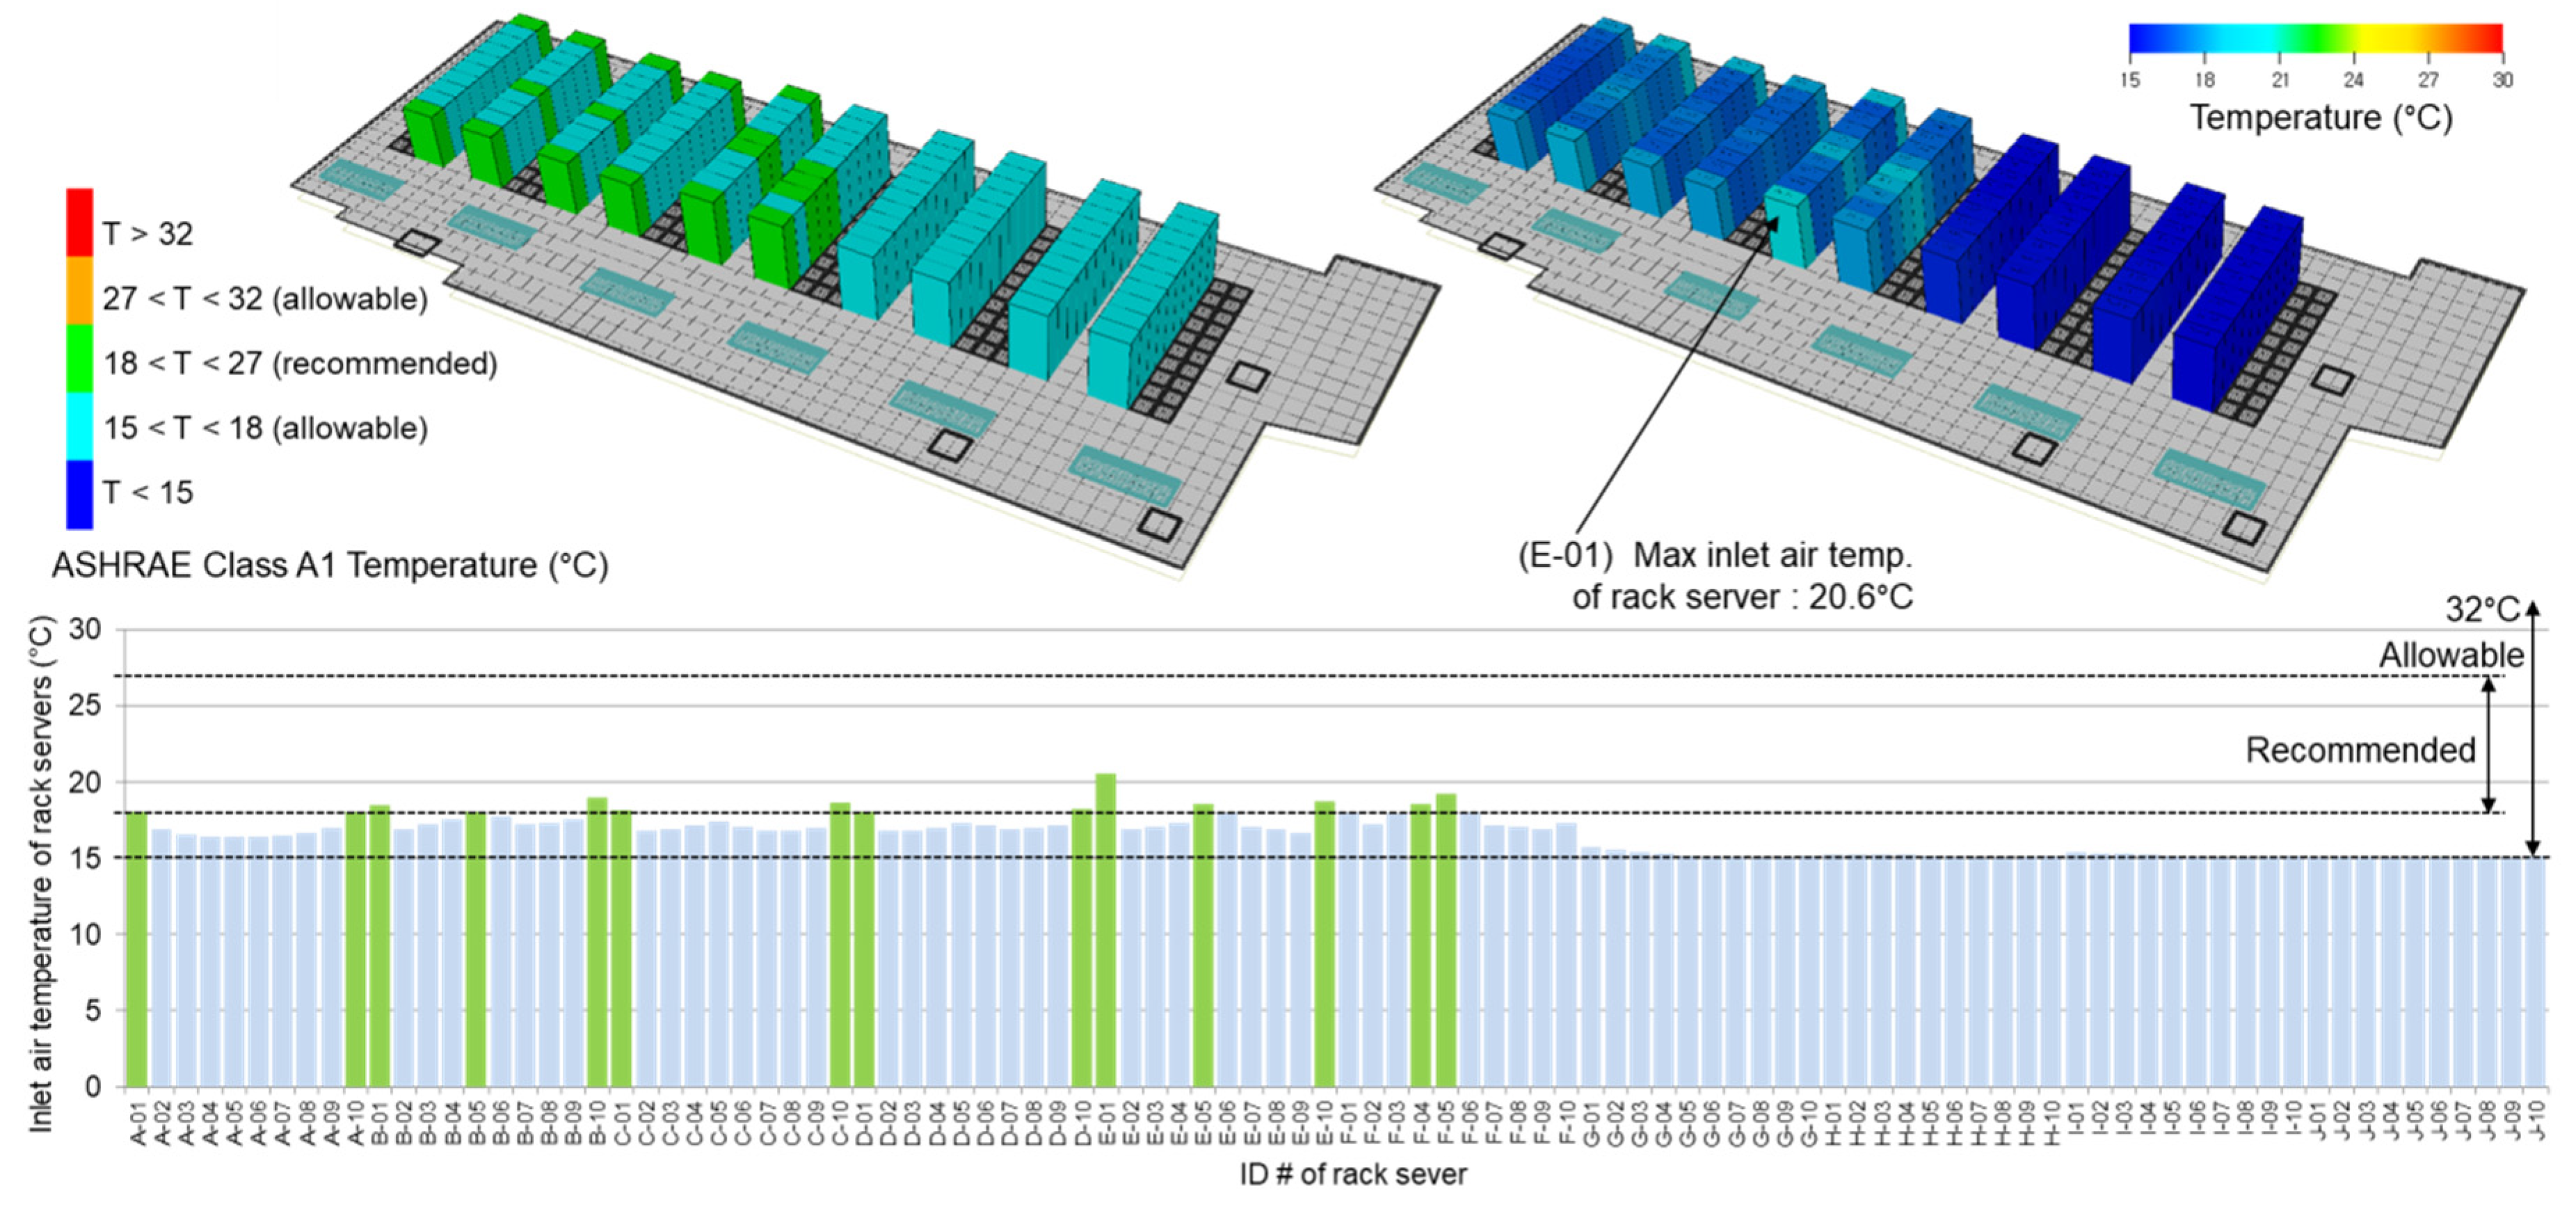
Figure 8b shows the ID numbers, which indicates the positions of 100 server racks (A01-J10) as well as the recommended and allowable ranges of the server inlet air temperature. In the upper allowable temperature range of 27–32 °C suggested by ASHRAE, the IT servers can operate without significant problems. However, if this condition is maintained over a long period of time, it continuously affects the IT equipment, thereby increasing the possibility of downtime. The inlet air temperature of the server racks is under 27 °C, which is within the range recommended by ASHRAE. Temperatures above 27 °C need not be classified. Therefore, the graph depicted in
Figure 8a ends at 30 °C, beyond which the temperature contours need not be clearly segregated with colors.
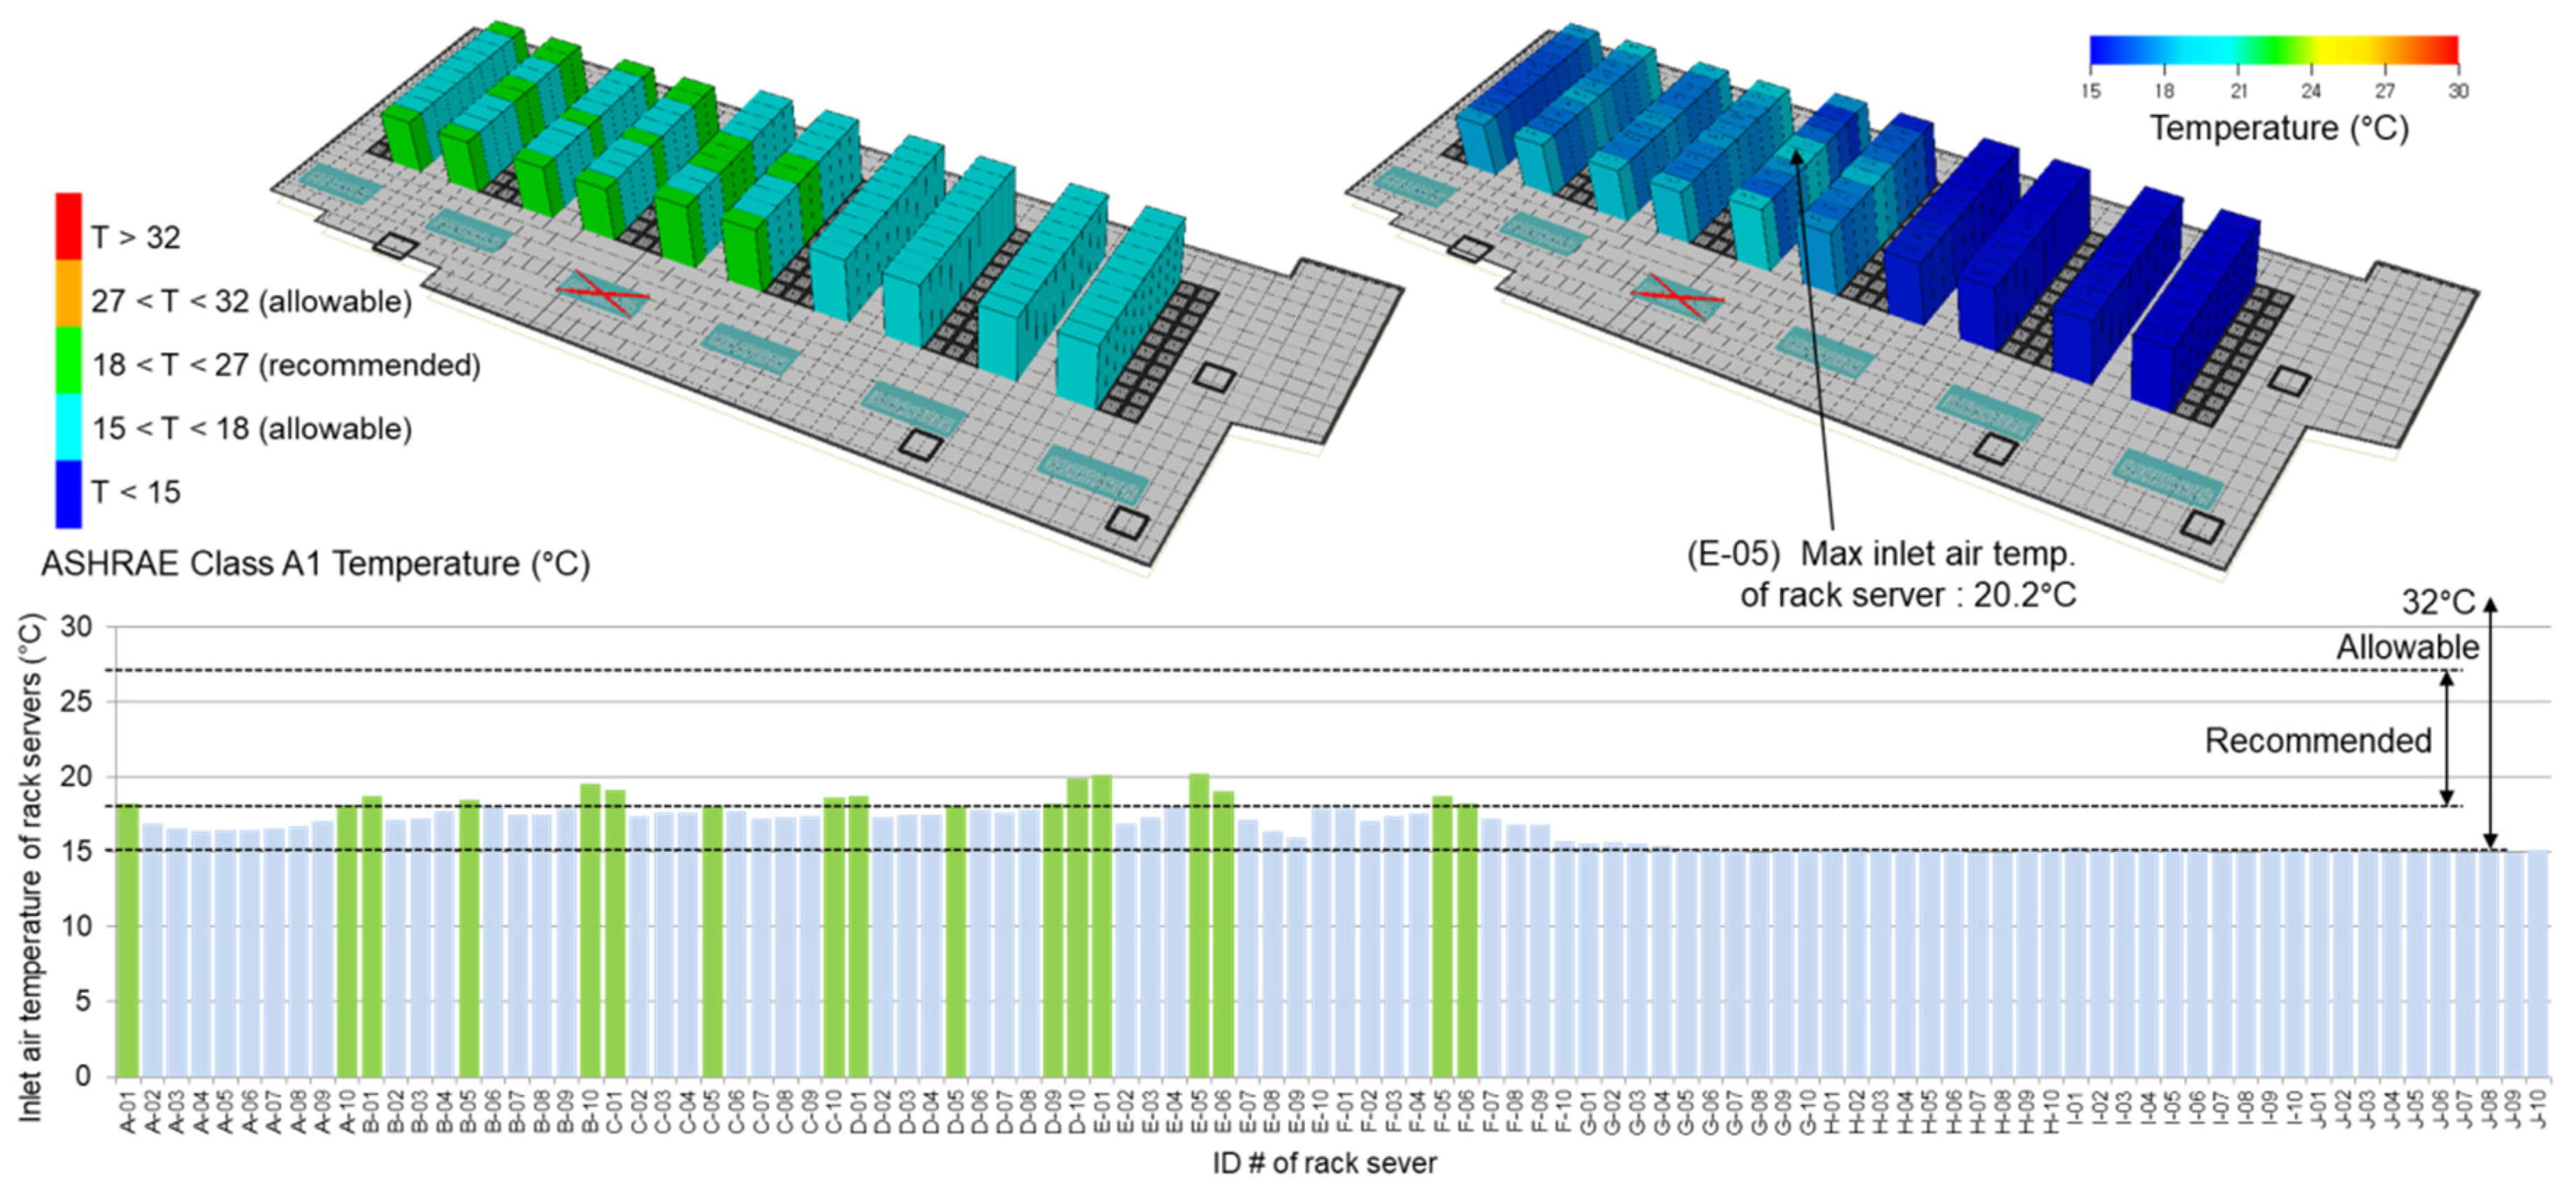
Figure 9 presents the mean inlet air temperature distribution of 100 server racks for ALT-1 that adopted the raised floor. All the server racks operated within the recommended temperature range of ASHRAE, which resulted in a very safe state. According to the airflow distribution analyzed above, a proper air volume was not supplied to the first server racks with high-speed airflow and the tenth server racks with low-speed airflow in comparison with the other server racks, thus resulting in relatively high inlet air temperatures for the server racks. Nevertheless, the maximum inlet air temperature was 20.6 °C, which is adequate.
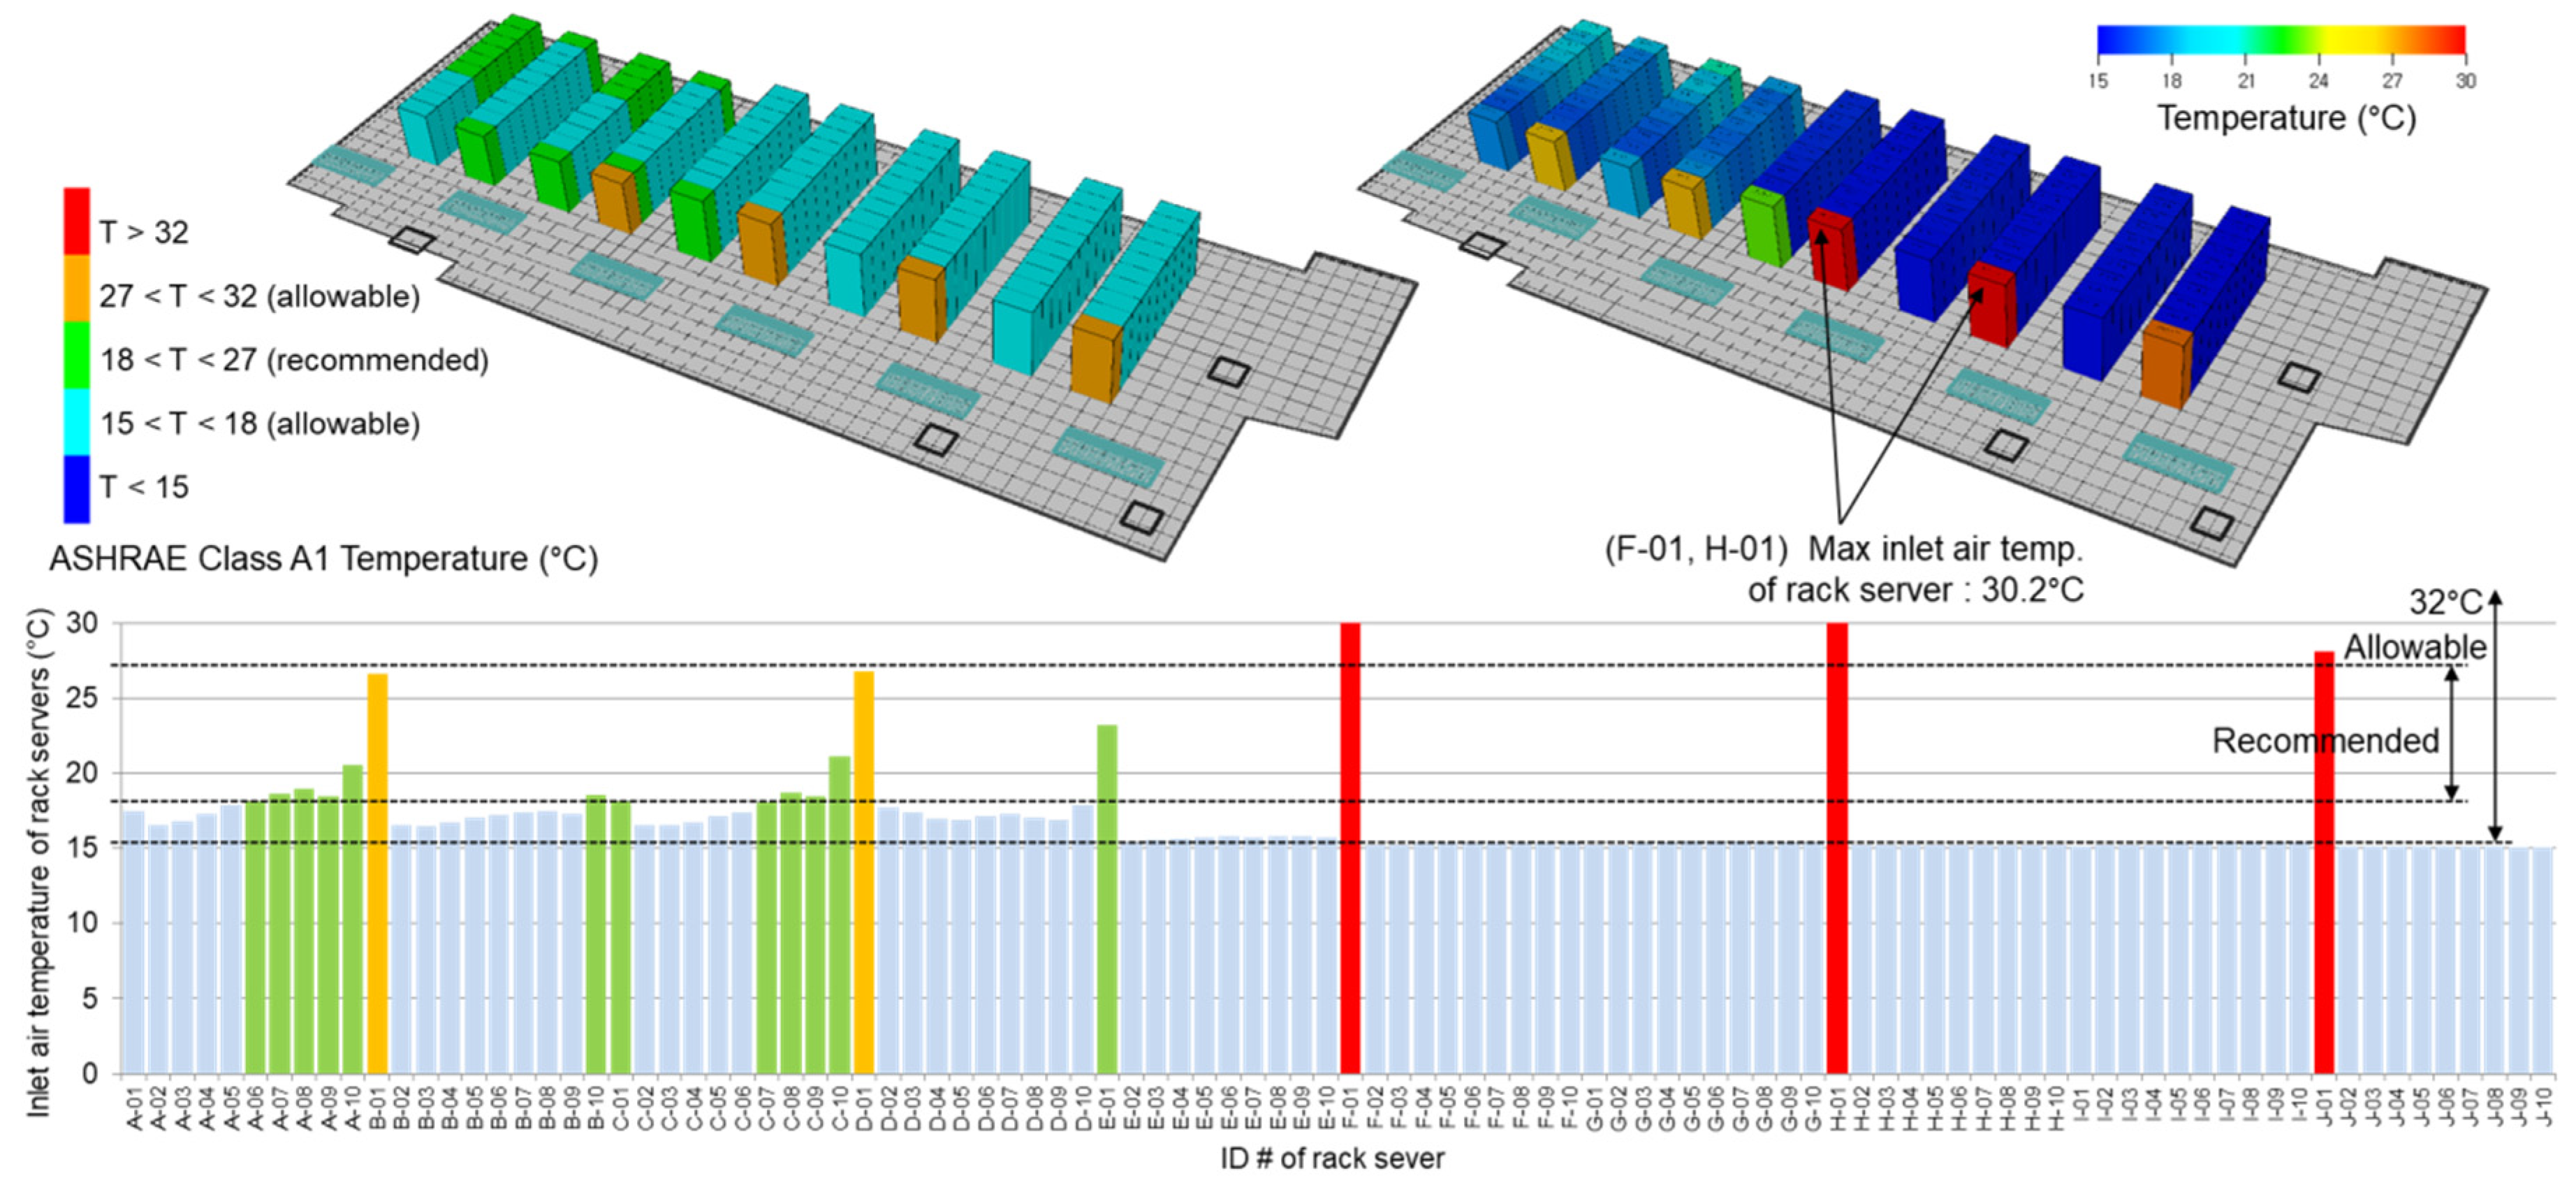
In the case of ALT-2 that adopted the hard floor as shown in
Figure 10, 39000 m
3/h of cooled air at 15 °C, blown from the CRAH units to the uncontained cold aisles at a high speed, was rapidly spread throughout the IT server room. This airflow velocity, which is higher than that in ALT-1, does not allow a sufficient air volume to be supplied to many server racks, thereby causing high inlet air temperature distribution. It was determined that 97% of the server racks satisfied the recommended temperature range of ASHRAE. Approximately 3% of them (three server racks closest to the CRAH units) exceeded the range. Among them, two servers exhibited a maximum inlet air temperature of 30.2 °C, which was 9.6 °C higher in comparison with ALT-1. In conclusion, for ALT-2, 97% of the 100 server racks satisfied the recommended temperature range of ASHRAE and 3% met the allowable temperature range. The numerical analysis results showed that the inlet air temperature distribution of the server racks was very stable for ALT-1 in comparison with ALT-2. In other words, the stable supply of cooled air through the raised floor improves the overall air distribution efficiency of the room-based cooling system.
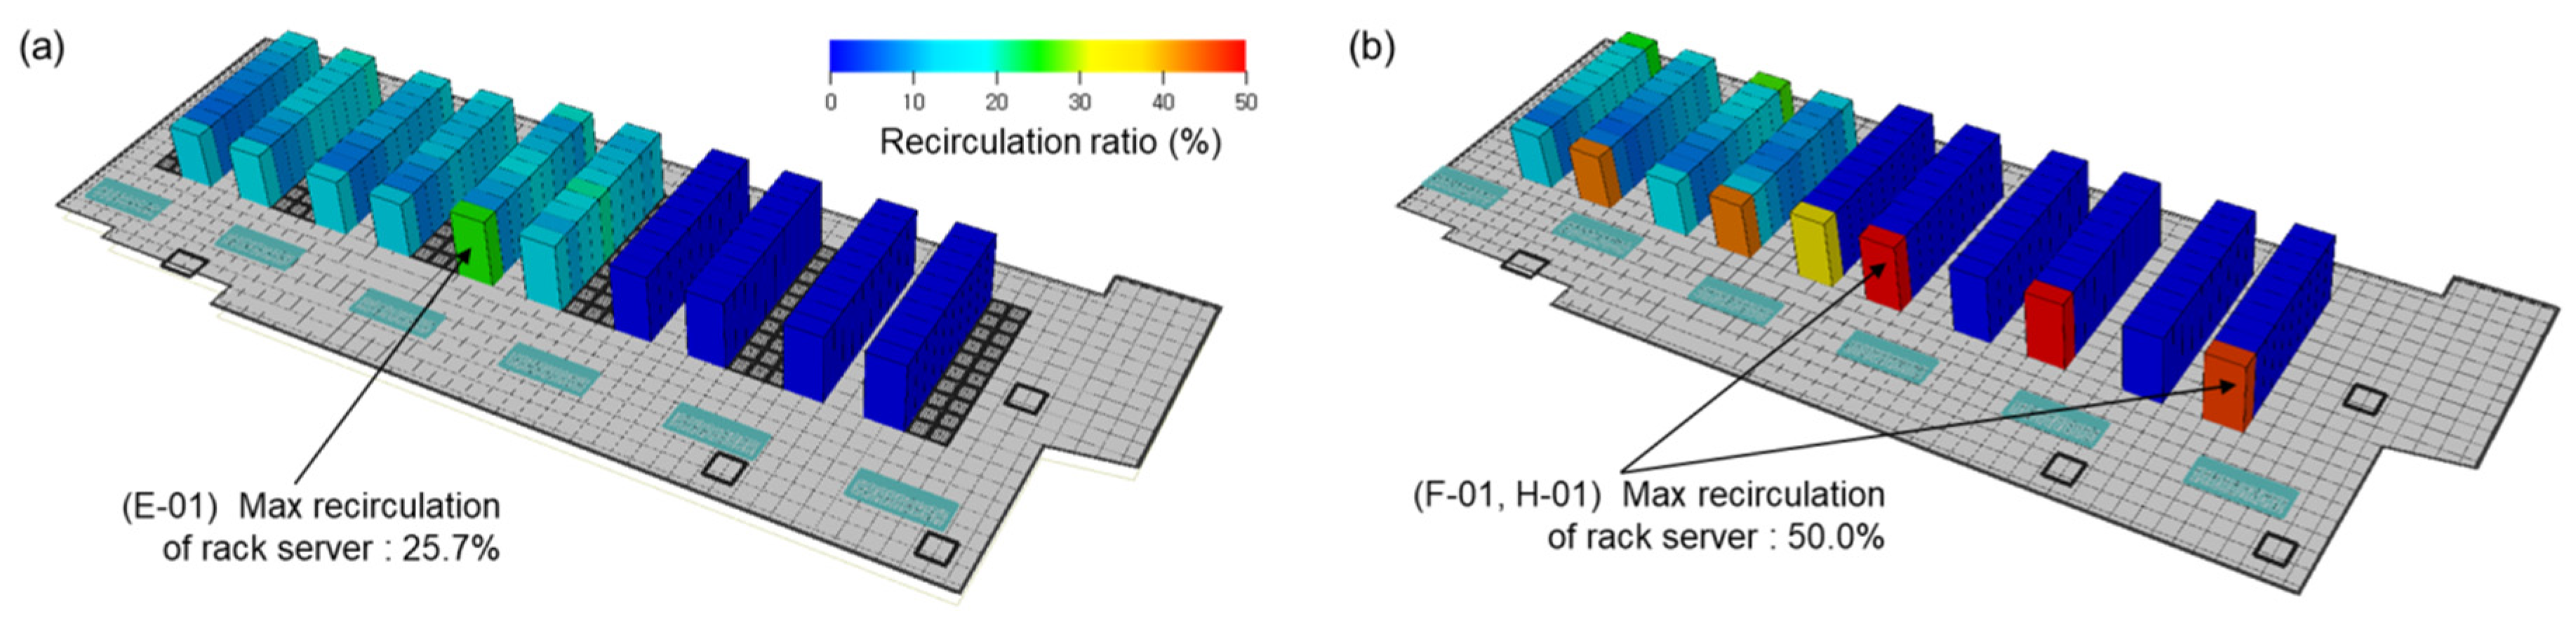
3.1.4. Recirculation Ratio
For cooling the IT server room, the cooled air that is supplied from the CRAH units is introduced into the server racks to remove the heat. The warmer air then returns to the CRAH units. During air re-circulation, the air warmed by the heat of the IT server is reintroduced into the server racks instead of returning to the CRAH units. During air by-pass, the cooled air that is supplied from the CRAH units immediately returns to the CRAH units instead of being introduced into the server racks; these processes occur frequently. The elements that have the largest influence on the thermal performance and efficiency of the cooling and air distribution systems in data centers are air re-circulation and air by-pass. Previously, the RTI (return temperature index) was proposed to explain the re-circulation and by-pass [
31,
32]. Under the ideal condition of the RTI, the air conditioning-cooling supply must be 100% matched by utilization. RTI is applicable to the traditional uncontained room-based cooling systems. For containment structures, such as HAC and CAC, however, RTI does not significantly change when the leakage rate between the hot and cold aisles is maintained at 5% or less. Therefore, RTI was not well applied to ALT-1 and ALT-2 with the HAC system. Instead, the recirculation ratio was analyzed based on the amount of air re-circulated inside the server racks where a proper air volume was not supplied. The ratio of the insufficient recirculation air volume is calculated by subtracting the ratio of the air volume that is actually supplied to the server racks (
) to the air volume required to remove the heat from the server racks (
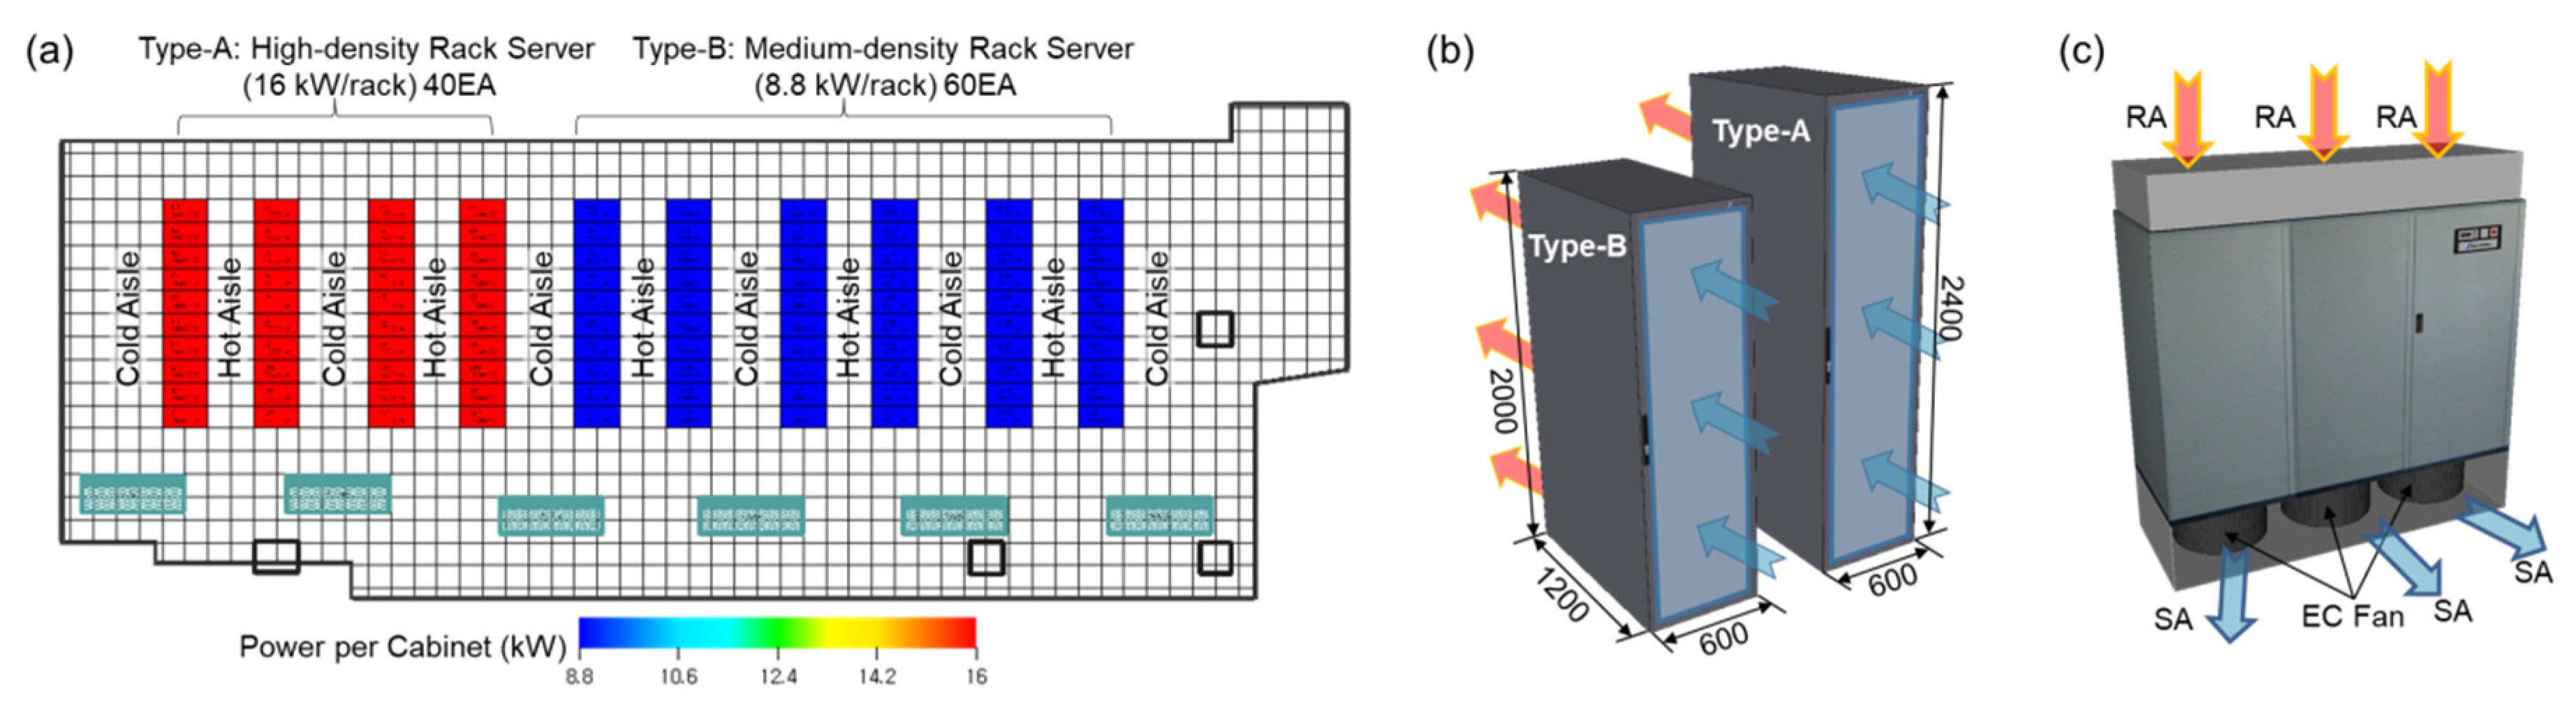
) from 100%. The recirculation ratio is calculated using Equation (1).
Figure 11 illustrates the distribution of the recirculation ratios of 100 server racks. The overall distribution pattern shows that the server racks with high inlet air temperatures exhibited high recirculation ratios. Because a proper air volume supply to remove the heat was absent, recirculation occurred inside and the inlet air temperature increased. In ALT-1 and ALT-2, a high heat load of 16 kW/rack occurs in rows A through D where A-type high-density server racks were applied; thus, high air volume needs to be supplied accordingly. Because the supplied air volume was not sufficient for them, the recirculation ratio was relatively high. For rows D through J where the B-type medium-density server racks were applied, it was determined that a proper air volume to remove the heat was supplied. In addition, the air volume was not sufficient for most of the first server racks that were the closest to the CRAH units, and they exhibited high recirculation ratios. A maximum recirculation ratio of 25.7% for ALT-1 implies that the supplied air volume was 25.7% less than the required air volume. However, this was not a problem because the inlet air temperature was 20.6 °C. The maximum recirculation ratio of ALT-2 was 50%, which indicated the presence of server racks that are in a serious condition. The inlet air temperature of these server racks was as high as approximately 30 °C. In other words, only half of the air volume that is required to remove the heat was supplied. In addition, the temperature of cooled air at 15 °C supplied from the CRAH units increased by more than 15 °C. The CFD analysis results showed that the recirculation ratio distribution of the server racks was very stable for ALT-1 in comparison with ALT-2, which corresponded to a 42% reduction in the recirculation ratio of more than 20%.
3.1.5. Operational Net Cooling Power
Table 4 describes the cooling system capacity during the operation of each CRAH unit. CRAH-01 and CRAH-02, which covered the high-density server racks, operated close to the rated cooling capacity. On the other hand, in the section where medium-density rack servers were installed and there was sufficient free space, approximately 70% of the rated capacities of CRAH-03 through CRAH-06 was used. The simulation analysis results showed that there was almost no difference in the cooling system load between the raised floor (ALT-1) and the hard floor (ALT-2). This indicates that the performance and efficiency of the IT environment, cooling system, and the air distribution system may significantly differ depending on the raised floor and the hard floor configuration, even if cooled air is supplied at the same temperature (15°C) by using the cooling systems with the same capacity.
3.2. Cooling Fault Conditions (ALT-3 and ALT-4)
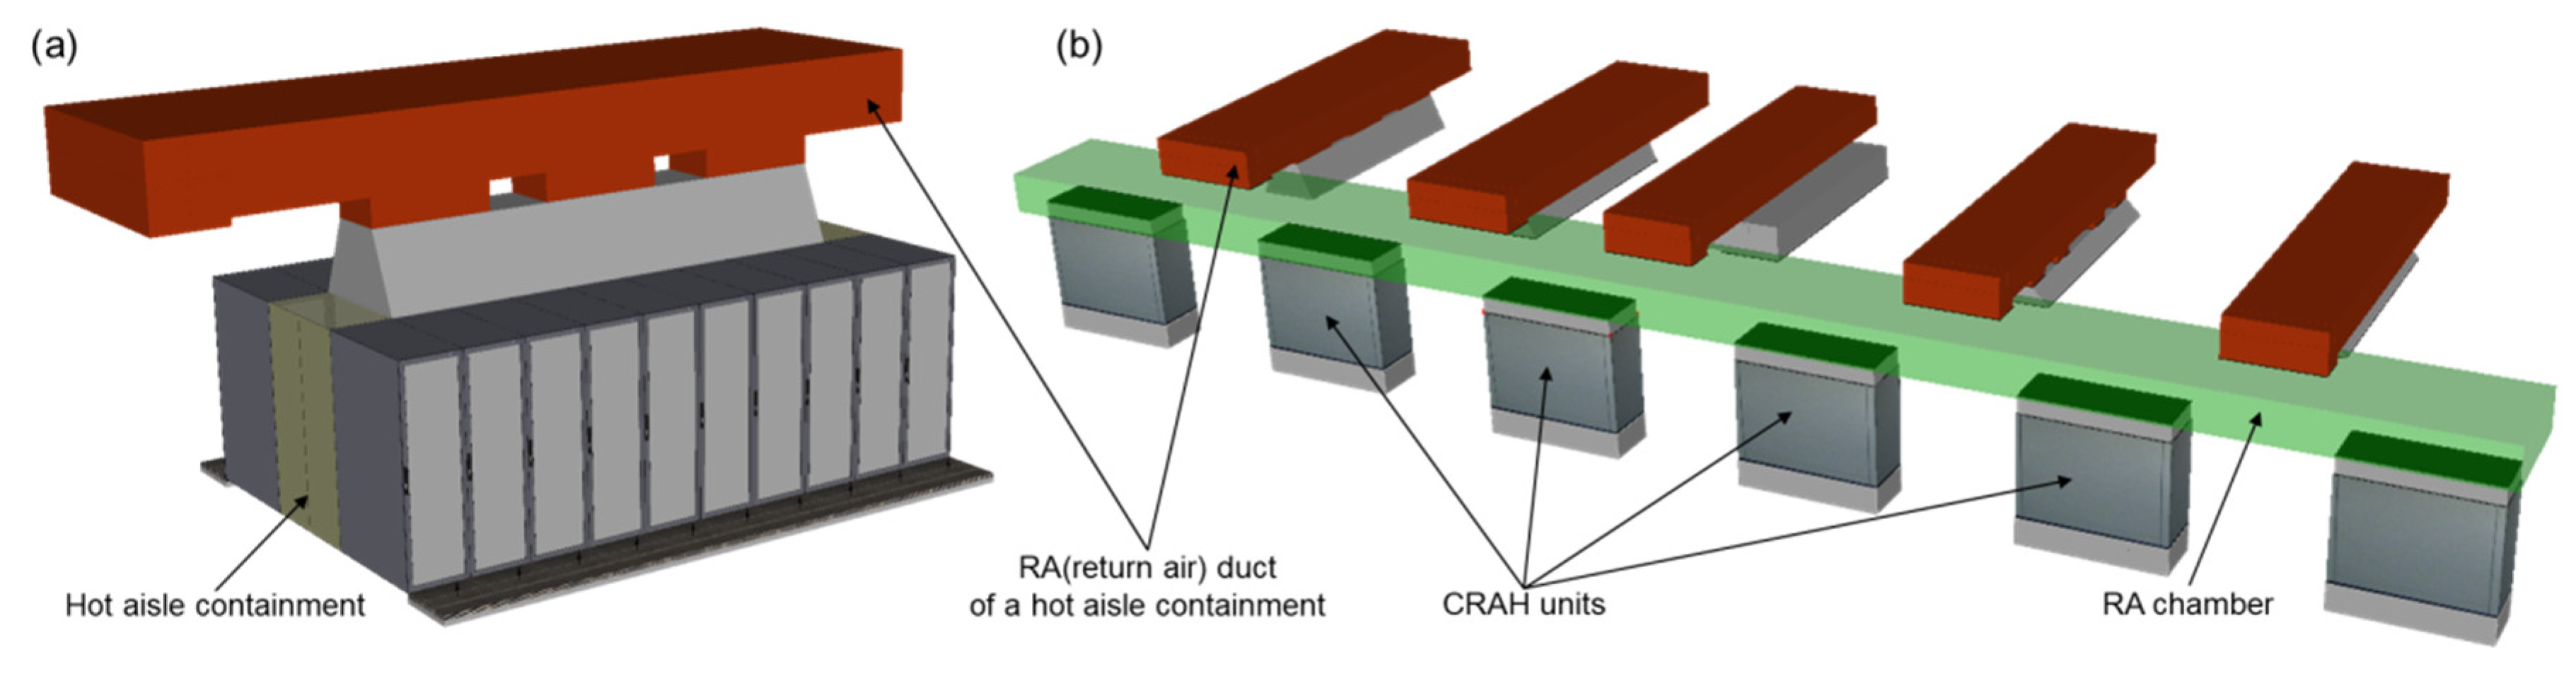
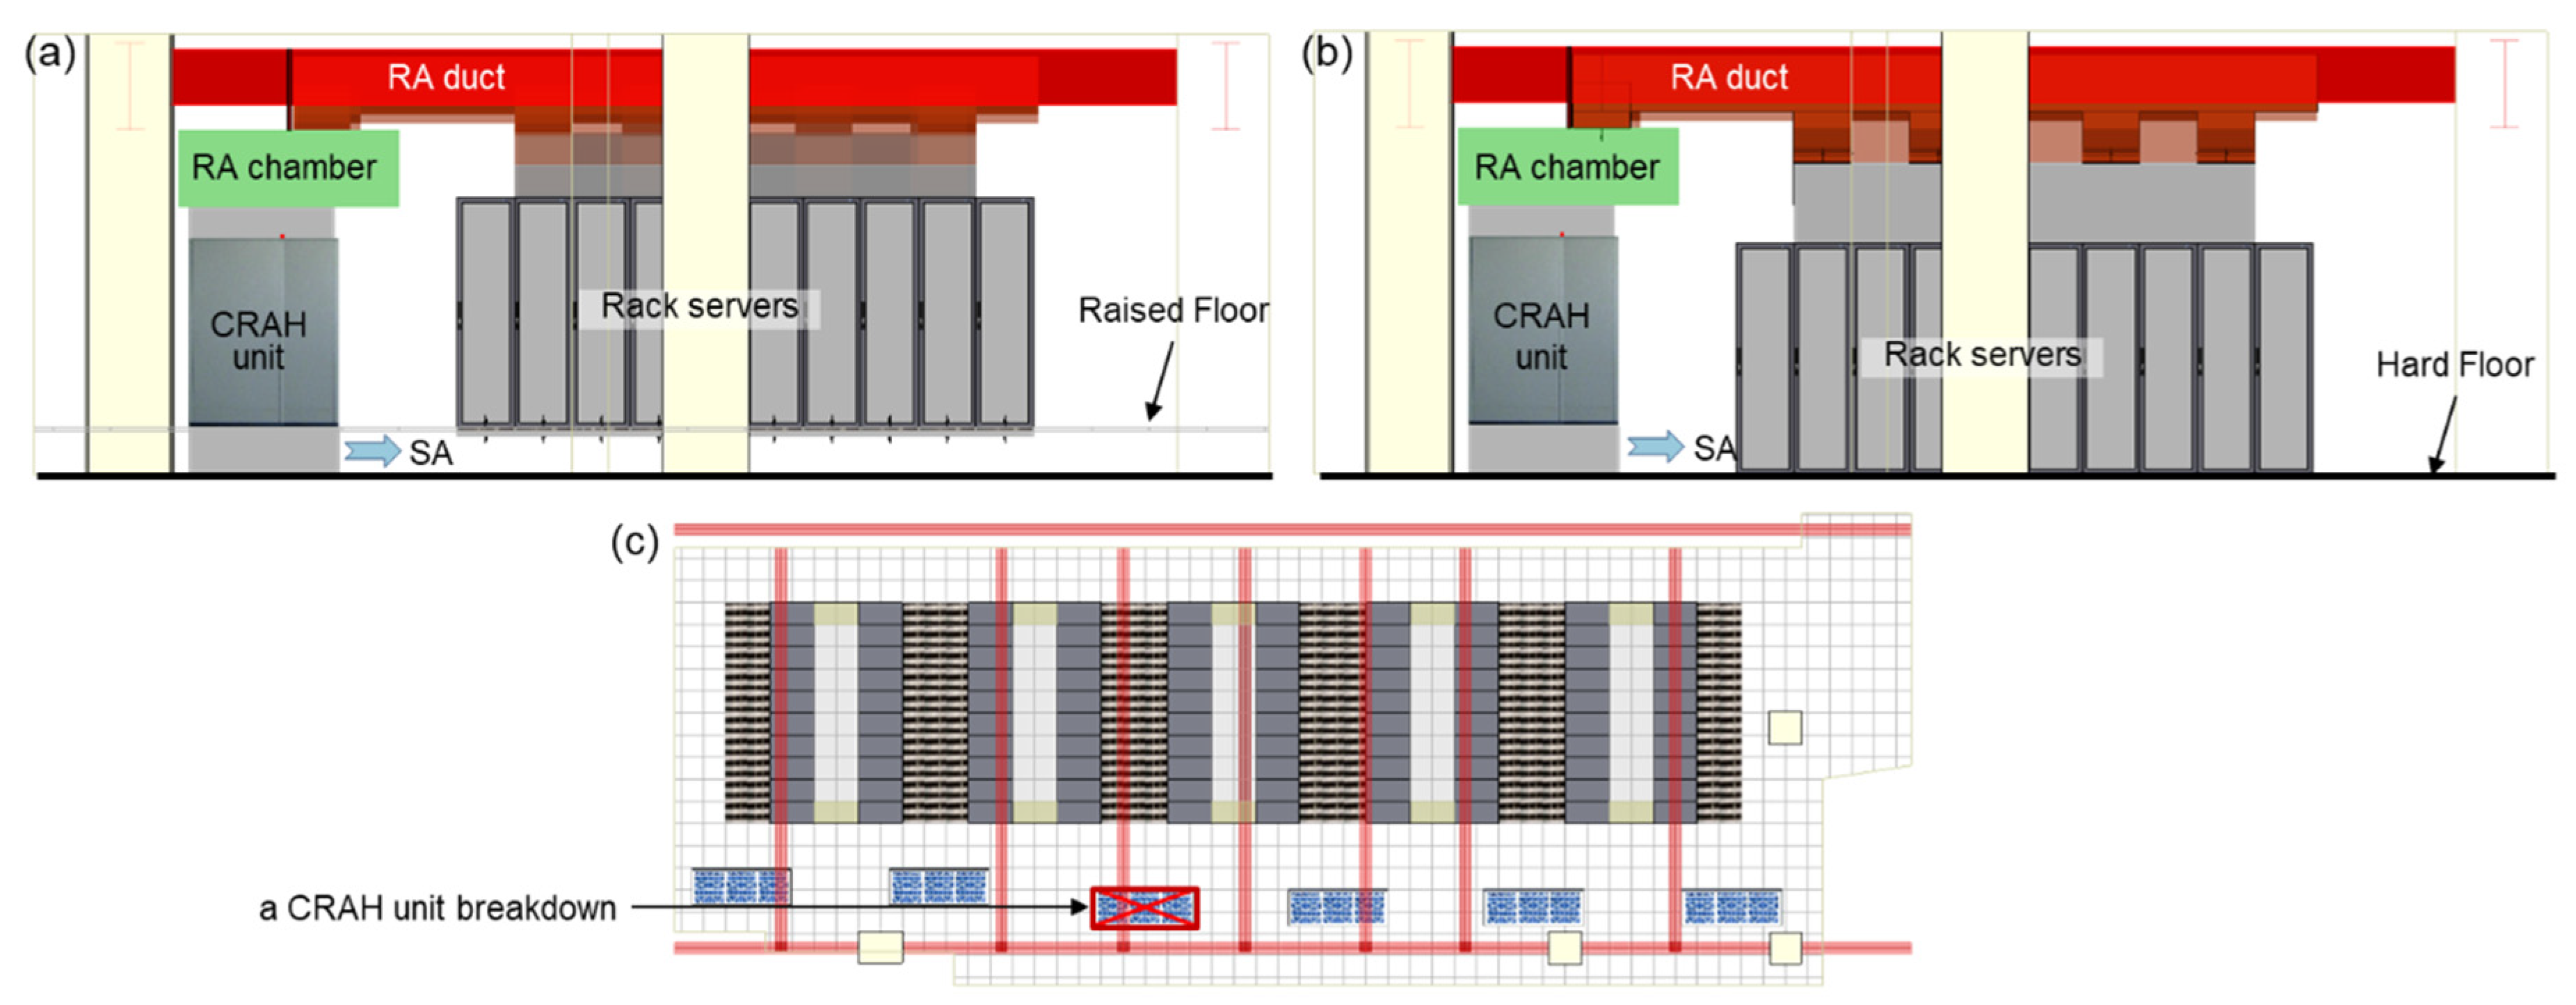
Regarding cooling fault operation, the thermal performances of the HAC with the raised floor (ALT-3) and hard floor (ALT-4) were evaluated under the condition that five out of six CRAH units operated and one unit experienced failure. For the cooling system, it was assumed that the operation of CRAH-03, which covered the high- and medium-density server racks, was stopped as depicted in
Figure 5c. As indicated, a value of N+1 for the cooling system was considered an emergency wherein the cooling capacities of the six CRAH units were increased to cover the entire IT load with five operational CRAH units.
3.2.1. Temperature Distribution in an IT Server Room
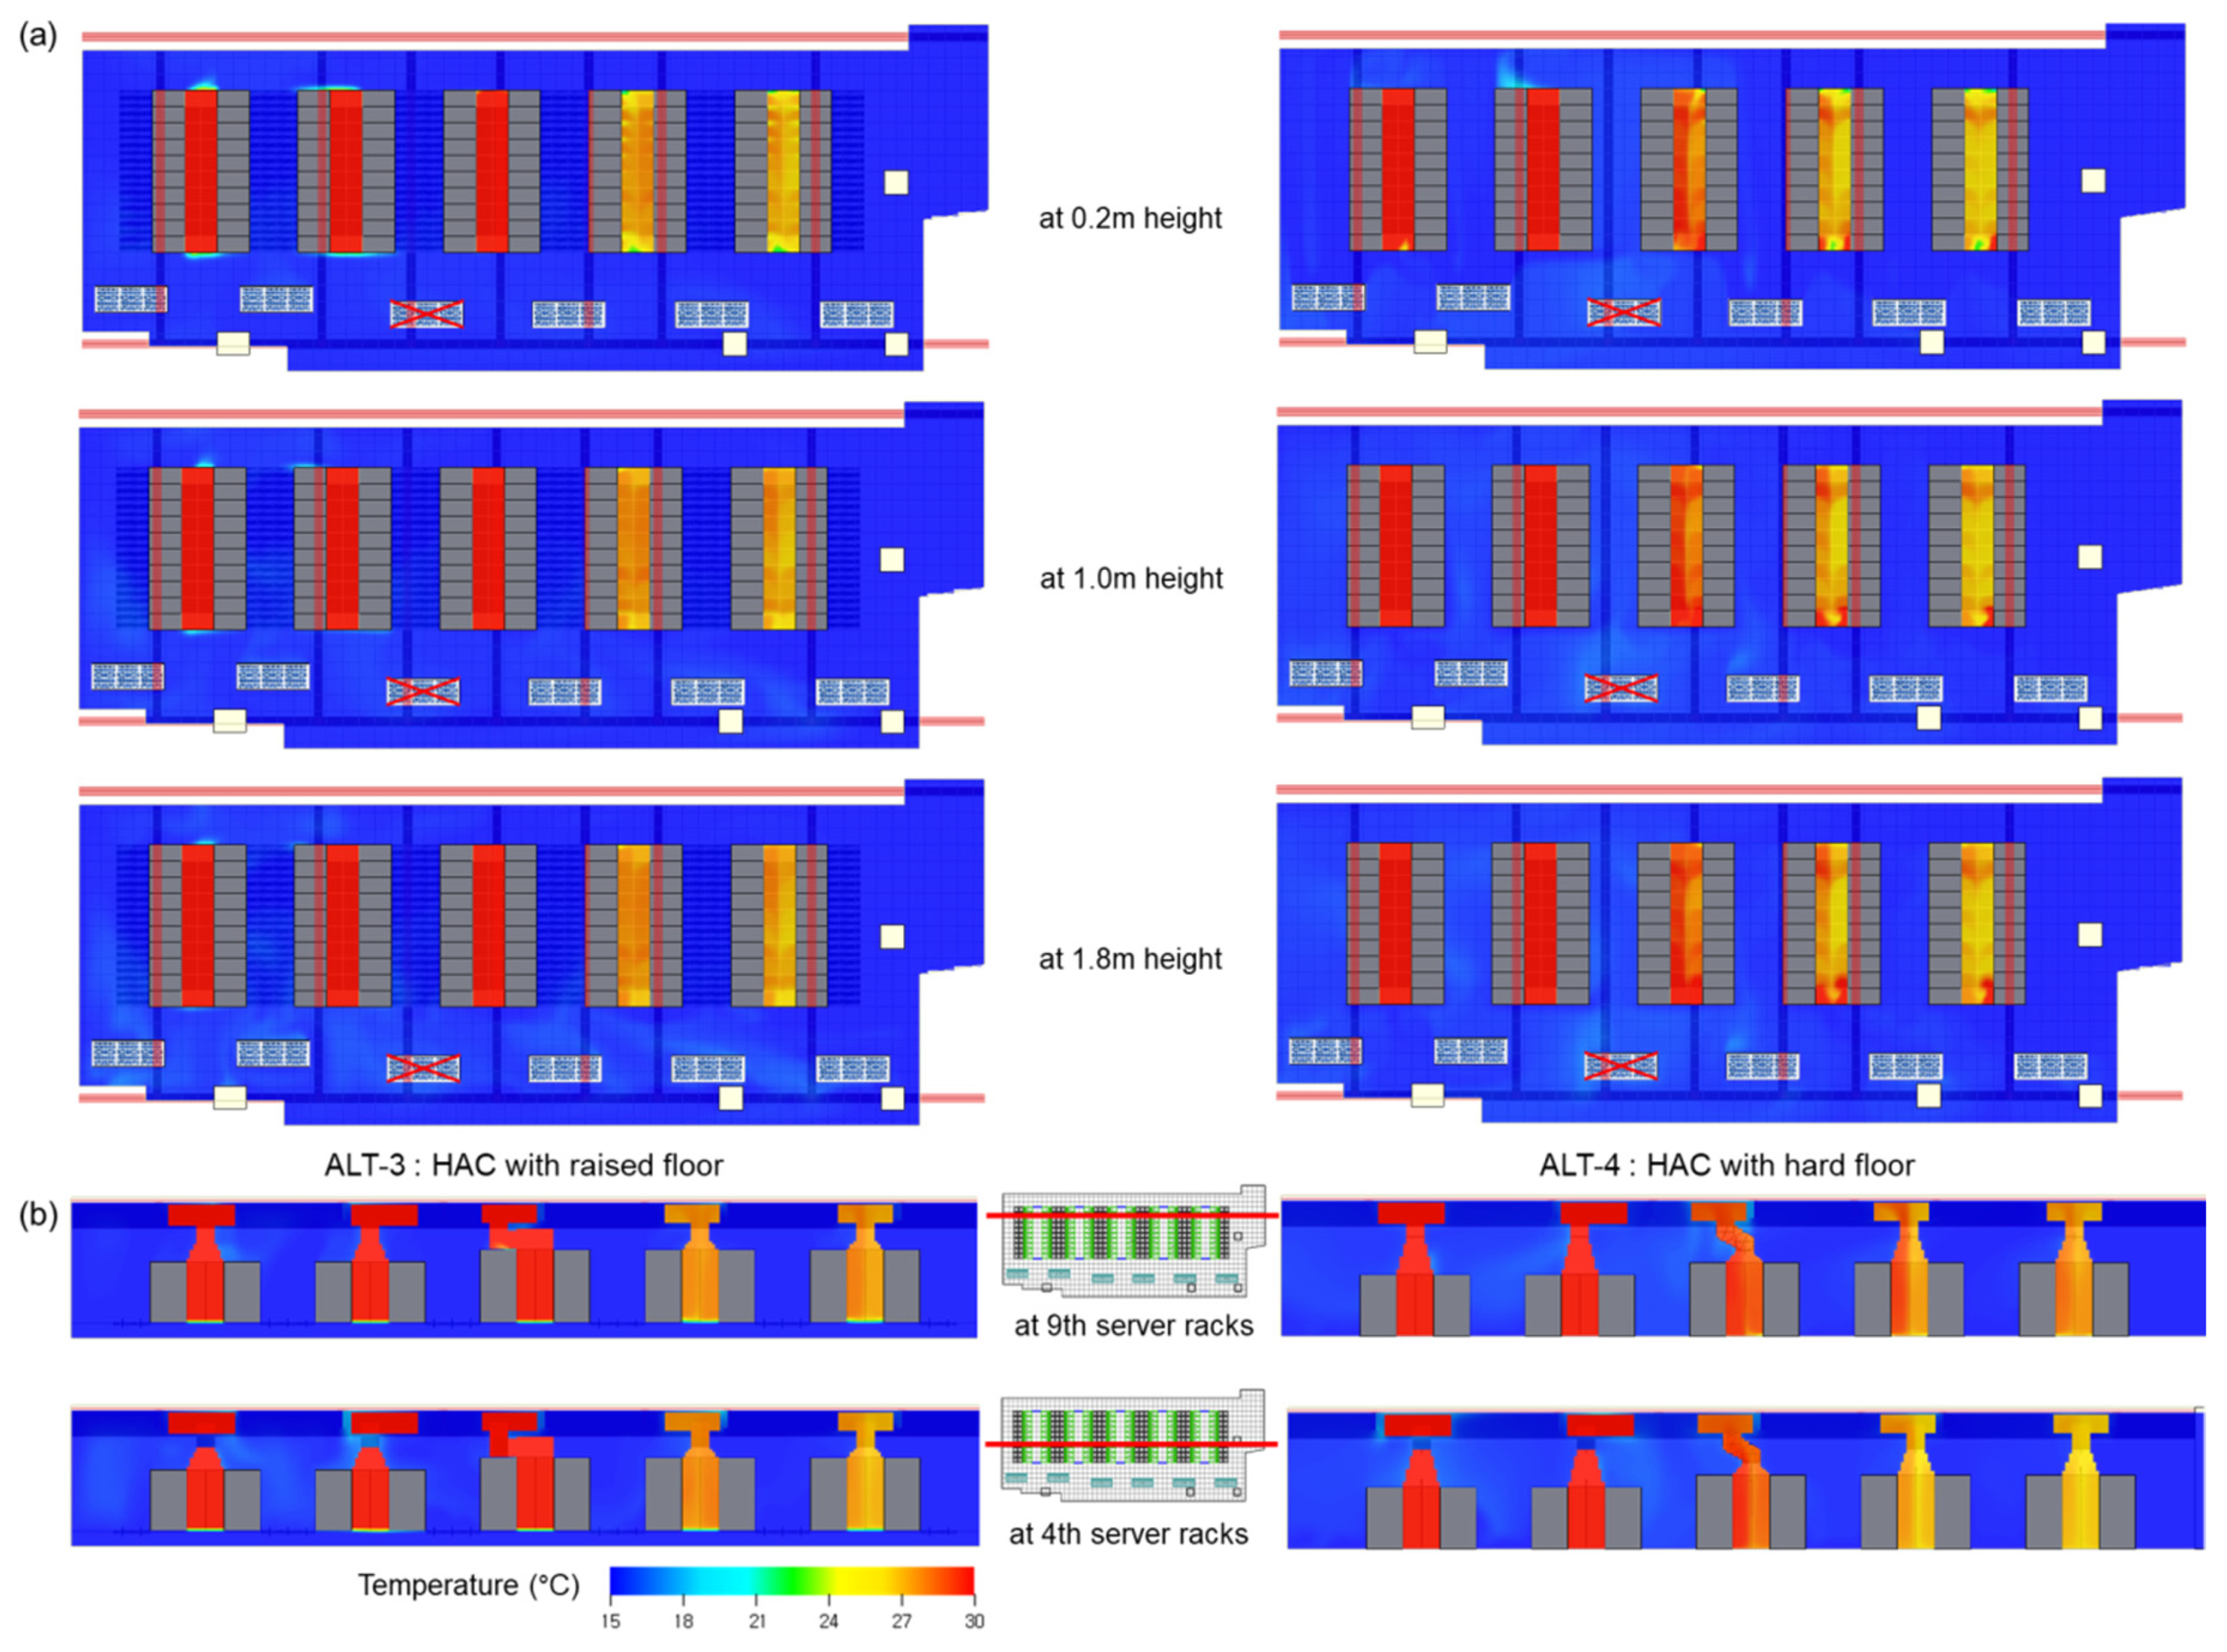
Figure 12a presents the air temperature distribution around the server racks at each height from the floor. For ALT-3 and ALT-4, approximately 16 °C was maintained for most of the cold aisles. The rise in air temperature was under excellent control in a similar manner to the normal cooling condition. This is because the cooled air that was produced from the five CRAH units was well distributed without significant heat loss in the paths to each server, even though one CRAH unit did not serve. The vertical section views of the IT server room in
Figure 12b show that a uniform distribution occurred in the cold aisles in a manner similar to the air temperature distribution of the horizontal sections for each height. The numerical analysis results under the cooling fault conditions showed that the air temperature distribution of the hot and cold aisles in the IT server room was similar for the HAC with a raised floor (ALT-3) and a hard floor (ALT-4). Almost normal IT environment maintenance was possible with the sufficient capacity of the five CRAH units.
3.2.2. Airflow Distribution in an IT Server Room
Figure 13a shows the distribution of the airflow that is discharged from the CRAH units at 0.2 m height from the floor. Compared with the normal cooling conditions in
Figure 7a, a low airflow distribution of 2 m/s or less occurred in rows D through F and it was covered by CRAH-03 because the cooled air was supplied from nearby CRAH units. In addition, the airflow velocity increased in comparison with the normal cooling conditions because the rest of the five CRAH units had to supply a larger airflow rate. The vertical section view of the cold aisle in
Figure 13b shows that high airflow velocity of 10 m/s or more to the fourth server rack position was maintained in ALT-3; the airflow velocity was approximately 6 m/s to the eighth server rack position, and 4 m/s or less for the rest. On the other hand, in ALT-4, high airflow velocity of 10 m/s or more was maintained to the eighth server rack position. The airflow velocity to the last server rack was maintained at approximately 8 m/s, thus exhibiting a relatively high-speed airflow distribution in comparison with ALT-3. As for the hot aisles, a stable airflow velocity was maintained for ALT-3 and ALT-4 due to the containment structure, and heat was effectively discharged through the ducts connected to the upper part. The CFD analysis results showed that ALT-4 exhibited a relatively higher airflow velocity than ALT-3 for the cold aisles in the IT server room. In particular, the number of sections that exhibited high-speed airflow of 10 m/s or more increased in comparison with the normal cooling conditions of ALT-1 and ALT-2. Therefore, this made it difficult to supply a proper air volume to the inlet of the server racks.
3.2.3. Inlet Air Temperature of the Server Racks
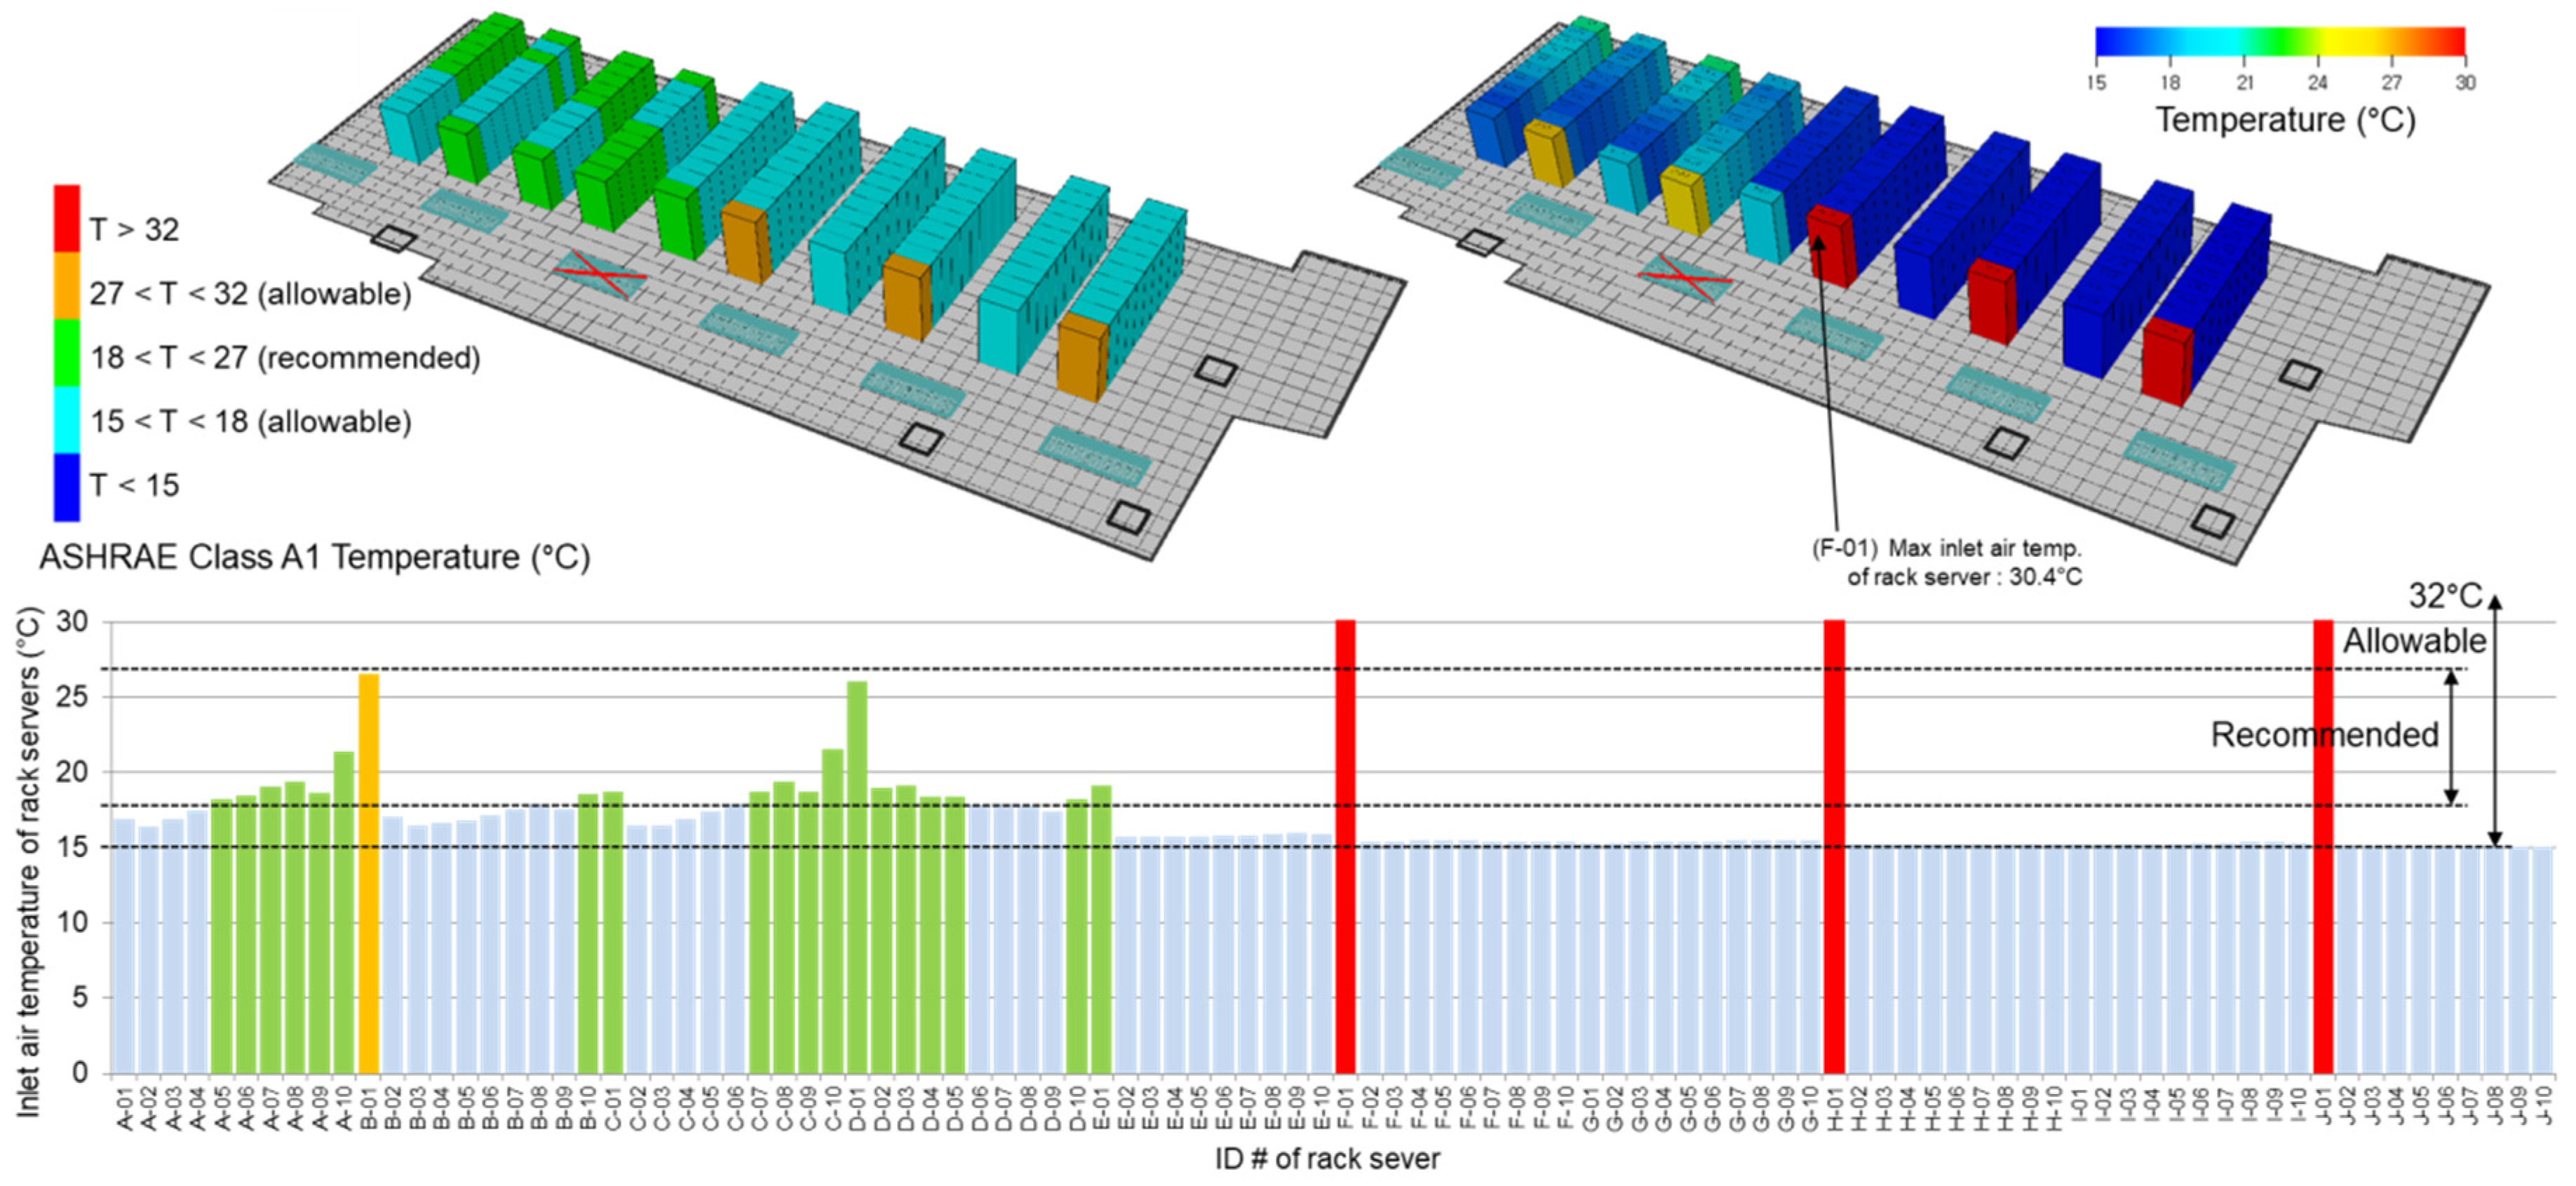
Figure 14 shows the mean inlet air temperature distribution that was supplied to the server racks of ALT-3. The IT environment was maintained within the recommended temperature range of ASHRAE for all the 100 server racks. The first server racks with high-speed airflow and the tenth server racks with low-speed airflow exhibited relatively high inlet air temperatures in comparison with the other server racks. In addition, the inlet air temperatures were higher in rows D and E in comparison with the other rows due to the downtime of CRAH-03. The maximum inlet air temperature was 20.2 °C, which is appropriate. In the case of ALT-4 in
Figure 15, five CRAH units supplied 46,000 m
3/h of cooled air at 15 °C to the cold aisles throughout the IT server room at a high speed. Due to the downtime of CRAH-03, the inlet air temperature was high in rows D and E, as sufficient air volume was not supplied to the server racks. Approximately 97% of the server racks satisfied the recommended temperature range of ASHRAE and 3% met the allowable temperature range specified by ASHRAE. Among them, the maximum inlet air temperature was as high as 30.4 °C. The simulation analysis results under the cooling fault conditions showed that the inlet air temperature distribution of the server racks was more stable for ALT-3 than for ALT-4. Even with the failure of one CRAH unit, it was possible to ensure a relatively stable supply of cooled air through the raised floor. In addition, there was no overall imbalance of the room-based cooling system when the required air volume was satisfied. As for the hard floor, the failure of one CRAH unit made it difficult to supply cooled air to the corresponding cold aisles because the server racks served as partitions to divide the space.
3.2.4. Recirculation Ratio
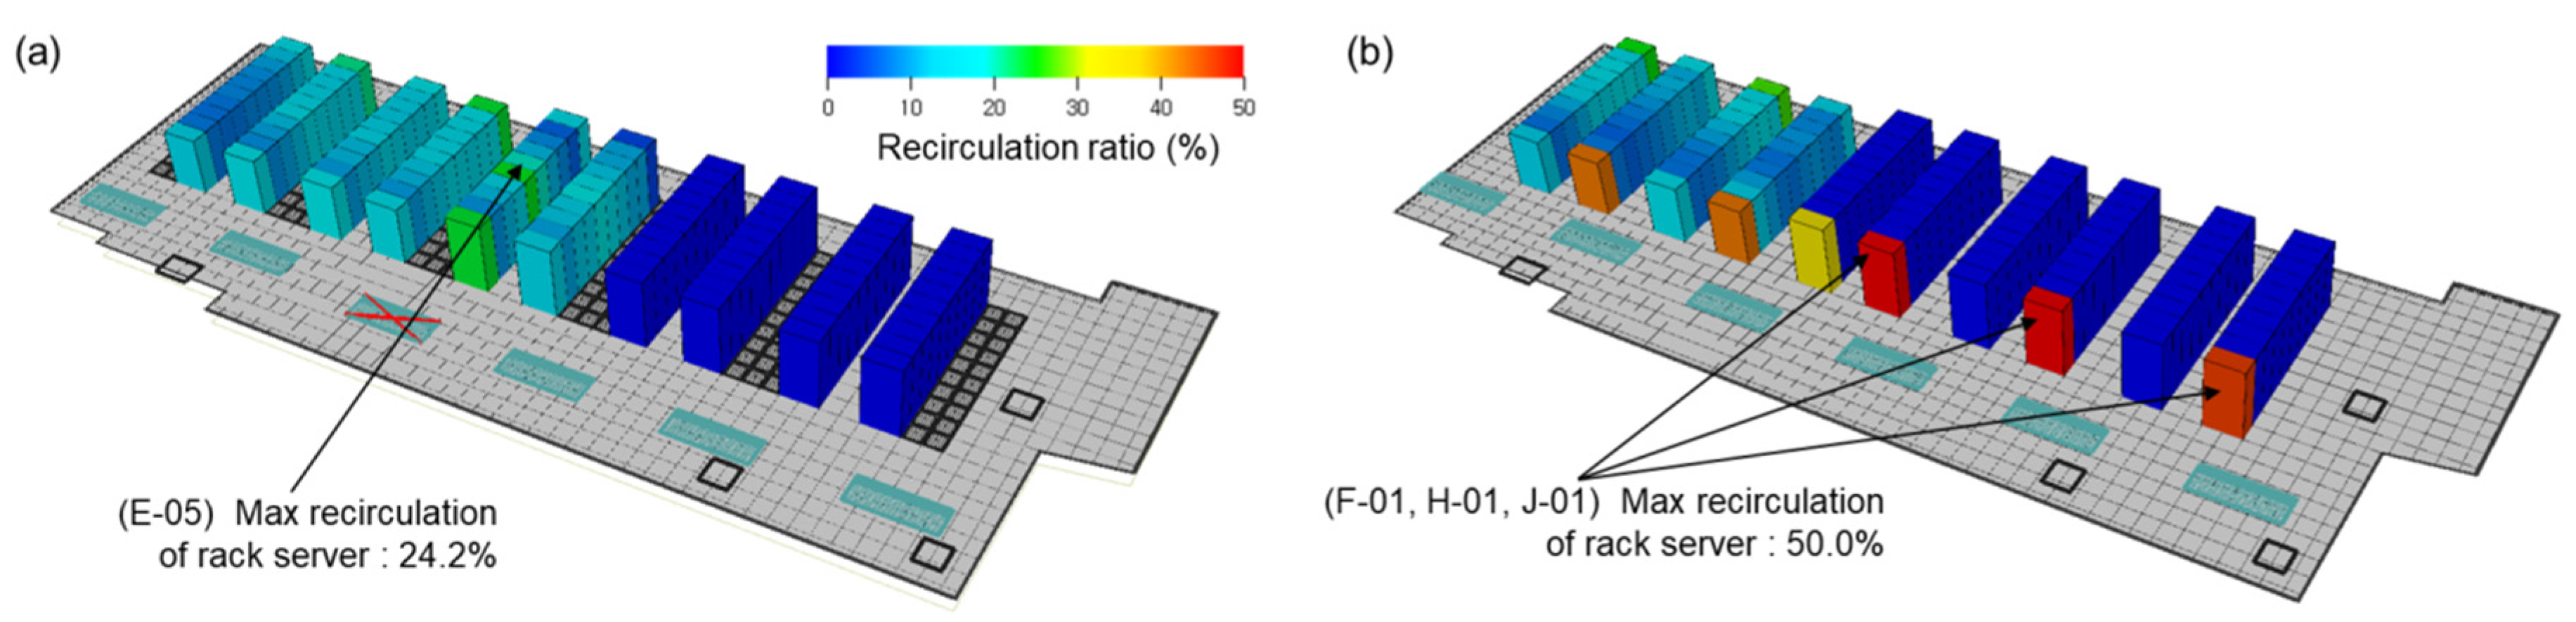
Figure 16 shows the recirculation ratios of 100 server racks. The overall distribution pattern shows that the server racks with high inlet air temperatures exhibited high recirculation ratios. Because adequate air volume was not supplied to remove the heat, recirculation occurred inside and the inlet air temperature increased. For ALT-3 and ALT-4, the air volume was not sufficient for the first server racks that were the closest to the CRAH units. The maximum recirculation ratio of ALT-3 was 24.2%. It was slightly lower than that in the normal cooling conditions, but the number of server racks with a recirculation ratio of more than 20% increased from two to four. This means that the supplied air volume was more than 20% lower than the required air volume. This was not a problem because the inlet air temperature ranged from 19.6 to 20.2 °C. In the case of ALT-4, the number of server racks with a recirculation ratio of more than 40% increased to two and the number of server racks with a serious recirculation ratio of 50% increased to three. The inlet air temperatures of these server racks were very high (~26.1–30.4 °C). The CFD analysis results under the cooling fault conditions showed that air recirculation occurred to a greater number of server racks in ALT-4 than in ALT-3, which corresponds to a 40% increase in the recirculation ratio of more than 20%. The IT environment is expected to be degraded if this phenomenon continues.
3.2.5. Operational Net Cooling Power
Table 5 shows the cooling system capacity during the operation of each CRAH unit under the cooling fault conditions. CRAH-01 and CRAH-02, which covered the high-density server racks, operated at the maximum cooling capacity. In the case of CRAH-04 through CRAH-06 for the section where medium-density server racks were installed, approximately 85% of the maximum capacity was used. The simulation analysis results under the cooling fault conditions showed that there was almost no difference in the cooling system load between the raised floor (ALT-3) and the hard floor (ALT-4). It was determined, however, that the IT environment of ALT-4 is unfavorable, even if cool air is supplied at the same temperature (15 °C) by using cooling systems with the same capacity.
4. Discussions; Cooling Efficiency Evaluation
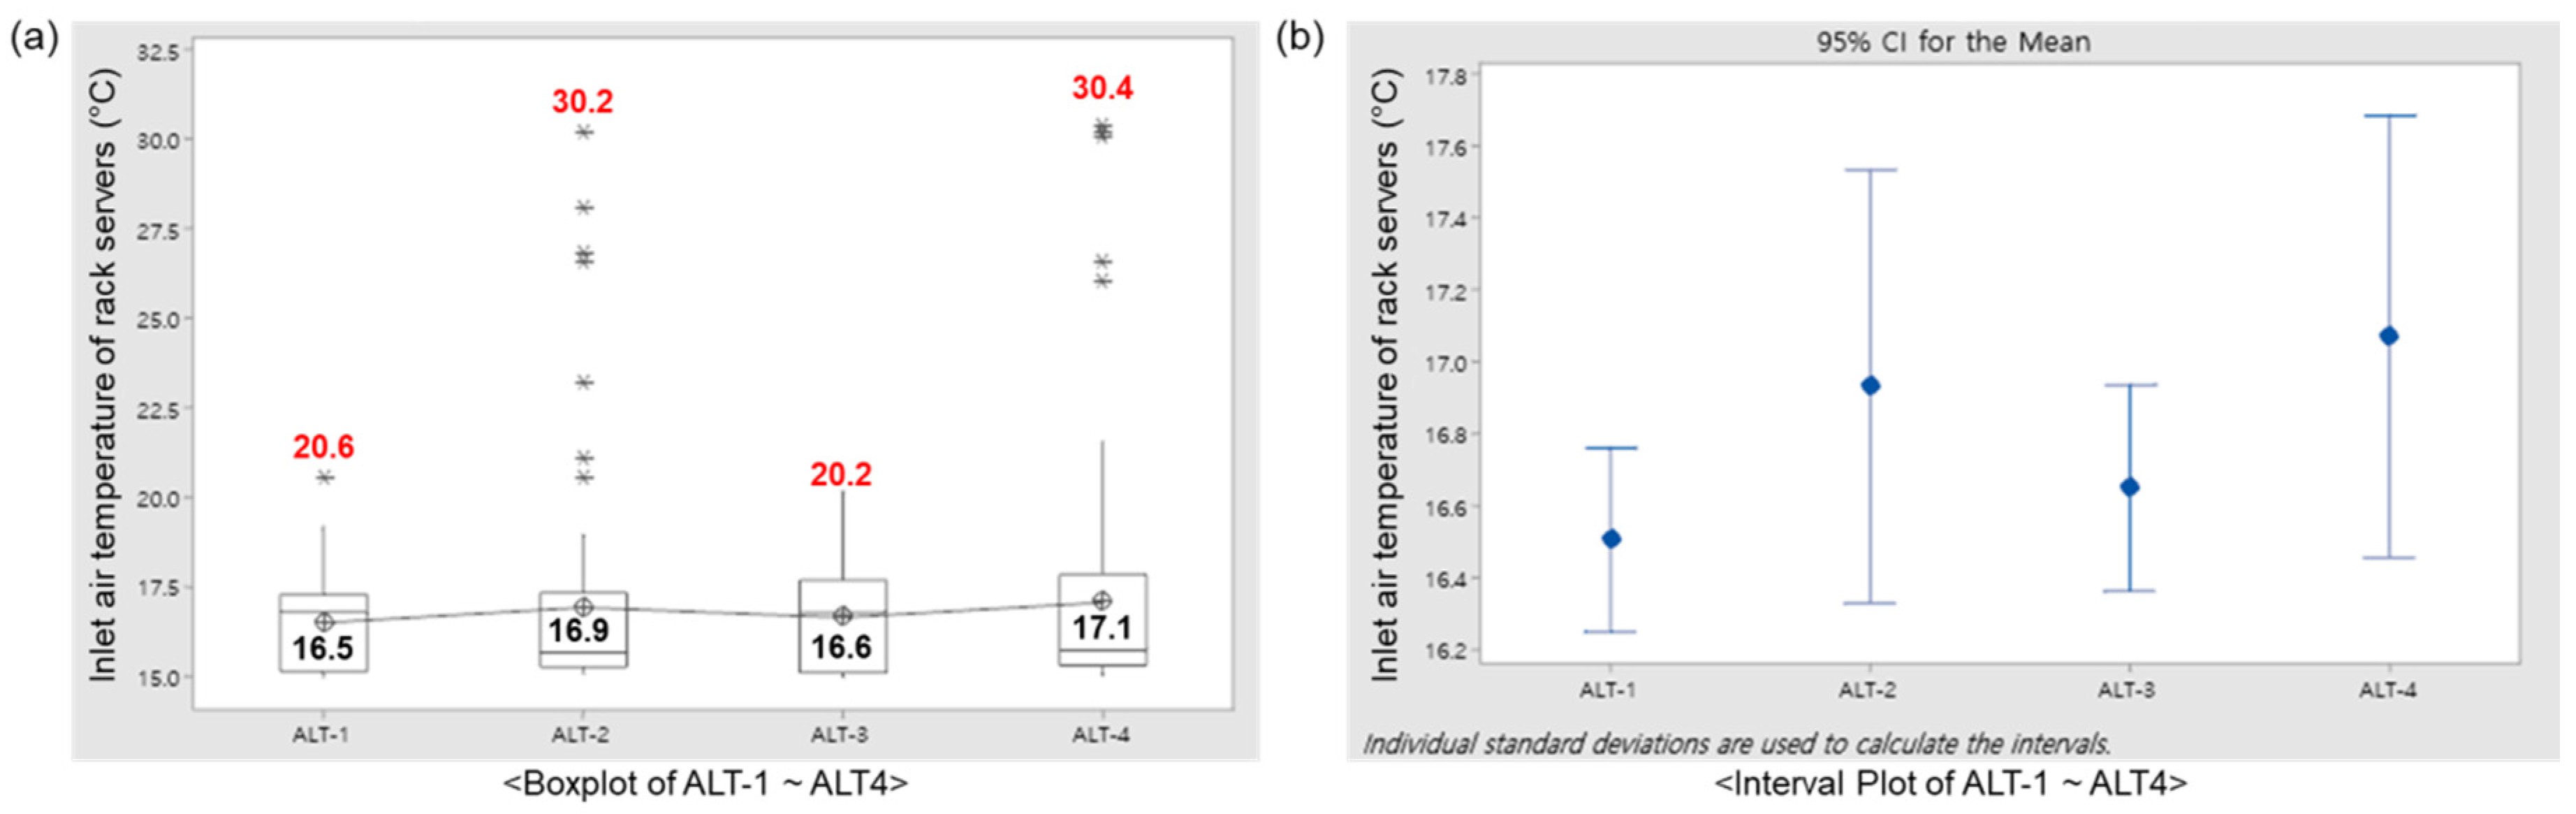
For a comparison based on the CFD simulation results, the IT environments were compared based on the inlet air temperature supplied to each server rack from ALT-1 to ALT-4, as demonstrated in
Figure 17a. The boxplot shows the distribution of the data, such as the maximum, minimum, and median values, as well as the quartiles for each alternative, along with a comparison of the four alternatives. When the normal cooling system was operated based on the supply air temperature of 15 °C, the mean inlet air temperatures of the raised floor (ALT-1) and hard floor (ALT-2) were 16.5 °C and 16.9 °C, respectively, which exhibited no significant difference. The maximum inlet air temperatures, however, were 20.6 °C and 30.2 °C, respectively, which exhibited a larger difference of 10 °C or higher. Some server racks of ALT-2 exceeded the recommended temperature range of ASHRAE. Because the IT environment was based on the raised floor with or without a normal cooling system operation, ALT-1 and ALT-3 exhibited very similar mean/maximum inlet air temperatures, standard errors, and standard deviations. In addition, based on the hard floor, the IT environment of ALT-2 was very similar to that of ALT-4. In the case of failure of the cooling system, the mean inlet air temperatures of the raised floor (ALT-3) and hard floor (ALT-4) were 16.6 °C and 17.1 °C, respectively, which exhibited a temperature increase of approximately 0.5 °C. In addition, the corresponding maximum inlet air temperatures were 20.2 °C and 30.4 °C, respectively. ALT-4 exhibited a temperature increase of 10 °C or higher, and some server racks exceeded the recommended temperature range of ASHRAE. The interval plot of the 95% confidence interval in
Figure 17b shows that the raised floor HAC systems of ALT-1 and ALT-3 maintained more uniform inlet air temperature ranges than the hard floor HAC systems of ALT-2 and ALT-4 for the normal and fault operations of the cooling system. The selection of the HAC with the raised floor over the hard floor can improve the air distribution efficiency by 28% for normal cooling conditions. Nonetheless, the hard floor HAC systems also maintained a proper IT environment.
5. Conclusions
In this study, CFD analysis was conducted to compare two air distribution methods with HAC for the same geometry of server racks in the IT room. The thermal performance of the raised floor and hard floor air distribution systems were compared and the IT environment in a reference data center was examined. Regarding the operating conditions, the difference in the thermal performance between the state in which the cooling system was normally operating, and another in which one cooling unit had failed, were analyzed. In conclusion, the HAC systems with a raised floor have higher cooling efficiency than those with a hard floor. The major results of this study can be summarized as follows.
The most important function of the HAC system is to effectively reduce the air re-circulation and by-pass by physically dividing the cold aisles and hot aisles. For all of ALT-1 through ALT-4, the temperature increase was well controlled in the entire cold aisle area because the temperature increased by approximately 1.0 °C or less from the supply air temperature of the CRAH units (15 °C). This indicates that the HAC system is effective in terms of temperature control and it maintains an appropriate IT environment.
Considering the IT environment, which is the server rack operating condition, applying the raised floor (ALT-1 and ALT-3) was determined to ensure more stable operation than applying the hard floor (ALT-2 and ALT-4). The selection of the HAC with a raised floor over a hard floor can improve the air distribution efficiency by 28%, which corresponds to a 40% reduction in the recirculation ratio of more than 20% during normal cooling conditions.
Considering the inlet air temperatures and recirculation ratios of the server racks, there was no decisive difference between the normal cooling condition in which all CRAH units operated and the cooling fault condition in which one unit did not operate, thus severely degrading the IT environment. For the stable operation of all server racks while one CRAH unit is not operating, the capacity of the total cooling system must be N + 1 or higher.
Even under normal cooling conditions, the velocity of the airflow discharged from the CRAH units is significantly high since the required air volume is large. In addition, a smaller temperature difference between the server rack inlet and outlet requires greater air volume. For an ordinary air volume, the velocity of the airflow discharged from the CRAH units is 10 m/s or higher. This high-speed airflow is most likely to cause a recirculation problem in the server racks that are close to the CRAH units.
To address this problem, it is necessary to consider methods for reducing the airflow velocity inside the raised floor or on the hard floor. This includes installing artificial resistive films that can delay an extremely fast airflow.
In the future, further investigations using sensitivity analysis for cooling energy savings is required through field measurement of the HAC system applied as a result of this study. We believe that it is necessary to present the effects of direct cooling energy reduction and coefficient of performance (COP) improvement according to the change in the supply air temperature.


