Article

Evaluation of Clearance to Stop Requirements in A Seismically Isolated Nuclear Power Plant

1
Korea Atomic Energy Research Institute, Daejeon 34057, Korea
2
Department of Structural Engineering, University of California, San Diego, CA 92093, USA
*
Author to whom correspondence should be addressed.
Energies 2020, 13(22), 6156; https://doi.org/10.3390/en13226156
Submission received: 21 October 2020 / Revised: 18 November 2020 / Accepted: 20 November 2020 / Published: 23 November 2020

Abstract

:
Seismically isolated nuclear power plants (NPPs) can provide substantial benefits towards reducing the failure probability of NPPs, especially for beyond design basis earthquake shaking. One risk posed by seismic isolation is the potential for pounding to a stop or moat wall, with currently little guidance provided by design standards on how to address this concern. In this paper, a structural model of an isolated NPP based on the Advanced Power Reactor 1400 MW is enveloped with moat walls and advanced bearing models. The bearing models account for large strain behavior through failure based on full-scale experiments with lead rubber bearings (LRBs). Using these analytical models and a measured ultimate property diagram from LRB failure tests, the range of clearance to the stop considering the performance criteria for the NPP is investigated. Although the analysis results are dependent on the particular models, ground motions, and criteria employed, this research provides an overview of the seismic response and performance criteria of an isolated NPP considering the clearance to the stop.

1. Introduction

Seismic isolation systems represent a promising strategy to improve the seismic performance of a structure under strong ground motions that reduces the vibration transferred to the structure by inserting a flexible isolation layer at the base that can sustain large displacements [1]. Although there are some remaining issues in the application of seismic isolation systems to nuclear power plants(NPPs), such as the durability of the isolators and design- and construction-related issues, the use of seismic isolation has increased gradually from the first seismically isolated NPP in Koeberg, South Africa in the 1970s [2,3]. Research on various types of isolators including experimental investigations, numerical modeling techniques, static and dynamic stability analysis, and aging has been conducted to address the issues [4,5,6,7,8,9]. With stricter safety regulations than other structures, it is critical that NPPs maintain their structural integrity against severe external hazards, including earthquakes. The application of seismic isolation to NPPs can allow for designs to meet the requirements in high seismic zones or increase the margin of safety for unexpected motions in regions with lower seismic risk.
One important step in investigating the seismic performance of a base-isolated NPP is the modeling of the structure and the isolation system. In this research, an NPP model was built based on the APR1400 (Advanced Power Reactor 1400 MW) from the Republic of Korea with lead rubber bearings (LRBs) used for the isolation system. The structural model was initially developed by KEPCO E & C (Korea Electric Power Corporation Engineering and Construction Company, Gimcheon-si, Korea), which is in charge of the APR1400 design, and later converted to OpenSees in collaboration with the University of California, Berkeley [10]. The model was then modified for the current study as well as related research to include moat walls [11] and advanced bearing models to capture the nonlinear characteristics of the LRBs [12]. The bearing models focus on capturing experimental results at large shear strain to better reflect strong ground motions. In the present work, the response of an isolated NPP including the displacement of the isolation system and floor response spectra (FRS) is investigated using the analytical model combining both structural and bearing models.
The displacement capacity of the isolation system is a critical parameter to consider in the performance criteria of isolated NPPs. Displacements must be sustained by the isolation bearings themselves as well as the umbilical lines crossing the isolation plane. The capacity of the isolators designed for the APR1400 was tested by the Korea Atomic Energy Research Institute (KAERI) focusing on their ultimate shear strength under the expected range of vertical loads [13,14]. With the experimental results and an analytically obtained vertical load distribution in the isolation system, it has been concluded that isolator shear strain failure can be quantified as a failure parameter. In this work, a sufficient capacity of the umbilical lines that cross the isolation boundary was assumed for relative displacement, and thus, the failure of the umbilical lines was not considered.
The key objective of this paper is to examine the performance criteria of seismically isolated NPPs, particularly the clearance to the stop (CS), as suggested by NUREG [15] and ASCE [16]. A physical stop is necessary for seismically isolated NPPs to ensure the mean annual frequency of failure of the isolation system is very small [15]. The CS, which refers to the horizontal distance between the superstructure of isolated NPP and the physical stop [16], is an important matter affecting the risk assessment of isolated NPPs, but few studies have evaluated CS. Kumar [17] calculated CS considering responses from various ground motions but the capacity of the isolation system was not considered. In the current paper, both numerical simulations and the experimental results from the bearing test program are considered in evaluating the range of CS. The lower and upper bounds of CS are suggested from the analytical displacement response and the experimental capacity of the isolators, respectively.

2. Models for Numerical Analysis

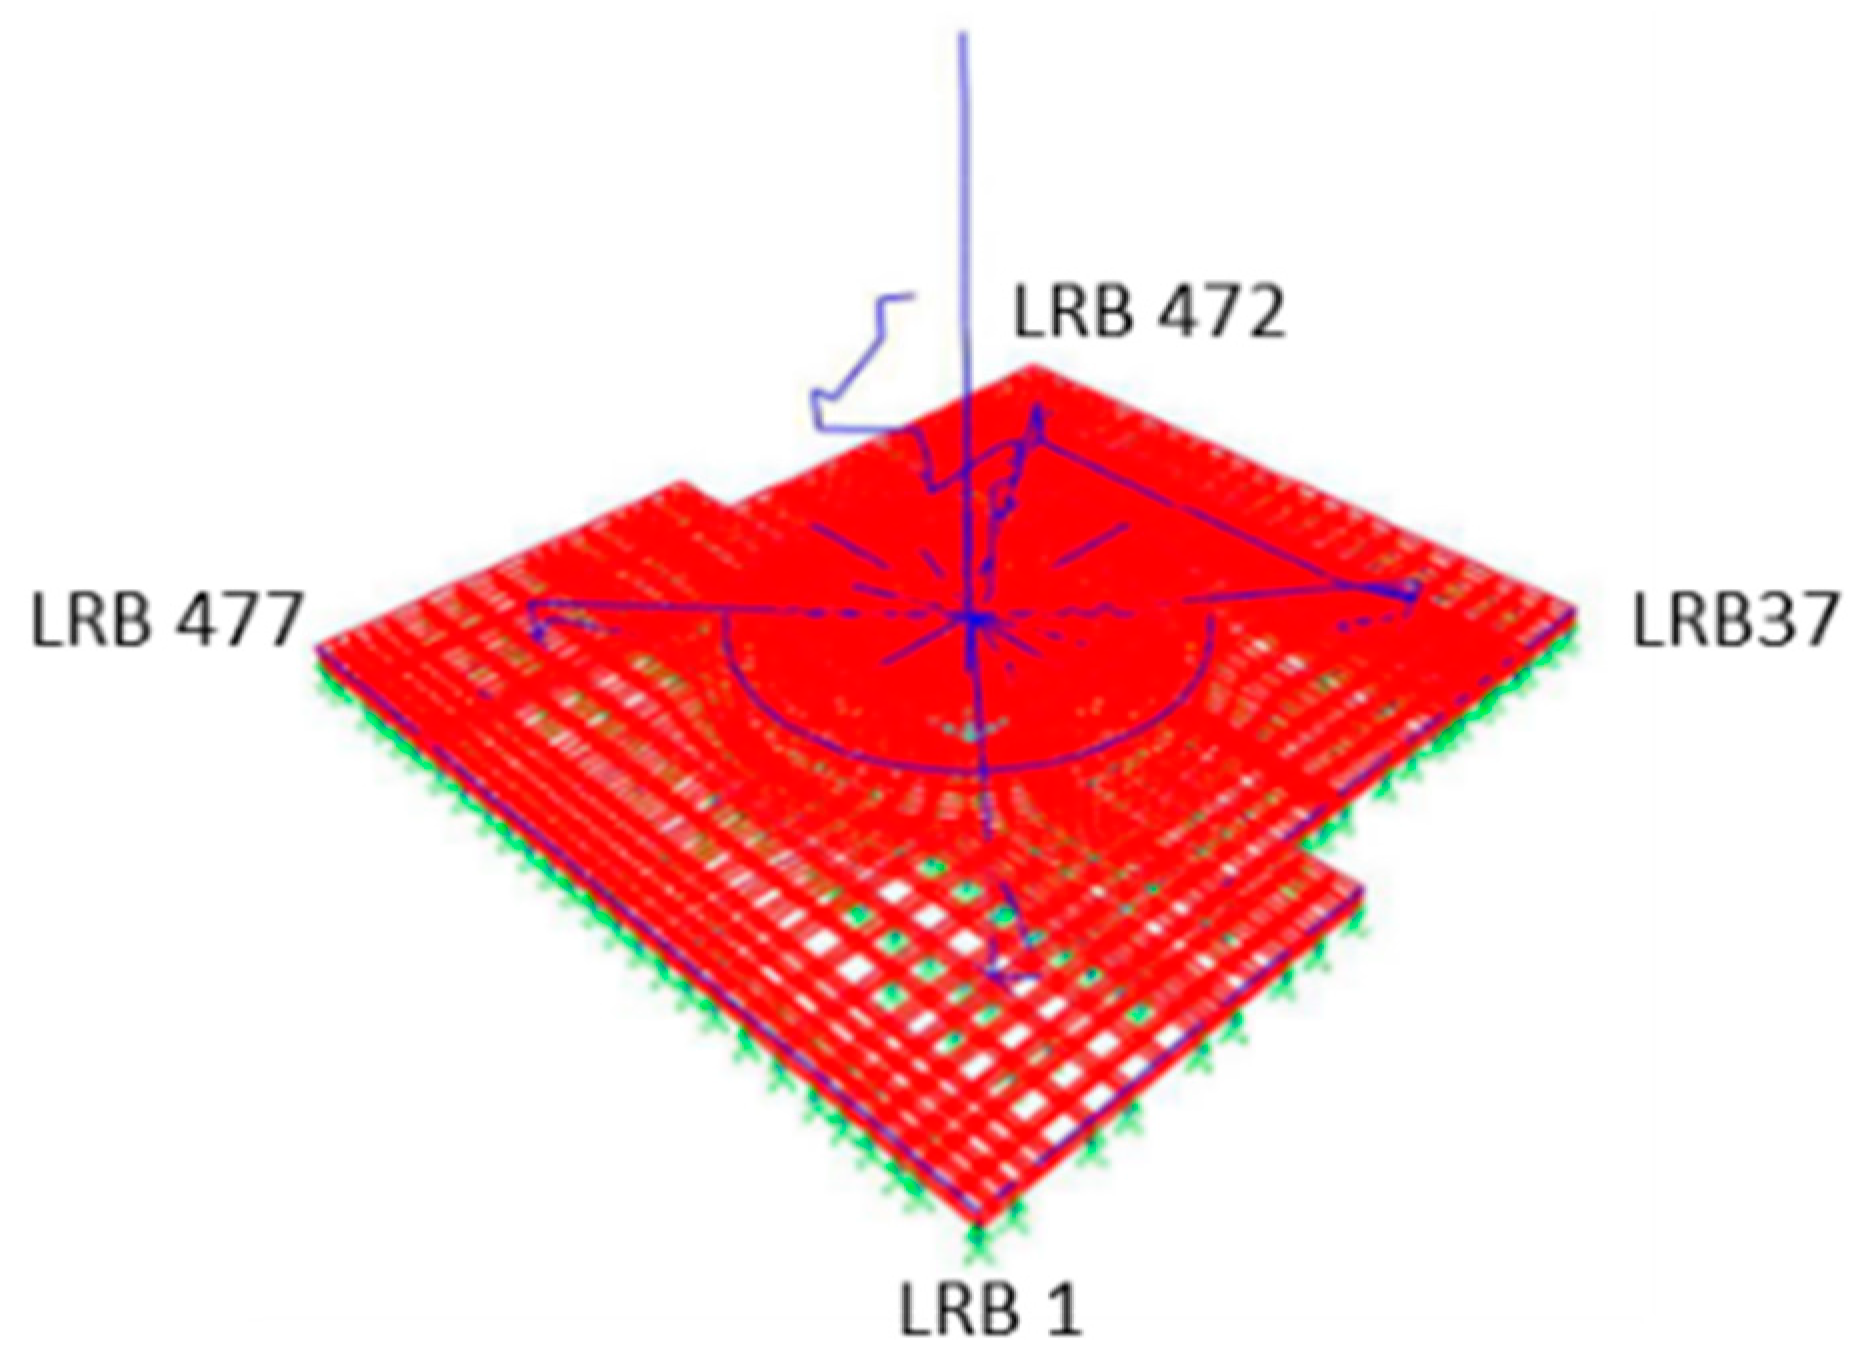
2.1. Structural Model of the APR1400
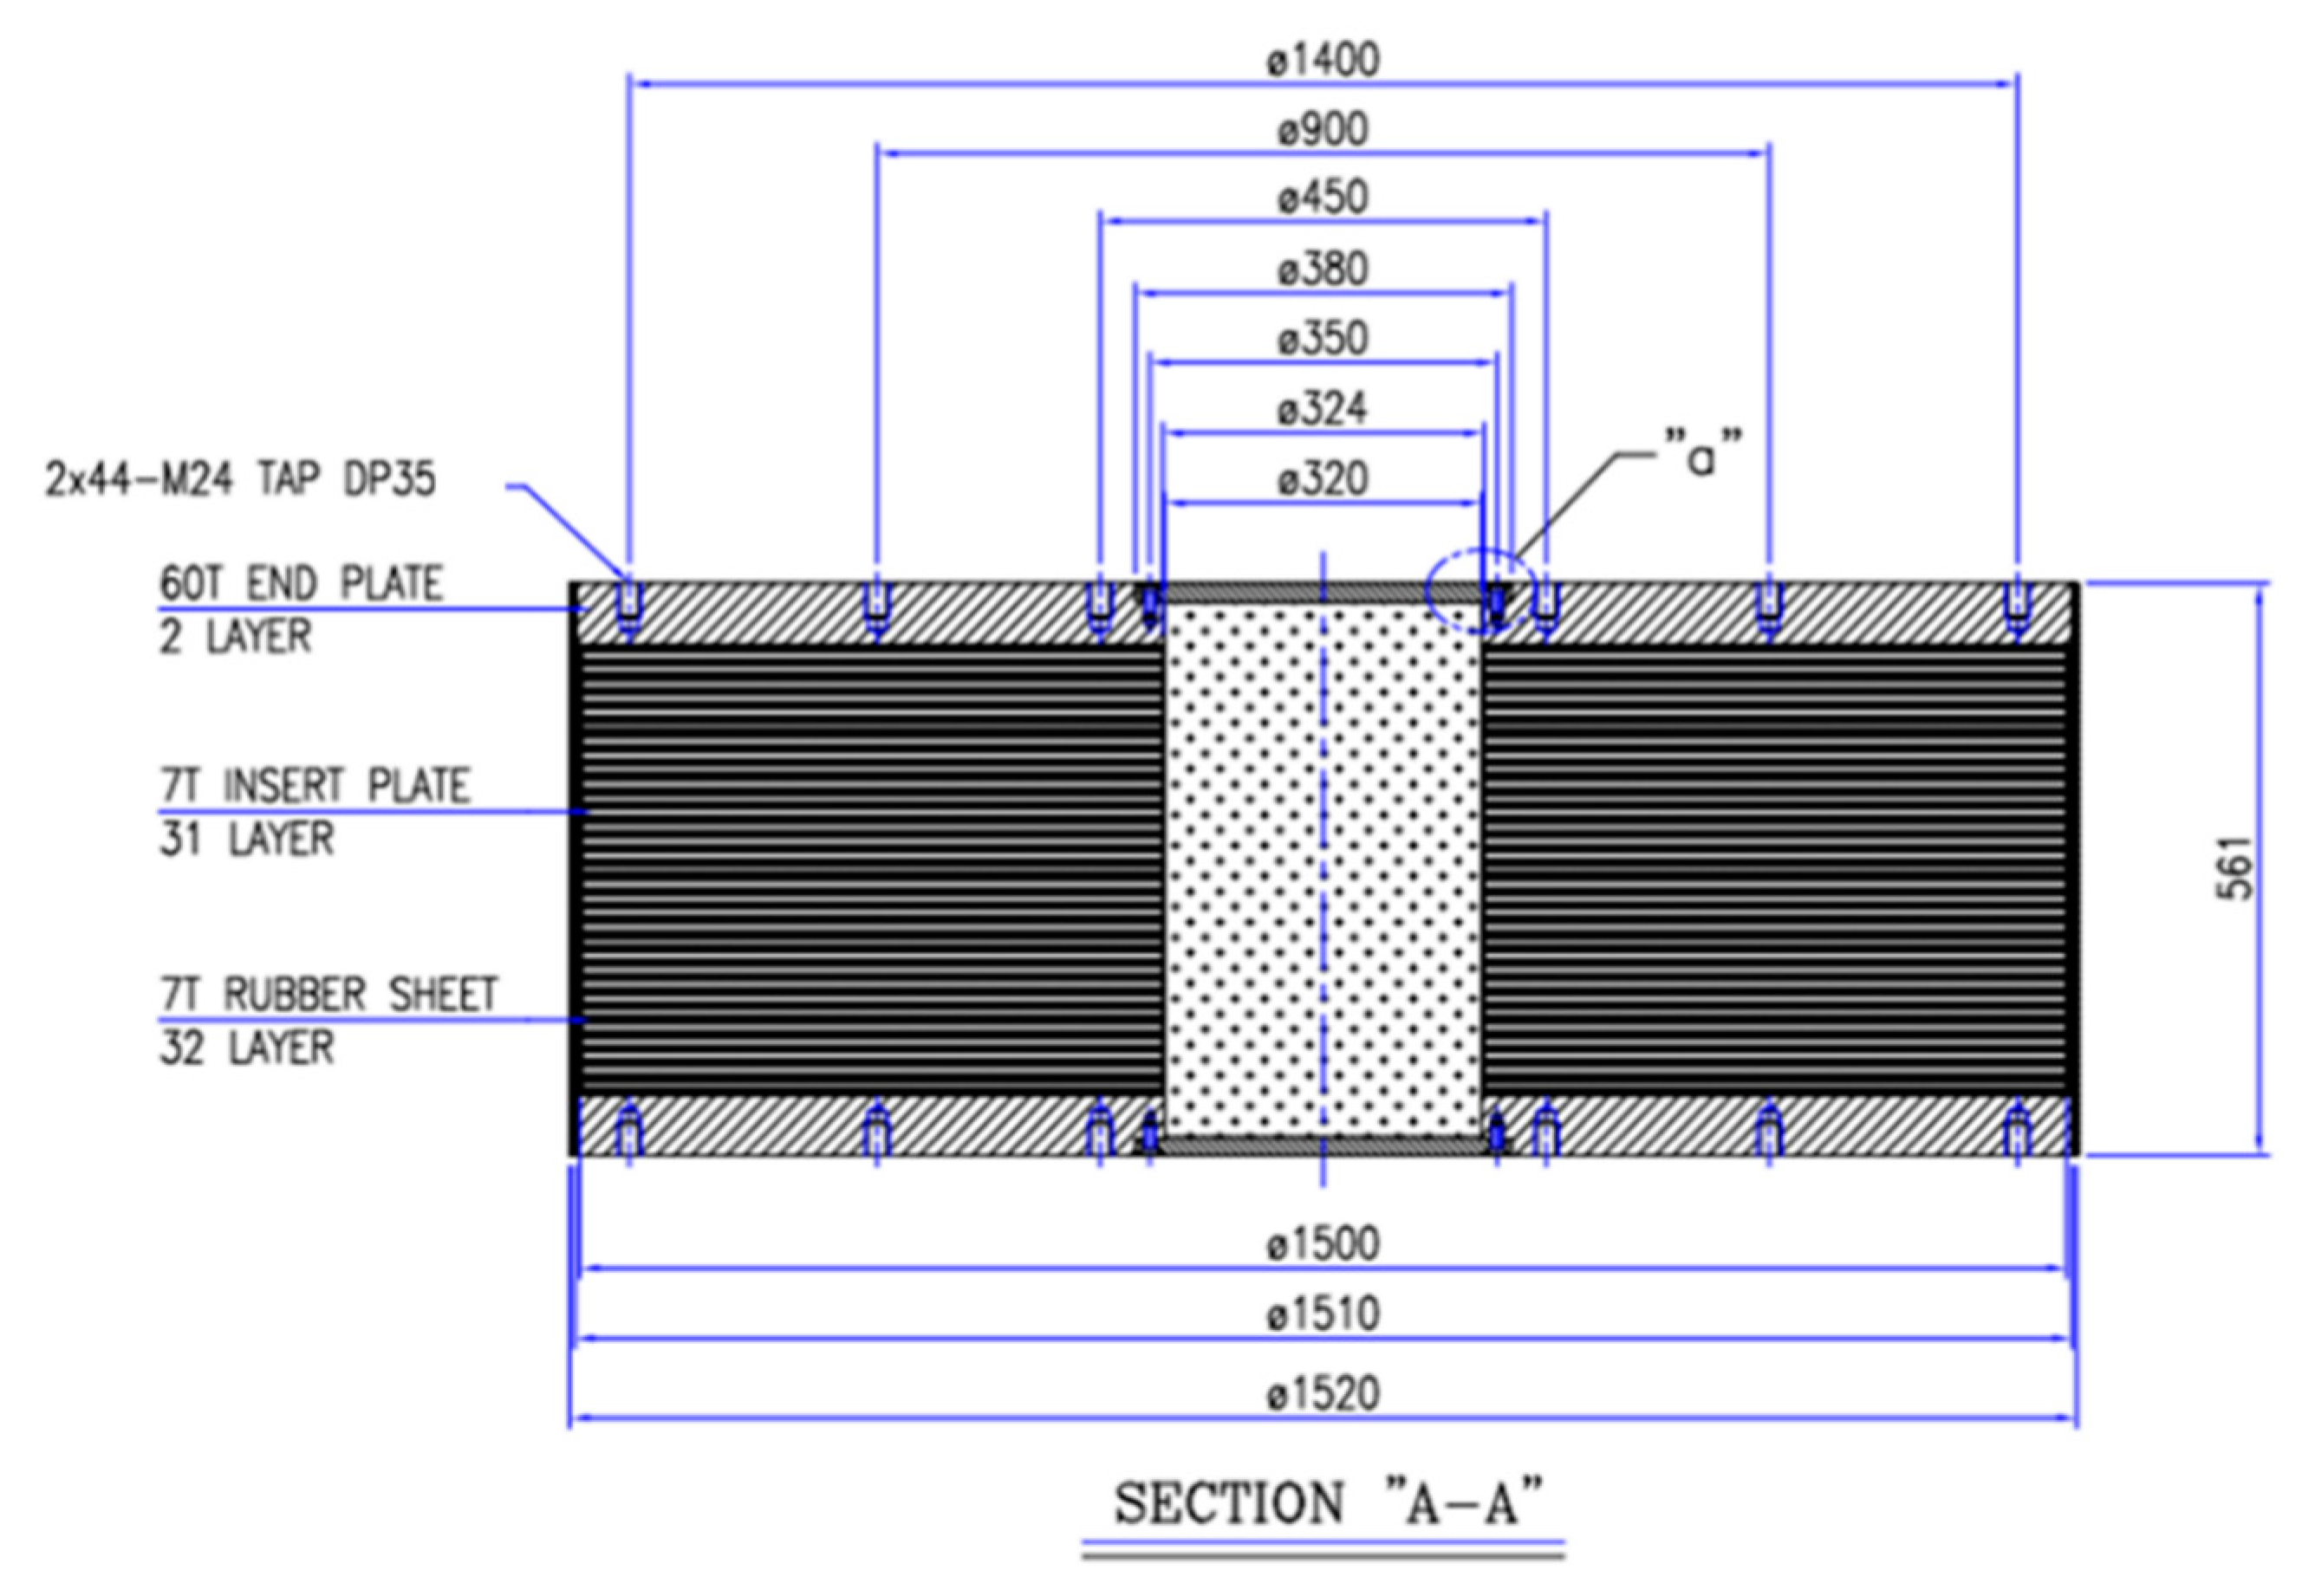
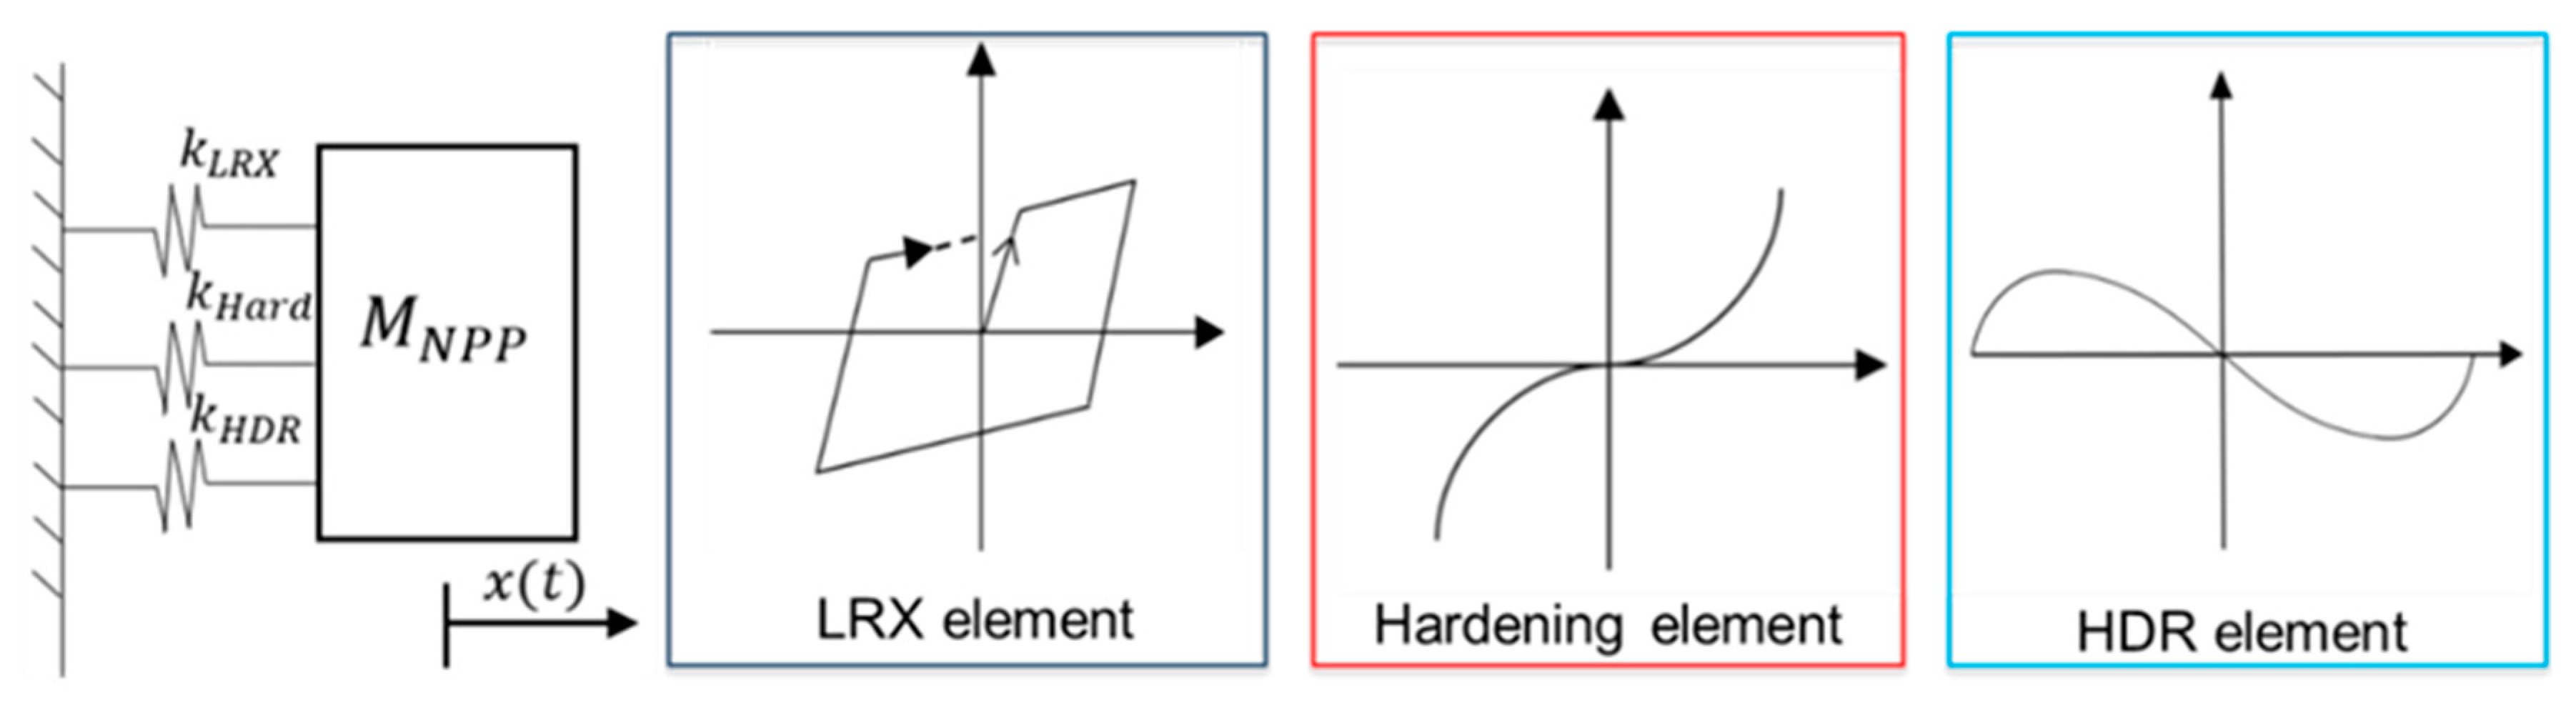
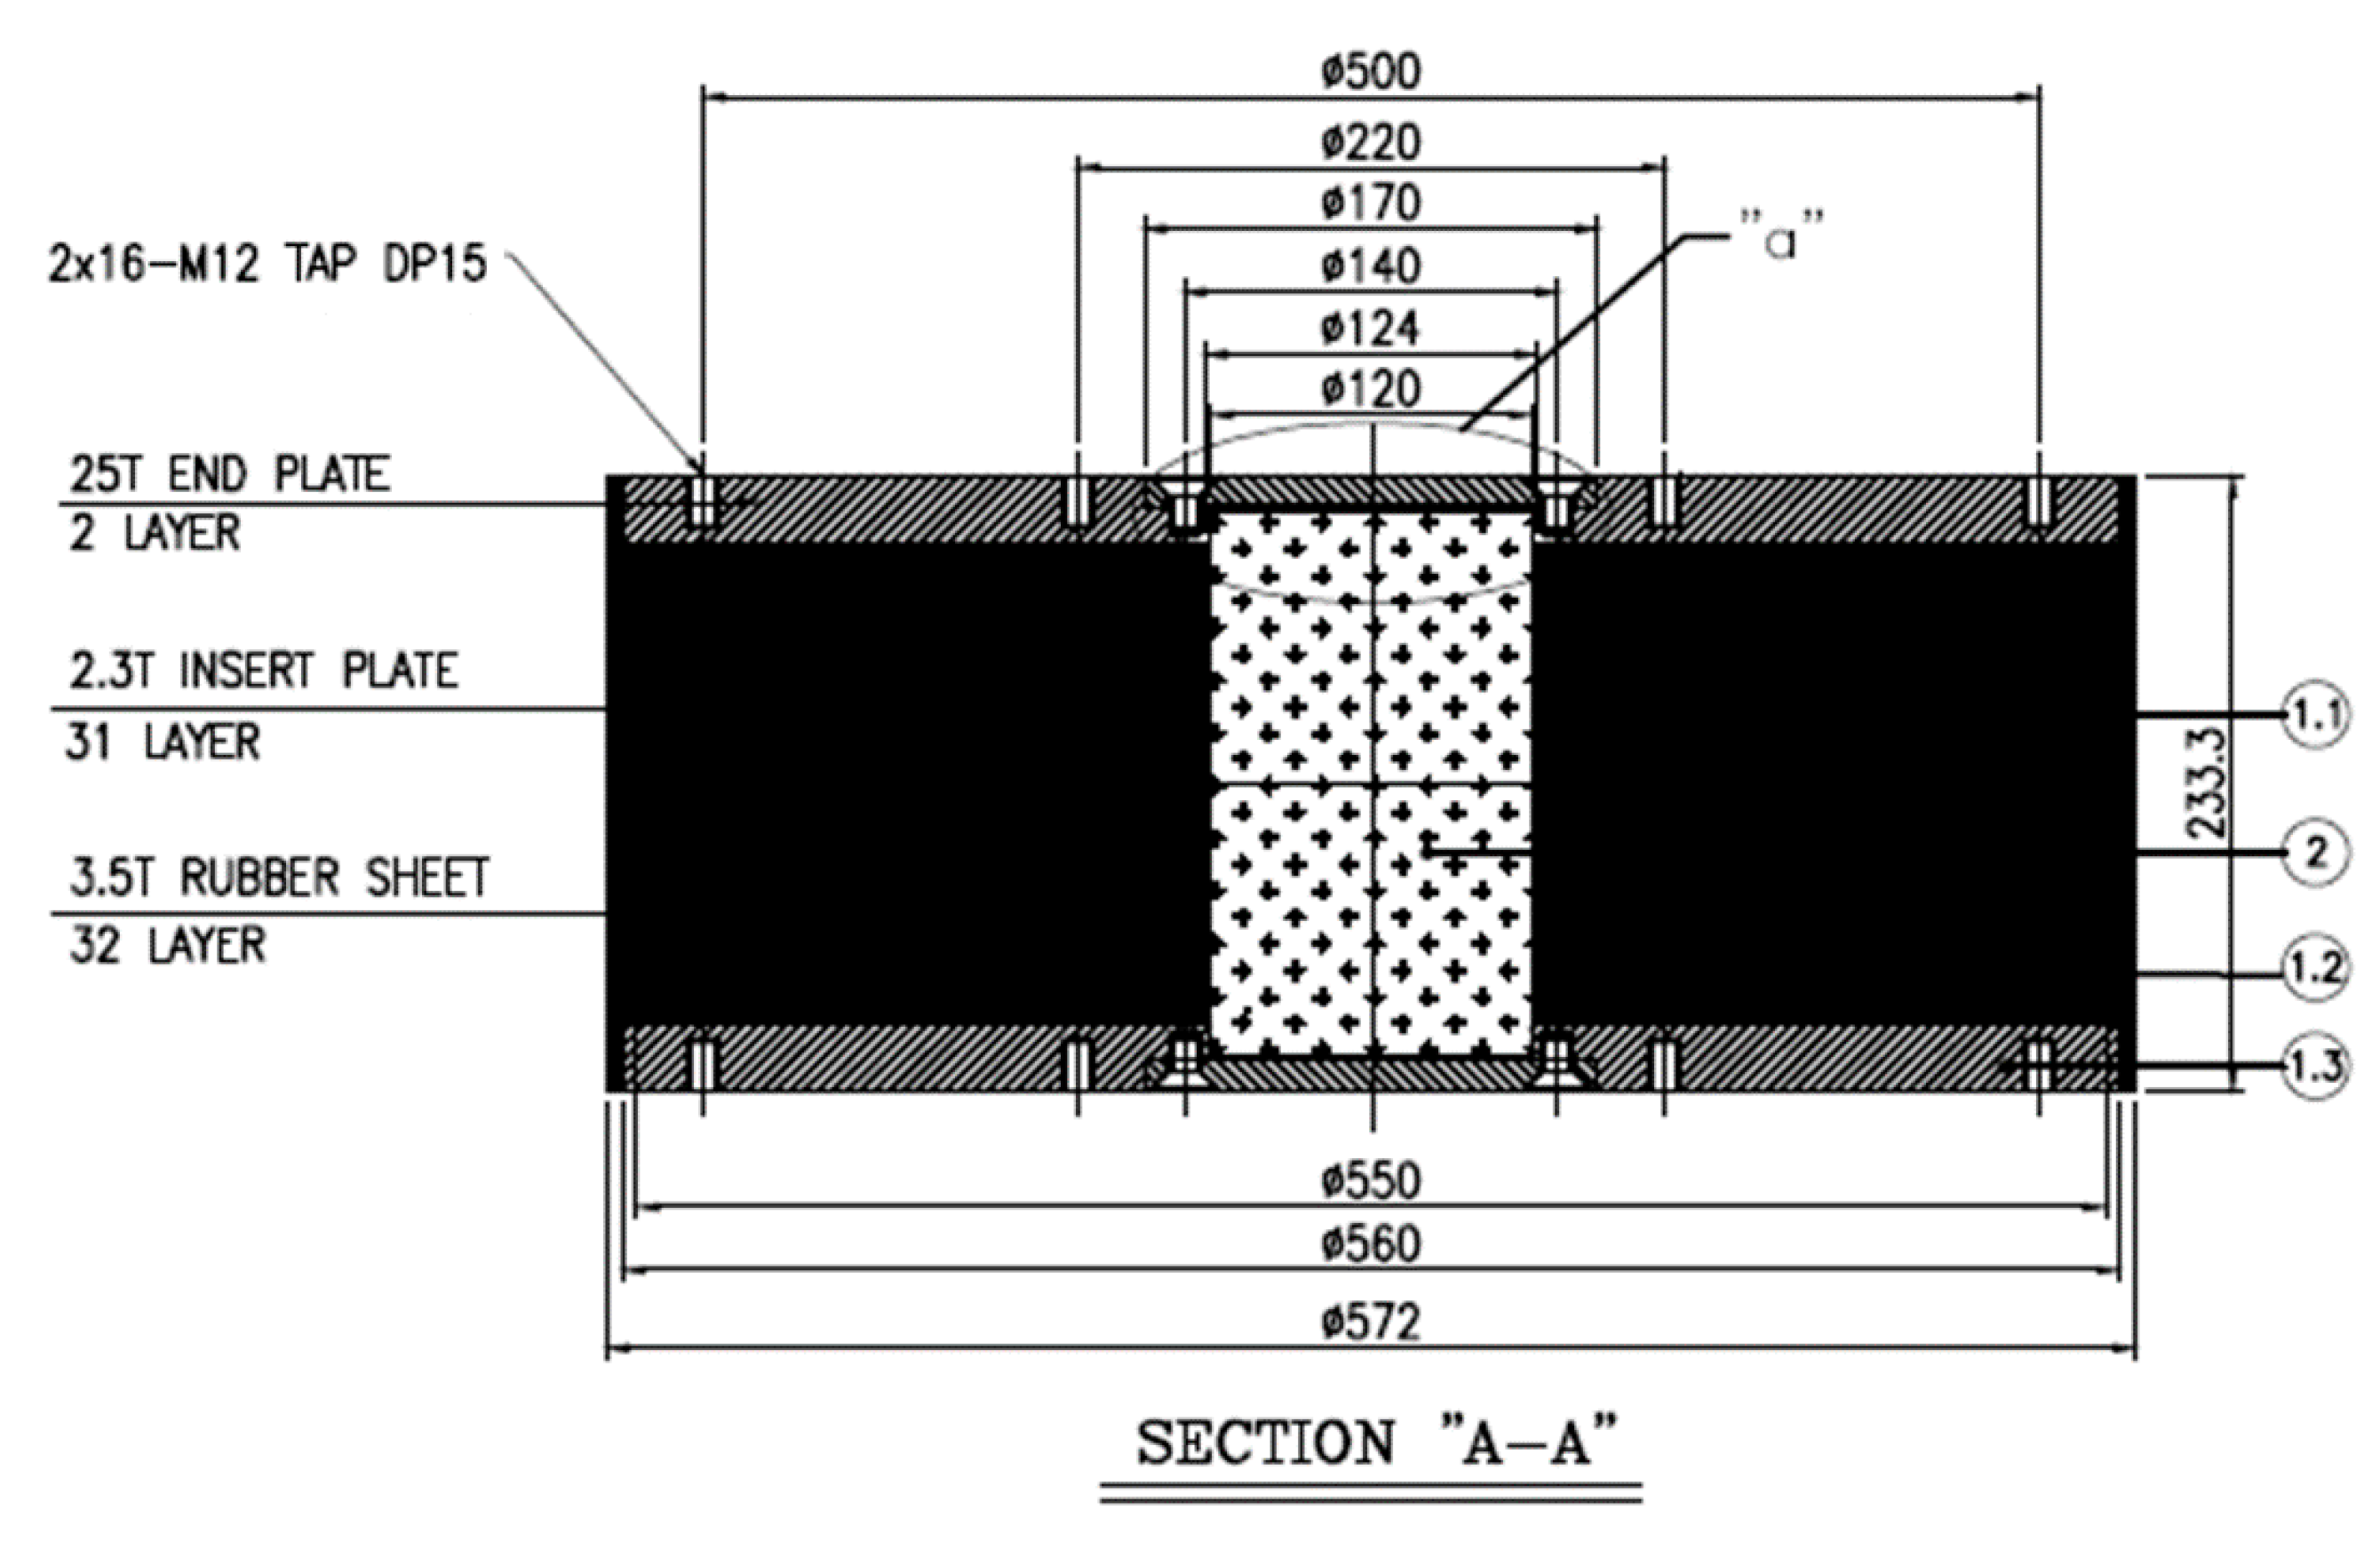
The structural model of the APR1400 including a seismic isolation system consisting of 486 bearings was initially developed in SAP2000 by KEPCO E & C. KEPCO, which is in charge of designing NPPs in Korea, developed a simplified Archetype Nuclear Test (ANT) stick model, as shown in Figure 1 [18]. The superstructure is modeled as beam–stick elements with lumped masses and the base mat is modeled using three dimensional solid elements. The reactor containment building (RCB) and the auxiliary building (AB) are located at the center of the model. The isolators are attached at the bottom of the base mat. The total weight of the nuclear island including base mat, reactor, RCB, and AB is 4732 MN. This SAP2000 model was then converted to an OpenSees format for hybrid simulations and parametric analysis [10]. The model was checked to ensure successful conversion, as shown by the modal frequencies of both models in Table 1 [18].
An advanced bearing model was developed and adapted for the ANT model [19] based on full-scale LRB experiments conducted by KAERI [14]. By focusing on the experimental results at shear strains of over 300%, the bearing model is considered applicable for beyond design basis earthquakes (BDBEs).

2.2. Isolator Model

KAERI conducted full-scale tests of LRBs designed for NPPs in 2014. As shown in the schematic in Figure 2, the diameters of the LRB and lead core were 1500 mm and 320 mm, respectively, with 32 layers of 7 mm thick rubber stacked to give a total rubber height of 224 mm. Two LRBs were tested, where each specimen experienced various motions including sine wave motion, elliptical trace sinusoidal motion, and earthquake response motion. Shear strain up to 500% at three frequencies (0.01 Hz, 0.2 Hz, and 0.5 Hz) was tested at the design axial load, 22,000 kN. Detailed explanations of the experiments can be found in previous reports [13,14,20,21]; Figure 3 presents an example of experimental results obtained from the tests.
A parallel numerical model of an isolator representing an LRB was suggested by Mosqueda, Marquez, and Hughes [12,19]. The characteristic behaviors of the LRBs, such as a reduction in strength due to the heat of the lead and hardening at large strain, as shown in Figure 3, are modeled using three elements: an LRX element, a Bouc–Wen (hardening) element, and an HDR element, which are all separately available in OpenSees [22], as shown in Figure 4.
The ratio of post-yield stiffness to initial stiffness α and the characteristic strength Q d are calibrated using test data at moderate to large levels of shear strains, e.g., 100–300% shear strain [19]. The parameters for the Bouc–Wen element are calibrated from tests at higher strains, in the range of 300–500% shear strain [19]. The HDR model is an element that consists of elastic and hysteretic components [23]; this phenomenological model contains 10 parameters, three of which account for the elastic component ( a 1 a 3 ), three for the hysteretic component ( b 1 b 3 ), and four for degradation effects ( c 1 c 4 ) such as mullins and scragging.
The model parameters in these three elements are calibrated from the full-scale bearing tests. The downhill simplex algorithm was used for the identification of the parameters by minimizing the normalized root-mean-squared error of the difference between the experimentally measured force and the numerical force determined numerically using OpenSees [12]. Table 2 summarizes the final calibrated parameters for the LRB model, and Figure 5 plots a comparison between the calibrated model and the experimental result [19].
The effects of axial load are also important, and there have been some documented evidence of lateral-vertical coupling in the behavior of the bearings. Such effects have been captured through hybrid simulations along with 3D testing of bearings [24]. However, the authors are not aware of a reliable model to capture these effects. From the experiments, it was difficult in the present work to conduct a full-scale LRB test with various axial loads to propose an adequate model because of budget and schedule constraints. Therefore, it is assumed herein that the experimental results conducted at design axial load represent the general behavior of the LRBs on average for the numerical model considering that some bearings will have increasing axial load while others will have a decreasing axial load. Consideration of axial load variation in the numerical model requires further experiments and research.

2.3. Ground Motions

The Pacific Earthquake Engineering Research Center (PEER) published a technical report [25] as the outcome of a research project conducted in tandem with KEPCO. In this project, a set of 20 ground motions were selected from the PEER NGA-West1 database, such that they match the mean and dispersion of a target response spectrum [25]. Using RSPMatch, each of the selected dispersion-appropriate records was individually matched to a single target spectrum corresponding to 5% damping [25]. Table 3 shows the properties of the 20 ground motions used for this research, with the mean spectrum matched to the 5% damped USNRC RG1.60 (U.S. Nuclear Regulatory Commission Regulatory Guide 1.60) target spectrum as shown in Figure 6. USNRC RG1.60 specifies design response spectra for the seismic design of NPPs [26]. For ground motion with various peak ground acceleration (PGA) levels, an amplification factor is applied to the motions in Figure 6.

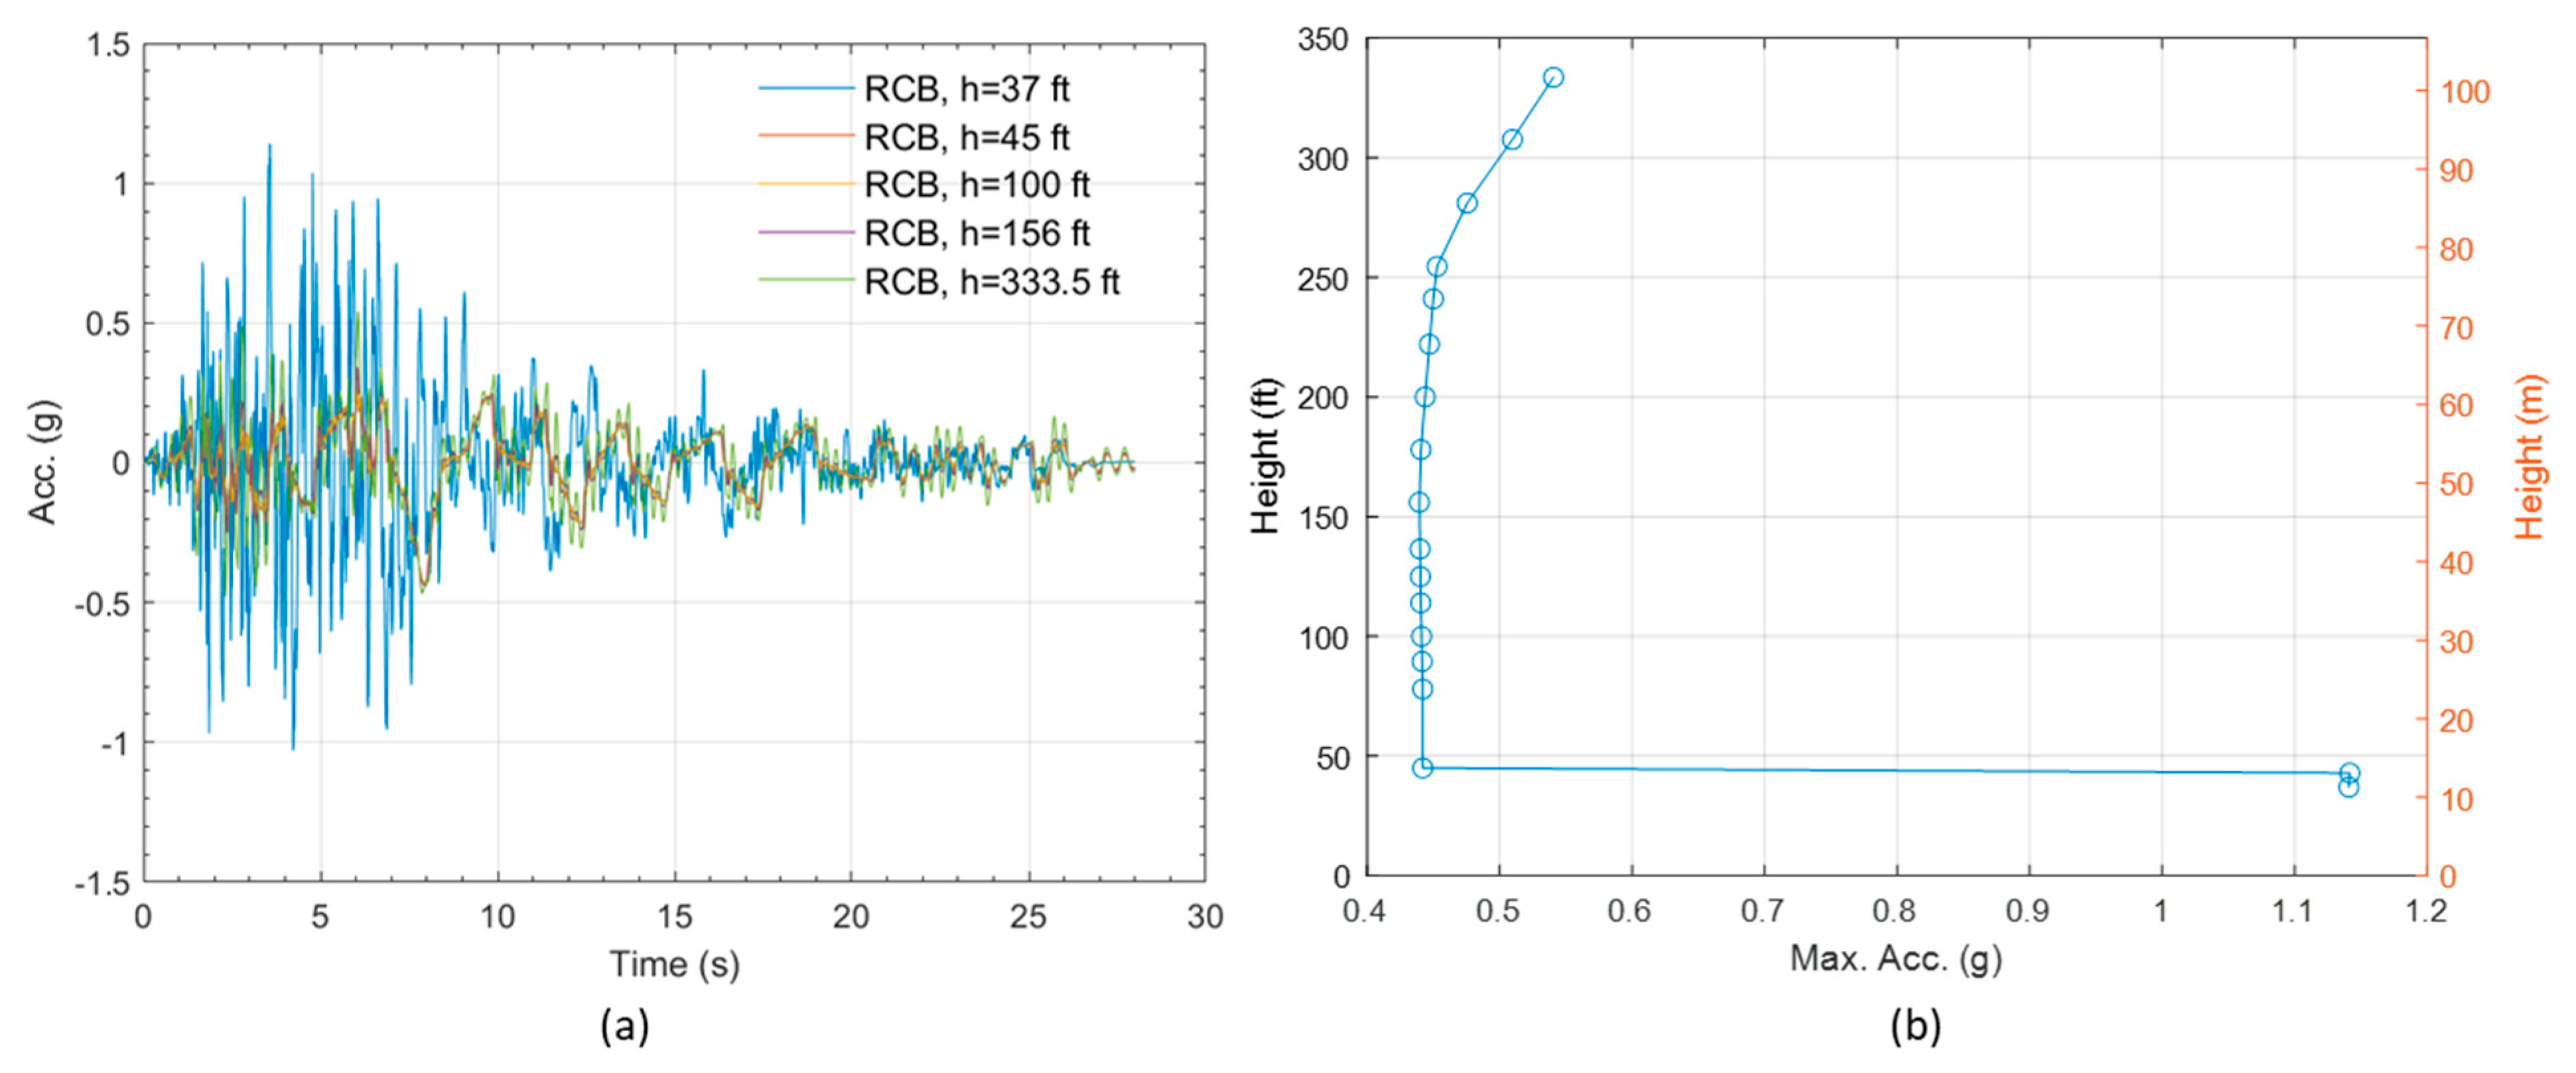
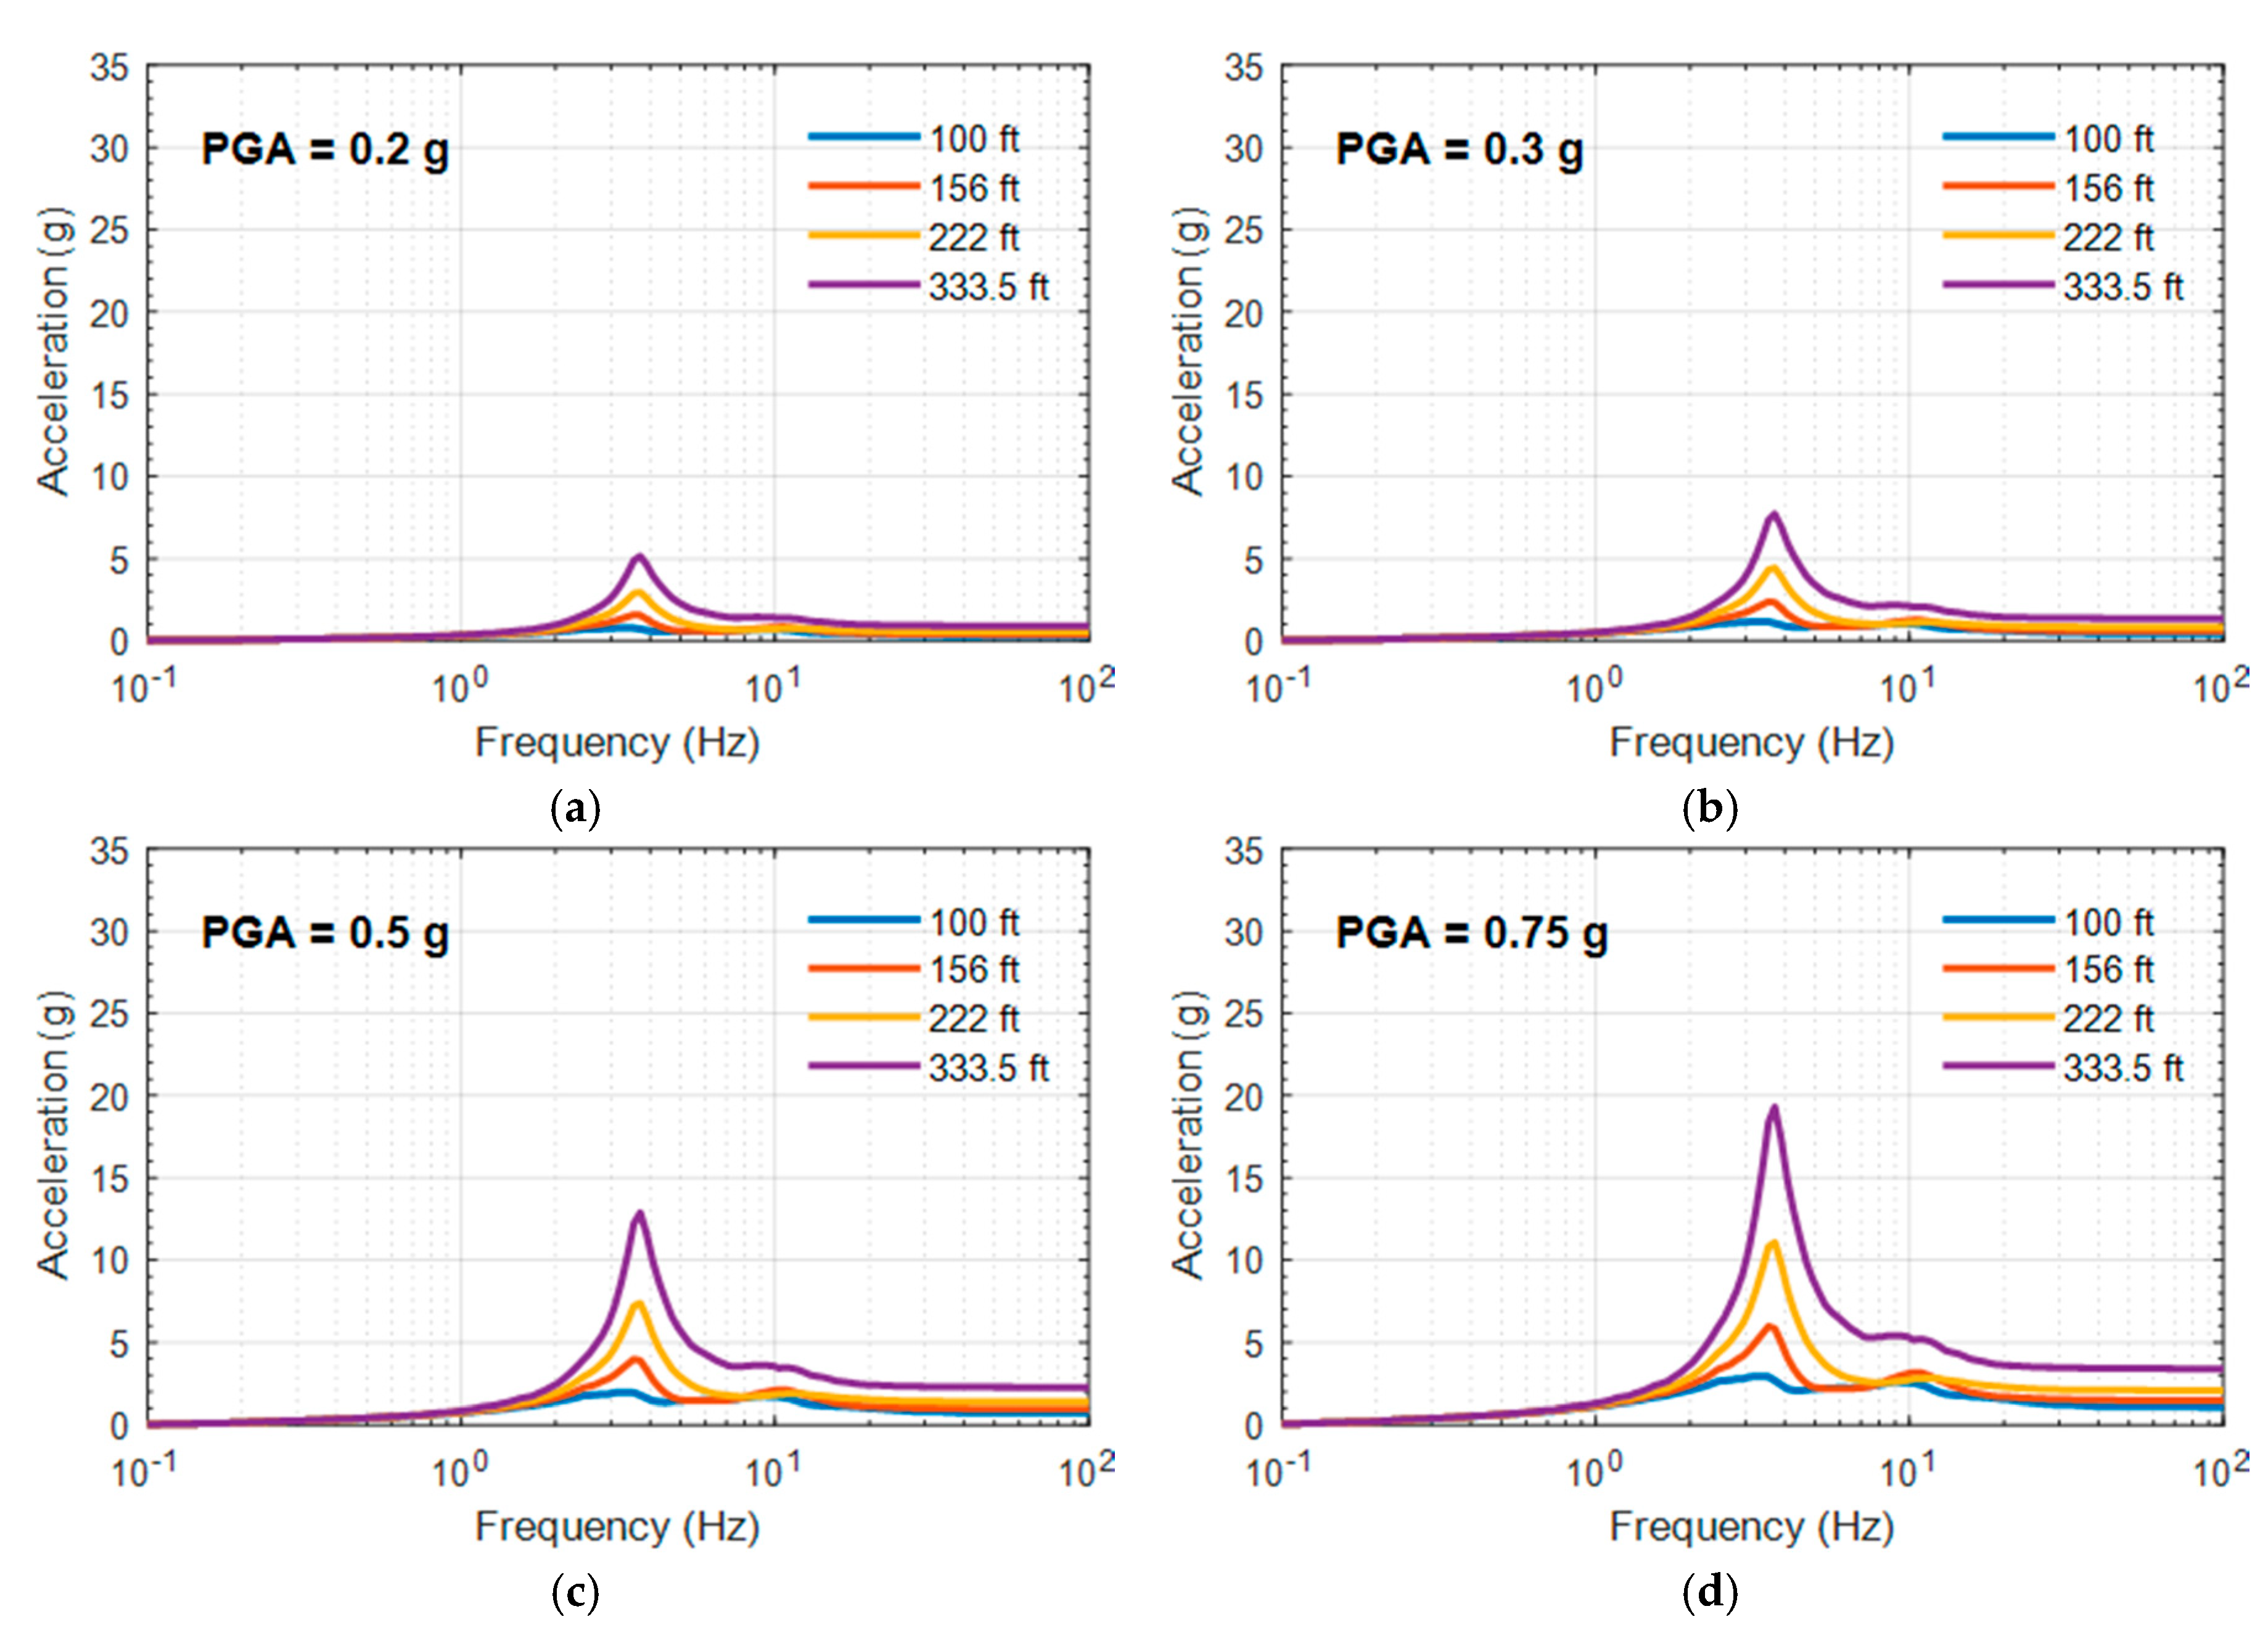
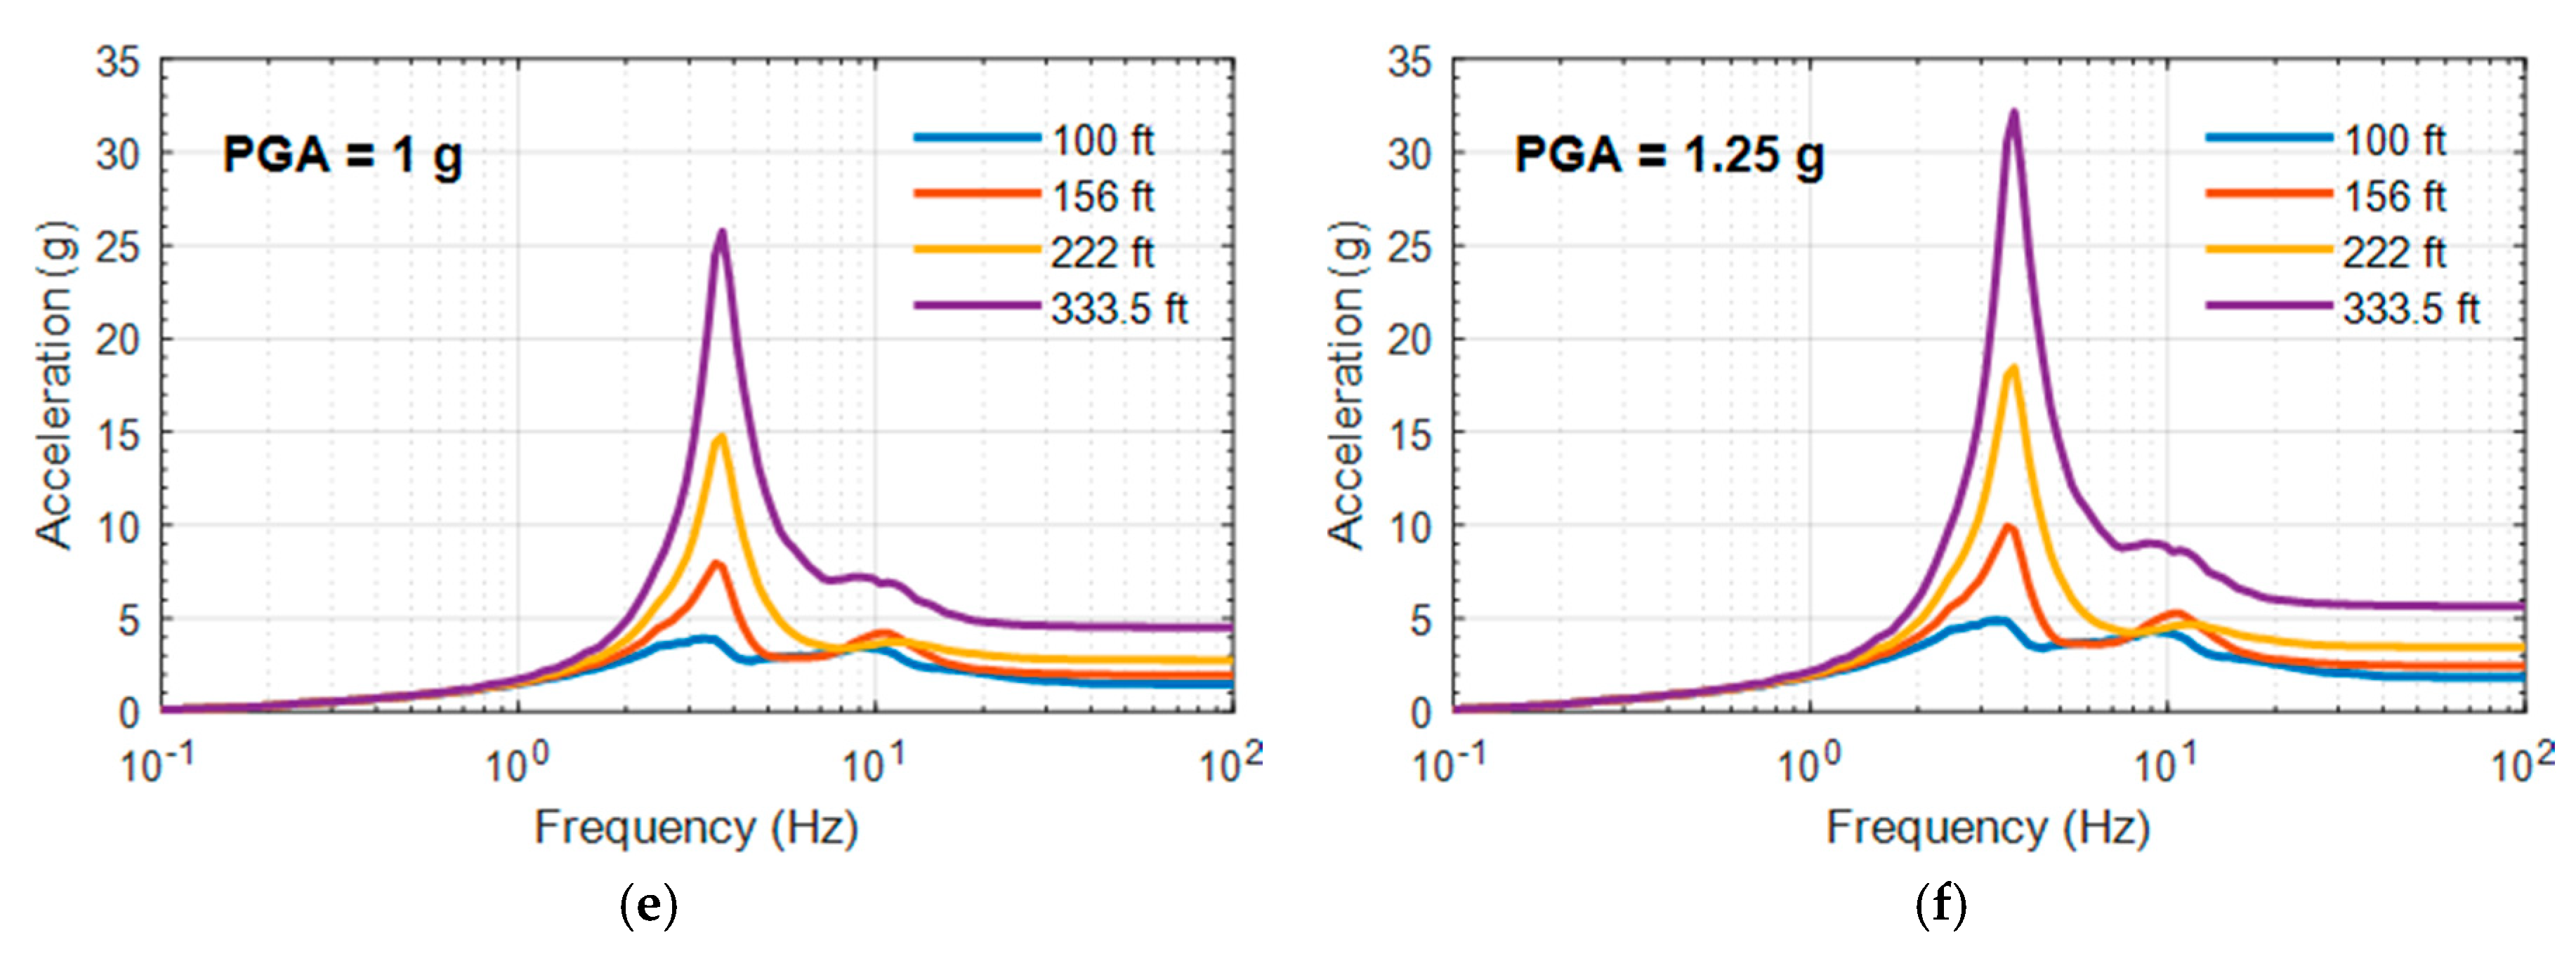
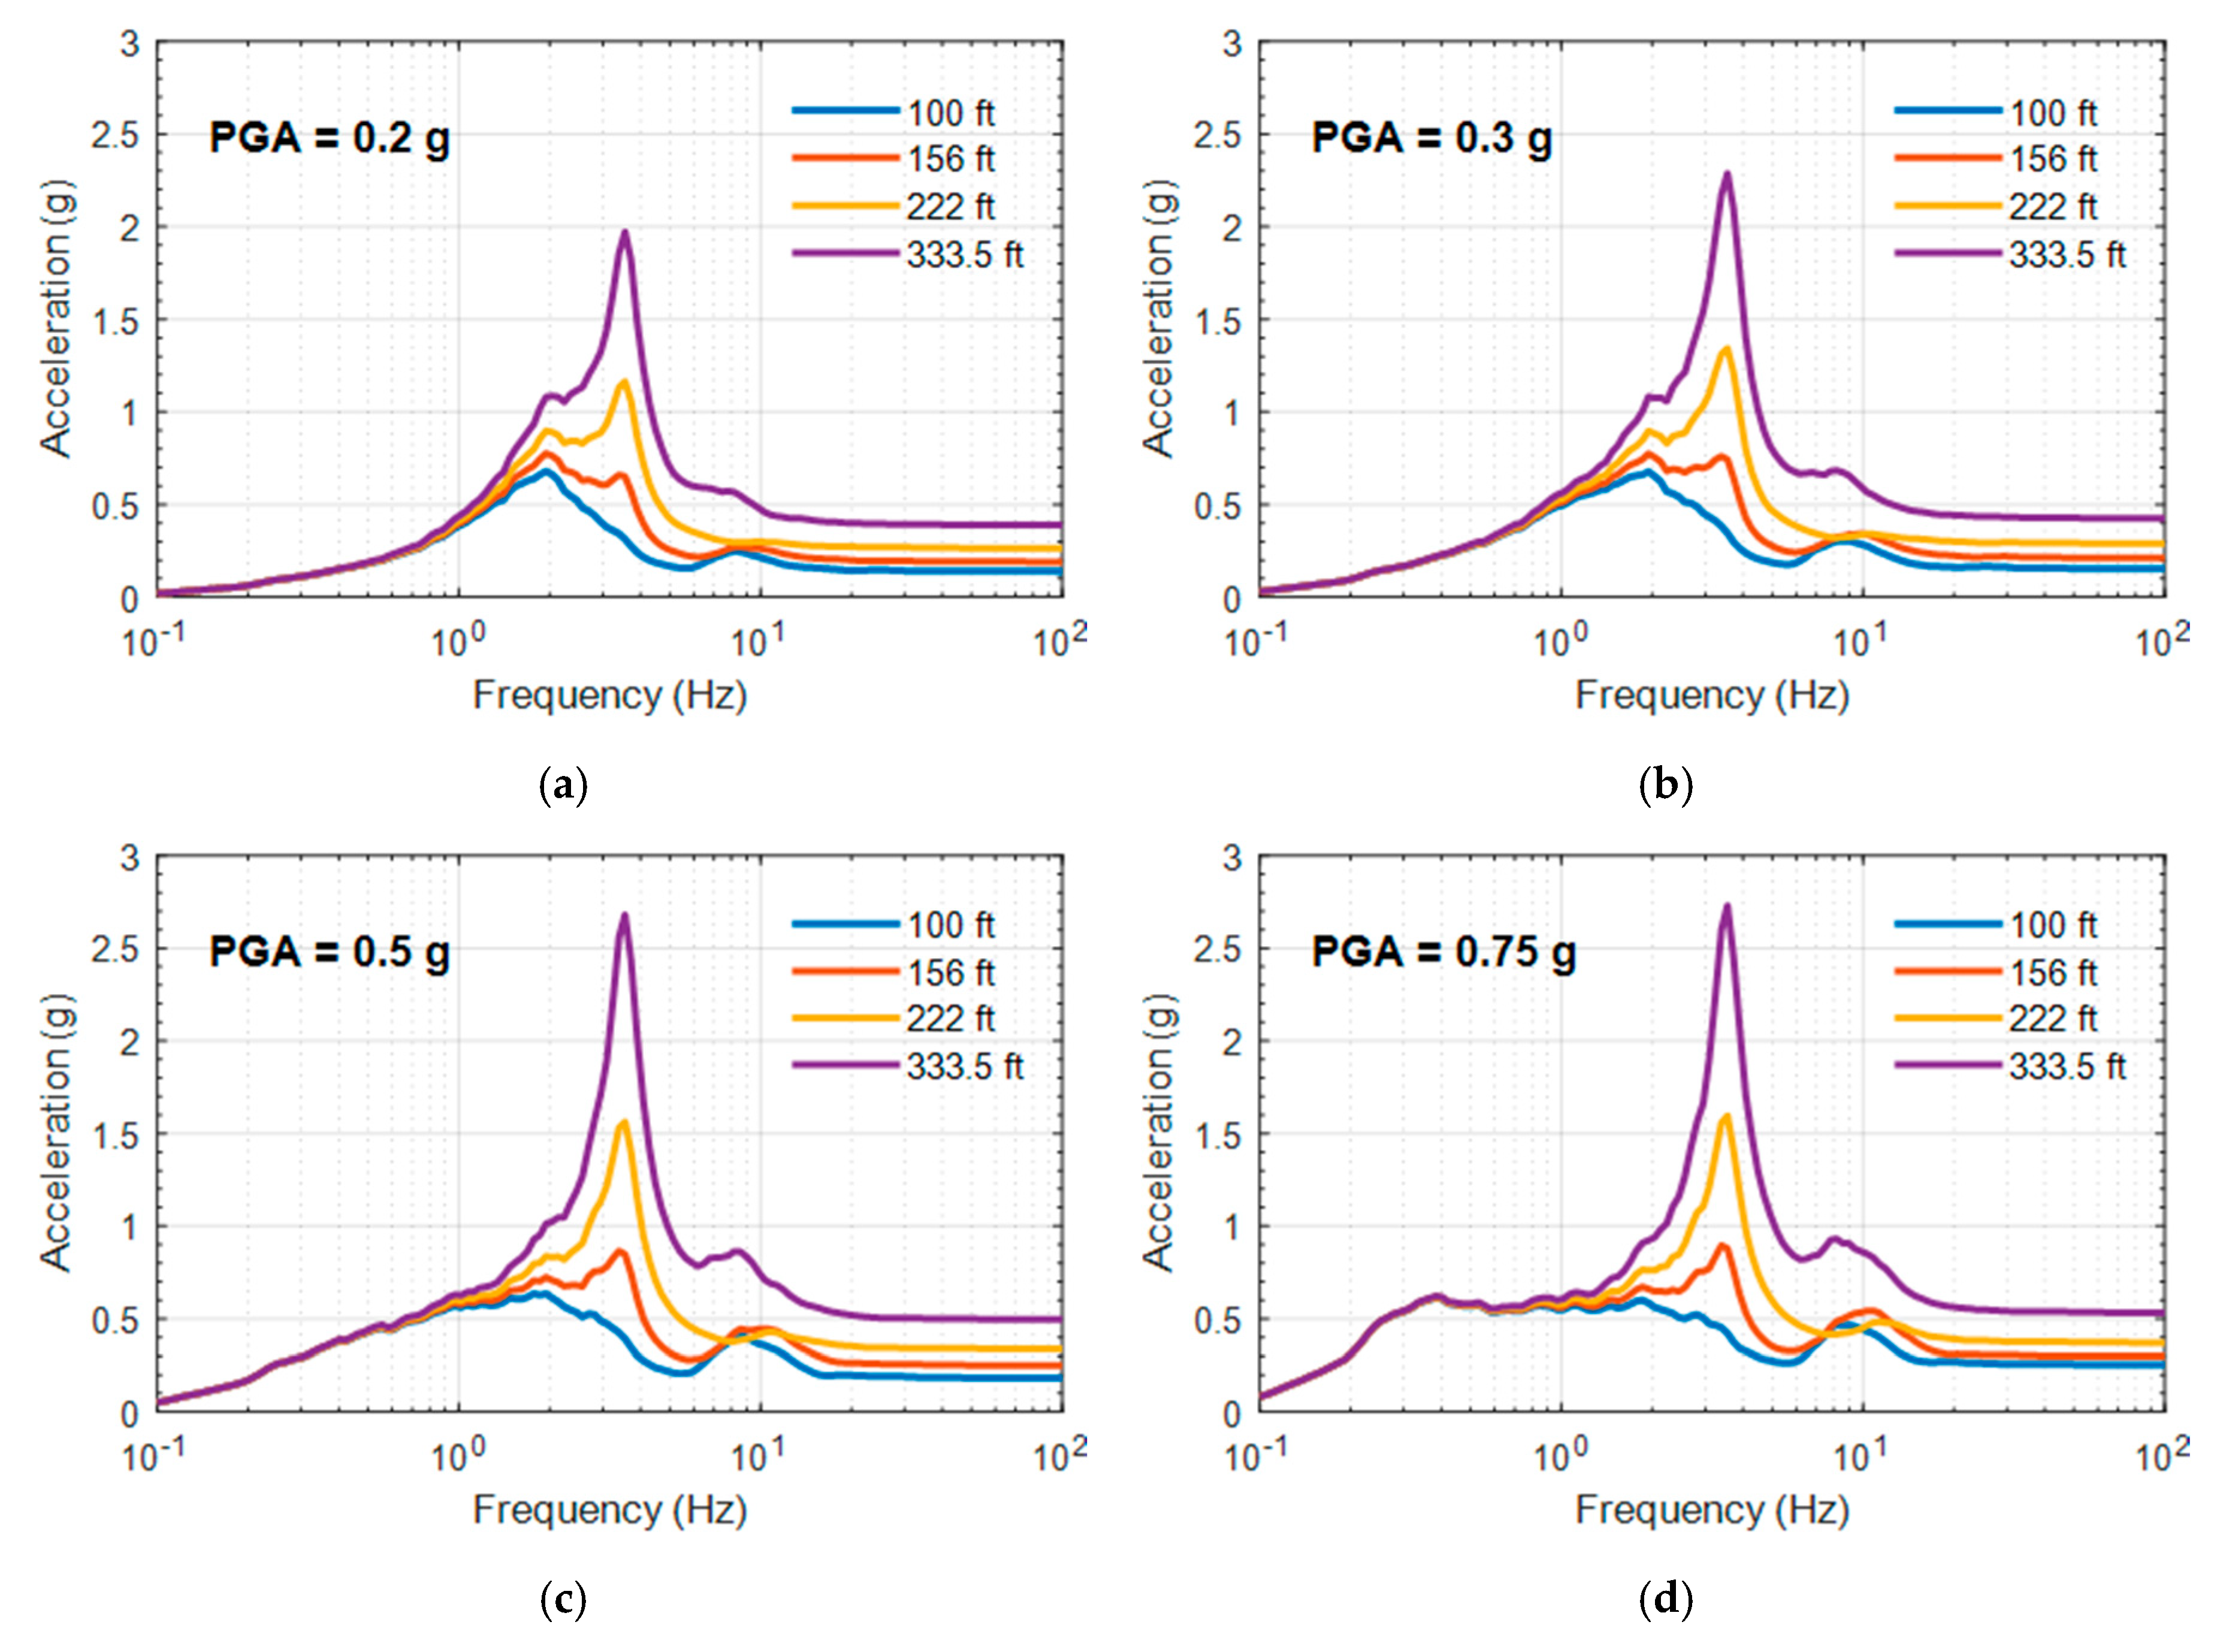
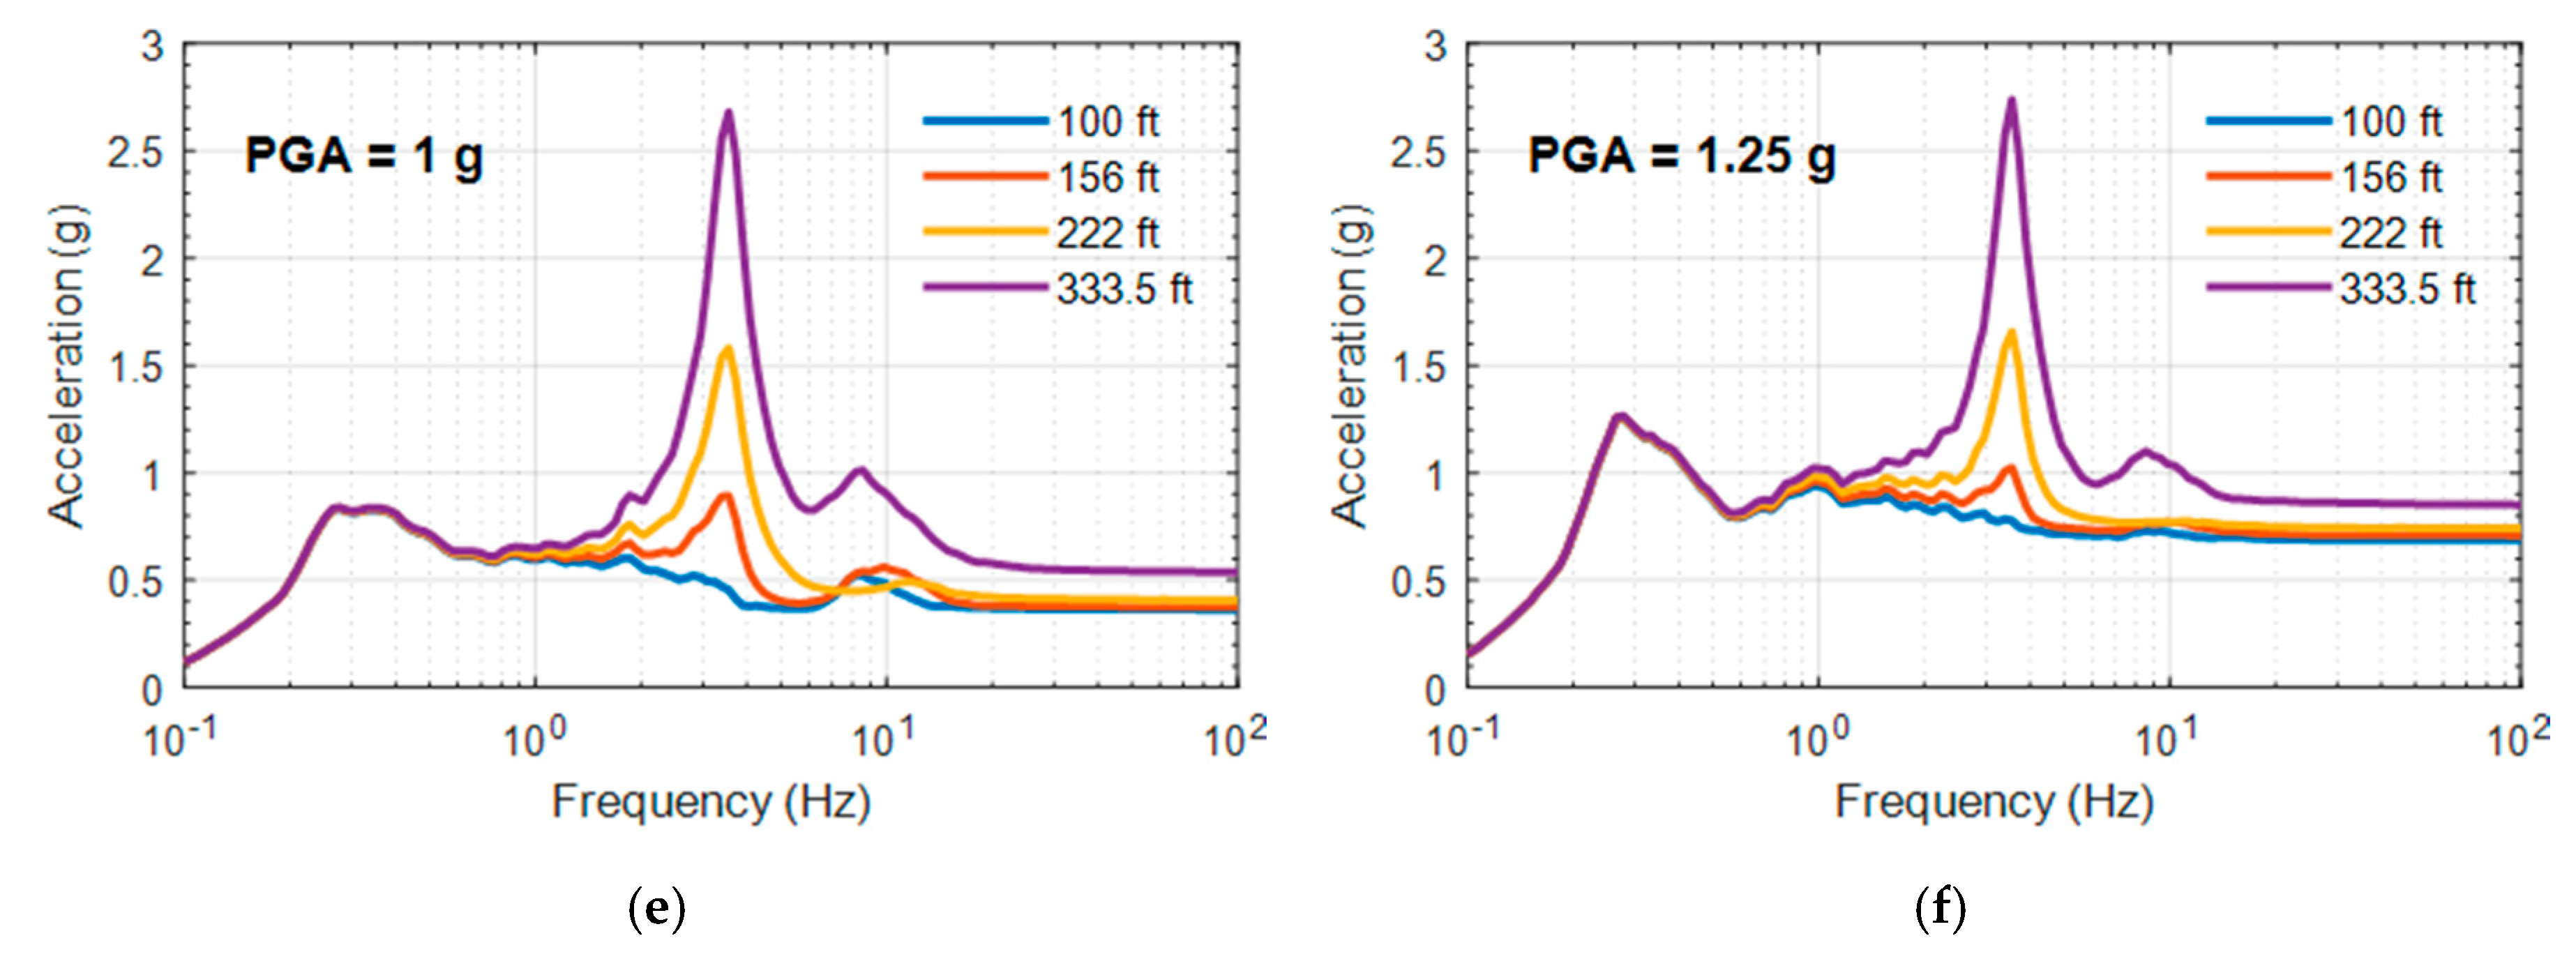
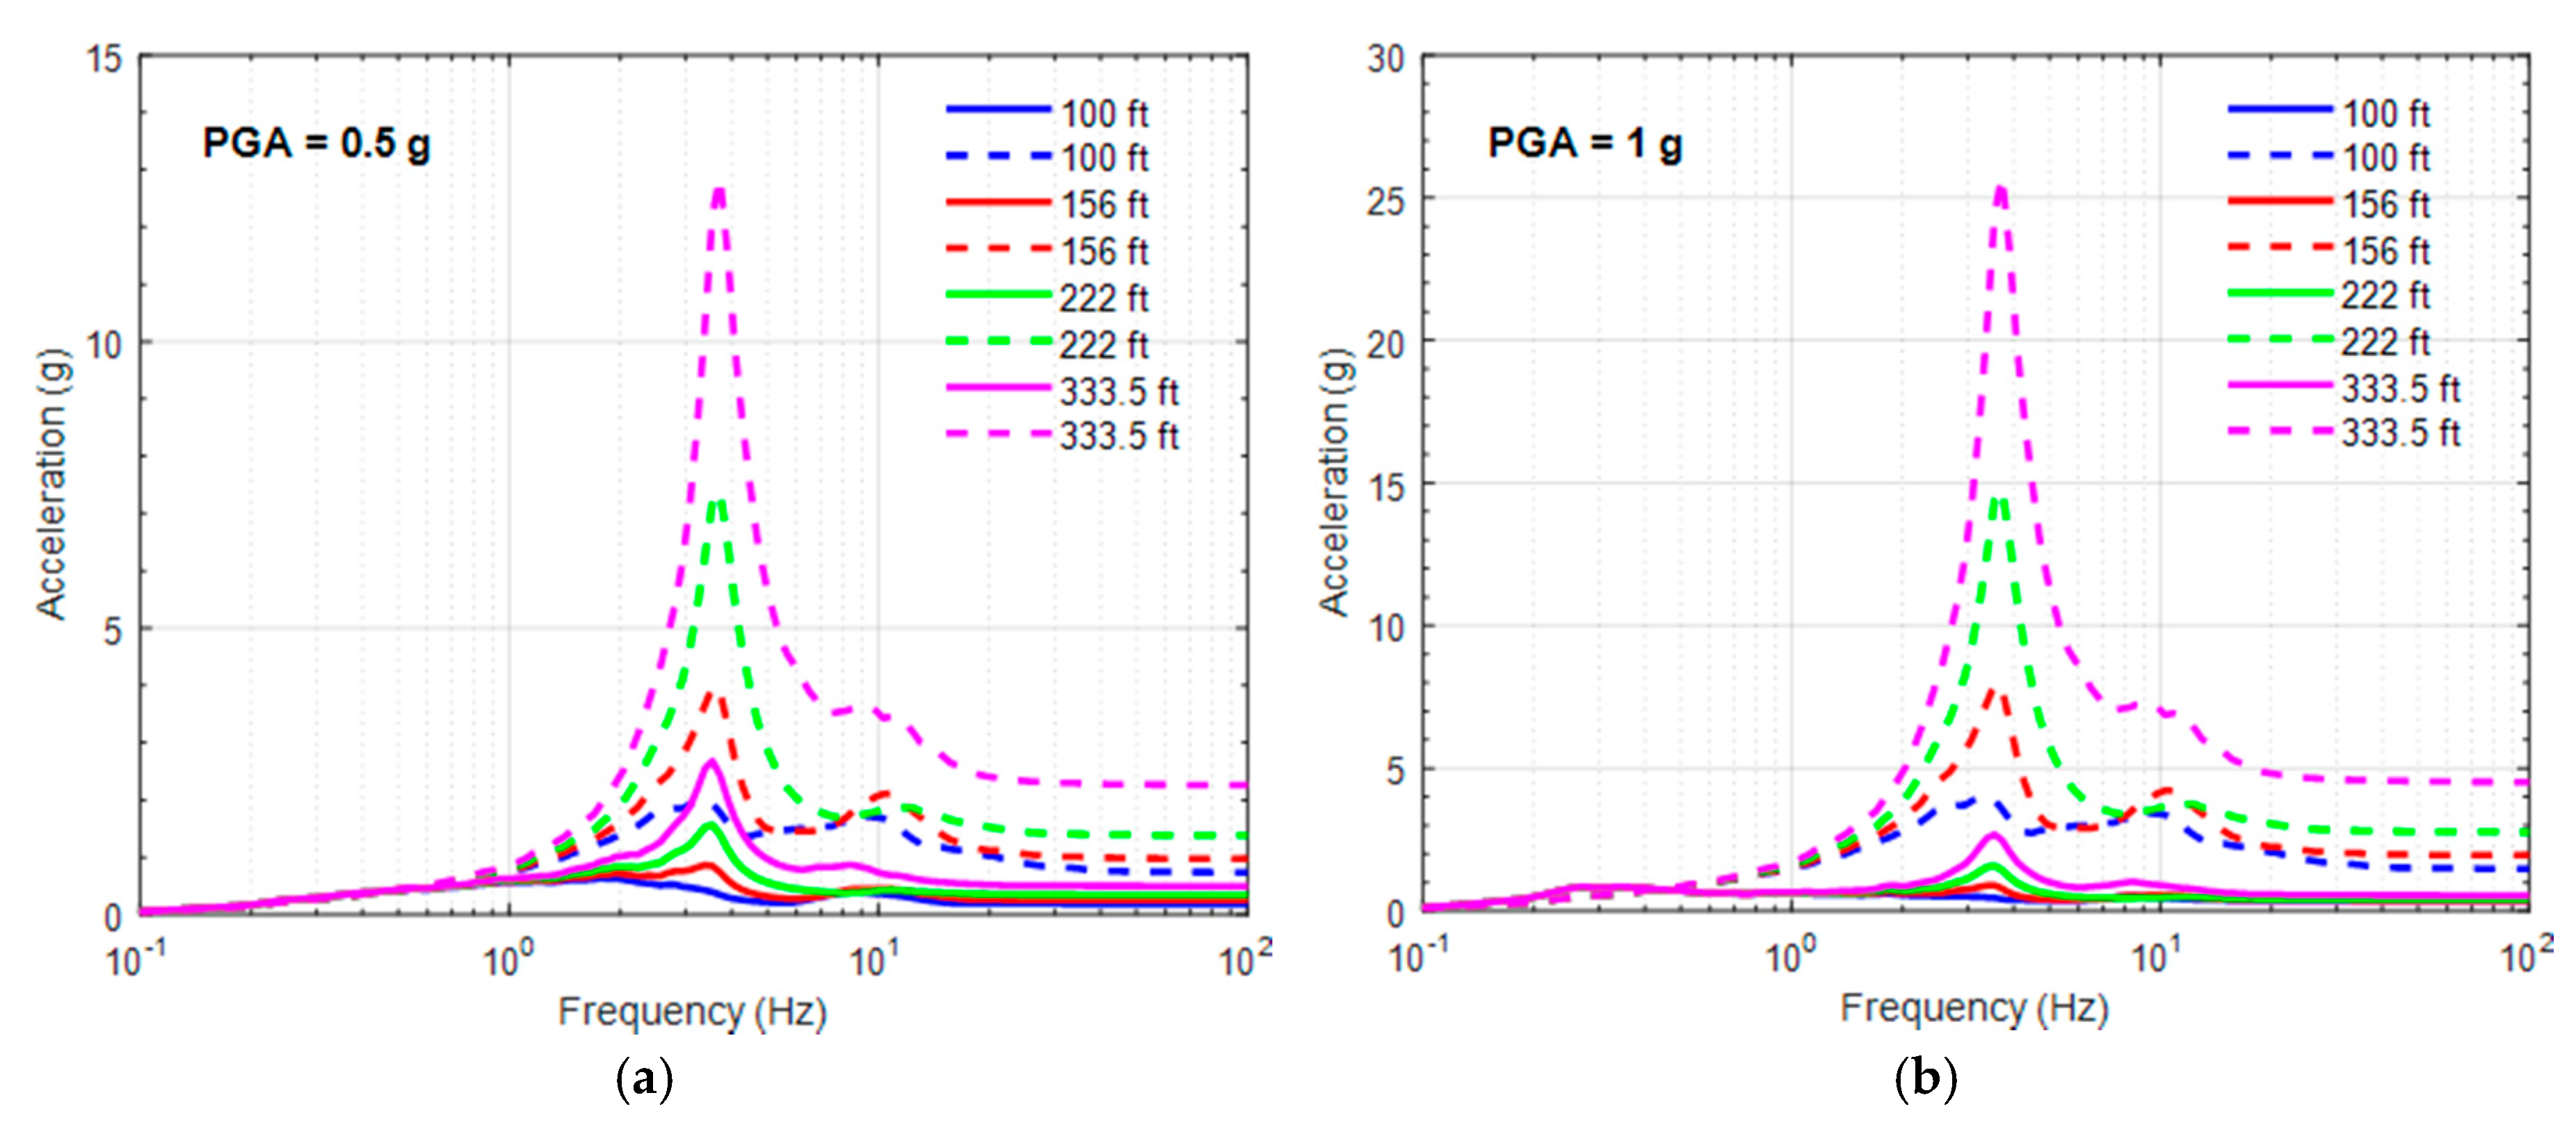
3. Response of an Isolated Nuclear Power Plant

Displacement of the Isolation System and Upper Structures

Figure 7 shows the acceleration time history of one of the ground motions in Table 3, earthquake #1 from San Fernando. Figure 8 shows the displacement time histories and the maximum displacement of the isolation system and upper structures subjected to the ground motion shown in Figure 7. The plots show the analytical responses from the bottom of the pedestal at 11.3 m (37 ft) to the top of the reactor containment building (RCB) at 101.7 m (333.5 ft). Similarly, Figure 9 shows the acceleration time histories and the maximum acceleration for the ground motion in Figure 7.
The top of the LRB and the bottom of the base mat meet at a height of 13.7 m (45 ft). As shown in Figure 8 and Figure 9, the responses above 13.7 m (45 ft) differ from those below 13.7 m (45 ft), meaning that the responses of the isolation layer and the upper structures are different. These results support the statement above that the isolation system reduces acceleration by allowing lateral displacement. Additionally, the displacement response in Figure 8 can be used as an input motion to assess the failure probability of the interfacing components, such as the umbilical lines between isolated and non-isolated structures.
Figure 10 shows the force-displacement relation of an LRB (LRB #1) subjected to the same ground motion in Figure 7 but at various PGA levels. This bearing, as depicted in Figure 1, is located at the corner of the base mat. According to Figure 10, the bearing model shows increased nonlinearity as the ground motion strengthens, similar to experimental observations, and thus it can be concluded that the bearing model is suitable for beyond design basis applications.
The floor response spectra (FRS) is another essential aspect in the analysis of the seismic fragility of equipment as well as risk assessment, as discussed in previous reports [27]. Figure 11 and Figure 12 exhibits the mean FRS of the 20 motions in Table 3; more specifically, Figure 11 shows the FRS of a non-isolated NPP at 30.5 m (100 ft), 47.5 m (156 ft), 67.7 m (222 ft), and 101.7 m (333.5 ft) of the RCB, and Figure 12 shows the FRS of a base-isolated NPP using the bearing model based on the experiments described in Section 2.2. As shown in Figure 12, the peaks at the isolation system frequency (about 0.5 Hz) become notable as the ground motion becomes stronger. Additionally, the responses are amplified depending on the elevation at the frequency of the RCB (about 3.5 Hz).
Figure 13 shows a comparison of the FRS from both base-isolated and non-isolated RCBs. The isolation system reduces the overall responses of the structure, with the isolated RCB only slightly exceeding the non-isolated RCB in the region near the natural frequency of the isolation system.
If there exists a stop (moat wall) in accordance with the evaluated CS, the FRS of the base-isolated RCB can be amplified due to a collision between the wall and the base mat, especially for ground motions exceeding BDBE ground motion response spectra (GMRS). Therefore, further research for the modeling of the moat wall, backfill soil, and impact is necessary to evaluate FRS considering moat wall impact at strong ground motions.

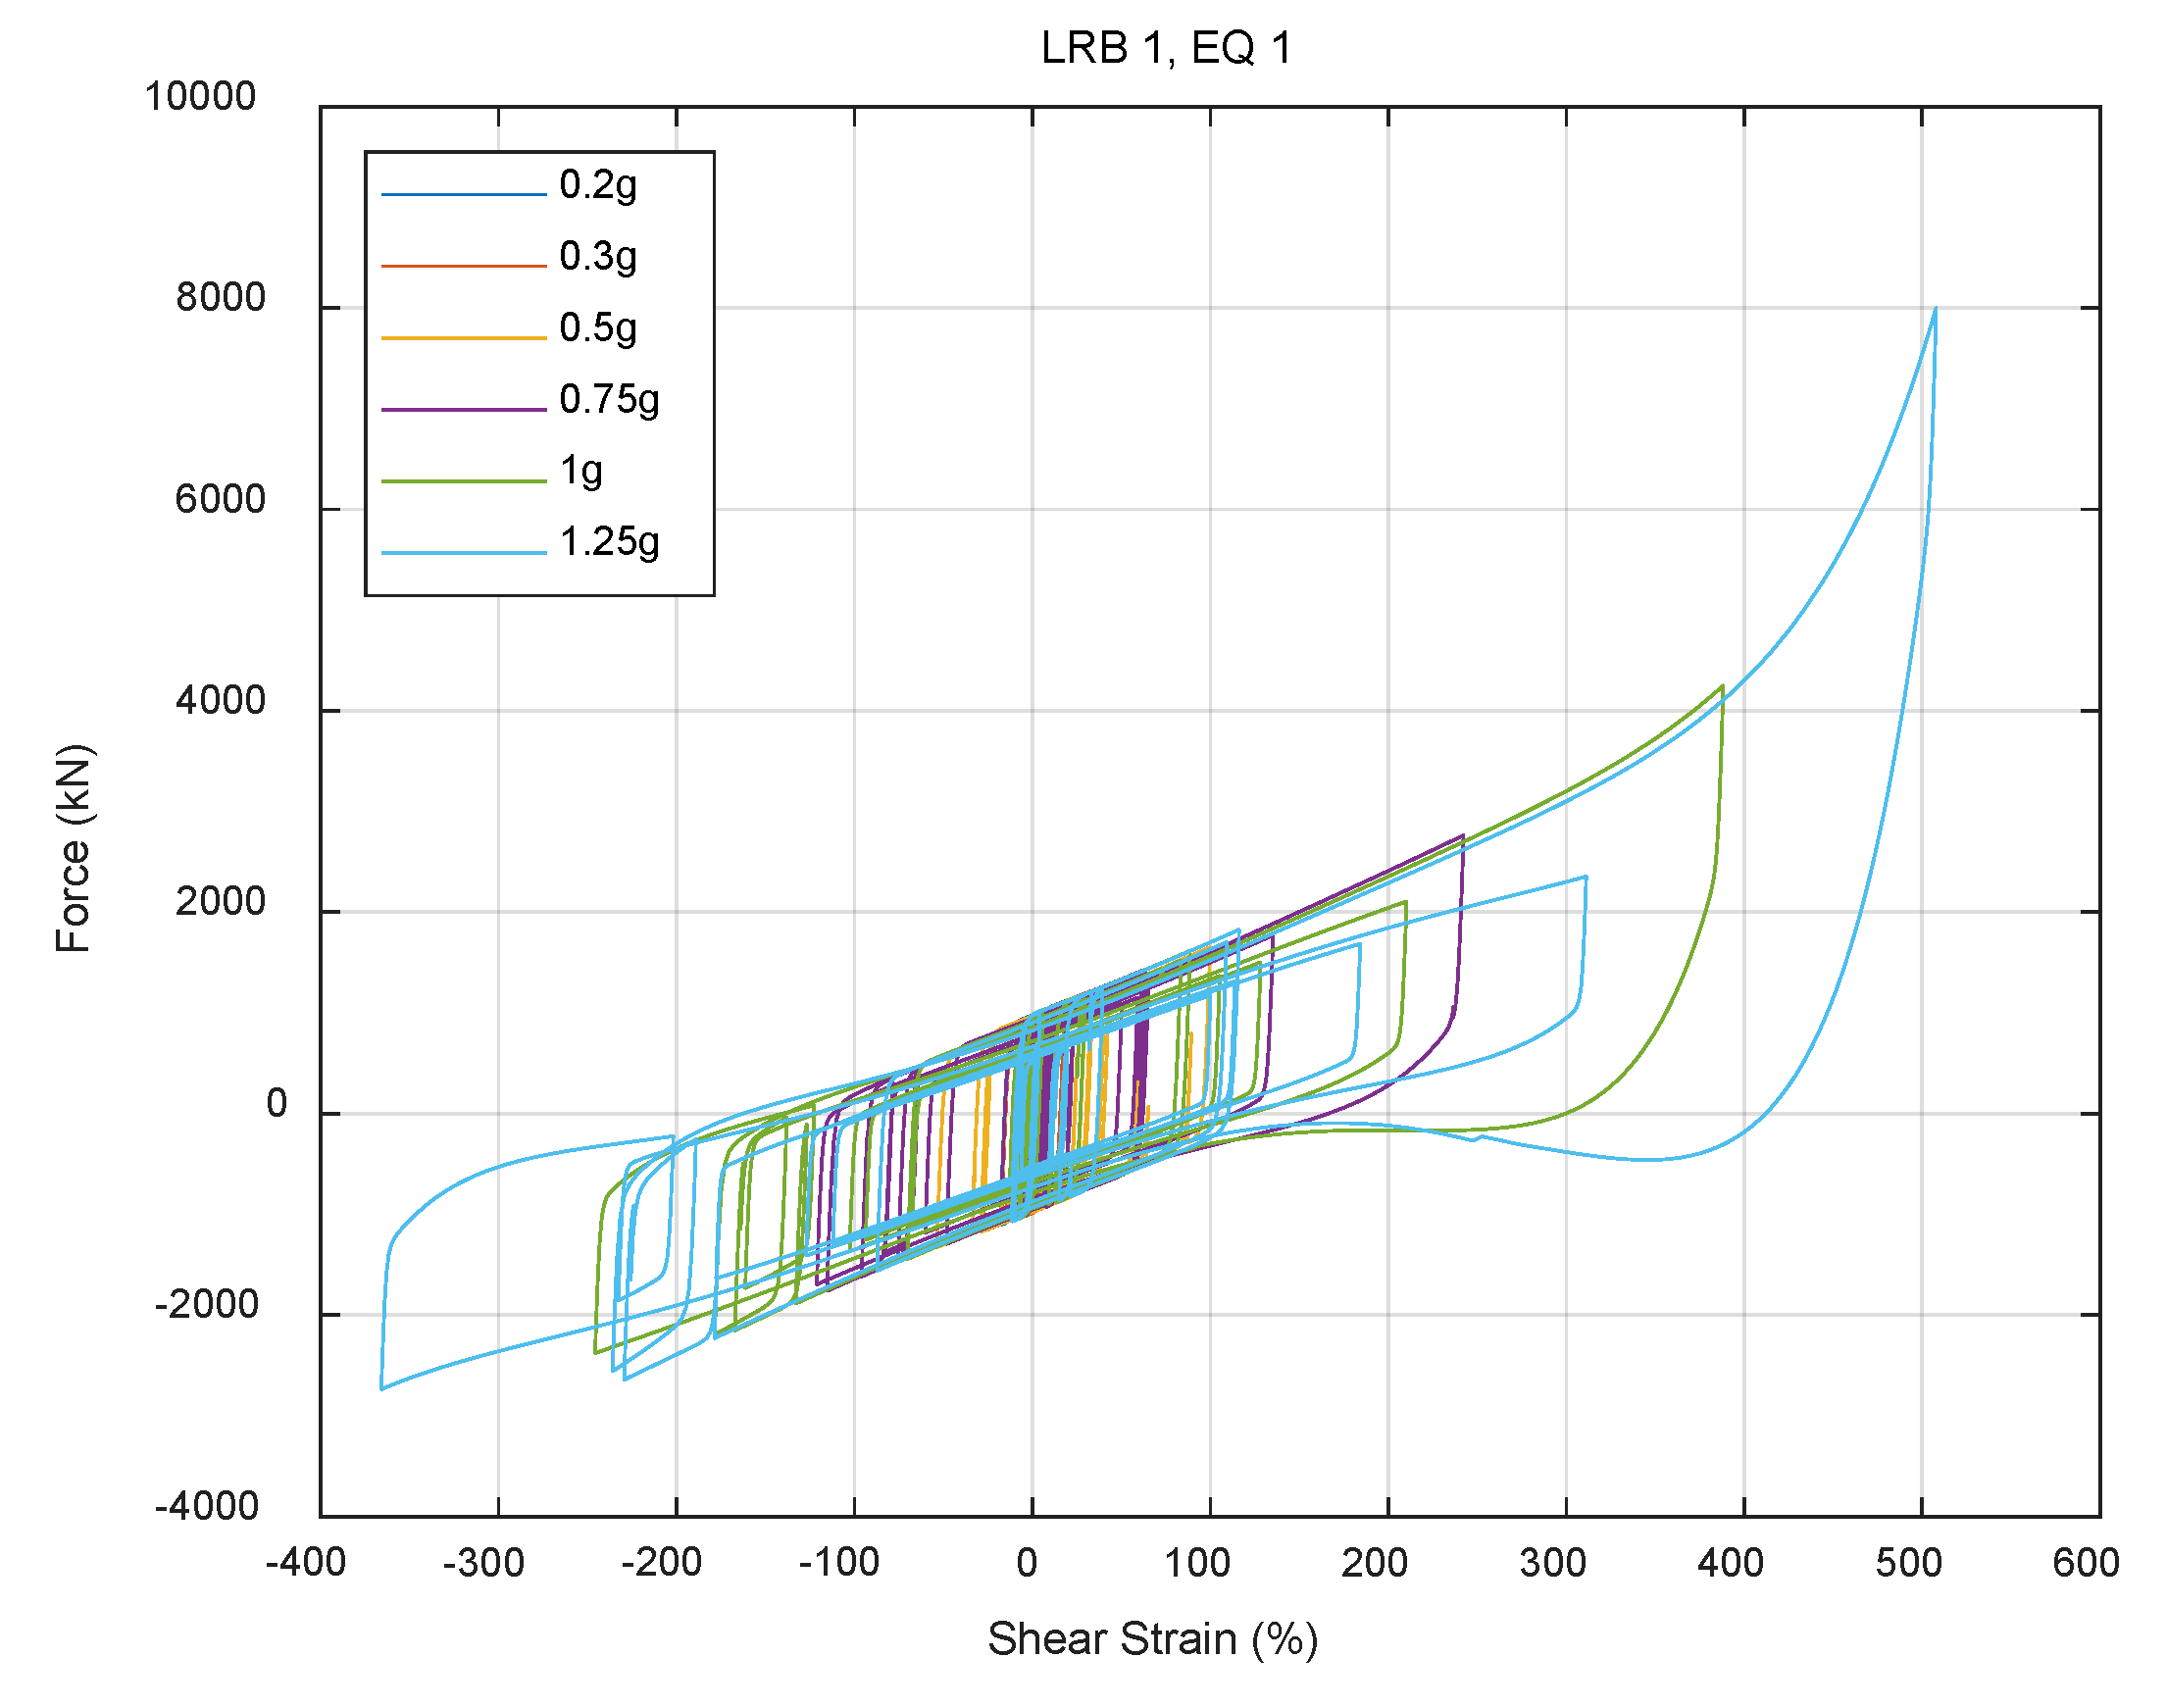
4. Capacity of the Isolation System

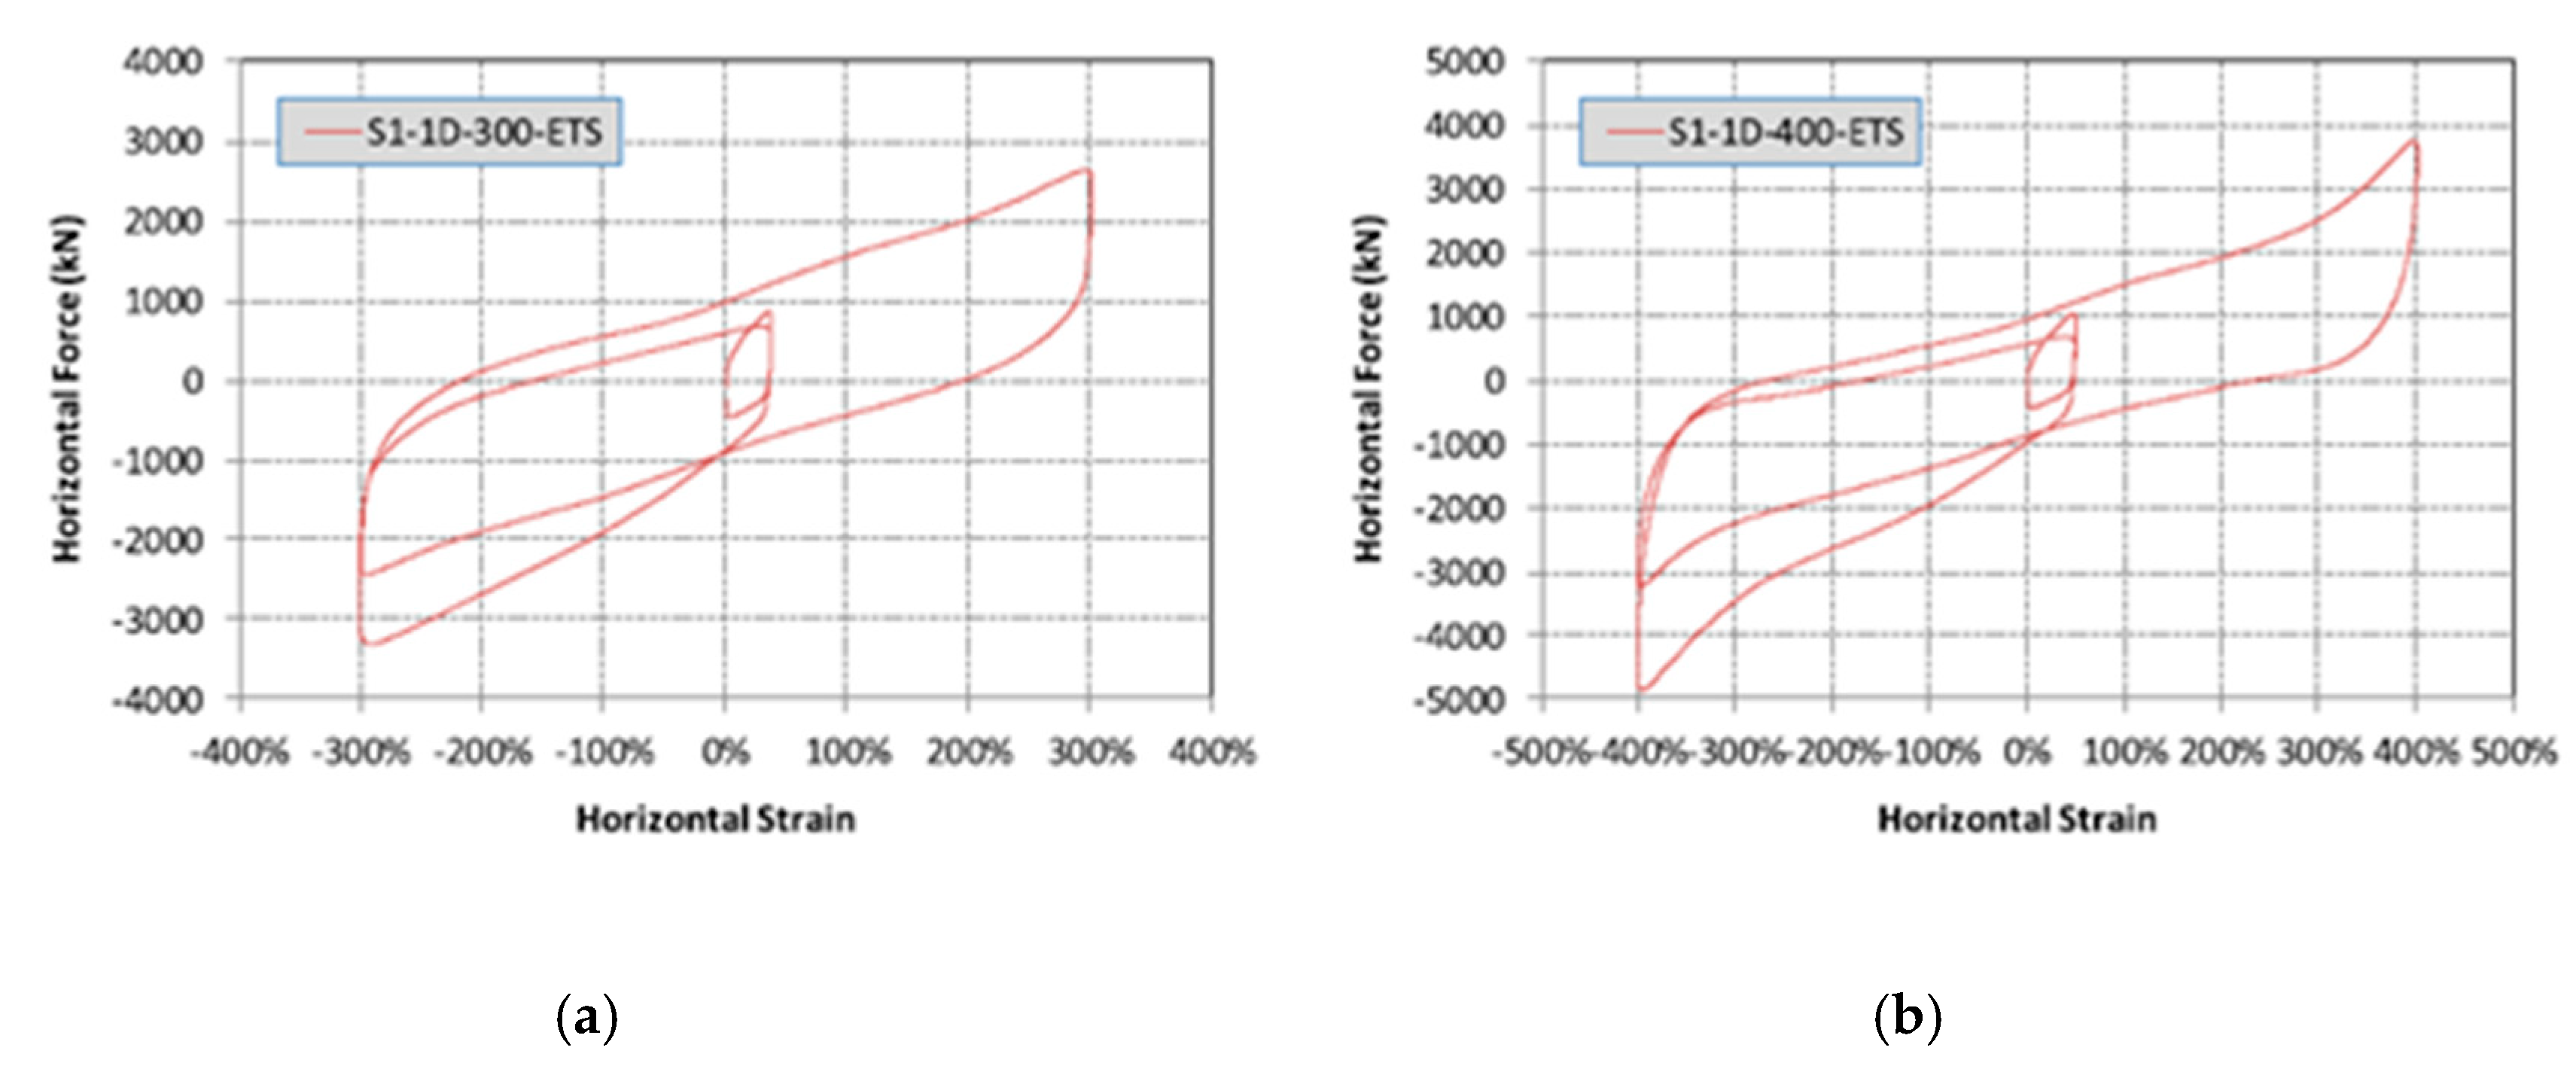
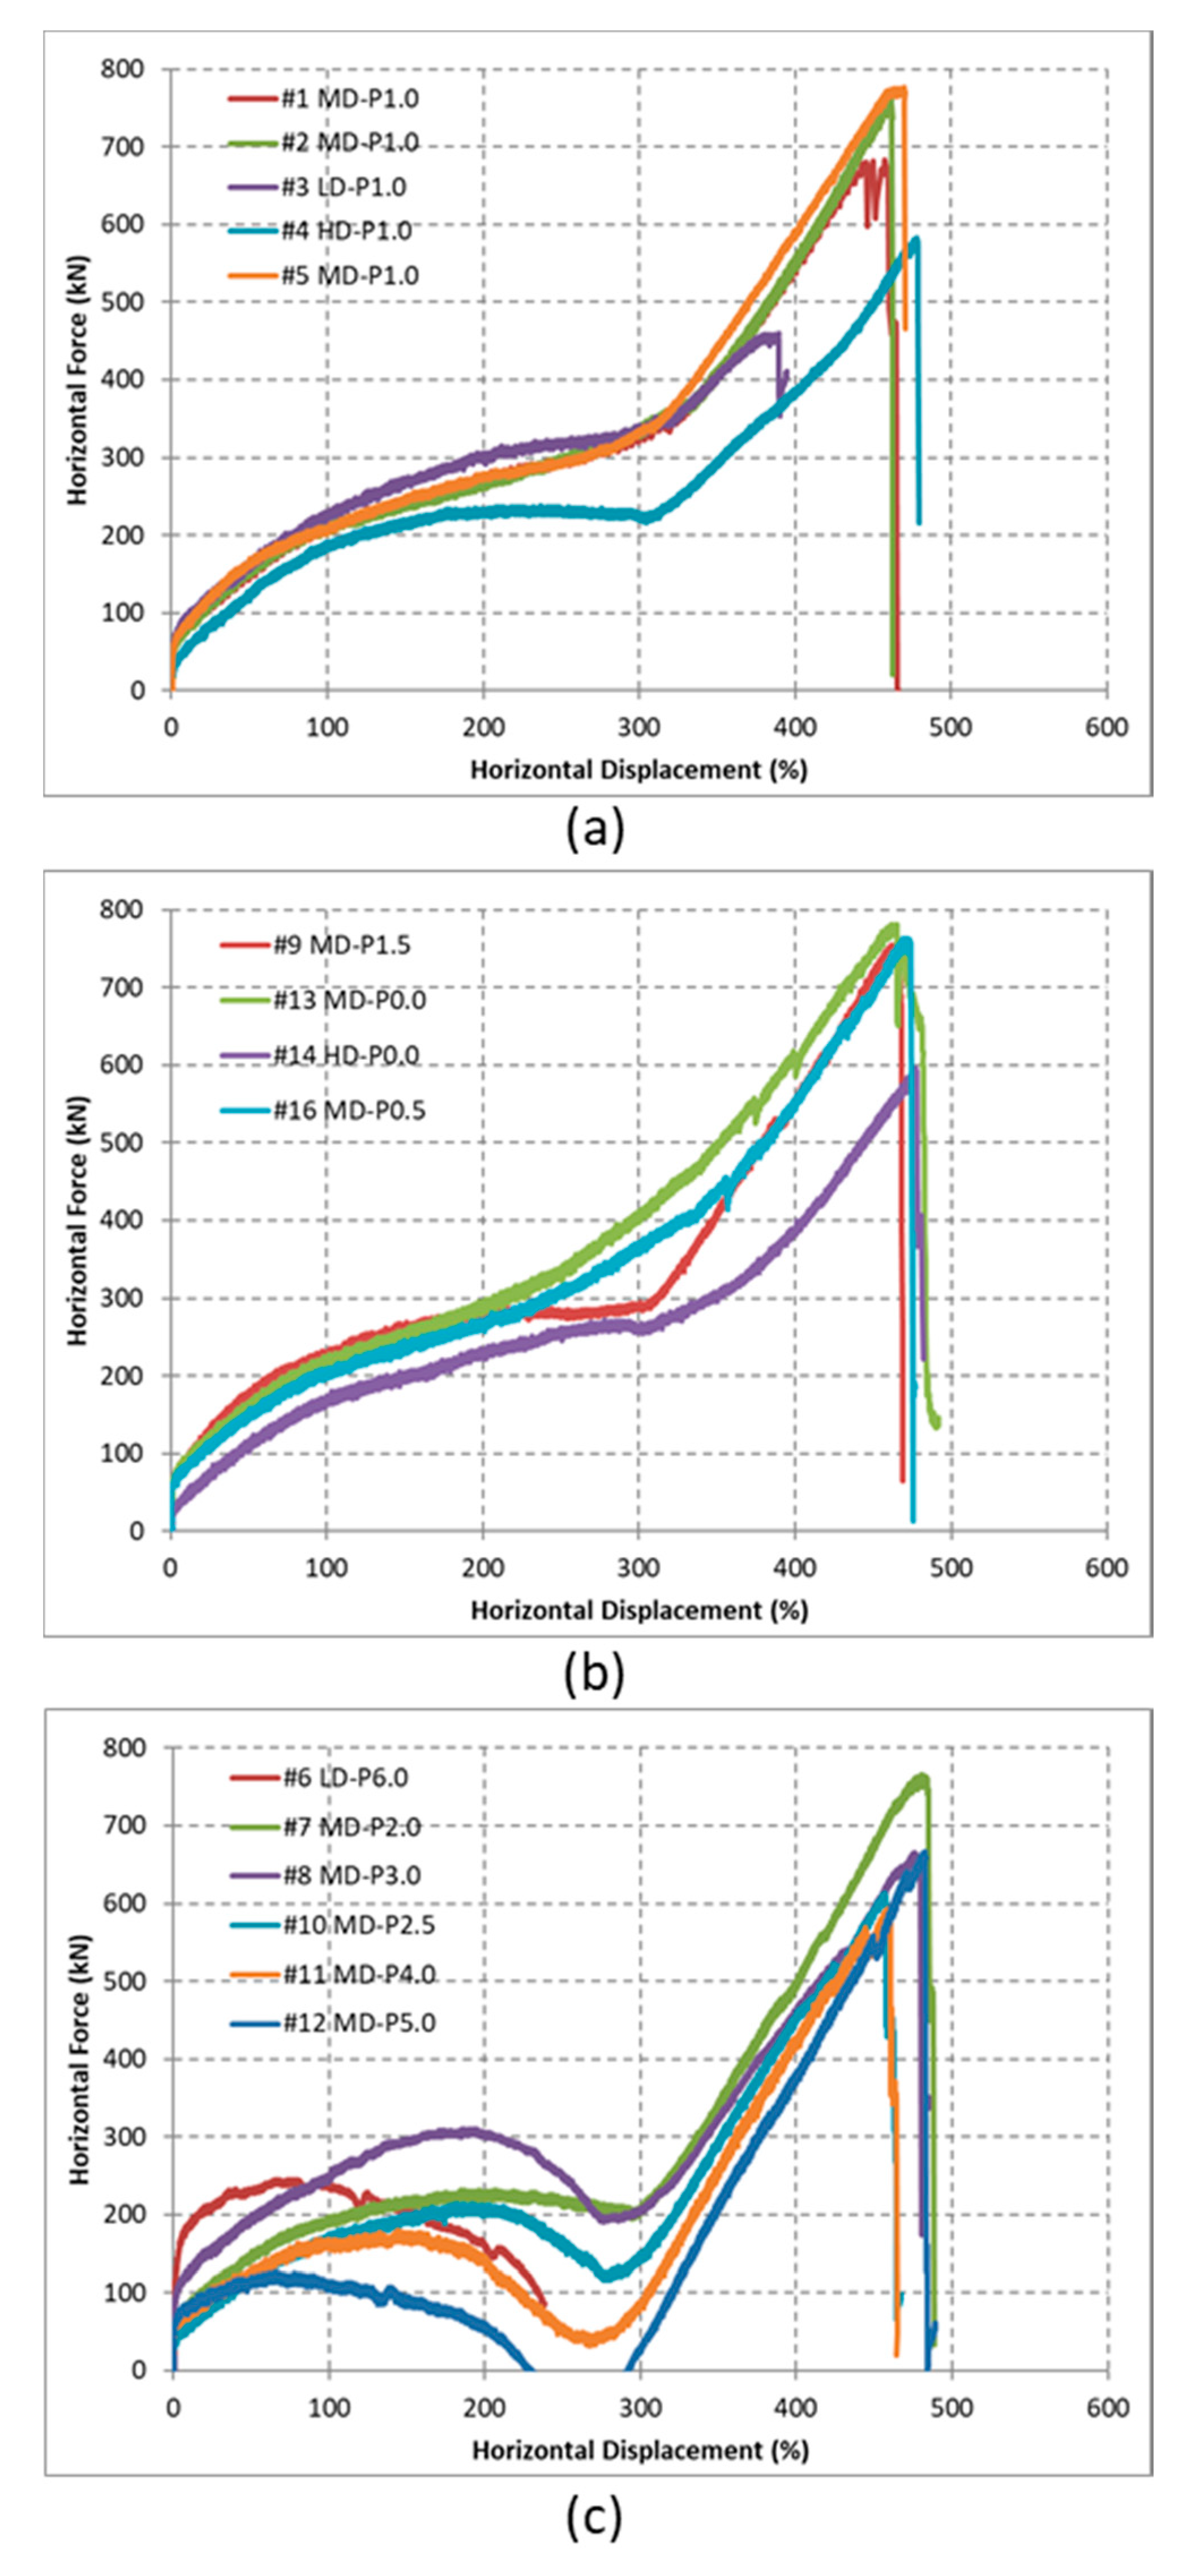
4.1. Experimental Setup

To obtain more data on the capacity of the LRBs, additional experiments were conducted on bearings smaller in size than those presented earlier for the model development. The dimensions of the LRB specimens are shown in Figure 14 [13,28,29]. The diameters of the LRB and lead core were 550 mm and 120 mm, respectively, and the total rubber thickness was 112 mm. Fifteen specimens, as listed in Table 4, were tested until failure. It should be noted that these specimens had experienced horizontal loading prior to the failed test and could have been slightly damaged; the LRBs were therefore classified as low damage (LD), moderate damage (MD), and high damage (HD) for previously experienced shear strain levels of 100%, 300%, and 400%, respectively [18]. The fourth column in Table 4 lists the experimental variable P/Pd, which is the ratio of the axial load to the design axial load, ranging from 0 to 6. Each test was performed by horizontal displacement control loading under these axial loading conditions.
Test results are depicted in Figure 15. The MD specimens under 1.0 Pd (design axial force) show consistent results, whereas the HD specimen shows decreased stiffness likely due to damage in previous loading cycles (Figure 15a). Additionally, the LD specimen under 1.0 Pd fails at a lower shear strain, which could be due to specimen variability. The results tested under axial loads up to 1.5 Pd Figure 15b) are not much different than the 1.0 Pd results. When the axial load exceeded 2.0 Pd, the stability limit was reached for several bearings followed by negative stiffness that caused a decrease in force and displacement capacity (Figure 15c). The buckling load, failure load, and failure displacement can be found in Table 4 [29]. While buckling can be considered a failure mode for a single isolator, it does not necessarily indicate the failure of the entire isolation system consisting of 486 bearings. Additionally, the bearings are able to regain stiffness at large strains that improve the overall dynamic stability of the isolation system. Therefore, shear failure following the stability limit is considered as a failure to investigate the upper bound of the CS in this study.

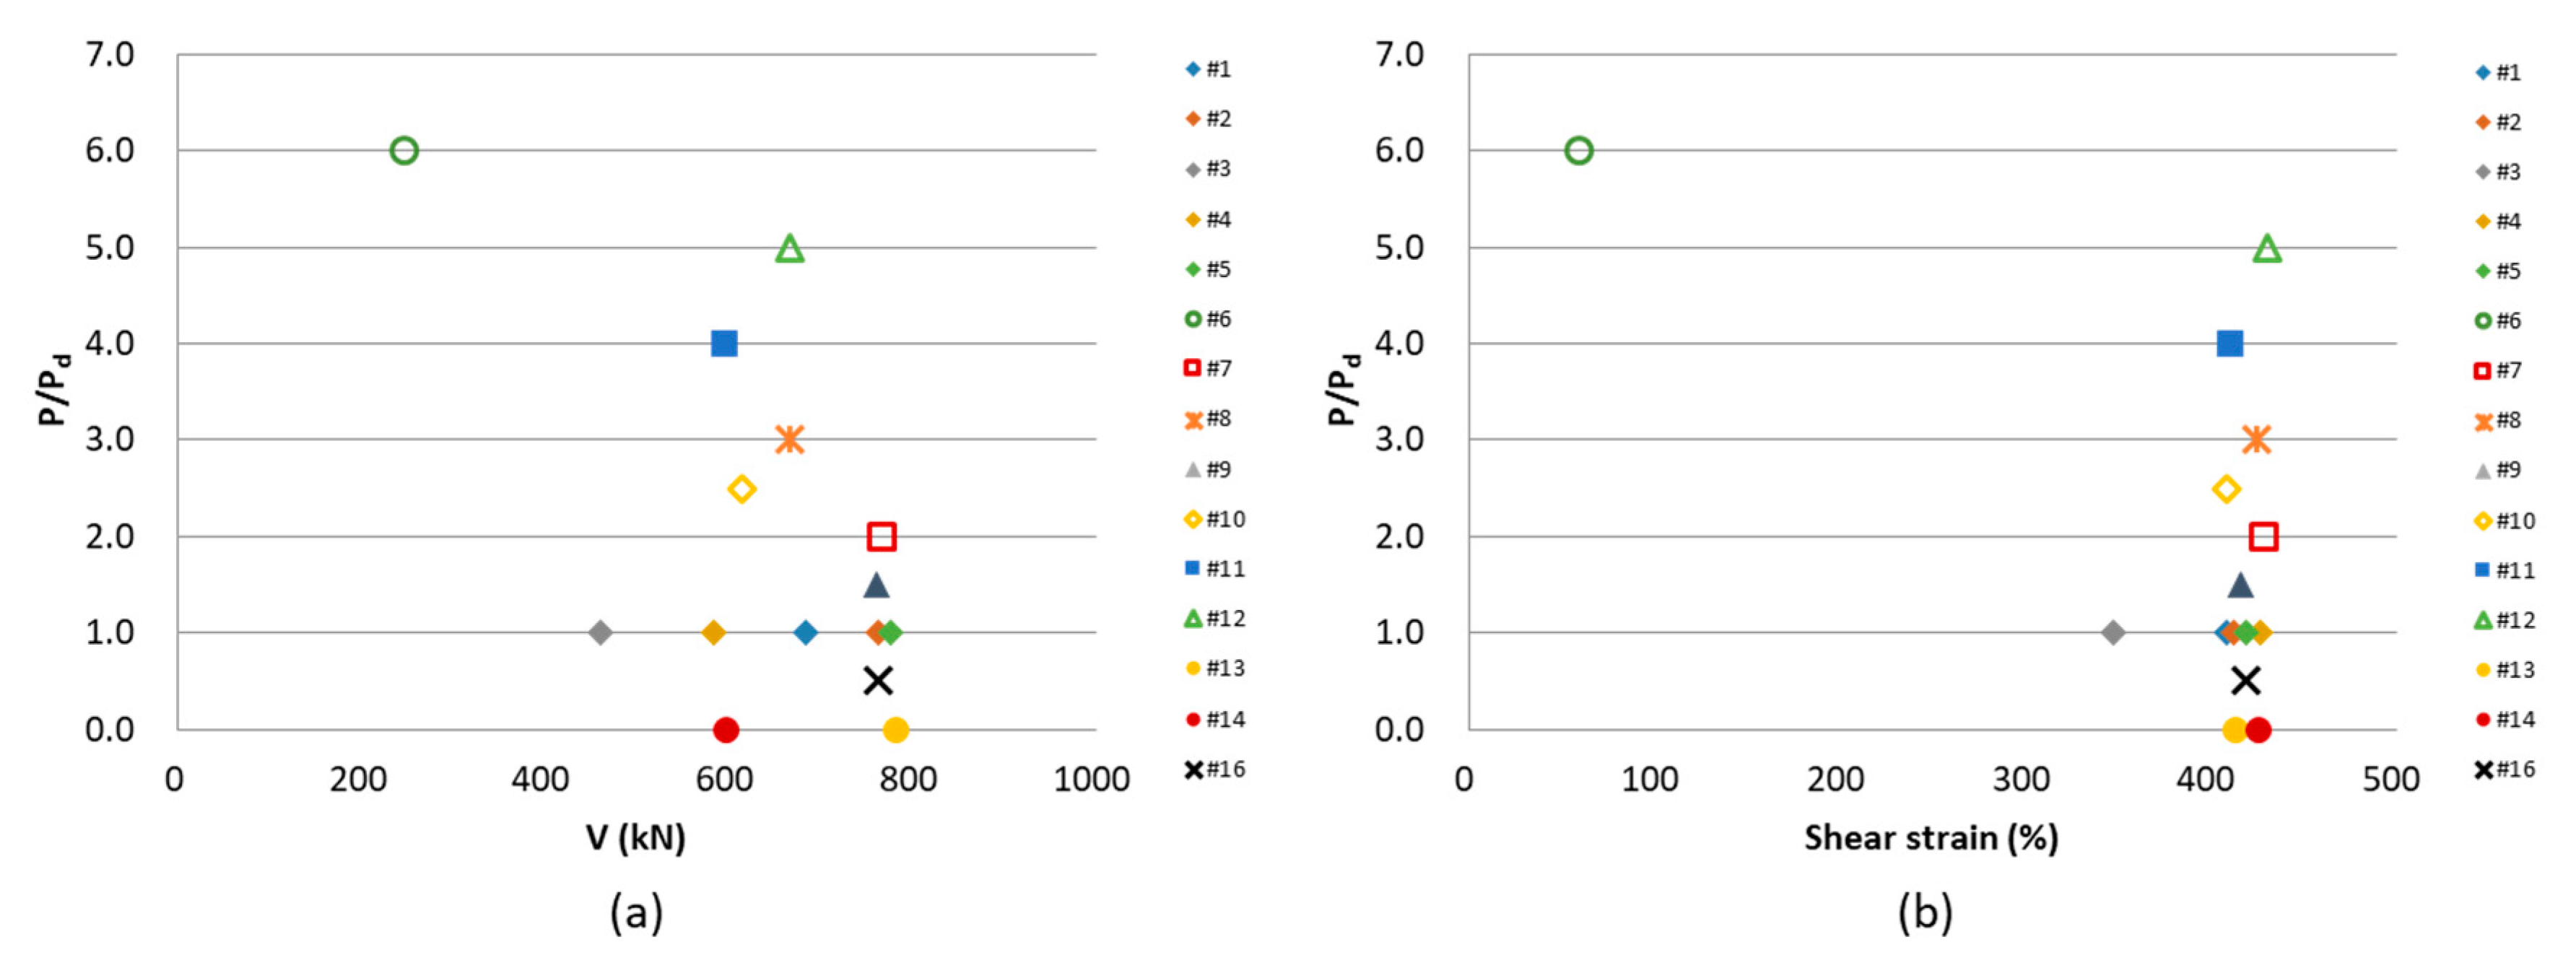
4.2. Ultimate Property Diagram

The failure criteria of the LRBs can be represented by an ultimate property diagram (UPD) [30]. The vertical load on an LRB affects its failure mode and shear failure capacity; the UPD shows this relationship, namely between the axial load and the shear load or strain of the limit state. In this research, UPDs were predicted experimentally because of difficulties in numerical analysis.
Figure 16a,b show UPDs based on the failure load and failure strain, respectively, from the test results in Table 4. As can be seen in the figure, the failure strains of the specimens are rather consistent at about 420%, compared to the failure loads. Therefore, within a certain level of vertical load, the shear strain can be a failure criteria parameter.

5. Clearance to the Stop in Accordance with Performance Criteria

5.1. Performance Criteria in Codes

The performance criteria for seismically isolated nuclear structures has been suggested in standards such as ASCE 4–16 [16] and NUREG/CR-7253 [15]. According to the standards, seismically isolated NPPs should allow for sufficient displacement of the isolation layer to reduce the acceleration induced by ground motions, while the failure probabilities of the superstructure, isolation systems, and umbilical lines remain at low levels, as specified below.
NUREG/CR-7253 gives performance and design recommendations for seismically isolated NPPs at two levels of ground motion: GMRS+ and BDBE GMRS. The first, GMRS+, covers RG1.208 GMRS and the minimum foundation input motion, while the second, BDBE GMRS, covers the UHRS (uniform hazard response spectrum) at a mean annual frequency of exceedance of 1 × 10⁻⁵ and 167% of GMRS+. The criteria under BDBE GMRS loading are normally critical. Isolation systems need to have 90% confidence of surviving without loss of gravity-load capacity, and the superstructure needs to have less than a 10% probability of contacting with a hard stop (moat wall) under BDBE GMRS loading. To satisfy these criteria, the CS has to be greater than the 90th percentile displacement of the structure under BDBE GMRS loading, and the isolation system and umbilical lines need to be designed to have 90% confidence or higher for the CS. The capacity of the interfacing components such as the umbilical lines is assumed in this work, and thus the failure of the umbilical lines is not considered at present.

5.2. Lower Bound of CS from Displacement Response

The RG1.60 design spectrum with PGA = 0.5 g can be regarded as the GMRS in the present work because a specific target site was not designated, and therefore the 20 ground motions detailed in Section 2.3 were selected for the analysis. An amplification factor AR was calculated to be about 2 because the ratio of the peak ground acceleration at an annual frequency of exceedance of 10−4 and 10−5 is about 2 based on a related hazard analysis in Korea [31]. Therefore, the BDBE GMRS is assumed as the RG1.60 design spectrum with PGA = 1.0 g.
Figure 17 shows a histogram of the maximum displacements of the AB at ground level (height = 100 ft) subjected to 20 ground motions (Table 3) for BDBE GMRS loading (PGA = 1.0 g).
As shown in Figure 17, the mean maximum displacement was about 0.77 m. If a normal distribution is assumed, the 90th percentile of the displacement is about 0.86 m (2.81 ft). The superstructure has less than a 10% probability of contact with a hard stop (moat wall) under BDBE GMRS loading, as the codes suggested. In other words, the lower bound of the CS is about 0.86 m in this case.

5.3. Upper Bound of CS from UPD

In this research, a fragility curve for the LRBs was estimated from the maximum likelihood method suggested by Shinozuka et al. [32]. The empirical fragility curve of the LRBs is assumed as a cumulative distribution function of the lognormal distribution, as shown in Equation (1),
F ( e ) = Φ [ ln ( e / e m ) β c ]
where e and e m are the shear strain (%) and the median value of the strain, respectively, β c is the log-standard deviation, and Φ [ · ] is the cumulative standard normal distribution function.
The likelihood function for the estimation can be defined as Equation (2) [32],
L = i = 1 N [ F ( e i ) ] x i [ 1 F ( e i ) ] 1 x i
where e i is the shear strain (%) to which the ith LRB is subjected, x i = 1 or 0 depending on whether the LRB failed or not, and N is the total number of tested LRBs.
Two parameters, e m and β c , are estimated from Equation (3), which finds the parameters to maximize the likelihood function L .
d ln L d e m = d ln L d β c = 0
The median shear failure strain and log-standard deviations were about 413% and 0.051, respectively. Figure 18 shows the empirical fragility curve. The test results in Figure 16 with the highest axial load (Test #6) was not included in this failure probability estimation because it exceeded the range of interest.
The failure probability of a prototype LRB in an isolated NPP is assumed to be the same as the small-scale LRBs despite size effects, considering the practical difficulty to conduct ultimate property tests of prototype LRBs. This assumption is considered to be acceptable based on the fact that the shear failure of the full-scale LRB specimen occurred at approximately 515% shear strain level [14]. From the fragility curve, the 10th percentile of the failure strain is about 387% or 0.87 m for a full-scale LRB with 0.224 m rubber thickness. Thus, 0.87 m can be the upper bound of the CS to satisfy the performance criteria that the isolation system should have 90% confidence of surviving without loss of gravity-load capacity. This condition is reasonable when the axial load remains within about 3 times the design value, as shown in Figure 16.
The design axial force is about 22,000 kN for the full-scale isolator of an NPP [14]. Figure 19 shows the initial dead load distribution on the 486 LRBs from the ANT model. The vertical load differs depending on the location, and it is about 10,000 kN or half of the design axial load, as shown in Figure 19.
Figure 20 shows the axial load distribution of the 486 isolators when the PGA of the ground motions was 1.0 g (BDBE GMRS level). Here, the axial load increased from the initial vertical load but remained within the design axial load, 22,000 kN. In case of ground motions with PGA = 1.25 g, the axial load reached 1.5 times the design load. Therefore, for the ground motions in this analysis, the failure probability in Figure 18 is considered acceptable.
As a result of the analysis, the range of the CS is about 0.86 m to 0.87 m (384% to 387% shear strain) in this research, with the expectation that the numerical models, experimental results, and all assumptions were reasonably generated to reflect realistic seismic behavior of the structures and isolators under consideration.

6. Conclusions

In this paper, we integrated NPP and LRB structural models to investigate the response, capacity, and clearance to the stop of an isolated NPP based on given performance criteria. From the experimental results and analysis, the following conclusions are drawn.
(1)
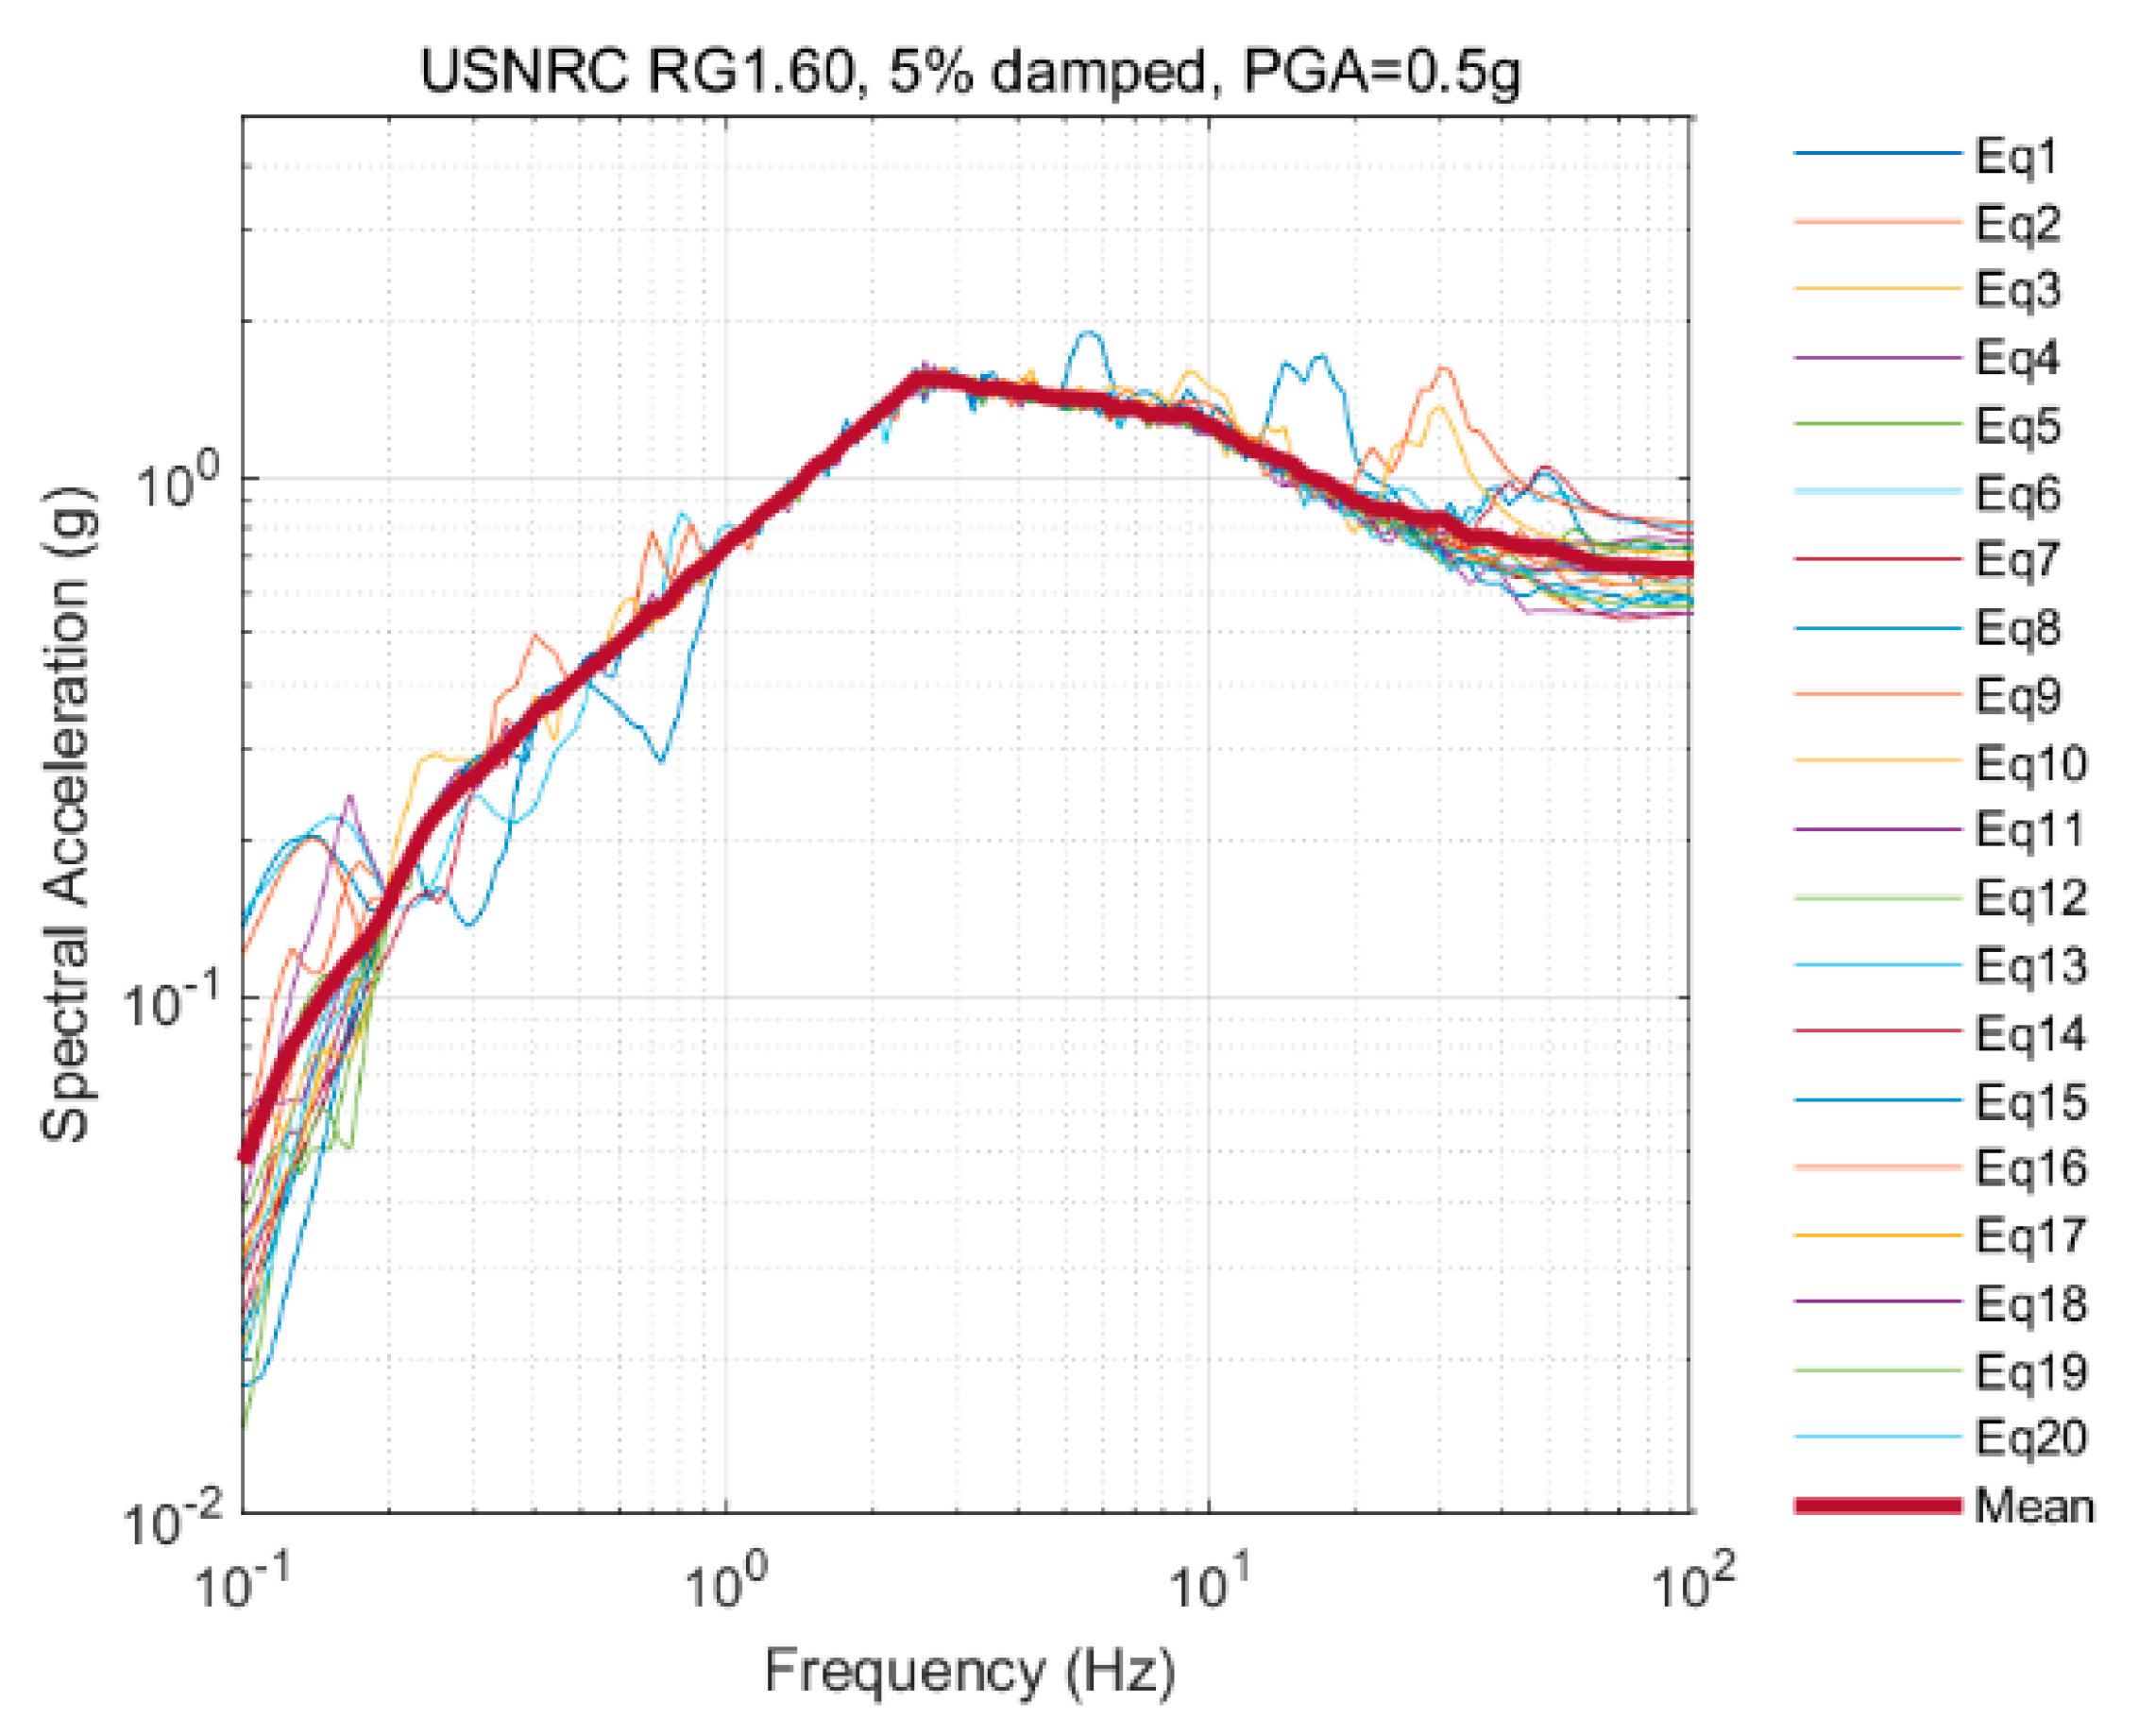
The RG1.60 design spectrum with PGA = 0.5 g and PGA = 1 g were used for the GMRS and BDBE GMRS because a target site was not designated. An amplification factor for the BDBE GMRS was determined to be about 2 from the ratio of the PGA at an annual frequency of exceedance 10−4 and 10−5 based on a hazard analysis in Korea.
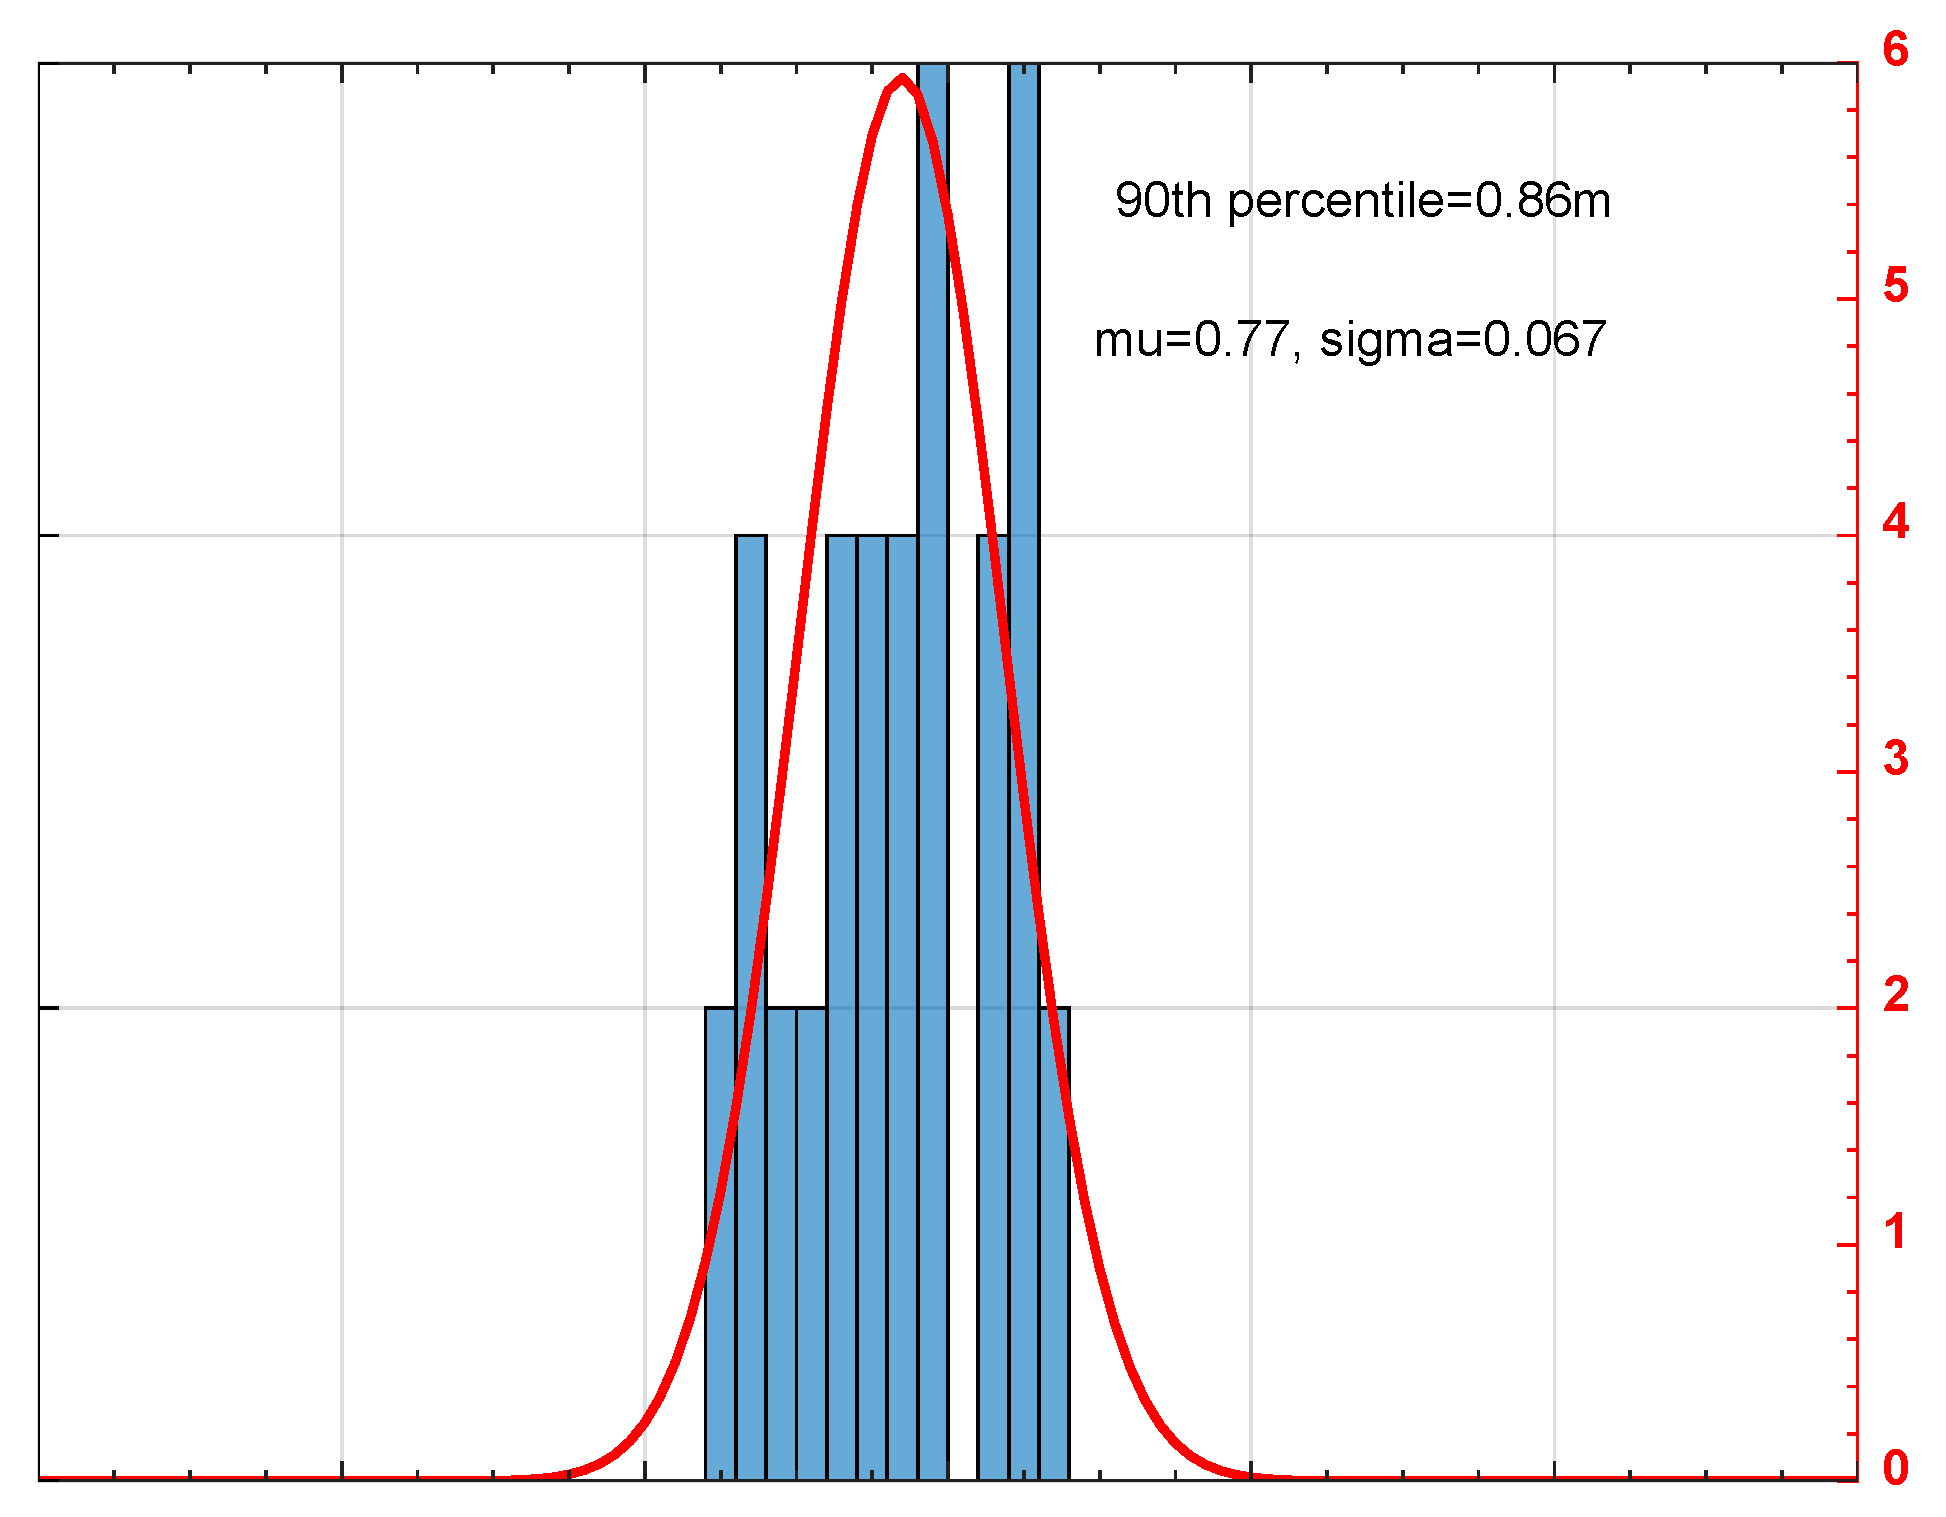
(2)
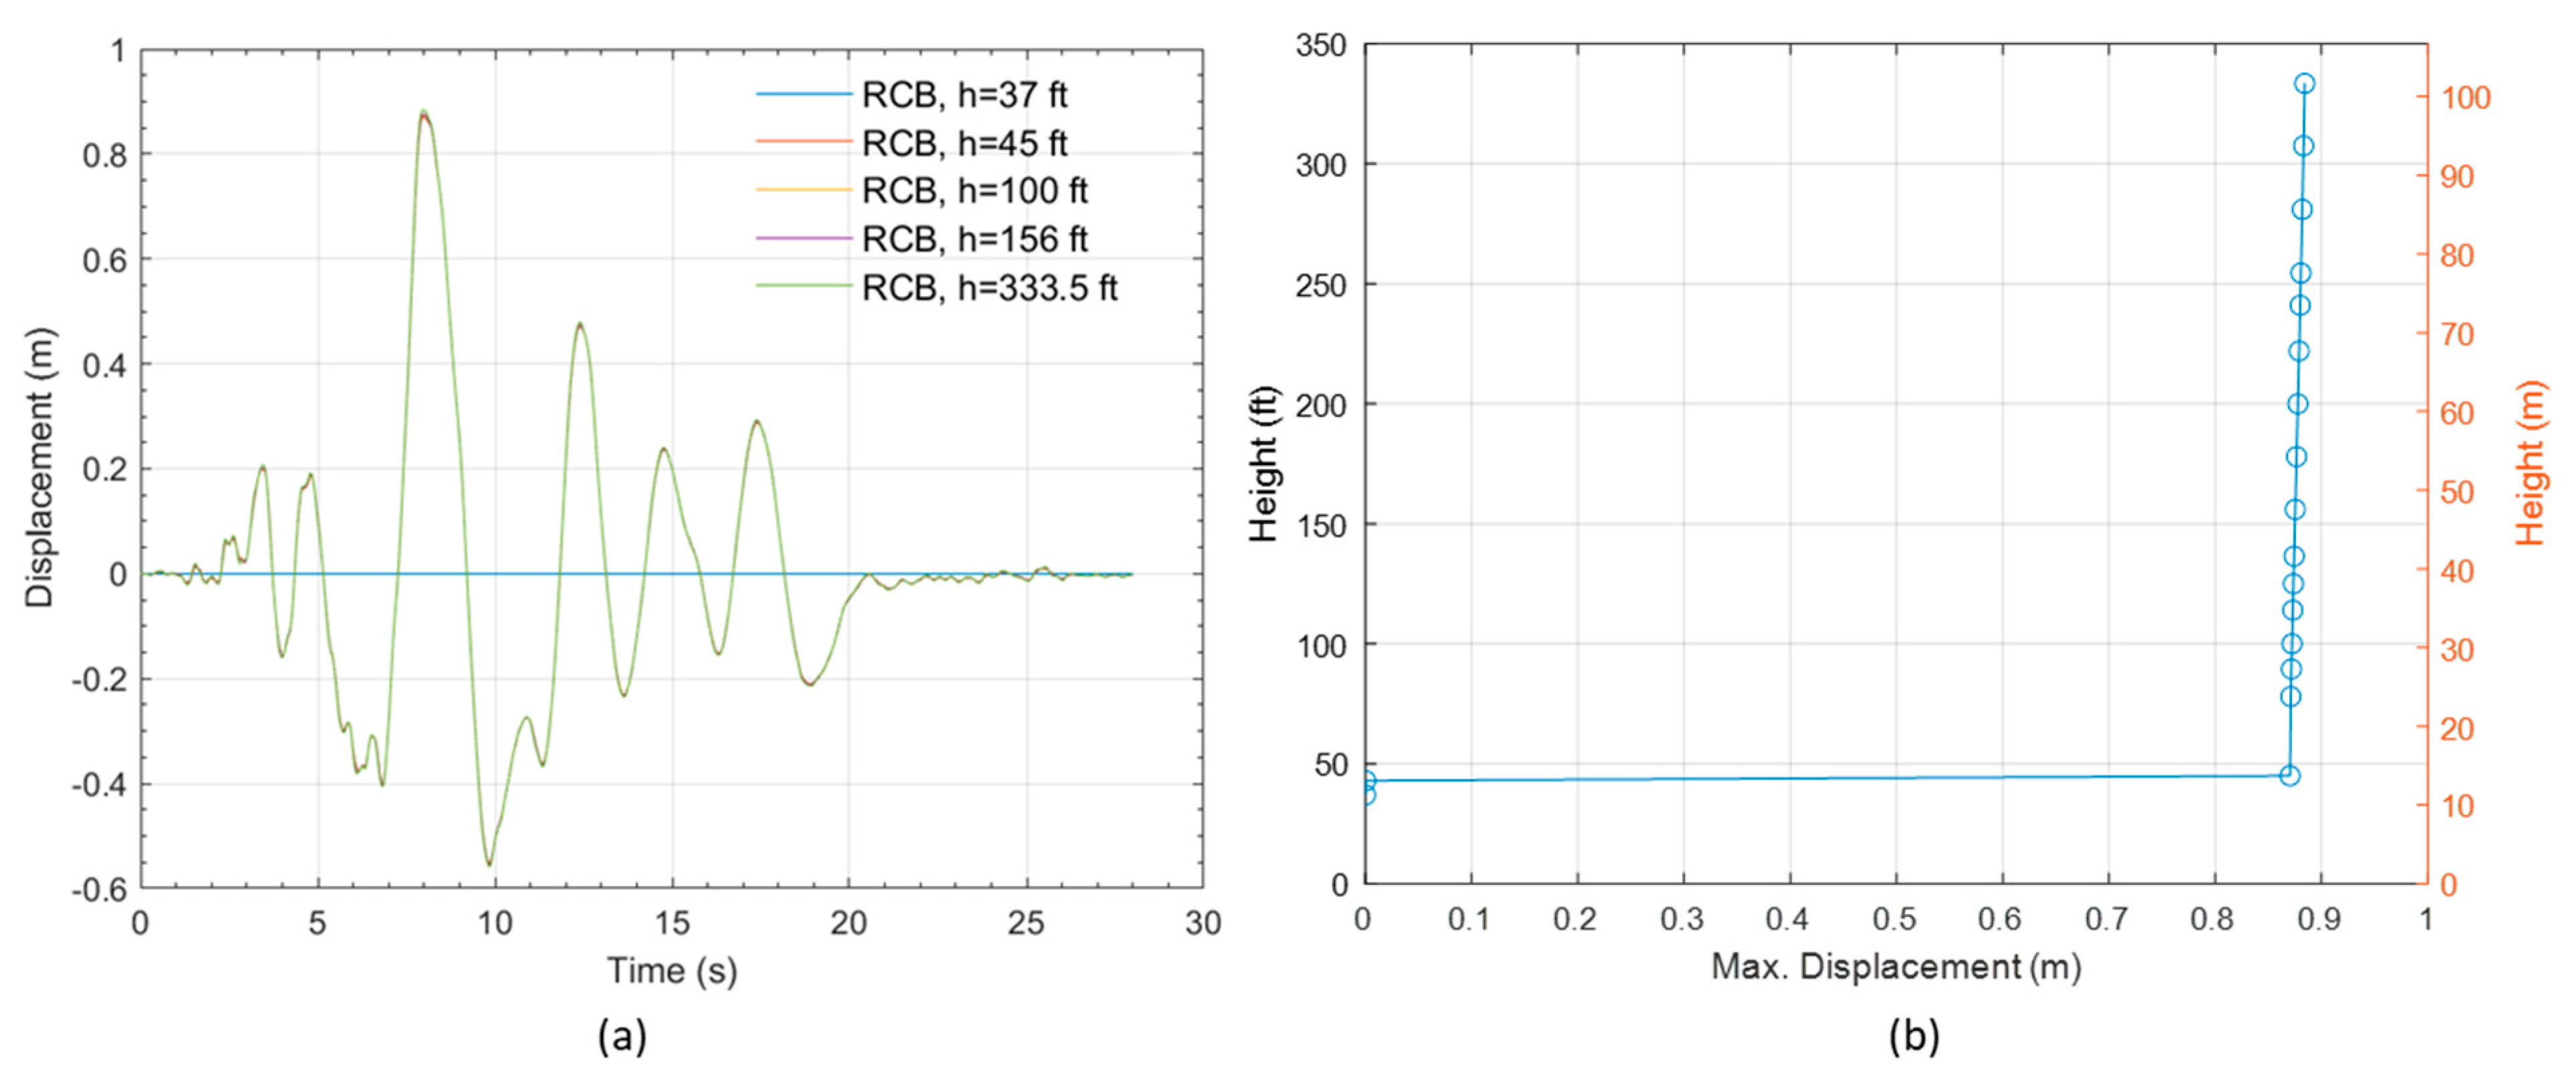
Assuming a normal distribution for the resulting maximum displacement under BDBE GMRS loading, the 90th percentile of the displacement was about 0.86 m. In this case, CS should be greater than 0.86 m based on the performance criteria that the superstructure has less than a 10% probability of contact with a hard stop (moat wall) under BDBE GMRS loading.
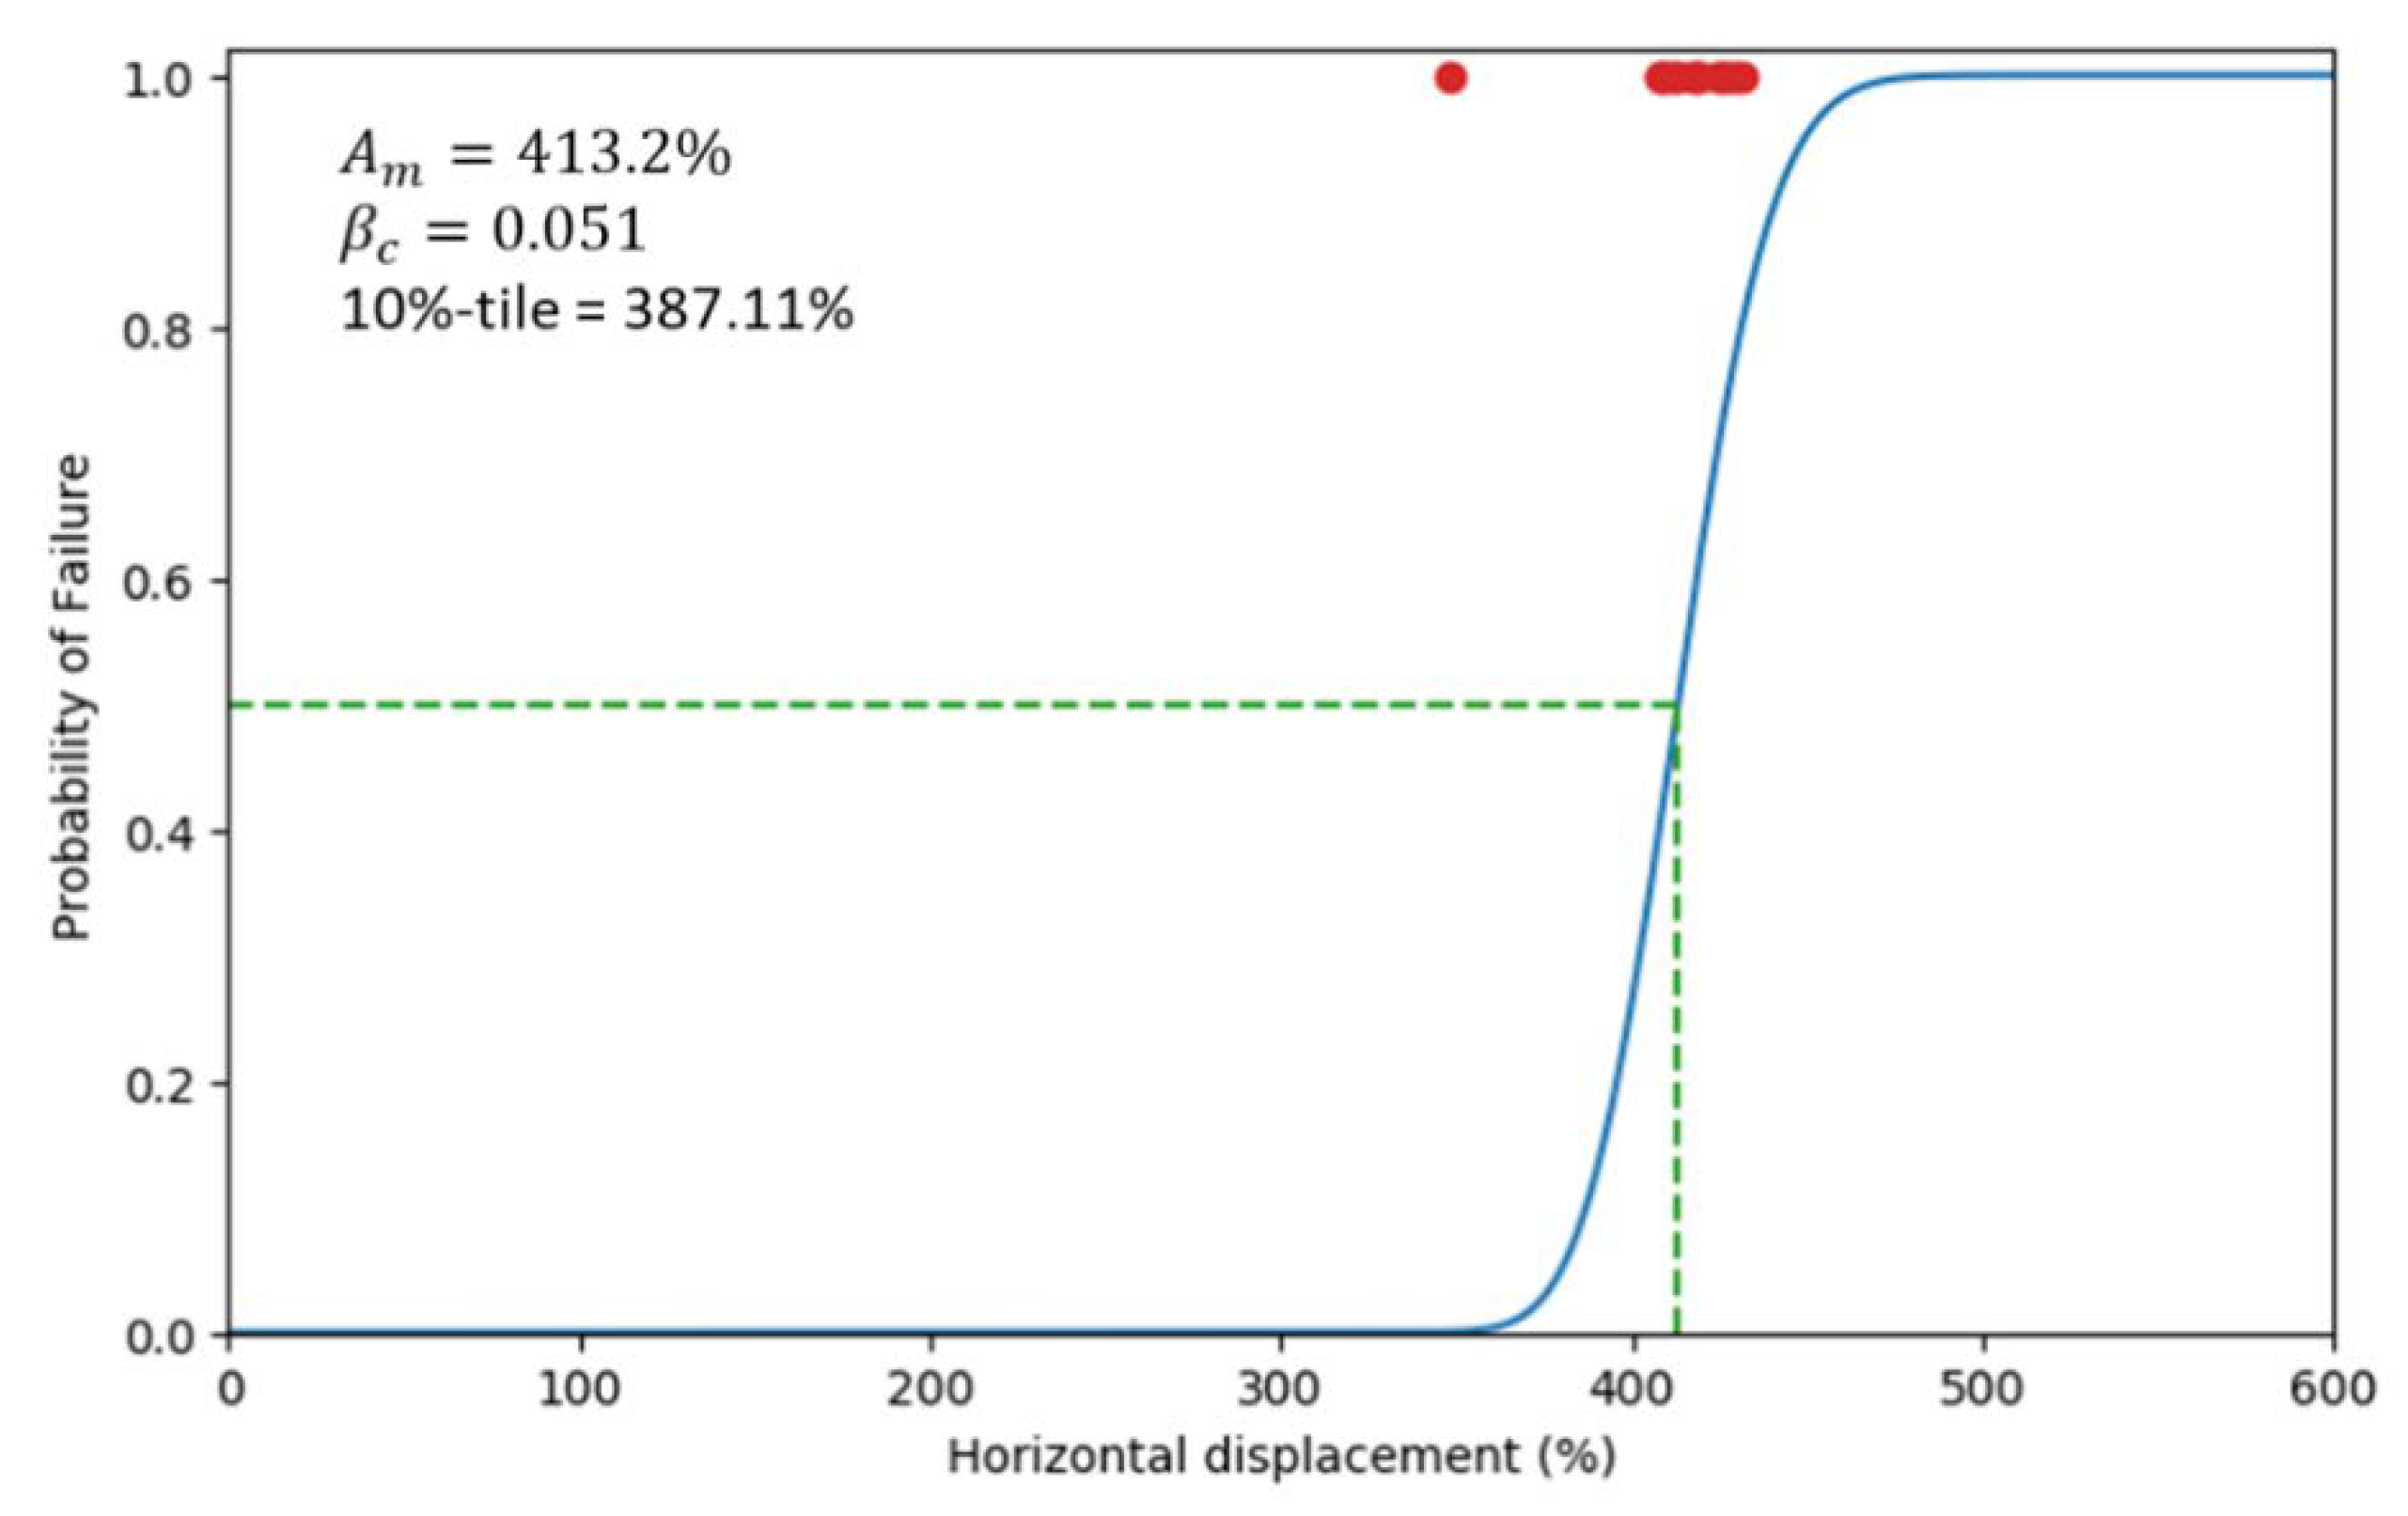
(3)
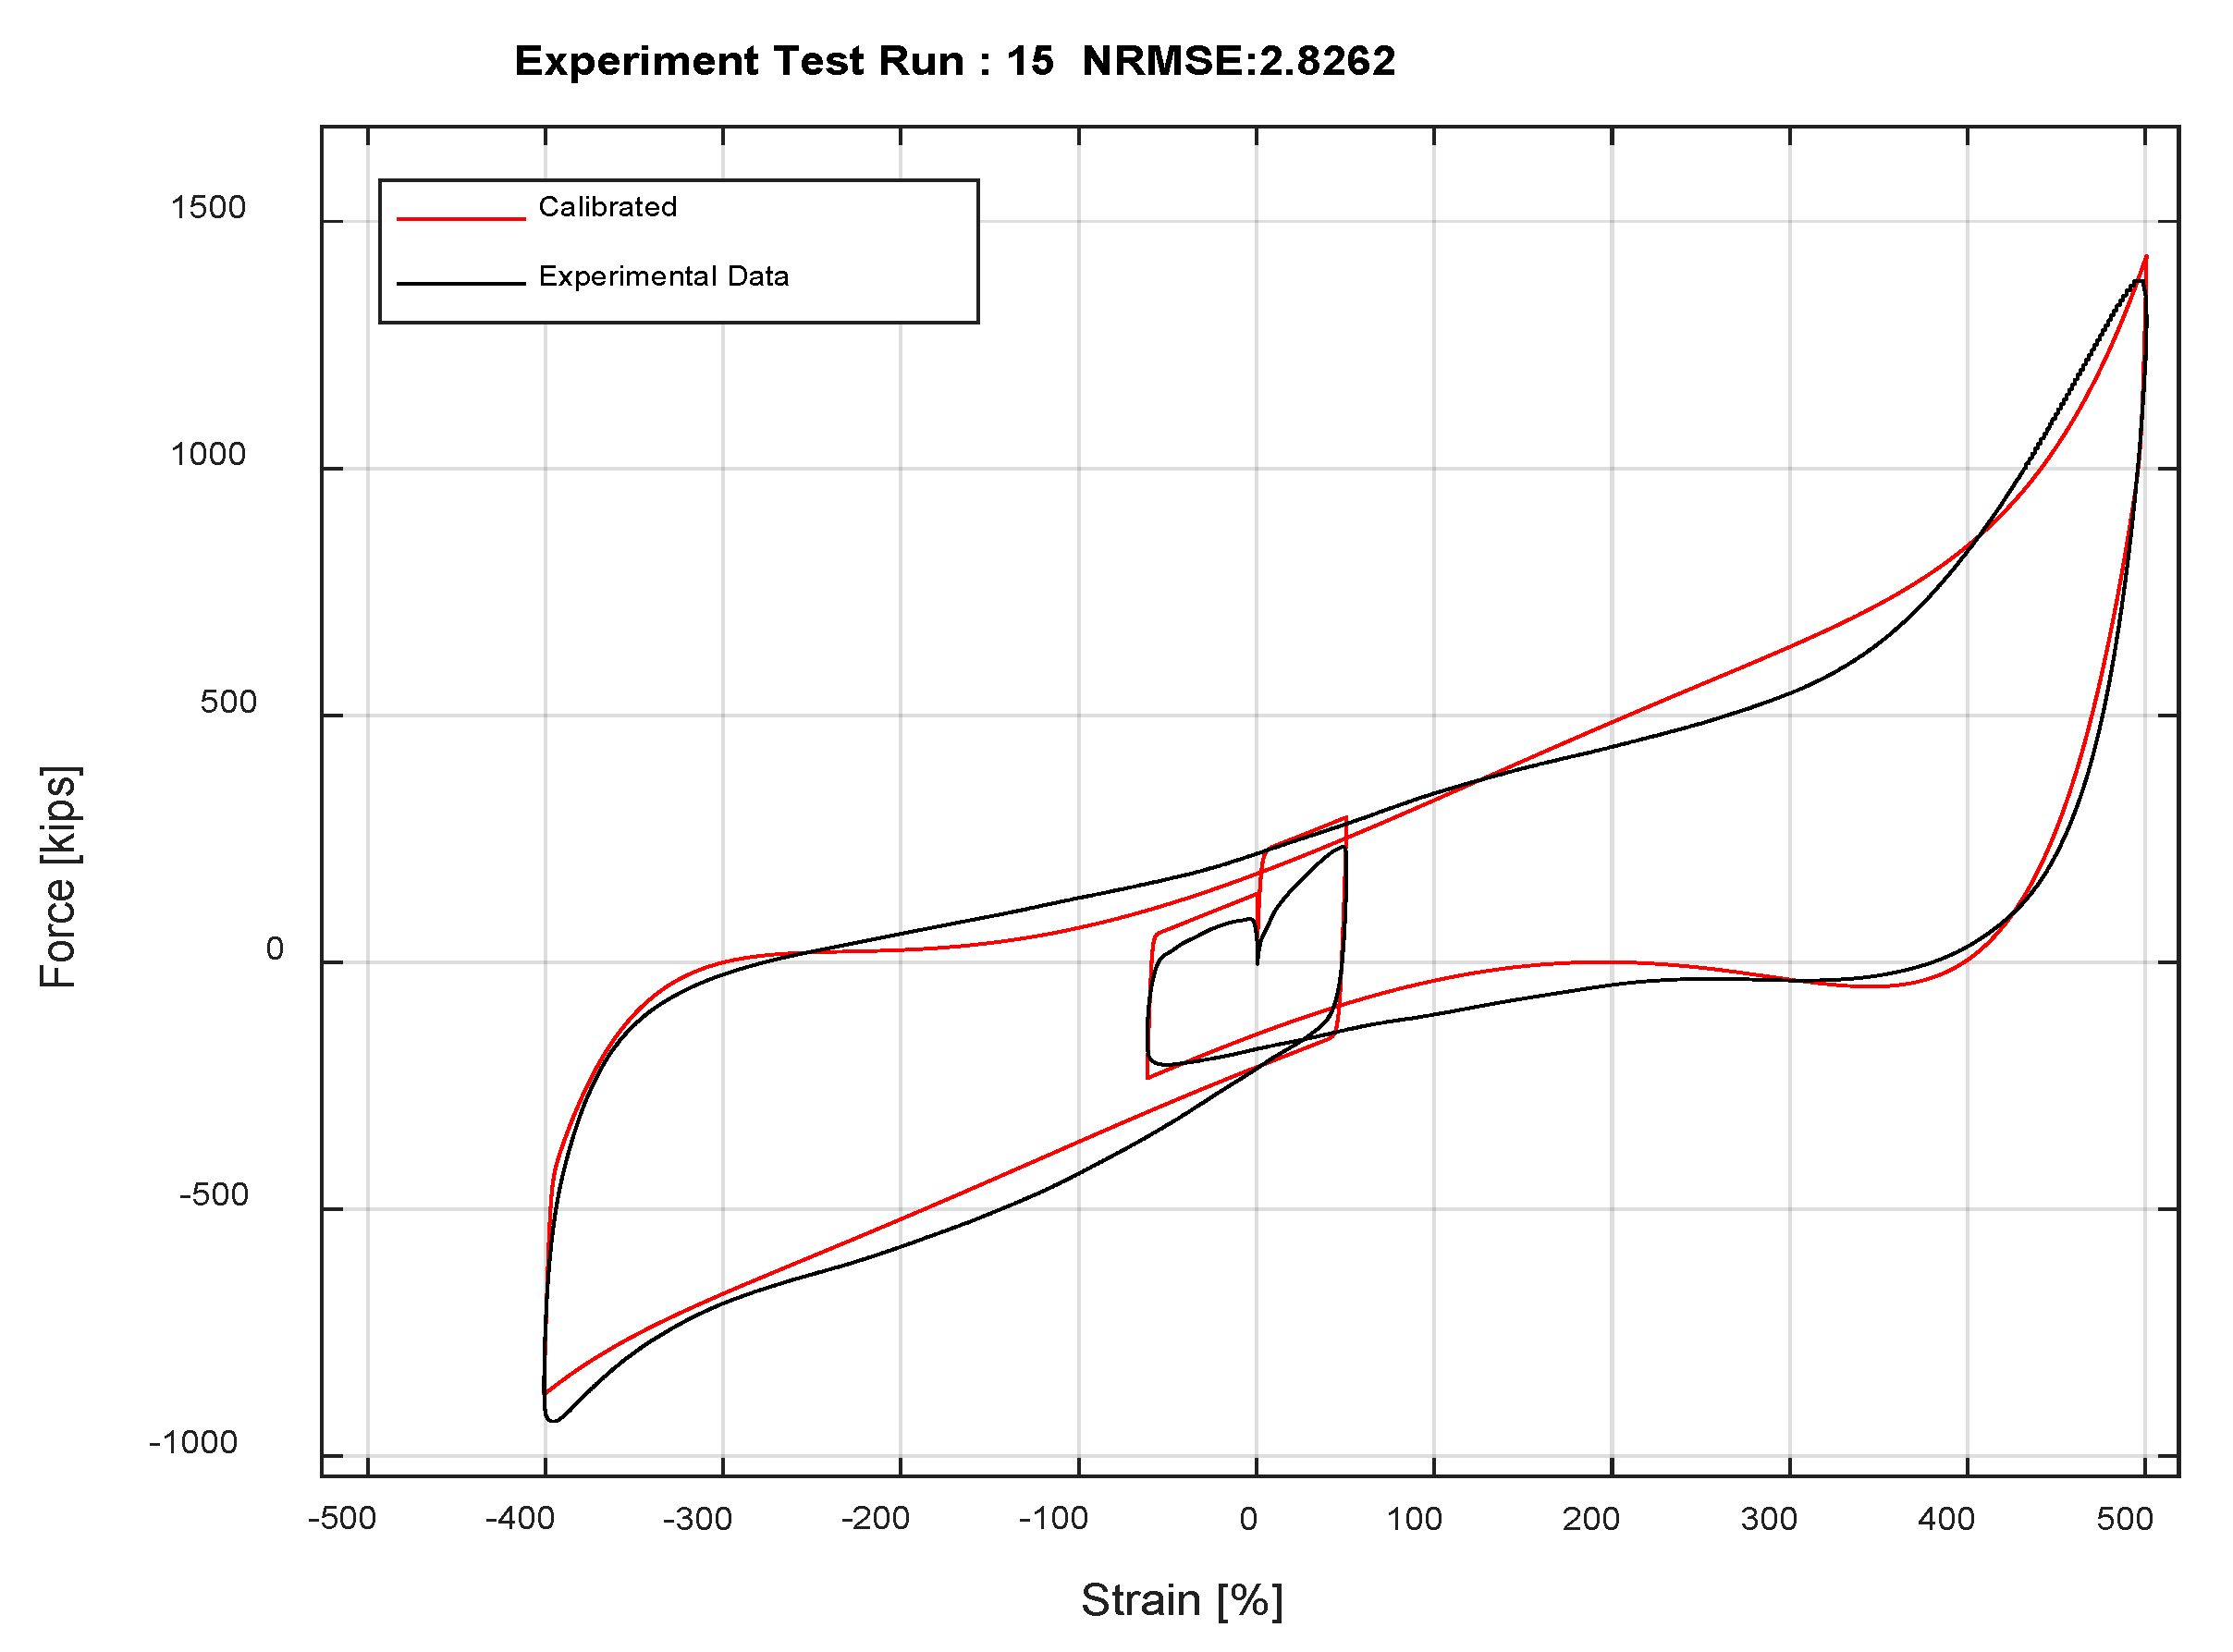
The shear strain of the LRB can be a failure criteria within a certain level of vertical loading based on the UPD, which represents the results of bearing capacity experiments. Failure probability using the shear strain parameter can be calculated by maximum likelihood estimation. The median failure strain was about 413%, and the 10th percentile was about 387% from the estimation. The 387% shear strain equates to 0.87 m for a full-scale LRB, which can be the upper bound of the CS to satisfy the performance criteria that the isolation system should have 90% confidence of surviving without loss of gravity-load capacity.
(4)
Limitations of this study include insufficient numbers of experiments as well as analysis results that are dependent on the particular models, ground motions, and criteria selected. Further research is necessary to reflect more realistic behavior of an isolated NPP under seismic loading and to suggest more reasonable ranges of clearance to the stop. Future work will address development of a bearing model that considers axial load. Consideration of the impact loading that occurs when the displacement of the NPP exceeds CS also needs further investigation.

Author Contributions

Conceptualization, G.A. and M.K.; methodology, G.A., J.-W.J. and J.F.M.; software, J.F.M.; validation, M.K.; formal analysis, G.A.; investigation, G.A. and J.-W.J.; resources, M.K. and G.M.; data curation, G.A.; writing—original draft preparation, G.A.; writing—review and editing, G.A., M.K., J.-W.J. and G.M.; visualization, G.A.; supervision, M.K.; project administration, M.K.; funding acquisition, M.K. All authors have read and agreed to the published version of the manuscript.

Funding

This research was supported by the National Research Foundation of Korea (NRF) grant funded by the Korean government (Ministry of Science and ICT) (No.2017M2A8A4014829).

Conflicts of Interest

The authors declare no conflict of interest.

References

  1. Whittaker, A.S.; Sollogoub, P.; Kim, M. Seismic isolation of nuclear power plants: Past, present and future. Nucl. Eng. Des. 2018, 338, 290–299. [Google Scholar] [CrossRef]
  2. Zhou, Z.; Hu, X.; Wong, J. Special Issues in the Application of Seismic Isolation to Nuclear Power Plants. Energies 2018, 11, 2333. [Google Scholar] [CrossRef] [Green Version]
  3. Forni, M.; Poggianti, A.; Dusi, A. Seismic Isolation of Nuclear Power Plants. In Proceedings of the 15th World Conference on Earthquake Engineering, Lisbon, Portugal, 24–28 September 2012. [Google Scholar]
  4. Kumar, M.; Whittaker, A.S.; Constantinou, M.C. Seismic Isolation of Nuclear Power Plants Using Elastomeric Bearings; MCEER-15-0008; University at Buffalo, The State University of New York: Buffalo, NY, USA, 2015. [Google Scholar]
  5. Rahnavard, R.; Craveiro, H.D.; Napolitano, R. Static and dynamic stability analysis of a steel-rubber isolator with rubber cores. Structures 2020, 26, 441–455. [Google Scholar] [CrossRef]
  6. Rahnavard, R.; Thomas, R.J. Numerical evaluation of steel-rubber isolator with single and multiple rubber cores. Eng. Struct. 2019, 198, 109532. [Google Scholar] [CrossRef]
  7. Radkia, S.; Rahnavard, R.; Tuwair, H.; Gandomkar, F.A.; Napolitano, R. Investigating the effects of seismic isolators on steel asymmetric structures considering soil-structure interaction. Structures 2020, 27, 1029–1040. [Google Scholar] [CrossRef]
  8. Park, J.; Choun, Y.; Kim, M.; Hahm, D. Revaluation of the aging property modification factor of lead rubber bearings based on accelerated aging tests and finite element analysis. Nucl. Eng. Des. 2019, 347, 59–66. [Google Scholar] [CrossRef]
  9. Sanchez, J.; Masroor, A.; Mosqueda, G.; Ryan, K. Static and Dynamic Stability of Elastomeric Bearings for Seismic Protection of Buildings. Asce J. Struct. Eng. 2013, 139, 1149–1159. [Google Scholar] [CrossRef]
  10. Schellenberg, A.H.; Sarebanha, A.; Schoettler, M.J.; Mosqueda, G.; Benzoni, G.; Mahin, S.A. Hybrid Simulation of Seismic Isolation Systems Applied to an APR-1400 Nuclear Power Plant; Pacific Earthquake Engineering Research Center: Berkeley, CA, USA, 2015.
  11. Sarebanha, A.; Mosqueda, G.; Kim, M.; Kim, J. Seismic response of base isolated nuclear power plants considering impact to moat walls. Nucl. Eng. Des. 2018, 328, 58–72. [Google Scholar] [CrossRef]
  12. Mosqueda, G.; Marquez, J.; Hughes, P. Modeling of base-isolated nuclear power plants subjected to beyond design basis shaking. In Proceedings of the 25th Conference on Structural Mechanics in Reactor Technology, Charlotte, NC, USA, 4–9 August 2019. [Google Scholar]
  13. Kim, M.; Kim, J.; Hahm, D.; Park, J.; Choi, I. Seismic performance assessment of seismic isolation systems for nuclear power plants, PVP2016-63742 (Pressentation only). In Proceedings of the ASME 2016 Pressure Vessels and Piping Conference PVP2016, Vancouver, BC, Canada, 17–21 July 2016. [Google Scholar]
  14. Kim, J.; Kim, M.; Choi, I. Experimental study on seismic behavior of lead-rubber bearing considering bi-directional horizontal input motions. Eng. Struct. 2019, 198, 109529. [Google Scholar] [CrossRef]
  15. United States Nuclear Safety Commision (U.S.NRC). Technical Considerations for Seismic Isolation of Nuclear Facilities; NUREG/CR-7253; U.S.NRC: Washington, DC, USA, 2019.
  16. ASCE. Seismic Analysis of Safety-Related Nuclear Structures, ASCE/SEI Standard 4-16; ASCE American Society of Civil Engineers: Reston, VA, USA, 2017. [Google Scholar]
  17. Kumar, M.; Whittaker, A.S. On the calculation of the clearance to the hard stop for seismically isolated nuclear power plants. In Proceedings of the Transactions, 23th International Conference on Structural Mechanics in Reactor Technology (SMiRT-23), Manchester, UK, 10–14 August 2015. [Google Scholar]
  18. Mosqueda, G.; Sarebanha, A. Effect of Moat Wall Impact on the Seismic Response of Base Isolated Nuclear Power Plants; KAERI/CM-2452; Korea Atomic Energy Research Institute: Daejeon, Korea, 2017. [Google Scholar]
  19. Hughes, P.; Marquez, J.; Mosqueda, G. Advanced Numerical Modeling of Seismic Isolation Bearings and Moat Walls for Impact Simulations to Evaluate Beyond Design Basis Shaking of Base Isolated Nuclear Power Plants; University of California: San Diego, CA, USA, 2019. [Google Scholar]
  20. Kim, J.; Kim, M.; Choi, I. Experimental study on the bidirectional behavior of a lead-rubber bearing. In Proceedings of the 16th World Conference on Earthquake Engineering (16WCEE), Santiago, Chile, 9–13 January 2017. [Google Scholar]
  21. Kim, M.; Kim, J. Performance characteristics of seismic isolation devices for nuclear power plants according to real and small scale model test. In Proceedings of the Transactions, 24th International Conference on Structural Mechanics in Reactor Technology (SMiRT-24), Busan, Korea, 20–25 August 2017. [Google Scholar]
  22. OpenSees. Available online: http://opensees.berkeley.edu (accessed on 15 October 2020).
  23. Grant, D.; Fenves, G.; Whittaker, A. Bidirectional modelling of high-damping rubber bearings. J. Earthq. Eng. 2004, 8, 161–185. [Google Scholar] [CrossRef]
  24. Sarebanha, A.; Schellenberg, A.H.; Schoettler, M.J.; Mosqueda, G.; Mahin, S.A. Real-time hybrid simulation of seismically isolated structures with full-scale bearings and large computational models. Spec. Issuecomput Modeling Eng. Sci. 2019, 120, 693–717. [Google Scholar] [CrossRef] [Green Version]
  25. Schellenberg, A.; Baker, J.; Mahin, S.; Sitar, N. Investigation of Seismic Isolation Technology Applied to the APR 1400 Nuclear Power Plant; Pacific Earthquake Engineering Research Center, Headquarters at University of Carlifornia, Berkeley: Berkeley CA, USA, 2014.
  26. United States Nuclear Regulatory Commission (U.S.NRC). Regulatory Guide 1.60. Design Response Spectra for Seismic Design of Nuclear Power Plants; U.S.NRC: Washington, DC, USA, 2014.
  27. Korea Electric Power Corporation (KEPCO); Korea Hydro & Nuclear Power Co. (KHNP). Probabilistic Risk Assessment Summary Report, APR1400-E-P-NR-13001-NP; KEPCO: Naju-si, Korea, 2013. [Google Scholar]
  28. Kim, M.; Hahm, D.; Kim, J. Development of probabilistic seismic risk assessment methodology for seismically isolated nuclear power plants. In Proceedings of the Transactions, 25th International Conference on Structural Mechanics in Reactor Technology (SMiRT-25), Charlotte, NC, USA, 4–9 August 2019. [Google Scholar]
  29. Kim, J.; Kim, M.; Choi, I. Experimental Study on the Ultimate Property Diagram of Base Isolators. In Proceedings of the Korean Nuclear Society Autumn Meeting, Pyeongchang, Korea, 30–31 October 2014. [Google Scholar]
  30. Japan Electric Association (JEA). Design and Technical Guideline of Seismic Isolation Structure for Nuclear Power Plant, JEAG 4614-2000; Japan Electric Association (JEA): Tokyo, Japan, 2000. (In Japanese) [Google Scholar]
  31. Kim, M.; Kim, J.; Choi, I. Investigation of Performance Objectives for Seismic Isolation Systems of Nuclear Power Plants, KAERI/TR-4667; Korea Atomic Energy Research Institute: Daejeon, Korea, 2012. [Google Scholar]
  32. Shinozuka, M.; Feng, M.; Lee, J.; Naganuma, T. Statistical Analysis of Fragility Curves. J. Eng. Mech. 2000, 126, 1224–1231. [Google Scholar] [CrossRef] [Green Version]
Figure 1. ANT model.
Energies 13 06156 g001
Figure 2. Dimensions of the test bearings (unit: mm).
Energies 13 06156 g002
Figure 3. Strain-force curves in the unidirectional sinusoidal test [13]: (a) 300% Strain; (b) 400% Strain.
Energies 13 06156 g003
Figure 4. Parallel system of the bearing model [19].
Energies 13 06156 g004
Figure 5. LRB model calibration (500% shear strain test) [19].
Energies 13 06156 g005
Figure 6. Acceleration response spectra for 20 motions (PGA = 0.5 g).
Energies 13 06156 g006
Figure 7. Input ground motion (EQ #1, PGA = 1 g).
Energies 13 06156 g007
Figure 8. Displacement response of nuclear power plant (NPP): (a) time histories and (b) maximum displacement for the ground motion in Figure 7.
Energies 13 06156 g008
Figure 9. Acceleration response of NPP: (a) time histories and (b) maximum acceleration for the ground motion in Figure 7.
Energies 13 06156 g009
Figure 10. Hysteresis of LRB #1.3.2. Floor Response Spectra of an Isolated NPP.
Energies 13 06156 g010
Figure 11. FRS of a non-isolated reactor containment building (RCB) at various peak ground acceleration (PGA) levels: (a) PGA = 0.2 g; (b) PGA = 0.3 g; (c) PGA = 0.5 g; (d) PGA = 0.75 g; (e) PGA = 1 g; (f) PGA = 1.25 g.
Energies 13 06156 g011aEnergies 13 06156 g011b
Figure 12. FRS of a base-isolated RCB at various PGA levels: (a) PGA = 0.2 g; (b) PGA = 0.3 g; (c) PGA = 0.5 g; (d) PGA = 0.75 g; (e) PGA = 1 g; (f) PGA = 1.25 g.
Energies 13 06156 g012aEnergies 13 06156 g012b
Figure 13. Comparison of FRS at different PGA from isolated (solid lines) and non-isolated (dashed lines) RCBs: (a) PGA = 0.5 g; (b) PGA = 1 g.
Energies 13 06156 g013
Figure 14. LRB specimen dimensions.
Energies 13 06156 g014
Figure 15. Force-displacement relationship of the LRBs for P/Pd ratios of (a) P = 1.0 Pd, (b) P = 0–1.5 Pd, and (c) P = 2.0–6.0 Pd.
Energies 13 06156 g015
Figure 16. Ultimate property diagram in (a) shear force and (b) shear strain.
Energies 13 06156 g016
Figure 17. Displacement of the auxiliary building under BDBE ground motion response spectra (GMRS) (PGA = 1.0 g).
Energies 13 06156 g017
Figure 18. Probability of shear failure.
Energies 13 06156 g018
Figure 19. Initial vertical load on the isolators.
Energies 13 06156 g019
Figure 20. Vertical load distribution on the 486 isolators under 20 ground motions (PGA = 1.0 g).
Energies 13 06156 g020
Table 1. Comparison of modal frequencies between SAP2000 and OpenSees models.
ModeSAP2000 Frequency (Hz)OpenSees Frequency (Hz)Direction
10.4770.477Isolation—Horizontal Translation
20.4770.477Isolation—Horizontal Translation
30.7100.711Isolation—Vertical Rotation
43.5463.539RCB *—Horizontal Translation
53.5723.546RCB—Horizontal Translation
66.9987.023AB **—Horizontal Translation
77.4847.521AB—Horizontal Translation
* RCB: Reactor Containment Building; ** AB: Auxiliary Building.
Table 2. Final calibrated parameters for the (lead rubber bearings) LRB model.
LeadRubberXElastomericBearingBoucWenHDR
Yield strength, F y 995.3 kNPost-yield stiffness ratio of the linear hardening component, α 1 0.00001 a 1 0.31
Post-yield stiffness ratio, α 0.01453 a 2 −15.92
Post-yield stiffness ratio of the non-linear hardening component, α 2 0.0003 a 3 0.82
Shear modulus, G r 0.3467 MPa b 1 5.53
Bulk modulus of the rubber, K b u l k 2000 MPaExponent of the non-linear hardening component, μ 9.0 b 2 52.02
b 3 2.86
Cavitation parameter, k c 20Yielding exponent (sharpness of the hysteresis loop corners), η 1 c 1 5.5 × 10⁻⁵
c 2 0.02
Damage parameter, ϕ m 0.75First hysteretic shape parameter, β 0.1 c 3 1
Second hysteretic shape parameter, γ 0.9 c 4 0
Table 3. Properties of the 20 motions [25].
Rec.#NGA#Earthquake (EQ)StationMag.Dist. (km)Vs30 (m/s)SFNPTSdt (s)Duration (s)
168San FernandoLA-Hollywood Stor FF6.622.83163.728000.128
293San FernandoWhittier Narrows Dam6.639.52997.579970.00539.985
3186Imperial Valley-06Niland Fire Station6.536.92077.879970.00539.985
4285Irpinia, Italy-01Bagnoli Irpinio6.98.210004.0127120.002936.8648
5718Superstition Hills-01Wildlife Liquef. Array6.217.62075.259610.00529.805
6730Spitak, ArmeniaGukasian6.836.22754.419900.0119.9
7748Loma PrietaBelmont-Envirotech6.944.16286.979890.00539.945
8855LandersFort Irwin7.363.03456.820000.0240
9862LandersIndio-Coachella Canal7.354.33456.530000.0260
10882LandersNorth Palm Springs7.326.83454.814,0000.00570
111165Kocaeli, TurkeyIzmit7.57.28113.360000.00530
121487Chi-Chi, TaiwanTCU0477.635.05202.118,0000.00590
131491Chi-Chi, TaiwanTCU0517.67.72733.018,0000.00590
141602Duzce, TurkeyBolu7.112.03261.355900.0155.9
151605Duzce, TurkeyDuzce7.16.62761.451770.00525.885
161611Duzce, TurkeyLamont 10587.10.24257.739010.0139.01
171762Hector MineAmboy7.143.12713.530000.0260
182113Denali, AlaskaTAPS Pump Station #097.954.83838.032,8950.005164.475
192744Chi-Chi, Taiwan-04CHY0886.248.42737.412,8000.00564
203264Chi-Chi, Taiwan-06CHY0246.331.14285.013,2040.00566.02
Table 4. Specimens for the ultimate property test.
Test SequenceSpecimenTagP/PdVert. Load (kN)Buckling Load (kN)Failure Load (kN)Failure Disp. (mm)Failure Disp. (%)
#1UCSD300%(1)MD-P1.01.02942 683457408
#2UCSD300%(5)MD-P1.01.02942 762462412
#3UCSD Non(1)LD-P1.01.02942 460389348
#4UCSD400%(1)HD-P1.01.02942236583478427
#5SGS1.0PdMD-P1.01.02942 777470419
#6UCSD Non(2)LD-P6.06.017,649 2456760
#7UCSD300%(3)MD-P2.02.05883232766480429
#8UCSD300%(7)MD-P3.03.08825311666476425
#9SGS1.5PdMD-P1.51.54412287761467417
#10UCSD300%(4)MD-P2.52.57354214614457408
#11UCSD300%(8)MD-P4.04.011,766180594460410
#12SGS2.0PdMD-P5.05.014,708126666483431
#13UCSD300%(2)MD-P0.00.0500 782463413
#14UCSD400%(2)HD-P0.00.0500 597477426
#15UCSD300%(6)MD-P0.50.51471 763469419
Publisher’s Note: MDPI stays neutral with regard to jurisdictional claims in published maps and institutional affiliations.

