Article

Optimizing Resource Utilization in Biomass Supply Chains by Creating Integrated Biomass Logistics Centers

1
Wageningen Food & Bio-Based Research, Bornse Weilanden 9, 6708 WG Wageningen, The Netherlands
2
Operations Research and Logistics, Wageningen University, Hollandseweg 1, 6706 KN Wageningen, The Netherlands
*
Author to whom correspondence should be addressed.
Energies 2020, 13(22), 6153; https://doi.org/10.3390/en13226153
Submission received: 29 October 2020 / Revised: 18 November 2020 / Accepted: 20 November 2020 / Published: 23 November 2020

Abstract

:
Bio-based supply chains are by nature complex to optimize. The new logistic concept of integrated biomass logistical center (IBLC) provides us the opportunity to make full use of the idle capacity for a food/feed plant to produce biobased products so that the entire chain efficiency can be improved. Although research has been conducted to analyze the IBLC concept, is yet to be an optimization model that can optimally arrange the activities in the supply chain where an IBLC stands in the middle. To fill the knowledge gap in the literature, this paper makes the first step to develop a MILP model that enables biobased supply chain optimization with the IBLC concept, which supports logistic and processing decisions in the chain. The model is applied in a case study for a feed and fodder plant in Spain where managerial insights have been derived for transferring the plant to a profitable IBLC.

1. Introduction

The world population is growing fast. There were approximately 7.5 billion people living on the earth in 2017 with an annual growth rate of 80 million [1]. The fast-growing world population requires more food to be supplied but the total amount of land for agricultural production hardly changes [2]. The large world population also leads to enormous energy consumption and per-capita energy use is also rising [3]. Crude oil, coal, and gas are still the main resources for humans to obtain energy; however, fossil fuel reserves are limited and continuously declining [4]. Moreover, fossil fuels are the major source of GHG emissions which is responsible for climate change [5]. One of the alternatives for fossil energy is bioenergy and biofuels. The wide availability of biomass enables biofuel to become an appealing source of renewable energy to replace fossil energy [6]. Furthermore, the processing of biomass does not contribute to a build-up of CO2 in the atmosphere, because the amount of carbon taken up during plant growth is roughly the same as the emission of carbon during the conversion of biomass [7].
The production of bioenergy and other biobased products from available biomass is a promising solution to reduce the global consumption of fossil fuels and thus greenhouse gas emissions. While significant research efforts have been devoted to exploring the potential of biomass production and conversion technologies, the importance of efficient logistics and supply chain management was only detected recently [8]. Efficient biomass logistics would focus on coordinating the flow of materials and operations within the biomass supply chain to maximize economic output for the same or even lower environmental impacts.
Designing efficient biomass supply chains is a rather complex process. The production of biomass is seasonal and location-specific, influenced directly by the biophysical, climatic, and socio-economic environments. Because of this, availability of biomass can differ between periods, years and locations. Moreover, in many cases, biomass is highly perishable and pre-treatment and storage can be crucial stages for the quality of the final products. Different pre-treatment and conversion technologies can be used to process different types of biomass in order to produce a variety of final biobased products. The quantity and quality of the produced final biobased products depend on the technology but also the scale of conversion. Important sources of biomass are crop residues and wastes from the food industry (what is waste for one is raw material for another). Decisions in other industries (e.g., farming, food processing) can influence availability and quality of biomass which can have direct consequences on idle time of machinery and available resources. To design an efficient biomass supply chain, all these decisions must be optimized simultaneously taking into account all these special features of biomass supply chains.
One way to improve machinery utilization is to combine food and/or feed processing with biomass processing in the same processing facility, i.e., an integrated biomass logistical center (IBLC) [9]. An Integrated Biomass Logistical Center (IBLC) is a new logistics concept that aims to integrate operations of different biomass supply chains (e.g., food, feed, and energy) in order to improve the efficiency of using the available resources like machinery and labor. More specifically, an IBLC is a facility that produces food and/or feed as their primary business but makes use of the idle capacity of the equipment and labor to produce biobased products. In practice, a lot of food and/or feed processing plants—which are equipped with pelletizers, drying systems, silos, conveyors, etc.—just operate in a specific period of the year because of the seasonal availability of the primary feedstocks [10]. Within an IBLC setting, during a few months after the harvesting period, the equipment and labor force of the IBLC will be devoted to processing primary food and/or feed products. For the rest of the year, the same equipment and labor force of the IBLC will be used to process biomass into biobased products to improve capacity utilization. Combining the food and non-food processing in one facility leads to less idle time of (already existing) equipment which brings in a reduction of the total costs [11]. Also, the required storage facilities can be used to store both food and non-food products as well as their feedstocks. In general, the IBLC concept introduces flexibility by aligning decisions related to the supply of different types of biomass (e.g., taking seasonality into account), the (pre)processing of raw materials, and meeting the demand of the various biobased product. As a result, the use of available pre-treatment, conversion, and storage facilities in the value chain can be optimized. Since the concept of IBLC is new, its economic and environmental consequences must be evaluated quantitatively before implementation. Such evaluation requires advanced decision support models. Even though there have been many models developed to optimize decisions of the biomass supply chain (e.g., [12,13,14,15,16,17,18,19]), hardly any looked into the optimal use of the equipment and available resources in an existing similar to an IBLC.
To fill the aforementioned knowledge gap, this paper developed the first mixed-integer programming model that optimizes the machinery utilization using the IBLC concept where the processing of biomass is combined into the business of existing food and/or feed manufacturing plant. The objective of this research is to improve the economic and environmental efficiency of current biomass supply chains by using IBLCs. We developed a mixed integer linear programming (MILP) model that optimizes the resource allocation decisions of an IBLC. To demonstrate the rationale and practicability of the model, a case study for a feed and fodder manufacturer in Spain was carried out. Managerial implications were derived from the case study to support the company’s decision making in turning the feed manufacturing plant into an IBLC.

2. Improving Efficiency in Biomass Supply Chains

This section reviews studies focusing on improving efficiency in biomass supply chains. Biomass is not only used as a source to produce bioenergy but also used for the production of food, feed, and other biobased products, like bioplastics and chemicals [20]. Because of the global scarcity of agricultural land and the increasing demand for biobased products, the utilization of biomass should be optimized to its full potential. One of the ways to achieve this is to redesign biomass supply chains to improve their economic and environmental performance. Redesigning a biomass supply chain is a complex process. First of all, the biomass supply chain for bio-energy production contains five general system components, namely (I) biomass harvesting and collection, (II) pre-treatment, (III) storage, (IV) transport, and (V) energy conversion. For these interrelated processes, it has to be determined where, when, and how they take place. Therefore, systematic thinking from the supply chain management perspective is required. It plays an important role in the management of biobased production processes. The objectives of biomass supply chain management are to minimize the costs and environmental impacts of the supply chain and to ensure continuous feedstock supply [6]. Secondly, a wide range of biobased products can be produced from various types of biomass with different treatment technologies, which leads to additional complexity of the biomass supply chain. Besides specially grown novel non-food crops, and the residuals of the traditional food-crops, there are also tertiary residues, the so-called post-consumer biomass products, that can be used to produce biobased products [21]. Because of the high variety of biomass inputs, pre-treatments, processing options, and biobased products as outputs, the system becomes very complex. Thirdly, the availability of biomass feedstocks depends on the harvesting period of the crop [11]. The seasonality leads to a non-continuous use of equipment that is needed for processing biomass [22]. If year-round processing of biomass is applied to avoid low capacity utilization, large amounts of biomass need to be stored for a long period and incur significant storage costs. This further increases the complexity of biomass processing planning.
A number of research papers reviewed, deal with the question of how biomass supply chains can be organized in a cost-efficient manner to collect, process, and transfer available biomass to a specific biorefinery plant [23,24,25,26]. As stated by Iakovou et al. [27], one of the most crucial bottlenecks in increased biomass utilization is the costs of logistics operations. In their study, they specifically refer to the utilization of biomass for energy production but such a bottleneck issue can also be considered valid for any other biorefinery outlet.
Hong et al. [28] address the topic of sustainable biomass supply chains from the viewpoint of supply chain management. In that study, sustainable biomass supply chains or network of supply chains is considered as the operational management method and optimization approach to reduce environmental impacts and the costs of manufacturing in the full life cycle of the bioproducts: from the raw material to the end product. Hong, How, and Lam [28] mentioned that a sustainable biomass supply chain should not only emphasize efficient transportation but also the conservation of mass and energy used in the processes, as well as the possibility to exploit multiple biomass sources. In the same study, the concept of industrial symbiosis is discussed together with the network synthesis with multi-goals of environmental, technical, economic, safety, and social factors. This is in line with the IBLC concept which looks at the synergy between existing agro-industries, the (regional) availability of biomass (residues), and the opportunity to develop value chains for biobased products.
Lautala et al. [29], come up with the concept of advanced feedstock supply systems, i.e., versatile preprocessing depots that can utilize multiple types of biomass. Typical preprocessing operations in such depots could include particle size reduction, moisture reduction, densification, and some advanced processes such as blending, partial pre-treatment, even fractionation to oil, sugar, or char intermediate products. Biomass leaves these depots as a commodity feedstock which is stable, dense, flowable, and has a defined grade of material specification.
Similarly, Eranki et al. [30] introduce the concept of advanced regional biomass processing depots (ARBPDs). An advanced RBDP produces intermediates and products beyond those for biochemical and thermochemical biofuel production, including higher-value animal feeds, nutraceuticals, and biocomposite materials, and thereby leveraging the capital and expertise of these well-established industries. In addition, Eranki, Bals, and Dale [30] come up with the concept of tailor-made, or enhanced RBPD: facilities that employ specific technologies that depend primarily on regional feedstock availability and biomass characteristics also on synergies among these technologies. Given the features of regional biomass availability and technology synergy, the enhanced RBPD can be considered as similar to an IBLC.
A similar approach is developed by Bals and Dale [31]: the local biomass processing depots (LBPDs). To overcome the difficulty of biomass as a bulky, inhomogeneous, difficult-to-transport, and perishable product, they propose to establish a network of regional or local biomass processing depots. Biomass supplied to LBPDs can then be homogenized, processed, and densified at a rural (local) level prior to shipping it to a biorefinery for conversion into final bioproducts such as fuels, chemicals. Campbell [32] describes LBDPs as a concept for processing regional specific biomass streams into densified, stable, and transportable commodities. Campbell identified the following functions for an LBDP: (i) purchasing biomass from farmers/growers, (ii) short-term storage, (iii) sorting and cleaning, (iv) biomass pretreatment, and (v) densification (e.g., palletization).
In another study, alternative options and configurations of biomass supply systems were investigated for the U.S. cellulosic biofuel industry [33,34]. The authors concluded that decentralized biomass processing facilities, or depots, may be needed to achieve lower feedstock costs but supply the quantity and quality required. Two types of depots exist (see Appendix A). The main function of a standard depot is to improve feedstock stability (for storage), increase bulk density (for transportation), improve flowability (for stable in-feed rates), and decrease material losses. On a contrary, a quality depot actively addresses feedstock quality aspects specific to the market it targets. It produces enhanced feedstock (with a lower contamination level) or even process intermediates and hence reduces the pre-treatment requirements at the client facility. To satisfy demand in its final markets, different kinds of pre-treatment steps are possible within advanced depots (thermal/chemical pre-treatment).
Annevelink [35] bring up the biomass yard as a logistical concept that different types of biomass from different supply sectors are collected in one location for pre-treatments. Within the biomass yard, biomass suppliers and collectors collaborate with biobased processing industries in organizing efficient regional biomass collection. When necessary, biomass is pre-treated into a specific bio-commodity for further biobased industrial processing. The function of the biomass yard is to improve the value chain of biomass (residues). To realize this, the biomass yard has several technical/ operational tasks concerning the sustainable collection of multiple streams, regional buffering, pre-treatments and densification, and transportation to market outlets. Also, the biomass yard manages various biomass supply chains from suppliers of unprocessed biomass to buyers of specified processed biomass components for biobased markets.
In Austria, the regional agricultural chamber Steiermark (Landwirtschaftskammer Steiermark) established the ‘Biomassehof’ as a regional service center for solid biofuels [36]. The Biomassehof was co-developed in 2011 by a farmer group within the framework of the BiomassTradeCenter project (2009–2011). This farmer group is responsible for operations related to the processing and exploitation of woody biomass into a solid biofuel. The goal of the center is to make locally grown woody biomass available for the bio-energy market and to guarantee the quality standards of both products and services in the market. In 2013, the Steiermark province had seven regional Biomassehöfe.
In addition to the aforementioned European research, there are also US studies worth being mentioned. For example, Perlack et al. [37] conducted an in-depth analysis of the biomass resources in the US context while Langholtz et al. [38] discussed the benefits of avoided CO2 emissions by replacing fossil fuels with biofuels. Moreover, Lautala, Hilliard, Webb, Busch, Hess, Roni, Hilbert, Handler, Bittencourt, and Valente [29] developed a Biofuel Infrastructure, Logistics, and Transportation model to calculate the optimal locations of multiple biorefineries.
Based on the previous research, this paper takes a step further by developing the first MILP model that enables the optimization of resource utilization in the biomass supply chain for an IBLC.

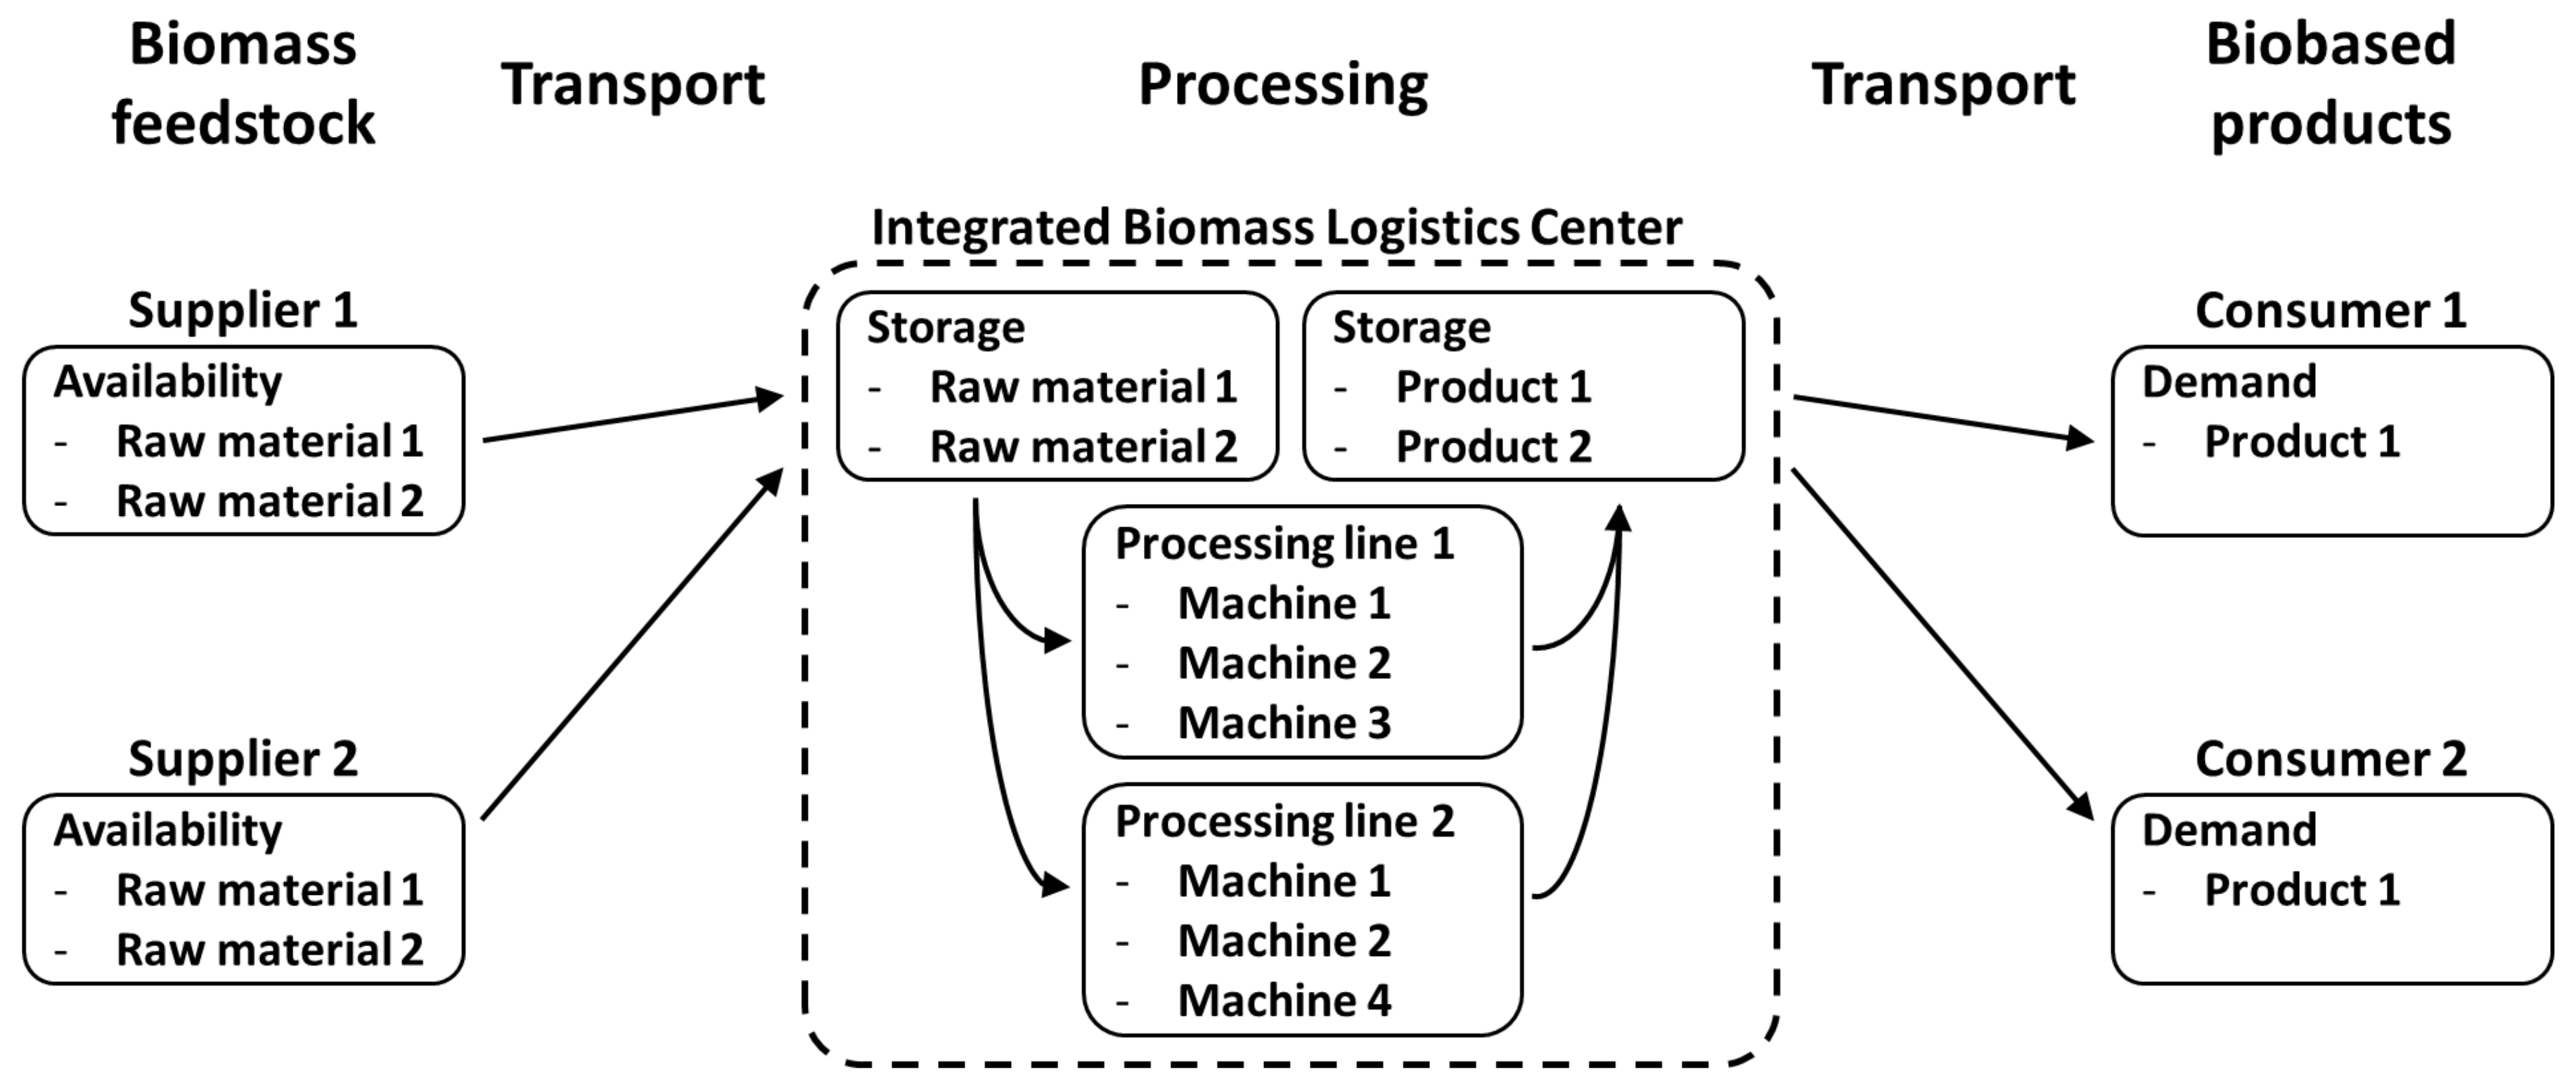
3. MILP Model for an IBLC

In this section, we describe the main components of the developed MILP model for IBLC’s. The MILP model maximizes the profit of a defined biomass supply chain subjected to a set of periodical constraints: feedstock availability, storage capacity, machinery capacity, and product demand. It also takes into account the logistics and the processing aspects within the IBLC to derive the optimal logistic and processing plans. The MILP model is schematically represented in Figure 1.
Multiple suppliers (e.g., farms) can supply several raw materials. Each supplier is at a specified distance from the IBLC. The raw materials are available in different (harvesting) periods. The weight decay of the raw materials stored at the supplier due to degradation can be specified. In each period, for each supplier, the MILP model decides the quantities of raw material that are stored at the supplier or moved to the IBLC. The storage costs at the supplier and the transportation costs are added to the raw material costs.
When raw materials are transported to the IBLC, the MILP model decides either to process them in the same period when they arrive or to move them into the storage of the IBLC. To process raw material, a certain processing line existing of one or more machines is used. Each of the machines has a fixed processing capacity per period. When the capacity of a machine is the limiting factor, the MILP model allows the IBLC to purchase an extra machine. The required investment costs are annualized considering a depreciation period of 10 years. Each raw material has specified processing costs. Cleaning costs and switching costs—i.e., costs related to adopting a process line for processing a different raw material—can be specified. For each processing line, a product yield is applied to account for the loss of material during processing.
Both raw materials and products can be stored at the IBLC at specified storage costs. When the storage capacity is the limiting factor, there is an option to increase the storage capacity at extra costs. Both for the raw materials and the products in the storage of the IBLC a decay factor per time period can be specified. Each product has its selling price and a certain demand at a specified distance. The selling price includes outbound transportation costs.
The results of the MILP model provide insights in terms of:
  • distinction in the production costs (e.g., raw material costs, processing costs);
  • storage plans for raw materials and products at the supplier and at the IBLC;
  • processing schedule of the IBLC including utilization rate of the machinery;
  • potential investment for extra machinery and storage capacity in the IBLC.

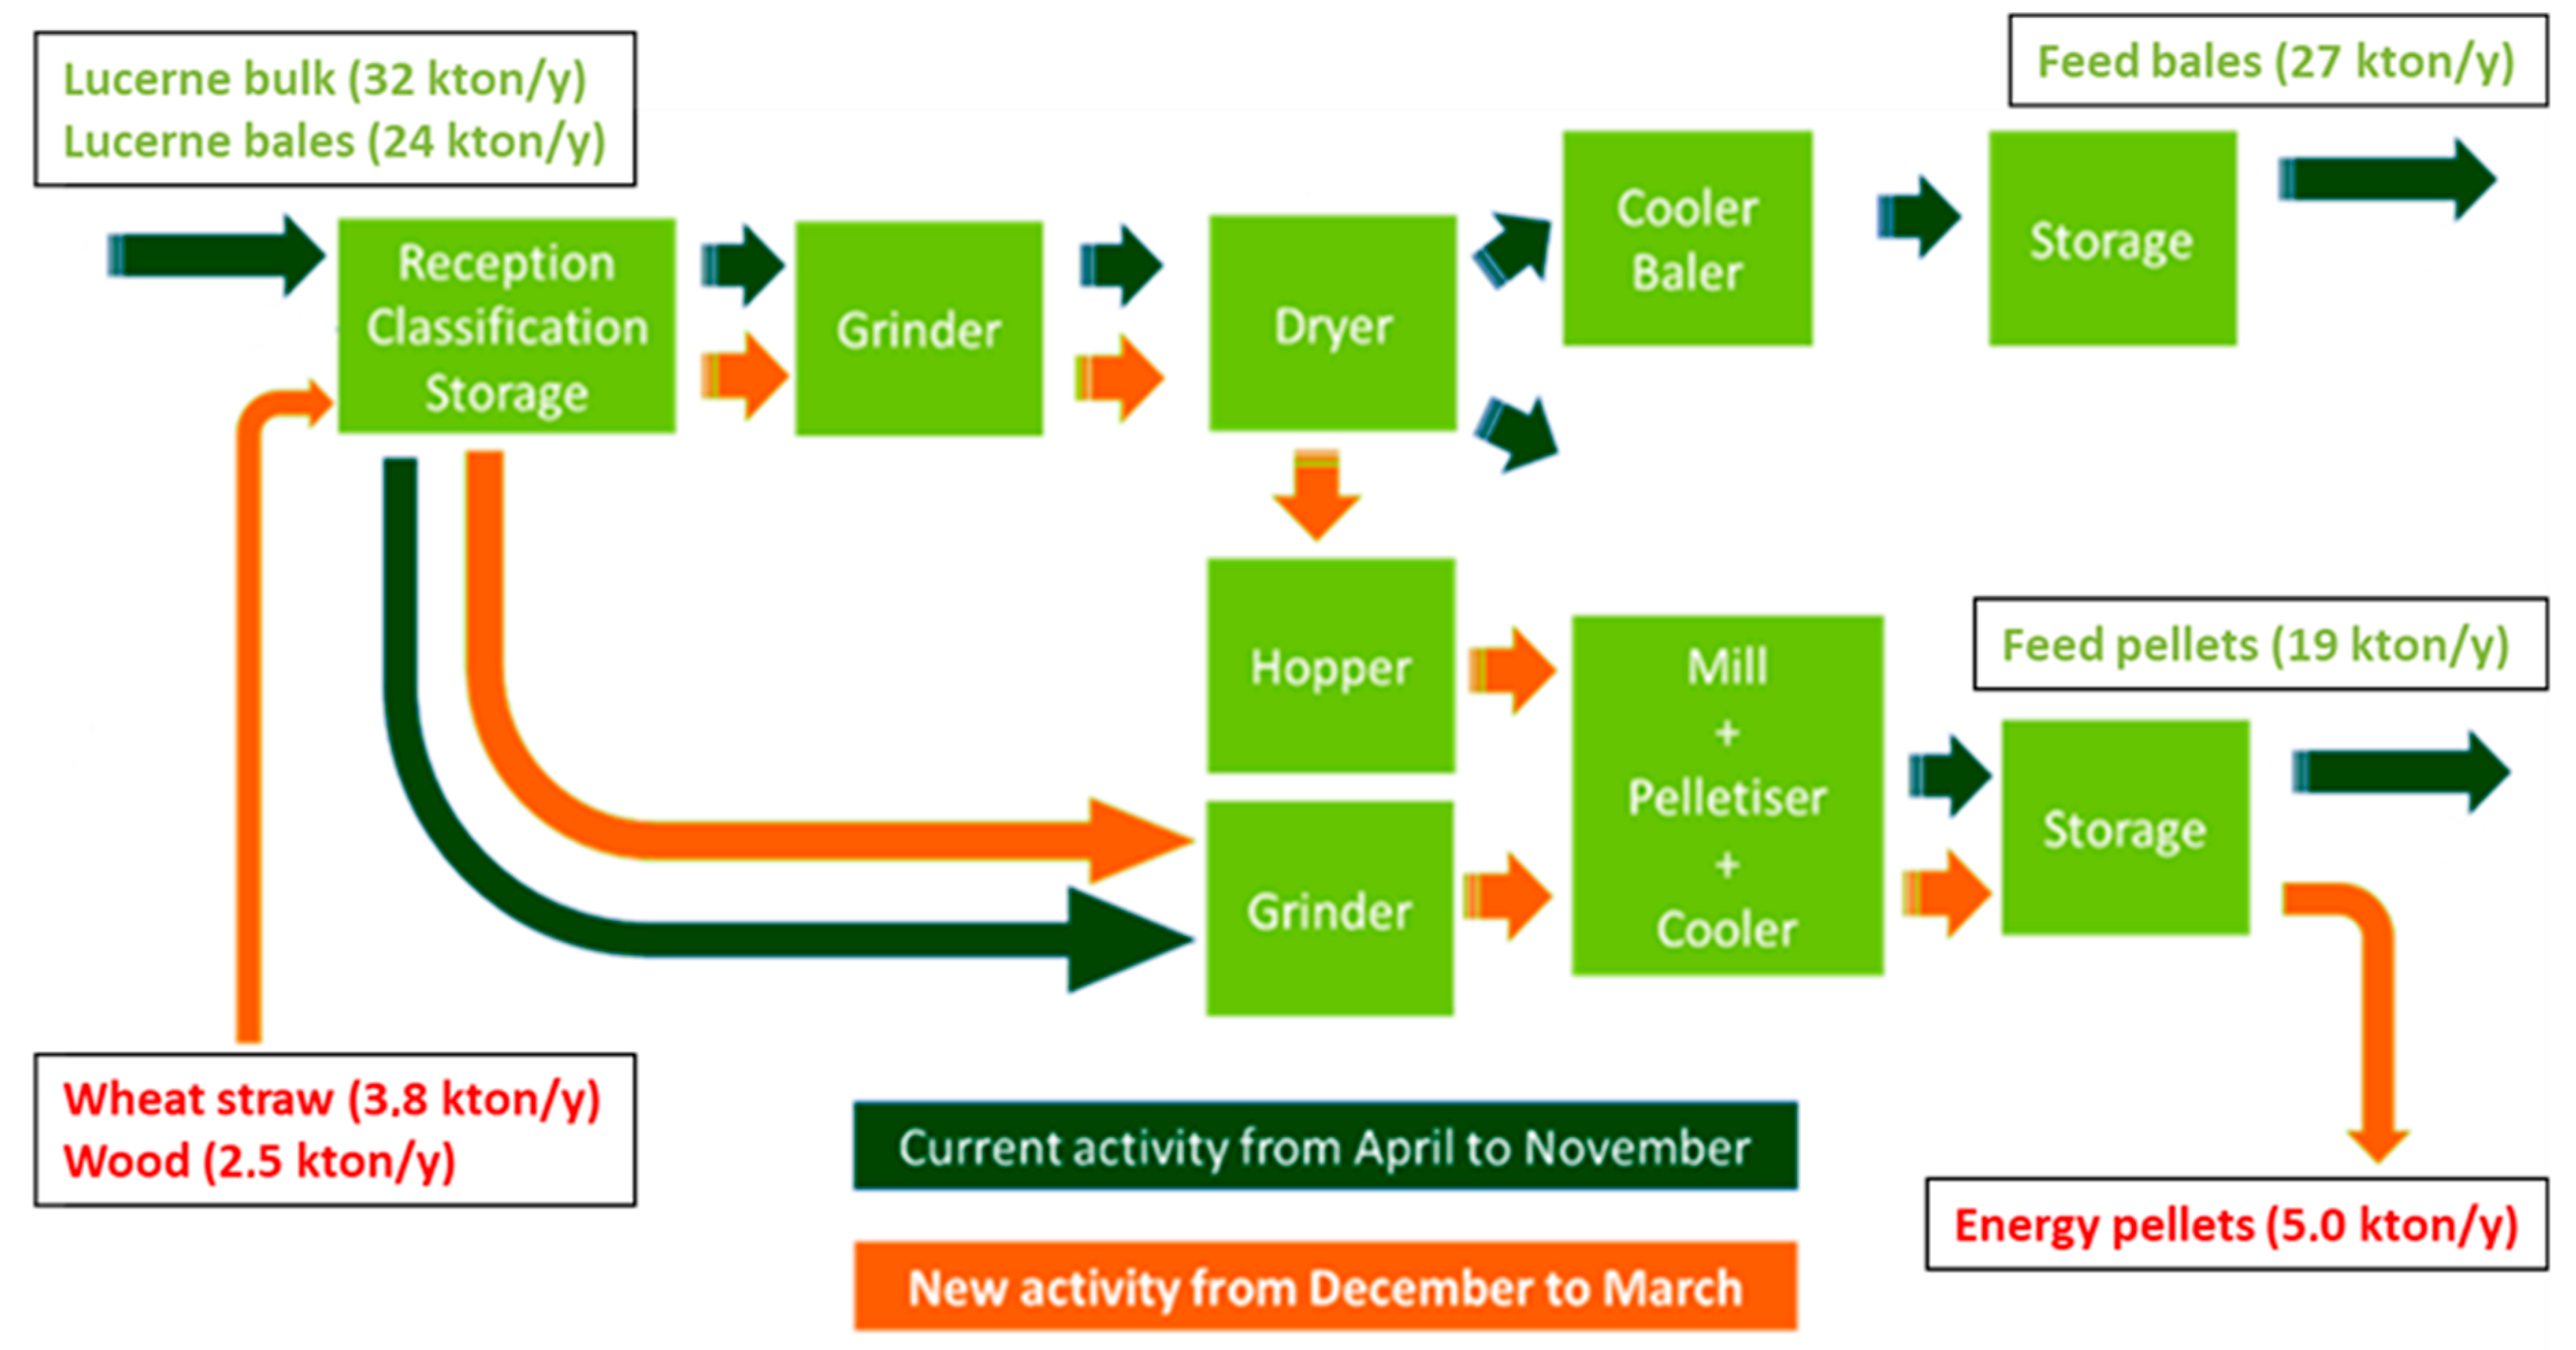
4. MILP Model Applied to a Feed and Fodder Supply Chain

The developed MILP model was applied to analyze the potential of an IBLC for a feed and fodder supply chain in Zaragoza, Spain. For modeling and demonstration purposes, the MIP case study was made more generic by adding data from other sources and by estimating certain values that were not available. In the current situation, lucerne bulk and lucerne bales are processed into respectively feed bales and feed pellets. The lucerne raw material is available 8 months per year. The idle time of most of the machinery can be used to process a mixture of wheat straw and wood chips into energy pellets. A detailed description of the supply chain is given below. The key parameters used in this MILP model are provided in the Appendix B. The main parameter values used in the model are provided in Appendix C. All monetary values used in this research refers to that in the year 2019.
In the MILP model the next processing lines were defined:
  • Processing line 1—Lucerne bulk is processed into lucerne feed bales using a dryer, a cooler (#1), and a baler. Lucerne bulk is available within a distance of 30 km to the IBLC from April to November.
  • Processing line 2—Lucerne bales are processed into lucerne feed pellets using a grinder, a mill, a pelletizer, and a cooler (#2). The lucerne in bales has usually a lower quality compared to the lucerne in bulk. Lucerne bales are available within 100 km of the IBLC from April to November.
  • Processing line 3—Wheat straw (60%) and wood chips (40%) are processed into energy pellets using a wood grinder, a dryer, a hopper, a grinder, a mill, a pelletizer, and a cooler (#2). The composition of wheat straw and wood chips is chosen based on the ash content and related to the quality of the energy pellets. The wood chips are processed in a wood grinder, dryer, and hopper before they are mixed with grinded wheat straw and enter the pelletizing process. The wheat straw is available within 30 km to the IBLC in July and August. The wood chips are assumed to be available the whole year, but the transport distance is further than 100 km. Both raw materials are assumed to be available in abundance. Therefore, the mixture is assumed to be available from July to August at a distance of 100 km to the IBLC.
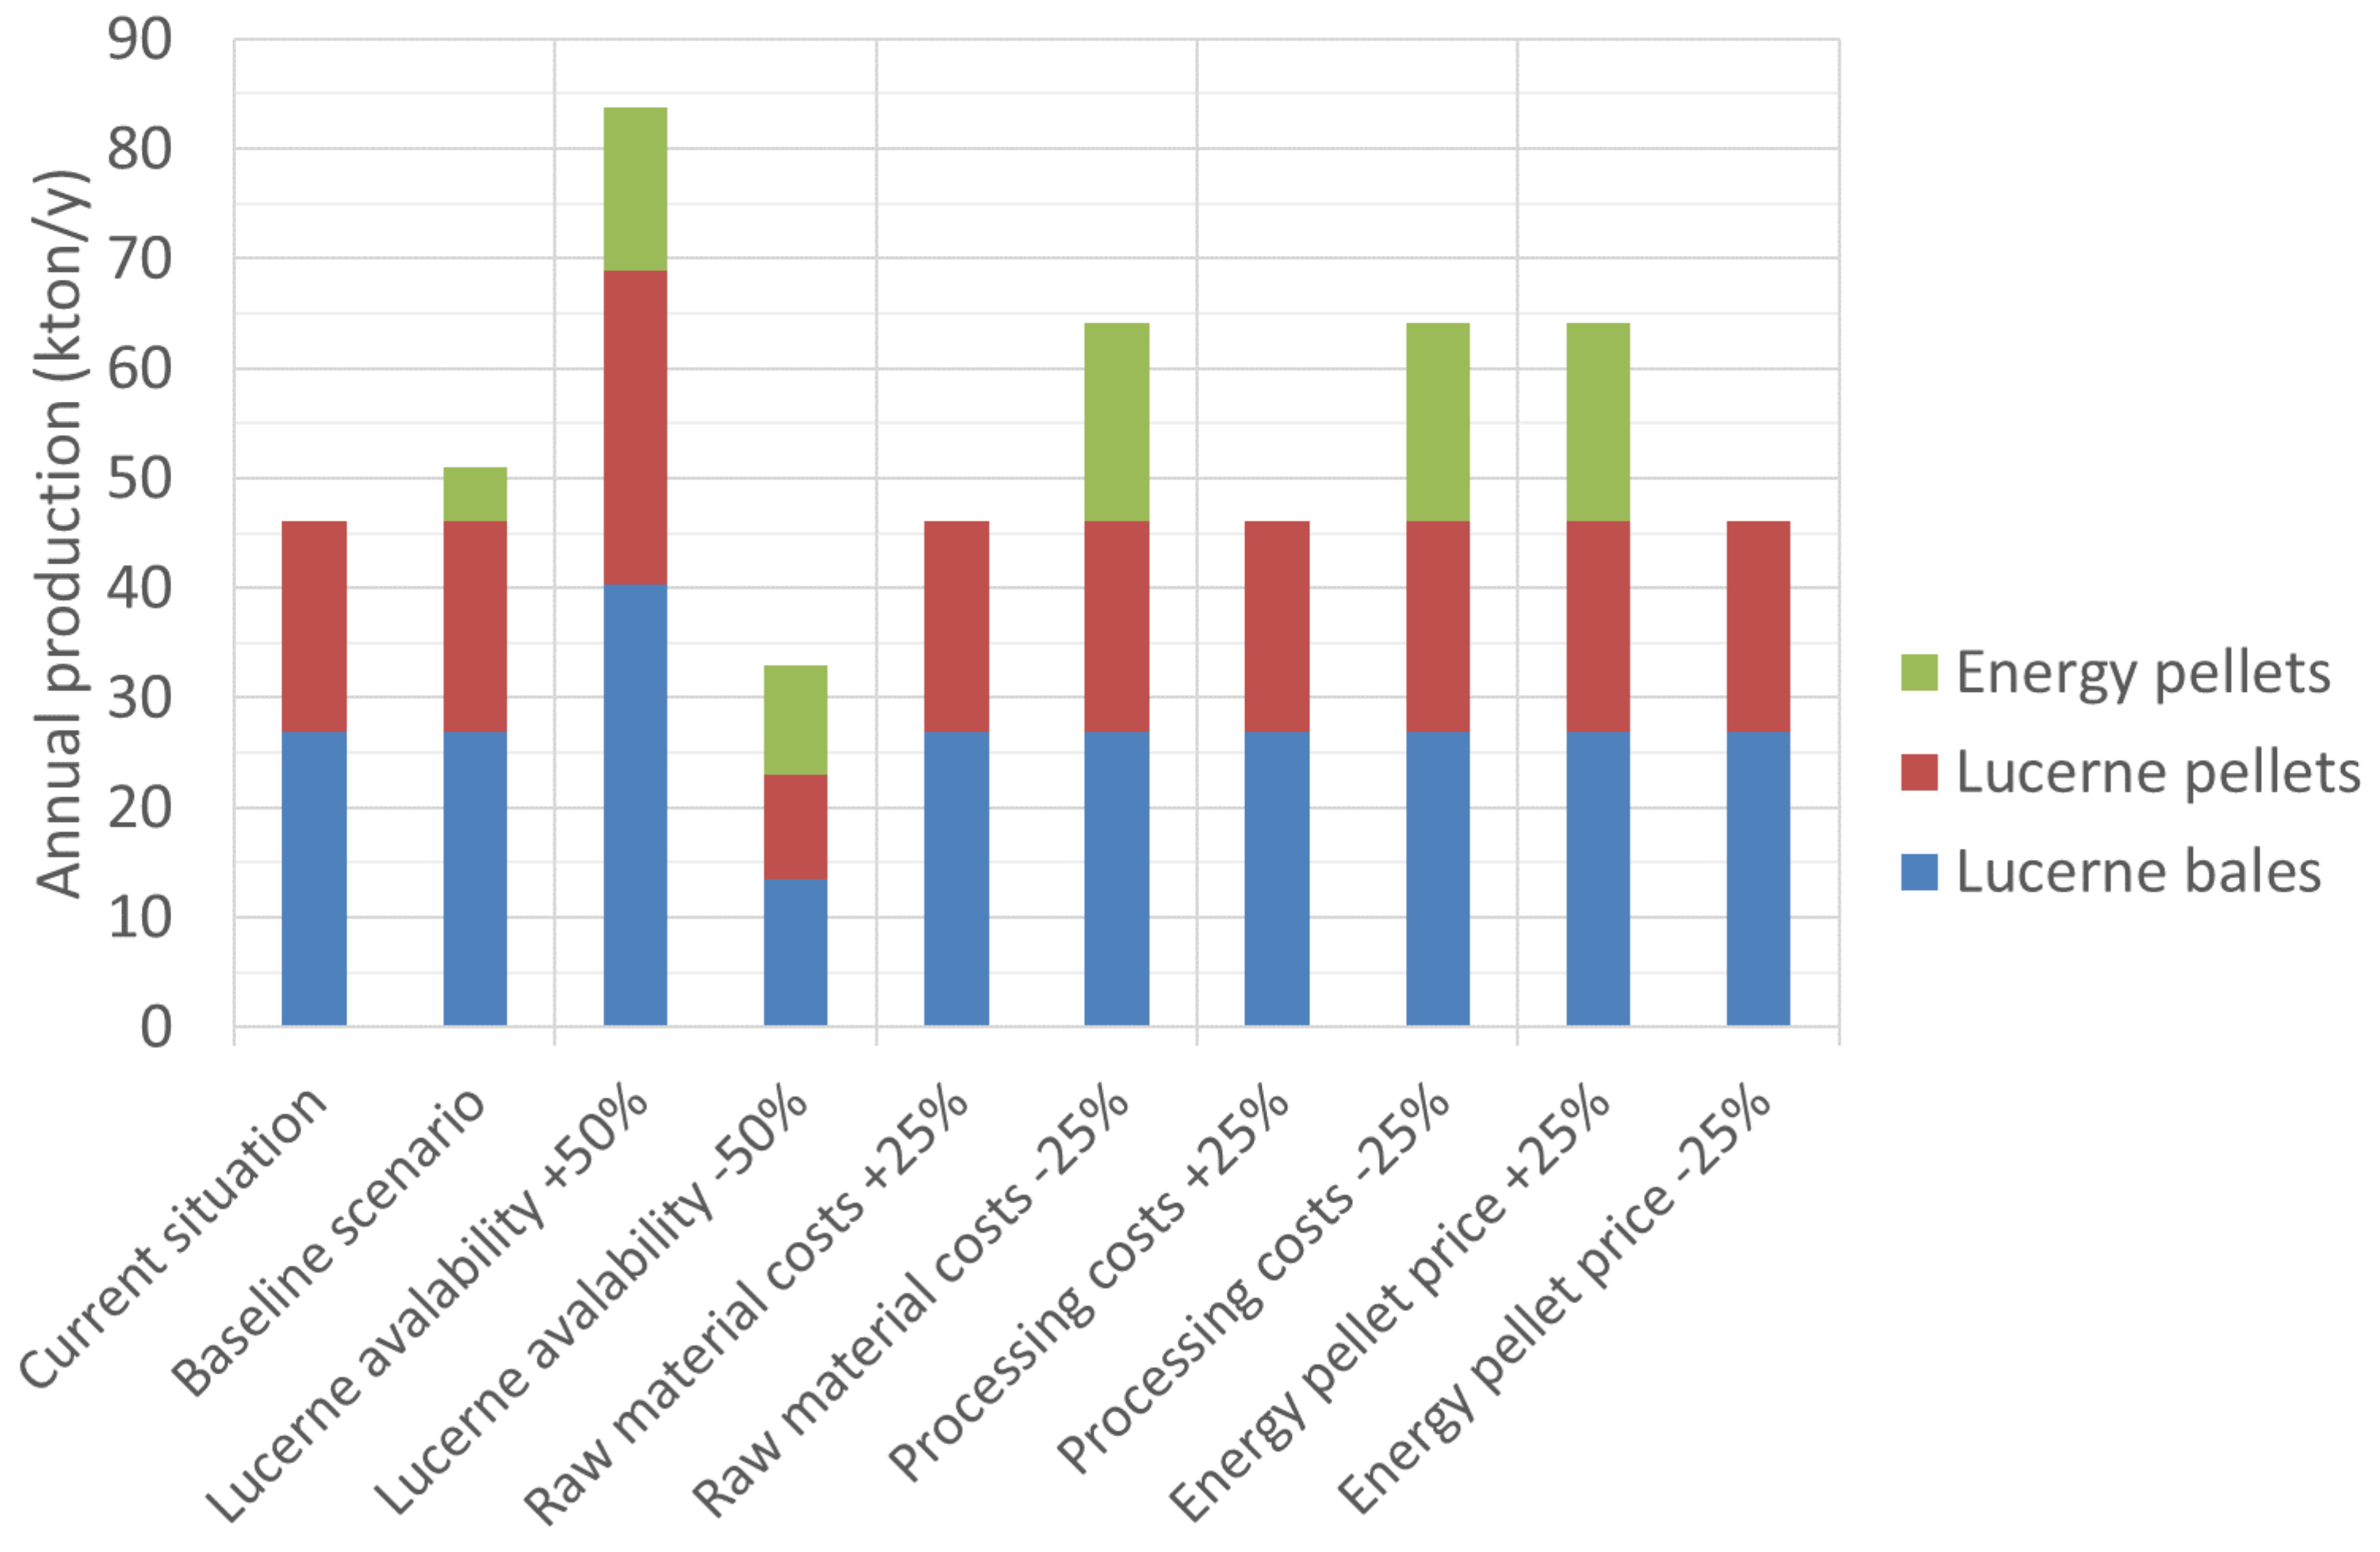
A simplified overview of the current situation and the baseline scenario is given in Figure 2.
The selling prices of the products (per tonne wet weight, including product transport to the buyer) are assumed to be 225 €/tonne for the lucerne feed bales, 180 €/tonne for the lucerne feed pellets, and 143 €/tonne for the energy pellets. The production costs are allocated to raw material costs (excluding transport), raw material (RM) transport, processing costs, costs for obtaining extra equipment, and product transport to the buyer. An overview of the various costs and the potential profit is given in Figure 3. The costs are expressed in euro per tonne product, which means that the processing yield (loss of raw material) is incorporated in the costs. Note that this overview is based on the input parameters of the MILP model, which means an average raw material transport distance is used and the costs for extra equipment are excluded. These aspects are taken into account in the scenario analysis of the MILP model.
It is shown that for all three products the raw material costs and processing costs dominate the production costs. Because of the small raw material transport distances, raw material transport has only a small contribution to the production costs. The raw material transport costs are highest for energy pellets, because of larger distances. Based on the general assumptions, slightly less profit can be made on the energy pellets (13 €/tonne) compared to the lucerne feed pellets (15 €/tonne) and lucerne feed bales (16 €/tonne).

4.1. Scenarios

For the analysis, different scenarios were defined. For all scenarios, the MILP model calculates the situation in which the profit is optimized. The analyzed scenarios are:
  • Current situation: Only lucerne is processed into feed bales or feed pellets.
  • Baseline scenario: Compared to the current situation also wheat straw and wood chips can be processed into energy pellets.
  • Variations on baseline scenario:
    Lucerne availability +/− 50%
    Raw material costs of wheat straw and wood chips +/− 25%
    Processing costs of all products +/− 25%
    Energy pellet selling price +/− 25%
For the current situation, the equipment is set to full capacity for the production of the lucerne feed products. In the MILP model, the option is given to double the capacity of the equipment by making extra investments. The investment costs are annualized by distributing the investment costs over 10 years. Costs related to maintenance, labor, and overhead for extra equipment are assumed to be already included in the processing costs.
Storage capacity at the IBLC, for raw materials and products combined, can be extended to a maximum of 17 kilotonnes per month. The decay during the storage of raw material is set to 1% per month. In all scenarios, the costs related to cleaning, product changeover, and storage capacity are negligible, because in this specific case study these costs turned out to be marginal compared to other costs.

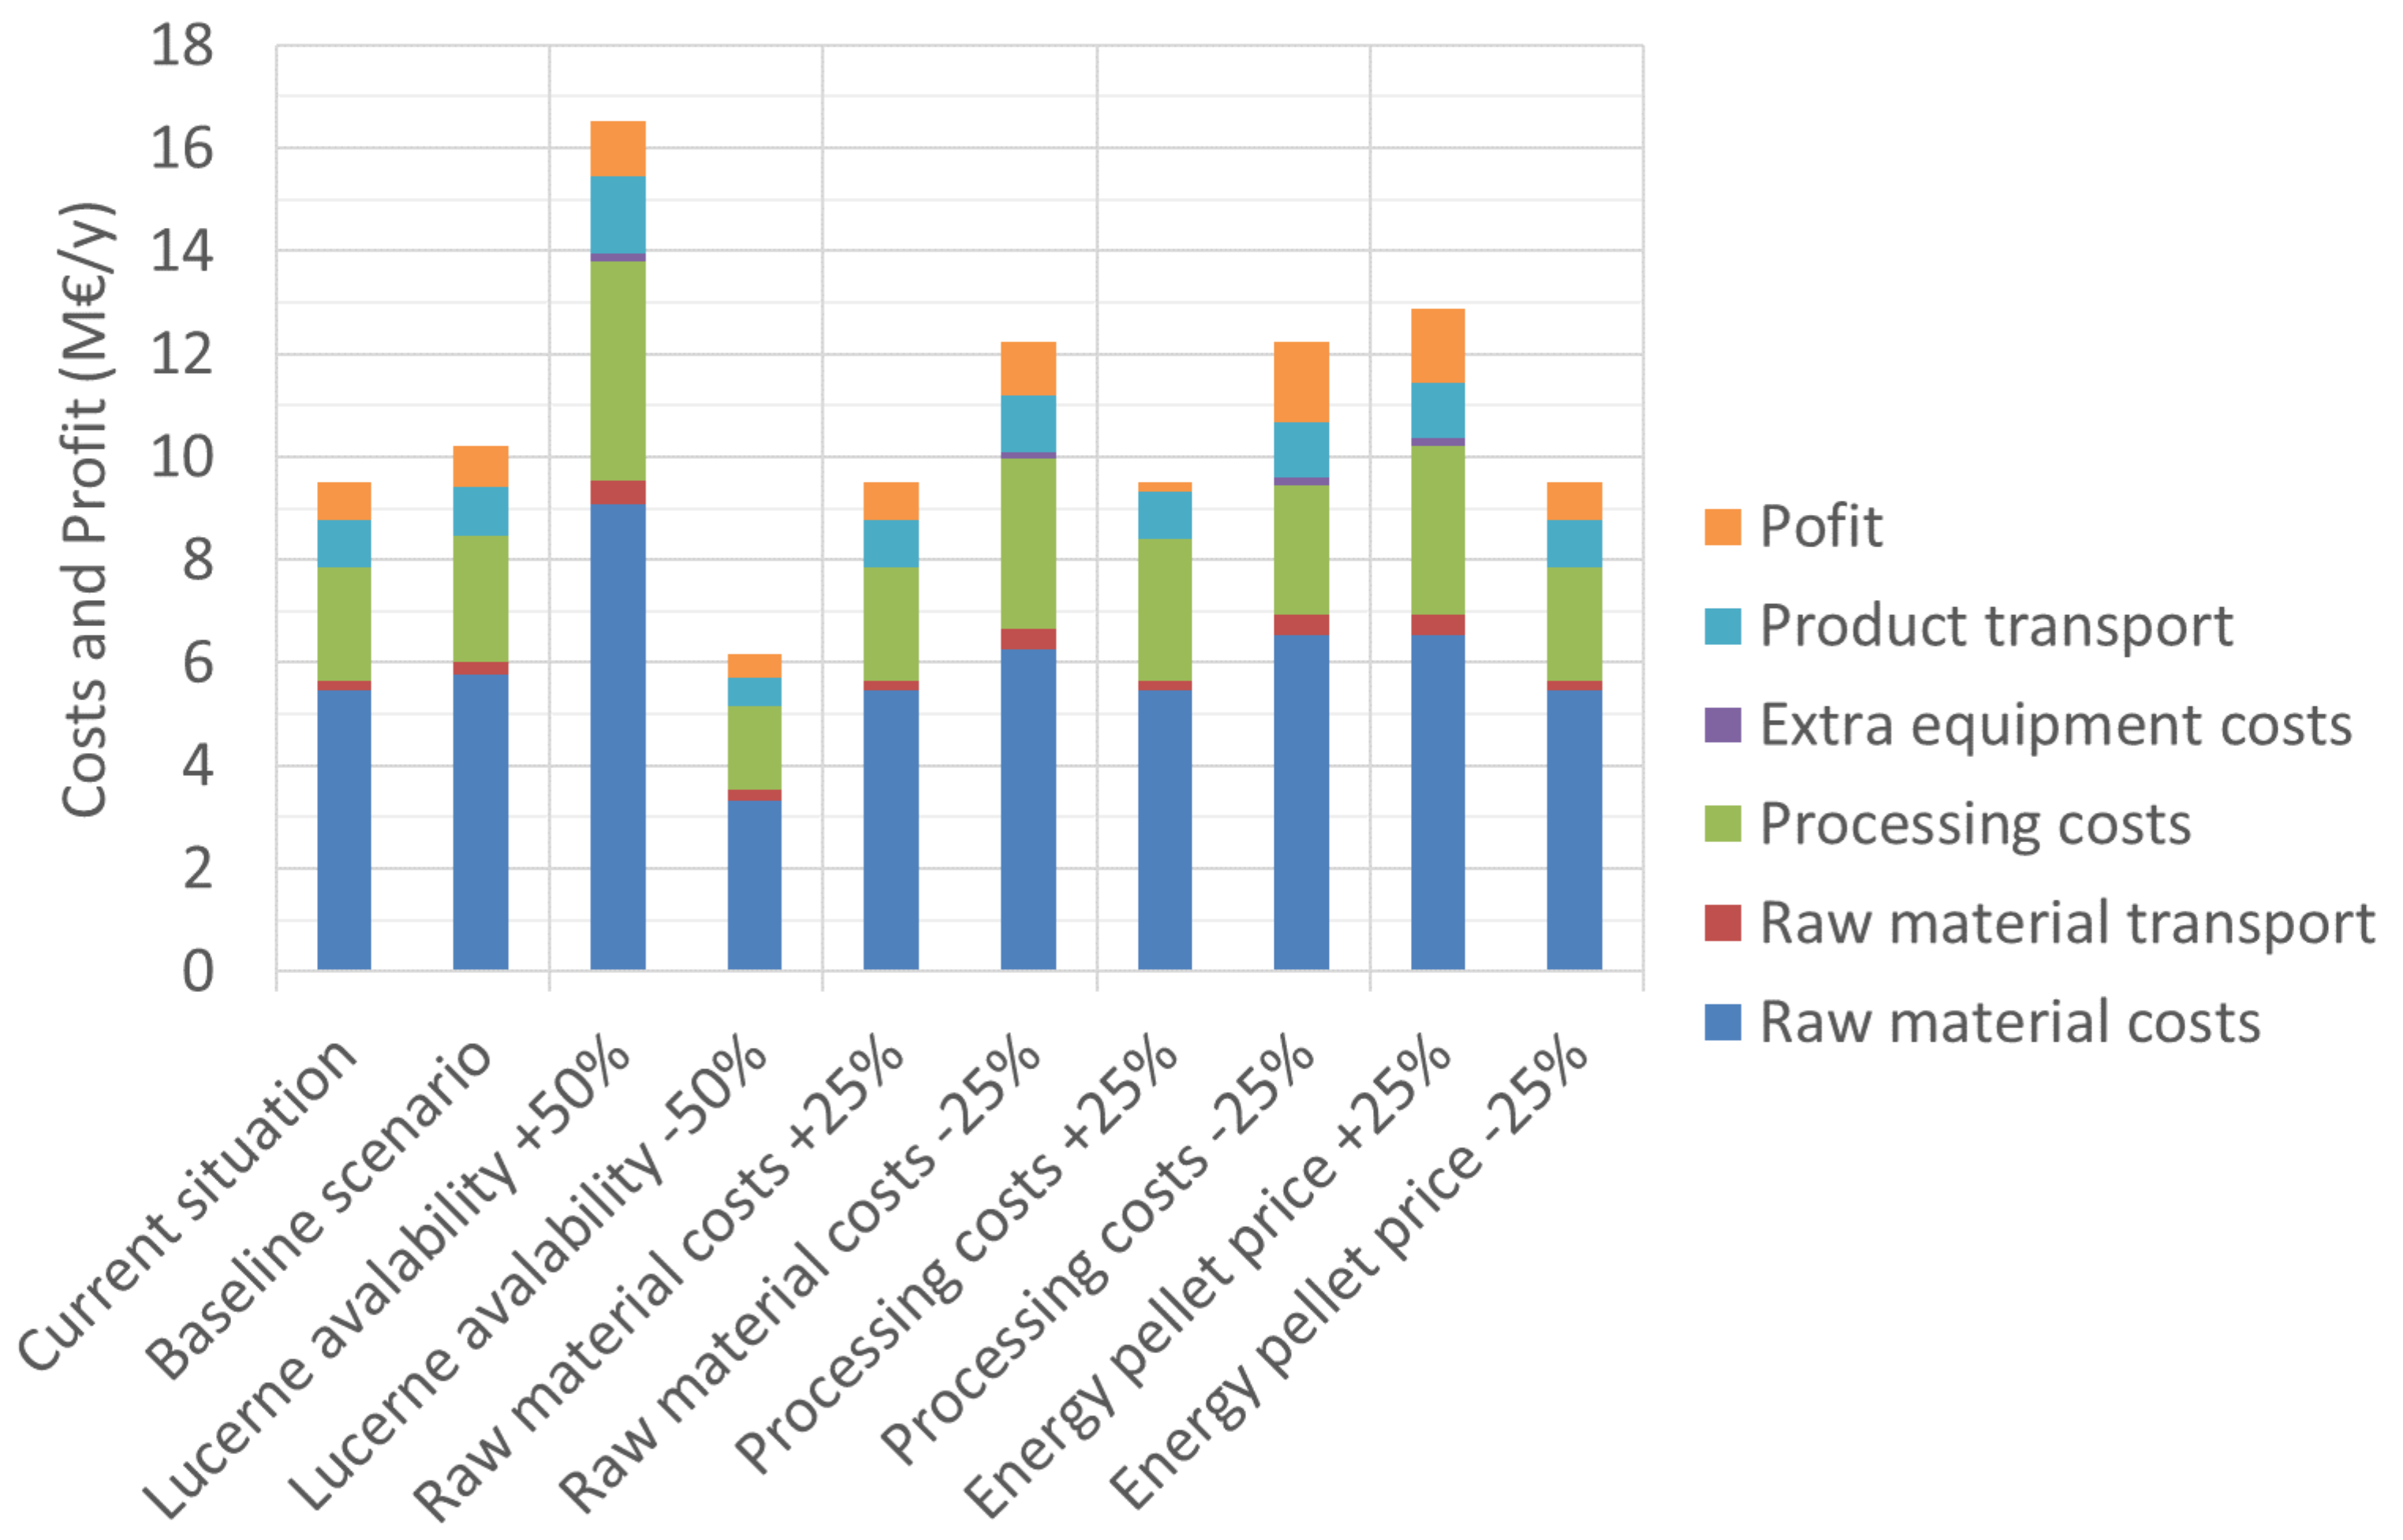
4.2. Sensitivity Analyses

The annually produced products with the highest profit for the different scenarios are shown in Figure 4. The annual costs and profit of the different scenarios are shown in Figure 5. The total costs, revenues, profit, and margin are shown in Table 1.
In the current situation, the lucerne bulk and lucerne bales are processed in the months in which they are available. All lucerne that is available is processed. During these months, the equipment is running at full capacity. The calculated profit is 0.7 M€ /year which results in a margin of 7.8%.
In the baseline scenario, the idle time of the processing of the lucerne products is used to produce energy pellets. In this scenario, it is not profitable to invest in extra equipment. The calculated profit increases only 0.1 M€/y and the margin decreases slightly to 7.7%.
When lucerne availability increases by 50%, it is profitable to invest in extra equipment. Not only more lucerne but also more energy pellets can be produced in the (extra) idle time of the lucerne processing equipment. In this scenario, the raw materials are stockpiled and processed in the months that they are not available. In the optimized scenario, the storage reaches its maximum and therefore there is no production in March. The calculated profit increases significantly with 0.4 M€/y to a total of 1.1 M€ /year. The margin decreases to 6.4% because the margin on energy pellets is smaller compared to the lucerne products. When the lucerne availability decreases by 50%, more energy pellets can be produced, also in the months in which lucerne is available. In this scenario, the profit decreases by 0.2 M€/y to a total of 0.5 M€/year, but the margin decreases slightly to only 7.7%.
When the raw material costs of wheat straw and wood chips increase by 25%, it is not profitable to produce energy pellets, even not in the idle time of the production of lucerne products. This change does not affect the production of lucerne products. For the scenario of decreasing energy pellet price by 25%, the same pattern is observed.
When increasing the processing costs for all raw materials by 25%, no energy pellets are produced and the profit decreases to 0.2 M€/y with a margin of just 2.0% because the profitability for producing lucerne products also decreases.
When raw material costs of wheat straw and wood chips decrease or energy pellet prices increase by 25%, or processing costs decrease 25%, it is profitable to produce energy pellets. In these scenarios, it is also profitable to invest in extra equipment. Especially in the scenarios with decreased processing costs and increased selling prices of energy pellets, the profit and margin increase significantly.

5. Discussion and Conclusions

In this research, we developed a MILP model to optimize biomass supply chains using IBLCs. The reasoning behind an IBLC is to optimize resource utilization of an existing biomass supply chain. Resources are not only biomass availability, but also storage capacity, machinery capacity, and labor availability. Through leveraging between the primary production of food and/or feed and the production of other biobased products, the IBLC can improve the utilization rates of machinery, process more locally available biomass, and increase the profit margin.
The MILP model takes into account the feedstock availability, feedstock transportation from the suppliers to the IBLC, feedstock processing in the IBLC, product transportation from the IBLC to the market, and the intermediate storage steps at the suppliers and the IBLC. It can calculate the optimal business strategy with respect to the feedstock sourcing plan, the IBLC processing schedule, and potential investment in machinery.
To demonstrate the added value of the MILP model in facilitating decision making on IBLC operations and investment. a case study for the feed and fodder sector was conducted. The case study gave relevant insights into the economic aspects of establishing an IBLC. Although the conclusions are very case-specific, some more general indications emerge for setting up an IBLC:
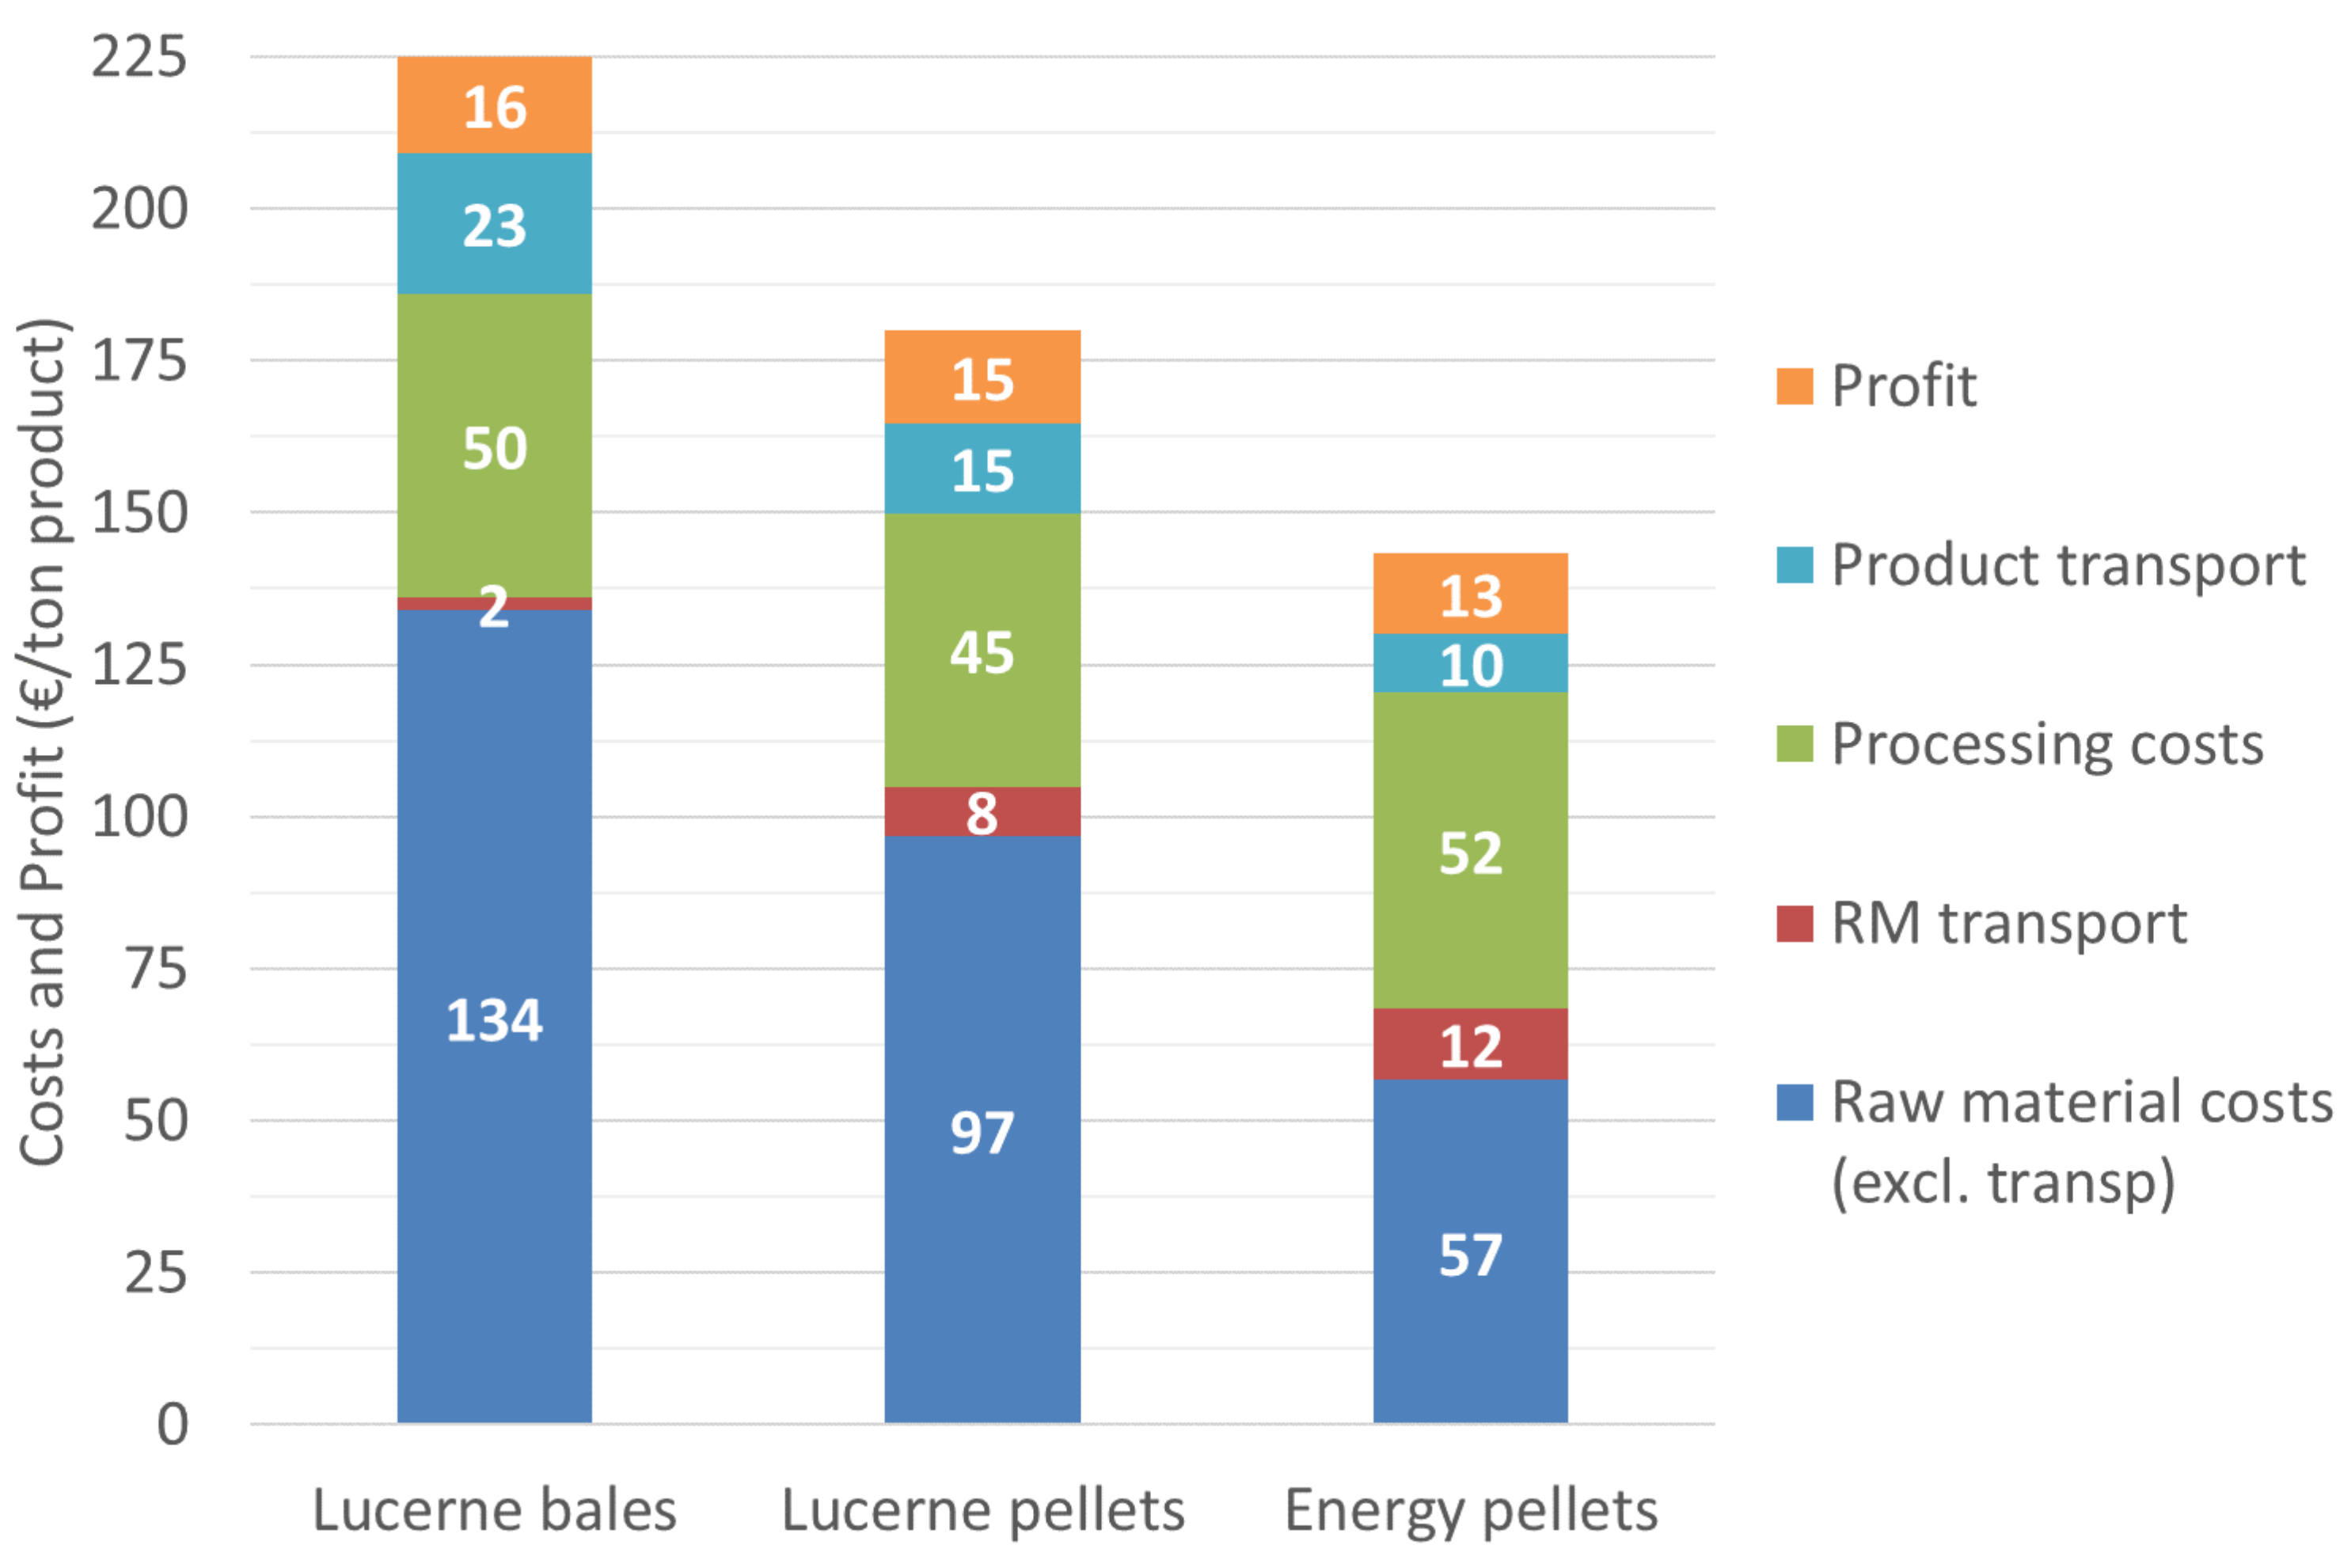
  • Raw material costs and processing costs often dominate the total production costs.
  • Raw material transport costs have only a small contribution to the total costs in the case when the transport distance to the IBLC is relatively small. At larger distances, transport costs will of course have a more significant contribution.
  • The efficient planning of the use of process lines and storage capacity in the IBLC is required.
  • Using the idle time of the existing processing equipment to produce biobased products, such as energy pellets, can increase the profit of the IBLC.
  • To determine the economic feasibility of additional process lines, accurate estimates of all cost aspects, including investment costs for extra equipment, are required.
  • The demand for biobased products should be adequate, so market size should be checked in practice.
The general indications for setting up an IBLC always need to be verified for the specific IBLC design at hand. For this purpose, the MILP model is an important supporting tool to fill the gap for decision supports on IBLC establishment in biomass supply chains. There are also limitations associated with the current version of the model which needs future development of its functions and applications in more case studies. For example, the assumption for the decay parameter was simplified as a fixed value, which should in fact depend on the moisture content. Future research should focus on further refining the MILP model to make it capture more realistic and detailed supply chain activities, especially within the IBLC. Moreover, the results of the case study are actually based on a specific location in Spain where the IBLC locates. To extrapolate the results to other locations, the location-specific factors—such as feedstock availability, sourcing distances, and demand—must be taken into account. This also requires to apply the MILP model to more case studies that cover diversified sectors and geography for the validation and further development of the MILP model.

Author Contributions

Conceptualization: X.G., J.V., B.A., J.S., A.K.; formal analysis: X.G., J.V.; data curation: X.G., J.V., B.A., J.S.; writing—original draft preparation: X.G., J.V.; writing—review and editing: B.A., J.S., A.K. All authors have read and agreed to the published version of the manuscript.

Funding

This research was funded by EU Horizon 2020, Grant agreement number: 727961.

Acknowledgments

The authors sincerely acknowledge the contributions made by Arne Knippels and Tom Romme to this paper.

Conflicts of Interest

The authors declare no conflict of interest.

Appendix A. Definitions of Different Types of Depots

Standard depot: a depot to improve feedstock stability (for storage), increase bulk density (for transport), improve flowability (for stable in-feed rates), and reduce material losses.
Quality depot: on top of the function of a standard depot, a quality depot actively addresses feedstock quality aspects specific to the end-use market it targets.

Appendix B. Mathematical Formulation of the MILP Model

M a x i m i z e T P = T R T C
T P is the total profit.
T R is the revenue.
T C is the costs.
T R = i , k , t W i , k , t P i , k
W i , k , t is the sold intermediate product (i,k) in month t.
P i , k is the price for the intermediate product (i,k).
T C = T P C r a w + T T C + T S C + T P T C + T E C C  
TPCraw is the production costs of the raw materials.
TTC is the transportation costs.
TSC is the storage costs.
TPTC is the total pre-treatment costs.
TECC is the costs to purchase extra machinery capacity.
T P C r a w = i , t , f X i , t , f P C r a w i , f
X i , t , f is the mass of raw material i harvested in period t on farm f.
P C r a w i , f is the production price of raw material i on farm f.
T T C = T T C r a w + T T C int
TTCraw is the transportation costs for the raw materials from the farms to the IBLC.
TTCint is the transportation costs for the intermediate product (after pre-treatment) sold from the IBLC to the market.
T T C r a w = i , f , t U i , f , t / d e n s i t y r a w   i D r a w f T r a n s p C
U i , f , t is the mass of raw material i on farm f that is moved to the IBLC in month t.
d e n s i t y r a w   i is the density of the raw material i.
D r a w f is the distance from farm f to the IBLC.
T r a n s p C is the per-unit transportation costs based on the volume of the materials.
T T C i n t = i , k , t W i , k , t / d e n s i t y i n t   i , k D i n t e r m e d i a t e i , k     T r a n s p C
d e n s i t y i n t   i , k is the density for the intermediate product (i,k).
D i n t e r m e d i a t e i , k is the distance from the IBLC to the market which purchases the intermediate product (i,k).
T S C = V S C r a w + V S C i n t + V S F + T F S C + S I N V
V S C r a w is the variable storage costs for the raw materials in the IBLC.
V S C i n t is the variable storage costs for the intermediate products in the IBLC.
V S F is the variable storage costs on farm.
T F S C is the fixed costs based on the space occupied in the IBLC.
S I N V is the annualized investment costs for purchasing extra storage capacity.
To save space, the detailed calculations of each type of storage costs are not listed here but they are available when requested by the readers.
S r a w o n f i e l d i , t , f =   a i , f S r a w o n f i e l d i , t 1 , f + X i , t , f U i , t , f     i   1 I ,   f   1 F   a n d   t   2 T
S r a w o n f i e l d i , 1 , f =   a i , f S r a w o n f i e l d i , T , f + X i , 1 , f U i , 1 , f     i   1 I   a n d   ,   f   1 F
Equations (A9) and (A10) are the conversion constraints for raw materials being transported and stored on field from one month to another.
S r a w o n f i e l d i , t , f is the mass of raw material i stored on farm f in month t.
a i , f is the decay factor per month for raw material i stored on farm f.
S r a w i b l c i , t = e i S r a w i b l c i , t 1 + f U i , t , f k Y i , k , t     i   1 I   a n d   t   2 T  
S r a w i b l c i , 1 = e i S r a w i b l c i , T + f U i , 1 , f k Y i , k , 1     i   1 I  
Equations (A11) and (A12) are the conversion constraints for transferring the raw materials stored in the IBLC from one month to another.
Y i , k , t is the mass of material i processed by the pretreatment k in month t in the IBLC.
S r a w i b l c i , t is the mass of raw material i stored in the IBLC in month t.
e i is the decay factor per month for raw material i in the IBLC.
k Y i , k , t   E o P k , q C a p i , q + E x t r P r e C h o i c e q E x t r C a p q N o r m a l F i , q     i   1 I , q 1 Q   a n d   t   1 T
C a p i , q is the capacity of machine q to process material i.
E x t r C a p q N o r m a l F i , q is the extra capacity of machine q for material i that can be purchased where N o r m a l F i , q is a normalization factor.
E x t r P r e C h o i c e q is a binary variable to indicate whether or not the extra piece of machine q to be purchased.
E o P k , q is a binary variable to indicate whether or not the pretreatment k includes machine q.
T E C C = q E x t r P r e C h o i c e q E x t r C o s t s q
Equation (A14) is used to calculate the costs to purchase extra machinery.
E x t r C o s t s q is the annualized investment costs to purchase the extra piece of machine q.
P T C = i , k , t Y i , k , t P T C K k
P T C is the total pretreatment costs for processing the raw materials into the intermediate products.
P T C K k is the unit pretreatment costs for processing the raw materials through pretreatment k.
Y i , k , t b i , k = Z i , k , t     i   1 I , k   1 K   a n d   t   1 T
Z i , k , t is the produced intermediate products (i,k) in month t.
b i , k is the conversion factor to transfer Y i , k , t to Z i , k , t .
X i , f , t A v r a w i , f , t       i   1 I ,   f   1 I   a n d   t   1 T
A v r a w i , f , t is the mass of raw material i that is available on farm f in month t.
W i , k , t D e m a n d i , k , t       i   1 I , k   1 K   a n d   t   1 T
D e m a n d i , k , t is the demand for the intermediate product (i,k) in month t.

Appendix C. Parameters MILP Model Feed and Fodder Sector

Table A1. Raw material availability.
FromUntilZone 1
10 km
(kton/Month)
Zone 2
30 km
(kton/Month)
Zone 3
100 km
(kton/Month)
Total
(kton/y)
Lucerne
bulk
AprNov22032
Lucerne
bales
AprNov0.50.5224
60% Straw
40% Wood
JulAug001734
Table A2. Parameters of raw materials and processing.
Raw MaterialProcessing
DensityPrice (No Transp)Average TransportYieldCostsCosts
(ton/m3)(€/ton)(km)(P/RM)(€/ton P)(€/ton RM)
Lucerne
bulk
0.250112.5200.84050.042.0
Lucerne
bales
0.25077.5730.80045.036.0
60% Straw
40% Wood
0.22546.81000.82651.842.8
Table A3. Product parameters.
DensityTransportSelling Price
(ton/m3)(km)(€/ton)
Feed bales0.380400225
Feed pellets0.600400180
Energy pellets0.562250143
Table A4. Extra equipment capacity and costs. The costs are annualized by distributing the investment costs over 10 years.
Extra CapacityExtra Equipment Costs
(ton/Month)(k€/y)
Wood grinder6005
Grinder300010
Hopper60010
Mill30006.5
Dryer400090
Baler400025
Pelletizer300019
Mizer30006.5
Cooler 140003.5
Cooler 230003
Storage577525

References

  1. Population_Institute, Why Population Matters. 2017. Available online: https://www.populationinstitute.org/resources/why-population-matters/ (accessed on 22 November 2020).
  2. Lambin, E.F.; Meyfroidt, P. Global land use change, economic globalization, and the looming land scarcity. Proc. Natl. Acad. Sci. USA 2011, 108, 3465–3472. [Google Scholar] [CrossRef] [PubMed] [Green Version]
  3. Jones, G.A.; Warner, K.J. The 21st century population-energy-climate nexus. Energy Policy 2016, 93, 206–212. [Google Scholar] [CrossRef]
  4. Shafiee, S.; Topal, E. When will fossil fuel reserves be diminished? Energy Policy 2009, 37, 181–189. [Google Scholar] [CrossRef]
  5. Bolin, B.; Jäger, J.; Döös, B.R. The Greenhouse Effect, Climatic Change, and Ecosystems; John Wiley & Sons Ltd.: Stockholm, Sweden, 1985. [Google Scholar]
  6. Mafakheri, F.; Nasiri, F. Modeling of biomass-to-energy supply chain operations: Applications, challenges and research directions. Energy Policy 2014, 67, 116–126. [Google Scholar] [CrossRef]
  7. McKendry, P. Energy production from biomass (part 1): Overview of biomass. Bioresour. Technol. 2002, 83, 37–46. [Google Scholar] [CrossRef]
  8. Ba, B.H.; Prins, C.; Prodhon, C. Models for optimization and performance evaluation of biomass supply chains: An Operations Research perspective. Renew. Energy 2016, 87, 977–989. [Google Scholar] [CrossRef]
  9. Gómez, M. AGROinLOG. 2019. Available online: https://citarea.cita-aragon.es/citarea/bitstream/10532/4873/1/3_AGROinLOG.pdf (accessed on 22 November 2020).
  10. Poutrin, C. Handbook for Agro-Industries Interested in Starting a New Activity as Biomass Logistic Centre: The Basic Demand of Information; Services Coop de France: Paris, France, 2015. [Google Scholar]
  11. Rentizelas, A.A.; Tolis, A.J.; Tatsiopoulos, I.P. Logistics issues of biomass: The storage problem and the multi-biomass supply chain. Renew. Sustain. Energy Rev. 2009, 13, 887–894. [Google Scholar] [CrossRef] [Green Version]
  12. Atashbar, N.Z.; Labadie, N.; Prins, C. Modeling and optimization of biomass supply chains: A review and a critical look. IFAC PapersOnLine 2016, 49, 604–615. [Google Scholar] [CrossRef]
  13. Cambero, C.; Sowlati, T. Assessment and optimization of forest biomass supply chains from economic, social and environmental perspectives—A review of literature. Renew. Sustain. Energy Rev. 2014, 36, 62–73. [Google Scholar] [CrossRef]
  14. De Meyer, A.; Cattrysse, D.; Rasinmäki, J.; Van Orshoven, J. Methods to optimise the design and management of biomass-for-bioenergy supply chains: A review. Renew. Sustain. Energy Rev. 2014, 31, 657–670. [Google Scholar] [CrossRef] [Green Version]
  15. Gargalo, C.L.; Carvalho, A.; Gernaey, K.V.; Sin, G. Optimal design and planning of glycerol-based biorefinery supply chains under uncertainty. Ind. Eng. Chem. Res. 2017, 56, 11870–11893. [Google Scholar] [CrossRef]
  16. Lee, M.; Cho, S.; Kim, J. A comprehensive model for design and analysis of bioethanol production and supply strategies from lignocellulosic biomass. Renew. Energy 2017, 112, 247–259. [Google Scholar] [CrossRef]
  17. Paulo, H.; Barbosa-Póvoa, A.P.F.; Relvas, S. Modeling integrated biorefinery supply chains. In Computer Aided Chemical Engineering; Elsevier: Amsterdam, The Netherlands, 2013; Volume 32, pp. 79–84. [Google Scholar]
  18. Roni, M.S.; Thompson, D.N.; Hartley, D.S. Distributed biomass supply chain cost optimization to evaluate multiple feedstocks for a biorefinery. Appl. Energy 2019, 254, 113660. [Google Scholar] [CrossRef]
  19. Zhu, X.; Yao, Q. Logistics system design for biomass-to-bioenergy industry with multiple types of feedstocks. Bioresour. Technol. 2011, 102, 10936–10945. [Google Scholar] [CrossRef]
  20. Hatti-Kaul, R.; Törnvall, U.; Gustafsson, L.; Börjesson, P. Industrial biotechnology for the production of bio-based chemicals—A cradle-to-grave perspective. Trends Biotechnol. 2007, 25, 119–124. [Google Scholar] [CrossRef]
  21. Annevelink, E.; Staritsky, I.; Krajnc, N.; Lammens, T.; Gonzalez, D.S.; Lenz, K.; Kühner, S.; Anttila, P.; Prinz, R.; Leduc, S. S2biom Survey of Logistical Concepts. 2016. Available online: https://scanr.enseignementsup-recherche.gouv.fr/publication/hal-01594510 (accessed on 22 October 2020).
  22. CIRCE. Summary of the Regional Situation, Biomass Resources and Priority Areas of Action in Spain; CIRCE-Research Centre for Energy Resources and Consumption: Zaragoza, Spain, 2014; Available online: https://www.sucellog.eu/images/Publications_and_Reports/D3.2a_Regional_situation_Resources_and_priority_areas_in_Spain_web.pdf (accessed on 22 October 2020).
  23. Balaman, Ş.Y.; Matopoulos, A.; Wright, D.G.; Scott, J. Integrated optimization of sustainable supply chains and transportation networks for multi technology bio-based production: A decision support system based on fuzzy ε-constraint method. J. Clean. Prod. 2018, 172, 2594–2617. [Google Scholar] [CrossRef] [Green Version]
  24. Leão, R.R.d.C.C.; Hamacher, S.; Oliveira, F. Optimization of biodiesel supply chains based on small farmers: A case study in Brazil. Bioresour. Technol. 2011, 102, 8958–8963. [Google Scholar] [CrossRef] [Green Version]
  25. Panteli, A.; Giarola, S.; Shah, N. Supply chain mixed integer linear program model integrating a biorefining technology superstructure. Ind. Eng. Chem. Res. 2018, 57, 9849–9865. [Google Scholar] [CrossRef] [Green Version]
  26. Pérez-Fortes, M.; Laínez-Aguirre, J.M.; Arranz-Piera, P.; Velo, E.; Puigjaner, L. Design of regional and sustainable bio-based networks for electricity generation using a multi-objective MILP approach. Energy 2012, 44, 79–95. [Google Scholar] [CrossRef] [Green Version]
  27. Iakovou, E.; Karagiannidis, A.; Vlachos, D.; Toka, A.; Malamakis, A. Waste biomass-to-energy supply chain management: A critical synthesis. Waste Manag. 2010, 30, 1860–1870. [Google Scholar] [CrossRef] [PubMed]
  28. Hong, B.H.; How, B.S.; Lam, H.L. Overview of sustainable biomass supply chain: From concept to modelling. Clean Technol. Environ. Policy 2016, 18, 2173–2194. [Google Scholar] [CrossRef]
  29. Lautala, P.T.; Hilliard, M.R.; Webb, E.; Busch, I.; Hess, J.R.; Roni, M.S.; Hilbert, J.; Handler, R.M.; Bittencourt, R.; Valente, A. Opportunities and challenges in the design and analysis of biomass supply chains. Environ. Manag. 2015, 56, 1397–1415. [Google Scholar] [CrossRef] [PubMed]
  30. Eranki, P.L.; Bals, B.D.; Dale, B.E. Advanced regional biomass processing depots: A key to the logistical challenges of the cellulosic biofuel industry. Biofuels Bioprod. Biorefining 2011, 5, 621–630. [Google Scholar] [CrossRef]
  31. Bals, B.D.; Dale, B.E. Developing a model for assessing biomass processing technologies within a local biomass processing depot. Bioresour. Technol. 2012, 106, 161–169. [Google Scholar] [CrossRef]
  32. Campbell, T. Local biomass processing depots for improved feedstock logistics and economics. In Proceedings of the the Idaho National Laboratory Biomass Workshop, Idaho Falls, ID, USA, 23 August 2011. [Google Scholar]
  33. Lamers, P.; Roni, M.S.; Tumuluru, J.S.; Jacobson, J.J.; Cafferty, K.G.; Hansen, J.K.; Kenney, K.; Teymouri, F.; Bals, B. Techno-economic analysis of decentralized biomass processing depots. Bioresour. Technol. 2015, 194, 205–213. [Google Scholar] [CrossRef] [Green Version]
  34. Lamers, P.; Tan, E.C.; Searcy, E.M.; Scarlata, C.J.; Cafferty, K.G.; Jacobson, J.J. Strategic supply system design—A holistic evaluation of operational and production cost for a biorefinery supply chain. Biofuels Bioprod. Biorefining 2015, 9, 648–660. [Google Scholar] [CrossRef]
  35. Annevelink, E.; van Gogh, J.B.; van Dam, J.E.G.; van den Oever, M.J.A.; Bartels, P. Opportunities for the Implementation of the Biomass Yard Concept in the Greenport Betuwse Bloem (in Dutch); Report No. 1478; Wageningen Food & Biobased Research: Wageningen, The Netherlands, 2014; Available online: https://edepot.wur.nl/274587 (accessed on 22 October 2020).
  36. Loibnegger, T.; Metschina, C.; Solar, T. Regionale Biomassehöfe, 3 Schritte zu Einer Erfolgreichen Projectrealisierung; Landwirtschaftskammer Steiermark: Graz, Austria, 2010; Available online: http://www.google.nl/url?sa=t&rct=j&q=&esrc=s&source=web&cd=&ved=2ahUKEwiRta3g_5TtAhViMewKHQZQAAUQFjAAegQIAxAC&url=http%3A%2F%2Fwww.biomasstradecentre2.eu%2Fscripts%2Fdownload.php%3Ffile%3D%2Fdata%2Fpdf_vsebine%2Fliterature%2FBLTC_Biomasseh__fe.pdf&usg=AOvVaw1bEqM3mS5-NEYfsg0ylJkt (accessed on 22 October 2020).
  37. Perlack, R.D.; Eaton, L.M.; Turhollow, A.F., Jr.; Langholtz, M.H.; Brandt, C.C.; Downing, M.E.; Graham, R.L.; Wright, L.L.; Kavkewitz, J.M.; Shamey, A.M. US Billion-Ton Update: Biomass Supply for a Bioenergy and Bioproducts Industry; U.S. Department of Energy: Oak Ridge, TN, USA, 2011. [CrossRef] [Green Version]
  38. Langholtz, M.; Busch, I.; Kasturi, A.; Hilliard, M.R.; McFarlane, J.; Tsouris, C.; Mukherjee, S.; Omitaomu, O.A.; Kotikot, S.M.; Allen-Dumas, M.R. The Economic Accessibility of CO2 Sequestration through Bioenergy with Carbon Capture and Storage (BECCS) in the US. Land 2020, 9, 299. [Google Scholar] [CrossRef]
Figure 1. Schematic representation of the MILP model for an IBLC.
Energies 13 06153 g001
Figure 2. Equipment usage and production of the current situation and baseline scenario.
Energies 13 06153 g002
Figure 3. Various costs and potential profit for each of the three products (using the average raw material transport distance, excluding costs for extra equipment).
Energies 13 06153 g003
Figure 4. Annual production of pellets in different scenarios.
Energies 13 06153 g004
Figure 5. Annual optimized costs and profit in different scenarios.
Energies 13 06153 g005
Table 1. Costs, revenue, profit, and margin in the different scenarios.
Current SituationBaselineLucerne AvailabilityRaw Material CostsProcessing
Costs
Energy Pellet Price
+50%−50%+25%−25%+25%−25%+25%−25%
Extra equip.?nonoyesnonoyesnoyesyesno
Costs (M€/y)8.89.415.35.78.811.09.310.511.38.8
Revenue (M€/y)9.510.216.36.29.512.19.512.112.79.5
Profit (M€/y)0.70.81.10.50.71.00.21.61.40.7
Profit margin (%)7.8%7.7%6.4%7.7%7.8%8.7%2.0%13%11%7.8%
Publisher’s Note: MDPI stays neutral with regard to jurisdictional claims in published maps and institutional affiliations.

