
Insights on Crypto Investors from a German Personal Finance Management App

Abstract
:1. Introduction
2. Data
2.1. Identification of Crypto Owners
2.2. Behavioral Traits
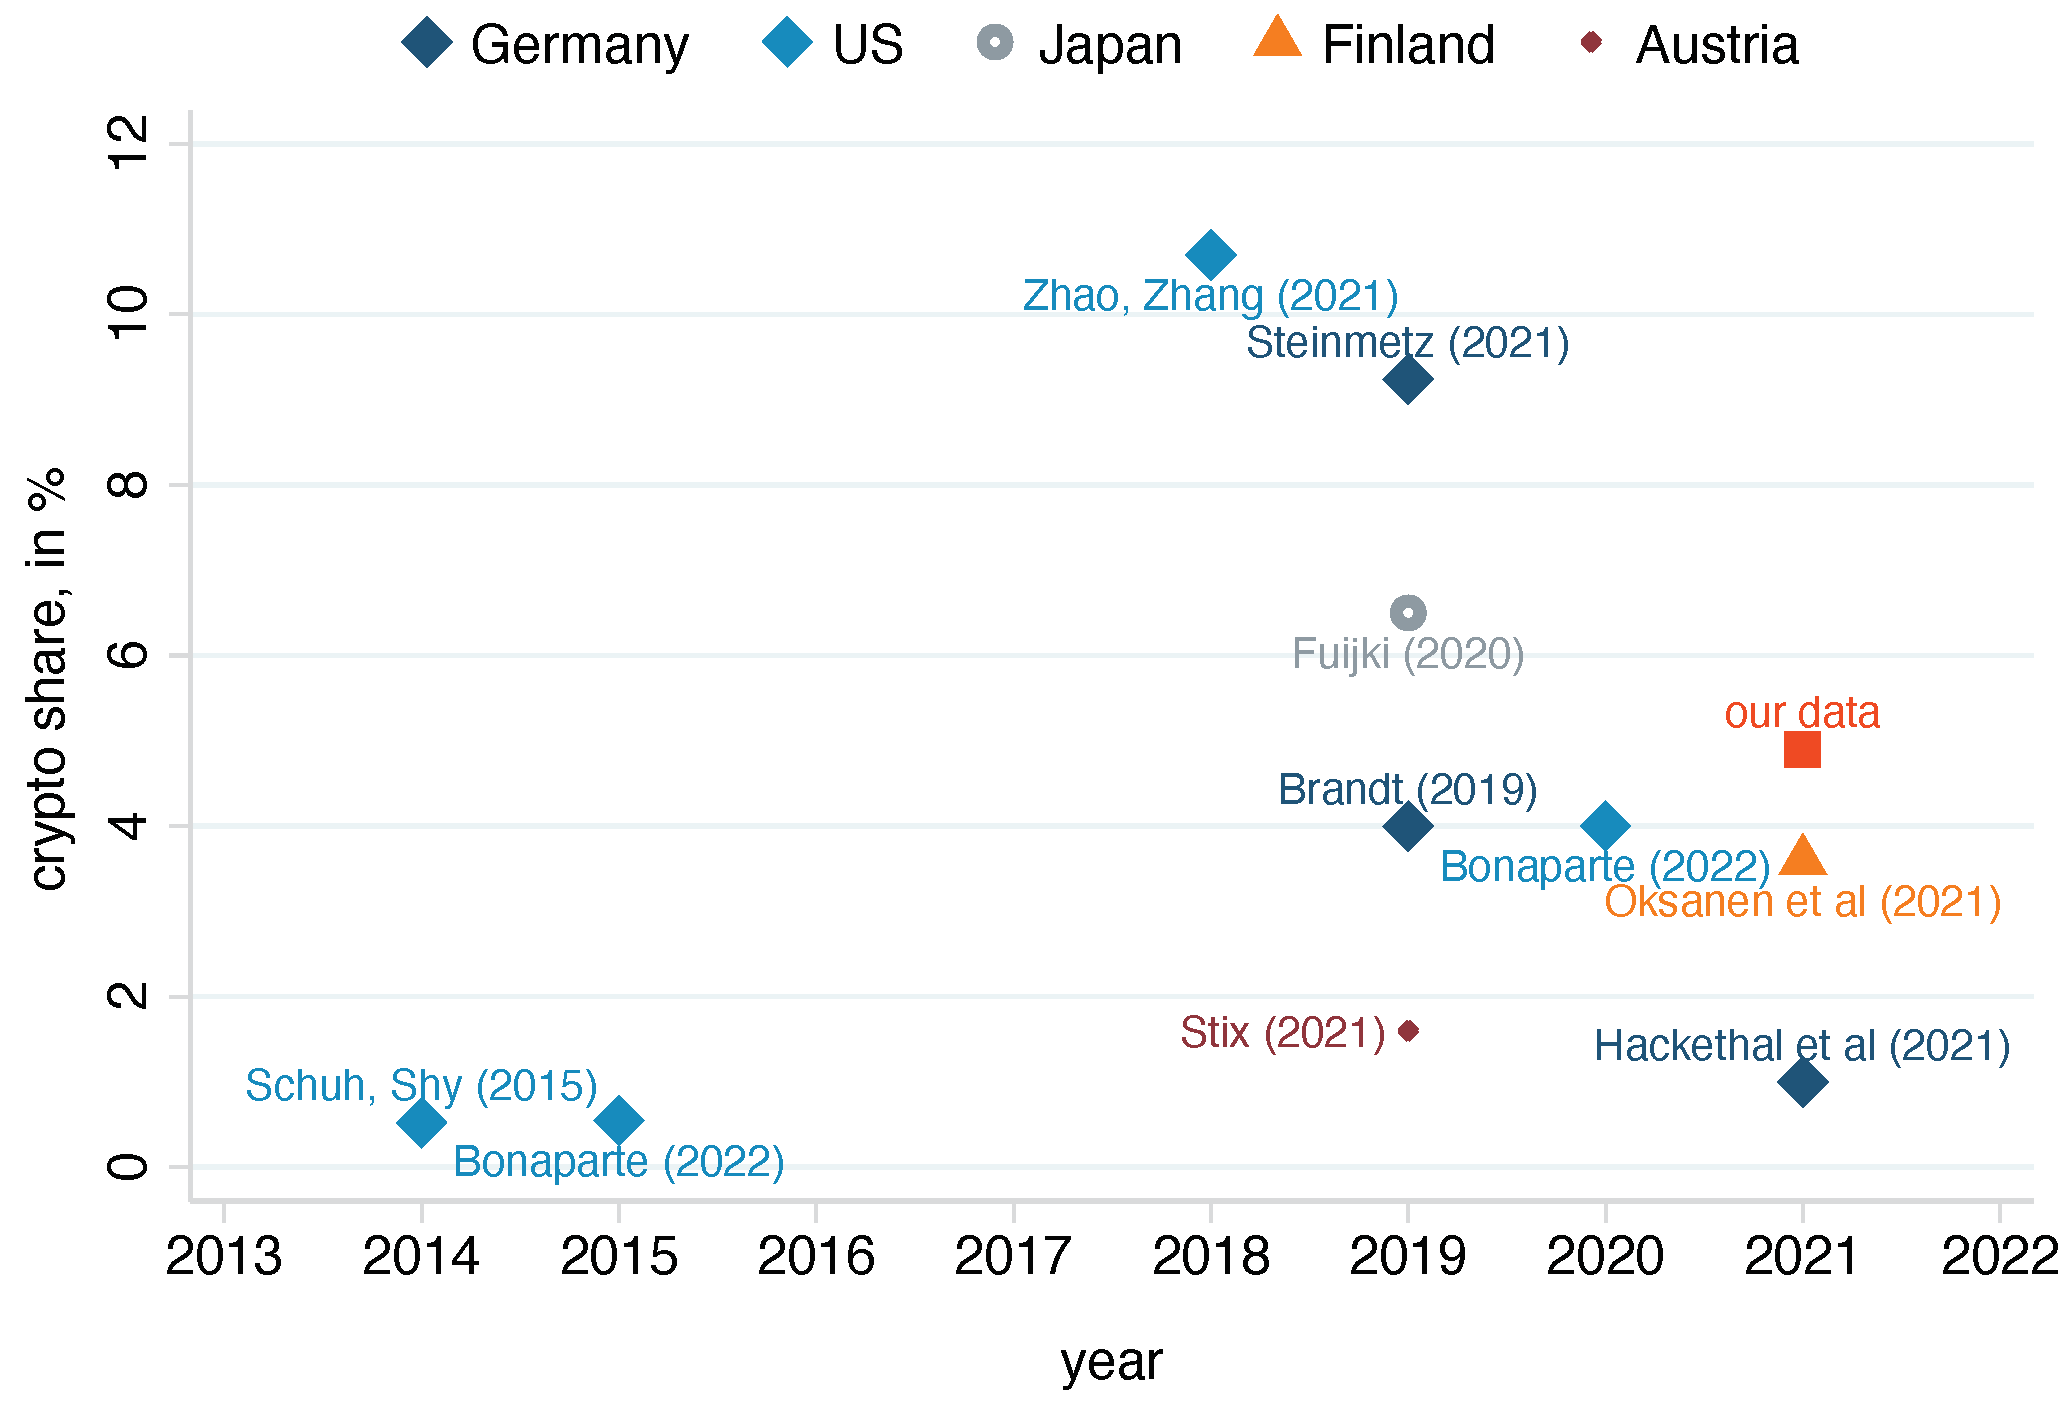
3. Who Are the Cryptocurrency Owners?
3.1. Univariate Analysis of Crypto Investors’ Characteristics, Behavioral Traits, and Consumption
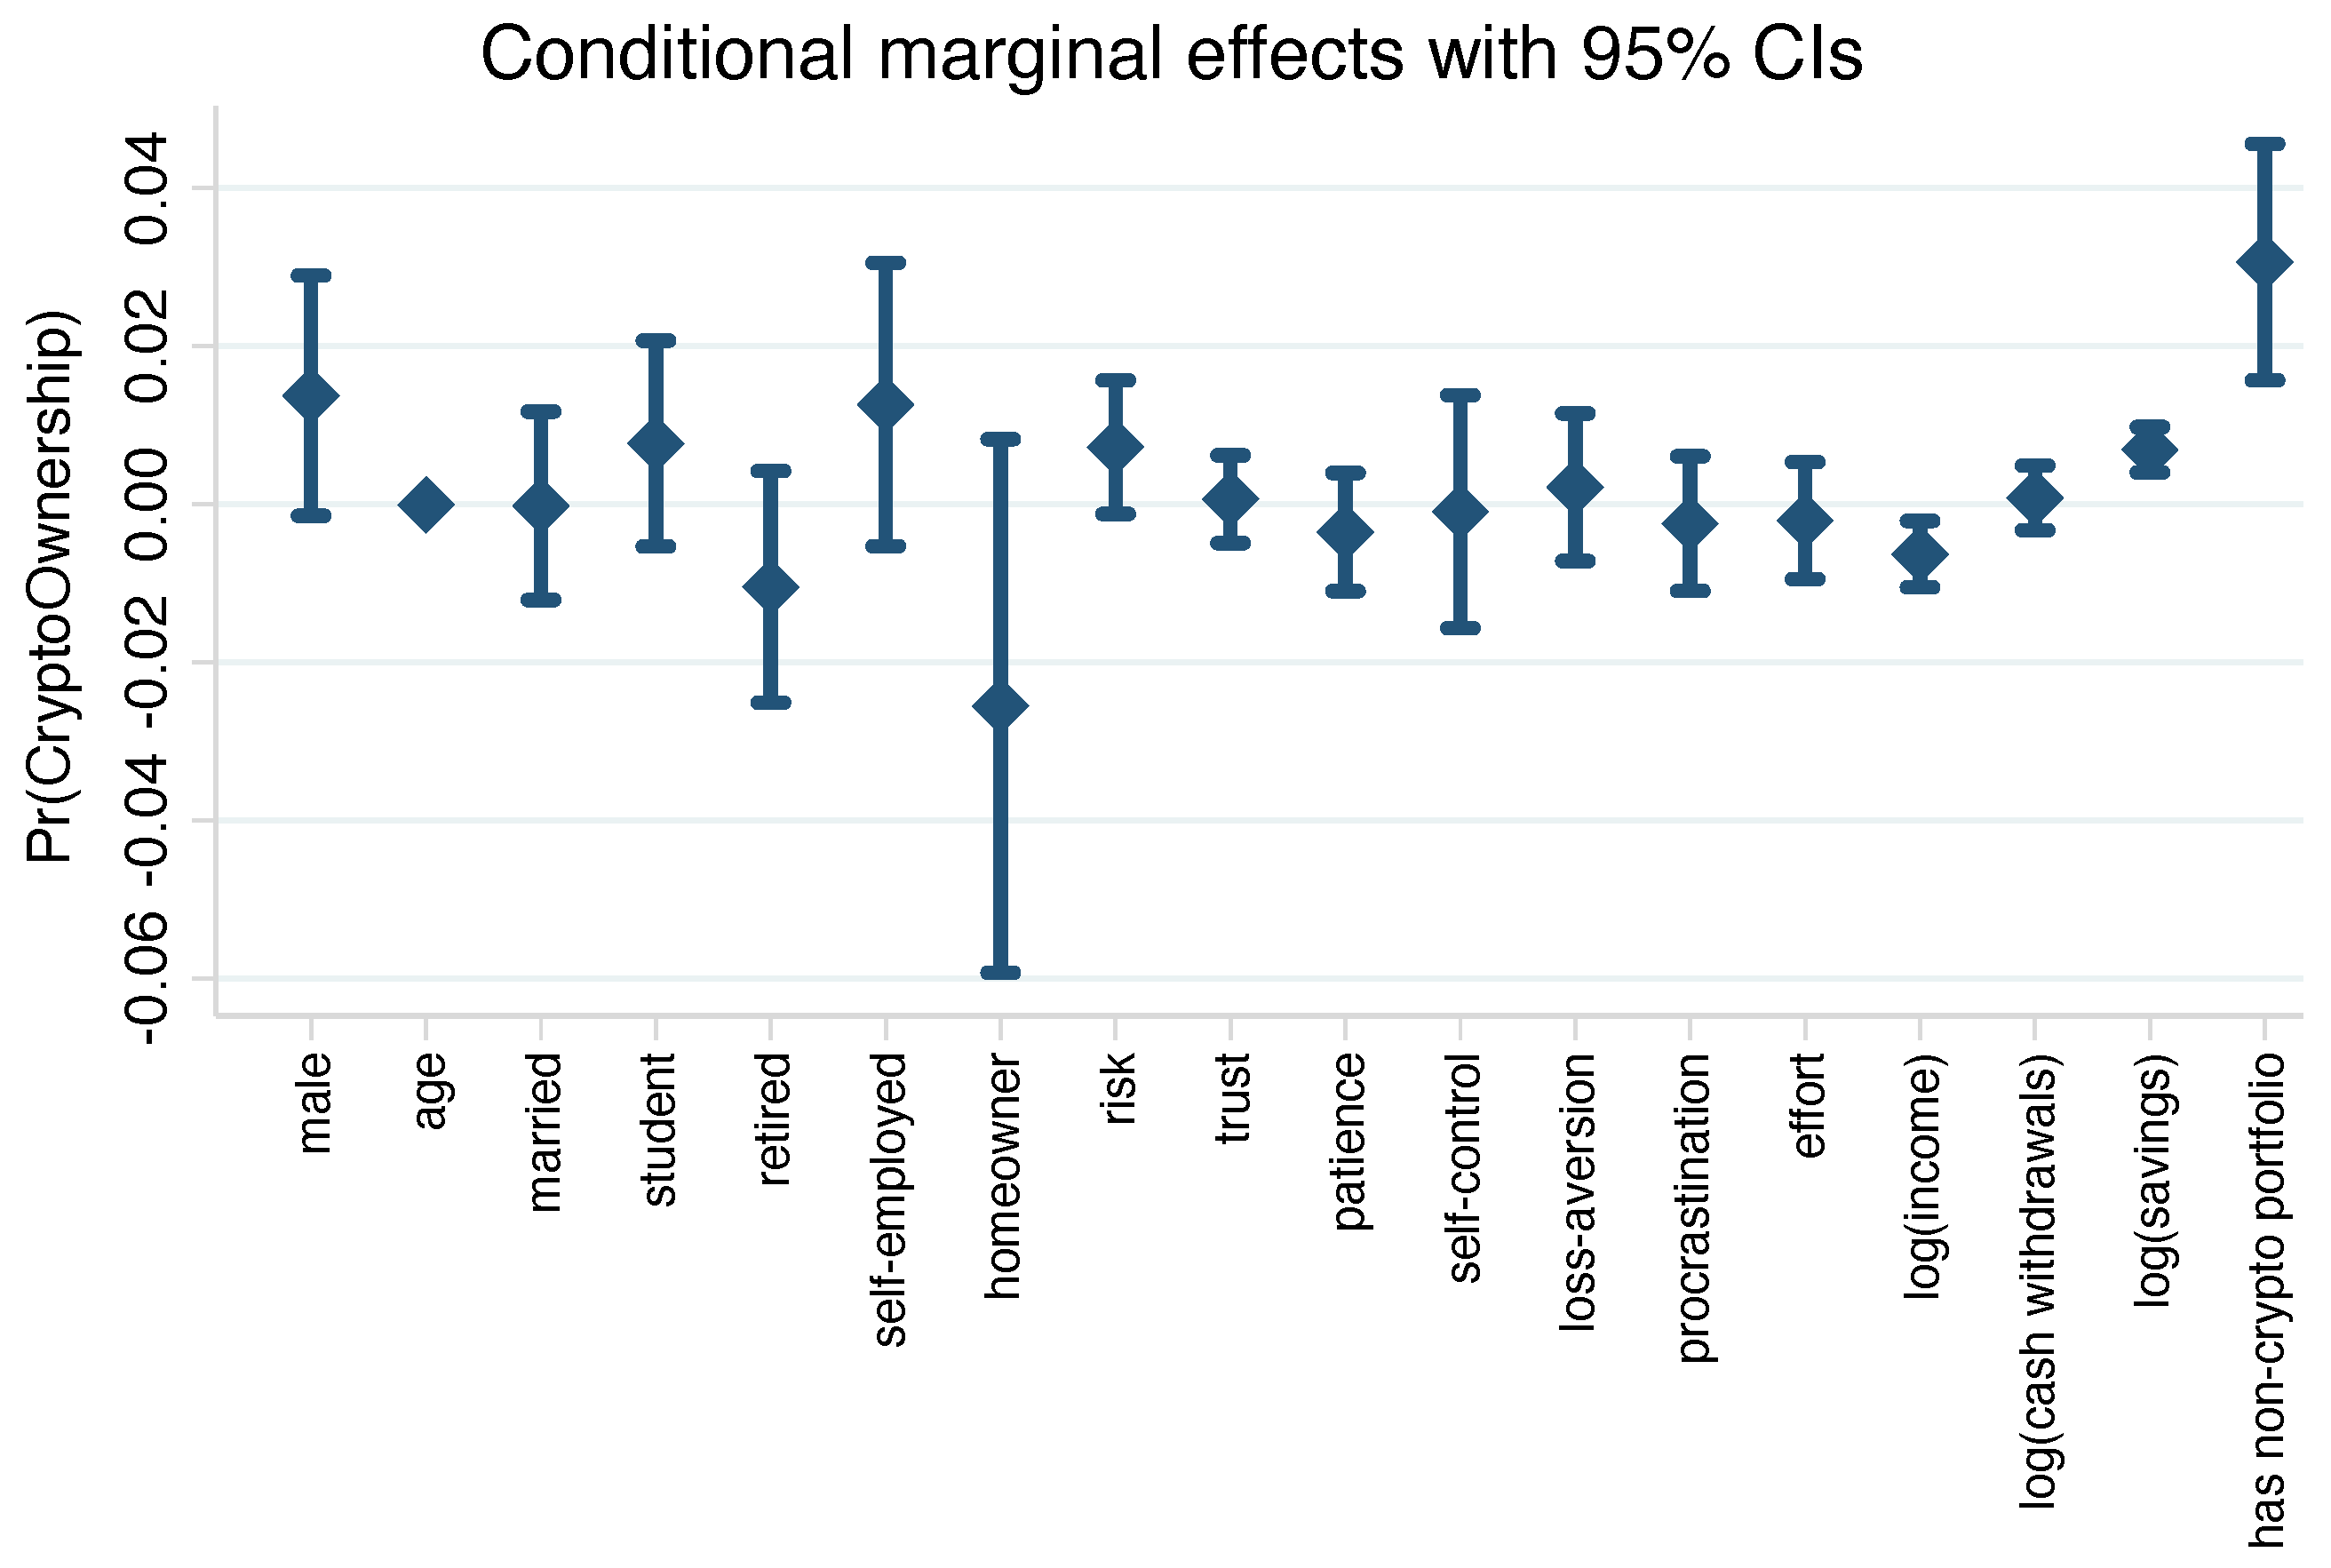
3.2. Identifying the Determinants of Crypto Ownership
3.3. Investigating How Crypto Investors Allocate Their Portfolios
3.4. Additional Insights on Financial Advice, Portfolio Size, and Differences to Conventional Investors
3.4.1. Crypto Owners Preferences for Financial Advice
3.4.2. How Do Crypto Investors Differ from Conventional Investors?
4. Discussion
5. Conclusions
Author Contributions
Funding
Data Availability Statement
Conflicts of Interest
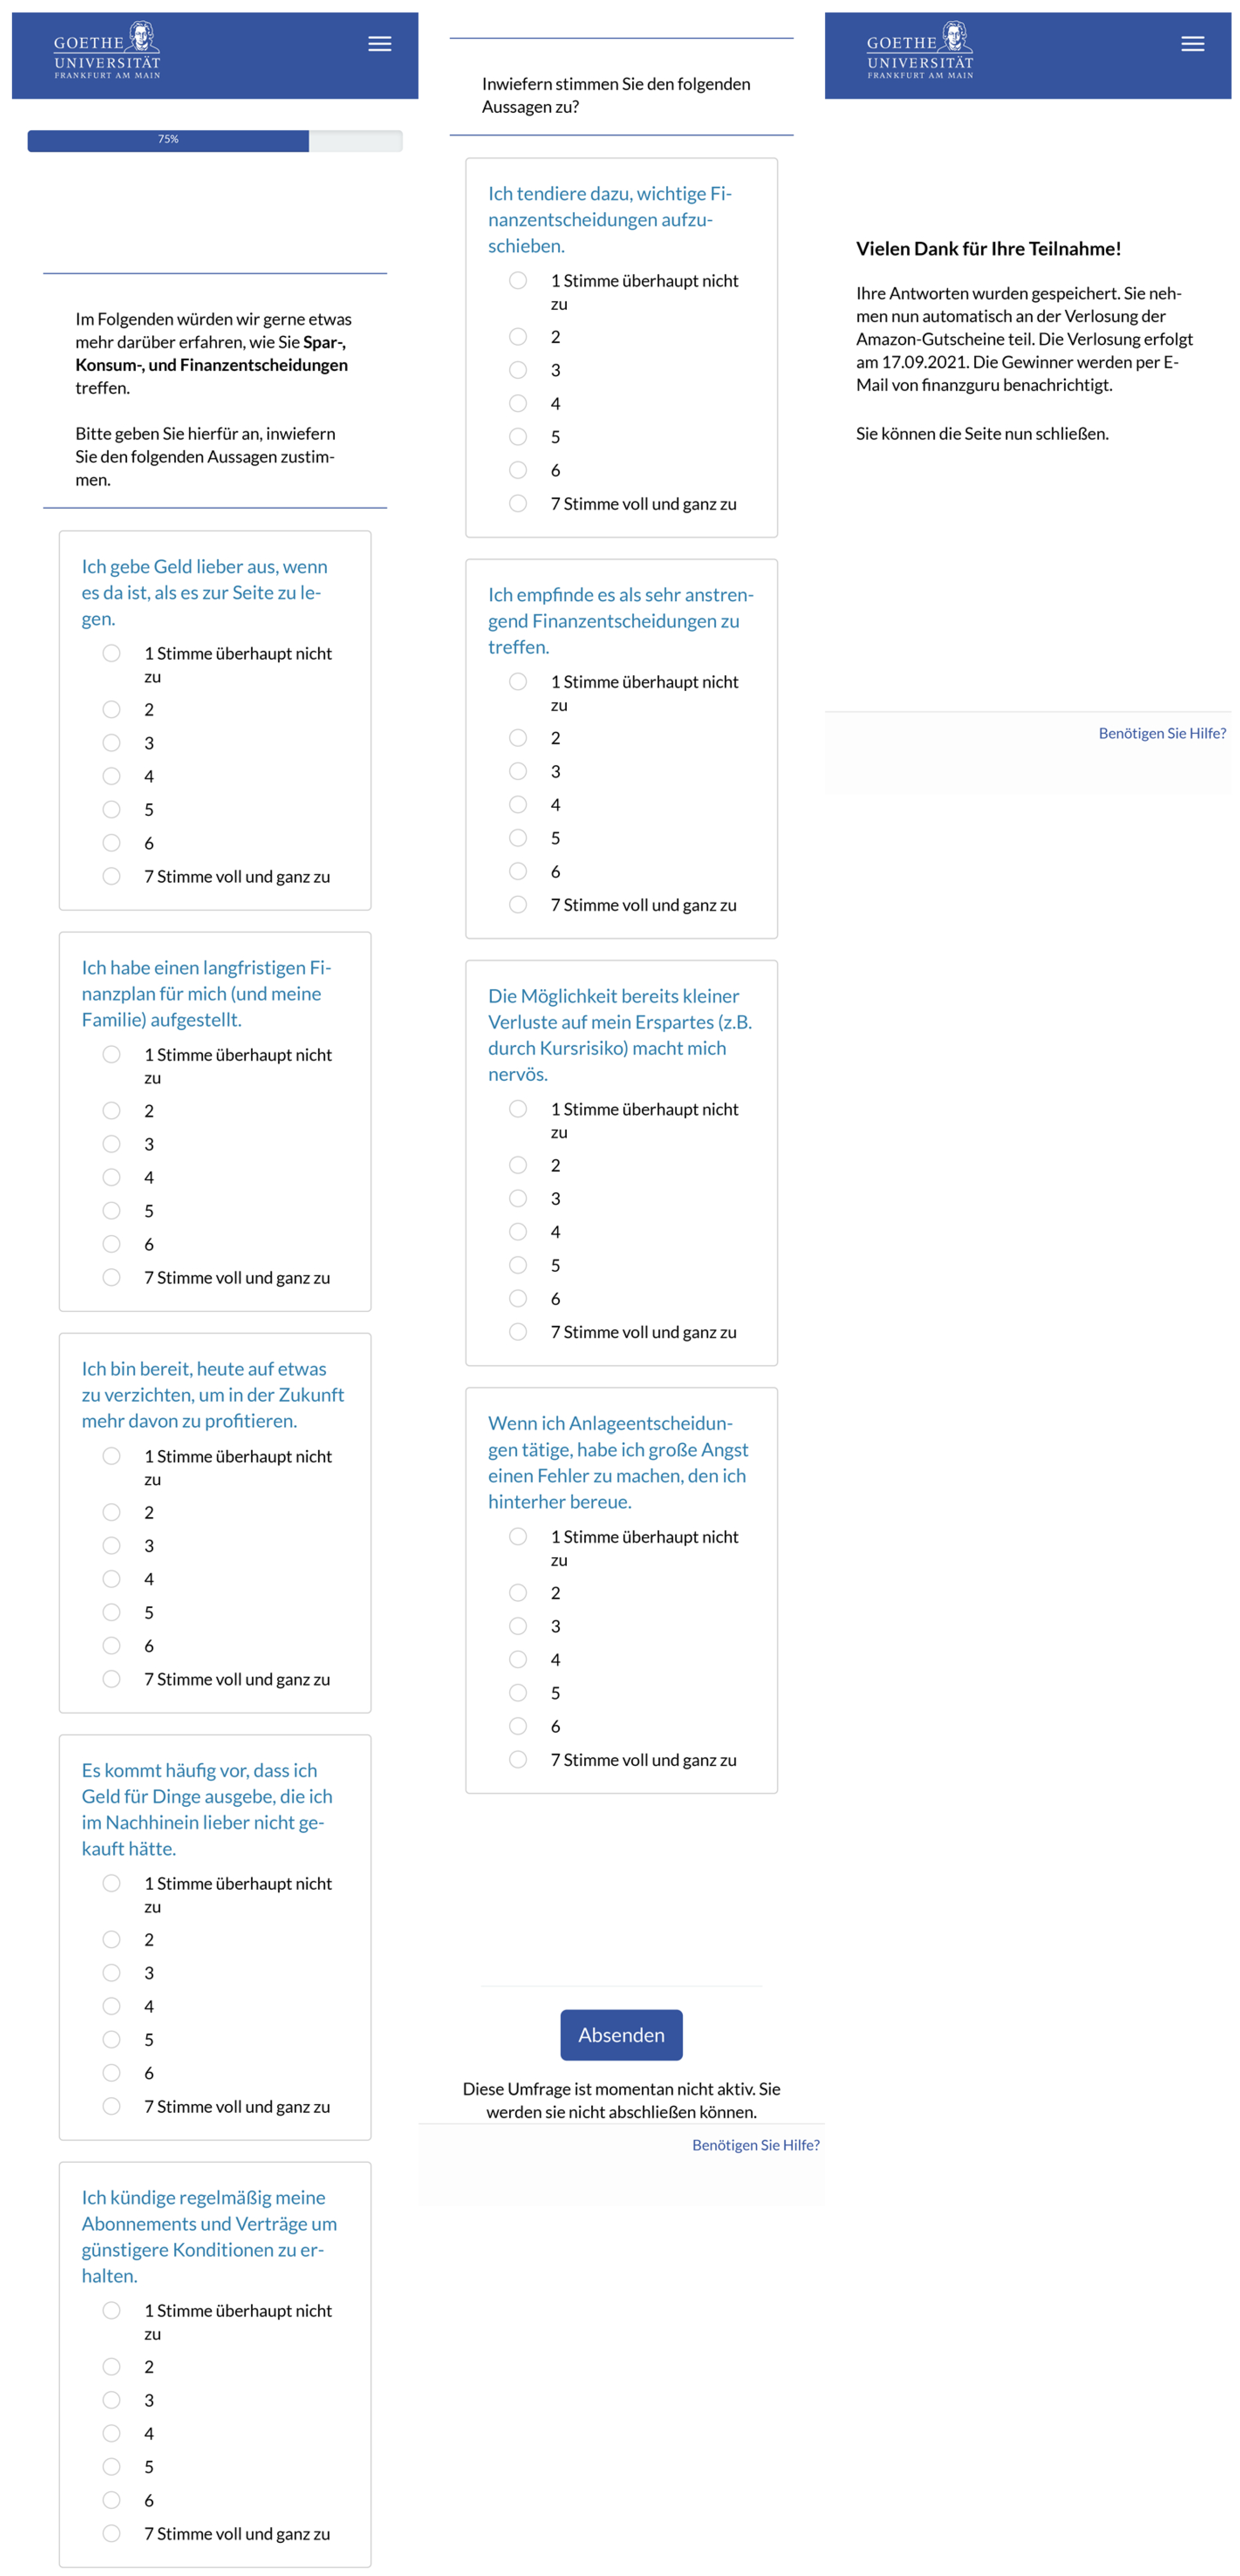
Appendix A. Survey


| Filter | Sample Size |
|---|---|
| - users who were activated to the survey | ca. 56,000 |
| - users who participated to the survey | 2163 |
| - users who completed survey * | 1761 |
| - users with available account transaction data (2018–2022) | 1533 |
| - users with available security account data | 689 |
| Overall Activated Customers | All Customers | Customers with Completed Questionnaires | ||||
|---|---|---|---|---|---|---|
| Number | Number | Response Rate | Number | Dropout Rate | Response Rate | |
| all | ca. 56,000 | 2163 | 3.86% | 1771 | 18.12% | 3.16% |
| survey test phase | ca. 5000 | 118 | 2.36% | 92 | 22.03% | 1.84% |
| established customers * | ca. 45,000 | 1684 | 3.74% | 997 | 40.80% | 2.22% |
| new customers * | ca. 6000 | 359 | 5.98% | 297 | 17.27% | 4.95% |


Appendix B


| N | Mean | sd | min | max | |
|---|---|---|---|---|---|
| Survey questions | |||||
| I prefer to spend money when it is there then put aside | 1531 | 3.182 | 1.563 | 1 | 7 |
| I have long-term financial plan for myself and my family | 1532 | 4.151 | 1.991 | 1 | 7 |
| I am willing to give up sth. today to profit more in future | 1532 | 3.031 | 1.520 | 1 | 7 |
| It happens often that I spend money on things and regret | 1532 | 4.414 | 1.717 | 1 | 7 |
| I regularly cancel subscrip. and contracts to get better conditions | 1532 | 4.474 | 2.004 | 1 | 7 |
| I tend to postpone important financial decisions | 1532 | 3.139 | 1.650 | 1 | 7 |
| I find it very stressful to make financial decisions | 1532 | 3.636 | 1.839 | 1 | 7 |
| The possibility of small losses on savings makes me nervous | 1531 | 3.273 | 1.813 | 1 | 7 |
| I am afraid of making mistakes that I regret afterwards | 1529 | 3.865 | 1.821 | 1 | 7 |
| Behavioral traits | |||||
| risk | 1532 | 3.891 | 1.552 | 1 | 7 |
| trust | 1532 | 3.946 | 1.377 | 1 | 7 |
| patience | 1532 | 3.107 | 1.317 | 1 | 7 |
| self-control | 1532 | 4.346 | 1.274 | 1 | 7 |
| procrastination | 1532 | 3.139 | 1.650 | 1 | 7 |
| effort | 1532 | 3.636 | 1.839 | 1 | 7 |
| loss-aversion | 1531 | 3.569 | 1.661 | 1 | 7 |
| Demographic information | |||||
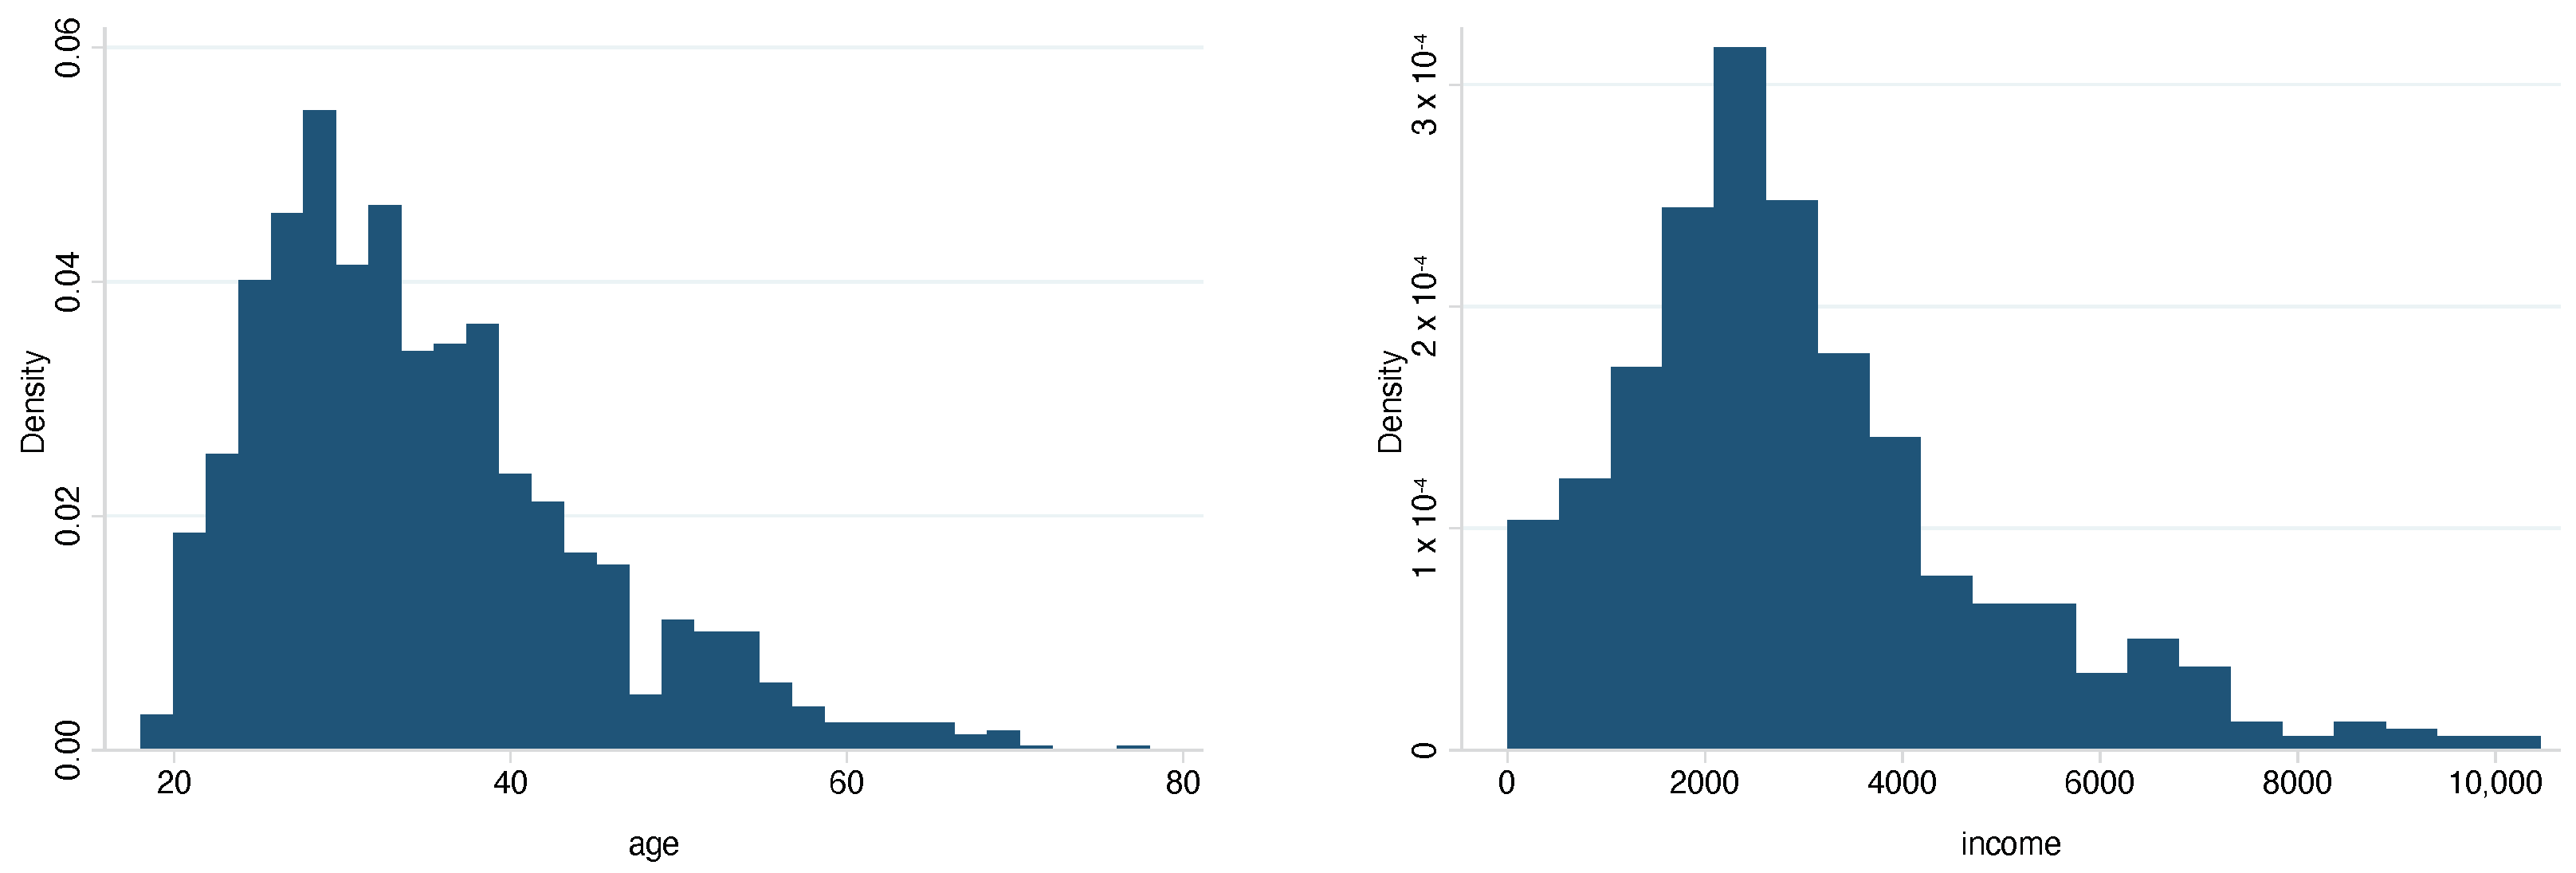
| age | 1533 | 34.73 | 9.936 | 18 | 78 |
| male | 1533 | 0.620 | 0.486 | 0 | 1 |
| married | 1533 | 0.596 | 0.491 | 0 | 1 |
| employed | 1533 | 0.217 | 0.412 | 0 | 1 |
| unemployed | 1533 | 0.472 | 0.499 | 0 | 1 |
| homeowner | 1533 | 0.045 | 0.207 | 0 | 1 |
| retired | 1533 | 0.295 | 0.456 | 0 | 1 |
| student | 1533 | 0.265 | 0.441 | 0 | 1 |
| self-employed | 1533 | 0.114 | 0.318 | 0 | 1 |
| N | Mean | sd | min | max | |
|---|---|---|---|---|---|
| male | 1312 | 0.610 | 0.488 | 0 | 1 |
| male (imputed) | 1533 | 0.620 | 0.486 | 0 | 1 |
| age | 1124 | 35.130 | 10.060 | 18 | 78 |
| age (imputed) | 1533 | 34.730 | 9.936 | 18 | 78 |
| employed | 972 | 0.188 | 0.391 | 0 | 1 |
| employed (imputed) | 1533 | 0.217 | 0.412 | 0 | 1 |
| unemployed | 972 | 0.466 | 0.499 | 0 | 1 |
| unemployed (imputed) | 1533 | 0.472 | 0.499 | 0 | 1 |
| married | 299 | 0.625 | 0.485 | 0 | 1 |
| married (imputed) | 1533 | 0.596 | 0.491 | 0 | 1 |
| Behavioral Trait | Survey Question | Original Survey Question in German | Skala | |
|---|---|---|---|---|
| 1 | risk | If you personally make savings or investment decisions, how would you describe your risk attitude? | Wenn Sie persönlich Spar- oder Anlageentscheidungen treffen: Wie würden Sie Ihre Risikoeinstellung beschreiben? | 1 (no risk) to 7 (high risk) |
| 2 | trust | What is your opinion on the following statement? In general, people can be trusted. | Wie ist Ihre Meinung zur folgenden Aussage? Im Allgemeinen kann man Menschen vertrauen. | 1 (no trust) to 7 (high trust) |
| 3 | patience | I would rather spend money when it is there than put it aside. | Ich gebe Geld lieber aus, wenn es da ist, als es zur Seite zu legen. | 1 (totally disagree) to 7 (absolutely agree) |
| 4 | patience | I am willing to give up something today in order to benefit more in the future. | Ich bin bereit, heute auf etwas zu verzichten, um in der Zukunft mehr davon zu profitieren. | 1 (totally disagree) to 7 (absolutely agree) |
| 5 | self-control bias | I have created a long-term financial plan for myself (and my family). | Ich habe einen langfristigen Finanzplan für mich (und meine Familie) aufgestellt. | 1 (totally disagree) to 7 (absolutely agree) |
| 6 | self-control bias | It often happens that I spend money on things that, in hindsight, I would have preferred not to have bought. | Es kommt häufig vor, dass ich Geld für Dinge ausgebe, die ich im Nachhinein lieber nicht gekauft hätte. | 1 (totally disagree) to 7 (absolutely agree) |
| 7 | self-control bias | I regularly cancel my subscriptions and contracts to get better conditions. | Ich kündige regelmäßig meine Abonnements und Verträge um günstigere Konditionen zu erhalten. | 1 (totally disagree) to 7 (absolutely agree) |
| 8 | procrastination | I tend to put off important financial decisions. | Ich tendiere dazu, wichtige Finanzentscheidungen aufzuschieben. | 1 (totally disagree) to 7 (absolutely agree) |
| 9 | effort | I find it very exhausting to make financial decisions. | Ich empfinde es als sehr anstrengend Finanzentscheidungen zu treffen. | 1 (totally disagree) to 7 (absolutely agree) |
| 10 | loss aversion | The possibility of even small losses on my savings makes me nervous. | Die Möglichkeit bereits kleiner Verluste auf mein Erspartes (z.B. durch Kursrisiko) macht mich nervös. | 1 (totally disagree) to 7 (absolutely agree) |
| 11 | loss aversion | When making financial decisions, I am afraid of making mistakes that I regret afterwards | Wenn ich Anlageentscheidungen tätige, habe ich große Angst einen Fehler zu machen, den ich hinterher bereue. | 1 (totally disagree) to 7 (absolutely agree) |
| N | Mean | sd | min | max | |
|---|---|---|---|---|---|
| Bank Account Information | |||||
| number of current accounts | 1455 | 2.29 | 1.88 | 0 | 27 |
| monthly total account transactions | 1533 | 52.89 | 28.89 | 0 | 241 |
| days in overdraft | 1455 | 178.50 | 370.10 | 0 | 4307 |
| number of insurance packages | 1533 | 5.25 | 4.38 | 0 | 21 |
| total debt | 1533 | −374.50 | 3976.00 | −112,602.00 | 0.00 |
| current account balance | 1453 | 3493.00 | 7773.00 | −8552.00 | 80,109.00 |
| Security Account Information | |||||
| has security accounts | 1533 | 0.45 | 0.50 | 0 | 1 |
| has crypto wallets | 1533 | 0.05 | 0.22 | 0 | 1 |
| number of depots | 1533 | 1.03 | 1.99 | 0 | 19 |
| number of crypto depots | 1533 | 0.20 | 1.26 | 0 | 17 |
| number of non-crypto depots | 1533 | 0.83 | 1.30 | 0 | 11 |
| total depot balance | 1533 | 13,566.00 | 87,839.00 | −19,950.00 | 2,788,000.00 |
| total crypto depot balance | 1533 | 174.80 | 4652.00 | 0.00 | 181,058.00 |
| total non-crypto depot balance | 1533 | 13,391.00 | 87,730.00 | −19,950.00 | 2,788,000.00 |
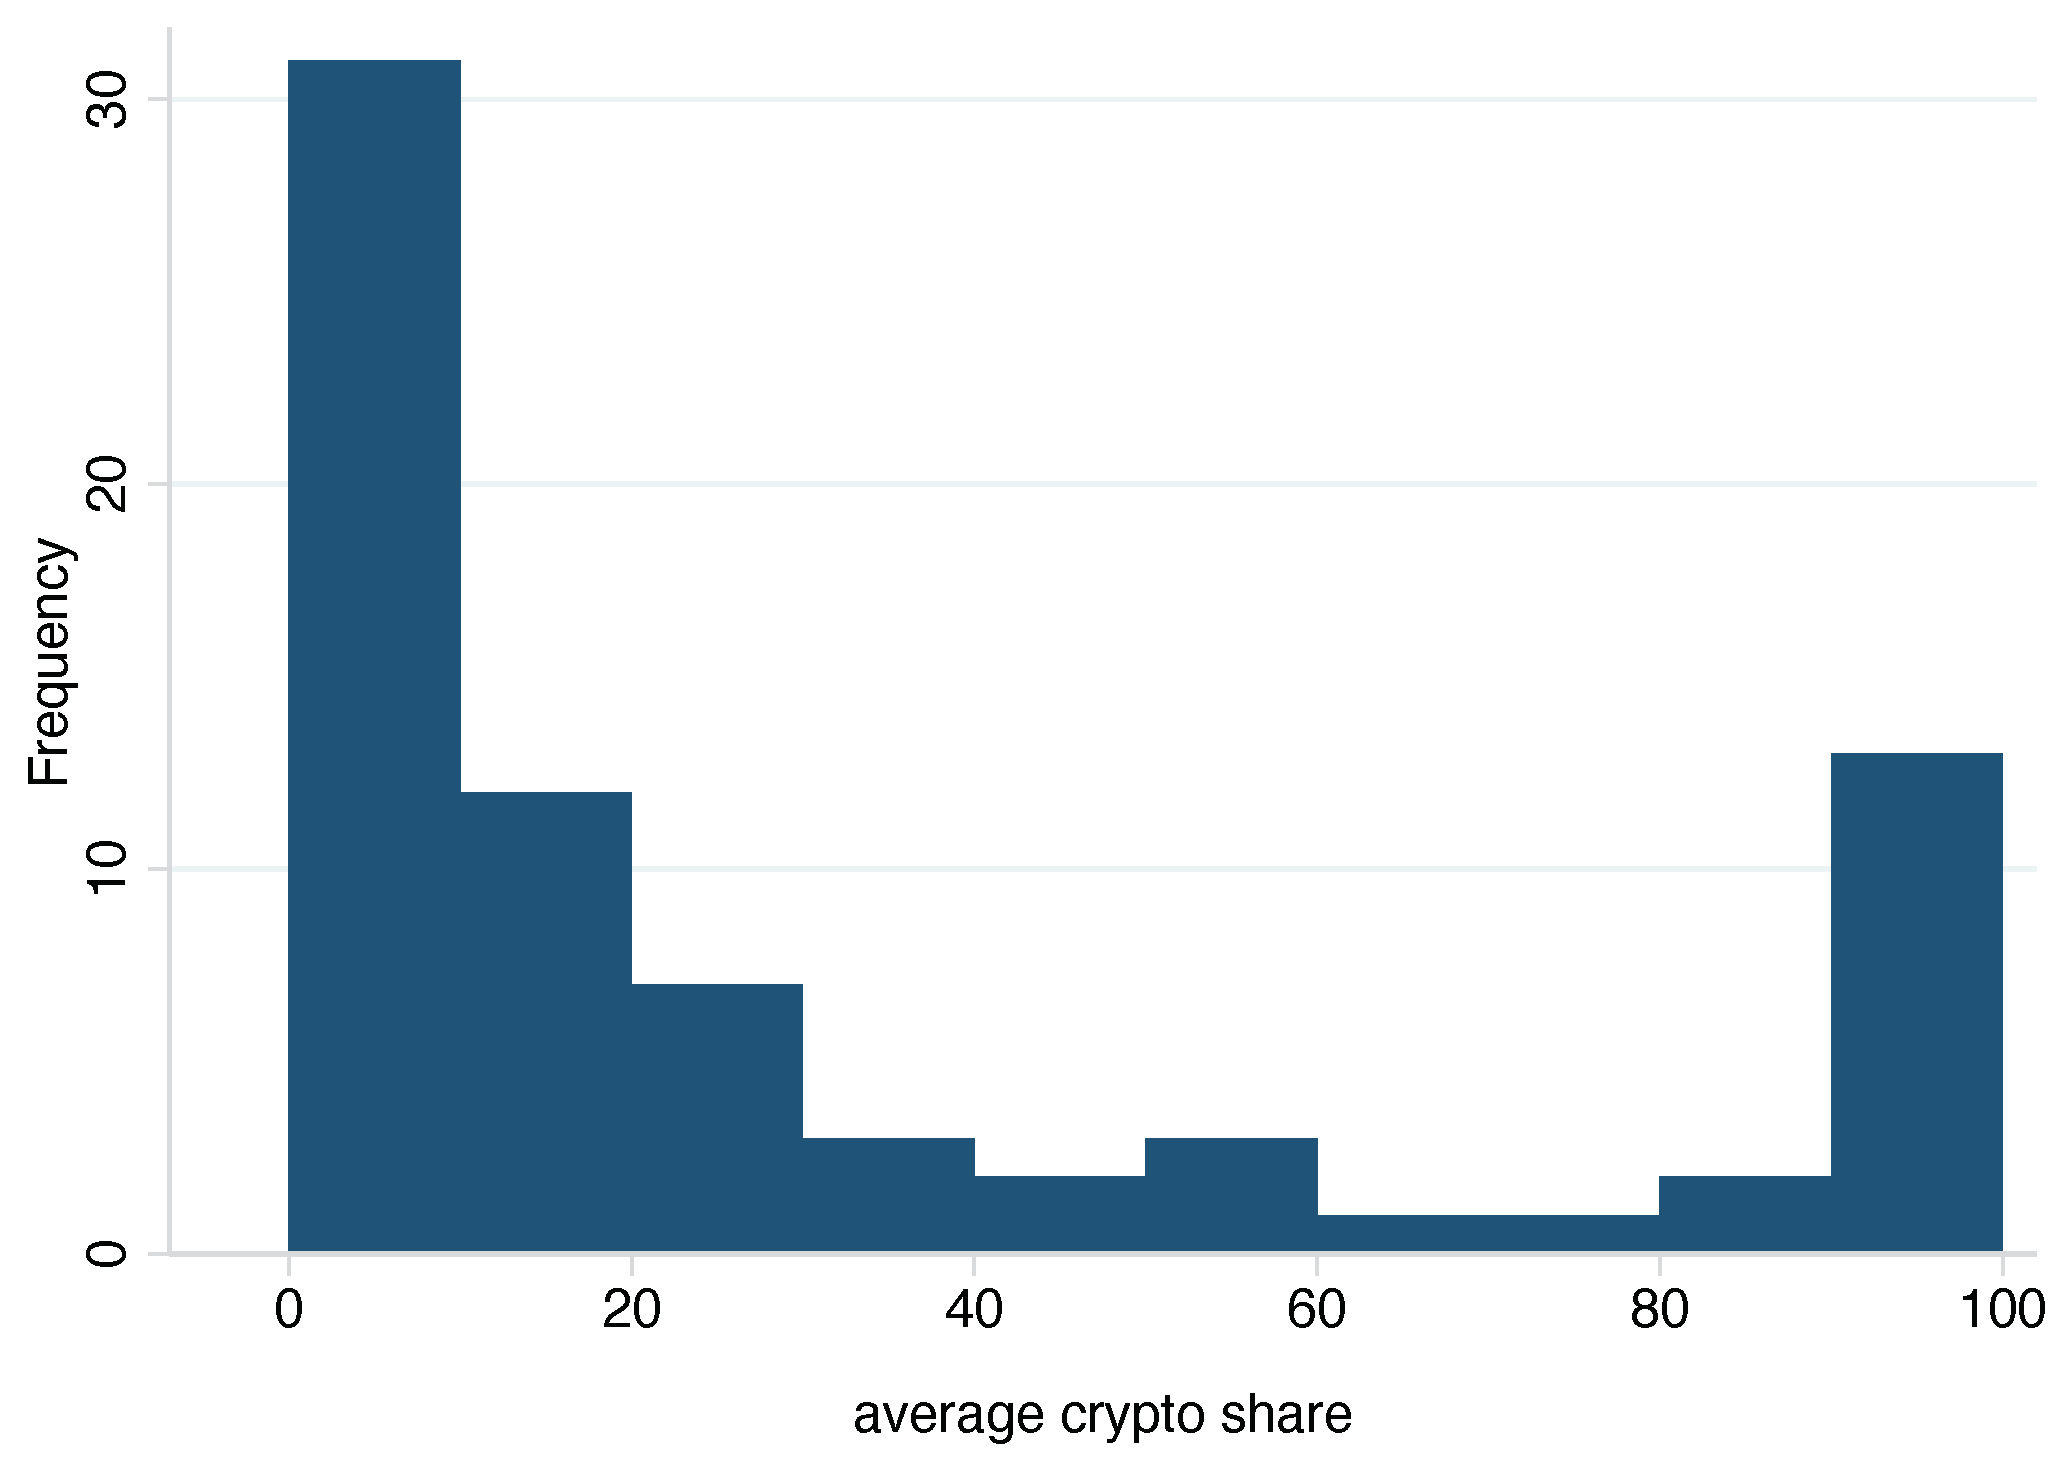
| share crypto assets | 1533 | 1.36 | 9.99 | 0.00 | 100.00 |
| Monthly Averages per Category | |||||
| income | 1533 | 2463.00 | 1727.00 | 0.00 | 10,457.00 |
| cash withdrawals | 1533 | 313.90 | 297.60 | 0.00 | 2780.00 |
| expenses for vocational training | 1533 | 49.90 | 86.61 | 0.00 | 326.70 |
| financial expenses | 1533 | 637.60 | 917.00 | 0.00 | 7792.00 |
| financial receipts | 1533 | 88.88 | 200.20 | 0.00 | 696.40 |
| leisure | 1533 | 88.75 | 72.64 | 0.00 | 609.40 |
| health | 1533 | 72.28 | 76.56 | 0.00 | 652.50 |
| pets | 1533 | 22.26 | 37.55 | 0.00 | 185.00 |
| children | 1533 | 61.94 | 123.50 | 0.00 | 694.00 |
| food | 1533 | 221.90 | 175.40 | 0.00 | 1013.00 |
| holiday | 1533 | 266.10 | 274.80 | 0.00 | 1544.00 |
| shopping | 1533 | 302.30 | 203.20 | 0.00 | 1373.00 |
| savings | 1533 | 398.90 | 665.00 | 0.00 | 4840.00 |
| refueling | 1533 | 81.70 | 57.55 | 0.00 | 341.60 |
| mobility | 1533 | 106.80 | 89.16 | 0.00 | 841.80 |
| insurance | 1533 | 224.50 | 262.40 | 0.00 | 1721.00 |
| living | 1533 | 606.20 | 473.20 | 0.00 | 3152.00 |
| other expenses | 1533 | 1778.00 | 2231.00 | 0.00 | 25,723.00 |
| other receipts | 1533 | 2352.00 | 2864.00 | 0.00 | 35,618.00 |
| (1) | (2) | (3) | (1)–(2) | (1)–(3) | (2)–(3) | |
|---|---|---|---|---|---|---|
| Crypto Investors | Conventional Investors | Non-Invested | Difference Crypto and Conventional Investors | Difference Crypto and Non-Invested | Difference Conventional and Non-Invested | |
| financial advice | ||||||
| ever asked for financial advice (0 no. 1 yes) | 0.43 | 0.53 | 0.45 | −0.10 * | −0.02 | 0.08 *** |
| satisfaction financial advise (1 not satisfied. 7 fully satisfied) | 4.69 | 4.39 | 4.80 | 0.29 | −0.11 | −0.41 *** |
| survey responses on investment decision-making | ||||||
| prefer to spend money when it is there then put aside | 2.71 | 2.87 | 3.45 | −0.16 | −0.74 *** | −0.58 *** |
| have long-term financial plan for myself and my family | 5.20 | 4.72 | 3.65 | 0.48 ** | 1.55 *** | 1.07 *** |
| am willing to give up sth. today to profit more in future | 2.47 | 2.89 | 3.19 | −0.42 ** | −0.72 *** | −0.3 *** |
| happens often that I spend money on things and regret | 4.65 | 4.65 | 4.22 | 0.00 | 0.43 ** | 0.43 *** |
| regularly cancel subscrip. and contracts to get better conditions | 4.60 | 4.66 | 4.33 | −0.06 | 0.27 | 0.34 *** |
| tend to postpone important financial decisions | 2.67 | 2.93 | 3.33 | −0.26 | −0.67 *** | −0.4 *** |
| find it very stressful to make financial decisions | 2.85 | 3.31 | 3.95 | −0.45 ** | −1.09 *** | −0.64 *** |
| possibility of small losses on savings makes me nervous | 2.43 | 2.74 | 3.73 | −0.32 * | −1.31 *** | −0.99 *** |
| am afraid of making mistakes that I regret afterwards | 3.16 | 3.39 | 4.28 | −0.23 | −1.12 *** | −0.89 *** |
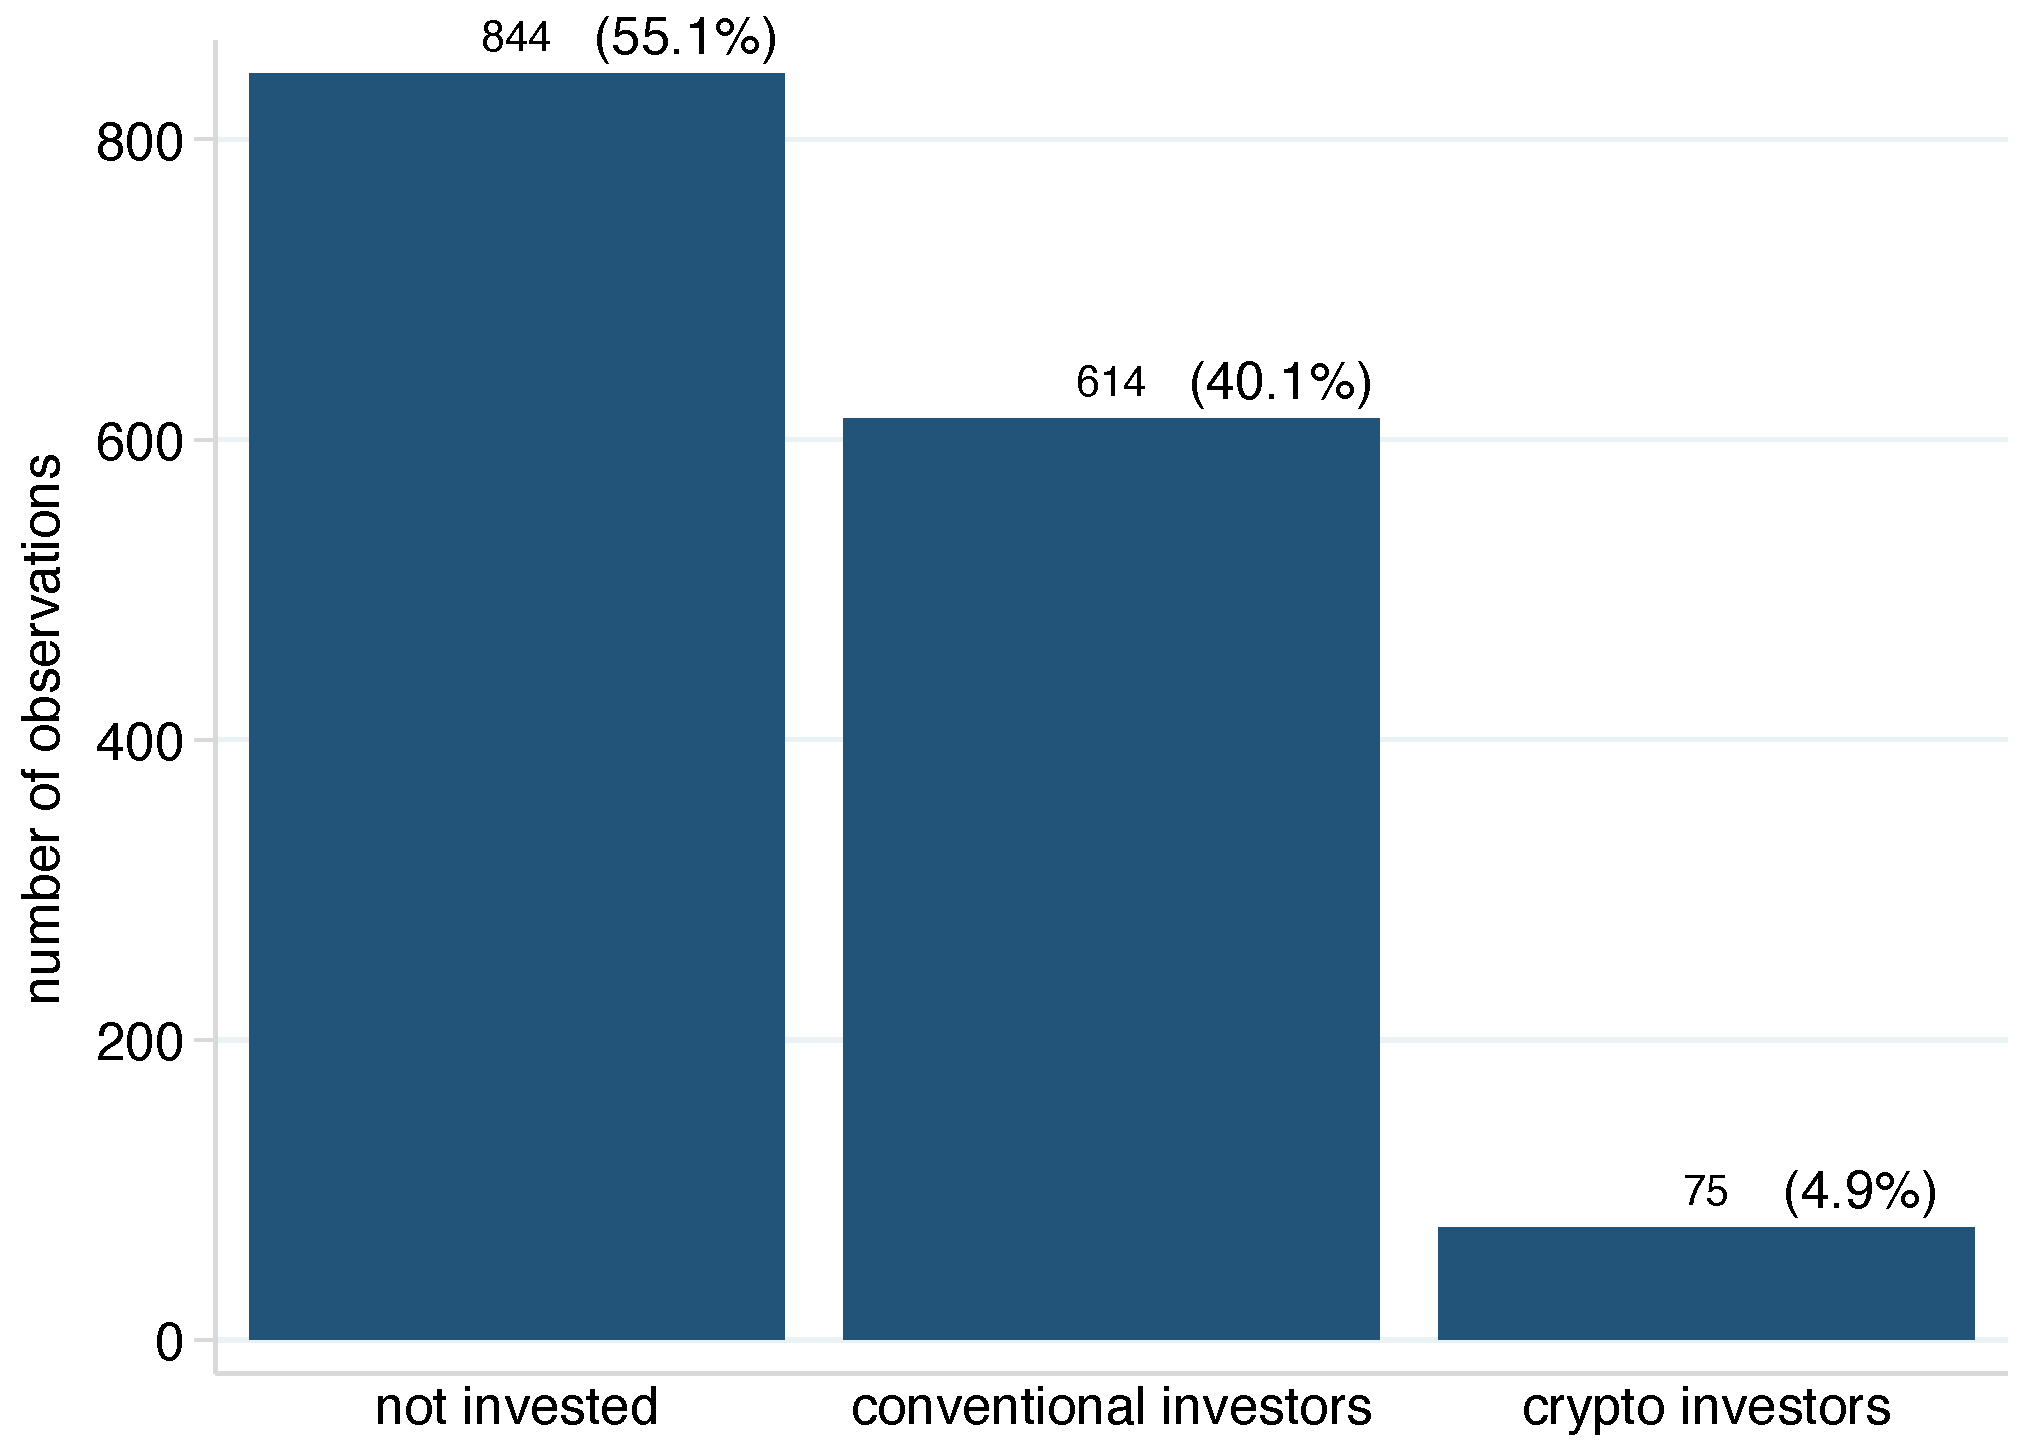
| n | 75 | 614 | 844 | |||
| received financial advice for following products | ||||||
| savings products | 0.13 | 0.33 | 0.45 | −0.2 ** | −0.32 *** | −0.12 *** |
| invesmtents | 0.69 | 0.67 | 0.49 | 0.01 | 0.19 ** | 0.18 *** |
| pension | 0.50 | 0.60 | 0.65 | −0.1 | −0.15 * | −0.05 |
| insurance | 0.66 | 0.61 | 0.61 | 0.04 | 0.05 | 0.00 |
| loans | 0.19 | 0.17 | 0.25 | 0.02 | −0.07 | −0.08 *** |
| real estate | 0.41 | 0.37 | 0.33 | 0.03 | 0.07 | 0.04 |
| n | 32 | 326 | 376 | |||
| reason no financial advice demanded | ||||||
| no money | 0.16 | 0.24 | 0.47 | −0.08 | −0.31 *** | −0.23 *** |
| too expensive | 0.23 | 0.23 | 0.26 | 0.00 | −0.03 | −0.03 |
| low quality | 0.30 | 0.18 | 0.10 | 0.12 * | 0.21 *** | 0.09 *** |
| time-consuming | 0.35 | 0.13 | 0.17 | 0.22 *** | 0.18 *** | −0.04 |
| no trust | 0.42 | 0.40 | 0.30 | 0.02 | 0.12 | 0.1 *** |
| enough financial literacy | 0.51 | 0.42 | 0.16 | 0.09 | 0.36 *** | 0.26 *** |
| rather advice of peers | 0.16 | 0.14 | 0.17 | 0.02 | −0.01 | −0.03 |
| n | 43 | 288 | 467 | |||
| Ever Asked for Financial Advice | |||||
|---|---|---|---|---|---|
| (1) | (2) | (3) | (4) | (5) | |
| Probit | Probit | Probit | Probit | Probit | |
| has crypto | −0.116 | −0.139 | −0.176 | −0.175 | −0.224 |
| (0.151) | (0.151) | (0.153) | (0.155) | (0.158) | |
| male | −0.0278 | −0.0342 | −0.0953 | −0.107 | |
| (0.0689) | (0.0692) | (0.0749) | (0.0753) | ||
| age | 0.0315 *** | 0.0310 *** | 0.0318 *** | 0.0313 *** | |
| (0.00362) | (0.00371) | (0.00384) | (0.00386) | ||
| married | 0.0317 | 0.0120 | −0.0782 | −0.0749 | |
| (0.0680) | (0.0683) | (0.0715) | (0.0716) | ||
| student | −0.0534 | −0.0479 | −0.0741 | −0.0799 | |
| (0.0782) | (0.0809) | (0.0824) | (0.0824) | ||
| retired | −0.0699 | −0.0522 | −0.0662 | −0.0560 | |
| (0.0723) | (0.0732) | (0.0741) | (0.0746) | ||
| self-employed | 0.147 | 0.194 | 0.166 | 0.152 | |
| (0.108) | (0.129) | (0.129) | (0.129) | ||
| homeowner | 0.130 | 0.106 | 0.0797 | 0.0595 | |
| (0.171) | (0.172) | (0.170) | (0.171) | ||
| log(income) | −0.00433 | −0.00601 | −0.00456 | ||
| (0.0224) | (0.0226) | (0.0226) | |||
| log(saving) | 0.0497 *** | 0.0447 *** | 0.0446 *** | ||
| (0.0127) | (0.0130) | (0.0130) | |||
| log(total debt) | 0.00624 | 0.00589 | 0.00756 | ||
| (0.0135) | (0.0135) | (0.0136) | |||
| risk | −0.0004 | 0.0673 * | 0.0547 | ||
| (0.0382) | (0.0402) | (0.0409) | |||
| trust | 0.0844 ** | 0.0820 ** | 0.0842 ** | ||
| (0.0328) | (0.0337) | (0.0337) | |||
| patience | 0.110 *** | 0.0740 * | 0.0792 ** | ||
| (0.0372) | (0.0388) | (0.0389) | |||
| self-control | 0.408 *** | 0.330 *** | 0.316 *** | ||
| (0.0745) | (0.0788) | (0.0793) | |||
| loss aversion | −0.0565 | −0.0733 | −0.0648 | ||
| (0.0515) | (0.0528) | (0.0530) | |||
| procrastination | −0.0822 ** | −0.0665 | −0.0678 | ||
| (0.0411) | (0.0424) | (0.0424) | |||
| effort | 0.161 *** | 0.193 *** | 0.192 *** | ||
| (0.0445) | (0.0464) | (0.0464) | |||
| log(total portfolio balance) | 0.0149 | ||||
| (0.00911) | |||||
| Constant | −1.131 *** | −1.204 *** | −0.0465 | −1.105 *** | −1.138 *** |
| (0.140) | (0.206) | (0.0332) | (0.212) | (0.214) | |
| Observations | 1532 | 1532 | 1532 | 1532 | 1532 |
| Pseudo R2 | 0.047 | 0.055 | 0.025 | 0.076 | 0.077 |
| Crypto Participation, Conditional on Being Invested | ||||||
|---|---|---|---|---|---|---|
| (1) | (2) | (3) | (4) | (5) | (6) | |
| Probit | Probit | Probit | Probit | Probit | Probit | |
| male | 0.366 ** | 0.358 ** | 0.277 | 0.372 ** | 0.293 * | |
| (0.168) | (0.168) | (0.173) | (0.171) | (0.175) | ||
| age | −0.00559 | −0.00374 | −0.00336 | −0.00286 | −0.00227 | |
| (0.00733) | (0.00733) | (0.00740) | (0.00732) | (0.00743) | ||
| married | 0.0253 | 0.0286 | 0.0350 | 0.0356 | 0.0449 | |
| (0.134) | (0.134) | (0.136) | (0.135) | (0.136) | ||
| student | 0.220 | 0.194 | 0.168 | 0.216 | 0.190 | |
| (0.146) | (0.155) | (0.156) | (0.156) | (0.157) | ||
| retired | −0.153 | −0.164 | −0.150 | −0.174 | −0.154 | |
| (0.159) | (0.162) | (0.160) | (0.160) | (0.159) | ||
| self-employed | 0.230 | 0.179 | 0.182 | 0.133 | 0.130 | |
| (0.169) | (0.229) | (0.228) | (0.227) | (0.224) | ||
| homeowner | −0.535 | −0.559 | −0.516 | −0.674 * | −0.627 * | |
| (0.352) | (0.358) | (0.359) | (0.345) | (0.349) | ||
| log(income) | −0.0234 | −0.0215 | −0.00837 | −0.00982 | ||
| (0.0379) | (0.0375) | (0.0403) | (0.0398) | |||
| log(saving) | 0.0407 | 0.0311 | 0.0397 | 0.0295 | ||
| (0.0262) | (0.0260) | (0.0264) | (0.0261) | |||
| log(debt) | −0.0401 | −0.0404 | −0.0453 | −0.0446 | ||
| (0.0305) | (0.0304) | (0.0323) | (0.0319) | |||
| risk | 0.186 ** | 0.135 | 0.141 | |||
| (0.0907) | (0.0904) | (0.0914) | ||||
| trust | 0.00402 | 0.0103 | 0.0141 | |||
| (0.0635) | (0.0647) | (0.0665) | ||||
| patience | −0.122 | −0.0847 | −0.100 | |||
| (0.0798) | (0.0809) | (0.0819) | ||||
| self-control | −0.0915 | −0.0496 | −0.0490 | |||
| (0.165) | (0.170) | (0.173) | ||||
| loss aversion | 0.0328 | 0.0567 | 0.0353 | |||
| (0.107) | (0.108) | (0.111) | ||||
| procrastination | −0.0129 | −0.0378 | −0.0457 | |||
| (0.0884) | (0.0920) | (0.0938) | ||||
| effort | −0.101 | −0.0890 | −0.0942 | |||
| (0.0867) | (0.0876) | (0.0878) | ||||
| log(food subscriptions) | 0.0864 ** | 0.108 ** | ||||
| (0.0414) | (0.0426) | |||||
| log(rent) | −0.0504 ** | −0.0500 ** | ||||
| (0.0240) | (0.0240) | |||||
| Constant | −1.415 *** | −1.361 *** | −1.362 *** | −1.393 *** | −1.373 *** | −1.431 *** |
| (0.320) | (0.417) | (0.0815) | (0.414) | (0.422) | (0.422) | |
| Observations | 689 | 689 | 689 | 689 | 689 | 689 |
| Pseudo R2 | 0.036 | 0.045 | 0.026 | 0.060 | 0.060 | 0.078 |
| Stock Market Participation | ||||||
|---|---|---|---|---|---|---|
| (1) | (2) | (3) | (4) | (5) | (6) | |
| Probit | Probit | Probit | Probit | Probit | Probit | |
| male | 0.640 *** | 0.637 *** | 0.340 *** | 0.568 *** | 0.322 *** | |
| (0.0705) | (0.0708) | (0.0782) | (0.0782) | (0.0852) | ||
| age | 0.00379 | 0.00736 ** | 0.0119 *** | 0.00964 ** | 0.0147 *** | |
| (0.00353) | (0.00367) | (0.00404) | (0.00389) | (0.00420) | ||
| retired | −0.293 *** | −0.321 *** | −0.368 *** | −0.323 *** | −0.364 *** | |
| (0.0739) | (0.0757) | (0.0789) | (0.0780) | (0.0807) | ||
| married | 0.0371 | 0.0421 | −0.0678 | 0.0679 | −0.0370 | |
| (0.0692) | (0.0698) | (0.0754) | (0.0717) | (0.0774) | ||
| student | 0.311 *** | 0.257 *** | 0.176 ** | 0.135 | 0.0731 | |
| (0.0793) | (0.0821) | (0.0850) | (0.0843) | (0.0870) | ||
| self-employed | 0.657 *** | 0.493 *** | 0.482 *** | 0.449 *** | 0.455 *** | |
| (0.111) | (0.130) | (0.135) | (0.133) | (0.137) | ||
| homeowner | 0.451 *** | 0.419 ** | 0.373 ** | 0.373 ** | 0.351 * | |
| (0.169) | (0.170) | (0.175) | (0.175) | (0.181) | ||
| log(income) | −0.0740 *** | −0.0849 *** | −0.0676 ** | −0.0818 ** | ||
| (0.0230) | (0.0256) | (0.0314) | (0.0346) | |||
| log(saving) | 0.0334 ** | 0.0189 | 0.0344 *** | 0.0208 | ||
| (0.0130) | (0.0135) | (0.0132) | (0.0137) | |||
| log(debt) | −0.0252 * | −0.0287 ** | −0.0308 ** | −0.0317 ** | ||
| (0.0138) | (0.0145) | (0.0144) | (0.0151) | |||
| risk | 0.319 *** | 0.311 *** | 0.306 *** | |||
| (0.0395) | (0.0421) | (0.0430) | ||||
| trust | 0.0129 | −0.00306 | −0.0316 | |||
| (0.0346) | (0.0357) | (0.0360) | ||||
| patience | −0.0827 ** | −0.0846 ** | −0.0910 ** | |||
| (0.0393) | (0.0408) | (0.0418) | ||||
| self-control | 0.365 *** | 0.354 *** | 0.305 *** | |||
| (0.0797) | (0.0840) | (0.0851) | ||||
| loss aversion | −0.224 *** | −0.180 *** | −0.166 *** | |||
| (0.0528) | (0.0550) | (0.0568) | ||||
| procrastination | 0.0329 | 0.0167 | 0.00395 | |||
| (0.0454) | (0.0471) | (0.0472) | ||||
| effort | 0.0290 | 0.0655 | 0.0640 | |||
| (0.0464) | (0.0489) | (0.0497) | ||||
| log(pet) | −0.0616 *** | −0.0504 ** | ||||
| (0.0209) | (0.0215) | |||||
| log(refueling) | −0.0748 ** | −0.0736 ** | ||||
| (0.0307) | (0.0316) | |||||
| log(train ticket) | 0.0632 *** | 0.0611 *** | ||||
| (0.0187) | (0.0193) | |||||
| log(drugstore) | −0.0736 ** | −0.0524 | ||||
| (0.0336) | (0.0352) | |||||
| log(interest) | −0.0737 ** | −0.0741 ** | ||||
| (0.0289) | (0.0301) | |||||
| log(taxi) | 0.0707 ** | 0.0565 * | ||||
| (0.0283) | (0.0300) | |||||
| log(credit card statement) | 0.0496 *** | 0.0343 ** | ||||
| (0.0138) | (0.0144) | |||||
| log(furniture) | 0.0411 * | 0.0513 ** | ||||
| (0.0213) | (0.0217) | |||||
| Constant | −0.776 *** | −0.369 * | −0.158 *** | −0.144 | −0.180 | −0.0644 |
| (0.139) | (0.207) | (0.0339) | (0.224) | (0.220) | (0.232) | |
| Observations | 1533 | 1533 | 1532 | 1532 | 1533 | 1532 |
| Pseudo R2 | 0.089 | 0.097 | 0.121 | 0.178 | 0.134 | 0.204 |
| log(Total Portfolio Balance) | ||||||
|---|---|---|---|---|---|---|
| (1) | (2) | (3) | (4) | (5) | (6) | |
| Probit | Probit | Probit | Probit | Probit | Probit | |
| has crypto | 0.832 *** | 0.813 *** | 0.544 ** | 0.579 ** | 0.773 *** | 0.551 ** |
| (0.276) | (0.277) | (0.275) | (0.273) | (0.269) | (0.270) | |
| male | 0.791 *** | 0.818 *** | 0.403 | 0.580 * | 0.225 | |
| (0.297) | (0.295) | (0.291) | (0.298) | (0.294) | ||
| age | 0.0281 ** | 0.0283 * | 0.0322 ** | 0.0295 ** | 0.0347 ** | |
| (0.0139) | (0.0144) | (0.0142) | (0.0145) | (0.0144) | ||
| married | −0.186 | −0.163 | −0.190 | −0.0572 | −0.106 | |
| (0.251) | (0.250) | (0.250) | (0.247) | (0.249) | ||
| student | 0.140 | 0.219 | 0.0769 | 0.0881 | −0.0339 | |
| (0.313) | (0.318) | (0.307) | (0.316) | (0.305) | ||
| retired | 0.104 | 0.0964 | 0.0859 | 0.0936 | 0.0710 | |
| (0.310) | (0.315) | (0.310) | (0.310) | (0.306) | ||
| self-employed | −0.101 | 0.208 | 0.253 | 0.133 | 0.191 | |
| (0.361) | (0.478) | (0.454) | (0.460) | (0.436) | ||
| homeowner | 0.530 | 0.670 | 0.726 | 0.485 | 0.571 | |
| (0.498) | (0.500) | (0.491) | (0.497) | (0.486) | ||
| log(income) | 0.103 | 0.0956 | 0.217 *** | 0.200 *** | ||
| (0.0748) | (0.0718) | (0.0791) | (0.0767) | |||
| log(saving) | −0.0405 | −0.0633 | −0.0391 | −0.0611 | ||
| (0.0489) | (0.0470) | (0.0483) | (0.0465) | |||
| log(debt) | −0.114 ** | −0.111 ** | −0.0921 * | −0.0908 * | ||
| (0.0567) | (0.0555) | (0.0554) | (0.0542) | |||
| risk | 0.313 * | 0.378 ** | 0.389 ** | |||
| (0.161) | (0.163) | (0.166) | ||||
| trust | −0.206 | −0.223 * | −0.253 ** | |||
| (0.127) | (0.127) | (0.124) | ||||
| patience | −0.376 ** | −0.388 ** | −0.363 ** | |||
| (0.154) | (0.156) | (0.153) | ||||
| self-control | 0.517 * | 0.456 | 0.437 | |||
| (0.307) | (0.315) | (0.308) | ||||
| loss aversion | −0.422 * | −0.425 * | −0.402 * | |||
| (0.233) | (0.233) | (0.230) | ||||
| procrastination | −0.00348 | 0.0215 | 0.0399 | |||
| (0.166) | (0.167) | (0.166) | ||||
| effort | −0.120 | −0.0771 | −0.0486 | |||
| (0.182) | (0.180) | (0.180) | ||||
| log(pet) | −0.249 *** | −0.234 *** | ||||
| (0.0849) | (0.0827) | |||||
| log(health insurance) | 0.145 ** | 0.122 ** | ||||
| (0.0626) | (0.0615) | |||||
| log(interest) | −0.201 ** | −0.197 ** | ||||
| (0.0968) | (0.0943) | |||||
| log(drugstore) | −0.274 *** | −0.230 ** | ||||
| (0.103) | (0.101) | |||||
| Constant | 5.716 *** | 5.118 *** | 6.897 *** | 5.072 *** | 5.505 *** | 5.360 *** |
| (0.539) | (0.685) | (0.151) | (0.646) | (0.688) | (0.659) | |
| Observations | 689 | 689 | 689 | 689 | 689 | 689 |
| R-squared | 0.028 | 0.038 | 0.084 | 0.110 | 0.074 | 0.139 |
| mainCategory | subCategory | mainCategory | subCategory |
|---|---|---|---|
| BARENTNAHMEN | GELDAUTOMAT | SONSTIGE_AUSGABEN | SONSTIGE_AUSGABEN |
| BILDUNG_BERUF | GEWERKSCHAFTEN | SONSTIGE_EINNAHMEN | BARGELDEINZAHLUNG |
| BILDUNG_BERUF | HOCHSCHULE | SONSTIGE_EINNAHMEN | ERSTATTUNGEN |
| BILDUNG_BERUF | SONSTIGE_AUSGABEN_BILDUNG_BERUF | SONSTIGE_EINNAHMEN | KAUTION_GUTSCHRIFT |
| BILDUNG_BERUF | STUDIENGEBUEHREN | SONSTIGE_EINNAHMEN | KREDITAUSZAHLUNG |
| DROGERIE | DROGERIE | SONSTIGE_EINNAHMEN | RUECKLASTSCHRIFT |
| EINKOMMEN | BEIHILFE | SONSTIGE_EINNAHMEN | SONSTIGE_EINNAHMEN |
| EINKOMMEN | ELTERNGELD | SONSTIGE_EINNAHMEN | UNTERHALT_GUTSCHRIFT |
| EINKOMMEN | KAPITALERTRAEGE | SONSTIGE_EINNAHMEN | VERKAUFSERLOES |
| EINKOMMEN | KINDERGELD | SPAREN_VORSORGE | ALTERSVORSORGE |
| EINKOMMEN | LEISTUNGEN_DER_BUNDESAGENTUR_FUER_ARBEIT | SPAREN_VORSORGE | AUFRUNDEN |
| EINKOMMEN | LOHN_GEHALT | SPAREN_VORSORGE | BAUSPARVERTRAG |
| EINKOMMEN | MIETEINNAHMEN | SPAREN_VORSORGE | KAPITALANLAGE |
| EINKOMMEN | RENTE_PENSION | SPAREN_VORSORGE | SPAREN |
| EINKOMMEN | SELBSTSTAENDIGKEIT | TANKEN | TANKEN |
| EINKOMMEN | SONSTIGES_EINKOMMEN | VERKEHR_MOBILITAET | AUTOMOBILCLUB |
| EINKOMMEN | STUDIENGELD | VERKEHR_MOBILITAET | AUTOVERMIETUNG |
| EINKOMMEN | TASCHENGELD_GUTSCHRIFT | VERKEHR_MOBILITAET | BAHNCARD |
| ESSEN_TRINKEN | KANTINE | VERKEHR_MOBILITAET | BAHNTICKETS |
| ESSEN_TRINKEN | LIEFERSERVICE | VERKEHR_MOBILITAET | FAHRRAD |
| ESSEN_TRINKEN | RESTAURANT | VERKEHR_MOBILITAET | FERNBUS |
| ESSEN_TRINKEN | SONSTIGE_ESSEN_TRINKEN | VERKEHR_MOBILITAET | KFZ_STEUER |
| FINANZEN | BAUFINANZIERUNG | VERKEHR_MOBILITAET | OEPNV |
| FINANZEN | HYPOTHEK | VERKEHR_MOBILITAET | PARKEN |
| FINANZEN | INKASSO | VERKEHR_MOBILITAET | SHARING_ANGEBOTE |
| FINANZEN | KREDIT | VERKEHR_MOBILITAET | SONSTIGE_VERKEHRSAUSGABEN |
| FINANZEN | KREDITKARTENABRECHNUNG | VERKEHR_MOBILITAET | TAXI |
| FINANZEN | LEASING | VERKEHR_MOBILITAET | WERKSTATT_SERVICE |
| FINANZEN | SONDERTILGUNG | VERSICHERUNGEN | BERUFSUNFAEHIGKEITSVERSICHERUNG |
| FINANZEN | SONSTIGE_FINANZAUSGABEN | VERSICHERUNGEN | BRILLENVERSICHERUNG |
| FINANZEN | SPENDE | VERSICHERUNGEN | GEBAEUDEVERSICHERUNG |
| FINANZEN | STEUERN_ABGABEN | VERSICHERUNGEN | GERAETEVERSICHERUNG |
| FINANZEN | ZINSEN_ENTGELTE | VERSICHERUNGEN | GESETZLICHE_KRANKENVERSICHERUNG |
| FREIZEIT_UNTERHALTUNG | BUECHER_MEDIEN | VERSICHERUNGEN | HAFTPFLICHTVERSICHERUNG |
| FREIZEIT_UNTERHALTUNG | FITNESSSTUDIO | VERSICHERUNGEN | HAUSRATVERSICHERUNG |
| FREIZEIT_UNTERHALTUNG | FRISEUR | VERSICHERUNGEN | HAUSTIERVERSICHERUNG |
| FREIZEIT_UNTERHALTUNG | KINO | VERSICHERUNGEN | KFZ_VERSICHERUNG |
| FREIZEIT_UNTERHALTUNG | LOTTERIE | VERSICHERUNGEN | KRANKENVERSICHERUNG |
| FREIZEIT_UNTERHALTUNG | SONSTIGE_FREIZEITAUSGABEN | VERSICHERUNGEN | KRANKENZUSATZVERSICHERUNG |
| FREIZEIT_UNTERHALTUNG | SPORT | VERSICHERUNGEN | LEBENSVERSICHERUNG |
| FREIZEIT_UNTERHALTUNG | STREAMING_PAYTV | VERSICHERUNGEN | PFLEGEVERSICHERUNG |
| FREIZEIT_UNTERHALTUNG | TICKETS | VERSICHERUNGEN | RECHTSSCHUTZVERSICHERUNG |
| FREIZEIT_UNTERHALTUNG | VEREIN_SONSTIGE | VERSICHERUNGEN | REISEKRANKENVERSICHERUNG |
| FREIZEIT_UNTERHALTUNG | VEREIN_SPORT | VERSICHERUNGEN | RENTENVERSICHERUNG |
| FREIZEIT_UNTERHALTUNG | VERLAG_ZEITUNG | VERSICHERUNGEN | RISIKO_LEBENSVERSICHERUNG |
| FREIZEIT_UNTERHALTUNG | VIRTUELLE_GUETER | VERSICHERUNGEN | SONSTIGE_SACHVERSICHERUNG |
| GESUNDHEIT | APOTHEKE | VERSICHERUNGEN | SONSTIGE_VERSICHERUNGEN |
| GESUNDHEIT | ARZT | VERSICHERUNGEN | UNFALLVERSICHERUNG |
| GESUNDHEIT | AUGENOPTIK | VERSICHERUNGEN | ZAHNZUSATZVERSICHERUNG |
| GESUNDHEIT | SONSTIGE_GESUNDHEITSAUSGABEN | WOHNEN_HAUSHALT | ABFALLBESEITIGUNG |
| HAUSTIERE | SONSTIGE_TIERAUSGABEN | WOHNEN_HAUSHALT | BAUMARKT |
| HAUSTIERE | TIERARZT | WOHNEN_HAUSHALT | DOMAIN_HOSTING |
| HAUSTIERE | TIERBEDARF | WOHNEN_HAUSHALT | EINRICHTUNG |
| KINDER | KINDERGARTEN | WOHNEN_HAUSHALT | GAS |
| KINDER | SCHULE | WOHNEN_HAUSHALT | GRUNDBESITZABGABEN |
| KINDER | SONSTIGE_KINDERAUSGABEN | WOHNEN_HAUSHALT | HANDWERKSLEISTUNGEN |
| KINDER | SPIELSACHEN | WOHNEN_HAUSHALT | HAUSGELD |
| KINDER | TASCHENGELD | WOHNEN_HAUSHALT | INTERNET_TELEFON |
| KINDER | UNTERHALT | WOHNEN_HAUSHALT | KAUTION |
| LEBENSMITTEL | GETRAENKEHANDEL | WOHNEN_HAUSHALT | MIETE |
| LEBENSMITTEL | LEBENSMITTEL_ABO | WOHNEN_HAUSHALT | MOBILFUNK |
| LEBENSMITTEL | SONSTIGE_LEBENSMITTELAUSGABEN | WOHNEN_HAUSHALT | OEL |
| LEBENSMITTEL | SUPERMARKT | WOHNEN_HAUSHALT | RUNDFUNKGEBUEHREN |
| REISEN_URLAUB | AUSLANDSEINSATZENTGELT | WOHNEN_HAUSHALT | SONSTIGE_HAUSHALTSAUSGABEN |
| REISEN_URLAUB | FLUEGE | WOHNEN_HAUSHALT | STROM |
| REISEN_URLAUB | HOTEL_URLAUBSWOHNUNG | WOHNEN_HAUSHALT | WASSER |
| REISEN_URLAUB | SONSTIGE_URLAUBSAUSGABEN | ||
| SHOPPING | BEKLEIDUNGSHANDEL | ||
| SHOPPING | BLUMENHANDEL | ||
| SHOPPING | ELEKTROHANDEL | ||
| SHOPPING | KAUFHAUS_GEMISCHT | ||
| SHOPPING | PRIME_MITGLIEDSCHAFT | ||
| SHOPPING | SONSTIGE_SHOPPING | ||
| SHOPPING | VERSANDHANDEL |
| Name | Crypto Wallet | Conventional Security Account | Total |
|---|---|---|---|
| coinbase | 152 | 0 | 152 |
| Deutsche Kreditbank | 0 | 125 | 125 |
| Trade Republic | 0 | 123 | 123 |
| ING | 0 | 113 | 113 |
| Comdirect | 0 | 91 | 91 |
| Sparkasse | 0 | 85 | 85 |
| (unknown) | 26 | 81 | 107 |
| Deutsche Bank | 0 | 73 | 73 |
| Baader Bank | 0 | 69 | 69 |
| Consorsbank | 0 | 57 | 57 |
| European Bank for Financial Services | 0 | 25 | 25 |
| Commerzbank | 0 | 23 | 23 |
| Union Investment | 0 | 21 | 21 |
| MLP Banking | 0 | 13 | 13 |
| flatex Bank | 0 | 13 | 13 |
| DWS | 0 | 11 | 11 |
| Volksbank | 0 | 11 | 11 |
| SSK | 0 | 9 | 9 |
| apoBank | 0 | 8 | 8 |
| bitpanda | 27 | 8 | 35 |
| FIL Fondsbank | 0 | 7 | 7 |
| binance | 5 | 0 | 5 |
| DekaBank | 0 | 5 | 5 |
| VR Bank | 0 | 5 | 5 |
| Raiffeisenbank | 0 | 4 | 4 |
| kraken | 3 | 0 | 3 |
| 1822direkt | 0 | 3 | 3 |
| Hypovereinsbank | 0 | 3 | 3 |
| DZ BANK | 0 | 2 | 2 |
| Degussa | 0 | 2 | 2 |
| LSK Oldenburg | 0 | 2 | 2 |
| Postbank | 0 | 2 | 2 |
| GENO Broker | 0 | 1 | 1 |
| LBBW | 0 | 1 | 1 |
| Oldenburgische Landesbank AG | 0 | 1 | 1 |
| VR-Bank Main-Rhön | 0 | 1 | 1 |
| netbank | 0 | 1 | 1 |
| Total | 213 | 999 | 1212 |
| # | Name | Exchange Score | Volume (24 h) | Avg. Liquidity | Weekly Visits | # Markets | # Coins |
|---|---|---|---|---|---|---|---|
| 1 | Binance | 9.9 | $11,797,432,757 24.44% | 894 | 17,867,235 | 1702 | 387 |
| 2 | Coinbase Exchange | 8.2 | $1,724,983,926 43.38% | 748 | 1,654,519 | 585 | 214 |
| 3 | FTX | 8.1 | $1,487,619,359 32.39% | 722 | 3,327,062 | 423 | 286 |
| 4 | Kraken | 7.5 | $415,574,757 72.56% | 717 | 1,205,310 | 619 | 205 |
| 5 | Binance.US | 7.2 | $276,049,818 0.67% | 679 | 459,341 | 286 | 131 |
| 6 | KuCoin | 7.2 | $662,624,108 29.92% | 562 | 2,296,501 | 1356 | 731 |
| 7 | Gate.io | 7.0 | $638,662,090 21.36% | 530 | 1,883,413 | 2455 | 1477 |
| 8 | Bitfinex | 7.0 | $229,170,831 2.55% | 628 | 638,900 | 378 | 171 |
| 9 | Huobi Global | 6.8 | $558,086,311 20.52% | 508 | 784,470 | 1094 | 593 |
| 10 | Bitstamp | 6.6 | $119,897,123 120.54% | 577 | 372,366 | 157 | 66 |
| 1 | We control for different socio-demographic factors such as gender, age, or employment status. |
| 2 | The company selected customers who are actively using the app, i.e., logging in to the app regularly. We further identified active users who have all main account flows available such as income, consumption, etc. |
| 3 | For a detailed overview of the participation rates and the number of cases, refer to Table A2 in the Appendix A. |
| 4 | The descriptive statistics of imputed and non-imputed variables are listed in Table A4 in the Appendix B. |
| 5 | For a detailed list of all transaction labels, refer to Table A12. Also, the descriptive statistics of the data sources are displayed in Table A3 and Table A6 in the Appendix B. |
| 6 | For more details, see Table A13. Note that one user can have multiple security accounts and crypto wallets so that the total number of all accounts and wallets is higher than the sample. Notably, almost all crypto users in our sample also hold conventional assets. Comparing our observed crypto wallets with the largest crypto providers shown in Table A14, we see that our data exhibits good coverage. |
| 7 | On average, we observe 6.4 security accounts that divide into an average of 4.1 crypto wallets and 2.3 conventional security accounts. |
| 8 | This number is quite similar to the average crypto wallet size of EUR 3819 Hackethal et al. (2021) find in their German online bank data. |
| 9 | Note that some of these studies rather refer to anxiety or to stress which is related to effort. |
| 10 | In the case of Hackethal et al. (2021), we explain this by the fact that the underlying sample of their study contains older and high-income investors that are attracted by the bank their data is based on. Also, the mean income observed in our sample is close to that of the German population, which was about EUR 2165 in 2021 (Statistisches Bundesamt (Destatis) 2022). |
| 11 | |
| 12 | See note 1 above. |
References
- Aksoy, Hakan, and Ismail Saglam. 2006. Patience extracts sugar from a lemon: Buy and hold with a classifier system in the istanbul stock exchange. Emerging Markets Finance & Trade 42: 50–61. [Google Scholar]
- Barboza, Gustavo. 2018. I will pay tomorrow, or maybe the day after. credit card repayment, present biased and procrastination. Economic Notes 47: 455–94. [Google Scholar] [CrossRef]
- Benetton, Matteo, Giovanni Compiani, Nick Barberis, Nicolae Garleanu, Amir Kermani, Jiasun Li, Ye Li, and Yukun Liu. 2021. Investors’ Beliefs and Cryptocurrency Prices. Working Paper 2020-107. Chicago, IL, USA: Becker Friedman Institute for Economics, University of Chicago. [Google Scholar]
- Bernaola, Daniel M. V., Gizelle D. Willows, and Darron West. 2021. The relevance of anger, anxiety, gender and race in investment decisions. Mind and Society 20: 1–21. [Google Scholar] [CrossRef]
- Blandin, Apolline, Gina Pieters, Yue Wu, Thomas Eisermann, Anton Dek, Sean Taylor, and Damaris Njoki. 2020. 3rd Global Cryptoasset Benchmarking Study. Working Paper. Cambridge, UK: Judge Business School, Cambridge Centre for Alternative Finance. [Google Scholar] [CrossRef]
- Bonaparte, Yosef. 2021. On the Portfolio Choice of Crypto Asset Class: Why the Millennials Own Crypto? Working Paper. Denver, CO, USA: Department of Finance, University of Colorado at Denver. [Google Scholar]
- Bonaparte, Yosef. 2022. Time horizon and cryptocurrency ownership: Is crypto not speculative? Journal of International Financial Markets, Institutions and Money 79: 101609. [Google Scholar] [CrossRef]
- Bouri, Elie, Peter Molnár, Georges Azzi, David Roubaud, and Lars Ivar Hagfors. 2017. On the hedge and safe haven properties of bitcoin: Is it really more than a diversifier? Finance Research Letters 20: 192–98. [Google Scholar] [CrossRef]
- Brandt, Matthias. 2019. So Verbreitet Sind Kryptowährungen. Statista. Available online: https://de.statista.com/infografik/18102/nutzung-von-kryptowaehrungen/ (accessed on 25 August 2022).
- Breuer, Wolfgang, Thomas Renerken, and Astrid Juliane Salzmann. 2022. Measuring risk-taking and patience in financial decision making. Review of Financial Economics 40: 97–114. [Google Scholar] [CrossRef]
- Brière, Marie, Kim Oosterlinck, and Ariane Szafarz. 2015. Virtual currency, tangible return: Portfolio diversification with bitcoin. Journal of Asset Management 16: 365–73. [Google Scholar] [CrossRef]
- Böyükaslan, Adem, and Fatih Ecer. 2021. Determination of drivers for investing in cryptocurrencies through a fuzzy full consistency method-Bonferroni (FUCOM-F’B) framework. Technology in Society 67: 101745. [Google Scholar] [CrossRef]
- Coinbase. 2022. Coinbase Crypto Report Europe 2022 H1. Coinbase Crypto Report. Available online: http://explore-ip.com/2022-Coinbase-Crypto-Report-Europe-2022-H1-EN.pdf (accessed on 29 August 2022).
- Deutsche Postbank. 2018. Jeder dritte Deutsche zieht Kryptowährungen als Geldanlage in Betracht. Postbank Digitalstudie. Available online: https://www.presseportal.de/pm/6586/3955818 (accessed on 29 August 2022).
- Dimmock, Stephen G., and Roy Kouwenberg. 2010. Loss-aversion and household portfolio choice. Journal of Empirical Finance 17: 441–59. [Google Scholar] [CrossRef]
- Dohmen, Thomas, Armin Falk, David Huffman, Uwe Sunde, Jürgen Schupp, and Gert G. Wagner. 2011. Individual risk attitudes: Measurement, determinants, and behavioral consequences. Journal of the European Economic Association 9: 522–50. [Google Scholar] [CrossRef]
- Dyhrberg, Anne Haubo. 2016. Bitcoin, gold and the dollar—A garch volatility analysis. Finance Research Letters 16: 85–92. [Google Scholar] [CrossRef]
- European Union. 2015. Directive (EU) 2015/2366 on EU-Wide Payment Services. Official Journal of the European Union. Available online: https://eur-lex.europa.eu/legal-content/EN/LSU/?uri=CELEX:32015L2366 (accessed on 29 August 2022).
- Exton, J., and F. Doidge. 2018. Cracking the Code on Cryptocurrency—Bitcoin Buy-in across Europe, the USA and Australia. ING International Survey Mobile Banking—Cryptocurrency. Available online: https://think.ing.com/reports/cracking-the-code-on-cryptocurrency (accessed on 29 August 2022).
- Falk, Armin, Anke Becker, Thomas Dohmen, Benjamin Enke, David Huffman, and Uwe Sunde. 2018. Global evidence on economic preferences. Quarterly Journal of Economics 133: 1645–92. [Google Scholar] [CrossRef]
- Floros, Christos, Konstantinos Gkillas, Christoforos Konstantatos, and Athanasios Tsagkanos. 2020. Realized measures to explain volatility changes over time. Journal of Risk and Financial Management 13: 125. [Google Scholar] [CrossRef]
- French, Declan, Donal McKillop, and Elaine Stewart. 2021. Personal finance apps and low-income households. Strategic Change 30: 367–75. [Google Scholar] [CrossRef]
- Fujiki, Hiroshi. 2020. Who adopts crypto assets in Japan? Evidence from the 2019 financial literacy survey. Journal of the Japanese and International Economies 58: 101107. [Google Scholar] [CrossRef]
- Fujiki, Hiroshi. 2021. Crypto asset ownership, financial literacy, and investment experience. Applied Economics 53: 4560–81. [Google Scholar] [CrossRef]
- Gambetti, Elisa, and Fiorella Giusberti. 2012. The effect of anger and anxiety traits on investment decisions. Journal of Economic Psychology 33: 1059–69. [Google Scholar] [CrossRef]
- Gambetti, Elisa, Micaela Maria Zucchelli, Raffaella Nori, and Fiorella Giusberti. 2022. Default rules in investment decision-making: Trait anxiety and decision-making styles. Financial Innovation 8: 23. [Google Scholar] [CrossRef]
- Gamst-Klaussen, Thor, Piers Steel, and Frode Svartdal. 2019. Procrastination and personal finances: Exploring the roles of planning and financial self-efficacy. Frontiers in Psychology 10: 775. [Google Scholar] [CrossRef]
- Ghosh, Bikramaditya, Spyros Papathanasiou, and Georgios Pergeris. 2022. Did cryptocurrencies exhibit log-periodic power law signature during the second wave of COVID-19? Economic Notes 51: e12207. [Google Scholar] [CrossRef]
- Gomes, Francisco J. 2005. Portfolio choice and trading volume with loss-averse investors. Journal of Business 78: 675–706. [Google Scholar] [CrossRef]
- Guiso, Luigi, Paola Sapienza, and Luigi Zingales. 2008. Trusting the stock market. Journal of Finance 63: 2557–600. [Google Scholar] [CrossRef]
- Gur, Nurullah. 2022. Patience and financial development. Finance Research Letters 44: 102045. [Google Scholar] [CrossRef]
- Hackethal, Andreas, Tobin Hanspal, Dominique M. Lammer, and Kevin Rink. 2021. The characteristics and portfolio behavior of bitcoin investors: Evidence from indirect cryptocurrency investments. Review of Finance 26: 855–98. [Google Scholar] [CrossRef]
- Haliassos, Michael, and Carol C Bertaut. 1995. Why do so few hold stocks? Economic Journal 105: 1110–29. [Google Scholar] [CrossRef]
- Krombholz, Katharina, Aljosha Judmayer, Matthias Gusenbauer, and Edgar Weippl. 2017. The other side of the coin: User experiences with bitcoin security and privacy. In Financial Cryptography and Data Security. Berlin and Heidelberg: Springer, pp. 555–80. [Google Scholar]
- Kyriazis, Nikolaos, Stephanos Papadamou, Panayiotis Tzeremes, and Shaen Corbet. 2022. The differential influence of social media sentiment on cryptocurrency returns and volatility during COVID-19. The Quarterly Review of Economics and Finance. in press. [Google Scholar] [CrossRef]
- Kyriazis, Nikolaos, Stephanos Papadamou, Panayiotis Tzeremes, and Shaen Corbet. 2023. Can cryptocurrencies provide a viable hedging mechanism for benchmark index investors? Research in International Business and Finance 64: 101832. [Google Scholar] [CrossRef]
- Laboure, Marion, and Reid Jim. 2020. The Future of Payments Part III. Digital Currencies: The Ultimate Hard Power Tool. Deutsche Bank Research. Available online: https://www.dbresearch.com/PROD/RPS_EN-PROD/PROD0000000000504589/The_Future_of_Payments_-_Part_III__Digital_Currenc.pdf (accessed on 29 August 2022).
- Manaa, Mehdi, Maria Teresa Chimienti, Mitsutoshi Adachi, Phoebus Athanassiou, Irina Balteanu, Alessandro Calza, Conall Devaney, Ester Diaz Fernandez, Fabian Eser, Ioannis Ganoulis, and et al. 2019. Occasional paper series crypto-assets: Implications for financial stability, monetary policy, and payments and market infrastructures. European Central Bank, ECB Crypto-Assets Task Force 223: 1–40. [Google Scholar] [CrossRef]
- McMorrow, Jake, and Mona Seyed Esfahani. 2021. An exploration into people’s perception and intention on using cryptocurrencies. HOLISTICA—Journal of Business and Public Administration 12: 109–44. [Google Scholar] [CrossRef]
- Mogul, Zubin, Bernhard Kronfellner, Michael Buser, Chi Lai, Kenneth Wee, Will Rhode, Kaj Burchardi, Anna Golebiowska, Pratin Vallabhaneni, John Wagner, and et al. 2020. How Banks Can Succeed with Cryptocurrency. Boston Consulting Group X White & Case. Available online: https://www.bcg.com/de-de/publications/2020/how-banks-can-succeed-with-cryptocurrency (accessed on 29 August 2022).
- Odean, Terrance. 1999. Do investors trade too much? American Economic Review 89: 1279–98. [Google Scholar] [CrossRef]
- Oksanen, A., E. Mantere, I. Vuorinen, and I. Savolainen. 2022. Gambling and online trading: Emerging risks of real-time stock and cryptocurrency trading platforms. Public Health 205: 72–78. [Google Scholar] [CrossRef] [PubMed]
- Olsen, Robert. 2012. Trust: The underappreciated investment risk attribute. Journal of Behavioral Finance 13: 308–13. [Google Scholar] [CrossRef]
- Pelster, Matthias, Bastian Breitmayer, and Tim Hasso. 2019. Are cryptocurrency traders pioneers or just risk-seekers? evidence from brokerage accounts. Economics Letters 182: 98–100. [Google Scholar] [CrossRef]
- Rey-Ares, Lucía, Sara Fernández-López, Sandra Castro-González, and David Rodeiro-Pazos. 2021. Does self-control constitute a driver of millennials’ financial behaviors and attitudes? Journal of Behavioral and Experimental Economics 93: 101702. [Google Scholar] [CrossRef]
- Rubbaniy, Ghulame, Kienpin Tee, Perihan Iren, and Sonia Abdennadher. 2022. Investors’ mood and herd investing: A quantile-on-quantile regression explanation from crypto market. Finance Research Letters 47: 102585. [Google Scholar] [CrossRef]
- Schuh, Scott, and Ozz Shy. 2015. U.S. Consumers’ Adoption and Use of Bitcoin and other Virtual Currencies. Working Paper. Ottawa, ON, Canada: Bank of Canada. [Google Scholar]
- Sekścińska, Katarzyna, Joanna Rudzinska-Wojciechowska, and Diana Jaworska. 2021. Self-control and investment choices. Journal of Behavioral Decision Making 34: 691–705. [Google Scholar] [CrossRef]
- Shapiro, Gilla K., and Brendan J. Burchell. 2012. Measuring financial anxiety. Journal of Neuroscience, Psychology, and Economics 5: 92. [Google Scholar] [CrossRef]
- Statistisches Bundesamt (Destatis). 2022. Volkswirtschaftliche Gesamtrechnungen, Inlandsproduktberechnung Vierteljahresergebnisse. In Statistisches Bundesamt (Destatis) Fachserie 18, Reihe 1.2; Wiesbaden: DeStatis. [Google Scholar]
- Steinmetz, Fred. 2021. Behavioural Clusters of Cryptocurrency Users: Frequencies of Non-Speculative Application Domains. BRL Working Paper Series 24. Hamburg, Germany: Blockchain Research Lab. [Google Scholar]
- Steinmetz, Fred, Marc von Meduna, Lennart Ante, and Ingo Fiedler. 2021. Ownership, uses and perceptions of cryptocurrency: Results from a population survey. Technological Forecasting and Social Change 173: 121073. [Google Scholar] [CrossRef]
- Stix, Helmut. 2021. Ownership and purchase intention of crypto-assets: Survey results. Empirica 48: 65–99. [Google Scholar] [CrossRef]
- Subramaniam, Sowmya, and Madhumita Chakraborty. 2020. Investor Attention and Cryptocurrency Returns: Evidence from Quantile Causality Approach. Journal of Behavioral Finance 21: 103–15. [Google Scholar] [CrossRef]
- Thompson, John R. J., Longlong Feng, R. Mark Reesor, and Chuck Grace. 2021. Know your clients’ behaviours: A cluster analysis of financial transactions. Journal of Risk and Financial Management 14: 50. [Google Scholar] [CrossRef]
- VuMA. 2022. Verbrauchs- und Medienanalyse. Hamburg: IFAK, Forsa Marplan, GIM, Kantar. [Google Scholar]
- Zhao, Haidong, and Lini Zhang. 2021. Financial literacy or investment experience: Which is more influential in cryptocurrency investment? International Journal of Bank Marketing 39: 1208–26. [Google Scholar] [CrossRef]
- Zhao, Yuan, Nan Liu, and Wanpeng Li. 2022. Industry herding in crypto assets. International Review of Financial Analysis 84: 102335. [Google Scholar] [CrossRef]

| Data Sources | Variables | |
|---|---|---|
| 1 | Survey | Behavioral traits |
| 2 | Demographics | Age, gender, employment, and living status |
| 3 | Account transactions | Labeled transactions |
| 4 | Security accounts | Monthly security balances, crypto wallets |
| Behavioral Trait | Survey Question | |
|---|---|---|
| 1 | risk | If you personally make savings or investment decisions, how would you describe your risk attitude? |
| 2 | trust | What is your opinion on the following statement? In general, people can be trusted. |
| 3 | patience | I would rather spend money when it is there than put it aside. |
| 4 | patience | I am willing to give up something today in order to benefit more in the future. |
| 5 | self-control bias | I have created a long-term financial plan for myself (and my family). |
| 6 | self-control bias | It often happens that I spend money on things that, in hindsight, I would have preferred not to have bought. |
| 7 | self-control bias | I regularly cancel my subscriptions and contracts to get better conditions. |
| 8 | procrastination | I tend to put off important financial decisions. |
| 9 | effort | I find it very exhausting to make financial decisions. |
| 10 | loss aversion | The possibility of even small losses on my savings makes me nervous. |
| 11 | loss aversion | When making financial decisions, I am afraid of making mistakes that I regret afterwards |
| (1) | (2) | (3) | (1)–(2) | (1)–(3) | (2)–(3) | |
|---|---|---|---|---|---|---|
| Crypto Investors | Conventional Investors | Non-Invested | Diff. Crypto and Conventional Investors | Diff. Crypto and Non-Invested | Diff. Conventional and Non-Invested | |
| Characteristics | ||||||
| Age | 33.39 | 35.17 | 34.53 | −1.78 | −1.14 | 0.64 |
| Male | 0.88 | 0.73 | 0.50 | 0.15 ** | 0.38 *** | 0.23 *** |
| Retired | 0.20 | 0.24 | 0.34 | −0.04 | −0.14 ** | −0.10 *** |
| Married | 0.64 | 0.62 | 0.57 | 0.02 | 0.07 | 0.05 ** |
| Student | 0.45 | 0.31 | 0.21 | 0.14 ** | 0.24 *** | 0.10 *** |
| Self-employed | 0.27 | 0.17 | 0.06 | 0.10 ** | 0.21 *** | 0.11 *** |
| Monthly transactions | 49.24 | 52.35 | 53.61 | −3.11 | −4.37 | −1.26 |
| # All security accounts | 6.43 | 1.78 | 4.64 *** | |||
| # Non-crypto security accounts | 2.32 | 1.78 | 0.54 *** | |||
| Total portfolio balance | 23,787.21 | 30,964.29 | −7177.08 | |||
| Behavioral traits | ||||||
| Risk | 4.88 | 4.41 | 3.42 | 0.47 *** | 1.46 *** | 0.99 *** |
| Trust | 4.04 | 4.03 | 3.88 | 0.01 | 0.16 | 0.15 ** |
| Patience | 2.59 | 2.88 | 3.32 | −0.29 * | −0.73 *** | −0.44 *** |
| Self-control | 4.82 | 4.68 | 4.06 | 0.14 | 0.75 *** | 0.61 *** |
| Procrastination | 2.67 | 2.93 | 3.33 | −0.26 | −0.67 *** | −0.4 *** |
| Effort | 2.85 | 3.31 | 3.95 | −0.45 ** | −1.09 *** | −0.64 *** |
| Loss aversion | 2.79 | 3.07 | 4.00 | −0.27 | −1.21 *** | −0.94 *** |
| n | 75 | 614 | 844 |
| (1) | (2) | (3) | (1)–(2) | (1)–(3) | (2)–(3) | |
|---|---|---|---|---|---|---|
| Crypto Investors | Conventional Investors | Non-Invested | Diff. Crypto and Conventional Investors | Diff. Crypto and Non-Invested | Diff. Conventional and Non-Invested | |
| Main Consumption Categories | ||||||
| income | 2249.53 | 2699.49 | 2309.92 | −449.96 * | −60.39 | 389.57 *** |
| Cash withdrawals | 254.72 | 304.53 | 326.03 | −49.81 | −71.31 ** | −21.50 |
| Vocational training | 48.94 | 52.14 | 48.35 | −3.20 | 0.58 | 3.79 |
| Financial expenses | 627.21 | 761.93 | 548.15 | −134.73 | 79.06 | 213.79 *** |
| Financial receipts | 81.91 | 91.70 | 87.45 | −9.79 | −5.54 | 4.25 |
| Leisure expenses | 76.20 | 86.71 | 91.35 | −10.51 | −15.15 * | −4.63 |
| Health care expenses | 58.88 | 77.75 | 69.50 | −18.87 * | −10.62 | 8.25 ** |
| Pet expenses | 9.49 | 18.59 | 26.06 | −9.10 ** | −16.57 *** | −7.48 *** |
| Children expenses | 41.87 | 60.49 | 64.78 | −18.62 | −22.91 | −4.29 |
| Food expenses | 183.33 | 215.28 | 230.11 | −31.95 | −46.78 ** | −14.83 |
| Holiday expenses | 258.23 | 285.83 | 252.40 | −27.59 | 5.84 | 33.43 ** |
| Shopping expenses | 306.28 | 291.83 | 309.51 | 14.45 | −3.23 | −17.68 * |
| Savings expenses | 666.99 | 536.43 | 274.99 | 130.55 | 392.00 *** | 261.44 *** |
| Mobility expenses | 98.89 | 108.69 | 106.06 | −9.80 | −7.17 | 2.63 |
| Insurance expenses | 171.81 | 256.80 | 205.66 | −84.99 ** | −33.85 | 51.14 *** |
| Living expenses | 531.97 | 669.90 | 566.44 | −137.93 ** | −34.47 | 103.46 *** |
| Other expenses | 1922.64 | 2291.23 | 1391.32 | −368.59 | 531.32 ** | 899.91 *** |
| Other receipts | 2498.57 | 3038.71 | 1839.40 | −540.15 | 659.16 *** | 1199.31 *** |
| Debt | −689.24 | −437.63 | −300.58 | −251.61 | −388.65 | −137.04 |
| Selected Consumption Subcategories | ||||||
| Pet | 6.53 | 12.50 | 18.02 | −5.97 ** | −11.48 *** | −5.52 *** |
| Refueling | 60.07 | 76.82 | 87.18 | −16.75 ** | −27.11 *** | −10.36 *** |
| Pharmacy | 22.46 | 31.68 | 30.63 | −9.22 ** | −8.16 *** | 1.05 |
| Drugstore | 26.91 | 35.10 | 42.71 | −8.19 ** | −15.81 *** | −7.62 *** |
| Health insurance | 30.55 | 82.34 | 47.91 | −51.79 ** | −17.36 | 34.43 *** |
| Restaurant | 34.91 | 41.07 | 37.41 | −6.16 * | −2.50 | 3.66 *** |
| Electronics | 212.41 | 170.09 | 155.67 | 42.32 * | 56.74 *** | 14.42 |
| Interest | 9.08 | 15.80 | 15.54 | −6.72 * | −6.46 * | 0.26 |
| Rent | 377.13 | 478.39 | 399.91 | −101.26 * | −22.78 | 78.48 *** |
| Furniture | 123.07 | 160.36 | 134.75 | −37.28 * | −11.67 | 25.61 *** |
| Capital investment | 648.89 | 410.27 | 111.63 | 238.62 | 537.26 *** | 298.64 *** |
| Train ticket | 38.70 | 35.42 | 26.31 | 3.28 | 12.39 *** | 9.11 *** |
| Credit card statement | 258.31 | 264.93 | 175.84 | −6.62 | 82.47 ** | 89.08 *** |
| Food subscriptions | 16.14 | 11.09 | 10.29 | 5.05 | 5.85 ** | 0.80 |
| Taxi | 5.68 | 5.94 | 3.73 | −0.26 | 1.95 * | 2.21 *** |
| n | 75 | 550 | 843 | |||
| Crypto Participation | ||||||
|---|---|---|---|---|---|---|
| (1) | (2) | (3) | (4) | (5) | (6) | |
| Probit | Probit | Probit | Probit | Probit | Probit | |
| male | 0.572 *** | 0.558 *** | 0.370 ** | 0.589 *** | 0.411 *** | |
| (0.141) | (0.142) | (0.155) | (0.146) | (0.158) | ||
| age | −0.004 | −0.001 | 0.0002 | 0.002 | 0.003 | |
| (0.006) | (0.006) | (0.006) | (0.007) | (0.007) | ||
| married | 0.032 | 0.037 | 0.020 | 0.031 | 0.013 | |
| (0.117) | (0.117) | (0.118) | (0.117) | (0.117) | ||
| student | 0.289 ** | 0.244 * | 0.190 | 0.236 * | 0.176 | |
| (0.123) | (0.133) | (0.136) | (0.135) | (0.137) | ||
| retired | −0.239 * | −0.268 * | −0.249 * | −0.286 ** | −0.260 * | |
| (0.135) | (0.138) | (0.138) | (0.139) | (0.140) | ||
| self-employed | 0.435 *** | 0.317 * | 0.297 * | 0.281 | 0.250 | |
| (0.147) | (0.172) | (0.179) | (0.172) | (0.179) | ||
| homeowner | −0.369 | −0.419 | −0.382 | −0.423 | −0.380 | |
| (0.341) | (0.353) | (0.356) | (0.362) | (0.365) | ||
| log(income) | −0.045 | −0.040 | −0.039 | −0.041 | ||
| (0.031) | (0.032) | (0.033) | (0.034) | |||
| log(saving) | 0.048 ** | 0.034 | 0.048 ** | 0.033 | ||
| (0.023) | (0.023) | (0.023) | (0.023) | |||
| log(total debt) | −0.044 | −0.044 | −0.039 | −0.040 | ||
| (0.028) | (0.027) | (0.028) | (0.028) | |||
| risk | 0.214 *** | 0.277 *** | 0.223 *** | |||
| (0.075) | (0.075) | (0.076) | ||||
| trust | −0.003 | 0.008 | −0.003 | |||
| (0.057) | (0.055) | (0.058) | ||||
| patience | −0.109 | −0.138 * | −0.116 | |||
| (0.076) | (0.074) | (0.076) | ||||
| self-control | 0.060 | 0.063 | 0.056 | |||
| (0.140) | (0.132) | (0.143) | ||||
| loss aversion | −0.018 | −0.057 | −0.023 | |||
| (0.087) | (0.083) | (0.089) | ||||
| procrastination | −0.033 | −0.007 | −0.049 | |||
| (0.079) | (0.075) | (0.082) | ||||
| effort | −0.044 | −0.060 | −0.045 | |||
| (0.073) | (0.071) | (0.075) | ||||
| log(interest) | −0.094 * | −0.086 * | ||||
| (0.052) | (0.052) | |||||
| log(food subscriptions) | 0.072 ** | 0.095 *** | ||||
| (0.035) | (0.037) | |||||
| Constant | −2.060 *** | −1.879 *** | −1.848 *** | −1.789 *** | −1.941 *** | −1.914 *** |
| (0.273) | (0.359) | (0.364) | (0.0656) | (0.373) | (0.380) | |
| Observations | 1533 | 1533 | 1532 | 1532 | 1533 | 1532 |
| Pseudo R2 | 0.076 | 0.089 | 0.127 | 0.076 | 0.102 | 0.142 |
| Crypto Share, Conditional on Crypto Ownership | ||||||
|---|---|---|---|---|---|---|
| (1) | (2) | (3) | (4) | (5) | (6) | |
| OLS | OLS | OLS | OLS | OLS | OLS | |
| male | −6.736 | −4.690 | 0.063 | −3.090 | −0.157 | |
| (13.430) | (13.790) | (13.380) | (13.270) | (12.770) | ||
| age | 0.274 | 0.420 | 1.083 * | 0.0003 | 0.733 | |
| (0.576) | (0.608) | (0.605) | (0.601) | (0.625) | ||
| married | −7.197 | −5.067 | −11.030 | −7.734 | −12.440 | |
| (9.800) | (10.110) | (9.889) | (9.848) | (9.897) | ||
| student | −10.830 | −13.670 | −20.410 ** | −12.170 | −18.230 ** | |
| (9.783) | (9.948) | (9.640) | (9.339) | (9.018) | ||
| retired | −5.803 | −8.298 | −26.740 ** | −12.220 | −27.370 ** | |
| (11.940) | (12.580) | (12.780) | (11.980) | (12.010) | ||
| self-employed | 9.052 | −4.251 | −4.888 | −8.728 | −8.637 | |
| (11.760) | (15.900) | (10.600) | (13.420) | (9.884) | ||
| homeowner | −24.040 * | −25.500 * | −56.750 *** | −26.790 ** | −53.850 *** | |
| (12.660) | (13.200) | (15.340) | (12.490) | (14.880) | ||
| log(income) | −2.639 | −4.644 ** | −9.894 *** | −9.705 *** | ||
| (2.433) | (1.957) | (2.960) | (2.646) | |||
| log(saving) | −0.219 | 1.414 | 0.940 | 1.932 | ||
| (1.784) | (1.927) | (1.726) | (1.874) | |||
| log(debt) | −0.752 | −1.057 | −1.280 | −1.443 | ||
| (2.139) | (2.301) | (2.026) | (2.204) | |||
| risk | 0.046 | 2.914 | 3.836 | |||
| (7.049) | (7.118) | (6.810) | ||||
| trust | −3.469 | −8.341 * | −7.272 | |||
| (4.637) | (4.299) | (4.360) | ||||
| patience | 5.244 | 9.227 * | 8.136 * | |||
| (4.697) | (4.930) | (4.789) | ||||
| self-control | −7.890 | −0.005 | −1.859 | |||
| (9.664) | (11.400) | (10.730) | ||||
| loss aversion | 1.233 | 12.100 | 12.810 | |||
| (10.720) | (11.470) | (10.780) | ||||
| procrastination | −6.293 | −6.732 | −6.337 | |||
| (5.736) | (5.886) | (5.539) | ||||
| effort | 12.480 | 16.440 * | 12.660 | |||
| (8.550) | (8.677) | (8.136) | ||||
| log(drugstore) | 15.930 *** | 11.600 *** | ||||
| (4.340) | (4.337) | |||||
| Constant | 38.110 * | 53.130 ** | 40.920 *** | 58.450 *** | 71.000 *** | 70.490 *** |
| (21.790) | (24.910) | (5.791) | (20.660) | (24.730) | (21.680) | |
| Observations | 74 | 74 | 74 | 74 | 74 | 74 |
| R-squared | 0.049 | 0.069 | 0.136 | 0.314 | 0.194 | 0.373 |
Disclaimer/Publisher’s Note: The statements, opinions and data contained in all publications are solely those of the individual author(s) and contributor(s) and not of MDPI and/or the editor(s). MDPI and/or the editor(s) disclaim responsibility for any injury to people or property resulting from any ideas, methods, instructions or products referred to in the content. |
© 2023 by the authors. Licensee MDPI, Basel, Switzerland. This article is an open access article distributed under the terms and conditions of the Creative Commons Attribution (CC BY) license (https://creativecommons.org/licenses/by/4.0/).
Share and Cite
Nemeczek, F.; Weiss, D. Insights on Crypto Investors from a German Personal Finance Management App. J. Risk Financial Manag. 2023, 16, 248. https://doi.org/10.3390/jrfm16040248
Nemeczek F, Weiss D. Insights on Crypto Investors from a German Personal Finance Management App. Journal of Risk and Financial Management. 2023; 16(4):248. https://doi.org/10.3390/jrfm16040248
Chicago/Turabian StyleNemeczek, Fabian, and Daniel Weiss. 2023. "Insights on Crypto Investors from a German Personal Finance Management App" Journal of Risk and Financial Management 16, no. 4: 248. https://doi.org/10.3390/jrfm16040248