Article

Genetic Diversity Analysis of Banana Cultivars (Musa sp.) in Saudi Arabia Based on AFLP Marker

by
Fatmah Ahmed Safhi
1,
Salha Mesfer Alshamrani
2,
Dalal Sulaiman Alshaya
1,*,
Mohammed A. A. Hussein
3 and
Diaa Abd El-Moneim
4
1
Department of Biology, College of Science, Princess Nourah bint Abdulrahman University, P.O. Box 84428, Riyadh 11671, Saudi Arabia
2
Department of Biology, College of Science, University of Jeddah, Jeddah 21959, Saudi Arabia
3
Department of Botany (Genetics), Faculty of Agriculture, Suez Canal University, Ismailia 41522, Egypt
4
Department of Plant Production (Genetic Branch), Faculty of Environmental Agricultural Sciences, Arish University, El-Arish 45511, Egypt
*
Author to whom correspondence should be addressed.
Curr. Issues Mol. Biol. 2023, 45(3), 1810-1819; https://doi.org/10.3390/cimb45030116
Submission received: 7 January 2023 / Revised: 11 February 2023 / Accepted: 16 February 2023 / Published: 22 February 2023
(This article belongs to the Special Issue Functional Genomics and Comparative Genomics Analysis in Plants)

Abstract

:
Banana plantation has been introduced recently to a temperate zone in the southeastern parts of Saudi Arabia (Fifa, Dhamadh, and Beesh, located in Jazan province). The introduced banana cultivars were of a clear origin without a recorded genetic background. In the current study, the genetic variability and structure of five common banana cultivars (i.e., Red, America, Indian, French, and Baladi) were analyzed using the fluorescently labeled AFLP technique. Nine different primer pairs combinations yielded 1468 loci with 88.96% polymorphism. Among all locations, high expected heterozygosity under the Hardy–Weinberg assumption was found (0.249 ± 0.003), where Dhamadh was the highest, followed by Fifa and Beesh, respectively. Based on the PCoA and Structure analysis, the samples were not clustered by location but in pairs in accordance with the cultivar’s names. However, the Red banana cultivar was found to be a hybrid between the American and Indian cultivars. Based on ΦST, 162 molecular markers (i.e., loci under selection) were detected among cultivars. Identifying those loci using NGS techniques can reveal the genetic bases and molecular mechanisms involved in the domestication and selection indicators among banana cultivars.

1. Introduction

Among the edible, vegetatively propagated, monocotyledonous, and herbaceous species of Musa, banana and plantain (Musa sp.) belong to the Eumusa section of the genus Musa, family Musaceae and order Zingiberales [1]. Bananas and plantains rank fourth after cereals in importance as food sources in many developing nations [2]. One hundred two million hectares of banana farms are found in humid tropical and subtropics in the Americas, Africa, Asia, and Europe, extending to Australia and Europe [2]. Numerous countries in Asia, Africa, Latin America, and the Pacific Islands rely on banana production for a large portion of their economies. There are about 145 million tons of banana production, of which only a few million tons are exported. The banana is, without a doubt, a staple food for millions of tropical residents [2,3]. There are many nutrients and carbohydrates in bananas and plantains, including carbohydrates, minerals, and vitamins [4,5]. Unlike other fruit crops, it grows faster than other perennials and produces fruit throughout the year. In banana cultivation, micropropagation or suckers are used for asexual propagation [6].
Unlike their wild relatives, cultivated bananas grow without pollination. Fantastic collections of parthenocarpic mutants have primarily been made by farmers and multiplied and distributed by vegetative propagation of spontaneously occurring mutants [7]. During the initial domestication process, a relatively limited portion of the genetic diversity of wild banana species was used [8]. It is essential to know about the genetic diversity and agroecological adaptations of Musa to address contemporary food security needs. Clone identification and taxonomic studies have relied heavily on morphological and agronomic characteristics [9,10].
Two wild species in the section Eumusa produce different genotypes: Musa acuminata (AA) and Musa balbisiana (BB). They are classified into other genomic groups, including AA, AB, and BBs classified as diploids, AAA, AAB, ABB, and BBBs classified as tetraploids, resulting from interspecific hybridization between M. acuminata and M. balbisiana [11]. Several unifying characteristics were observed in morphological studies of Musa species. Hybrid cultivars and wild types exhibit complex genome structures and phylogenetic relationships that require further investigation. Banana cultivation is susceptible to pests and diseases because of its narrow genetic base [12]. Further, abiotic stresses caused by global warming and climate change exacerbate this situation [13]. In order to boost banana productivity, identifying genotypes with high potential is crucial [14].
It is common practice in plants to use molecular markers to identify genetic differences in germplasm, identify duplicate accessions, and test for genetic fidelity [3]. The availability of molecular markers, particularly polymerase chain reactions (PCR)-based techniques, has led to the evaluation of Musa species’ genetic diversity. For example, the application of random amplified polymorphic DNA (RAPD) techniques, which provide helpful information and new insights into the taxonomy [15], restriction fragment length polymorphism (RFLP) [16], sequence-related amplified polymorphism (SRAP) [17], and microsatellites or simple sequence repeats (SSRs), inter-simple sequence repeats (ISSRs) [18]. The AFLP method combines the convenience of polymerase chain reaction (PCR)-based fingerprinting with the reliability of restriction-based fingerprinting [19,20]. Furthermore, AFLP allows high-resolution genotyping by rapidly generating hundreds of highly reproducible DNA markers [21]. This study investigated the genetic d and genetic relationships of banana cultivars with unknown genomic groups, introduced into three locations in Jazan, southeast Saudi Arabia.

2. Materials and Methods

2.1. Sampling Site

The study was performed in three districts of one department of the southwestern region of Jazan province in Saudi Arabia (the Fifa mountains, Dhamdh governorate, and Beesh town). Banana cultivars were collected from farms in the main banana-growing agroecological zones of the country. The agroecological zone of the southwestern regions of Saudi Arabia is characterized by three agroclimatic zones and ten subzones defined by geographic location and topography that differ in rainfall and air temperature [22]. High altitudes are characterized by lower temperatures and higher rainfall (400–450 mm per year), making vegetation more diverse [23].

2.2. Sample Collection

A total of eight Musa species and subspecies were used in this study. Three samples of fresh banana leaves of each cultivar were collected from the field, packed in plastic bags, labeled with a site code, and kept in iceboxes until examination. To avoid sampling duplication from the same individual, we did not sample plants located directly next to each other (Table 1).

2.3. DNA Extraction

According to the manufacturer’s instructions, plant genomic DNA was extracted from leaf samples using the WizPrep™ gDNA Mini Kit (Wizbiosolutions Inc, Seongnam, Republic of Korea) with a final elution volume of 50 mL. To check the DNA quality, we visually tested 5 uL of each sample by 1% gel electrophoresis. DNA appears as sharp bands when visualized under UV light using the Ingenius3 Gel documentation system (Syngene, UK). Extracted DNA was stored at −20 °C until required for PCR.

2.4. AFLP Protocol

AFLP analysis was carried out following the method of Vos et al. [24], with one modification in the labeling type, as primers were labeled fluorescently rather than radioactively labeled. All primers and adaptors were synthesized by Eurofins, Hamburg, Germany (Table 2). Samples were successfully tested with six different selective PCR combinations. The original PCR protocol was followed without modification. Visualization of the amplified products was performed by a private service using an ABI3730 DNA analyzer (Applied Biosystems, Waltham, MA, USA) with a size standard GS500-LIZ (Macrogen Fragment Analysis Service, Republic of Korea).

2.5. Data Analysis

Peak ScannerTM (Applied Biosystems, USA) and Raw Geno V2 (Applied Biosystems, USA) were used to automate the AFLP scoring. The band-binary criterion was applied to the analysis of the AFLP data as the detected bands were codified as 1 when present and 0 when absent. As the total number of samples equals 8, thus a single sample frequency = 12.5%. Bands with a frequency of >87% or <13% are often uninformative or misleading when included in the analyses [25,26] and were, therefore, excluded from further analysis using FAMD 1.31 software [27].
The Bayesian clustering method was applied by using Structure V2.2 [28] to investigate the genetic structure. Triple independent simulations were performed per each assumed number of sub-populations K (tested K = 1 to 5). Parameters were set as the following burn-in period of 10,000 out of 100,000 MCMC iterations, and the admixture ancestry model was set on. Analysis of molecular variance (AMOVA) was performed to test the population genetic differentiation using Arlequin V3.5 [29]. The significance of ΦST was tested with 10,000 permutations for the detected AFLP loci.

3. Results

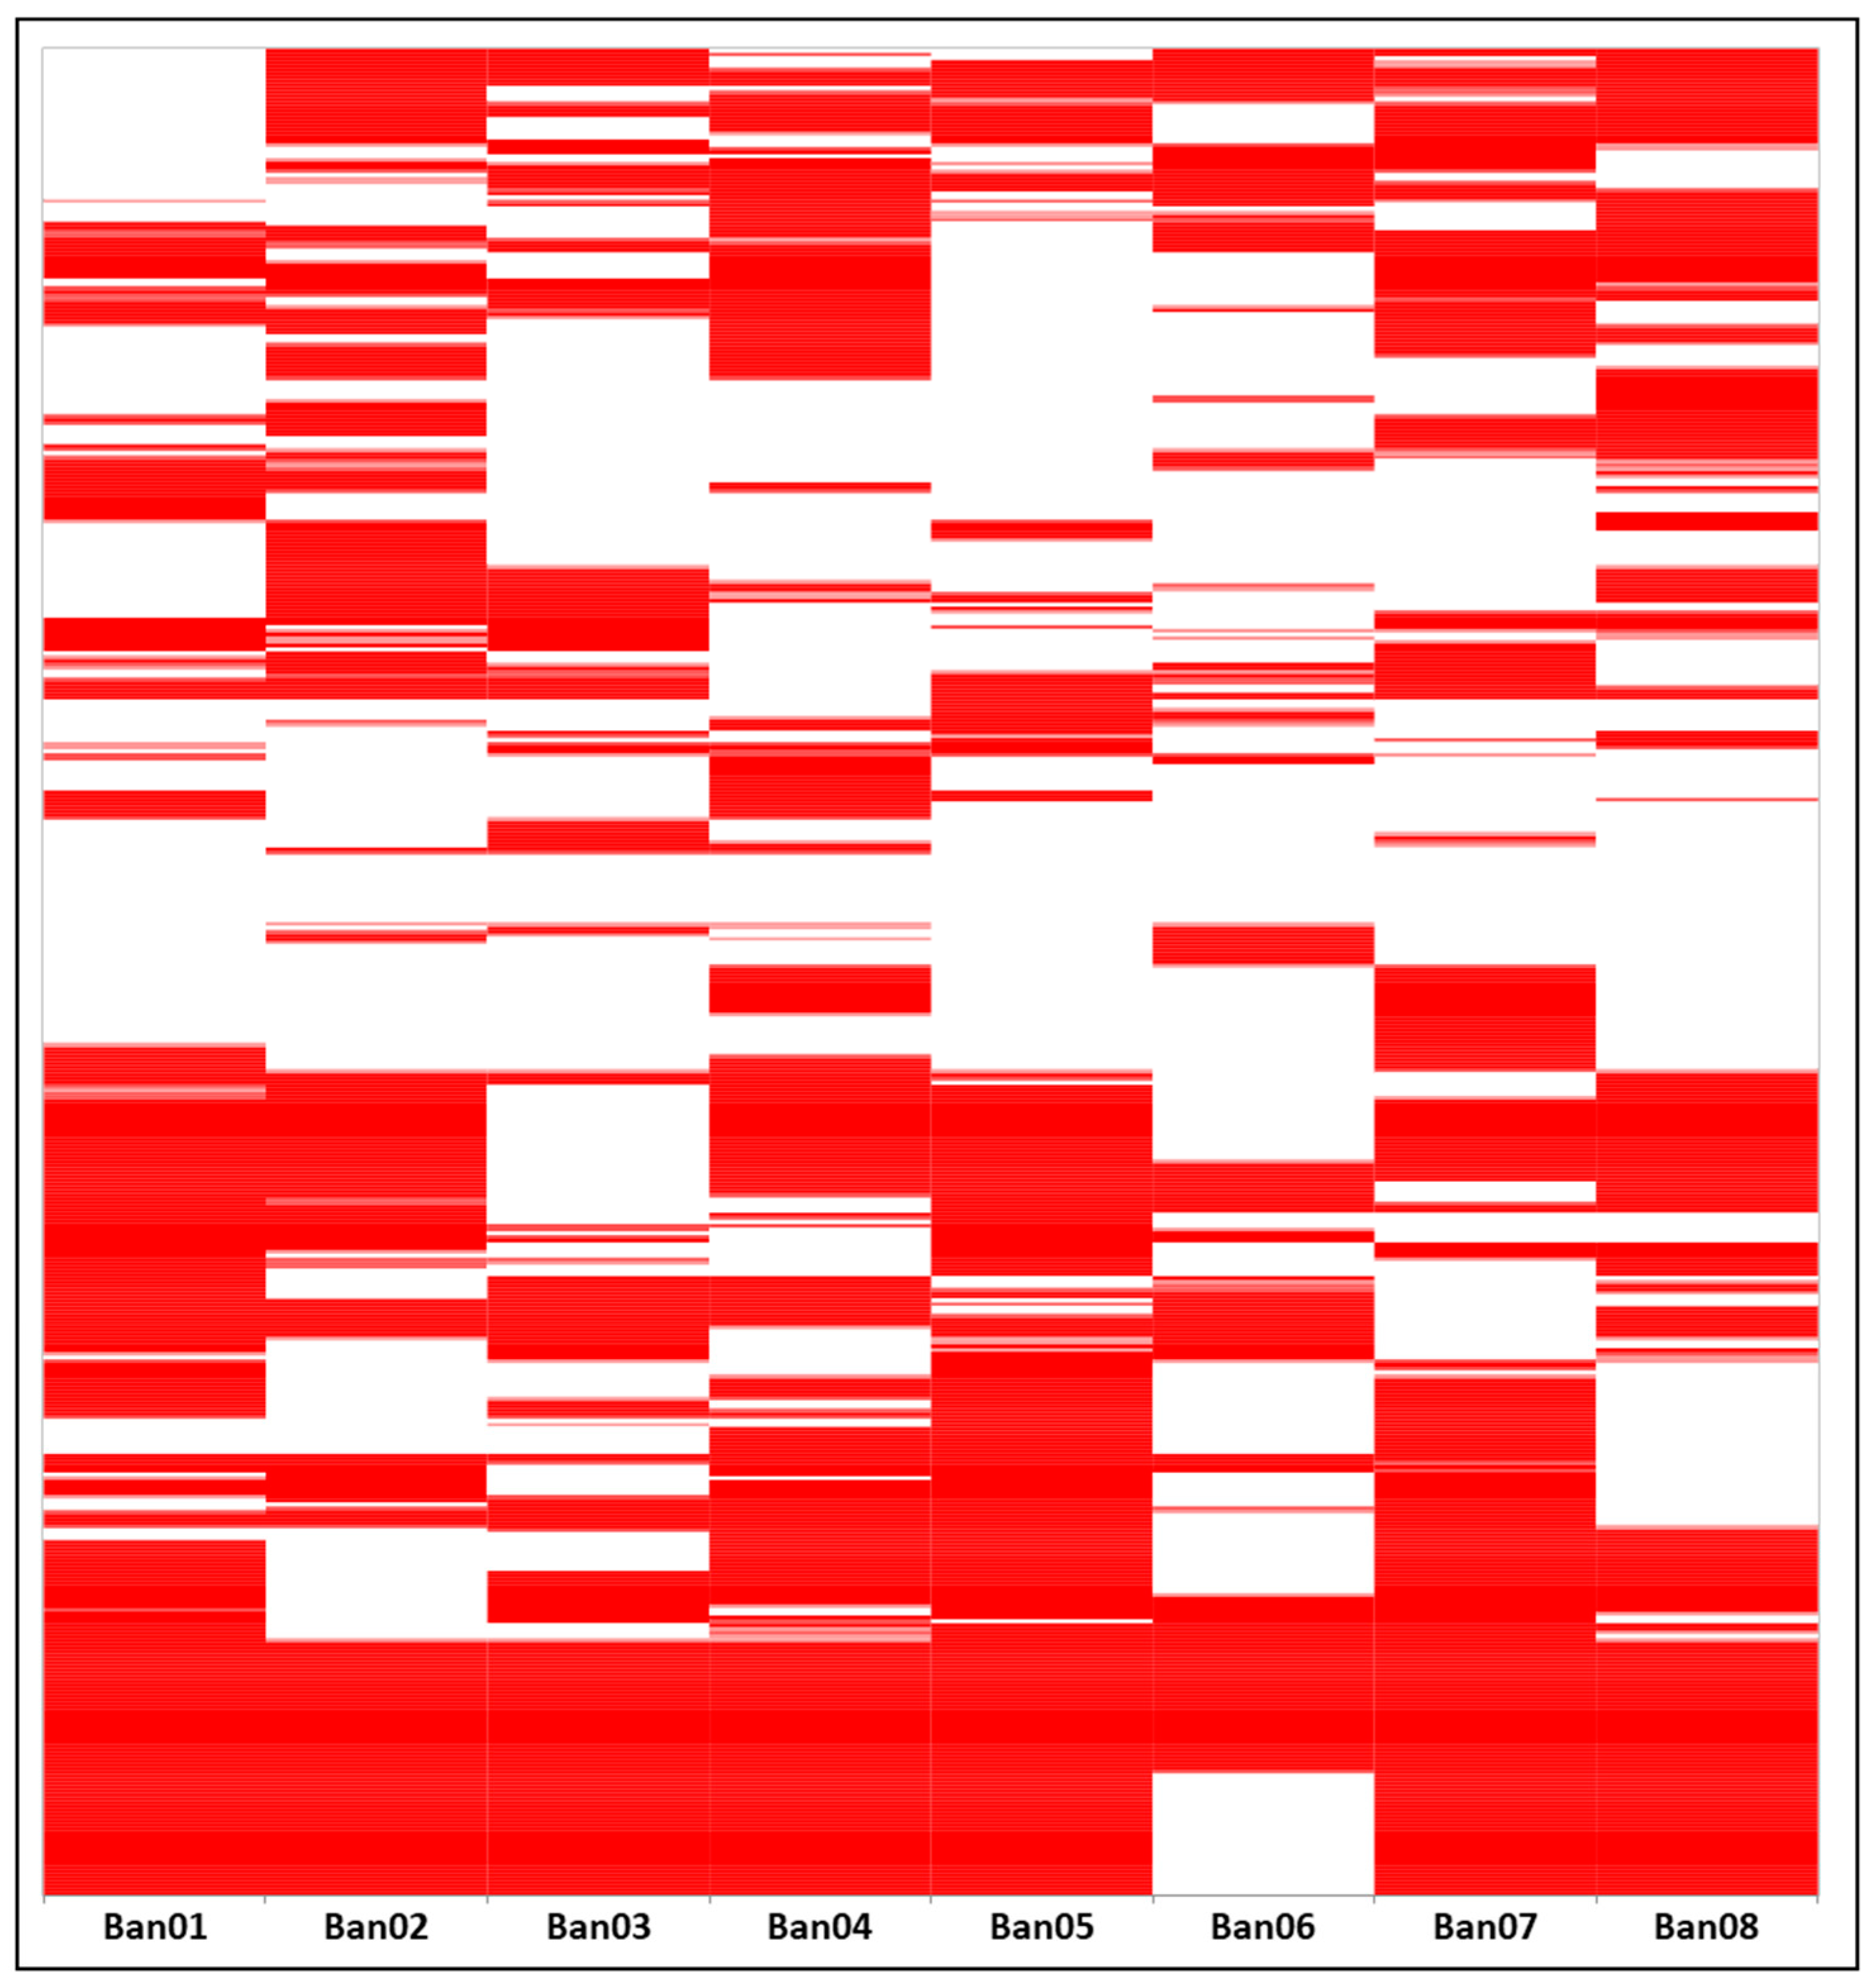
3.1. Fragment Analysis and Band Scoring

PCR amplification and fragment detection were successful for nine AFLP selective primer pairs. Among primer pairs, the average scored bands were 163 ± 35 bands ranging between 50 and 674 bp with an average size of 250 ± 78 bp (Supplementary Table S1). A weak significant negative correlation was found between fragment sizes and frequencies (r = −0.20; p < 0.00). Band scoring yielded a total number of 1468 bands with 162 monomorphic ones (88.96% polymorphism) for all primer pairs applied to the eight samples (Figure 1). After filtration, 136 loci (a band uniquely found in one sample, frequency below 13%) were removed to avoid bias, and 162 loci (locus found in all samples except for one, frequency above 87%) were removed and considered monomorphic. A total of 1008 loci were retained for further analysis.

3.2. Genetic Polymorphism and Diversity

Polymorphic bands for each location were 963, 862, and 571 for Dhamadh, Fifa, and Beesh areas, respectively. The effective number of alleles (ne) for all bulked samples combined was 1.46 ± 0.006. The expected heterozygosity under Hardy–Weinberg assumption (He) for all bulked samples combined was 0.249 ± 0.003. Samples from Dhamadh scored the highest ne (1.525 ± 0.01) and the highest He (0.292 ± 0.006) when FIS = 1. Samples from Beesh yielded the lowest ne (1.39 ± 0.013) and the lowest He (0.195 ± 0.006), while samples from Fifa scored 1.47 ± 0.010 for ne and 0.261 ± 0.006 for He (Table 3).

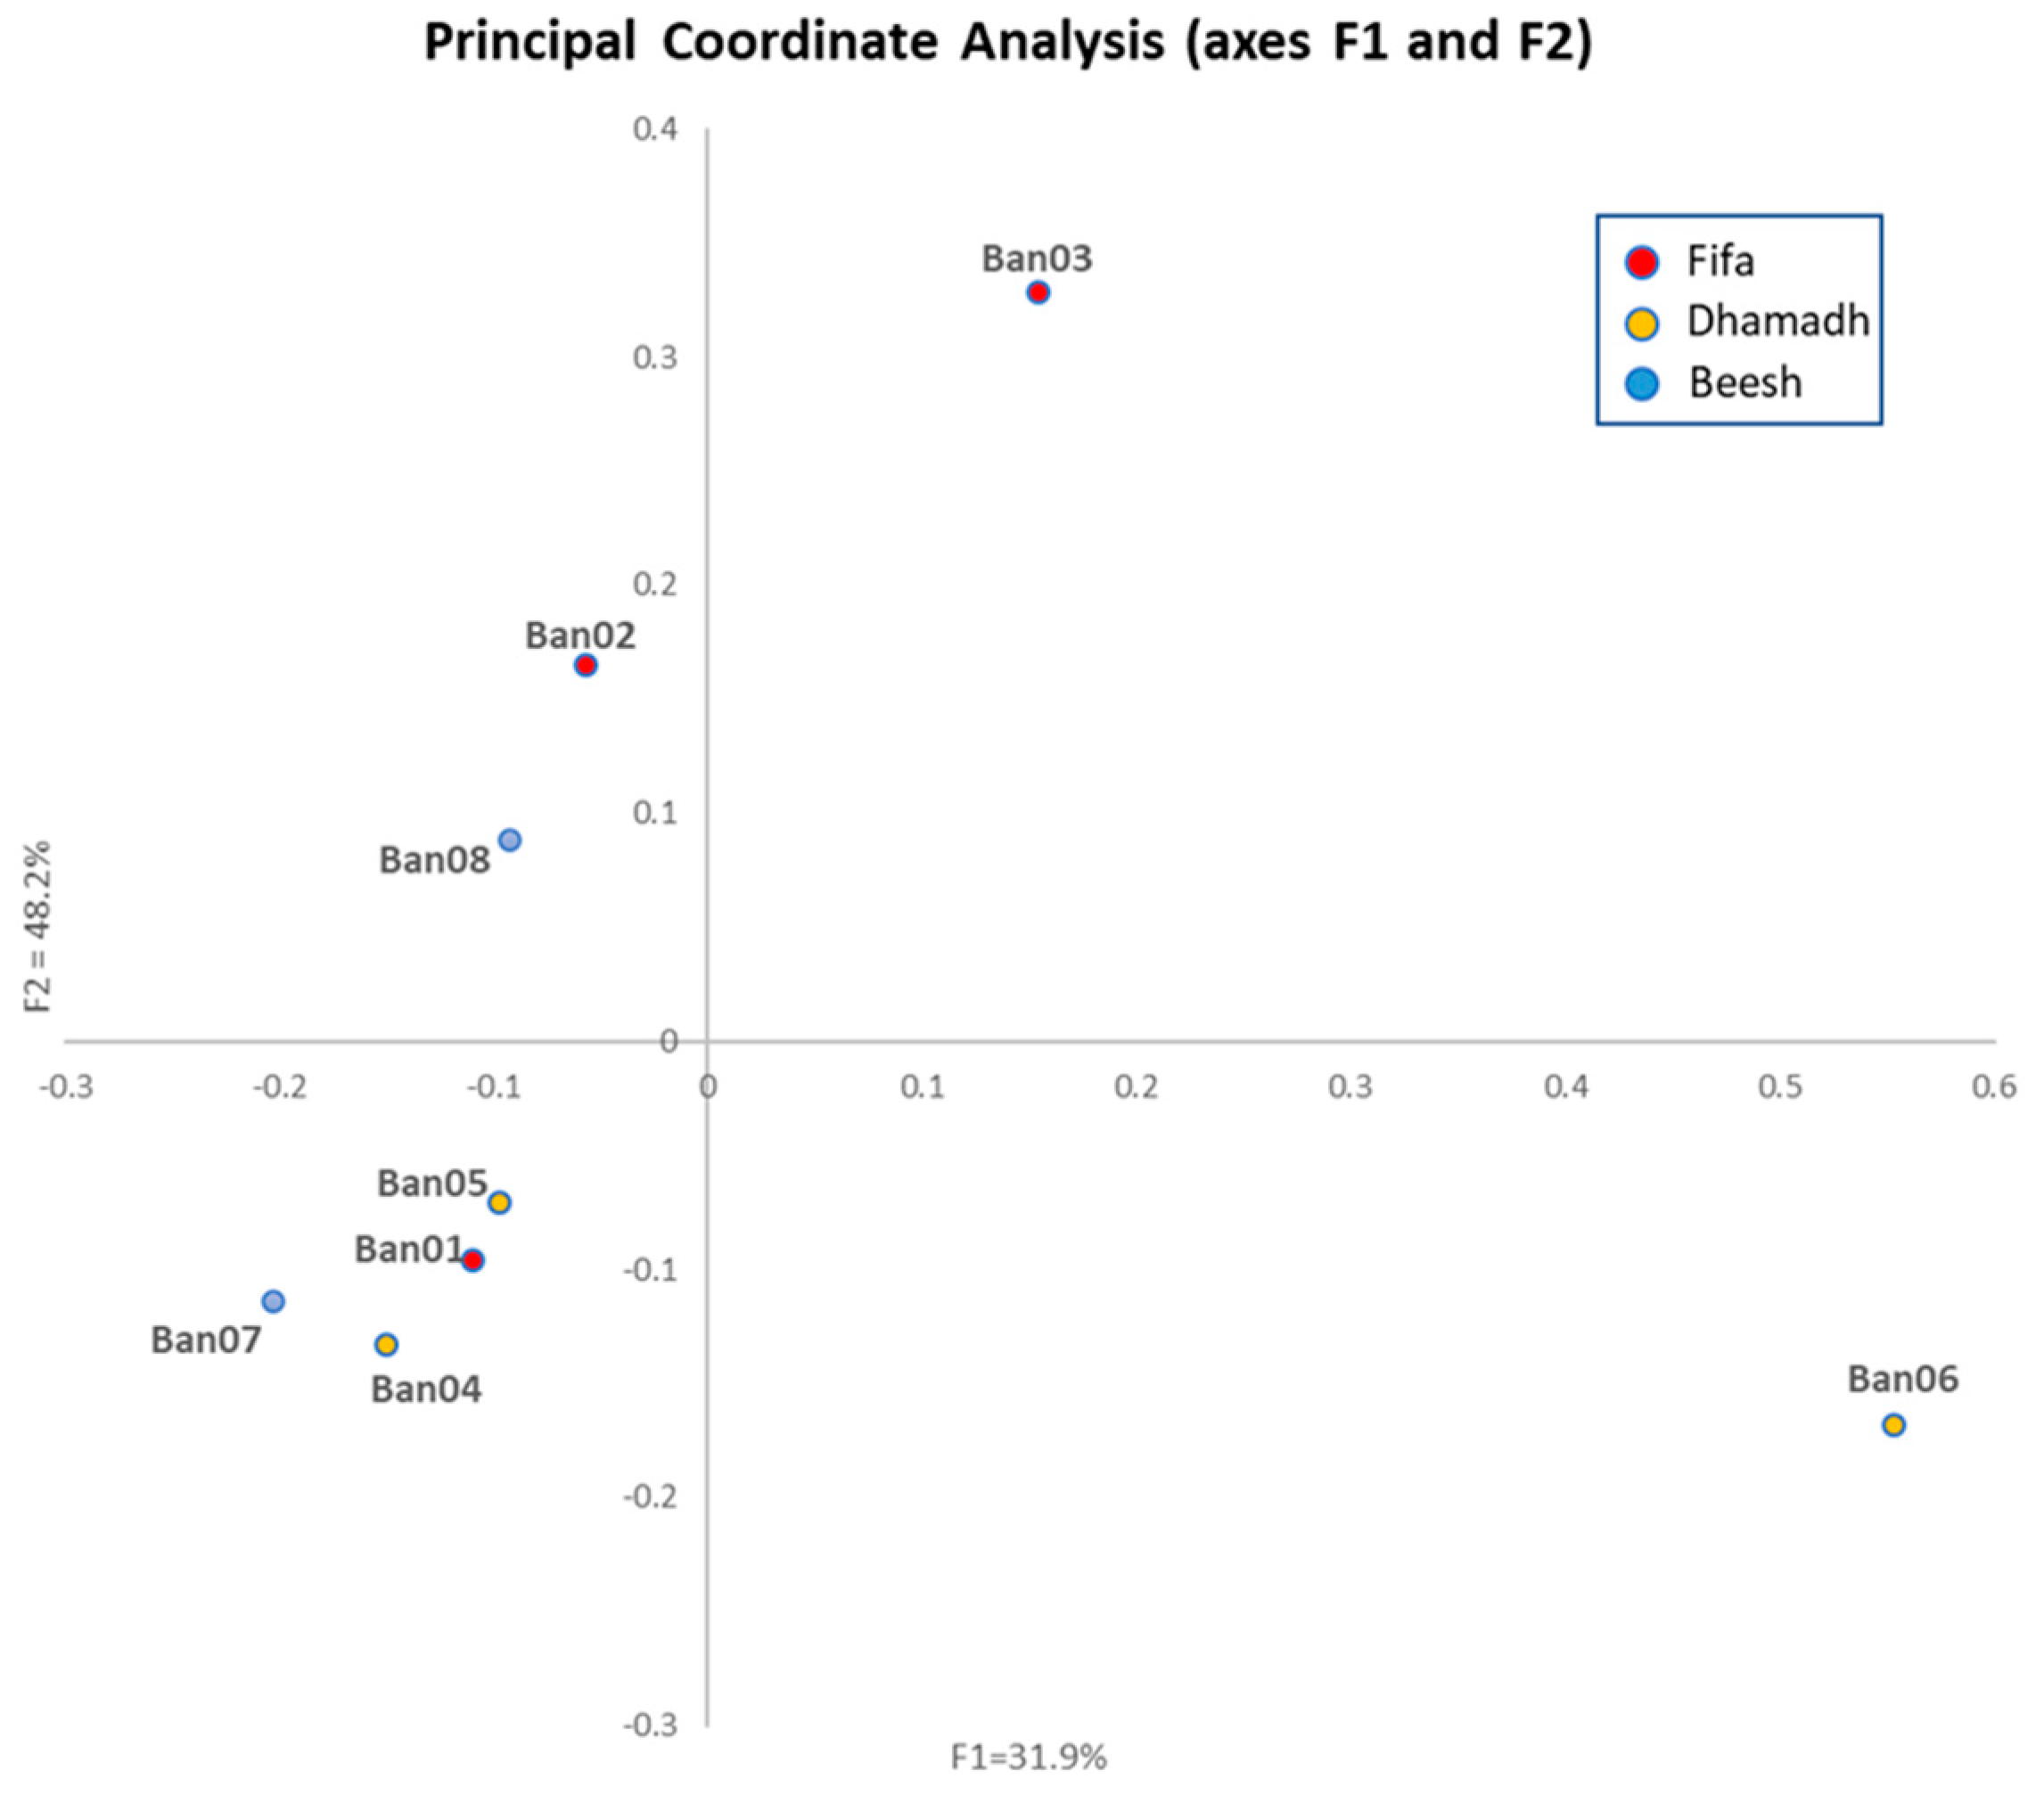
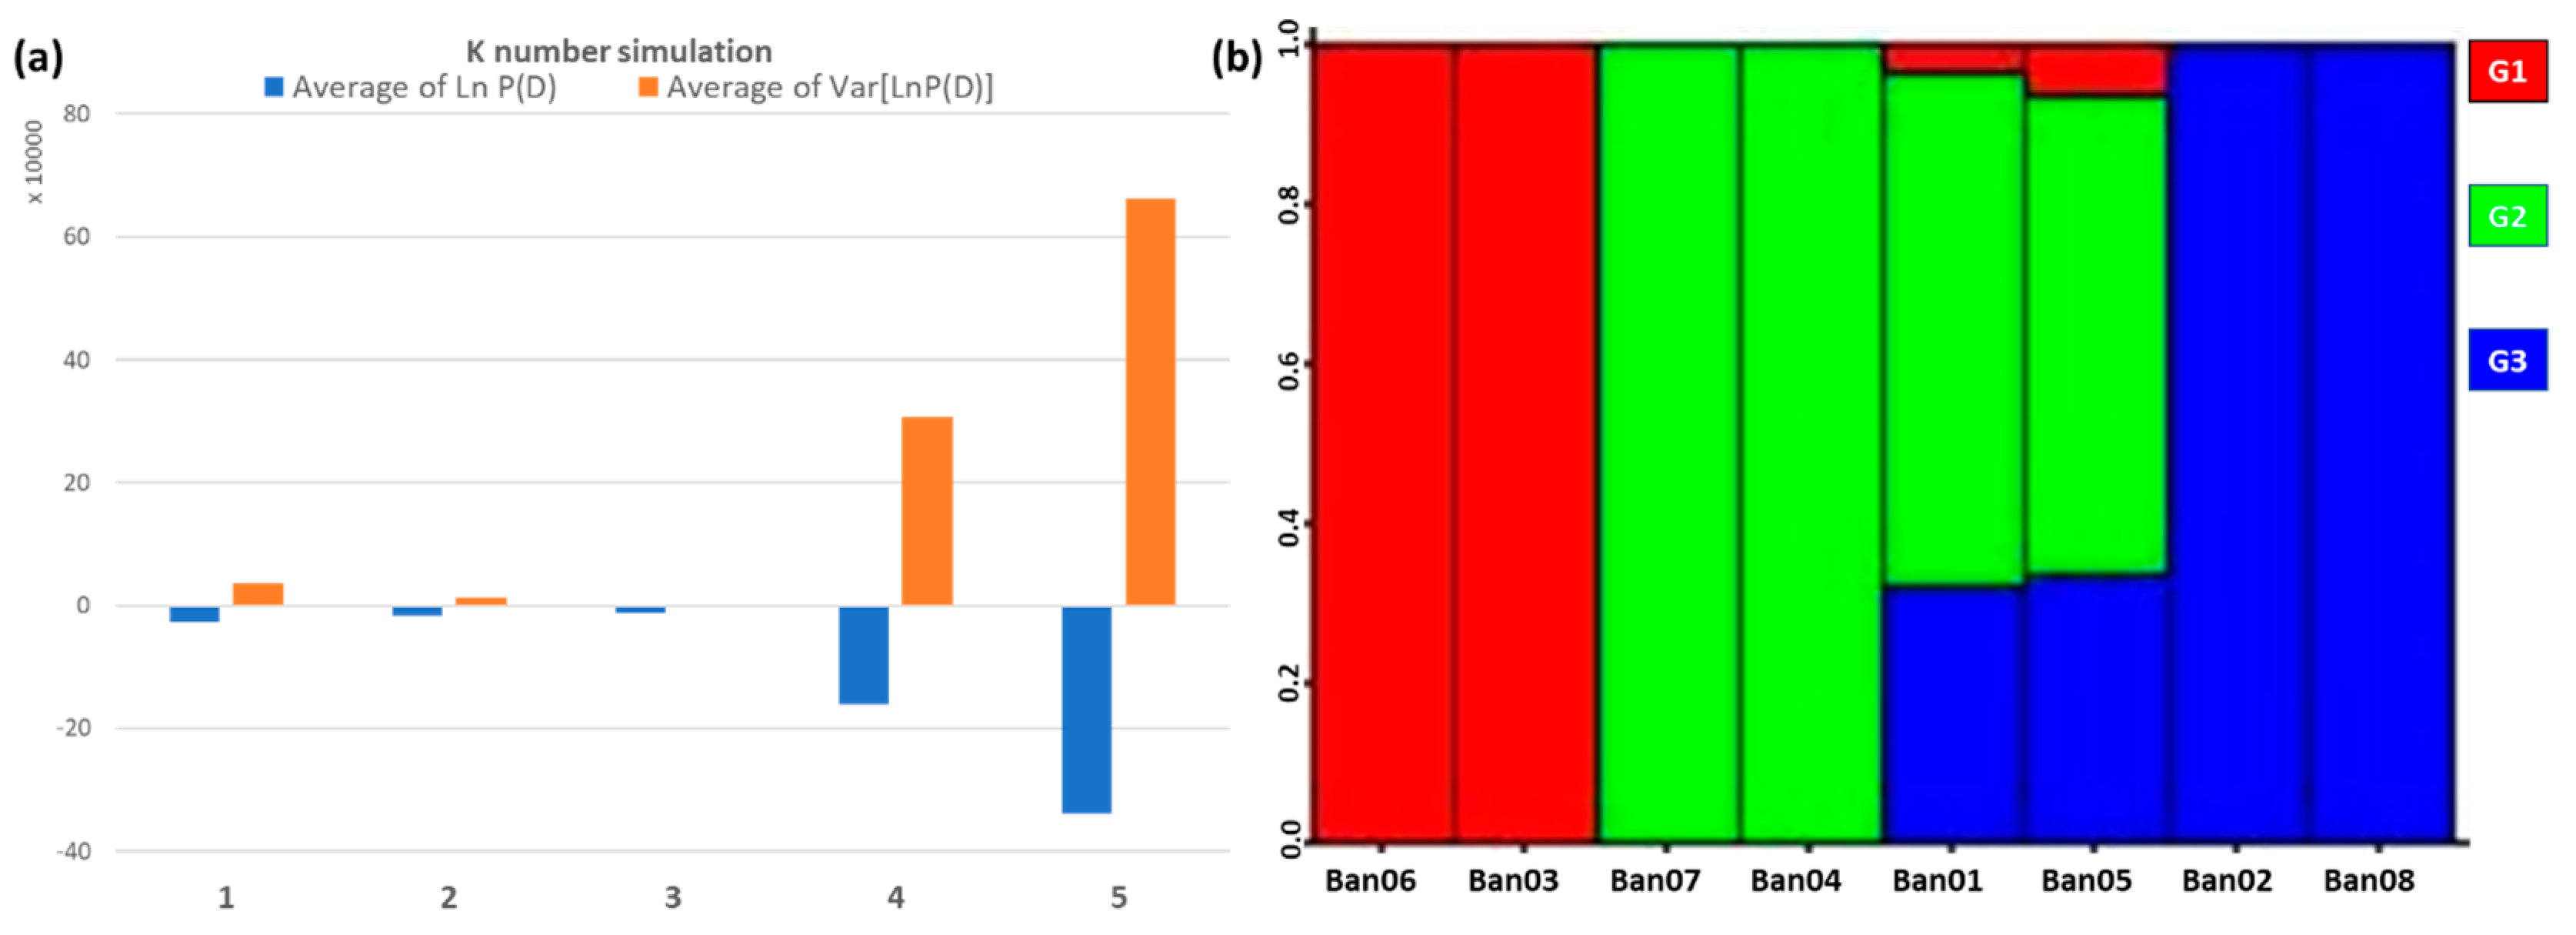
3.3. Population Structure

The dissimilarity genetic distance was calculated using the Jaccard coefficient; the distance ranged from 0.483 to 0.812. The two samples, Ban03 and Ban06, showed the highest dissimilarity values and were considered the most distant among all (Table 4). The principal coordinate analysis (PCoA) based on Jaccard genetic dissimilarity matrix showed non-location orientation. The demonstrated variation was between 31.9% (axis F1) and 48.2% (axis F2). The analyzed samples were clustered in pairs: Ban01 and Ban05, Ban04 and Ban07, both were clustered in the negative (x, y) quartile, the Ban02, and Ban08 in the negative x, positive y quartile, except for Ban03 plotted in the positive (x, y) quartile at a distance from Ban06 in the positive x, negative y quartile (Figure 2).
The average estimated Ln probability score with the lowest variance was calculated for sub-population number K = 3, indicating that the observed samples most probably originated from three sub-groups (Figure 3a). Again, the sample structure was not clustered by location. Group 1 defines Ban03 and Ban06 samples with 100% homogenized diversity both are two different cultivars, the Baladi and French cultivars, respectively. Group 2 represents Ban04 and Ban07 samples with 100% homogenized diversity; both samples are of the same cultivar (American cultivar). Finally, group 3 defines Ban02 and Ban08 samples with 100% homogenized diversity; both samples are of the same cultivar (Indian cultivar). The only two samples that showed heterogeneous diversity were Ban01 and Ban05 samples, both are known as the Red banana cultivar; both samples showed the highest diversity portion of group 2, followed by group 3 and a minimal portion from group 1, reflecting a hybrid status mainly occurred between the American and Indian cultivars (Figure 3b).

3.4. Genetic Differentiation and Geographical Influence

The genetic differentiation was tested using AMOVA to measure the changes in the pairwise differentiation of the ΦST among the studied location and the cultivars. A very low ΦST of 0.07 among locations was detected, partitioned into a 93% genetic variation originating within locations, while 7% of the genetic variation occurred among locations. On the other hand, a much higher ΦST of 0.28 among cultivars was detected, partitioned into a 71.05% genetic variation originating within groups, while 28.95% of the genetic variation occurred among cultivars (Table 5). Based on the FST for each locus compared to the observed heterozygosity, 162 outlier loci were detected, differentiating all cultivars and considered loci under selection among cultivars (Supplementary Table S2). The AMOVA test then scored the maximum ΦST value of 1.00, as of 100% genetic differentiation originating from the differences between the cultivars and none within each (Table 5).

4. Discussion

Future research directions may also be highlighted. Recently, banana cultivations were established in Jazan province, a temperate region in the southeastern parts of Saudi Arabia. In several surveys related to banana cultivation in the Middle East, Saudi Arabia was never considered (e.g., de Langhe [8]). However, nowadays, initiatives to increase banana cultivation have been reported (e.g., a 100,000 banana-trees cultivation project was started by local businesswomen in Jazan [30]). The huge number of imported cultivars has drawn the scientific community’s attention to study and analyze them, especially at the genetic level. Using DNA fingerprinting techniques combined with botanical and physiological assessments would provide a clear base for selection procedures and biological maintenance. Application of DNA fingerprinting on banana plants were previously reported, whether to identify genotypes among wild species and cultivars [31,32], to estimate genetic diversity among cultivars [33] or genotypes [34], to resolve the link between genotypes and morpho-based classification [21], or to identify of duplicate accessions and genetic fidelity testing [3].
A high number of variable markers is possible with the AFLP technique, allowing genome-wide analysis of genetic variability. In our study, based on nine AFLP primer pairs combinations, 1468 loci were detected, compared to Opara et al. [35], who yielded 1094 loci when applied 12 AFLP primer pairs combinations to study local banana cultivars in the southern region of Oman. A comparison confirms the reproducibility of the used combination in our analysis, as a lower number of combinations yielded a higher number of loci. In an additional study, 22 AFLP primer pairs applied on 21 accessions yielded 485 bands only with 46.18% polymorphism (e.g., Ahmad et al. [36]). Thus, choosing the primer pairs combinations is critical to saving time and cost while improving the marker reproducibility and robustness. Based on the high reading output and extensive statistical analysis, the genetic variability of the samples was expected to be more clearly reflected. The likelihood of detecting markers under selection is relatively high, either directly or because they are located near genes under selection. The mean expected heterozygosity under Hardy–Weinberg assumption (He) was 0.249, regardless of the unequal diversity levels detected among the locations, which reflect a high diversity level among the samples. In a similar study, Wang et al. [37] detected high levels of genetic diversity for the wild banana progenitor M. balbisiana population, where a similar He of 0.241 was estimated, even though wild specimens usually record much higher diversity than the cultivated ones [36].
Molecular data consisting of unlinked markers are used by Structure software to infer population structure using model-based clustering. In Jazan locations, a genetic structure was detected, even though it was proven to be influenced by the genetic background of the cultivars rather than the sampling locations. Patterns of phylogeography have been tested for banana plants in China by Ge et al. [38], and all the genetic diversity analyses confirmed the significant geographical structuring when comparing wild to cultivated banana populations. The samples of the Red banana cultivars showed mixed portions of other groups (inferred by color). It is normal to observe traces of other cultivars’ genetic diversity, possibly due to the banana’s ancestral origin. The heterogeneity is based on the American and Indian cultivars with almost an equal portion, suggesting a clear hybridization event between both cultivars. On the other side, genetically related samples in group 1 were from different geographical locations and cultivars, known as the Baladi and the French cultivars. While they originate from distant locations, both cultivars showed the same similarity membership coefficient (i.e., a value that assigns a sample to a particular group). However, the PCoA clarified the genetic distance among both as unequal cultivars, proving the importance of complementing the structure analysis with PCoA analysis to resolve the correct genetic clustering [35,36].
There is increasing interest in identifying genes or outlier loci that underlie adaptations to different factors in several species or in finding signatures of selection and domestication [39,40,41]. Outlier loci are revealed when populations differ at specific markers [40,42]. In the current study, 162 outliers were detected, and those loci participated in the development and selection of banana cultivars, which were indeed found to exhibit increased differentiation among locations along with no genetic variability detected within cultivars. Similar studies confirmed the potential of the AFLP technique to detect molecular markers to distinguish cultivars, subspecies, and wild banana accessions [21,32,35,36,37]. In the presence of noncoding DNA, some of the detected AFLP loci may simply show the signature of selection because they only are associated with the target [43]. The genome scan of banana cultivars from Jazan in Saudi Arabia offers an opportunity to uncover molecular markers for the selected cultivars even though the location and function of the detected outlier loci are uncertain. A reduced representation library of these cultivars’ genomes can be constructed using the AFLP primers used to amplify the outlier loci [44]. This perspective can help to thoroughly study those loci in nature and identify their role in the domestication of banana plants and cultivars.

Supplementary Materials

The following supporting information can be downloaded at: https://www.mdpi.com/article/10.3390/cimb45030116/s1, Table S1: Band scored by AFLP in eight banana cultivars from Jazan province; Table S2: Loci under selection analysis of the filtered AFLP dataset among the eight Banana samples from Jazan, Saudi Arabia.

Author Contributions

Conceptualization, F.A.S., S.M.A., D.S.A., M.A.A.H., D.A.E.-M.; methodology, F.A.S., S.M.A., D.S.A.; software, D.S.A., M.A.A.H., D.A.E.-M.; validation, F.A.S., S.M.A., D.S.A.; formal analysis, S.M.A., D.S.A., M.A.A.H.; investigation, M.A.A.H., D.A.E.-M.; resources, F.A.S., S.M.A., D.S.A.; data curation, M.A.A.H.; writing—original draft preparation, M.A.A.H., D.A.E.-M.; writing—review and editing, F.A.S., S.M.A., D.S.A., M.A.A.H., D.A.E.-M.; visualization, D.A.E.-M.; supervision, D.A.E.-M.; project administration, F.A.S. and S.M.A.; funding acquisition, F.A.S. and S.M.A. All authors have read and agreed to the published version of the manuscript.

Funding

Princess Nourah bint Abdulrahman University Researchers Supporting Project number (PNURSP2023R318), Princess Nourah bint Abdulrahman University, Riyadh, Saudi Arabia.

Institutional Review Board Statement

Not applicable.

Informed Consent Statement

Not applicable.

Data Availability Statement

Not applicable.

Acknowledgments

The authors are grateful to the Princess Nourah bint Abdulrahman University Researchers Supporting Project number (PNURSP2023R318), Princess Nourah bint Abdulrahman University, Riyadh, Saudi Arabia.

Conflicts of Interest

The authors declare no conflict of interest.

References

  1. Cronquist, A. The Evolution and Classification of Flowering Plants, 2nd ed.; New York Botanical Garden: Bronx, NY, USA, 1988; ISBN 978-0-89327-332-3. [Google Scholar]
  2. FAOSTAT. Available online: https://www.fao.org/faostat/en/#search/banana (accessed on 30 October 2022).
  3. Christelová, P.; De Langhe, E.; Hřibová, E.; Čížková, J.; Sardos, J.; Hušáková, M.; Van den houwe, I.; Sutanto, A.; Kepler, A.K.; Swennen, R.; et al. Molecular and Cytological Characterization of the Global Musa Germplasm Collection Provides Insights into the Treasure of Banana Diversity. Biodivers. Conserv. 2017, 26, 801–824. [Google Scholar] [CrossRef] [Green Version]
  4. Abd El-Moneim, D.; Dawood, M.F.A.; Moursi, Y.S. Positive and negative effects of nanoparticles on agricultural crops. Nanotechnol. Environ. Eng. 2021, 6, 21. [Google Scholar] [CrossRef]
  5. Kodym, A.; Zapata-Arias, F.J. Natural Light as an Alternative Light Source for the in Vitro Culture of Banana (Musa Acuminata Cv. ‘Grande Naine’). Plant Cell Tissue Organ Cult. 1998, 55, 141–145. [Google Scholar] [CrossRef]
  6. Mahadev, S.R.; Kathithachalam, A.; Marimuthu, M. An Efficient Protocol for Large-Scale Plantlet Production from Male Floral Meristems of Musa Spp. Cultivars Virupakshi and Sirumalai. Vitr. Cell. Dev. Biol. Plant 2011, 47, 611–617. [Google Scholar] [CrossRef]
  7. Heslop-Harrison, J.S.; Schwarzacher, T. Domestication, Genomics and the Future for Banana. Ann. Bot. 2007, 100, 1073–1084. [Google Scholar] [CrossRef] [PubMed] [Green Version]
  8. De Langhe, E.; Vrydaghs, L.; De Maret, P.; Perrier, X.; Denham, T. Why Bananas Matter: An Introduction to the History of Banana Domestication. Ethnobot. Res. Appl. 2009, 7, 165. [Google Scholar] [CrossRef] [Green Version]
  9. Ortiz, R. Morphological Variation in Musa Germplasm. Genet. Resour. Crop. Evol. 1997, 44, 393–404. [Google Scholar] [CrossRef]
  10. Pillay, M.; Ogundiwin, E.; Nwakanma, D.C.; Ude, G.; Tenkouano, A. Analysis of Genetic Diversity and Relationships in East African Banana Germplasm. Theor. Appl. Genet. 2001, 102, 965–970. [Google Scholar] [CrossRef]
  11. Pollefeys, P.; Sharrock, S.; Arnaud, E. Preliminary Analysis of the Literature on the Distribution of Wild Musa Species Using MGIS and DIVA-GIS; INIBAP-International Plant Genetic Resources Institute(IPGRI): Montpellier, France, 2004. [Google Scholar]
  12. Sardos, J.; Perrier, X.; Doležel, J.; Hřibová, E.; Christelová, P.; Van den houwe, I.; Kilian, A.; Roux, N. DArT Whole Genome Profiling Provides Insights on the Evolution and Taxonomy of Edible Banana (Musa Spp.). Ann. Bot 2016, 118, 1269–1278. [Google Scholar] [CrossRef] [Green Version]
  13. Lorenzen, J.; Hearne, S.; Mbanjo, G.; Nyine, M.; Close, T. Use of Molecular Markers in Banana and Plantain Improvement. Acta Hortic. 2011, 231–236. [Google Scholar] [CrossRef]
  14. Hinge, V.R.; Shaikh, I.M.; Chavhan, R.L.; Deshmukh, A.S.; Shelake, R.M.; Ghuge, S.A.; Dethe, A.M.; Suprasanna, P.; Kadam, U.S. Assessment of Genetic Diversity and Volatile Content of Commercially Grown Banana (Musa Spp.) Cultivars. Sci. Rep. 2022, 12, 7979. [Google Scholar] [CrossRef] [PubMed]
  15. Ruangsuttapha, S.; Eimert, K.; Schröder, M.-B.; Silayoi, B.; Denduangboripant, J.; Kanchanapoom, K. Molecular Phylogeny of Banana Cultivars from Thailand Based on HAT-RAPD Markers. Genet. Resour. Crop. Evol. 2007, 54, 1565–1572. [Google Scholar] [CrossRef]
  16. D’Hont, A.; Denoeud, F.; Aury, J.-M.; Baurens, F.-C.; Carreel, F.; Garsmeur, O.; Noel, B.; Bocs, S.; Droc, G.; Rouard, M.; et al. The Banana (Musa Acuminata) Genome and the Evolution of Monocotyledonous Plants. Nature 2012, 488, 213–217. [Google Scholar] [CrossRef] [PubMed] [Green Version]
  17. Esmail, S.M.; Aboulila, A.A.; Abd El-Moneim, D. Variation in several pathogenesis-related (PR) protein genes in wheat (Triticum aestivum) involved in defense against Puccinia striiformis f. sp. tritici. Physiol. Mol. Plant Pathol. 2020, 112, 101545. [Google Scholar] [CrossRef]
  18. Drapal, M.; de Carvalho, E.B.; Rouard, M.; Amah, D.; Sardos, J.; Van den Houwe, I.; Brown, A.; Roux, N.; Swennen, R.; Fraser, P.D. Metabolite Profiling Characterises Chemotypes of Musa Diploids and Triploids at Juvenile and Pre-Flowering Growth Stages. Sci. Rep. 2019, 9, 4657. [Google Scholar] [CrossRef] [Green Version]
  19. Ude, G.; Pillay, M.; Nwakanma, D.; Tenkouano, A. Analysis of Genetic Diversity and Sectional Relationships in Musa Using AFLP Markers. Theor. Appl. Genet. 2002, 104, 1239–1245. [Google Scholar] [CrossRef]
  20. Ude, G.; Pillay, M.; Nwakanma, D.; Tenkouano, A. Genetic Diversity in Musa Acuminata Colla and Musa Balbisiana Colla and Some of Their Natural Hybrids Using AFLP Markers. Theor. Appl. Genet. 2002, 104, 1246–1252. [Google Scholar] [CrossRef]
  21. Loh, J.P.; Kiew, R.; Set, O.; Gan, L.H.; Gan, Y.-Y. Amplified Fragment Length Polymorphism Fingerprinting of 16 Banana Cultivars (Musa Cvs.). Mol. Phylogenet. Evol. 2000, 17, 360–366. [Google Scholar] [CrossRef]
  22. Khemira, H.; Mars, M. Fig Production in Subtropical South-Western Saudi Arabia. Acta Hortic. 2017, 169–172. [Google Scholar] [CrossRef]
  23. Safhi, F.A.; ALshamrani, S.M.; Jalal, A.S.; Abd El-Moneim, D.; Alyamani, A.A.; Ibrahim, A.A. Genetic Characterization of Some Saudi Arabia’s Accessions from Commiphora gileadensis Using Physio-Biochemical Parameters, Molecular Markers, DNA Barcoding Analysis and Relative Gene Expression. Genes 2022, 13, 2099. [Google Scholar] [CrossRef]
  24. Vos, P.; Hogers, R.; Bleeker, M.; Reijans, M.; van de Lee, T.; Hornes, M.; Friters, A.; Pot, J.; Paleman, J.; Kuiper, M.; et al. AFLP: A New Technique for DNA Fingerprinting. Nucl. Acids Res. 1995, 23, 4407–4414. [Google Scholar] [CrossRef] [Green Version]
  25. Bonin, A.; Ehrich, D.; Manel, S. Statistical Analysis of Amplified Fragment Length Polymorphism Data: A Toolbox for Molecular Ecologists and Evolutionists. Mol. Ecol. 2007, 16, 3737–3758. [Google Scholar] [CrossRef]
  26. Abd El-Moneim, D.A.; Mohamed, I.N.; Belal, A.H.; Atta, M.E. Screening bread wheat genotypes for drought tolerance: 1-Germination, radical growth and mean performance of yield and its components. Ann. Agric. Sci. 2008, 53, 171–181. [Google Scholar]
  27. Schluter, P.M.; Harris, S.A. Analysis of Multilocus Fingerprinting Data Sets Containing Missing Data. Mol. Ecol Notes 2006, 6, 569–572. [Google Scholar] [CrossRef]
  28. Mesfer, A.S.; Safhi, F.A.; Alshaya, D.S.; Ibrahim, A.A.; Mansour, H.; Abd El Moneim, D. Genetic diversity using biochemical, physiological, karyological and molecular markers of Sesamum indicum L. Front. Genet. 2022, 13, 1035977. [Google Scholar] [CrossRef] [PubMed]
  29. Excoffier, L.; Lischer, H.E.L. Arlequin Suite Ver 3.5: A New Series of Programs to Perform Population Genetics Analyses under Linux and Windows. Mol. Ecol. Resour. 2010, 10, 564–567. [Google Scholar] [CrossRef] [PubMed]
  30. Abd El-Moneim, D.; ELsarag, E.I.S.; Aloufi, S.; El-Azraq, A.M.; ALshamrani, S.M.; Safhi, F.A.A.; Ibrahim, A.A. Quinoa (Chenopodium quinoa Willd.): Genetic Diversity According to ISSR and SCoT Markers, Relative Gene Expression, and Morpho-Physiological Variation under Salinity Stress. Plants 2021, 10, 2802. [Google Scholar] [CrossRef] [PubMed]
  31. Kaemmer, D.; Afza, R.; Weising, K.; Kahl, G.; Novak, F.J. Oligonucleotide and Amplification Fingerprinting of Wild Species and Cultivars of Banana (Musa Spp.). Nat. Biotechnol. 1992, 10, 1030–1035. [Google Scholar] [CrossRef] [PubMed]
  32. Wong, C. Genetic Diversity of the Wild Banana Musa Acuminata Colla in Malaysia as Evidenced by AFLP. Ann. Bot. 2001, 88, 1017–1025. [Google Scholar] [CrossRef] [Green Version]
  33. Jarret, R.L.; Vuylsteke, D.R.; Gawel, N.J.; Pimentel, R.B.; Dunbar, L.J. Detecting Genetic Diversity in Diploid Bananas Using PCR and Primers from a Highly Repetitive DNA Sequence. Euphytica 1993, 68, 69–76. [Google Scholar] [CrossRef]
  34. Creste, S.; Tulmann Neto, A.; Vencovsky, R.; de Oliveira Silva, S.; Figueira, A. Genetic Diversity of Musa Diploid and Triploid Accessions from the Brazilian Banana Breeding Program Estimated by Microsatellite Markers. Genet. Resour. Crop. Evol. 2004, 51, 723–733. [Google Scholar] [CrossRef]
  35. Opara, U.L.; Jacobson, D.; Al-Saady, N.A. Analysis of Genetic Diversity in Banana Cultivars (Musa Cvs.) from the South of Oman Using AFLP Markers and Classification by Phylogenetic, Hierarchical Clustering and Principal Component Analyses. J. Zhejiang Univ. Sci. B 2010, 11, 332–341. [Google Scholar] [CrossRef] [PubMed] [Green Version]
  36. Ahmad, F.; Megia, R.; Poerba, Y.S. Genetic Diversity of Musa Balbisiana Colla in Indonesia Based on AFLP Marker. HAYATI J. Biosci. 2014, 21, 39–47. [Google Scholar] [CrossRef] [Green Version]
  37. Wang, X.-L.; Chiang, T.-Y.; Roux, N.; Hao, G.; Ge, X.-J. Genetic Diversity of Wild Banana (Musa Balbisiana Colla) in China as Revealed by AFLP Markers. Genet. Resour. Crop. Evol. 2007, 54, 1125–1132. [Google Scholar] [CrossRef]
  38. Ge, X.J.; Liu, M.H.; Wang, W.K.; Schaal, B.A.; Chiang, T.Y. Population Structure of Wild Bananas, Musa Balbisiana, in China Determined by SSR Fingerprinting and CpDNA PCR-RFLP: Population structure of wild bananas. Mol. Ecol. 2005, 14, 933–944. [Google Scholar] [CrossRef] [PubMed]
  39. Bonin, A. Explorative Genome Scan to Detect Candidate Loci for Adaptation Along a Gradient of Altitude in the Common Frog (Rana Temporaria). Mol. Biol. Evol. 2006, 23, 773–783. [Google Scholar] [CrossRef] [PubMed]
  40. Magdy, M.; Werner, O.; McDaniel, S.; Goffinet, B.; Ros, R. Genomic Scanning Using AFLP to Detect Loci under Selection in the Moss Funaria Hygrometrica along a Climate Gradient in the Sierra Nevada Mountains, Spain. Plant. Biol. 2016, 18, 280–288. [Google Scholar] [CrossRef]
  41. Magdy, M.; Eshak, M.G.; Rashed, M.A.-S. Genetic Structure of Mugil Cephalus L. Populations from the Northern Coast of Egypt. Vet. World 2016, 9, 53. [Google Scholar] [CrossRef] [Green Version]
  42. Storz, J.F. INVITED REVIEW: Using Genome Scans of DNA Polymorphism to Infer Adaptive Population Divergence: Genome scans and adaptive population divergence. Mol. Ecol. 2005, 14, 671–688. [Google Scholar] [CrossRef]
  43. Schlötterer, C. Hitchhiking Mapping—Functional Genomics from the Population Genetics Perspective. Trends Genet. 2003, 19, 32–38. [Google Scholar] [CrossRef]
  44. Hohenlohe, P.A.; Catchen, J.; Cresko, W.A. Population Genomic Analysis of Model and Nonmodel Organisms Using Sequenced RAD Tags. In Data Production and Analysis in Population Genomics; Pompanon, F., Bonin, A., Eds.; Methods in Molecular BiologyTM; Humana Press: Totowa, NJ, USA, 2012; Volume 888, pp. 235–260. ISBN 978-1-61779-869-6. [Google Scholar]
Figure 1. Heatmap of the binary scored bands for nine primer pairs applied to eight banana samples.
Cimb 45 00116 g001
Figure 2. PCoA based on the Jaccard genetic distance matrix among the eight banana samples.
Cimb 45 00116 g002
Figure 3. Bayesian inference of AFLP binary data using Structure software. The triplicates average for each K number was used to estimate Ln P(D) average and variance (a). The bar plot of the diversity portion for each of the eight samples is based on the three detected groups (k = 3; (b)).
Cimb 45 00116 g003
Table 1. Banana cultivars ID, names, species, and sampling locations from Jazan province.
Sample IDCultivar NameSpecies NameLocation
Ban01Red BananaMusa acuminataFifa
Ban02Indian BananaMusa acuminataFifa
Ban03Baladi BananaMusa acuminataFifa
Ban04American BananaMusa paradisiacaDhamadh
Ban05Red BananaMusa acuminataDhamadh
Ban06French BananaMusa acuminataDhamadh
Ban07American BananaMusa paradisiacaBeesh
Ban08Indian BananaMusa acuminataBeesh
Table 2. Sequences of primers and adaptors that were used to establish the AFLP-PCR technique.
TypeEcoRI5′-Sequence-3′MseI5′-Sequence-′3
AdaptorsA1CTCGTAGACTGCGTACCA1GACGATGAGTCCTGAG
A2AATTGGTACGCAGTCA2TACTCAGGACTCAT
1st PCR+AGACTGCGTACCAATTCA+CGATGAGTCCTGAGTAC
Selective PCR+ACAFAM-GACTGCGTACCAATTCAA+CTCGATGAGTCCTGAGCTC
+AGGHEX-GACTGCGTACCAATTCAG+CTAGATGAGTCCTGAGCTA
+ATACY3-GACTGCGTACCAATTCAA+CTTGATGAGTCCTGAGCTT
Table 3. Genetic diversity and DNA polymorphism based on AFLP bands.
Parameter/Location Fifa
(Ban01–03)
Dhamadh
(Ban04–06)
Beesh
(Ban07–08)
Overall
Number of polymorphic bands8629635711008
Mean effective number of alleles (ne)1.4701.5251.3901.461
Standard deviation (ne)0.0100.0100.0130.006
Mean heterozygosity (He)0.2610.2920.1950.249
Standard deviation (He)0.0060.0060.0060.003
Table 4. Jaccard dissimilarity genetic distance matrix between all the eight Banana samples.
Jaccard *Ban01Ban02Ban03Ban04Ban05Ban06Ban07Ban08
Ban0100.5710.6360.5280.4920.7610.5220.541
Ban020.57100.620.5650.560.7550.5770.483
Ban030.6360.6200.6420.6180.710.6470.636
Ban040.5280.5650.64200.5170.7730.4470.551
Ban050.4920.560.6180.51700.750.5130.532
Ban060.7610.7550.710.7730.7500.8120.762
Ban070.5220.5770.6470.4470.5130.81200.556
Ban080.5410.4830.6360.5510.5320.7620.5560
* The red-to-green gradient reflects the minimum to the maximum genetic distance between 0.00 to 1.00, respectively.
Table 5. Genetic differentiation through AMOVA of banana samples based on the AFLP loci dataset.
DatasetComparison SchemeGroupsAmong Groups (Va)Within Groups (Vb)ΦST (p < 0.00)
All AFLPAmong locations37%93%0.07
Among cultivars428.95%71.05%0.28
OutliersAmong cultivars4100%0%1.00
Disclaimer/Publisher’s Note: The statements, opinions and data contained in all publications are solely those of the individual author(s) and contributor(s) and not of MDPI and/or the editor(s). MDPI and/or the editor(s) disclaim responsibility for any injury to people or property resulting from any ideas, methods, instructions or products referred to in the content.

