

Impact of the m.13513G>A Variant on the Functions of the OXPHOS System and Cell Retrograde Signaling
 , , and
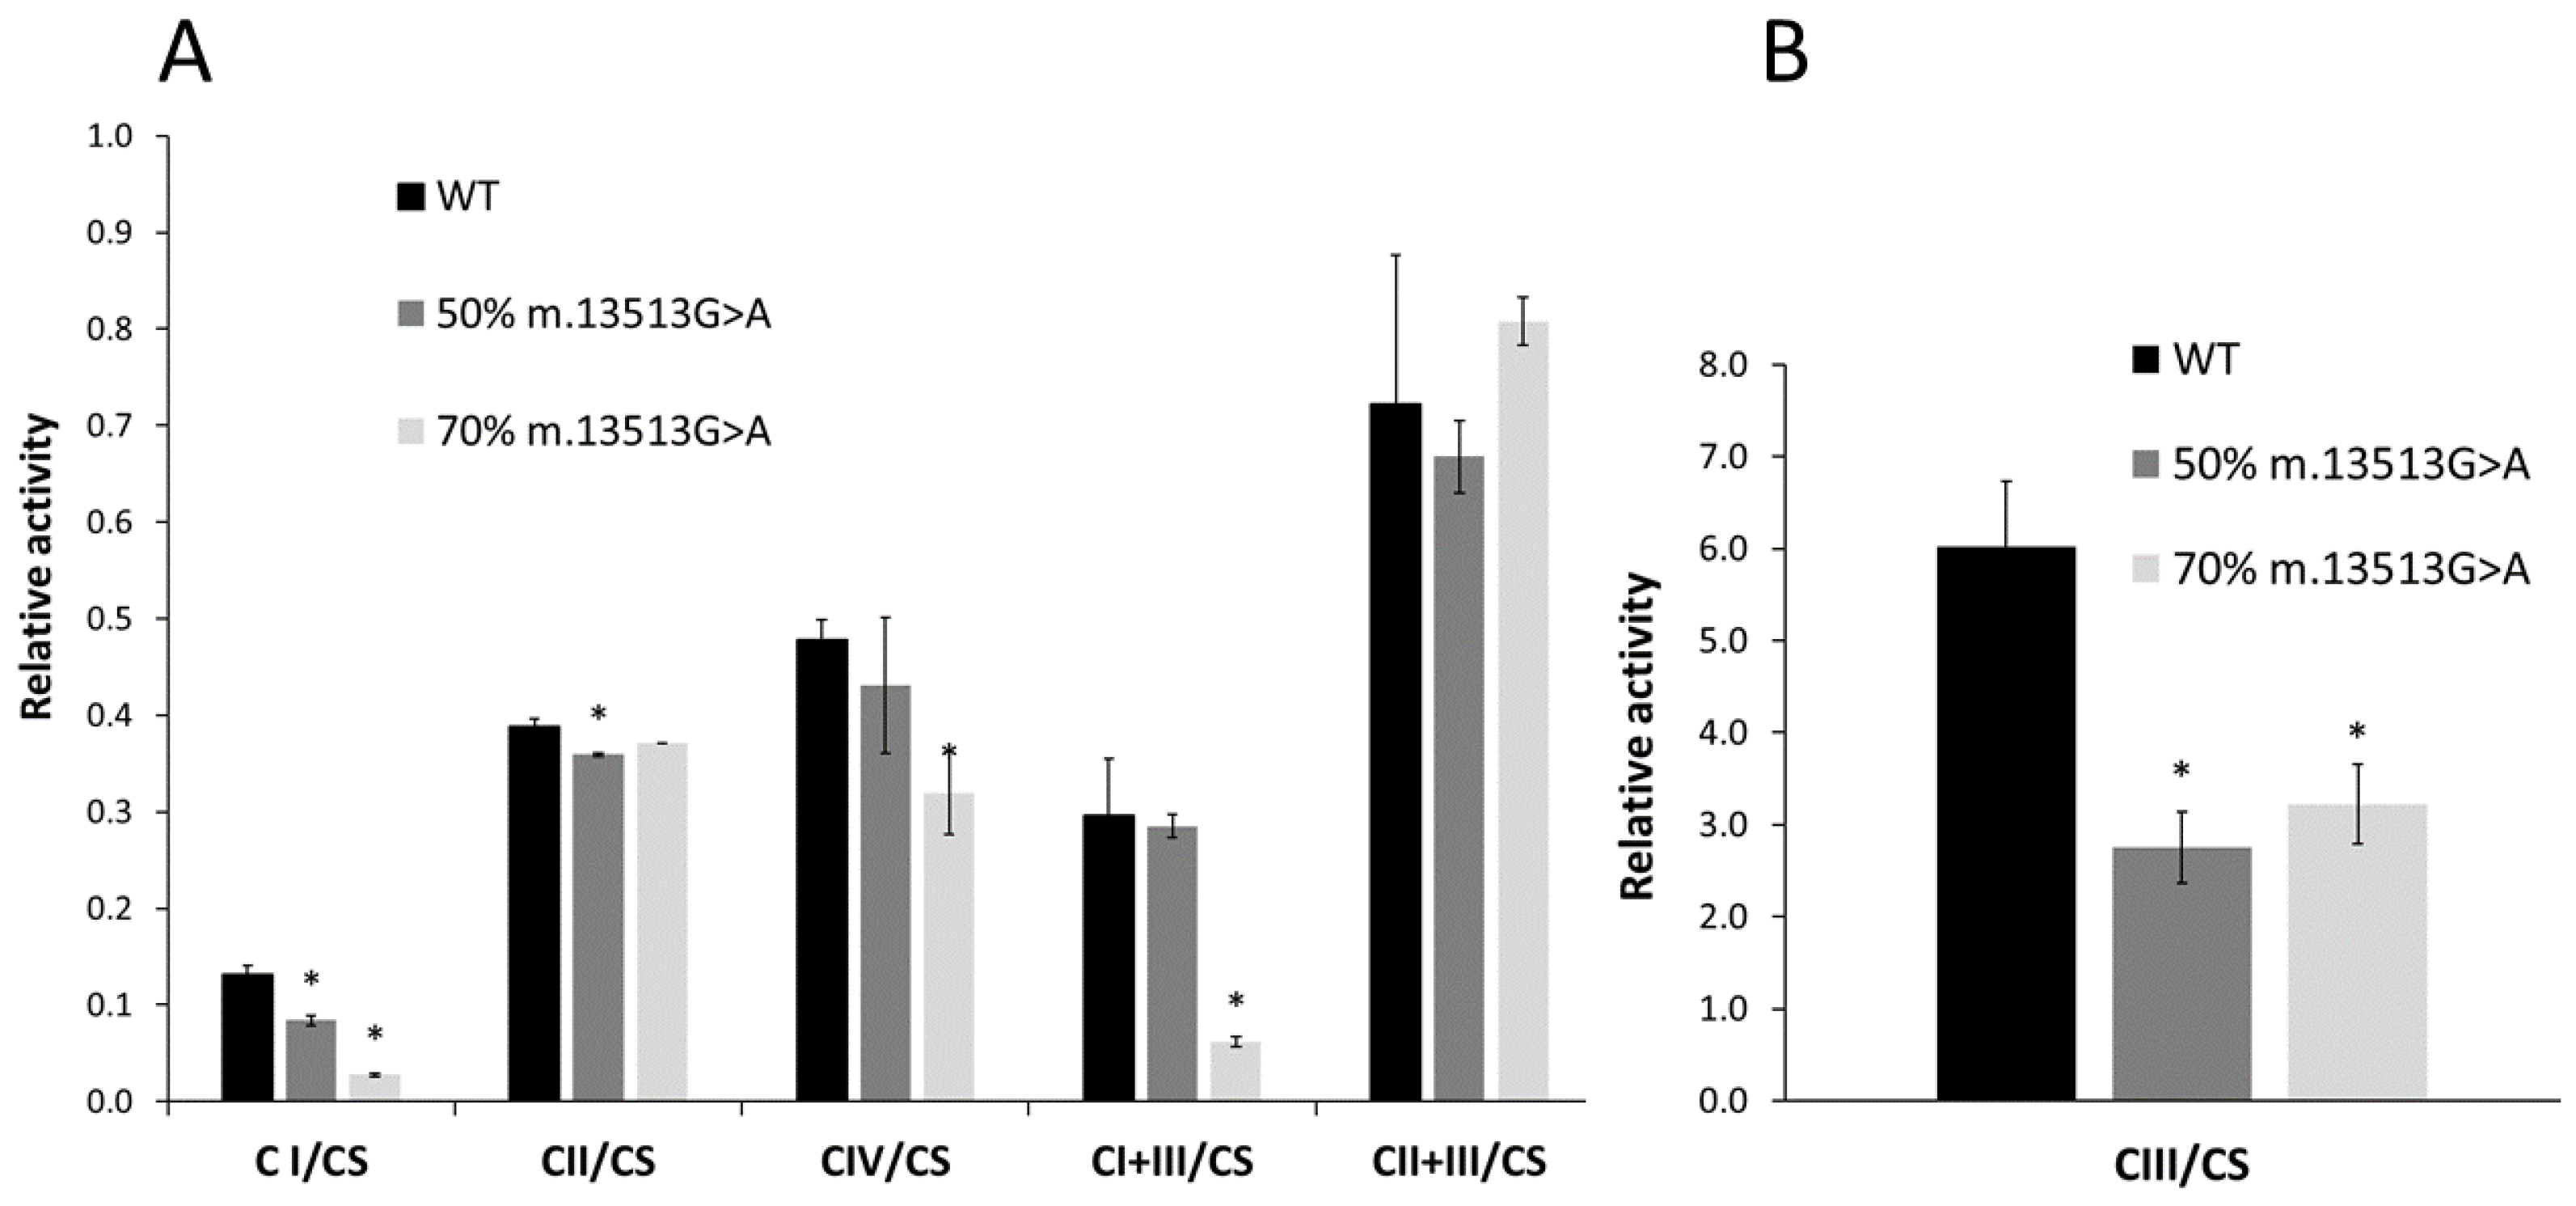
Abstract
:1. Introduction
2. Materials and Methods
2.1. Recruitment of Participants and Ethics Statement
2.2. Cell Culture, Generation of ρ0 Cells, and Construction of Cybrids
2.3. Mitochondria Isolation
2.4. Enzyme Measurements
2.5. High-Resolution Respirometry
2.6. RNA Sample Preparation and Next Generation Sequencing
2.7. Bioinformatic Analysis
2.8. Selfie-Digital RT-PCR
3. Results
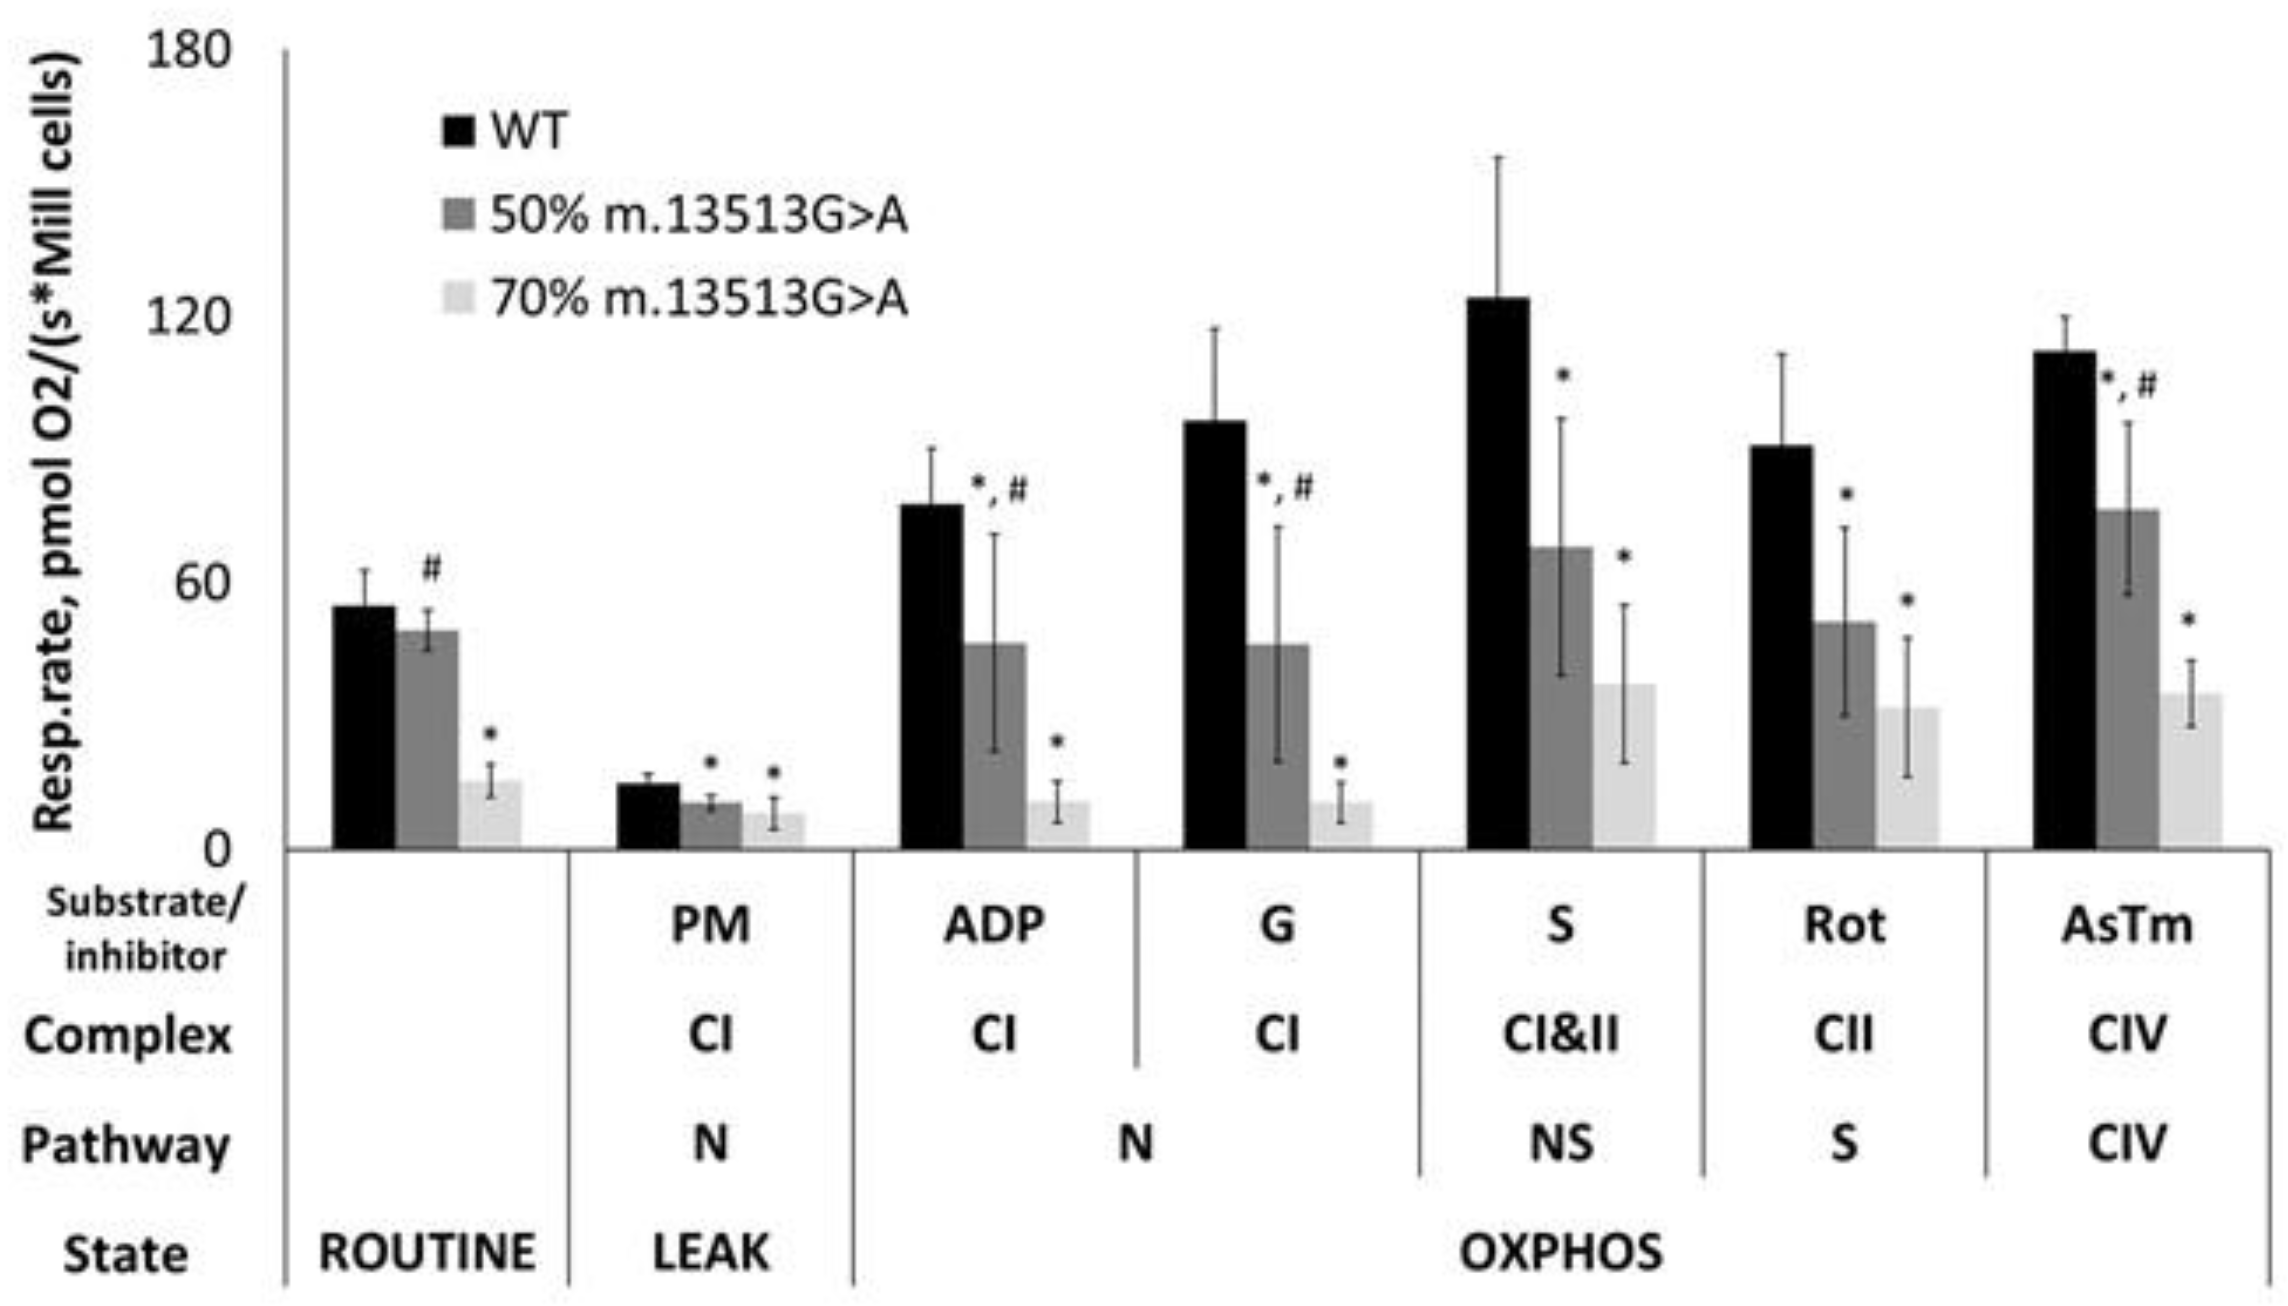
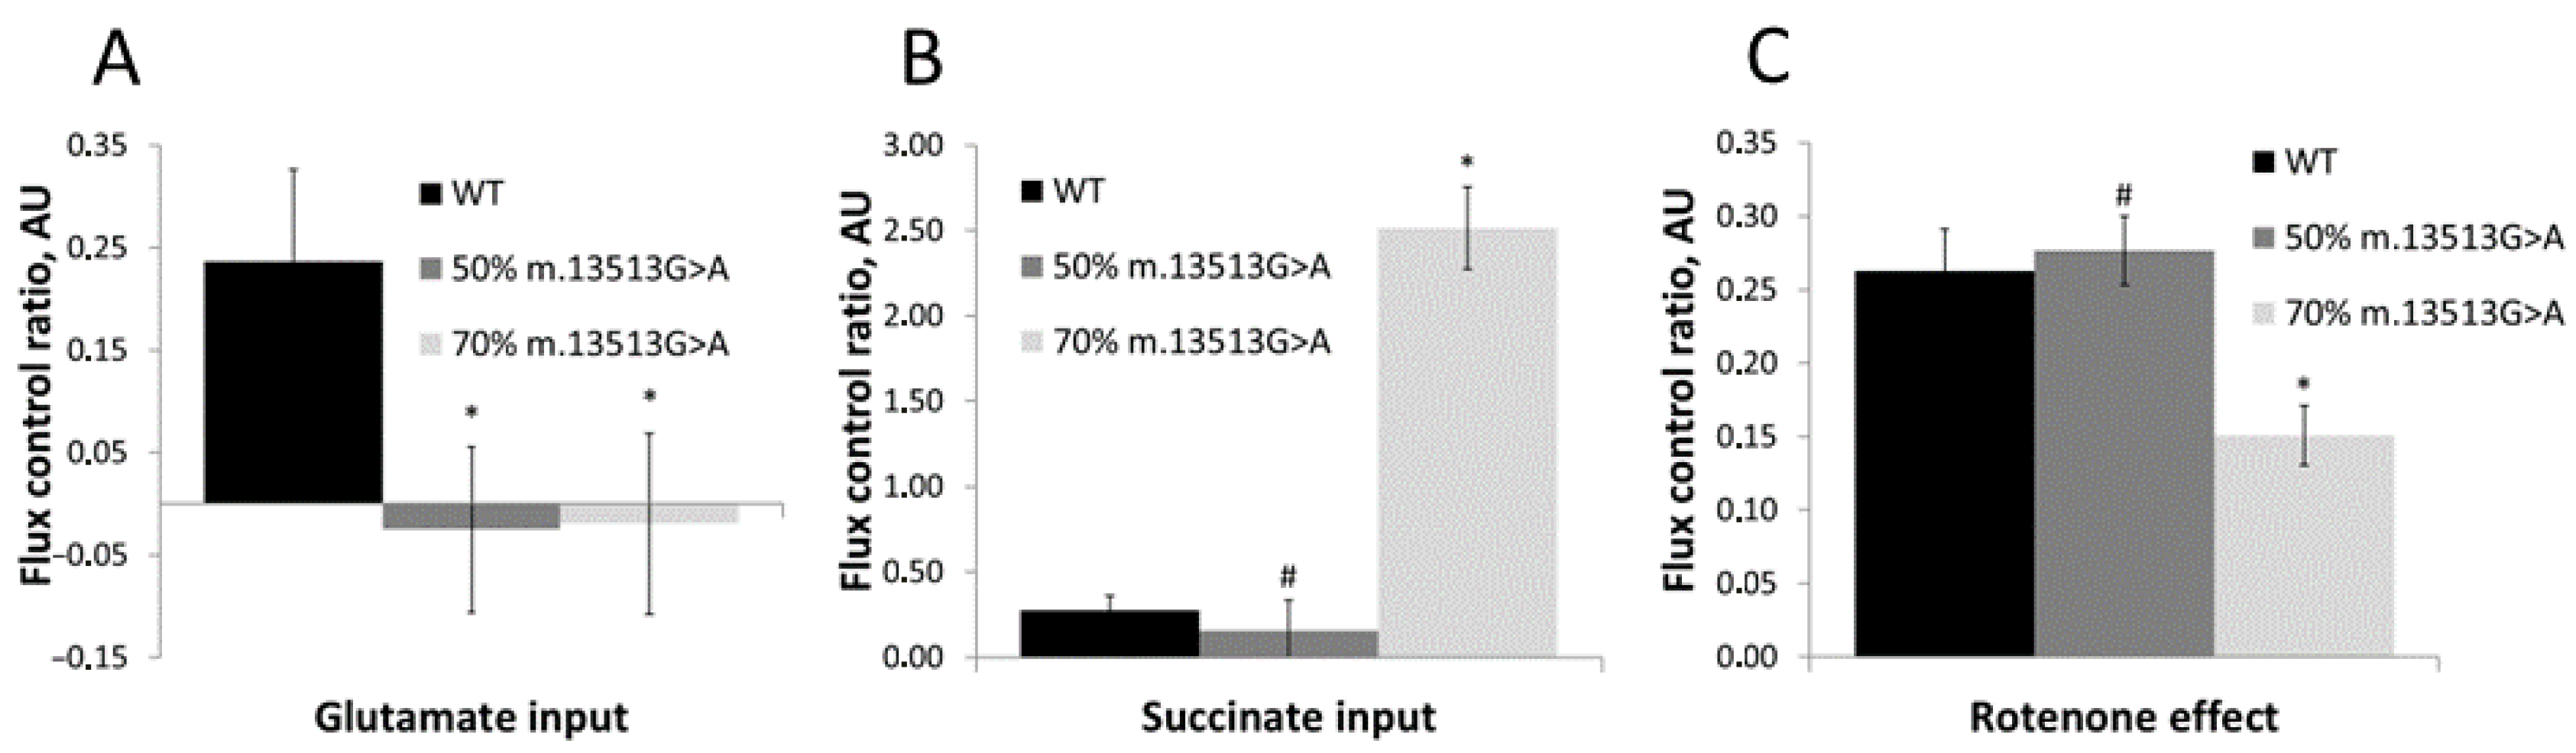
3.1. Functionality of the OXPHOS System
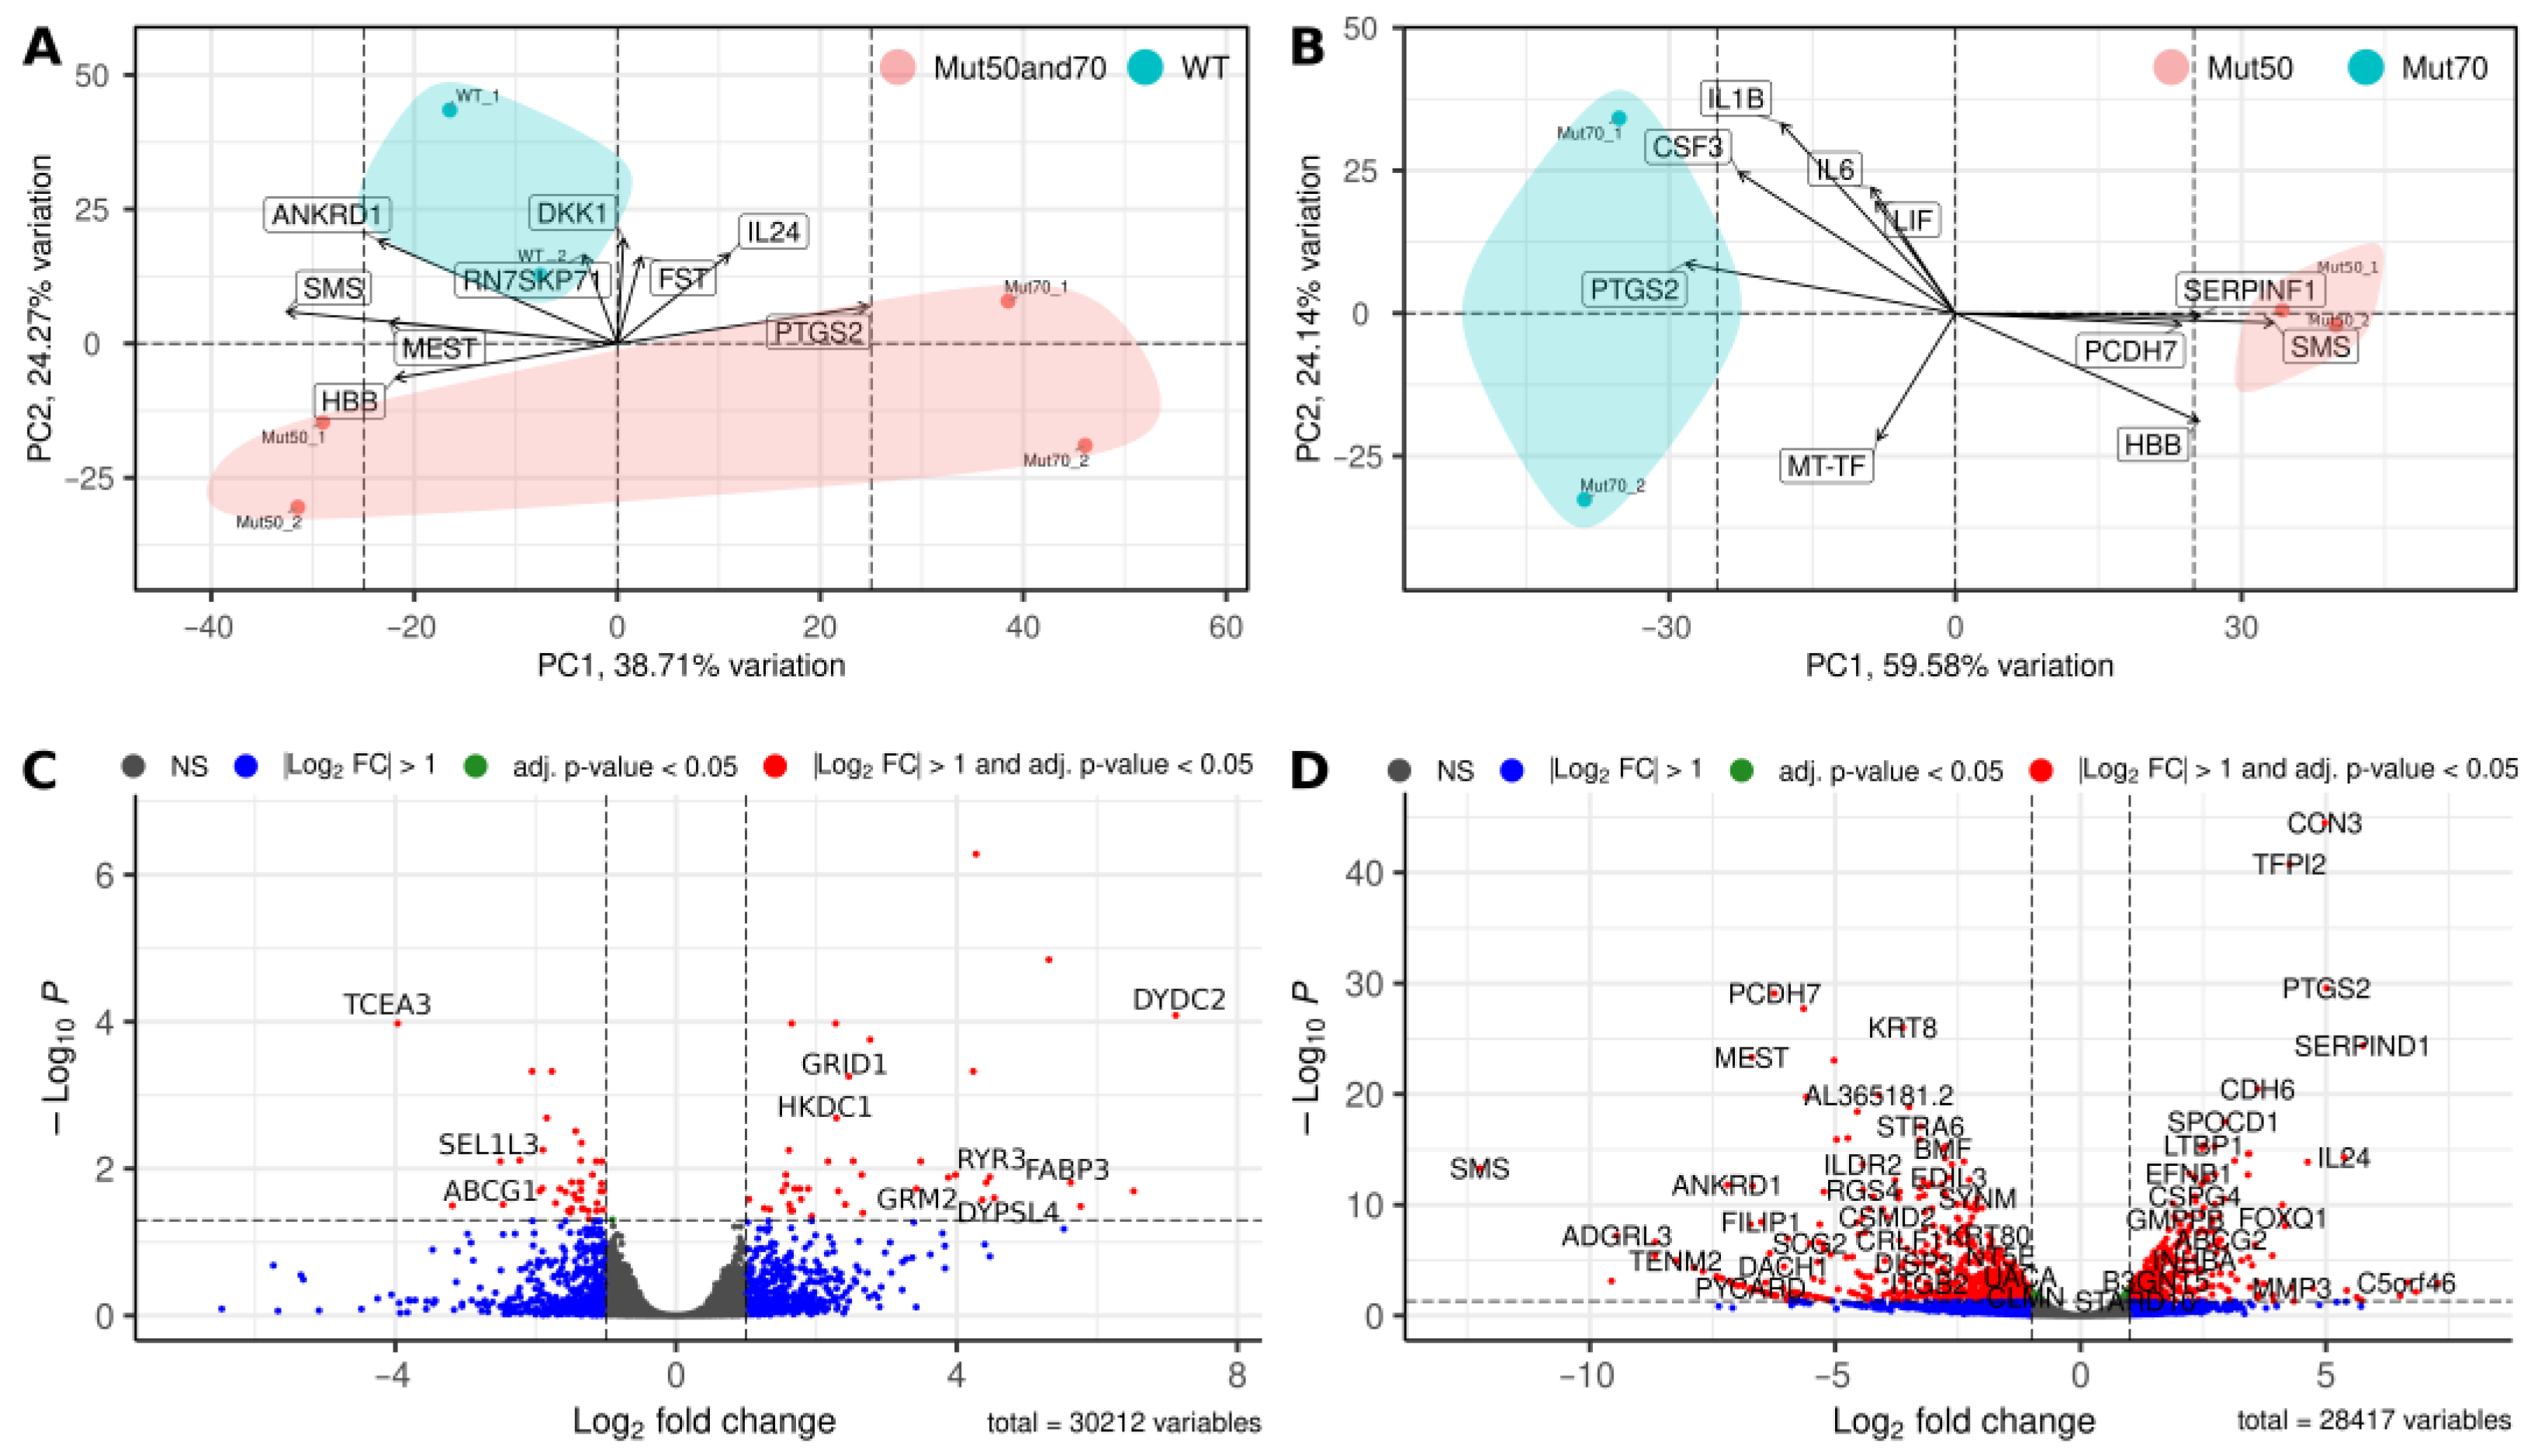
3.2. Effect of the Pathogenic mtDNA Variant on Differential Gene Expression
4. Discussion
Supplementary Materials
Author Contributions
Funding
Institutional Review Board Statement
Informed Consent Statement
Data Availability Statement
Acknowledgments
Conflicts of Interest
References
- John, P.; Whatley, F.R. Paracoccus Denitrificans and the Evolutionary Origin of the Mitochondrion. Nature 1975, 254, 495–498. [Google Scholar] [CrossRef]
- Deluca, H.F.; Engstrom, G.W. Calcium Uptake by Rat Kidney Mitochondria. Proc. Natl. Acad. Sci. USA 1961, 47, 1744–1750. [Google Scholar] [CrossRef] [Green Version]
- Sancak, Y.; Markhard, A.L.; Kitami, T.; Kovács-Bogdán, E.; Kamer, K.J.; Udeshi, N.D.; Carr, S.A.; Chaudhuri, D.; Clapham, D.E.; Li, A.A.; et al. EMRE is an Essential Component of the Mitochondrial Calcium Uniporter Complex. Science 2013, 342, 1379–1382. [Google Scholar] [CrossRef] [Green Version]
- McBride, H.M.; Neuspiel, M.; Wasiak, S. Mitochondria: More than Just a Powerhouse. Curr. Biol. CB 2006, 16, R551–R560. [Google Scholar] [CrossRef] [Green Version]
- Lax, N.Z.; Turnbull, D.M.; Reeve, A.K. Mitochondrial Mutations: Newly Discovered Players in Neuronal Degeneration. Neuroscientist 2011, 17, 645–658. [Google Scholar] [CrossRef]
- Koopman, W.J.H.; Willems, P.H.G.M.; Smeitink, J.A.M. Monogenic Mitochondrial Disorders. N. Engl. J. Med. 2012, 366, 1132–1141. [Google Scholar] [CrossRef] [Green Version]
- Kroemer, G.; Galluzzi, L.; Brenner, C. Mitochondrial Membrane Permeabilization in Cell Death. Physiol. Rev. 2007, 87, 99–163. [Google Scholar] [CrossRef]
- Hockenbery, D.; Nuñez, G.; Milliman, C.; Schreiber, R.D.; Korsmeyer, S.J. Bcl-2 is an Inner Mitochondrial Membrane Protein That Blocks Programmed Cell Death. Nature 1990, 348, 334–336. [Google Scholar] [CrossRef]
- Edinger, A.L.; Thompson, C.B. Death by Design: Apoptosis, Necrosis and Autophagy. Curr. Opin. Cell Biol. 2004, 16, 663–669. [Google Scholar] [CrossRef]
- Butow, R.A.; Avadhani, N.G. Mitochondrial Signaling: The Retrograde Response. Mol. Cell 2004, 14, 1–15. [Google Scholar] [CrossRef]
- da Cunha, F.M.; Torelli, N.Q.; Kowaltowski, A.J. Mitochondrial Retrograde Signaling: Triggers, Pathways, and Outcomes. Oxid. Med. Cell. Longev. 2015, 2015, 482582. [Google Scholar] [CrossRef] [Green Version]
- Walker, B.R.; Moraes, C.T. Nuclear-Mitochondrial Interactions. Biomolecules 2022, 12, 427. [Google Scholar] [CrossRef]
- Srinivasan, V.; Kriete, A.; Sacan, A.; Jazwinski, S.M. Comparing the Yeast Retrograde Response and NF-ΚB Stress Responses: Implications for Aging. Aging Cell 2010, 9, 933–941. [Google Scholar] [CrossRef] [Green Version]
- Jazwinski, S.M.; Kriete, A. The Yeast Retrograde Response as a Model of Intracellular Signaling of Mitochondrial Dysfunction. Front. Physiol. 2012, 3, 139. [Google Scholar] [CrossRef] [Green Version]
- Cagin, U.; Enriquez, J.A. The Complex Crosstalk between Mitochondria and the Nucleus: What Goes in Between? Int. J. Biochem. Cell Biol. 2015, 63, 10–15. [Google Scholar] [CrossRef]
- Biswas, G.; Adebanjo, O.A.; Freedman, B.D.; Anandatheerthavarada, H.K.; Vijayasarathy, C.; Zaidi, M.; Kotlikoff, M.; Avadhani, N.G. Retrograde Ca2+ Signaling in C2C12 Skeletal Myocytes in Response to Mitochondrial Genetic and Metabolic Stress: A Novel Mode of Inter-Organelle Crosstalk. EMBO J. 1999, 18, 522–533. [Google Scholar] [CrossRef] [Green Version]
- Tuppen, H.A.L.; Blakely, E.L.; Turnbull, D.M.; Taylor, R.W. Mitochondrial DNA Mutations and Human Disease. Biochim. Biophys. Acta BBA Bioenerg. 2010, 1797, 113–128. [Google Scholar] [CrossRef] [Green Version]
- Guha, M.; Srinivasan, S.; Guja, K.; Mejia, E.; Garcia-Diaz, M.; Johnson, F.B.; Ruthel, G.; Kaufman, B.A.; Rappaport, E.F.; Glineburg, M.R.; et al. HnRNPA2 is a Novel Histone Acetyltransferase That Mediates Mitochondrial Stress-Induced Nuclear Gene Expression. Cell Discov. 2016, 2, 16045. [Google Scholar] [CrossRef] [Green Version]
- Rooijers, K.; Loayza-Puch, F.; Nijtmans, L.G.; Agami, R. Ribosome Profiling Reveals Features of Normal and Disease-Associated Mitochondrial Translation. Nat. Commun. 2013, 4, 2886. [Google Scholar] [CrossRef] [Green Version]
- Chae, S.; Ahn, B.Y.; Byun, K.; Cho, Y.M.; Yu, M.-H.; Lee, B.; Hwang, D.; Park, K.S. A Systems Approach for Decoding Mitochondrial Retrograde Signaling Pathways. Sci. Signal. 2013, 6, rs4. [Google Scholar] [CrossRef]
- Kandel, J.; Picard, M.; Wallace, D.C.; Eckmann, D.M. Mitochondrial DNA 3243A>G Heteroplasmy is Associated with Changes in Cytoskeletal Protein Expression and Cell Mechanics. J. R. Soc. Interface 2017, 14, 20170071. [Google Scholar] [CrossRef] [Green Version]
- Pignataro, D.; Francia, S.; Zanetta, F.; Brenna, G.; Brandini, S.; Olivieri, A.; Torroni, A.; Biamonti, G.; Montecucco, A. A Missense MT-ND5 Mutation in Differentiated Parkinson Disease Cytoplasmic Hybrid Induces ROS-Dependent DNA Damage Response Amplified by DROSHA. Sci. Rep. 2017, 7, 9528. [Google Scholar] [CrossRef] [Green Version]
- Meseguer, S.; Martínez-Zamora, A.; García-Arumí, E.; Andreu, A.L.; Armengod, M.-E. The ROS-Sensitive MicroRNA-9/9* Controls the Expression of Mitochondrial TRNA-Modifying Enzymes and is Involved in the Molecular Mechanism of MELAS Syndrome. Hum. Mol. Genet. 2015, 24, 167–184. [Google Scholar] [CrossRef] [Green Version]
- Chomyn, A. Platelet-Mediated Transformation of Human Mitochondrial DNA-Less Cells. Methods Enzymol. 1996, 264, 334–339. [Google Scholar] [CrossRef]
- Lin, T.-K.; Lin, H.-Y.; Chen, S.-D.; Chuang, Y.-C.; Chuang, J.-H.; Wang, P.-W.; Huang, S.-T.; Tiao, M.-M.; Chen, J.-B.; Liou, C.-W. The Creation of Cybrids Harboring Mitochondrial Haplogroups in the Taiwanese Population of Ethnic Chinese Background: An Extensive in Vitro Tool for the Study of Mitochondrial Genomic Variations. Oxid. Med. Cell. Longev. 2012, 2012, 824275. [Google Scholar] [CrossRef] [Green Version]
- Picard, M.; Zhang, J.; Hancock, S.; Derbeneva, O.; Golhar, R.; Golik, P.; O’Hearn, S.; Levy, S.; Potluri, P.; Lvova, M.; et al. Progressive Increase in MtDNA 3243A>G Heteroplasmy Causes Abrupt Transcriptional Reprogramming. Proc. Natl. Acad. Sci. USA 2014, 111, E4033–E4042. [Google Scholar] [CrossRef] [Green Version]
- Rodenburg, R.J. Mitochondrial Complex I-Linked Disease. Biochim. Biophys. Acta 2016, 1857, 938–945. [Google Scholar] [CrossRef]
- Pelnena, D.; Burnyte, B.; Jankevics, E.; Lace, B.; Dagyte, E.; Grigalioniene, K.; Utkus, A.; Krumina, Z.; Rozentale, J.; Adomaitiene, I.; et al. Complete MtDNA Sequencing Reveals Mutations m.9185T>C and m.13513G>A in Three Patients with Leigh Syndrome. Mitochondrial DNA Part A DNA Mapp. Seq. Anal. 2018, 29, 1115–1120. [Google Scholar] [CrossRef]
- King, M.P.; Attardi, G. Human Cells Lacking MtDNA: Repopulation with Exogenous Mitochondria by Complementation. Science 1989, 246, 500–503. [Google Scholar] [CrossRef]
- Chang, Y.-C.; Liao, C.-B.; Hsieh, P.-Y.C.; Liou, M.-L.; Liu, Y.-C. Expression of Tumor Suppressor P53 Facilitates DNA Repair but Not UV-Induced G2/M Arrest or Apoptosis in Chinese Hamster Ovary CHO-K1 Cells. J. Cell. Biochem. 2008, 103, 528–537. [Google Scholar] [CrossRef]
- Mayr, J.A.; Havlícková, V.; Zimmermann, F.; Magler, I.; Kaplanová, V.; Jesina, P.; Pecinová, A.; Nusková, H.; Koch, J.; Sperl, W.; et al. Mitochondrial ATP Synthase Deficiency Due to a Mutation in the ATP5E Gene for the F1 Epsilon Subunit. Hum. Mol. Genet. 2010, 19, 3430–3439. [Google Scholar] [CrossRef] [Green Version]
- Feichtinger, R.G.; Zimmermann, F.; Mayr, J.A.; Neureiter, D.; Hauser-Kronberger, C.; Schilling, F.H.; Jones, N.; Sperl, W.; Kofler, B. Low Aerobic Mitochondrial Energy Metabolism in Poorly- or Undifferentiated Neuroblastoma. BMC Cancer 2010, 10, 149. [Google Scholar] [CrossRef] [Green Version]
- Aminzadeh-Gohari, S.; Weber, D.D.; Catalano, L.; Feichtinger, R.G.; Kofler, B.; Lang, R. Targeting Mitochondria in Melanoma. Biomolecules 2020, 10, 1395. [Google Scholar] [CrossRef]
- Rustin, P.; Chretien, D.; Bourgeron, T.; Gérard, B.; Rötig, A.; Saudubray, J.M.; Munnich, A. Biochemical and Molecular Investigations in Respiratory Chain Deficiencies. Clin. Chim. Acta Int. J. Clin. Chem. 1994, 228, 35–51. [Google Scholar] [CrossRef]
- Berger, A.; Mayr, J.A.; Meierhofer, D.; Fötschl, U.; Bittner, R.; Budka, H.; Grethen, C.; Huemer, M.; Kofler, B.; Sperl, W. Severe Depletion of Mitochondrial DNA in Spinal Muscular Atrophy. Acta Neuropathol. 2003, 105, 245–251. [Google Scholar] [CrossRef] [Green Version]
- Martin, M. Cutadapt Removes Adapter Sequences from High-Throughput Sequencing Reads. EMBnet. J. 2011, 17, 10–12. [Google Scholar] [CrossRef]
- Kopylova, E.; Noé, L.; Touzet, H. SortMeRNA: Fast and Accurate Filtering of Ribosomal RNAs in Metatranscriptomic Data. Bioinformatics 2012, 28, 3211–3217. [Google Scholar] [CrossRef] [Green Version]
- Dobin, A.; Davis, C.A.; Schlesinger, F.; Drenkow, J.; Zaleski, C.; Jha, S.; Batut, P.; Chaisson, M.; Gingeras, T.R. STAR: Ultrafast Universal RNA-Seq Aligner. Bioinformatics 2013, 29, 15–21. [Google Scholar] [CrossRef]
- Anders, S.; Pyl, P.T.; Huber, W. HTSeq—A Python Framework to Work with High-Throughput Sequencing Data. Bioinformatics 2015, 31, 166–169. [Google Scholar] [CrossRef] [Green Version]
- Blighe, K. Haplotype Classification Using Copy Number Variation and Principal Components Analysis. Open Bioinforma. J. 2013, 7, 19–24. [Google Scholar] [CrossRef] [Green Version]
- Love, M.I.; Huber, W.; Anders, S. Moderated Estimation of Fold Change and Dispersion for RNA-Seq Data with DESeq2. Genome Biol. 2014, 15, 550. [Google Scholar] [CrossRef] [Green Version]
- Blighe, K. EnhancedVolcano: Publication-Ready Volcano Plots with Enhanced Colouring and Labeling 2023. Available online: https://github.com/kevinblighe/EnhancedVolcano (accessed on 15 January 2023).
- Falcon, S.; Gentleman, R. Using GOstats to Test Gene Lists for GO Term Association. Bioinformatics 2007, 23, 257–258. [Google Scholar] [CrossRef] [Green Version]
- Winter, D.J. Rentrez: An R Package for the NCBI EUtils API. R J. 2017, 9, 520–526. [Google Scholar] [CrossRef]
- GO.Db. Available online: http://bioconductor.org/packages/GO.db/ (accessed on 20 October 2022).
- Ge, S.X.; Jung, D.; Yao, R. ShinyGO: A Graphical Gene-Set Enrichment Tool for Animals and Plants. Bioinformatics 2020, 36, 2628–2629. [Google Scholar] [CrossRef]
- Podlesniy, P.; Trullas, R. Absolute Measurement of Gene Transcripts with Selfie-Digital PCR. Sci. Rep. 2017, 7, 8328. [Google Scholar] [CrossRef] [Green Version]
- Larsen, S.; Nielsen, J.; Hansen, C.N.; Nielsen, L.B.; Wibrand, F.; Stride, N.; Schroder, H.D.; Boushel, R.; Helge, J.W.; Dela, F.; et al. Biomarkers of Mitochondrial Content in Skeletal Muscle of Healthy Young Human Subjects. J. Physiol. 2012, 590, 3349–3360. [Google Scholar] [CrossRef]
- Santorelli, F.M.; Tanji, K.; Kulikova, R.; Shanske, S.; Vilarinho, L.; Hays, A.P.; DiMauro, S. Identification of a Novel Mutation in the MtDNA ND5 Gene Associated with MELAS. Biochem. Biophys. Res. Commun. 1997, 238, 326–328. [Google Scholar] [CrossRef]
- Danhelovska, T.; Kolarova, H.; Zeman, J.; Hansikova, H.; Vaneckova, M.; Lambert, L.; Kucerova-Vidrova, V.; Berankova, K.; Honzik, T.; Tesarova, M. Multisystem Mitochondrial Diseases Due to Mutations in MtDNA-Encoded Subunits of Complex I. BMC Pediatr. 2020, 20, 41. [Google Scholar] [CrossRef]
- Shanske, S.; Coku, J.; Lu, J.; Ganesh, J.; Krishna, S.; Tanji, K.; Bonilla, E.; Naini, A.B.; Hirano, M.; DiMauro, S. The G13513A Mutation in the ND5 Gene of Mitochondrial DNA as a Common Cause of MELAS or Leigh Syndrome: Evidence from 12 Cases. Arch. Neurol. 2008, 65, 368–372. [Google Scholar] [CrossRef] [Green Version]
- Wang, S.-B.; Weng, W.-C.; Lee, N.-C.; Hwu, W.-L.; Fan, P.-C.; Lee, W.-T. Mutation of Mitochondrial DNA G13513A Presenting with Leigh Syndrome, Wolff-Parkinson-White Syndrome and Cardiomyopathy. Pediatr. Neonatol. 2008, 49, 145–149. [Google Scholar] [CrossRef] [Green Version]
- Ng, P.S.; Pinto, M.V.; Neff, J.L.; Hasadsri, L.; Highsmith, E.W.; Fidler, M.E.; Gavrilova, R.H.; Klein, C.J. Mitochondrial Cerebellar Ataxia, Renal Failure, Neuropathy, and Encephalopathy (MCARNE). Neurol. Genet. 2019, 5, e314. [Google Scholar] [CrossRef] [Green Version]
- Bakis, H.; Trimouille, A.; Vermorel, A.; Redonnet, I.; Goizet, C.; Boulestreau, R.; Lacombe, D.; Combe, C.; Martin-Négrier, M.-L.; Rigothier, C. Adult Onset Tubulo-Interstitial Nephropathy in MT-ND5-Related Phenotypes. Clin. Genet. 2020, 97, 628–633. [Google Scholar] [CrossRef]
- Barone, V.; La Morgia, C.; Caporali, L.; Fiorini, C.; Carbonelli, M.; Gramegna, L.L.; Bartiromo, F.; Tonon, C.; Morandi, L.; Liguori, R.; et al. Case Report: Optic Atrophy and Nephropathy With m.13513G>A/MT-ND5 MtDNA Pathogenic Variant. Front. Genet. 2022, 13, 887696. [Google Scholar] [CrossRef]
- Gramegna, L.L.; Evangelisti, S.; Di Vito, L.; La Morgia, C.; Maresca, A.; Caporali, L.; Amore, G.; Talozzi, L.; Bianchini, C.; Testa, C.; et al. Brain MRS Correlates with Mitochondrial Dysfunction Biomarkers in MELAS-Associated MtDNA Mutations. Ann. Clin. Transl. Neurol. 2021, 8, 1200–1211. [Google Scholar] [CrossRef]
- Ng, Y.S.; Lax, N.Z.; Maddison, P.; Alston, C.L.; Blakely, E.L.; Hepplewhite, P.D.; Riordan, G.; Meldau, S.; Chinnery, P.F.; Pierre, G.; et al. MT-ND5 Mutation Exhibits Highly Variable Neurological Manifestations at Low Mutant Load. EBioMedicine 2018, 30, 86–93. [Google Scholar] [CrossRef] [Green Version]
- Kirby, D.M.; Boneh, A.; Chow, C.W.; Ohtake, A.; Ryan, M.T.; Thyagarajan, D.; Thorburn, D.R. Low Mutant Load of Mitochondrial DNA G13513A Mutation Can Cause Leigh’s Disease. Ann. Neurol. 2003, 54, 473–478. [Google Scholar] [CrossRef]
- Krylova, T.D.; Sheremet, N.L.; Tabakov, V.Y.; Lyamzaev, K.G.; Itkis, Y.S.; Tsygankova, P.G.; Andreeva, N.A.; Shmelkova, M.S.; Nevinitsyna, T.A.; Kadyshev, V.V.; et al. Three Rare Pathogenic MtDNA Substitutions in LHON Patients with Low Heteroplasmy. Mitochondrion 2020, 50, 139–144. [Google Scholar] [CrossRef]
- Sun, C.-B.; Bai, H.-X.; Xu, D.-N.; Xiao, Q.; Liu, Z. Mitochondrial 13513G>A Mutation with Low Mutant Load Presenting as Isolated Leber’s Hereditary Optic Neuropathy Assessed by Next Generation Sequencing. Front. Neurol. 2021, 12, 601307. [Google Scholar] [CrossRef]
- Vázquez-Justes, D.; Carreño-Gago, L.; García-Arumi, E.; Traveset, A.; Montoya, J.; Ruiz-Pesini, E.; López, R.; Brieva, L. Mitochondrial m.13513G>A Point Mutation in ND5 in a 16-Year-Old Man with Leber Hereditary Optic Neuropathy Detected by Next-Generation Sequencing. J. Pediatr. Genet. 2019, 8, 231–234. [Google Scholar] [CrossRef]
- Chomyn, A. Mitochondrial Genetic Control of Assembly and Function of Complex I in Mammalian Cells. J. Bioenerg. Biomembr. 2001, 33, 251–257. [Google Scholar] [CrossRef]
- Zhu, J.; Vinothkumar, K.R.; Hirst, J. Structure of Mammalian Respiratory Complex I. Nature 2016, 536, 354–358. [Google Scholar] [CrossRef] [PubMed] [Green Version]
- Moreno-Lastres, D.; Fontanesi, F.; García-Consuegra, I.; Martín, M.A.; Arenas, J.; Barrientos, A.; Ugalde, C. Mitochondrial Complex I Plays an Essential Role in Human Respirasome Assembly. Cell Metab. 2012, 15, 324–335. [Google Scholar] [CrossRef] [Green Version]
- Ugalde, C.; Janssen, R.J.R.J.; van den Heuvel, L.P.; Smeitink, J.A.M.; Nijtmans, L.G.J. Differences in Assembly or Stability of Complex I and Other Mitochondrial OXPHOS Complexes in Inherited Complex I Deficiency. Hum. Mol. Genet. 2004, 13, 659–667. [Google Scholar] [CrossRef]
- Budde, S.M.; van den Heuvel, L.P.; Janssen, A.J.; Smeets, R.J.; Buskens, C.A.; DeMeirleir, L.; Van Coster, R.; Baethmann, M.; Voit, T.; Trijbels, J.M.; et al. Combined Enzymatic Complex I and III Deficiency Associated with Mutations in the Nuclear Encoded NDUFS4 Gene. Biochem. Biophys. Res. Commun. 2000, 275, 63–68. [Google Scholar] [CrossRef]
- Galera-Monge, T.; Zurita-Díaz, F.; Canals, I.; Hansen, M.G.; Rufián-Vázquez, L.; Ehinger, J.K.; Elmér, E.; Martin, M.A.; Garesse, R.; Ahlenius, H.; et al. Mitochondrial Dysfunction and Calcium Dysregulation in Leigh Syndrome Induced Pluripotent Stem Cell Derived Neurons. Int. J. Mol. Sci. 2020, 21, 3191. [Google Scholar] [CrossRef]
- Ehinger, J.K.; Piel, S.; Ford, R.; Karlsson, M.; Sjövall, F.; Frostner, E.Å.; Morota, S.; Taylor, R.W.; Turnbull, D.M.; Cornell, C.; et al. Cell-Permeable Succinate Prodrugs Bypass Mitochondrial Complex I Deficiency. Nat. Commun. 2016, 7, 12317. [Google Scholar] [CrossRef] [Green Version]
- Stewart, J.B.; Chinnery, P.F. The Dynamics of Mitochondrial DNA Heteroplasmy: Implications for Human Health and Disease. Nat. Rev. Genet. 2015, 16, 530–542. [Google Scholar] [CrossRef]
- Wahedi, A.; Soondram, C.; Murphy, A.E.; Skene, N.; Rahman, S. Transcriptomic Analyses Reveal Neuronal Specificity of Leigh Syndrome Associated Genes. J. Inherit. Metab. Dis. 2023, 1–18. [Google Scholar] [CrossRef]
- Bchetnia, M.; Tardif, J.; Morin, C.; Laprise, C. Expression Signature of the Leigh Syndrome French-Canadian Type. Mol. Genet. Metab. Rep. 2022, 30, 100847. [Google Scholar] [CrossRef]
- Karakaidos, P.; Rampias, T. Mitonuclear Interactions in the Maintenance of Mitochondrial Integrity. Life 2020, 10, 173. [Google Scholar] [CrossRef]
- Labhart, P.; Morgan, G.T. Identification of Novel Genes Encoding Transcription Elongation Factor TFIIS (TCEA) in Vertebrates: Conservation of Three Distinct TFIIS Isoforms in Frog, Mouse, and Human. Genomics 1998, 52, 278–288. [Google Scholar] [CrossRef]
- Kazim, N.; Adhikari, A.; Davie, J. The Transcription Elongation Factor TCEA3 Promotes the Activity of the Myogenic Regulatory Factors. PLoS ONE 2019, 14, e0217680. [Google Scholar] [CrossRef] [PubMed]
- Lee, Y.-K.; Jee, B.A.; Kwon, S.M.; Yoon, Y.-S.; Xu, W.G.; Wang, H.-J.; Wang, X.W.; Thorgeirsson, S.S.; Lee, J.-S.; Woo, H.G.; et al. Identification of a Mitochondrial Defect Gene Signature Reveals NUPR1 as a Key Regulator of Liver Cancer Progression. Hepatology 2015, 62, 1174–1189. [Google Scholar] [CrossRef]
- Völgyi, K.; Badics, K.; Sialana, F.J.; Gulyássy, P.; Udvari, E.B.; Kis, V.; Drahos, L.; Lubec, G.; Kékesi, K.A.; Juhász, G. Early Presymptomatic Changes in the Proteome of Mitochondria-Associated Membrane in the APP/PS1 Mouse Model of Alzheimer’s Disease. Mol. Neurobiol. 2018, 55, 7839–7857. [Google Scholar] [CrossRef]
- Kawahata, I.; Bousset, L.; Melki, R.; Fukunaga, K. Fatty Acid-Binding Protein 3 Is Critical for α-Synuclein Uptake and MPP+-Induced Mitochondrial Dysfunction in Cultured Dopaminergic Neurons. Int. J. Mol. Sci. 2019, 20, 5358. [Google Scholar] [CrossRef] [Green Version]
- Wei, L.; He, F.; Zhang, W.; Chen, W.; Yu, B. Bioinformatics Analysis of Microarray Data to Reveal the Pathogenesis of Diffuse Intrinsic Pontine Glioma. Biol. Res. 2018, 51, 26. [Google Scholar] [CrossRef] [Green Version]
- Pala, M.; Meral, I.; Pala Acikgoz, N.; Gorucu Yilmaz, S.; Okur, S.K.; Acar, S.; Polat, Y.; Akbas, F. Downregulatory Effect of MiR-342-3p on Epileptogenesis in the PTZ-Kindling Model. Mol. Biol. Rep. 2022, 49, 11997–12006. [Google Scholar] [CrossRef]


Disclaimer/Publisher’s Note: The statements, opinions and data contained in all publications are solely those of the individual author(s) and contributor(s) and not of MDPI and/or the editor(s). MDPI and/or the editor(s) disclaim responsibility for any injury to people or property resulting from any ideas, methods, instructions or products referred to in the content. |
© 2023 by the authors. Licensee MDPI, Basel, Switzerland. This article is an open access article distributed under the terms and conditions of the Creative Commons Attribution (CC BY) license (https://creativecommons.org/licenses/by/4.0/).
Share and Cite
Kidere, D.; Zayakin, P.; Livcane, D.; Makrecka-Kuka, M.; Stavusis, J.; Lace, B.; Lin, T.-K.; Liou, C.-W.; Inashkina, I. Impact of the m.13513G>A Variant on the Functions of the OXPHOS System and Cell Retrograde Signaling. Curr. Issues Mol. Biol. 2023, 45, 1794-1809. https://doi.org/10.3390/cimb45030115
Kidere D, Zayakin P, Livcane D, Makrecka-Kuka M, Stavusis J, Lace B, Lin T-K, Liou C-W, Inashkina I. Impact of the m.13513G>A Variant on the Functions of the OXPHOS System and Cell Retrograde Signaling. Current Issues in Molecular Biology. 2023; 45(3):1794-1809. https://doi.org/10.3390/cimb45030115
Chicago/Turabian StyleKidere, Dita, Pawel Zayakin, Diana Livcane, Marina Makrecka-Kuka, Janis Stavusis, Baiba Lace, Tsu-Kung Lin, Chia-Wei Liou, and Inna Inashkina. 2023. "Impact of the m.13513G>A Variant on the Functions of the OXPHOS System and Cell Retrograde Signaling" Current Issues in Molecular Biology 45, no. 3: 1794-1809. https://doi.org/10.3390/cimb45030115