
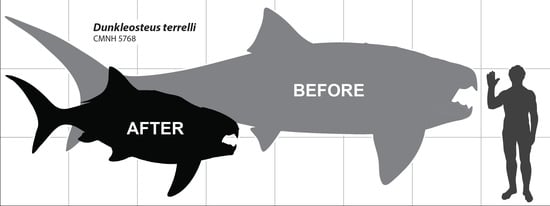
A Devonian Fish Tale: A New Method of Body Length Estimation Suggests Much Smaller Sizes for Dunkleosteus terrelli (Placodermi: Arthrodira)

Abstract
:
1. Introduction
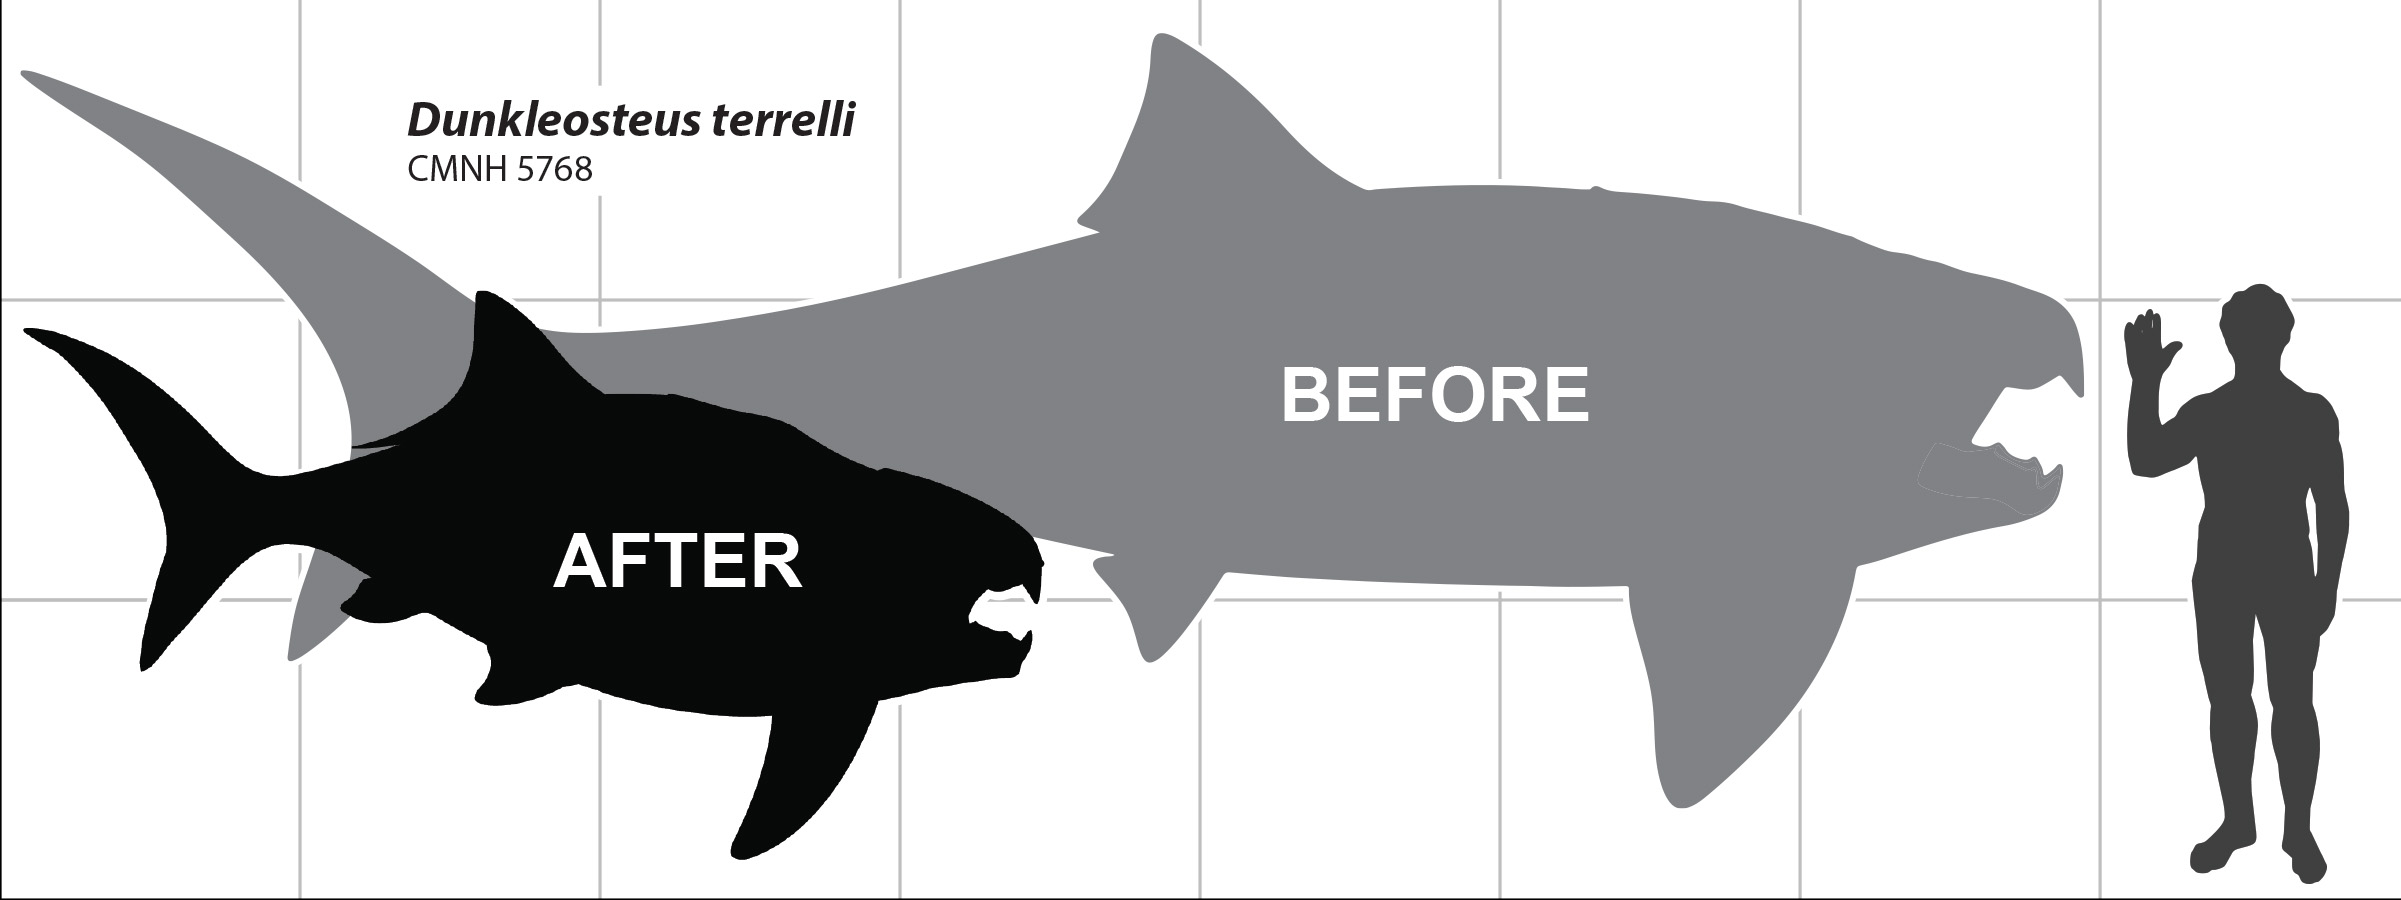
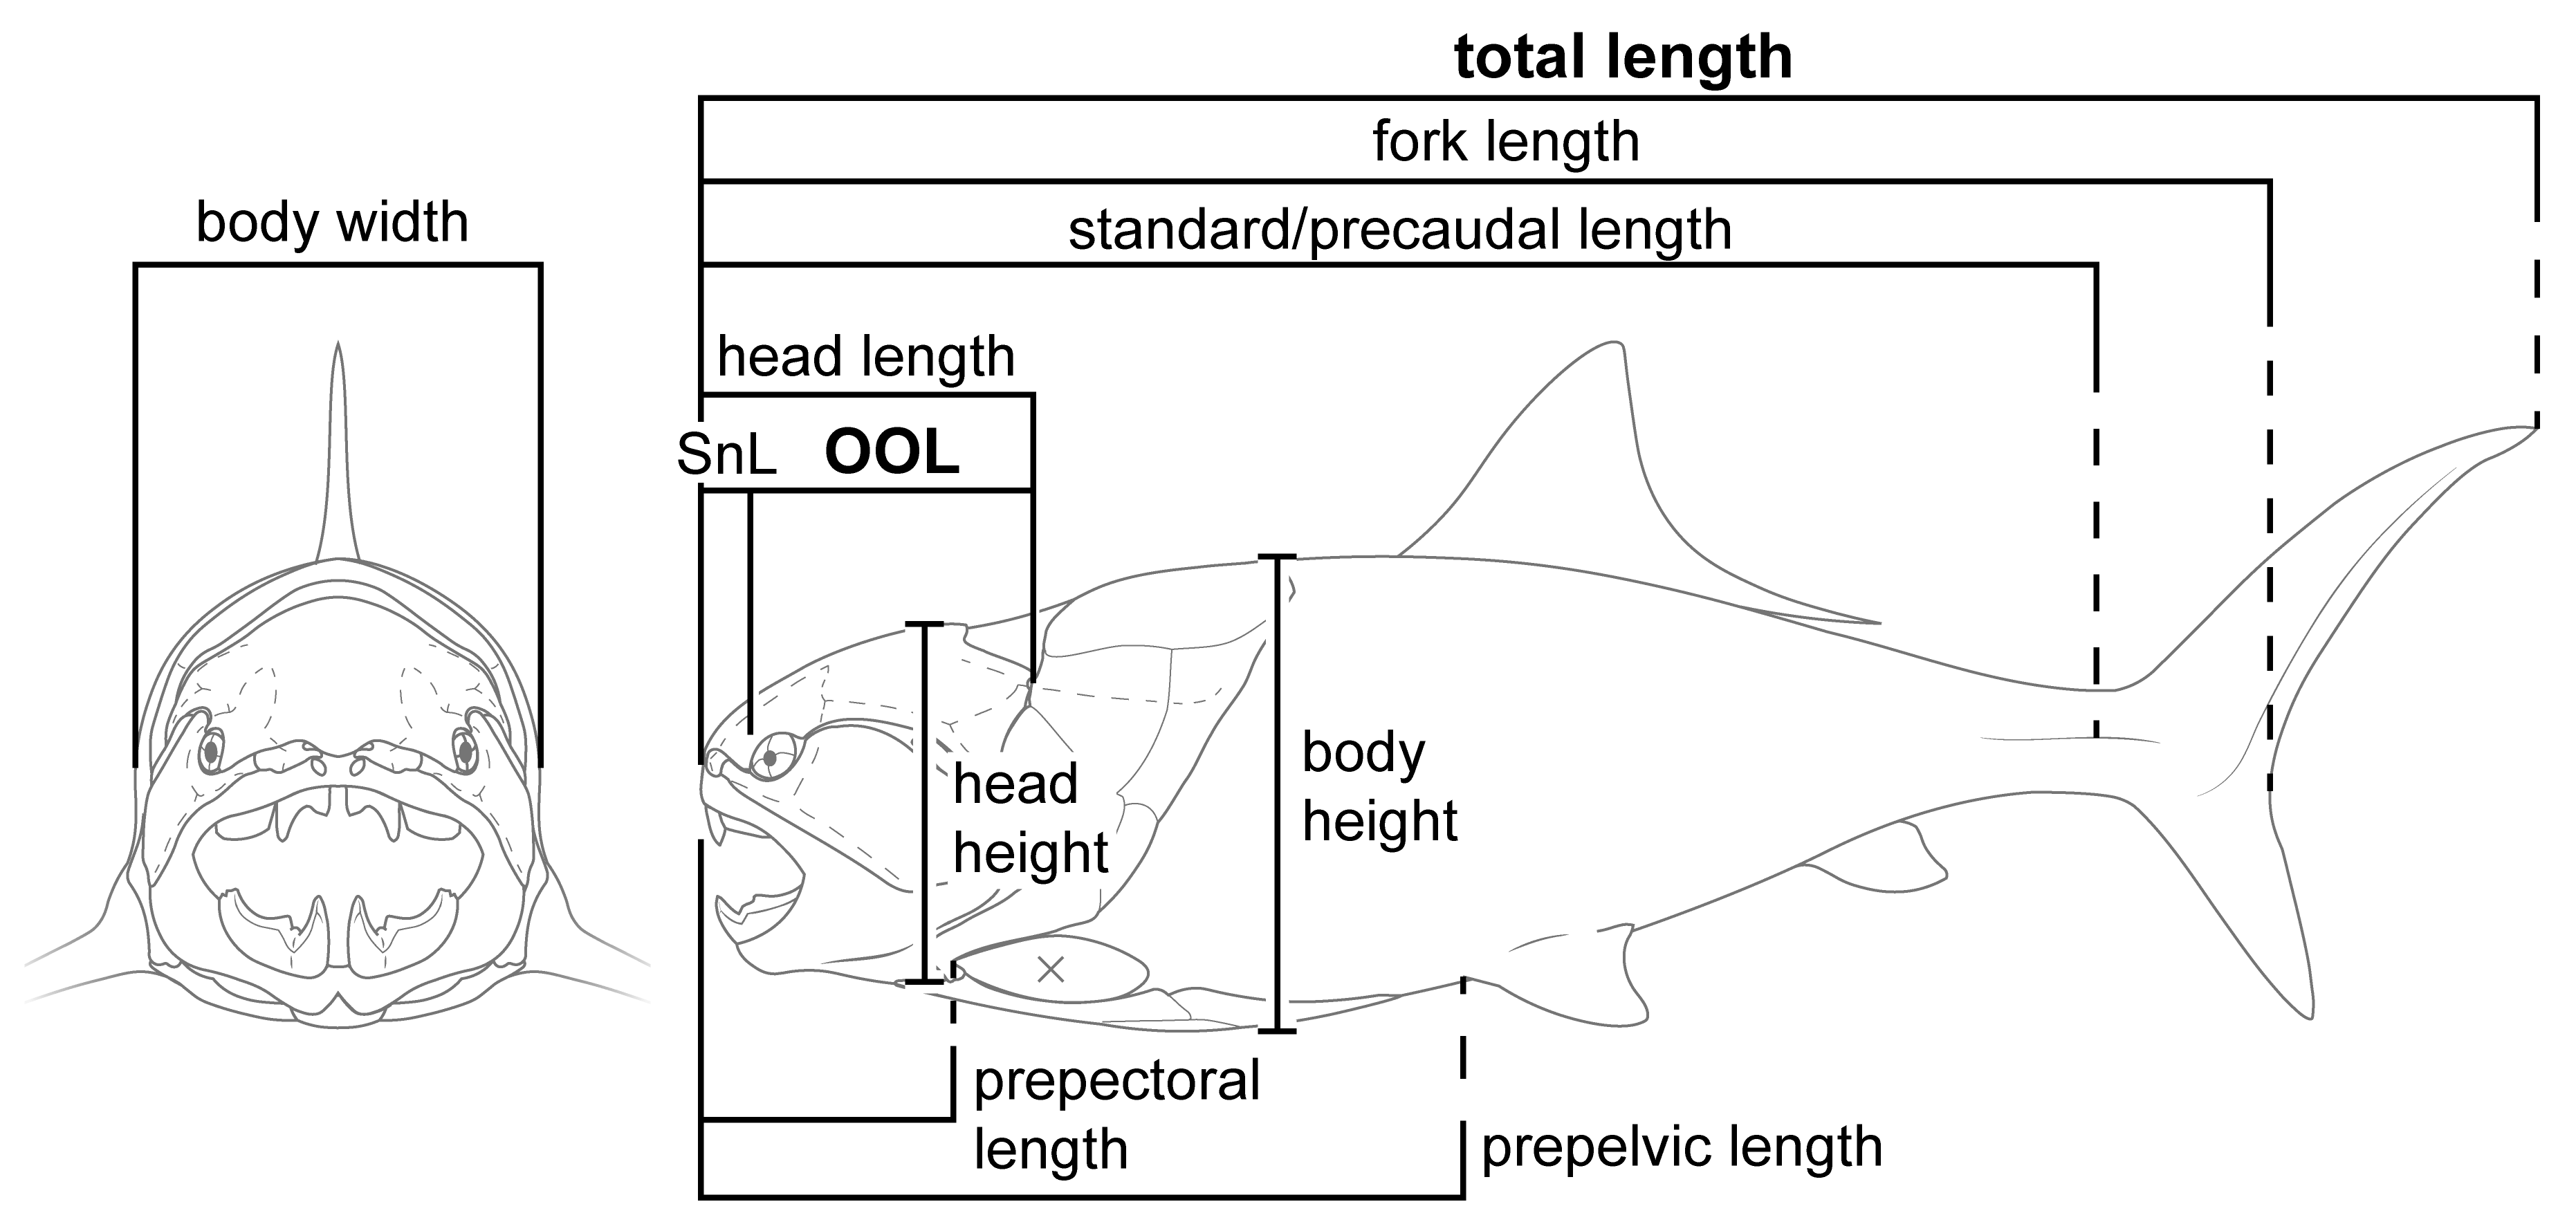
Introducing Orbit-Opercular Length


2. Materials and Methods
2.1. Institutional Abbreviations
2.2. Model Assumptions
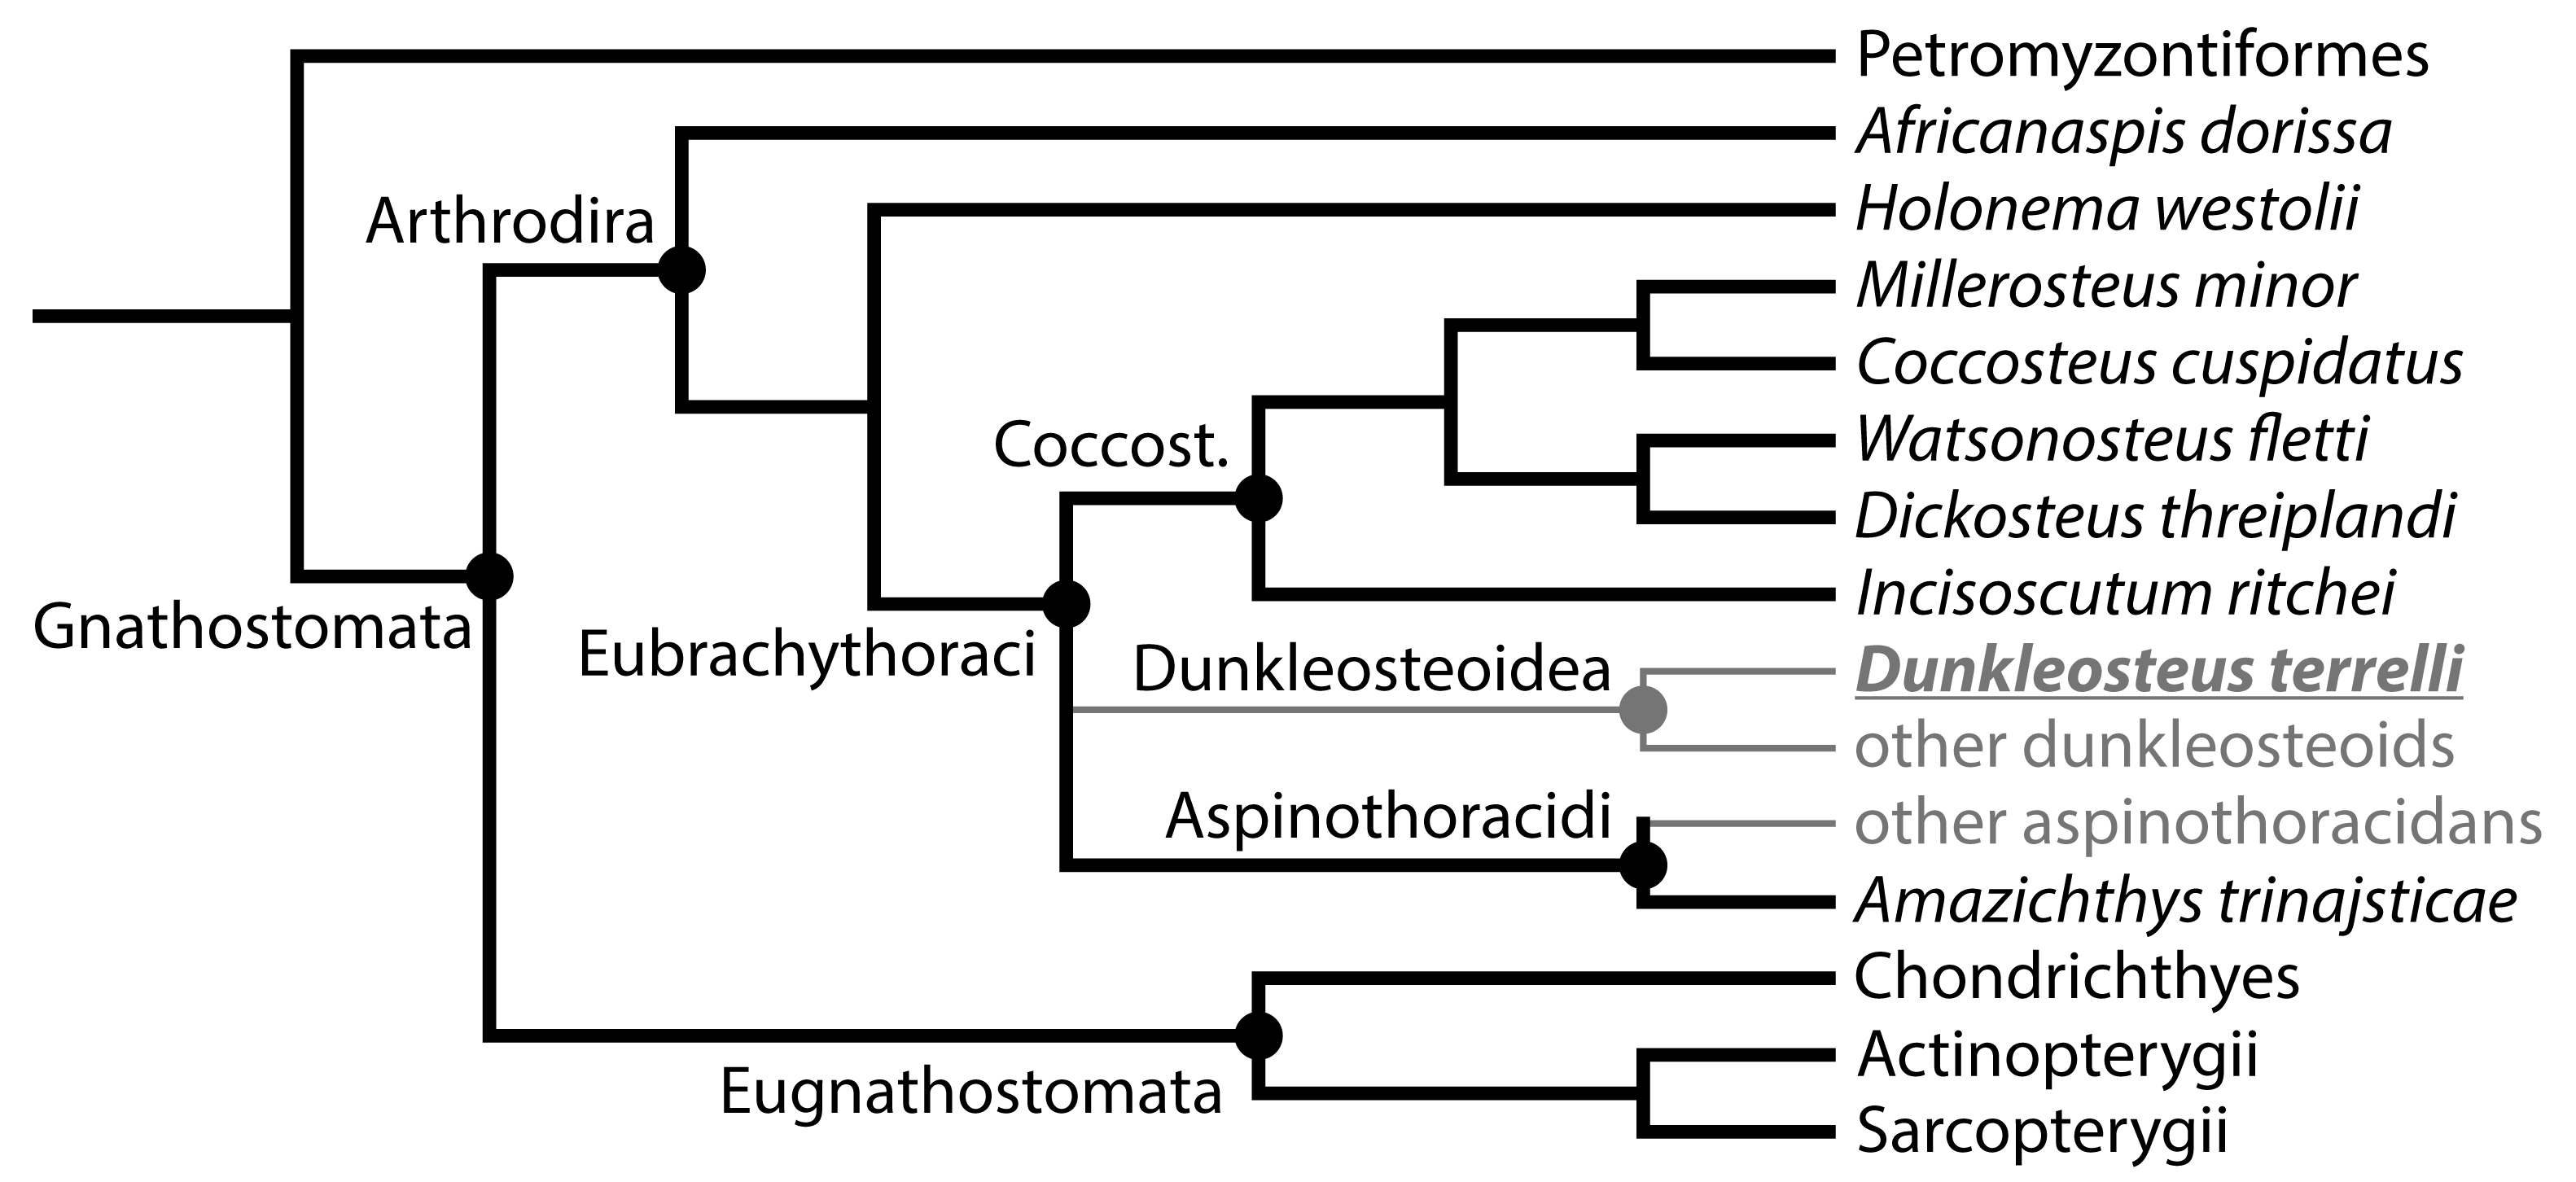
- The dataset must include a wide variety of fishes, including fishes spanning the possible range of body sizes for Dunkleosteus. This is necessary to avoid errors from data extrapolation, which if not controlled for can lead to errors in body size estimation [30,35,36]. Related to this, it is important to include taxa that phylogenetically bracket the extinct taxa of interest, in order to increase confidence in the applicability of the model [48]. For arthrodires, this phylogenetic bracket would encompass extant gnathostomes (chondrichthyans, osteichthyans), lampreys (Petromyzontiformes), and other arthrodires for which complete remains are known (Figure 3). Lampreys are not the closest relative to gnathostomes among jawless fish groups (cephalaspidomorphs are closer), but were chosen here because lampreys can be measured from modern specimens and thus be measured more precisely.
- The model must accurately estimate body size in fishes regardless of phylogeny. If a model only predicts body length in one group of fishes like sharks or bony fishes but cannot be applied more broadly, it is unlikely to be accurate in arthrodires. Similarly, a measurement may strongly correlate with total length in fishes but different groups of fishes may follow different regression lines. If this is the case, an additional variable would be needed to adjust for clade-specific differences in slope and intercept. However, such a model would be almost useless for estimating body size in arthrodires, as the additional coefficients for arthrodires would be calculated based on a narrow subset of taxa spanning a limited range of sizes.
- The model must accurately estimate total length in the few arthrodire taxa known from complete remains. If a method works for extant gnathostomes (which are universally regarded as more closely related to each other than to arthrodires; [5,49]) but fails to predict length in Arthrodira, it cannot be reasonably applied to Dunkleosteus. One potential issue is that most arthrodires for which complete remains are known are either coccosteomorphs (e.g., Coccosteus, Millerosteus, Watsonosteus) or more basal arthrodire lineages (Africanaspis, Holonema). Amazichthys trinajsticae is the only exception in this regard [21]. However, given the distribution of taxa considered in this study (Figure 3), if a model accurately predicts body length in lampreys, coccosteomorphs, basal arthrodires, Amazichthys, and extant jawed fishes it can be assumed it will also accurately predict body length in Dunkleosteus terrelli and other “pachyosteomorph” arthrodires (Dunkleosteoidea and Aspinothoracidi).
- The anatomical proxy for total length must be measurable in fossils of Dunkleosteus terrelli. If a measurement is highly correlated with size but is not measurable in Dunkleosteus specimens (e.g., snout-vent length) or is based on anatomical landmarks that cannot be reliably recognized in arthrodires (e.g., prebranchial length, given the branchial region of arthrodires cannot be easily distinguished from the rest of the skull [50,51]), then it is useless for estimating the body size of D. terrelli.

2.3. Data and Measurements

2.4. Statistical Analysis
2.4.1. Estimating the Length of the Largest Dunkleosteus
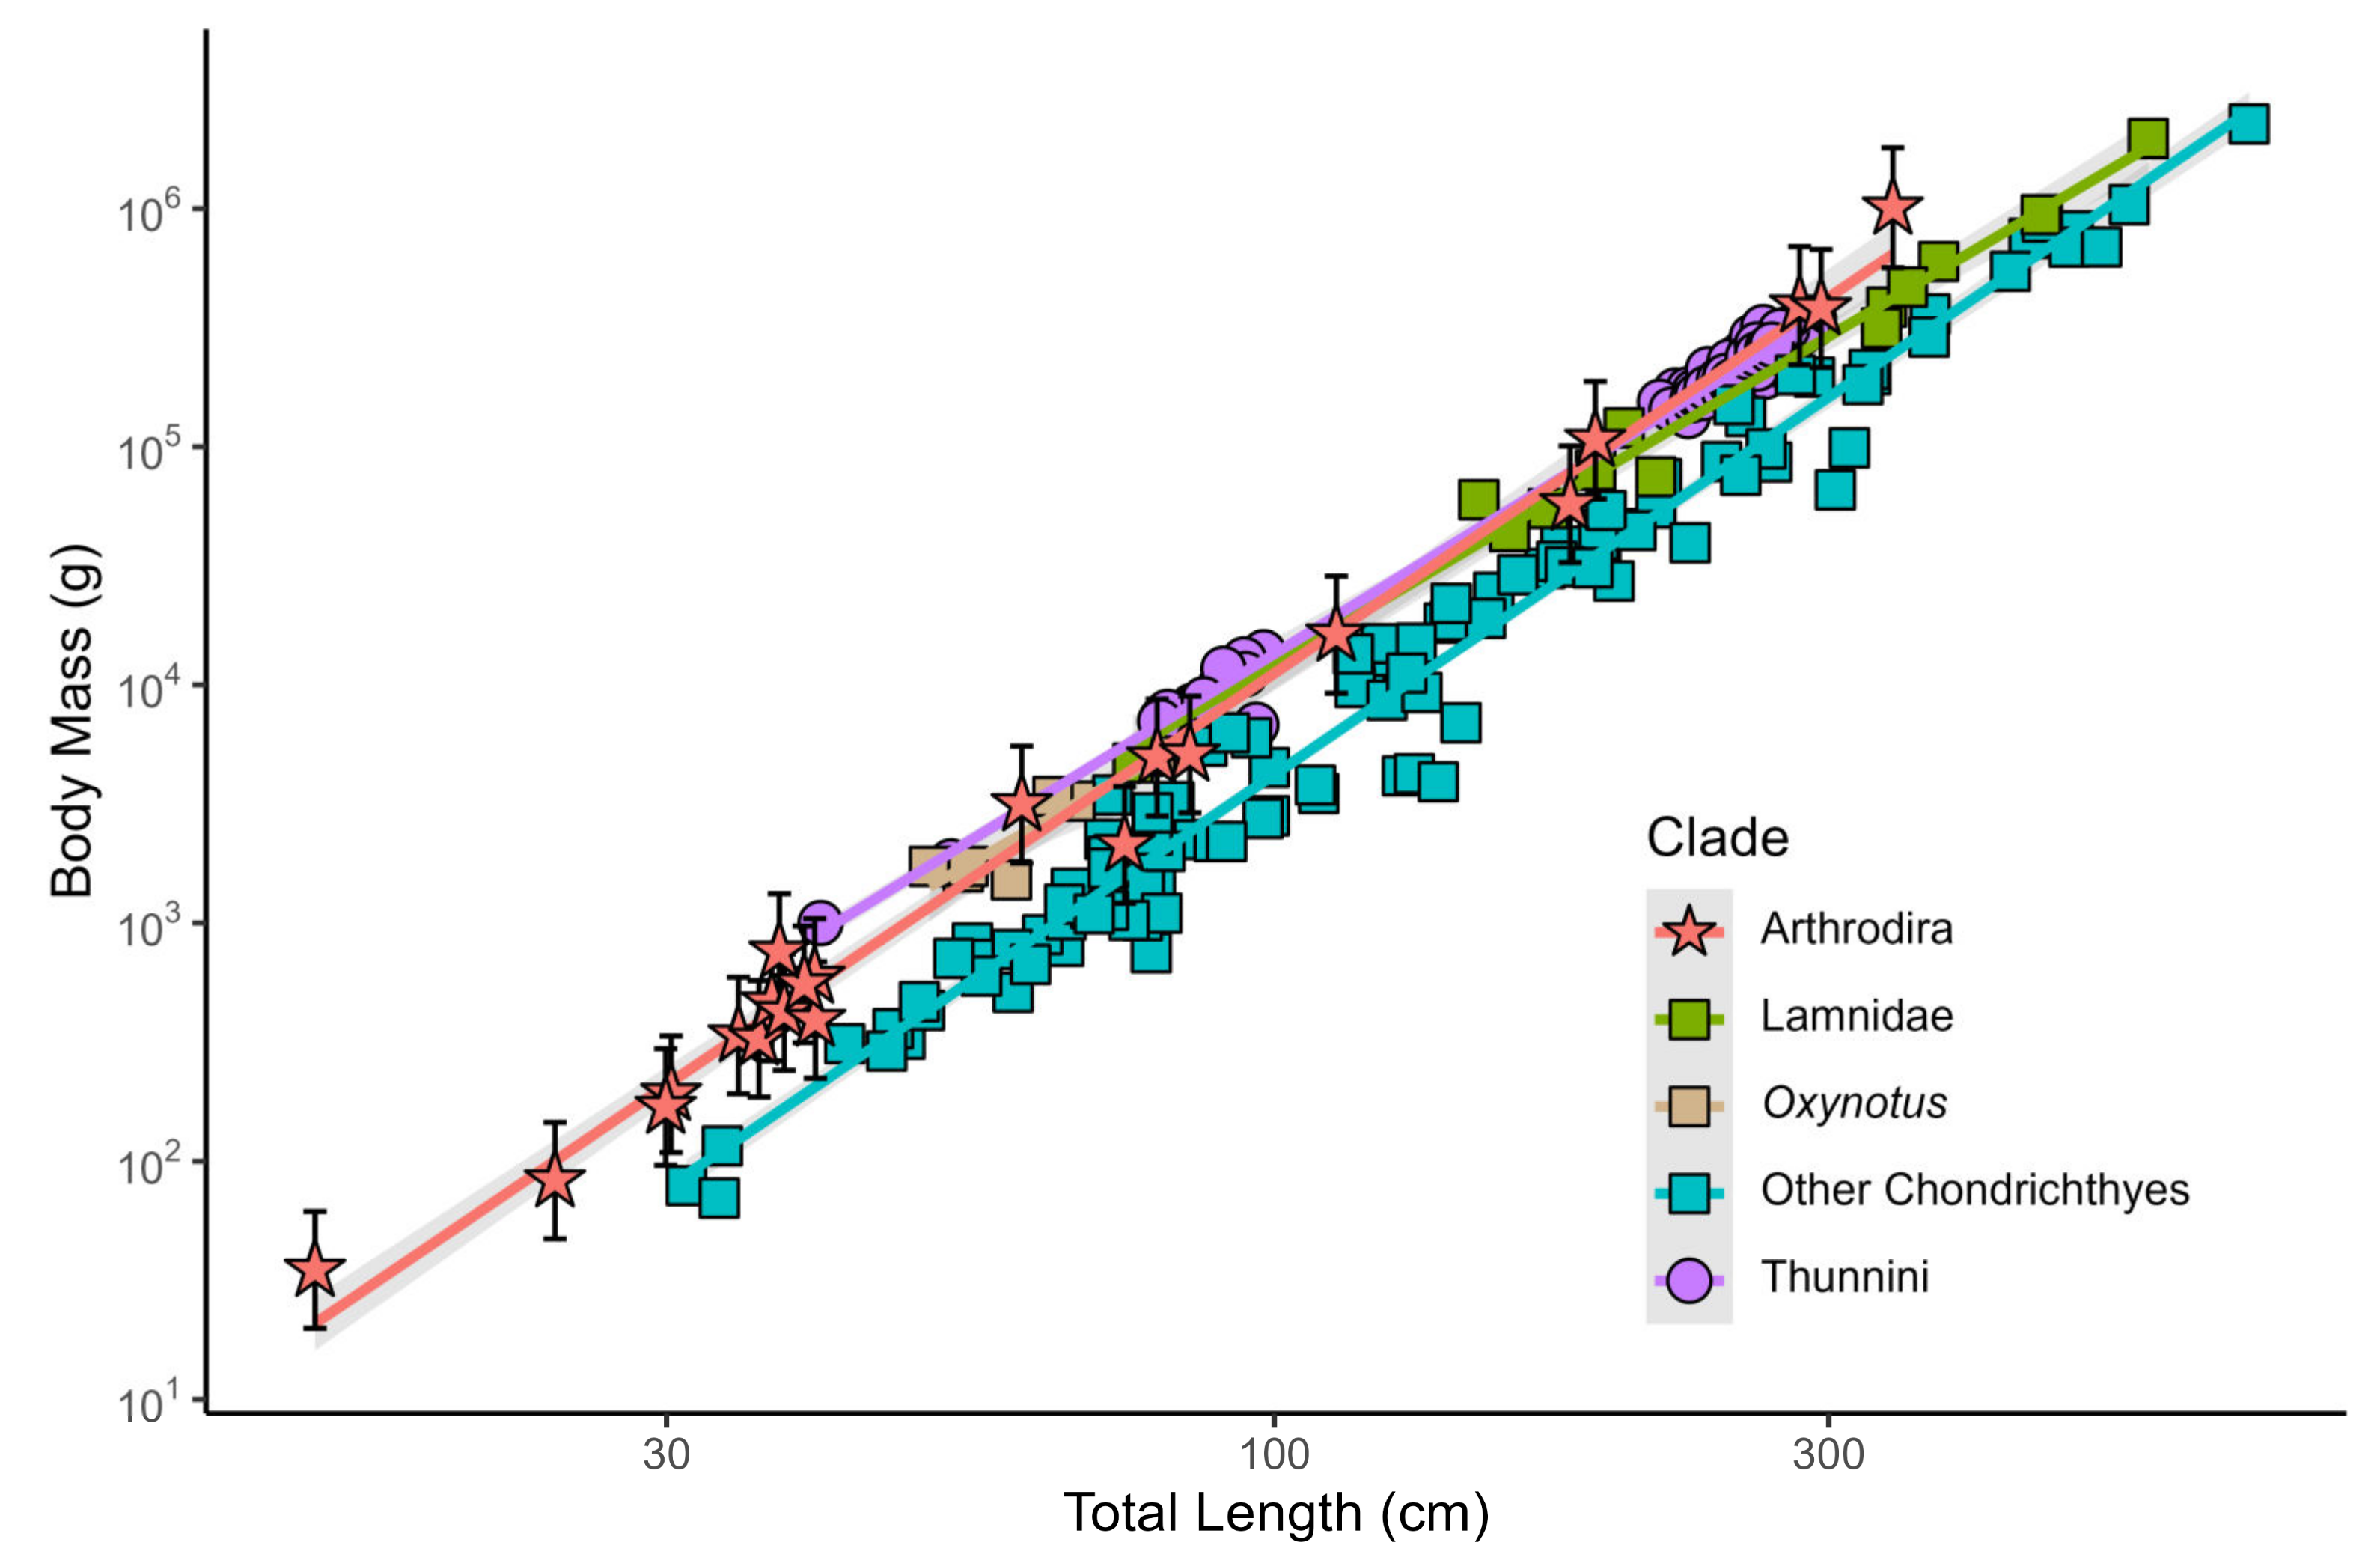
2.4.2. Body Mass of Dunkleosteus
3. Results
3.1. Results of Model
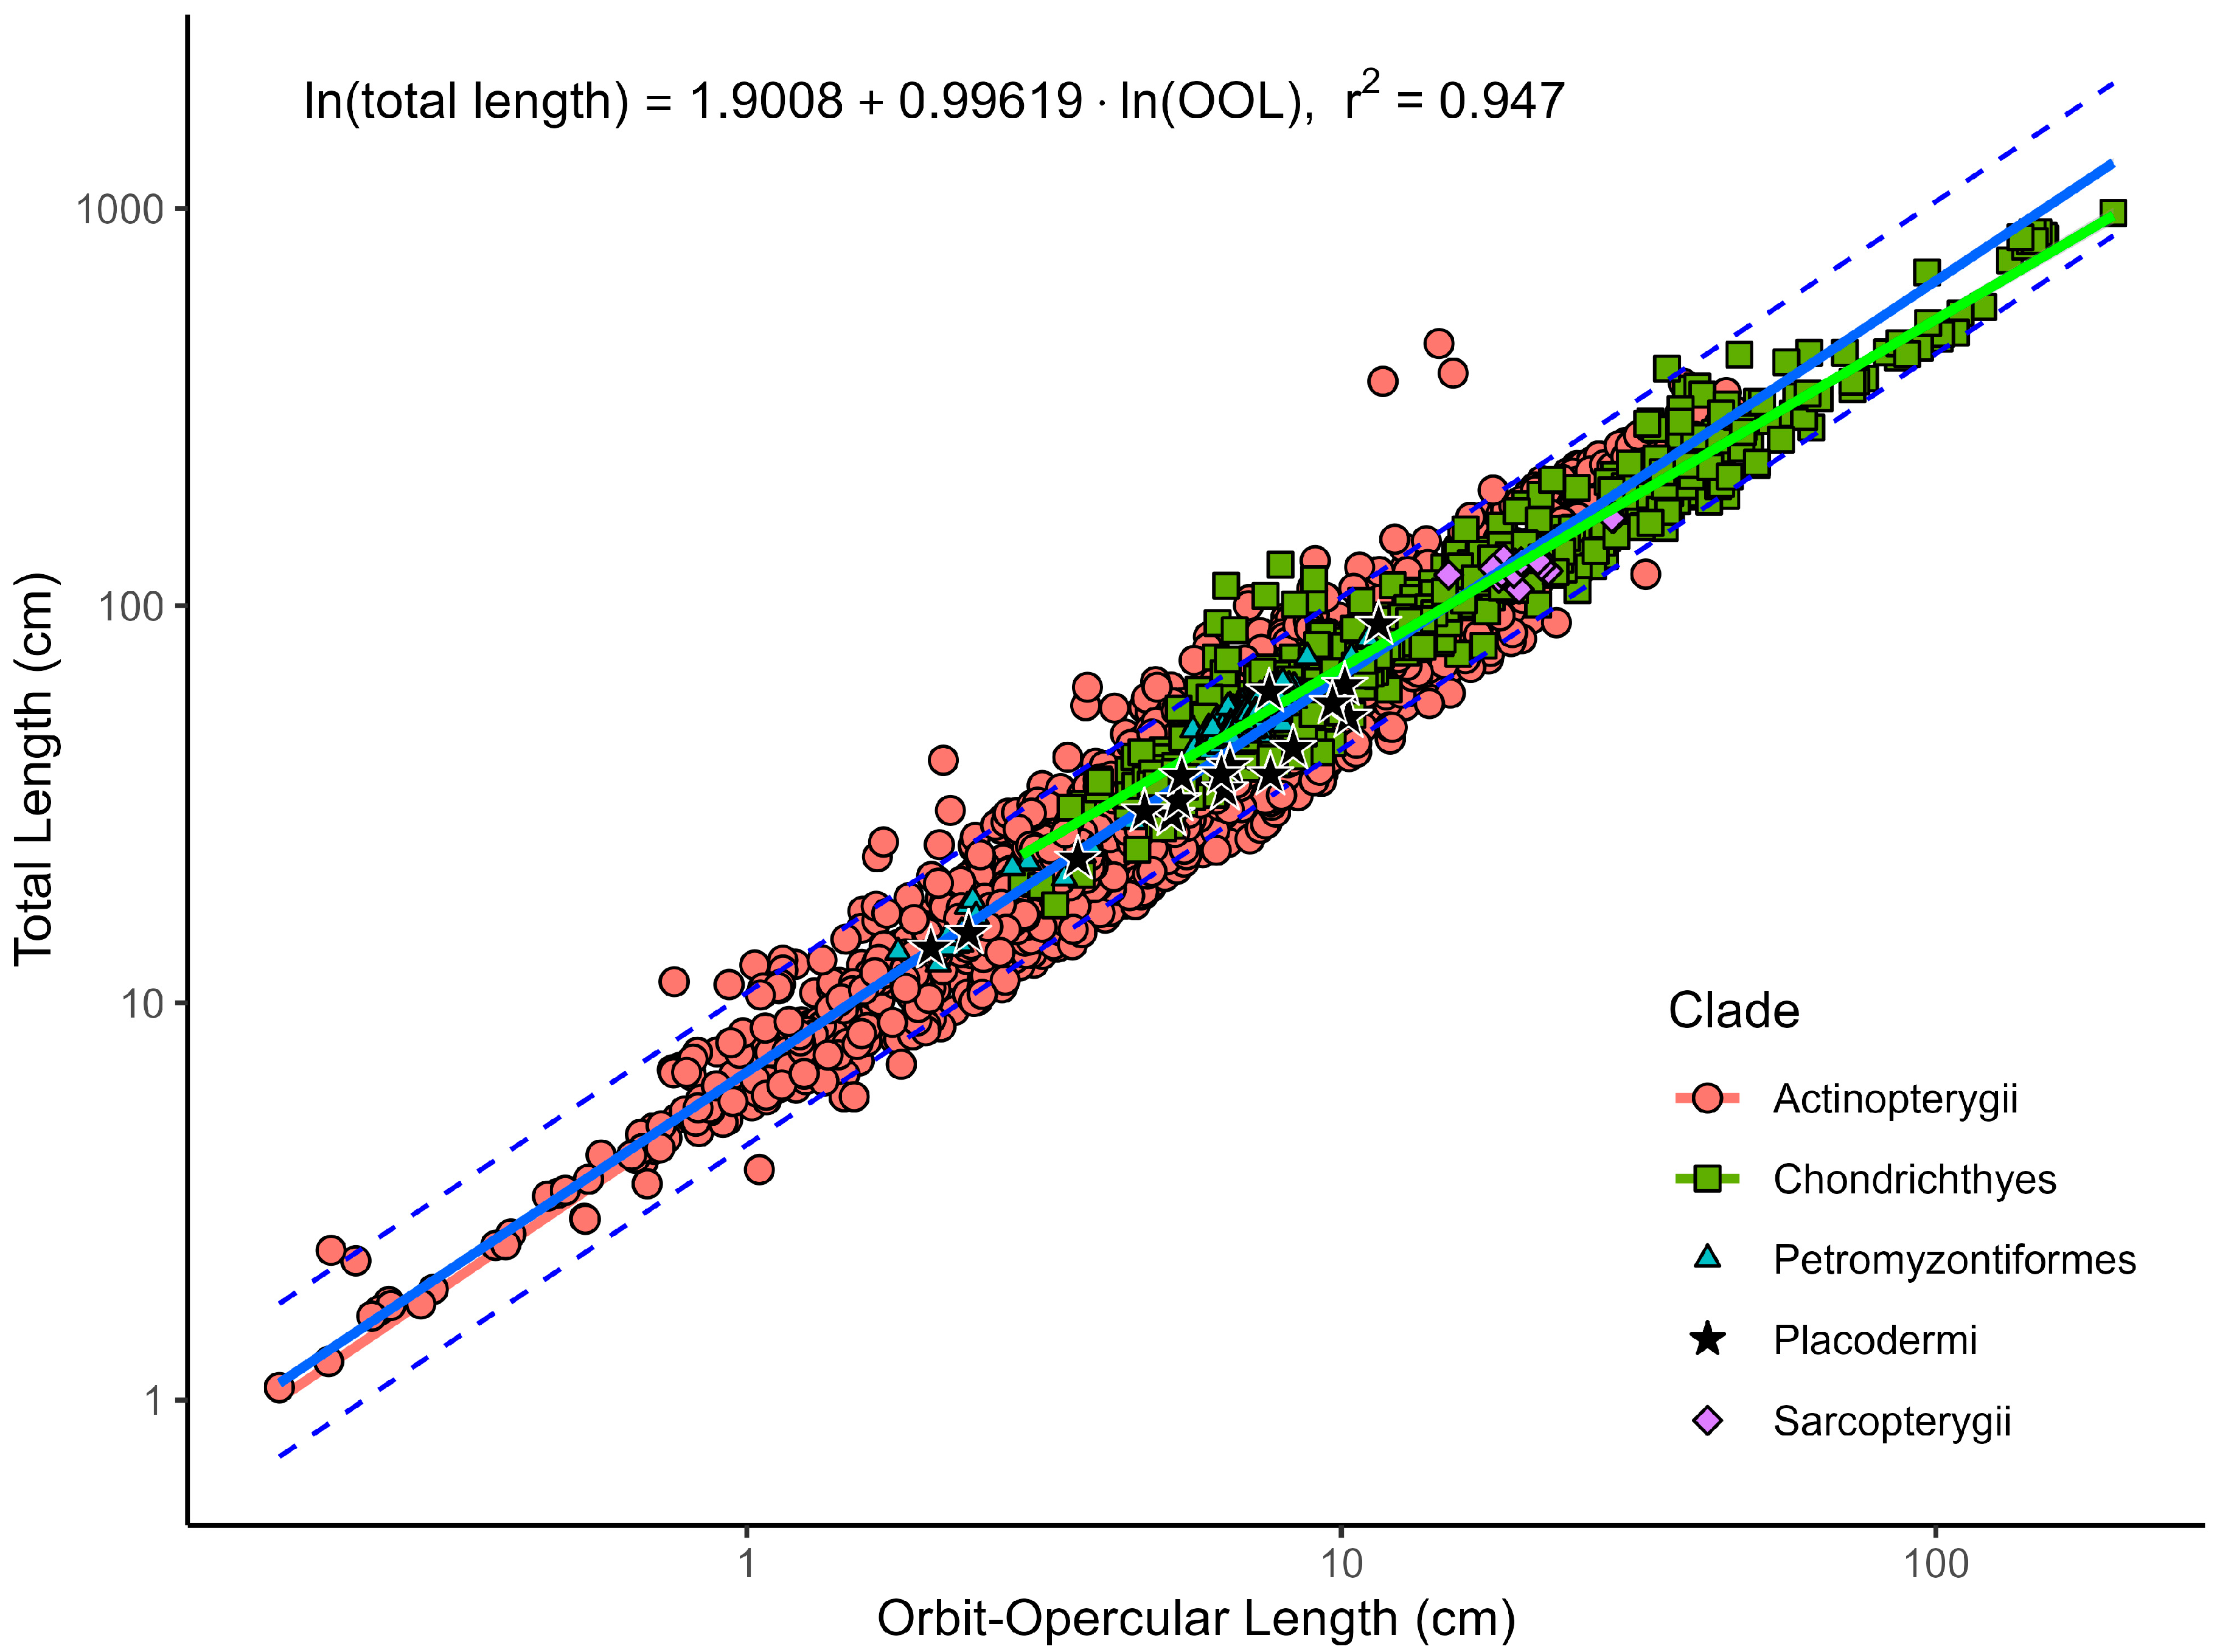
3.1.1. OOL in Extant Fishes
3.1.2. Outliers in the OOL Model
3.1.3. Effects of Snout Length
3.1.4. Body Size of Arthrodires
3.2. Body Size of Dunkleosteus terrelli
3.2.1. Length of Dunkleosteus terrelli
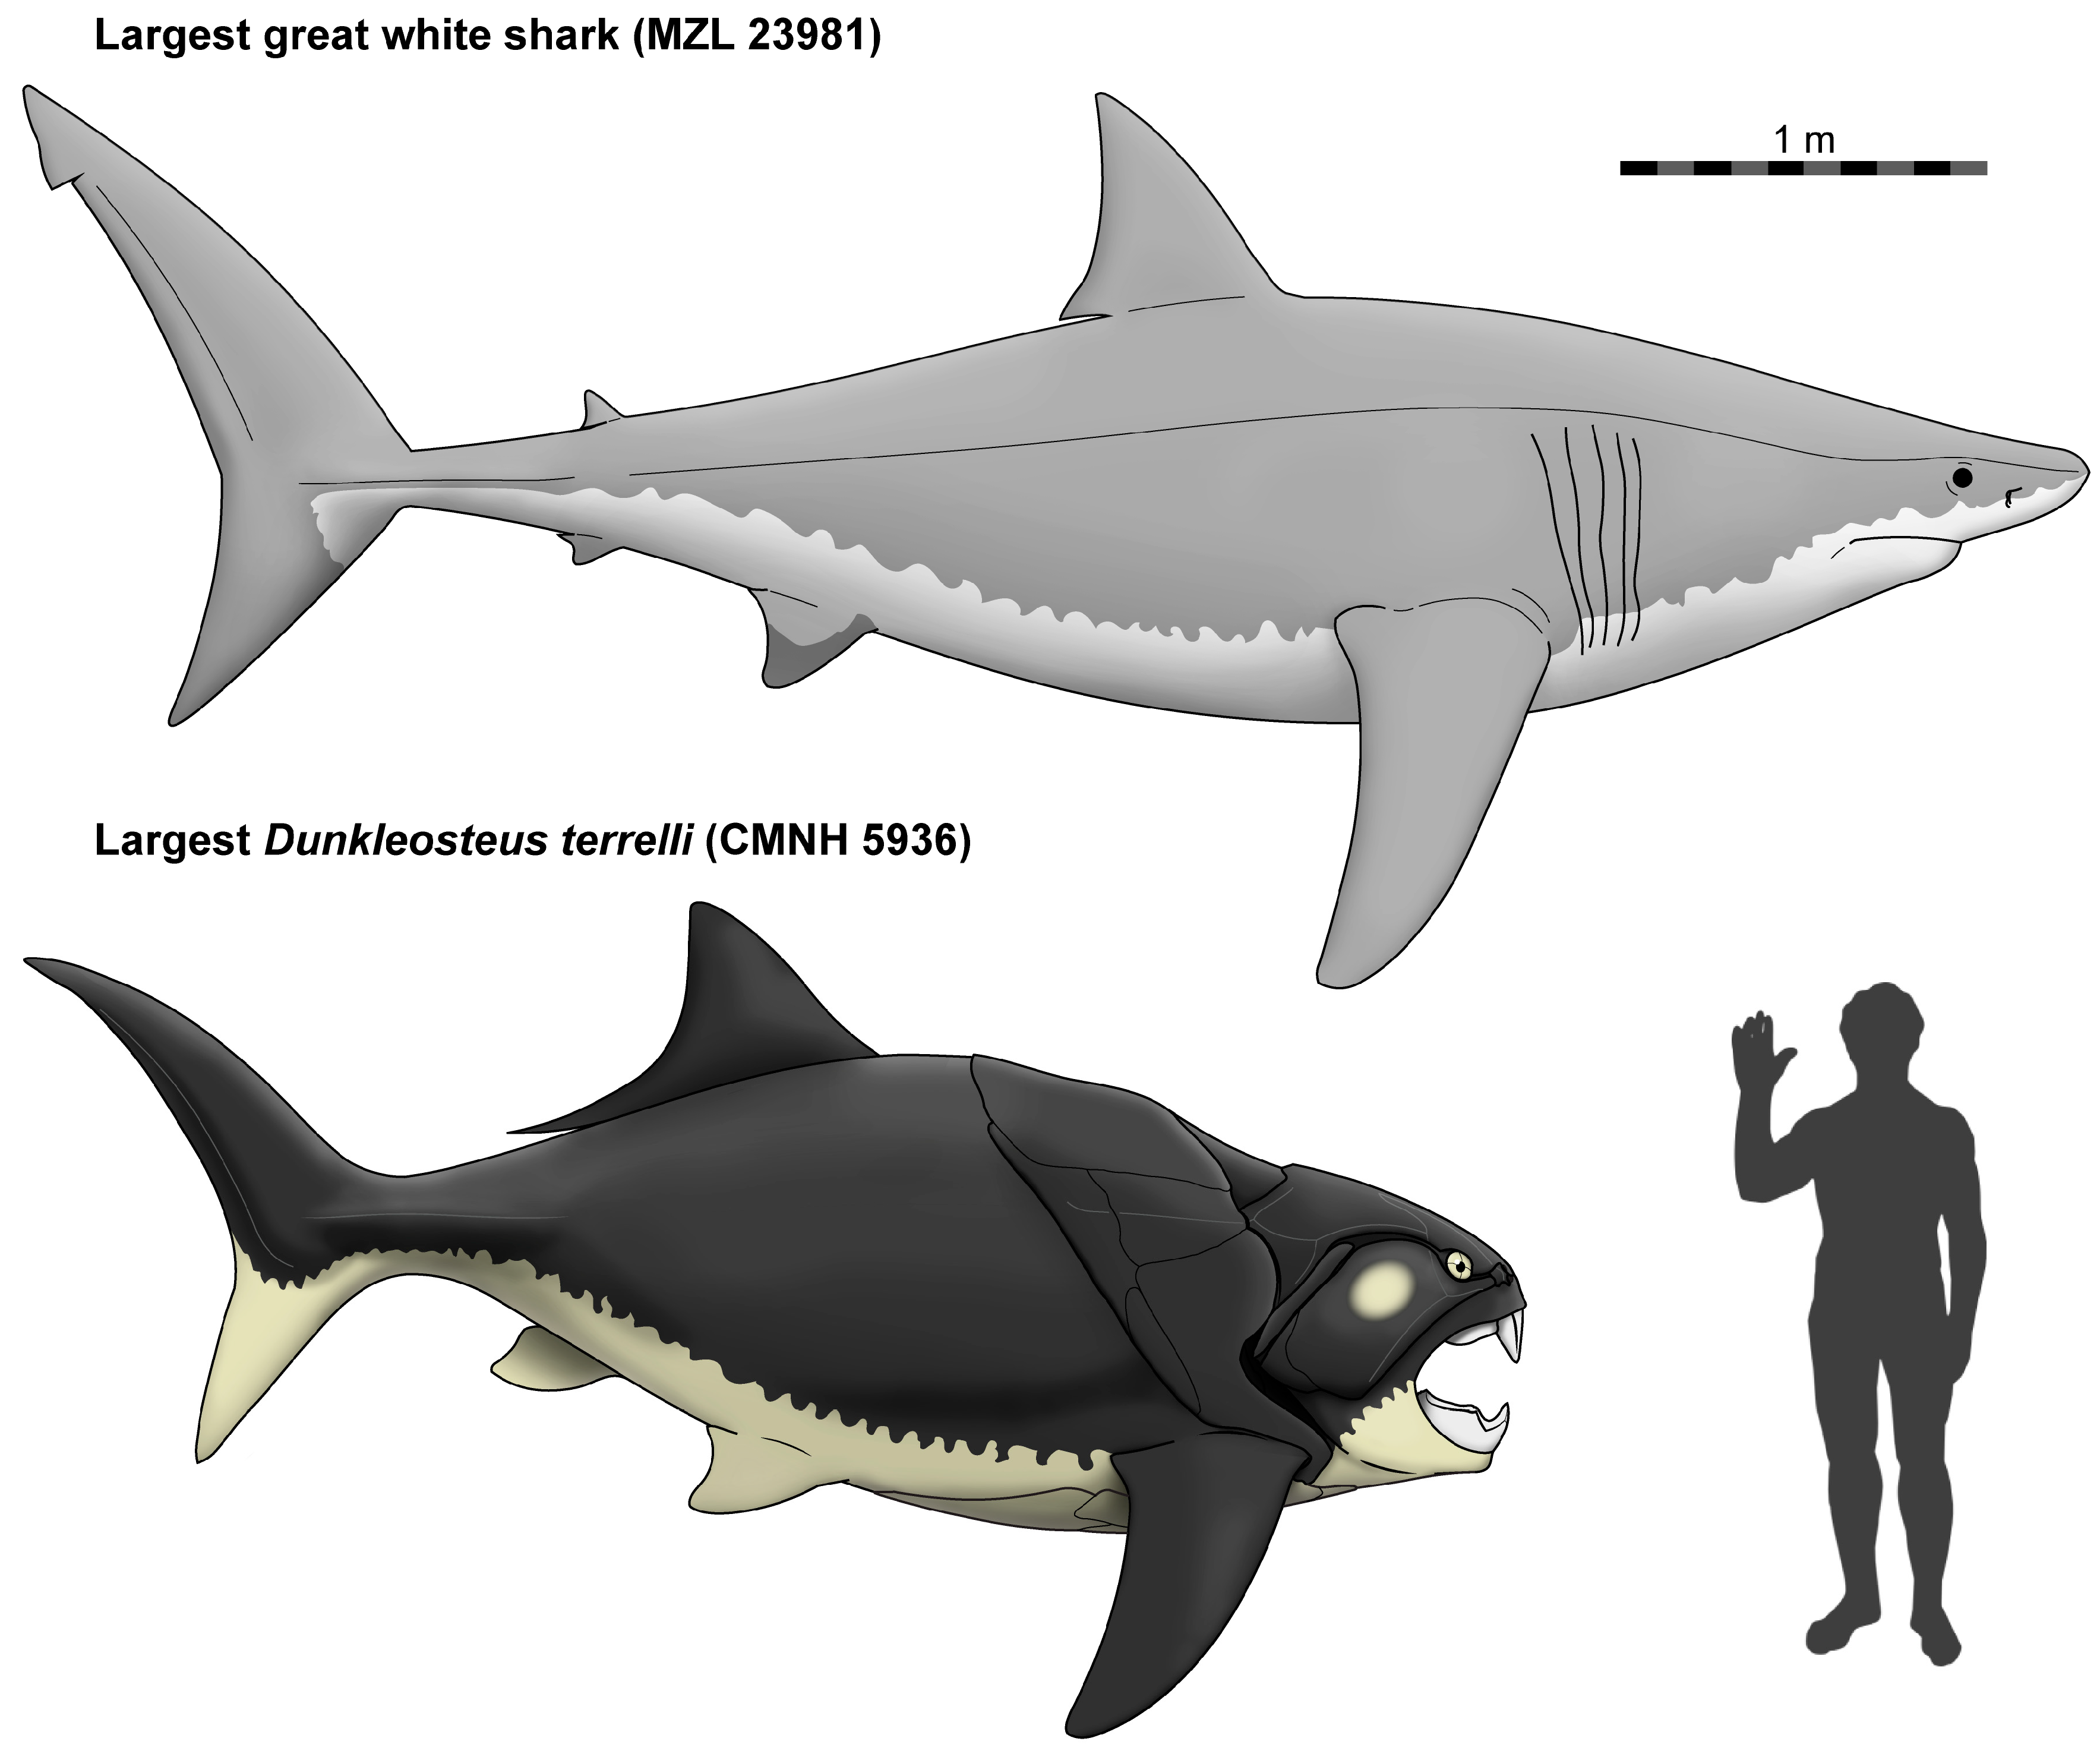
3.2.2. The Largest Dunkleosteus
3.2.3. Weight of Dunkleosteus terrelli
4. Discussion
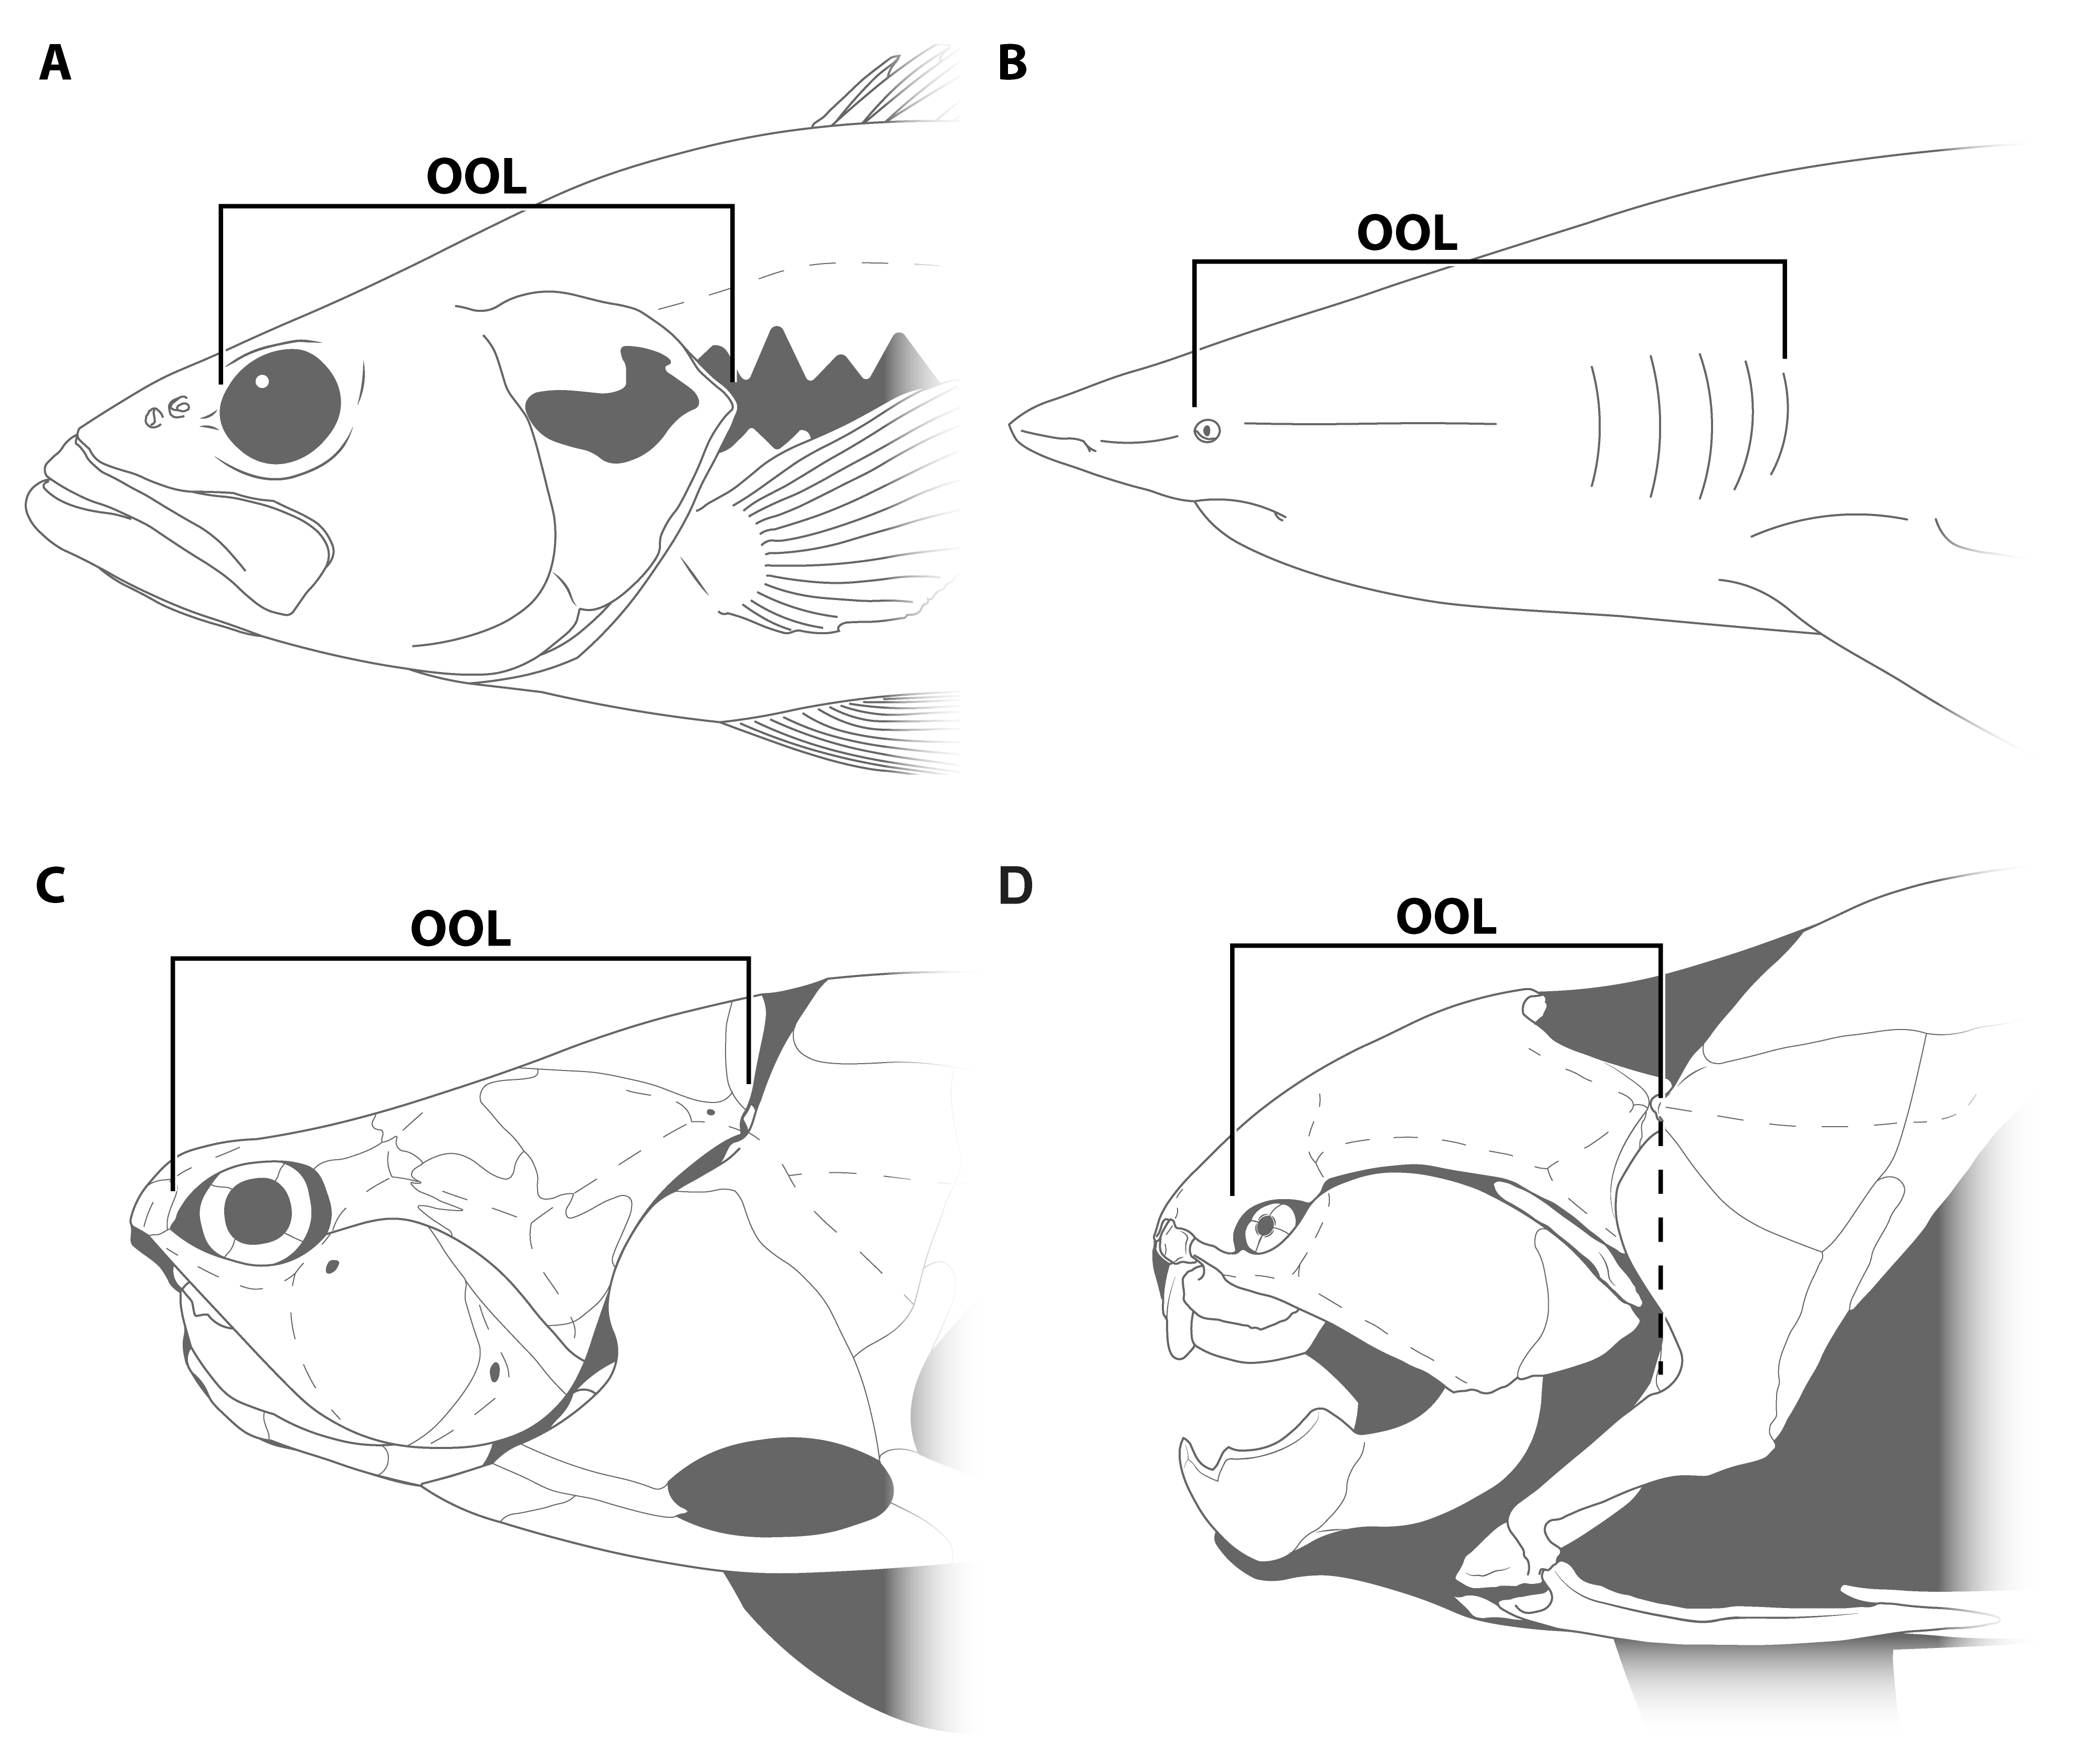
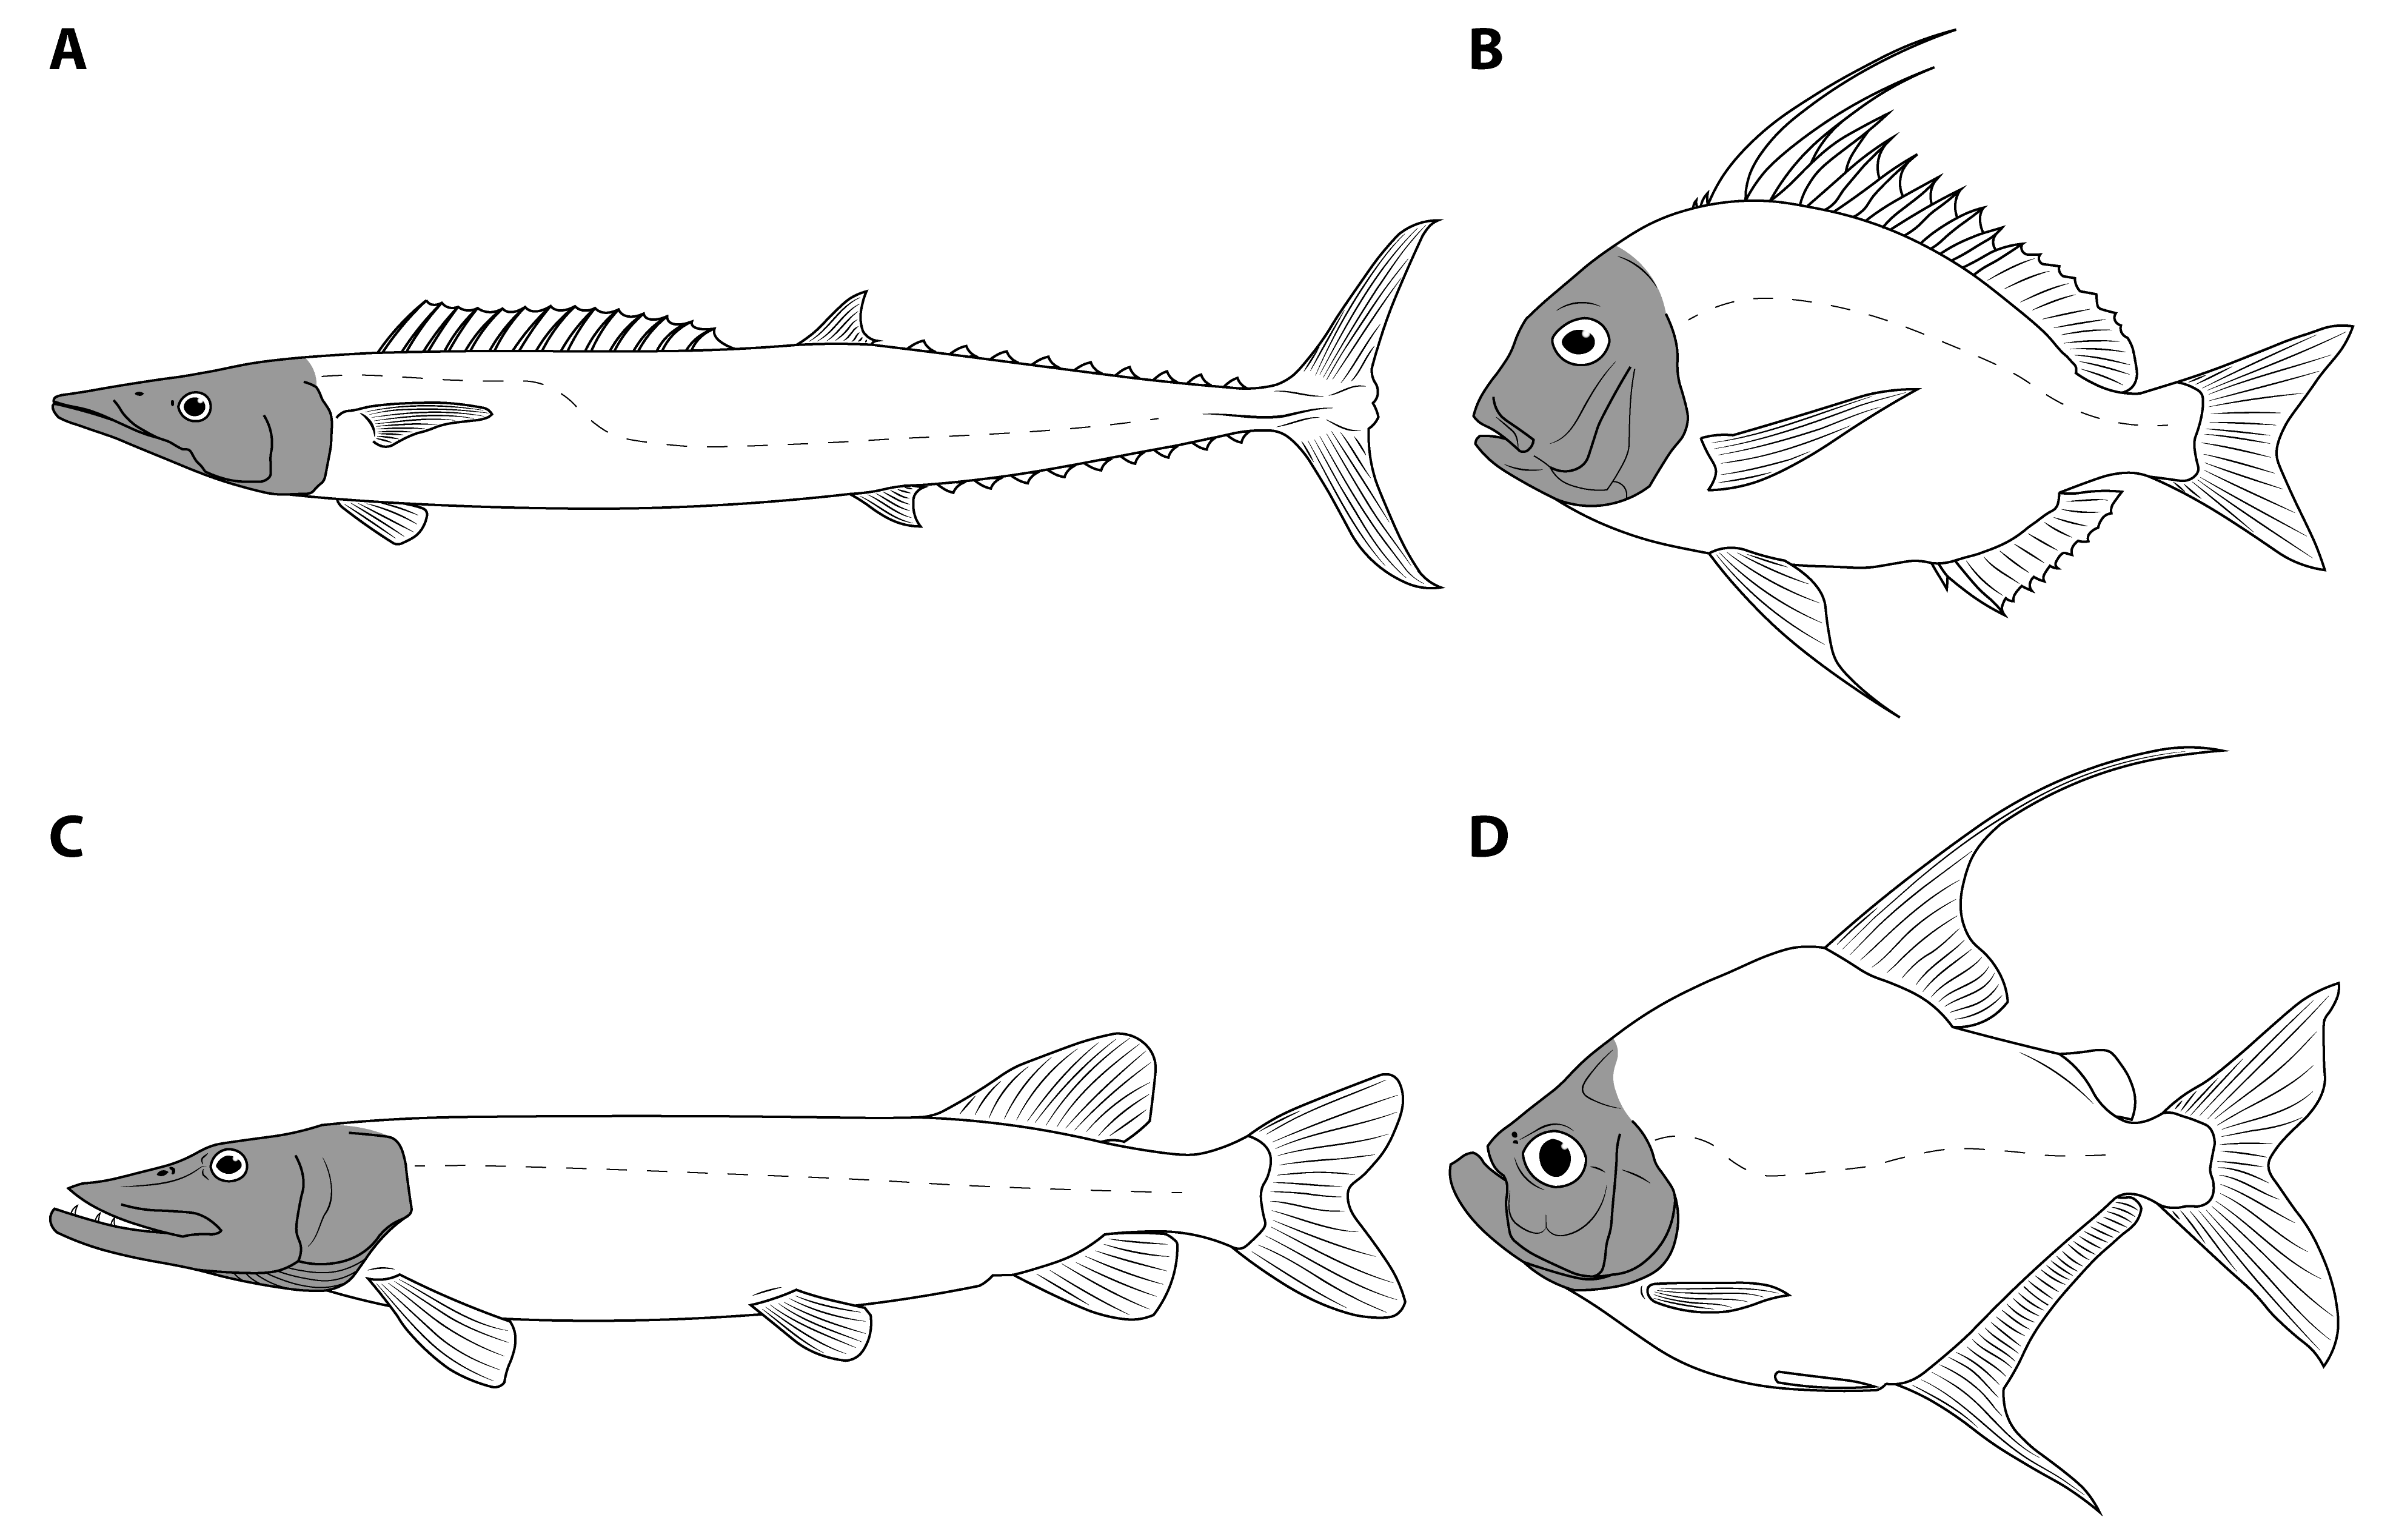
4.1. Head–Body Proportions in Fishes
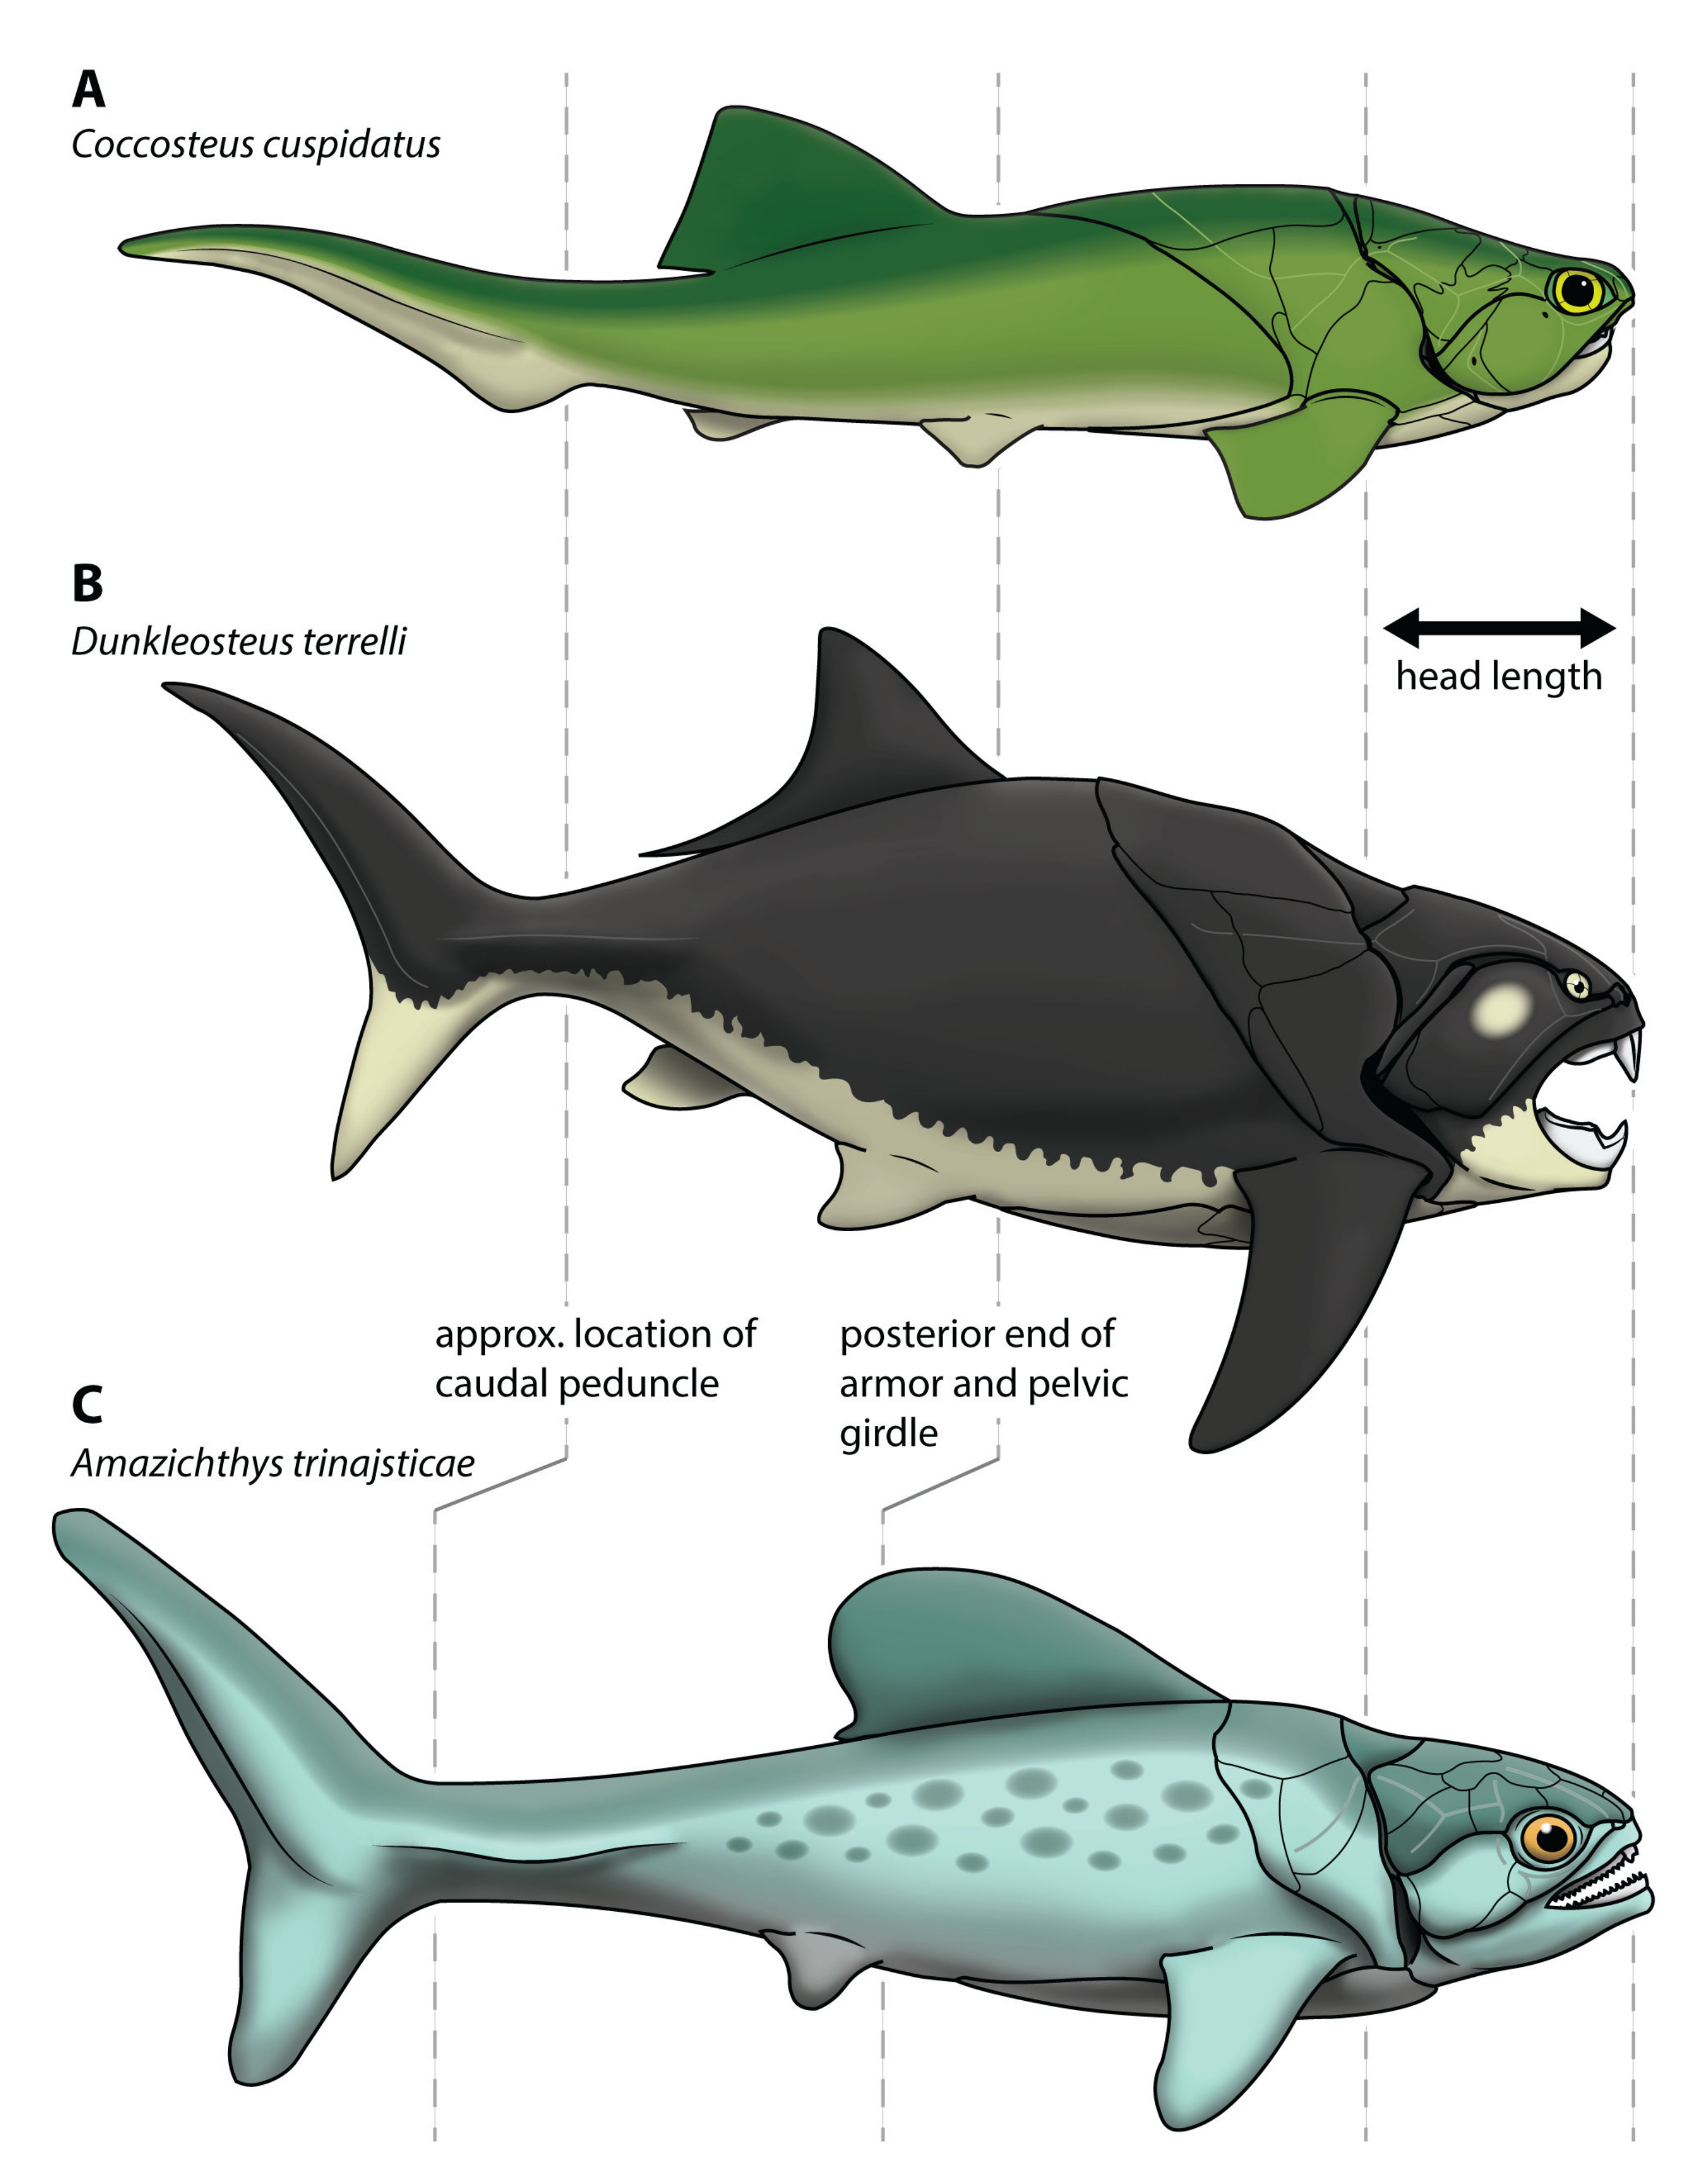
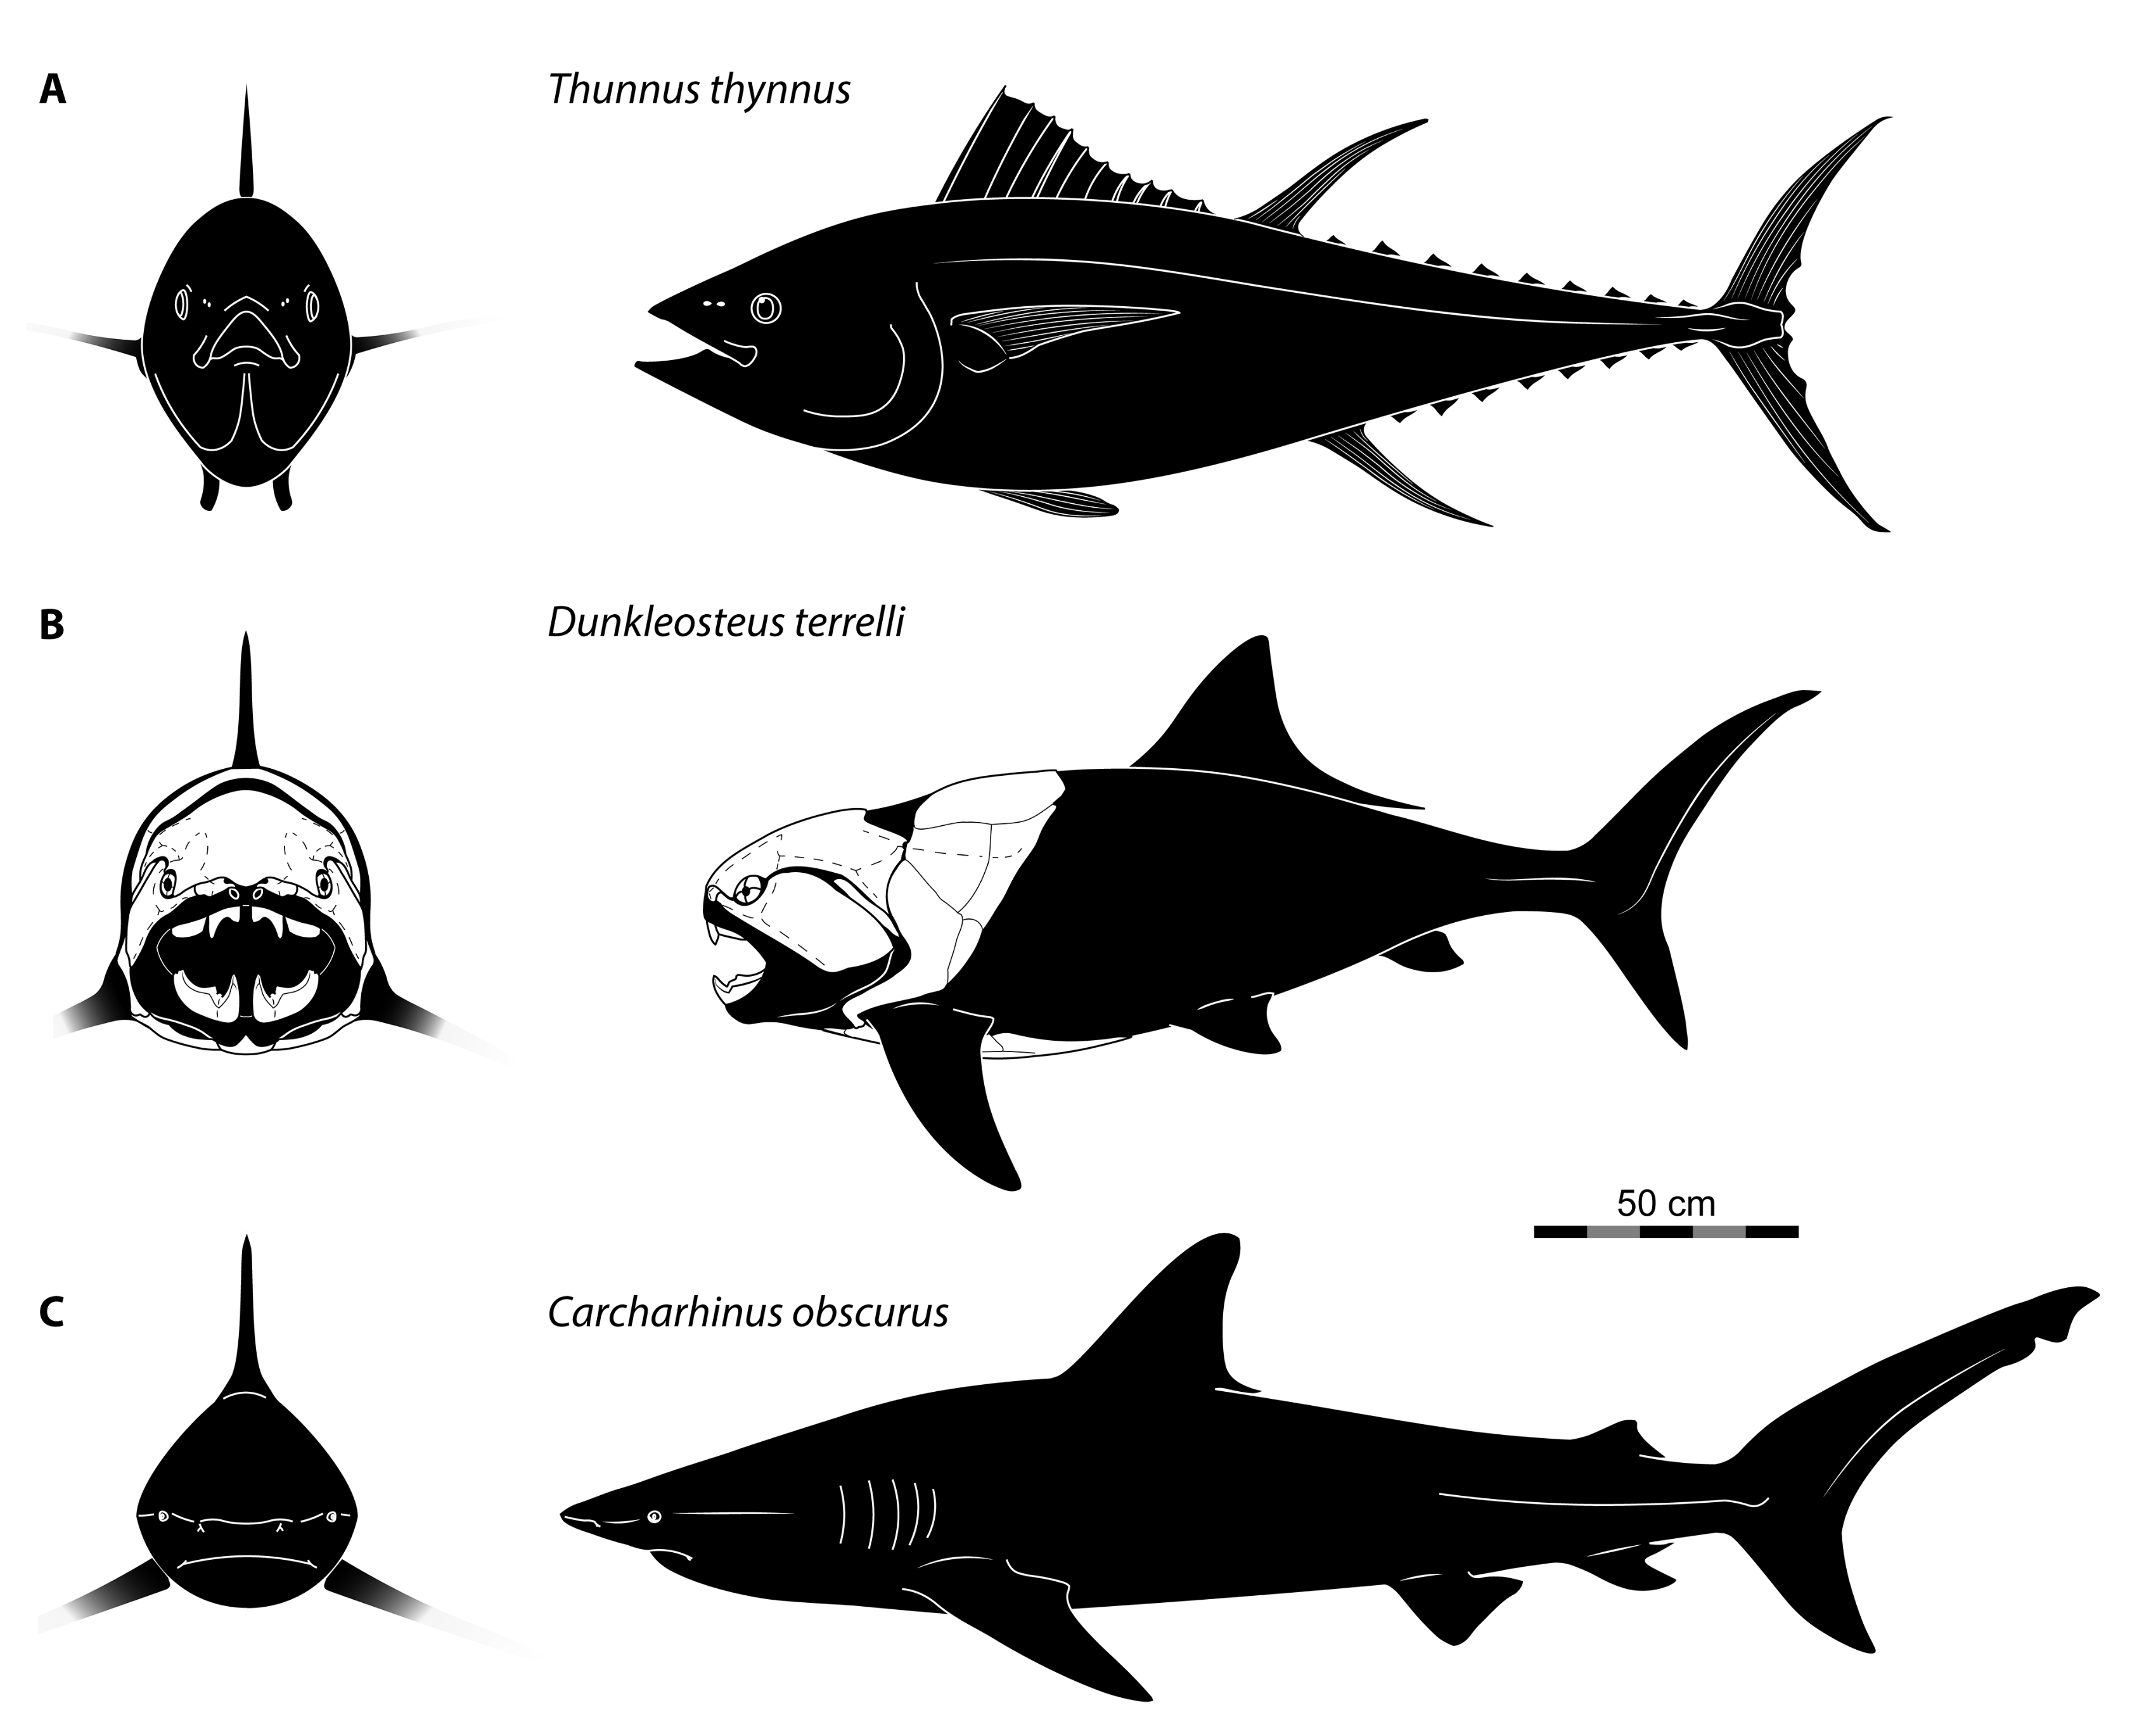
4.2. Body Shape of Arthrodires


4.3. Body Size of Dunkleosteus terrelli
4.4. Body Size Evolution in Paleozoic Vertebrates
5. Conclusions
Supplementary Materials
Funding
Institutional Review Board Statement
Data Availability Statement
Acknowledgments
Conflicts of Interest
References
- Zhu, M.; Yu, X.; Ahlberg, P.E.; Choo, B.; Lu, J.; Qiao, T.; Qu, Q.; Zhao, W.; Jia, L.; Blom, H.; et al. A Silurian placoderm with osteichthyan-like marginal jaw bones. Nature 2013, 502, 188–193. [Google Scholar] [CrossRef] [PubMed]
- Brazeau, M.D. The braincase and jaws of a Devonian ‘acanthodian’ and modern gnathostome origins. Nature 2009, 457, 305–308. [Google Scholar] [CrossRef] [PubMed] [Green Version]
- Zhu, M.; Ahlberg Per, E.; Pan, Z.; Zhu, Y.; Qiao, T.; Zhao, W.; Jia, L.; Lu, J. A Silurian maxillate placoderm illuminates jaw evolution. Science 2016, 354, 334–336. [Google Scholar] [CrossRef] [PubMed]
- Friedman, M. Styloichthys as the oldest coelacanth: Implications for early osteichthyan interrelationships. J. Syst. Palaeontol. 2007, 5, 289–343. [Google Scholar] [CrossRef]
- King, B.; Qiao, T.; Lee, M.S.Y.; Zhu, M.; Long, J.A. Bayesian Morphological Clock Methods Resurrect Placoderm Monophyly and Reveal Rapid Early Evolution in Jawed Vertebrates. Syst. Biol. 2017, 66, 499–516. [Google Scholar] [CrossRef]
- Long, J.A. The Rise of Fishes: 500 Million Years of Evolution, 2nd ed.; Johns Hopkins University Press: Baltimore, MD, USA, 2010. [Google Scholar]
- Young, G.C. Did placoderm fish have teeth? J. Vertebr. Palentology 2003, 23, 987–990. [Google Scholar] [CrossRef]
- Anderson, P.S.L.; Westneat, M.W. Feeding mechanics and bite force modelling of the skull of Dunkleosteus terrelli, an ancient apex predator. Biol. Lett. 2007, 3, 77–80. [Google Scholar] [CrossRef] [Green Version]
- Anderson, P.S.L.; Westneat, M.W. A biomechanical model of feeding kinematics for Dunkleosteus terrelli (Arthrodira, Placodermi). Paleobiology 2009, 35, 251–269. [Google Scholar] [CrossRef]
- Snively, E.; Anderson, P.S.L.; Ryan, M.J. Functional and ontogenetic implications of bite stress in arthrodire placoderms. Kirtlandia 2010, 57, 53–60. [Google Scholar]
- Carr, R.K. Paleoecology of Dunkleosteus terrelli. Kirtlandia 2010, 57, 36–45. [Google Scholar]
- Ferrón, H.G.; Martinez-Perez, C.; Botella, H. Ecomorphological inferences in early vertebrates: Reconstructing Dunkleosteus terrelli (Arthrodira, Placodermi) caudal fin from palaeoecological data. PeerJ 2017, 5, e4081. [Google Scholar] [CrossRef] [Green Version]
- Wilson, A.O.; Parnell, J.; Boyce, A.J.; Bowden, S.A. Constraining causes of fish mass mortality using ultra-high-resolution biomarker measurement. Chem. Geol. 2014, 385, 156–162. [Google Scholar] [CrossRef] [Green Version]
- Hamilton, R.F.M.; Trewin, N.H. Environmental Controls on Fish Faunas of the Middle Devonian Orcadian Basin. In Devonian of the World: Proceedings of the 2nd International Symposium on the Devonian System—Memoir 14, Volume I: Regional Syntheses, 1988; McMillan, N.J., Embry, A.F., Glass, D.J., Eds.; Canadian Society of Petroleum Geologists: Calgary, AB, Canada, 1988; pp. 589–600. [Google Scholar]
- Miles, R.S.; Westoll, T.S. The Placoderm Fish Coccosteus cuspidatus Miller ex Agassiz from the Middle Old Red Sandstone of Scotland. Part I. Descriptive Morphology. Trans. R. Soc. Edinb. 1968, 67, 373–476. [Google Scholar] [CrossRef]
- Trinajstic, K. New anatomical information on Holonema (Placodermi) based on material from the Frasnian Gogo Formation and the Givetian-Frasnian Gneudna Formation, Western Australia. Geodiversitas 1999, 21, 69–84. [Google Scholar]
- Gess, R.W.; Trinajstic, K.M. New morphological information on, and species of placoderm fish Africanaspis (Arthrodira, Placodermi) from the Late Devonian of South Africa. PLoS ONE 2017, 12, e0173169. [Google Scholar] [CrossRef] [Green Version]
- Newman, M.J.; den Blaauwen, J.; Burrow, C.; Jones, R. Earliest vertebrate embryos in the fossil record (Middle Devonian, Givetian). Palaeontology 2021, 64, 21–30. [Google Scholar] [CrossRef]
- Vézina, D. Plourdosteus canadensis (Woodward 1892), un Arthrodire du Frasnien inférieur du Canada: Contribution à l’étude morphologique et phylogénétique des Plourdosteidae (Vertebrata, Placodermi) du Dévonien moyen et supérieur; l’Université de Paris VII: Paris, France, 1988. [Google Scholar]
- Dennis, K.; Miles, R.S. A pachyosteomorph arthrodire from Gogo, Western Australia. Zool. J. Linn. Soc. 1981, 73, 213–258. [Google Scholar] [CrossRef]
- Jobbins, M.; Rücklin, M.; Ferrón, H.G.; Klug, C. A new selenosteid placoderm from the Late Devonian of the eastern Anti-Atlas (Morocco) with preserved body outline and its ecomorphology. Frontiers in Ecology and Evolution 2022, 10, 969158. [Google Scholar] [CrossRef]
- Boyle, J.; Ryan, M.J. New information on Titanichthys (Placodermi, Arthrodira) from the Cleveland Shale (Upper Devonian) of Ohio, USA. J. Paleontol. 2017, 91, 318–336. [Google Scholar] [CrossRef] [Green Version]
- Zhu, Y.-A.; Zhu, M.; Wang, J.-Q. Redescription of Yinostius major (Arthrodira: Heterostiidae) from the Lower Devonian of China, and the interrelationships of Brachythoraci. Zool. J. Linn. Soc. 2016, 176, 806–834. [Google Scholar] [CrossRef] [Green Version]
- Miles, R.S. The Placoderm Fish Rhachiosteus pterygiatus Gross and its Relationships. Earth Environ. Sci. Trans. R. Soc. Edinb. 1966, 66, 377–392. [Google Scholar] [CrossRef]
- Dunkle, D.H.; Bungart, P.A. A new arthrodiran fish from the upper Devonian Ohio Shales. Kirtlandia 1945, 8, 85–95. [Google Scholar]
- Dean, B. On the vertebral column, fins, and ventral armoring of Dinichthys. Proc. N. Y. Acad. Sci. 1896, 15, 157–188. [Google Scholar]
- Carr, R.K. Reanalysis of Heintzichthys gouldii (Newberry), an aspinothoracid arthrodire (Placodermi) from the Famennian of northern Ohio, with a review of brachythoracid systematics. Zool. J. Linn. Soc. 1991, 103, 349–390. [Google Scholar] [CrossRef] [Green Version]
- Carr, R.K.; Lelièvre, H.; Jackson, G.L. The ancestral morphotype for the gnathostome pectoral fin revisited and the placoderm condition. In Morphology, Phylogeny and Paleobiogeography of Fossil Fishes; Elliott, D.K., Maisey, J.G., Yu, X., Miao, D., Eds.; Verlag Dr. Friedrich Pfeil: München, Germany, 2010; pp. 107–122. [Google Scholar]
- Johanson, Z.; Trinajstic, K.; Cumbaa, S.; Ryan, M.J. Fusion in the vertebral column of the pachyosteomorph arthrodire Dunkleosteus terrelli (‘Placodermi’). Palaeontol. Electron. 2019, 22, 1–13. [Google Scholar] [CrossRef] [Green Version]
- Schmidt-Nielsen, K. Scaling: Why is Animal Size so Important? Cambridge University Press: Cambridge, UK, 1984; p. 241. [Google Scholar]
- Grubich, J.R.; Huskey, S.; Crofts, S.; Orti, G.; Porto, J. Mega-Bites: Extreme jaw forces of living and extinct piranhas (Serrasalmidae). Sci. Rep. 2012, 2, 1–9. [Google Scholar] [CrossRef] [Green Version]
- Sallan, L.; Galimberti, A.K. Body-size reduction in vertebrates following the end-Devonian mass extinction. Science 2015, 350, 812–815. [Google Scholar] [CrossRef]
- Engelman, R.K. Giant, swimming mouths: Oral dimensions of extant sharks do not accurately predict body size in Dunkleosteus terrelli (Placodermi: Arthrodira). PeerJ In press. 2023. [Google Scholar]
- Rinderknecht, A.; Blanco, R.E. The largest fossil rodent. Proc. R. Soc. B: Biol. Sci. 2008, 275, 923–928. [Google Scholar] [CrossRef]
- Millien, V. The largest among the smallest: The body mass of the giant rodent Josephoartigasia monesi. Proc. R. Soc. B: Biol. Sci. 2008, 275, 1953–1955. [Google Scholar] [CrossRef] [Green Version]
- Engelman, R.K. Resizing the largest known extinct rodents (Caviomorpha: Dinomyidae, Neoepiblemidae) using occipital condyle width. R. Soc. Open Sci. 2022, 9, 220370. [Google Scholar] [CrossRef] [PubMed]
- Garrick, J.A.F. Sharks of the genus Carcharhinus. NOAA Tech. Rep. NMFS Circ. 1982, 445, 1–194. [Google Scholar]
- Bauchot, R.; Bauchot, M.L.; Platel, R.; Ridet, J.M. Brains of Hawaiian Tropical Fishes; Brain Size and Evolution. Copeia 1977, 1977, 42–46. [Google Scholar] [CrossRef]
- Alexander, R.M. Functional Design in Fishes; Hutchinson University Library: London, UK, 1967. [Google Scholar]
- Van Valkenburgh, B. Skeletal and dental predictors of body mass in carnivores. In Body Size in Mammalian Paleobiology: Estimation and Biological Implications; Damuth, J., MacFadden, B.J., Eds.; Cambridge University Press: Cambridge, UK, 1990; pp. 181–205. [Google Scholar]
- Godoy, P.L.; Benson, R.B.J.; Bronzati, M.; Butler, R.J. The multi-peak adaptive landscape of crocodylomorph body size evolution. BMC Evol. Biol. 2019, 19, 167. [Google Scholar] [CrossRef] [Green Version]
- Hurlburt, G.; Heckert, A.B.; Farlow, J.O. Body mass estimates of phytosaurs (Archosauria: Parasuchidae) from the Petrified Forest Formation (Chinle Group: Revueltian) based on skull and limb bone measurements. New Mex. Mus. Nat. Hist. Sci. Bull. 2003, 24, 105–113. [Google Scholar]
- Bonani Mateussi, N.T.; Melo, B.F.; Oliveira, C. Molecular delimitation and taxonomic revision of the wimple piranha Catoprion (Characiformes: Serrasalmidae) with the description of a new species. J. Fish Biol. 2020, 97, 668–685. [Google Scholar] [CrossRef]
- Casselman, J.M.; Crossman, E.J.; Ihssen, P.E.; Reist, J.D.; Booke, H.E. Identification of muskellunge, northern pike, and their hybrids. Am. Fish. Soc. Spec. Publ. 1986, 15, 14–46. [Google Scholar]
- Randall, J.E.; Randall′s Tank Photos. Collection of 10,000 Large-Format Photos (Slides) of Dead Fishes. Available online: www.fishbase.org (accessed on 29 June 2022).
- Ward, A.B.; Mehta, R.S. Axial Elongation in Fishes: Using Morphological Approaches to Elucidate Developmental Mechanisms in Studying Body Shape. Integr. Comp. Biol. 2010, 50, 1106–1119. [Google Scholar] [CrossRef] [Green Version]
- Walker, J.A.; Alfaro, M.E.; Noble, M.M.; Fulton, C.J. Body Fineness Ratio as a Predictor of Maximum Prolonged-Swimming Speed in Coral Reef Fishes. PLoS ONE 2013, 8, e75422. [Google Scholar] [CrossRef] [Green Version]
- Witmer, L.M. The Extant Phylogenetic Bracket and the importance of reconstructing soft tissues in fossils. In Functional Morphology in Vertebrate Paleontology; Thomason, J.J., Ed.; Cambridge University Press: New York, NY, USA, 1995; pp. 19–33. [Google Scholar]
- Brazeau, M.D.; Friedman, M. The origin and early phylogenetic history of jawed vertebrates. Nature 2015, 520, 490–497. [Google Scholar] [CrossRef] [Green Version]
- Heintz, A. The structure of Dinichthys: A contribution to our knowledge of the Arthrodira. In The Bashford Dean Memorial Volume; Gudger, E.W., Ed.; American Museum of Natural History: New York, NY, USA, 1932; pp. 115–224. [Google Scholar]
- Carr, R.K.; Johanson, Z.; Ritchie, A. The phyllolepid placoderm Cowralepis mclachlani: Insights into the evolution of feeding mechanisms in jawed vertebrates. J. Morphol. 2009, 270, 775–804. [Google Scholar] [CrossRef] [PubMed]
- Dean, B. A mounted specimen of Dinichthys terrelli. Mem. Am. Mus. Nat. Hist. 1909, 9, 268–269. [Google Scholar]
- Desmond, A.J. On the coccosteid arthrodire Millerosteus minor. Zool. J. Linn. Soc. 1974, 54, 277–298. [Google Scholar] [CrossRef]
- Miles, R.S.; White, E.I. The Holonematidae (placoderm fishes), a review based on new specimens of Holonema from the Upper Devonian of Western Australia. Philos. Trans. R. Soc. London B Biol. Sci. 1971, 263, 101–234. [Google Scholar] [CrossRef]
- Trinajstic, K.; Sanchez, S.; Dupret, V.; Tafforeau, P.; Long, J.; Young, G.; Senden, T.; Boisvert, C.; Power, N.; Ahlberg, P.E. Fossil musculature of the most primitive jawed vertebrates. Science 2013, 341, 160–164. [Google Scholar] [CrossRef] [Green Version]
- Trinajstic, K.; Briggs, D.E.G.; Long, J.A. The Gogo Formation Lagerstätte: A view of Australia′s first great barrier reef. J. Geol. Soc. 2022, 179, jgs2021-105. [Google Scholar] [CrossRef]
- Trinajstic, K.; Long, J.A.; Sanchez, S.; Boisvert, C.A.; Snitting, D.; Tafforeau, P.; Dupret, V.; Clement, A.M.; Currie, P.D.; Roelofs, B.; et al. Exceptional preservation of organs in Devonian placoderms from the Gogo lagerstätte. Science 2022, 377, 1311–1314. [Google Scholar] [CrossRef]
- Long, J.A.; Trinajstic, K.; Johanson, Z. Devonian arthrodire embryos and the origin of internal fertilization in vertebrates. Nature 2009, 457, 1124–1127. [Google Scholar] [CrossRef]
- Ørvig, T. New Finds of Acanthodians, Arthrodires, Crossopterygians, Ganoids and Dipnoans in the Upper Middle Devonian Calcareous Flags (Oberer Plattenkalk) of the Bergisch Gladbach-Paffrath Trough. Paläontologische Z. 1960, 34, 295–335. [Google Scholar] [CrossRef]
- Miles, R.S. Observations on the ptyctodont fish, Rhamphodopsis Watson. Zool. J. Linn. Soc. 1967, 47, 99–120. [Google Scholar] [CrossRef]
- Denison, R.H. Placodermi. In Handbook of Palaeoichthyology; Schultze, H.-P., Ed.; Gustav Fischer Verlag: Stuttgart, Germany, 1978; Volume 2, pp. 1–128. [Google Scholar]
- Béchard, I.; Arsenault, F.; Cloutier, R.; Kerr, J. The Devonian placoderm fish Bothriolepis canadensis revisited with three-dimensional digital imagery. Palaeontol. Electron. 2014, 17, 1–19. [Google Scholar] [CrossRef]
- Dennis-Bryan, K. A new species of eastmanosteid arthrodire (Pisces: Placodermi) from Gogo, Western Australia. Zool. J. Linn. Soc. 1987, 90, 1–64. [Google Scholar] [CrossRef]
- Miles, R.S.; Dennis, K. A primitive eubrachythoracid arthrodire from Gogo, Western Australia. Zool. J. Linn. Soc. 1979, 66, 31–62. [Google Scholar] [CrossRef]
- Gardiner, B.G.; Miles, R.S. Eubrachythoracid arthrodires from Gogo, Western Australia. Zool. J. Linn. Soc. 1994, 112, 443–477. [Google Scholar] [CrossRef]
- Long, J.A. Two new arthrodires (placoderm fishes) from the Upper Devonian Gogo Formation, Western Australia. Mem.-Qld. Mus. 1990, 28, 51–64. [Google Scholar]
- Froese, R.; Pauly, D. FishBase 2000: Concepts, design and data sources; ICLARM: Los Baños, CA,USA; Laguna, Philippines, 2000; p. 344. [Google Scholar]
- Hubbs, C.; Lagler, K.; Smith, G. Fishes of the Great Lakes Region, Revised ed.; University of Michigan Press: Ann Arbor, MI, USA, 2004. [Google Scholar]
- Compagno, L.J.V. Sharks of the World. An Annotated and Illustrated Catalogue of Shark Species Known to Date. Part 1. Hexanchiformes to Lamniformes; Food and Agriculture Organization of the United Nations: Rome, Italy, 1984. [Google Scholar]
- Johanson, Z.; Smith, M.M. Placoderm fishes, pharyngeal denticles, and the vertebrate dentition. J. Morphol. 2003, 257, 289–307. [Google Scholar] [CrossRef]
- Smith, C.L. A revision of the American groupers: Epinephelus and allied genera. Bull. Am. Mus. Nat. Hist. 1971, 146, 67–242. [Google Scholar]
- Francis, M.P. Morphometric minefields—Towards a measurement standard for chondrichthyan fishes. Environ. Biol. Fishes 2006, 77, 407–421. [Google Scholar] [CrossRef]
- Howe, J.C. Standard length: Not quite so standard. Fish. Res. 2002, 56, 1–7. [Google Scholar] [CrossRef]
- Helfman, G.S.; Collete, B.B.; Facey, D.E.; Bowen, B.W. The Diversity of Fishes: Biology, Evolution, and Ecology, 2nd ed.; Wiley-Blackwell: West Sussex, UK, 2009; p. 736. [Google Scholar]
- Betancur, R.R.; Wiley, E.O.; Arratia, G.; Acero, A.; Bailly, N.; Miya, M.; Lecointre, G.; Orti, G. Phylogenetic classification of bony fishes. BMC Evol. Biol. 2017, 17, 162. [Google Scholar] [CrossRef] [Green Version]
- Hughes, L.C.; Ortí, G.; Huang, Y.; Sun, Y.; Baldwin, C.C.; Thompson, A.W.; Arcila, D.; Betancur, R.R.; Li, C.; Becker, L.; et al. Comprehensive phylogeny of ray-finned fishes (Actinopterygii) based on transcriptomic and genomic data. Proc. Natl. Acad. Sci. USA 2018, 115, 6249–6254. [Google Scholar] [CrossRef] [PubMed] [Green Version]
- R Core Team R: A Language and Environment for Statistical Computing; R Foundation for Statistical Computing: Vienna, Austria, 2020.
- Wickham, H.; Averick, M.; Bryan, J.; Chang, W.; McGowan, L.; François, R.; Grolemund, G.; Hayes, A.; Henry, L.; Hester, J.; et al. Welcome to the Tidyverse. J. Open Source Softw. 2019, 4, 1686. [Google Scholar] [CrossRef] [Green Version]
- Robinson, D.; Hayes, A.; Couch, S. broom: Convert Statistical Objects into Tidy Tibbles, R package version 1.0.1; R Foundation for Statistical Computing: Vienna, Austria, 2022; Available online: https://CRAN.R-project.org/package=broom (accessed on 29 June 2022).
- Wilke, C.O. cowplot: Streamlined Plot Theme and Plot Annotations for ‘ggplot2’, R package version 1.1.1; R Foundation for Statistical Computing: Vienna, Austria, 2020; Available online: https://CRAN.R-project.org/package=cowplot (accessed on 29 June 2022).
- Meyer, D.; Dimitriadou, E.; Hornik, K.; Weingessel, A.; Leisch, F. e1071: Misc Functions of the Department of Statistics; Probability Theory Group (Formerly: E1071), TU Wien, 1.7-12; R Foundation for Statistical Computing: Vienna, Austria, 2022; Available online: https://CRAN.R-project.org/package=e1071 (accessed on 29 June 2022).
- Xu, S. ggstar: Multiple Geometric Shape Point Layer for ‘ggplot2’, R package version 1.0.4; R Foundation for Statistical Computing: Vienna, Austria, 2022; Available online: https://CRAN.R-project.org/package=ggstar (accessed on 29 June 2022).
- Wilke, C.; Wiernik, B.M. ggtext: Improved Text Rendering Support for ‘ggplot2’, R package version 0.1.2; R Foundation for Statistical Computing: Vienna, Austria, 2022; Available online: https://CRAN.R-project.org/package=ggtext (accessed on 29 June 2022).
- Auguie, B. gridExtra: Miscellaneous Functions for "Grid" Graphics, R package version 2.3; R Foundation for Statistical Computing: Vienna, Austria, 2017; Available online: https://CRAN.R-project.org/package=gridExtra (accessed on 29 June 2022).
- Zhu, H. kableExtra: Construct Complex Table with ‘kable’ and Pipe Syntax, R package version 1.3.4; R Foundation for Statistical Computing: Vienna, Austria, 2021; Available online: https://CRAN.R-project.org/package=kableExtra (accessed on 29 June 2022).
- Ooms, J. magick: Advanced Graphics and Image-Processing in R, R package version 2.7.3; R Foundation for Statistical Computing: Vienna, Austria, 2021; Available online: https://CRAN.R-project.org/package=magick (accessed on 29 June 2022).
- Bache, S.M.; Wickham, H. magrittr: A Forward-Pipe Operator for R, R package version 2.0.3; R Foundation for Statistical Computing: Vienna, Austria, 2022; Available online: https://CRAN.R-project.org/package=magrittr (accessed on 29 June 2022).
- Schauberger, P.; Walker, A.; Braglia, L. openxlsx: Read, Write, and Edit xlsx Files, R package version 4.2.5.1; R Foundation for Statistical Computing: Vienna, Austria, 2022; Available online: https://CRAN.R-project.org/package=openxslx (accessed on 29 June 2022).
- Wickham, H.; Bryan, J. readxl: Read Excel Files, R package version 1.4.1; R Foundation for Statistical Computing: Vienna, Austria, 2022; Available online: https://CRAN.R-project.org/package=readxl (accessed on 29 June 2022).
- Henry, L.; Wickham, H. rlang: Functions for Base Types and Core R and ‘Tidyverse’ Features, R package version 1.0.6; R Foundation for Statistical Computing: Vienna, Austria, 2022; Available online: https://CRAN.R-project.org/package=rlang (accessed on 29 June 2022).
- Wickham, H.; Seidel, D. scales: Scale Functions for Visualization, R package version 1.2.1; R Foundation for Statistical Computing: Vienna, Austria, 2022; Available online: https://CRAN.R-project.org/package=scales (accessed on 29 June 2022).
- Hopkins, S.S.B. Estimation of body size in fossil mammals. In Methods in Paleoecology: Reconstructing Cenozoic Terrestrial Environments and Ecological Communities; Croft, D.A., Su, D.F., Simpson, S.W., Eds.; Springer Nature: Cham, Switzerland, 2018; pp. 7–22. [Google Scholar]
- Robins, C.R. Summer concentration of white marlin, Tetrapturus albidus, west of the straits of Gibraltar. In Proceedings of the International Billfish Symposium Kailua-Kona, Hawaii, 9–12 August 1792. Part 2. Review and Contributed Papers; National Oceanic and Atmospheric Administration, NOAA Technical Report NMFS SSRF-675; Shomura, S., Williams, F., Eds.; National Marine Fisheries Service: Seattle, WA, USA, 1974; pp. 164–174. [Google Scholar]
- Robins, C.R.; de Sylva, D.P. Description and Relationships of the Longbill Spearfish, Tetrapturus belone, Based on Western North Atlantic Specimens. Bull. Mar. Sci. 1960, 10, 383–413. [Google Scholar]
- Robins, C.R.; De Sylva, D.P. A new western Atlantic spearfish, Tetrapturus pfluegeri, with a redescription of the Mediterranean spearfish Tetrapturus belone. Bull. Mar. Sci. Gulf Caribb. 1963, 13, 85–122. [Google Scholar]
- Russell, F.S. Tunny Investigations made in the North Sea on Col. E. T. Peel’s Yacht, “St. George,” Summer, 1933. Part I. Biometric Data. J. Mar. Biol. Assoc. United Kingd. 1934, 19, 503–522. [Google Scholar] [CrossRef] [Green Version]
- Gregory, W.K.; Conrad, G.M. The comparative osteology of the swordfish (Xiphias) and the sailfish (Istiophorus). Am. Mus. Novit. 1937, 952, 1–25. [Google Scholar]
- White, W.T.; Kyne, P.M.; Harris, M. Lost before found: A new species of whaler shark Carcharhinus obsolerus from the Western Central Pacific known only from historic records. PLoS ONE 2019, 14, e0209387. [Google Scholar] [CrossRef]
- Chang, J.; Rabosky, D.L.; Smith, S.A.; Alfaro, M.E. An r package and online resource for macroevolutionary studies using the ray-finned fish tree of life. Methods Ecol. Evol. 2019, 10, 1118–1124. [Google Scholar] [CrossRef] [Green Version]
- Rabosky, D.L.; Chang, J.; Title, P.O.; Cowman, P.F.; Sallan, L.; Friedman, M.; Kaschner, K.; Garilao, C.; Near, T.J.; Coll, M.; et al. An inverse latitudinal gradient in speciation rate for marine fishes. Nature 2018, 559, 392–395. [Google Scholar] [CrossRef]
- Engelman, R.K. Occipital condyle width (OCW) is a highly accurate predictor of body mass in therian mammals. BMC Biol. 2022, 20, 1–37. [Google Scholar] [CrossRef]
- Ane, C. Re: [R-sig-phylo] Model Selection and PGLS. Available online: https://www.mail-archive.com/r-sig-phylo@r-project.org/msg05774.html (accessed on 29 June 2022).
- Nelson, A.; Engelman, R.K.; Croft, D.A. How large were South American notoungulates? New estimates based on head-body length, condylobasal length, and occipital condyle width. J. Mammal. Evol. In press. 2023. [Google Scholar]
- Garland, T., Jr.; Ives, A.R. Using the Past to Predict the Present: Confidence Intervals for Regression Equations in Phylogenetic Comparative Methods. Am. Nat. 2000, 155, 346–364. [Google Scholar] [CrossRef]
- Rohlf, F.J. A comment on phylogenetic correction. Evolution 2006, 60, 1509–1515. [Google Scholar] [CrossRef]
- Akaike, H. A new look at the statistical model identification. IEEE Trans. Autom. Control. 1974, 19, 716–723. [Google Scholar] [CrossRef]
- Schwarz, G. Estimating the Dimension of a Model. Ann. Statist. 1978, 6, 461–464. [Google Scholar] [CrossRef]
- Smith, R.J. Interpretation of correlations in intraspecific and interspecific allometry. Growth 1981, 45, 291–297. [Google Scholar]
- Smith, R.J. Allometric scaling in comparative biology: Problems of concept and method. Am. J. Physiol. 1984, 246, R152–R160. [Google Scholar] [CrossRef]
- Smith, R.J. Bias in equations used to estimate fossil primate body mass. J. Hum. Evol. 1993, 25, 31–41. [Google Scholar] [CrossRef]
- Smith, R.J. Logarithmic transformation bias in allometry. Am. J. Phys. Anthropol. 1993, 90, 215–228. [Google Scholar] [CrossRef]
- Duan, N. Smearing Estimate: A Nonparametric Retransformation Method. J. Am. Stat. Assoc. 1983, 78, 605–610. [Google Scholar] [CrossRef]
- Snowdon, P. A ratio estimator for bias correction in logarithmic regressions. Can. J. For. Res. 1991, 21, 720–724. [Google Scholar] [CrossRef]
- Tsubamoto, T. Estimating Body Mass from the Astragalus in Mammals. Acta Palaeontol. Pol. 2014, 59, 259–265. [Google Scholar] [CrossRef] [Green Version]
- Engelman, R.K. Reconstruction of Dunkleosteus terrelli (Placodermi: Arthrodira): A new look for the Devonian’s most famous predator. In preparation.
- Hussakof, L. Notes on the Devonian ″placoderm″ Dinichthys intermedius Newb. Bull. Am. Mus. Nat. Hist. 1905, 21, 27–36. [Google Scholar]
- Hlavin, W.J. Biostratigraphy of the Late Devonian Black Shales on the Cratonal Margin of the Appalachian Geosyncline. Ph.D. Thesis, Boston University Graduate School, Ann Arbor, MI, USA, 1976. [Google Scholar]
- Ault, J.S.; Luo, J. A reliable game fish weight estimation model for Atlantic tarpon (Megalops atlanticus). Fish. Res. 2013, 139, 110–117. [Google Scholar] [CrossRef]
- Froese, R.; Thorson, J.T.; Reyes, R.B. A Bayesian approach for estimating length-weight relationships in fishes. J. Appl. Ichthyol. 2014, 30, 78–85. [Google Scholar] [CrossRef] [Green Version]
- Courtney, M.; Cole-Fletcher, S.; Marin-Salcedo, L.; Rana, A. Errors in Length-weight Parameters at FishBase.org. Nat. Preced. 2011. [Google Scholar] [CrossRef]
- Froese, R. Cube law, condition factor and weight–length relationships: History, meta-analysis and recommendations. J. Appl. Ichthyol. 2006, 22, 241–253. [Google Scholar] [CrossRef]
- Yeh, C.F.; Hodson, R.G. Effects of Formalin on Length and Weight of Bluegill and White Crappie from Lake Nasworthy, Texas. Southwest. Nat. 1975, 20, 315–321. [Google Scholar] [CrossRef]
- Mollet, H.F.; Cailliet, G.M. Using allometry to predict body mass from linear measurements of the white shark. In Great White Sharks: The Biology of Carcharodon Carcharias; Klimley, A.P., Ainley, D.G., Eds.; Academic Press: New York, NY, USA, 1996; pp. 81–89. [Google Scholar]
- Wall, W.P. The Correlation between High Limb-Bone Density and Aquatic Habits in Recent Mammals. J. Paleontol. 1983, 57, 197–207. [Google Scholar]
- ICRP. Basic anatomical and physiological data: The skeleton. Ann. ICRP 1995, 25, 1–80. [Google Scholar] [CrossRef]
- Giles, S.; Rücklin, M.; Donoghue, P.C.J. Histology of “placoderm” dermal skeletons: Implications for the nature of the ancestral gnathostome. J. Morphol. 2013, 274, 627–644. [Google Scholar] [CrossRef] [Green Version]
- Fabbri, M.; Navalón, G.; Benson, R.B.J.; Pol, D.; O’Connor, J.; Bhullar, B.-A.S.; Erickson, G.M.; Norell, M.A.; Orkney, A.; Lamanna, M.C.; et al. Subaqueous foraging among carnivorous dinosaurs. Nature 2022, 603, 852–857. [Google Scholar] [CrossRef]
- Houssaye, A.; Martin Sander, P.; Klein, N. Adaptive Patterns in Aquatic Amniote Bone Microanatomy-More Complex than Previously Thought. Integr. Comp. Biol. 2016, 56, 1349–1369. [Google Scholar] [CrossRef] [Green Version]
- Horton, J.M.; Summers, A.P. The material properties of acellular bone in a teleost fish. J. Exp. Biol. 2009, 212, 1413–1420. [Google Scholar] [CrossRef] [Green Version]
- Davesne, D.; Meunier, F.J.; Schmitt, A.D.; Friedman, M.; Otero, O.; Benson, R.B.J. The phylogenetic origin and evolution of acellular bone in teleost fishes: Insights into osteocyte function in bone metabolism. Biol. Rev. 2019, 94, 1338–1363. [Google Scholar] [CrossRef]
- Knell, R.J. On the analysis of non-linear allometries. Ecol. Entomol. 2009, 34, 1–11. [Google Scholar] [CrossRef] [Green Version]
- Paiva, A.L.S.; Godoy, P.L.; Souza, R.B.B.; Klein, W.; Hsiou, A.S. Body size estimation of Caimaninae specimens from the Miocene of South America. J. S. Am. Earth Sci. 2022, 118, 103970. [Google Scholar] [CrossRef]
- Freedman, J.A.; Noakes, D.L.G. Why are there no really big bony fishes? A point-of-view on maximum body size in teleosts and elasmobranchs. Rev. Fish Biol. Fish. 2002, 12, 403–416. [Google Scholar] [CrossRef]
- Baker, C.F.; Rossi, C.R.; Quiroga, P.; White, E.; Williams, P.; Kitson, J.; Bice, C.M.; Renaud, C.B.; Potter, I.; Neira, F.J.; et al. Morphometric and physical characteristics distinguishing adult Patagonian lamprey, Geotria macrostoma from the pouched lamprey, Geotria australis. PLoS ONE 2021, 16, e0250601. [Google Scholar] [CrossRef]
- Schultze, H.-P. Juvenile specimens of Eusthenopteron foordi Whiteaves, 1881 (osteolepiform rhipidistian, Pisces) from the Late Devonian of Miguasha, Quebec, Canada. J. Vertebr. Paleontol. 1984, 4, 1–16. [Google Scholar] [CrossRef]
- Cote, S.; Carroll, R.; Cloutier, R.; Bar-Sagi, L. Vertebral development in the Devonian Sarcopterygian fish Eusthenopteron foordi and the polarity of vertebral evolution in non-amniote tetrapods. J. Vertebr. Paleontol. 2002, 22, 487–502. [Google Scholar] [CrossRef]
- Winfield, I.J.; Nelson, J.S. Cyprinid Fishes: Systematics, Biology and Exploitation; Springer: New York, NY, USA, 2012; p. 667. [Google Scholar]
- Heintz, A. A new reconstruction of Dinichthys. Am. Mus. Novitataes 1931, 457, 1–5. [Google Scholar]
- Yamanoue, Y.; Setiamarga, D.H.; Matsuura, K. Pelvic fins in teleosts: Structure, function and evolution. J. Fish Biol. 2010, 77, 1173–1208. [Google Scholar] [CrossRef]
- Afrisal, M.; Nurjirana, I.; Burhanuddin, A.I. Osteological study of Titan Trigger fish, Balistoides viridescens (Bloch and Schneider, 1801) (Balistidae Tetraodontiformes) from the Spermonde Archipelago Waters. IOP Conf. Ser. Earth Environ. Sci. 2019, 370, 012035. [Google Scholar] [CrossRef]
- Zhuang, X.; Qu, M.; Zhang, X.; Ding, S. A Comprehensive Description and Evolutionary Analysis of 22 Grouper (Perciformes, Epinephelidae) Mitochondrial Genomes with Emphasis on Two Novel Genome Organizations. PLoS ONE 2013, 8, e73561. [Google Scholar] [CrossRef] [Green Version]
- Ma, K.Y.; Craig, M.T.; Choat, J.H.; van Herwerden, L. The historical biogeography of groupers: Clade diversification patterns and processes. Mol. Phylogenetics Evol. 2016, 100, 21–30. [Google Scholar] [CrossRef]
- Ma, K.Y.; Craig, M.T. An Inconvenient Monophyly: An Update on the Taxonomy of the Groupers (Epinephelidae). Copeia 2018, 106, 443–456. [Google Scholar] [CrossRef]
- Monarch. Fish Specimens Housed at the California Academy of Sciences Uploaded to Monarch. Available online: http//:monarch.calacademy.org/index.php (accessed on 24 July 2022).
- Van Mesdag, S.N.K. Hyperostosis in Bone in the Vertebral Column of the Devonian Placoderm Fish Millerosteus Minor (Miller, 1858); Imperial College London: London, UK, 2018. [Google Scholar]
- Gardiner, B.G.; Miles, R.S. A new genus of eubrachythoracid arthrodire from Gogo, Western Australia. Zool. J. Linn. Soc. 1990, 99, 159–204. [Google Scholar] [CrossRef]
- Rücklin, M. First selenosteid placoderms from the eastern Anti-Atlas of Morocco; osteology, phylogeny and palaeogeographical implications. Palaeontology 2011, 54, 25–62. [Google Scholar] [CrossRef]
- Gross, W. Die Arthrodira Wildungens. Geol. Und Paläeontologische Abh. 1932, 19, 1–61. [Google Scholar]
- Carr, R.K. A redescription of Gymnotrachelus (Placodermi: Arthrodira) from the Cleveland Shale (Famennian) of northern Ohio, U.S.A. Kirtlandia 1994, 48, 3–21. [Google Scholar]
- Dean, B. Biometric Evidence in the Problem of the Paired Limbs of the Vertebrates. Am. Nat. 1902, 36, 837–847. [Google Scholar] [CrossRef]
- Motani, R. Evolution of fish-shaped reptiles (Reptilia: Ichthyopterygia) in their physical environments and constraints. Annu. Rev. Earth Planet. Sci. 2004, 33, 395–420. [Google Scholar] [CrossRef] [Green Version]
- Block, B.A.; Finnerty, J.R. Endothermy in fishes: A phylogenetic analysis of constraints, predispositions, and selection pressures. Environ. Biol. Fish. 1994, 40, 283–302. [Google Scholar] [CrossRef]
- Friedman, S.T.; Price, S.A.; Corn, K.A.; Larouche, O.; Martinez, C.M.; Wainwright, P.C. Body shape diversification along the benthic–pelagic axis in marine fishes. Proc. R. Soc. B 2020, 287, 20201053. [Google Scholar] [CrossRef]
- Trinajstic, K.; Boisvert, C.; Long, J.; Maksimenko, A.; Johanson, Z. Pelvic and reproductive structures in placoderms (stem gnathostomes). Biol. Rev. 2015, 90, 467–501. [Google Scholar] [CrossRef]
- Long, J.A.; Burrow, C.J.; Ginter, M.; Maisey, J.G.; Trinajstic, K.M.; Coates, M.I.; Young, G.C.; Senden, T.J. First Shark from the Late Devonian (Frasnian) Gogo Formation, Western Australia Sheds New Light on the Development of Tessellated Calcified Cartilage. PLoS ONE 2015, 10, e0126066. [Google Scholar] [CrossRef]
- Zhu, Y.-a.; Li, Q.; Lu, J.; Chen, Y.; Wang, J.; Gai, Z.; Zhao, W.; Wei, G.; Yu, Y.; Ahlberg, P.E.; et al. The oldest complete jawed vertebrates from the early Silurian of China. Nature 2022, 609, 954–958. [Google Scholar] [CrossRef]
- Ruff, C.B. Long bone articular and diaphyseal structure in Old World monkeys and apes. II: Estimation of body mass. Am. J. Phys. Anthropol. 2003, 120, 16–37. [Google Scholar] [CrossRef]
- Miller, R.G. Beyond ANOVA, Basics of Applied Statistics; John Wiley and Sons: New York, NY, USA, 1986; p. 317. [Google Scholar]
- Carrillo, J.D.; Asher, R.J. An exceptionally well-preserved skeleton of Thomashuxleya externa (Mammalia, Notoungulata), from the Eocene of Patagonia, Argentina. Palaeontol. Electron. 2017, 20.2.34A, 1–33. [Google Scholar] [CrossRef]
- Kaufman, R.L. Heteroskedasticity in Regression: Detection and Correction; SAGE Publications: Thousand Oaks, CA, USA, 2013; p. 112. [Google Scholar]
- Kulbicki, M.; Guillemot, N.; Amand, M. A general approach to length-weight relationships for New Caledonian lagoon fishes. Cybium 2005, 29, 232–252. [Google Scholar]
- Brassey, C.A. Body-mass estimation in paleontology: A review of volumetric techniques. Paleontol. Soc. Pap. 2016, 22, 133–156. [Google Scholar] [CrossRef]
- McBee, K.; Baker, R.J. Dasypus novemcinctus. Mamm. Species 1982, 162, 1–9. [Google Scholar] [CrossRef]
- Iverson, J.B. Proportional skeletal mass in turtles. Fla. Sci. 1984, 47, 1–11. [Google Scholar]
- Amorim, A.F.; Arfelli, C.A.; Bornatowski, H.; Hussey, N.E. Rare giants? A large female great white shark caught in Brazilian waters. Mar. Biodivers. 2017, 48, 1687–1692. [Google Scholar] [CrossRef]
- De Maddalena, A.; Glaizot, O.; Olivier, G. On the Great White Shark, Carcharodon carcharias (Linnaeus, 1758), preserved in the Museum of Zoology in Lausanne. Mar. Life 2003, 13, 53–59. [Google Scholar]
- Christiansen, H.M.; Lin, V.; Tanaka, S.; Velikanov, A.; Mollet, H.F.; Wintner, S.P.; Fordham, S.V.; Fisk, A.T.; Hussey, N.E. The Last Frontier: Catch Records of White Sharks (Carcharodon carcharias) in the Northwest Pacific Ocean. PLoS ONE 2014, 9, e94407. [Google Scholar] [CrossRef] [Green Version]
- Tapanila, L.; Pruitt, J. Redefining species concepts for the Pennsylvanian scissor tooth shark, Edestus. PLoS ONE 2019, 14, e0220958. [Google Scholar] [CrossRef]
- Knapp, A.; Rangel-de Lázaro, G.; Goswami, A.; Friedman, M.; Evans, K.M.; Giles, S.; Beckett, H.T.; Johanson, Z. How to tuna fish: Constraint, convergence and integration in the neurocranium of pelagiarian fishes. bioRxiv 2022. bioRxiv:2022.12.19.521082. Available online: https://doi.org/10.1101/2022.12.19.521082 (accessed on 28 December 2022). [CrossRef]
- Gomez, C.; Pourquié, O. Developmental control of segment numbers in vertebrates. J. Exp. Zool. Part B Mol. Dev. Evol. 2009, 312B, 533–544. [Google Scholar] [CrossRef] [Green Version]
- Bernheim, S.; Meilhac, S.M. Mesoderm patterning by a dynamic gradient of retinoic acid signalling. Philos. Trans. R. Soc. B 2020, 375, 20190556. [Google Scholar] [CrossRef]
- Cooke, J.; Zeeman, E.C. A clock and wavefront model for control of the number of repeated structures during animal morphogenesis. J. Theor. Biol. 1976, 58, 455–476. [Google Scholar] [CrossRef]
- Pais-de-Azevedo, T.; Magno, R.; Duarte, I.; Palmeirim, I. Recent advances in understanding vertebrate segmentation. F1000Research 2018, 7, 97. [Google Scholar] [CrossRef] [Green Version]
- Schilling, T.F.; Kimmel, C.B. Musculoskeletal patterning in the pharyngeal segments of the zebrafish embryo. Development 1997, 124, 2945–2960. [Google Scholar] [CrossRef]
- Wartlick, O.; Kicheva, A.; González-Gaitán, M. Morphogen Gradient Formation. Cold Spring Harb. Perspect. Biol. 2009, 1, a001255. [Google Scholar] [CrossRef] [Green Version]
- Sefton, E.M.; Bhullar, B.-A.S.; Mohaddes, Z.; Hanken, J. Evolution of the head-trunk interface in tetrapod vertebrates. eLife 2016, 5, e09972. [Google Scholar] [CrossRef]
- Morin-Kensicki, E.M.; Melancon, E.; Eisen, J.S. Segmental relationship between somites and vertebral column in zebrafish. Development 2002, 129, 3851–3860. [Google Scholar] [CrossRef]
- Maddin, H.C.; Piekarski, N.; Reisz, R.R.; Hanken, J. Development and evolution of the tetrapod skull-neck boundary. Biol. Rev. 2020, 95, 573–591. [Google Scholar] [CrossRef] [Green Version]
- Wolpert, L.; Tickle, C.; Arias, A.M. Principles of Development, 5th ed.; Oxford University Press: Oxford, UK, 2015; p. 695. [Google Scholar]
- Burke, A.C.; Nelson, C.E.; Morgan, B.A.; Tabin, C. Hox genes and the evolution of vertebrate axial morphology. Development 1995, 121, 333–346. [Google Scholar] [CrossRef]
- Benton, M.J.; Donoghue, P.C.; Asher, R.J.; Friedman, M.; Near, T.J.; Vinther, J. Constraints on the timescale of animal evolutionary history. Palaeontol. Electron. 2015, 18.1.1FC, 1–106. [Google Scholar] [CrossRef] [Green Version]
- Andreev, P.S.; Sansom, I.J.; Li, Q.; Zhao, W.; Wang, J.; Wang, C.-C.; Peng, L.; Jia, L.; Qiao, T.; Zhu, M. The oldest gnathostome teeth. Nature 2022, 609, 964–968. [Google Scholar] [CrossRef] [PubMed]
- Claverie, T.; Wainwright, P.C. A Morphospace for Reef Fishes: Elongation Is the Dominant Axis of Body Shape Evolution. PLoS ONE 2014, 9, e112732. [Google Scholar] [CrossRef] [PubMed] [Green Version]
- Casti, J.L. Beyond Belief: Randomness, Prediction and Explanation in Science; CRC Press: Boca Raton, FL, USA, 2018; p. 356. [Google Scholar]
- Eldredge, N.; Gould, S.J. Punctuated equilibria: An alternative to phyletic gradualism. In Models in Paleobiology; Schopf, T.J.M., Ed.; Freeman, Cooper & Co: San Francisco, CA, USA, 1972. [Google Scholar]
- Cohn, M.J.; Tickle, C. Developmental basis of limblessness and axial patterning in snakes. Nature 1999, 399, 474–479. [Google Scholar] [CrossRef] [PubMed]
- Taylor, M.P.; Wedel, M.J. Why sauropods had long necks; and why giraffes have short necks. PeerJ 2013, 1, e36. [Google Scholar] [CrossRef] [PubMed] [Green Version]
- Wagner, G.P.; Altenberg, L. Perspective: Complex adaptations and the evolution of evolvability. Evolution 1996, 50, 967–976. [Google Scholar] [CrossRef]
- Zelditch, M.L.; Goswami, A. What does modularity mean? Evol. Dev. 2021, 23, 377–403. [Google Scholar] [CrossRef]
- Goswami, A.; Polly, P.D. The influence of character correlations on phylogenetic analysis. In Carnivoran Evolution: New Views on Phylogeny, Form, and Function; Goswami, A., Friscia, A., Eds.; Cambridge University Press: Cambridge, UK, 2010; pp. 141–164. [Google Scholar]
- Downs, J.P.; Daeschler, E.B.; Jenkins, F.A.; Shubin, N.H. The cranial endoskeleton of Tiktaalik roseae. Nature 2008, 455, 925–929. [Google Scholar] [CrossRef]
- Holland, L.Z.; Ocampo Daza, D. A new look at an old question: When did the second whole genome duplication occur in vertebrate evolution? Genome Biol. 2018, 19, 209. [Google Scholar] [CrossRef]
- Longhurst, T.J.; Joss, J.M.P. Homeobox genes in the Australian lungfish, Neoceratodus forsteri. J. Exp. Zool. 1999, 285, 140–145. [Google Scholar] [CrossRef]
- Hoegg, S.; Brinkmann, H.; Taylor, J.S.; Meyer, A. Phylogenetic Timing of the Fish-Specific Genome Duplication Correlates with the Diversification of Teleost Fish. J. Mol. Evol. 2004, 59, 190–203. [Google Scholar] [CrossRef] [Green Version]
- Koh, E.G.L.; Lam, K.; Christoffels, A.; Erdmann, M.V.; Brenner, S.; Venkatesh, B. Hox gene clusters in the Indonesian coelacanth, Latimeria menadoensis. Proc. Natl. Acad. Sci. USA 2003, 100, 1084–1088. [Google Scholar] [CrossRef] [Green Version]
- Meyer, A.; Schloissnig, S.; Franchini, P.; Du, K.; Woltering, J.M.; Irisarri, I.; Wong, W.Y.; Nowoshilow, S.; Kneitz, S.; Kawaguchi, A.; et al. Giant lungfish genome elucidates the conquest of land by vertebrates. Nature 2021, 590, 284–289. [Google Scholar] [CrossRef]
- Grande, L.; Bemis, W.E. A Comprehensive Phylogenetic Study of Amiid Fishes (Amiidae) Based on Comparative Skeletal Anatomy. An Empirical Search for Interconnected Patterns of Natural History. J. Vertebr. Paleontol. 1998, 18, 1–696. [Google Scholar] [CrossRef]
- Gutarra, S.; Moon, B.C.; Rahman, I.A.; Palmer, C.; Lautenschlager, S.; Brimacombe, A.J.; Benton, M.J. Effects of body plan evolution on the hydrodynamic drag and energy requirements of swimming in ichthyosaurs. Proc. R. Soc. B 2019, 286, 20182786. [Google Scholar] [CrossRef] [Green Version]
- Wilson, H. Dunkleosteus terrelli Size. Available online: https://www.deviantart.com/harry-the-fox/art/Dunkleosteus-terrelli-size-808872651 (accessed on 9 April 2022).
- Greenfield, T. Ceratotrichia and Dorsal Fin Shape in Arthrodires. Available online: https://incertaesedisblog.wordpress.com/2020/11/03/ceratotrichia-and-dorsal-fin-shape-in-arthrodires/ (accessed on 9 April 2022).
- García-Salinas, P.; Gallego, V.; Asturiano, J.F. Reproductive Anatomy of Chondrichthyans: Notes on Specimen Handling and Sperm Extraction. II. Sharks and Chimaeras. Animals 2021, 11, 2191. [Google Scholar] [CrossRef]
- Hunter, J. An account of the Gymnotus electricus. Philos. Trans. (1683–1775) 1775, 65, 395–407. [Google Scholar]
- Rivas, L.R. A comparison between giant bluefin tuna (Thunnus thynnus) from the Straits of Florida and the Gulf of Maine, with reference to migration and population identity. In Proceedings of the Gulf and Caribbean Fisheries Institute Seventh Annual Session, La Havana, Cuba, 20–21 October 1955; pp. 133–149. [Google Scholar]
- Frey, L.; Coates, M.I.; Tietjen, K.; Rücklin, M.; Klug, C. A symmoriiform from the Late Devonian of Morocco demonstrates a derived jaw function in ancient chondrichthyans. Commun. Biol. 2020, 3, 681. [Google Scholar] [CrossRef]
- Dean, B. The Cladoselachian Sharks. Mem. Am. Mus. Nat. Hist. 1909, 9, 211–248. [Google Scholar]
- Newberry, J.S. Descriptions of fossil fishes. In Report of the Geological Survey of Ohio. Volume II. Geology and Paleontology; Nevins and Myers, State Printers: Columbus, OH, USA, 1875; Volume 2, pp. 1–64. [Google Scholar]
- Newberry, J.S. Fossil Fishes. In Report of the Geological Survey of Ohio. Volume II. Geology and Paleontology; Nevins and Myers, State Printers: Columbus, OH, USA, 1873; Volume 1. [Google Scholar]
- Dean, B. Notes on a newly mounted Titanichthys. Mem. Am. Mus. Nat. Hist. 1909, 9, 270–271. [Google Scholar]
- Trinajstic, K. The role of heterochrony in the evolution of eubrachythoracid arthrodires with special reference to Compagopiscis croucheri and Incisoscutum ritchei from the Late Devonian Gogo Formation, Western Australia. Geobios 1995, 28, 125–128. [Google Scholar] [CrossRef]
- Newberry, J.S. Paleozoic Fishes of North America. Monogr. U.S. Geol. Surv. 1889, 16, 1–228. [Google Scholar]
- Dean, B. Fishes, Living and Fossil: An Outline of Their Forms and Probable Relationships; Macmillan and Company: London, UK, 1895; p. 300. [Google Scholar]
- Anonymous. Cleveland shale fishes. Bull. Clevel. Mus. Nat. Hist. 1923, 9, 36. [Google Scholar]
- Hyde, J.E. Collecting fossil fishes from the Cleveland Shale. Nat. Hist. 1926, 26, 497–504. [Google Scholar]
- Romer, A.S. Vertebrate Paleontology, 3rd ed.; University of Chicago Press: Chicago, IL, USA, 1966; p. 478. [Google Scholar]
- Colbert, E.H. Evolution of the Vertebrates: A History of the Backboned Animals Through Time, 2nd ed.; John Wiley and Sons: Hoboken, NJ, USA, 1969; p. 535. [Google Scholar]
- Williams, M.E. Jaws: The Early Years. Explorer 1992, 34, 4–8. [Google Scholar]
- Maisey, J.G. Discovering Fossil Fishes; Henry and Holt, Co.: New York, NY, USA, 1996; p. 223. [Google Scholar]
- Janvier, P. Early Vertebrates; Clarendon Press: Oxford, UK, 2003; p. 408. [Google Scholar]
- Long, J.A.; Choo, B.; Clement, A. The evolution of fishes through geologic time. In Evolution and Development of Fishes; Johanson, Z., Underwood, C., Richter, M., Eds.; Cambridge University Press: Cambridge, UK, 2019; pp. 3–29. [Google Scholar] [CrossRef]
- Hansen, M.C. Phylum Chordata-vertebrate fossils. In Fossils of Ohio; Feldmann, R.M., Hackathorn, M., Eds.; Ohio Division of Geological Survey: Columbus, OH, USA, 1996; Volume 70, pp. 288–369. [Google Scholar]
- Carr, R.K. Placoderm diversity and evolution. Bull. Du Muséum Natl. D’histoire Nat. 1995, 4, 85–125. [Google Scholar]
- Anderson, P.S.L. Shape variation between arthrodire morphotypes indicates possible feeding niches. J. Vertebr. Paleontol. 2008, 28, 961–969. [Google Scholar] [CrossRef]
- Miles, R.S. Features of Placoderm Diversification and the Evolution of the Arthrodire Feeding Mechanism. Trans. R. Soc. Edinb. 1969, 68, 123–170. [Google Scholar] [CrossRef]
- Romer, A.S.; Williams, G.C. The Early Evolution of Fishes. Q Rev. Biol. 1976, 51, 202–240. [Google Scholar] [CrossRef]
- Carr, R.K.; Hlavin, W.J. Dinichthyidae (Placodermi): A paleontological fiction? Geobios 1995, 28, 85–87. [Google Scholar] [CrossRef]
- Choo, B.; Zhu, M.; Zhao, W.; Jia, L.; Zhu, Y. The largest Silurian vertebrate and its palaeoecological implications. Sci. Rep. 2014, 4, 5242. [Google Scholar] [CrossRef] [Green Version]
- Dahl, T.W.; Hammarlund, E.U.; Anbar, A.D.; Bond, D.P.G.; Gill, B.C.; Gordon, G.W.; Knoll, A.H.; Nielsen, A.T.; Schovsbo, N.H.; Canfield, D.E. Devonian rise in atmospheric oxygen correlated to the radiations of terrestrial plants and large predatory fish. Proc. Natl. Acad. Sci. USA 2010, 107, 17911–17915. [Google Scholar] [CrossRef] [Green Version]
- Romer, A.S. Eurypterid Influence on Vertebrate History. Science 1933, 78, 114–117. [Google Scholar] [CrossRef]
- Lamsdell, J.C.; Braddy, S.J. Cope’s Rule and Romer’s theory: Patterns of diversity and gigantism in eurypterids and Palaeozoic vertebrates. Biol. Lett. 2010, 6, 265–269. [Google Scholar] [CrossRef] [Green Version]
- Coatham, S.J.; Vinther, J.; Rayfield, E.J.; Klug, C. Was the Devonian placoderm Titanichthys a suspension feeder? R. Soc. Open Sci. 2020, 7, 200272. [Google Scholar] [CrossRef]
- Williams, M.E. Feeding behavior in Cleveland Shale fishes. In Evolutionary Biology of Behavior and Coevolution; Boucot, A.J., Ed.; Elsevier: Amsterdam, The Netherlands, 1990; pp. 273–287. [Google Scholar]
- Ginter, M. Teeth of late Famennian ctenacanth sharks from the Cleveland Shale. In Morphology, Phylogeny and Paleobiogeography of Fossil Fishes; Elliott, D.K., Maisey, J.G., Yu, X., Miao, D., Eds.; Verlag Dr. Friedrich Pfeil: München, Germany, 2010; pp. 145–158. [Google Scholar]
- Hodnett, J.-P.M.; Grogan, E.M.; Lund, R.; Lucas, S.G.; Suazo, T.; Elliott, D.K.; Pruitt, J. Ctenacanthiform sharks from the late Pennsylvanian (Missourian) Tinajas Member of the Atrasado Formation, central New Mexico. New Mex. Mus. Nat. Hist. Sci. Bull. 2021, 84, 391–424. [Google Scholar]
- Maisey, J.G.; Bronson, A.W.; Williams, R.R.; McKinzie, M. A Pennsylvanian ‘supershark’ from Texas. J. Vertebr. Paleontol. 2017, 37, e1325369. [Google Scholar] [CrossRef]
- Young, B.; Dunstone, R.L.; Senden, T.J.; Young, G.C. A gigantic sarcopterygian (tetrapodomorph lobe-finned fish) from the upper Devonian of Gondwana (Eden, New South Wales, Australia). PLoS ONE 2013, 8, e53871. [Google Scholar] [CrossRef]
- Clement, G. Large Tristichopteridae (Sarcopterygii, Tetrapodomorpha) from the Late Famennian Evieux Formation of Belgium. Palaeontology 2002, 45, 577–593. [Google Scholar] [CrossRef]
- Daeschler, E.B.; Downs, J.P. New description and diagnosis of Hyneria lindae (Sarcopterygii, Tristichopteridae) from the Upper Devonian Catskill Formation in Pennsylvania, U.S.A. J. Vertebr. Paleontol. 2018, 38, e1448834. [Google Scholar] [CrossRef]
- Rosa, R.; Lopes, V.M.; Guerreiro, M.; Bolstad, K.; Xavier, J.C. Biology and ecology of the world’s largest invertebrate, the colossal squid (Mesonychoteuthis hamiltoni): A short review. Polar Biol. 2017, 40, 1871–1883. [Google Scholar] [CrossRef]
- McClain, C.R.; Balk, M.A.; Benfield, M.C.; Branch, T.A.; Chen, C.; Cosgrove, J.; Dove, A.D.; Gaskins, L.; Helm, R.R.; Hochberg, F.G.; et al. Sizing ocean giants: Patterns of intraspecific size variation in marine megafauna. PeerJ 2015, 3, e715. [Google Scholar] [CrossRef] [Green Version]
- Andrews, S.M.; Westoll, T.S. The Postcranial Skeleton of Rhipidistian Fishes Excluding Eusthenopteron. Trans. R. Soc. Edinb. 1970, 68, 391–489. [Google Scholar] [CrossRef]
- Jeffery, J. The Morphology and Phylogeny of the European Members of Order Rhizodontida (Pisces: Sarcopterygii); University of Cambridge: Cambridge, UK, 1998. [Google Scholar]
- Andrews, S.M. Rhizodont crossopterygian fish from the Dinantian of Foulden, Berwickshire, Scotland, with a re-evaluation of this group. Trans. R. Soc. Edinb. Earth Sci. 1985, 76, 67–95. [Google Scholar] [CrossRef]
- Johanson, Z.; Ahlberg, P.E. A complete primitive rhizodont from Australia. Nature 1998, 394, 569–573. [Google Scholar] [CrossRef]
- National Parks Service. Shark Fossil—″Saivodus striatus″. Available online: https://www.nps.gov/articles/000/shark-fossil-saivodus-striatus.htm (accessed on 20 August 2022).
- Hodnett, J.-P.M.; Elliott, C.L.; Toomey, R.; Olson, R.; Wood, J.; Santucci, V.L. The Late Mississippian (Viséan) Chondrichthyan Assemblage from the Joppa Member of the Ste. Genevieve Formation at Mammoth Cave National Park, Kentucky. J. Vertebr. Paleontol. SVP Program Abstr. Book 2020, 2020, 173. [Google Scholar] [CrossRef]
- Hodnett, J.-P.M.; Tweet, J.S.; Santucci, V.L. The occurrence of fossil cartilaginous fishes (Chondrichthyes) within the parks and monuments of the National Parks Service. New Mex. Mus. Nat. Hist. Sci. Bull. 2022, 90, 183–208. [Google Scholar]
- Engelman, R.K. A Devonian Fish Tale: A new method of body length estimation in placoderms suggests much smaller sizes for the Famennian arthrodire Dunkleosteus terrelli. J. Vertebr. Paleontol. SVP Program Abstr. Book 2022, 2022, 132. [Google Scholar]
- Tapanila, L.; Pruitt, J.; Wilga, C.D.; Pradel, A. Saws, Scissors, and Sharks: Late Paleozoic Experimentation with Symphyseal Dentition. Anat. Rec. 2020, 303, 363–376. [Google Scholar] [CrossRef]
- Mutter, R.J.; Neuman, A.G. New eugeneodontid sharks from the Lower Triassic Sulphur Mountain Formation of Western Canada. Geol. Soc. Lond. Spec. Publ. 2008, 295, 9–41. [Google Scholar] [CrossRef]
- Vermeij, G.J. Gigantism and Its Implications for the History of Life. PLoS ONE 2016, 11, e0146092. [Google Scholar] [CrossRef]
- Reimchen, T.E. Trout Foraging Failures and the Evolution of Body Size in Stickleback. Copeia 1991, 1991, 1098–1104. [Google Scholar] [CrossRef]
- Scharf, F.S.; Juanes, F.; Rountree, R.A. Predator size-prey size relationships of marine fish predators: Interspecific variation and effects of ontogeny and body size on trophic-niche breadth. Mar. Ecol. Prog. Ser. 2000, 208, 229–248. [Google Scholar] [CrossRef]
- Lucifora, L.O.; García, V.B.; Menni, R.C.; Escalante, A.H.; Hozbor, N.M. Effects of body size, age and maturity stage on diet in a large shark: Ecological and applied implications. Ecol. Res. 2008, 24, 109–118. [Google Scholar] [CrossRef]
- Van Valkenburgh, B.; Wang, X.; Damuth, J. Cope’s Rule, hypercarnivory, and extinction in North American canids. Science 2004, 306, 101. [Google Scholar] [CrossRef] [PubMed] [Green Version]
- Boucot, A.J. Arthrodire-ctenacanth shark. In Evolutionary Paleobiology of Behavior and Coevolution; Elsevier: New York, NY, USA, 1990; pp. 192–195. [Google Scholar]
- Syverson, V.J.; Baumiller, T.K. Temporal trends of predation resistance in Paleozoic crinoid arm branching morphologies. Paleobiology 2016, 40, 417–427. [Google Scholar] [CrossRef] [PubMed]
- Syverson, V.J.P.; Brett, C.E.; Gahn, F.J.; Baumiller, T.K. Spinosity, regeneration, and targeting among Paleozoic crinoids and their predators. Paleobiology 2018, 44, 290–305. [Google Scholar] [CrossRef] [Green Version]
- Blanton, P.L.; Biggs, N.L. Density of fresh and embalmed human compact and cancellous bone. Am. J. Phys. Anthropol. 1968, 29, 39–44. [Google Scholar] [CrossRef]
- Cupello, C.; Brito, P.M.; Herbin, M.; Meunier, F.J.; Janvier, P.; Dutel, H.; Clément, G. Allometric growth in the extant coelacanth lung during ontogenetic development. Nat. Commun. 2015, 6, 8222. [Google Scholar] [CrossRef]
- Dunkle, D.H.; Bungart, P.A. The infero-gnathal plates of Titanichthys. Kirtlandia 1942, 8, 49–59. [Google Scholar]
- Goujet, D. “Lungs” in Placoderms, a persistent palaeobiological myth related to environmental preconceived interpretations. Comptes Rendus Palevol 2011, 10, 323–329. [Google Scholar] [CrossRef]
- McCune, A.R.; Carlson, R.L. Twenty ways to lose your bladder: Common natural mutants in zebrafish and widespread convergence of swim bladder loss among teleost fishes. Evol. Dev. 2004, 6, 246–259. [Google Scholar] [CrossRef]
- Ramanujan, S. Ramanujan’s Collected Works; Chelsea: New York, NY, USA, 1962. [Google Scholar]
- Shephard, R.J. Body Composition in Biological Anthropology; Cambridge University Press: Cambridge, UK, 1991; p. 368. [Google Scholar]
- Springer, S.; Gilbert, P.W. The Basking Shark, Cetorhinus maximus, from Florida and California, with Comments on Its Biology and Systematics. Copeia 1976, 1976, 47–54. [Google Scholar] [CrossRef]
- Varojean, D.H. Systematics of the Genus Echinorhinus Blainville, Based on a Study of the Prickly Shark Echinorhinus Cookei Pietschmann; Fresno State College: Fresno, CA, USA, 1972. [Google Scholar]
- Villarino, M.B. Ramanujan’s Perimeter of an Ellipse. ArXIv Math 2008, arXiv:math/0506384. [Google Scholar] [CrossRef]
- Parsons. Displacement and Area Curves of Fishes. Trans. Am. Soc. Mech. Eng. 1888, 9, 679–695. [Google Scholar]
- Wedel, M.J. Evidence for bird-like air sacs in saurischian dinosaurs. J. Exp. Zool. Part A Ecol. Genet. Physiol. 2009, 311A, 611–628. [Google Scholar] [CrossRef] [PubMed]
- Kauffman, D.E. Notes on the Biology of the Tiger Shark (Galeocerdo Arcticus) from Philippine Waters; U. S. Fish & Wildlife Service: Washington, DC, USA, 1950; Volume 16, pp. 1–10. [Google Scholar]
- Baldridge, H.D. Sinking Factors and Average Densities of Florida Sharks as Functions of Liver Buoyancy. Copeia 1970, 1970, 744–754. [Google Scholar] [CrossRef]
- Corner, E.D.S.; Denton, E.J.; Forster, G. On the buoyancy of some deep-sea sharks. Proc. R. Soc. London. Ser. B. Biol. Sci. 1969, 171, 415–429. [Google Scholar] [CrossRef]
- Trinajstic, K.; Boisvert, C.; Long, J.A.; Johanson, Z. Evolution of Vertebrate Reproduction. In Evolution and Development of Fishes; Underwood, C., Richter, M., Johanson, Z., Eds.; Cambridge University Press: Cambridge, UK, 2019; pp. 207–226. [Google Scholar]


| Model | N | Equation | r2adj | AIC | BIC | %PE | CF | %PEcf | %SEE |
|---|---|---|---|---|---|---|---|---|---|
| All species | 3169 | Ln(TL) = 0.9962 × Ln(OOL) + 1.9008 | 0.947 | −463 | −445 | 17.83 | 1.019 | 17.55 | 25.21 |
| Fusiform and elongate taxa | 2660 | Ln(TL) = 0.9836 × Ln(OOL) + 1.9622 | 0.962 | −1164 | −1147 | 15.38 | 1.011 | 15.26 | 21.44 |
| With shape as covariate | 3398 | See Supplementary Information | 0.974 | −2846 | −2785 | 12.10 | 1.009 | 12.03 | 17.23 |
| Fusiform species only | 1741 | Ln(TL) = 0.9713 × Ln(OOL) + 1.9121 | 0.980 | −1562 | −1545 | 11.98 | 1.008 | 11.88 | 16.69 |
| Including body depth as covariate | 2845 | See Supplementary Information | 0.950 | −761 | −737 | 16.26 | 1.023 | 16.17 | 23.56 |
| Including snout length as covariate | 3169 | Ln(TL) = 0.7482 × Ln(OOL) − 0.2301 × Ln(SNL) + 2.124 | 0.961 | −1451 | −1426 | 14.82 | 1.018 | 14.62 | 21.21 |
| Pelagic species only | 638 | Ln(TL) = 0.9677 × Ln(OOL) + 2.0373 | 0.953 | −256 | −242 | 16.65 | 1.009 | 16.56 | 21.83 |
| Fusiform and elongate non-acanthopterygians | 2394 | Ln(TL) = 0.9902 × Ln(OOL) + 1.8915 | 0.960 | −687 | −670 | 16.47 | 1.017 | 16.26 | 23.3 |
| Sharks only | 540 | Ln(TL) = 0.8852 × Ln(OOL) + 2.1809 | 0.962 | −544 | −531 | 11.57 | 1.012 | 11.51 | 15.69 |
| With shape, allowing variable slope for Chondrichthyes | 3169 | See Supplementary Information | 0.971 | −2310 | −2237 | 12.45 | 1.015 | 12.40 | 18.27 |
| Head length | 3169 | Ln(TL) = 0.9717 × Ln(HDL) + 1.5688 | 0.963 | −1579 | −1561 | 14.55 | 1.018 | 14.37 | 20.75 |
| Taxon | Specimen | Actual Length | Estimated Length | +/−PE | 95% P.I. | PE |
|---|---|---|---|---|---|---|
| Millerosteus minor | FMNH PF 1089 | 13.7 | 13.87 | (11.4–16.3) | (8.9–21.6) | 1.1 |
| Millerosteus minor | Composite (see Methods) | 15.0 | 16.04 | (13.2–18.9) | (10.3–24.9) | 6.8 |
| Africanaspis dorissa | Reconstruction in [17] | 23.0 | 24.45 | (20.2–28.7) | (15.7–38.0) | 5.9 |
| Incisoscutum ritchei | Reconstruction in [55] | 30.3 | 31.62 | (26.1–37.2) | (20.4–49.1) | 4.3 |
| Coccosteus cuspidatus | NMS 1893.107.27 | 29.6 | 35.10 | (28.9–41.3) | (22.6–54.5) | 15.6 |
| Coccosteus cuspidatus | FMNH PF 1673 | 37.1 | 36.51 | (30.1–42.9) | (23.5–56.7) | −1.7 |
| Coccosteus cuspidatus | Reconstruction in [15] | 39.4 | 43.94 | (36.2–51.7) | (28.3–68.3) | 10.3 |
| Coccosteus cuspidatus | ROM VP 52664 | 37.5 | 42.52 | (35.1–50.0) | (27.4–66.1) | 11.8 |
| Plourdosteus canadensis | MNHM 2-177 | 37.5 | 51.40 | (42.4–60.4) | (33.1–79.9) | 27.0 |
| Dickosteus threiplandi | NMS 1987.7.118 | 43.7 | 56.13 | (46.3–66.0) | (36.1–87.2) | 22.2 |
| Holonema westolii | Reconstruction in [16] | 60.6 | 51.18 | (42.2–60.2) | (32.9–79.5) | −18.5 |
| Watsonosteus fletti | NMS G.1995.4.2 | 56.6 | 65.30 | (53.8–76.8) | (42.0–101.5) | 13.3 |
| Amazichthys trinajsticae | AA.MEM.DS.8 | 89.7 | 78.02 | (64.3–91.7) | (50.2–121.2) | −15.0 |
| Individual Specimens | Species Averages | |||||
|---|---|---|---|---|---|---|
| Model | Estimate | +/−PE | 95% P.I. | Estimate | +/−PE | 95% P.I. |
| All fishes | 352.6 | (290.7–414.5) | (226.8–548.1) | 338.9 | (278.4–399.4) | (214.0–536.7) |
| Fusiform and elongate fishes | 353.8 | (299.8–407.8) | (241.7–518.0) | 343.0 | (289.9–396.1) | (229.7–512.1) |
| With shape as covariate | 324.8 | (285.8–363.9) | (237.8–443.7) | 320.1 | (279.8–360.3) | (229.9–445.6) |
| Fusiform taxa only | 319.7 | (281.7–357.6) | (236.1–432.8) | 313.9 | (278.6–349.3) | (234.1–421.1) |
| With body depth as covariate | 335.4 | (281.1–389.6) | (221.4–508.0) | 344.1 | (283.6–404.6) | (221.8–536.6) |
| Including snout length as a separate integer | 336.8 | (284.9–388.7) | (231.1–492.7) | 328.5 | (276.1–380.9) | (219.8–493.2) |
| Pelagic taxa | 357.5 | (298.3–416.7) | (242.4–527.2) | 328.8 | (276.7–380.9) | (222.4–486.1) |
| Fusiform and elongate non-acanthopterygians | 340.5 | (285.1–395.9) | (225.7–513.7) | 318.5 | (279.3–357.7) | (234.0–433.5) |
| Sharks | 298.5 | (264.2–332.9) | (224.1–397.8) | 299.6 | (268.0–331.2) | (227.9–393.9) |
| With shape and variable slope for Chondrichthyes | 340.7 | (298.4–382.9) | (245.1–473.6) | 328.6 | (284.4–372.9) | (226.9–476.0) |
| Head length | 266.7 | (228.3–305.0) | (184.2–386.0) | 262.3 | (221.3–303.2) | (176.0–390.9) |
| Other methods of estimating length | ||||||
| Scaling from Coccosteus in [15], head length | 341 | — | — | |||
| Scaling from Coccosteus in [15], length of mediodorsal (sensu [64]) | 223 | — | — | |||
| Scaling from Coccosteus in [15], greatest external length of mediodorsal | 297 | — | — | |||
| Scaling from Coccosteus in [15], greatest length of posteroventrolateral | 388 | — | — | |||
| Scaling from Coccosteus in [15], inferognathal length | 523 | — | — | |||
| Scaling from Coccosteus in [15], body depth | 614 | — | — | |||
| Entering angle (sensu [150]) | 347 | — | — | |||
| Approximate location of pelvic girdle on body | ~340 | — | — | |||
| Measurement | Model | Data Type | Estimated Length | +/−PE | 95% P.I. |
|---|---|---|---|---|---|
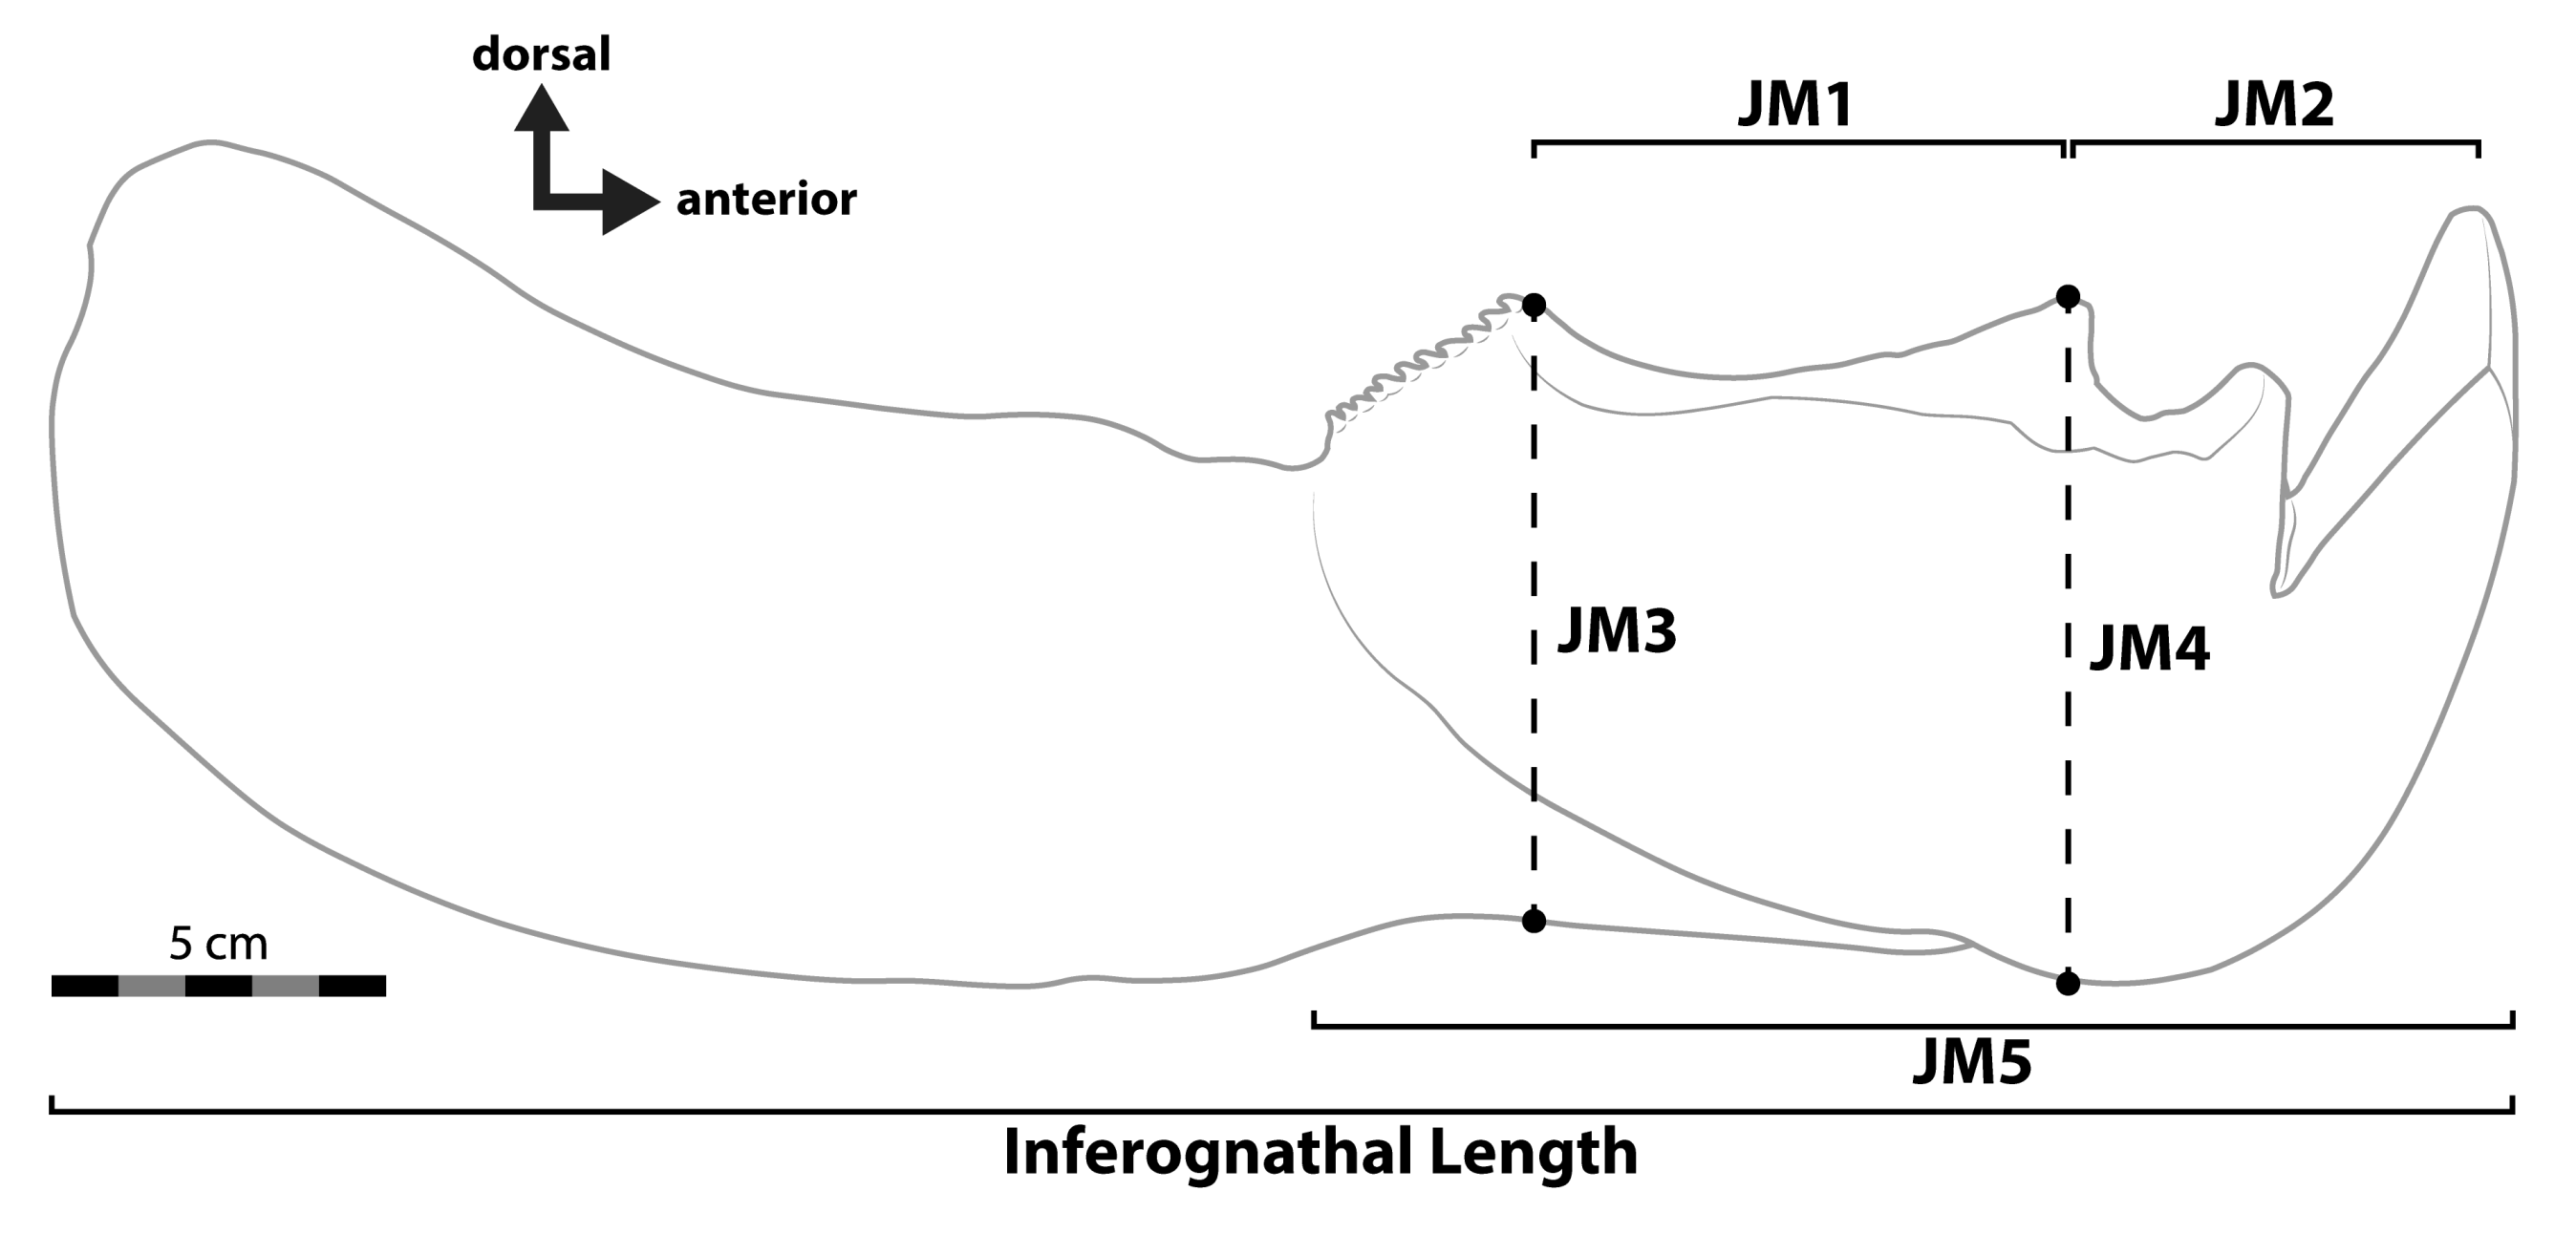
| JM3 | All specimens | Individual Data | 409.4 | (337.6–481.3) | (263.4–636.5) |
| All specimens | Species Averages | 392.7 | (322.6–462.8) | (248.0–622.0) | |
| Fusiform fishes only | Individual Data | 369.8 | (325.9–413.7) | (273.1–500.7) | |
| Fusiform fishes only | Species Averages | 362.7 | (321.9–403.6) | (270.4–486.7) | |
| Variable slope for chondrichthyans | Individual Data | 395.4 | (346.4–444.5) | (284.4–549.8) | |
| Variable slope for chondrichthyans | Species Averages | 339.4 | (293.7–385.1) | (179.0–643.6) | |
| JM5 | All specimens | Individual Data | 423.5 | (349.2–497.8) | (272.4–658.4) |
| All specimens | Species Averages | 406.0 | (333.6–478.5) | (256.4–643.1) | |
| Fusiform fishes only | Individual Data | 382.2 | (336.8–427.6) | (282.3–517.5) | |
| Fusiform fishes only | Species Averages | 374.8 | (332.6–417.0) | (279.4–502.9) | |
| Variable slope for chondrichthyans | Individual Data | 409.0 | (358.3–459.7) | (294.2–568.6) | |
| Variable slope for chondrichthyans | Species Averages | 350.5 | (303.3–397.7) | (183.7–668.8) |
| Specimen | Estimated Total Length (cm) | Ellipsoid Model, All Fishes | Ellipsoid Model, Large Pelagic Fishes | Carcharodon Length–Weight Equation |
|---|---|---|---|---|
| CMNH 7424 | 188.9 | 106.7 (60.5–188.4) | 166.7 (120.7–230.1) | 136.0 |
| CMNH 6090 | 283.2 | 391.7 (221.1–693.9) | 561.3 (401.8–784.2) | 423.9 |
| CMNH 7054 | 295.5 | 381.4 (215.5–675.0) | 545.0 (393.0–755.8) | 413.2 |
| CMNH 5768 | 340.6 | 1008.4 (564.6–1801.0) | 1204.1 (833.1–174053) | 941.5 |
| CMNH 5936 | 406.5 | 1763.9 (982.1–3168.0) | 1731.6 (1175.9–2549.8) | 1494.2 |
| Clade | Arthrodira | Chondrichthyes (Elasmobranchii) | Osteichthyes (Actinopterygii) |
|---|---|---|---|
| Body cross-section in anterior view | Circular | Circular | Mediolaterally narrow |
| Anteroposterior length relative to thoracic girth | Short | Elongate | Variable, generally intermediate |
| Body height relative to anteroposterior length | Deep | Shallow | Deep |
| Study | Length Estimate | Method of Estimation |
|---|---|---|
| Newberry [206]: p. 24 | 4.5–5.5 m (“15 to 18 feet”) | Extrapolated from Coccosteus cuspidatus |
| Newberry [210]: p. 24 | 4.5 m (“15 feet in length”) | Unstated (implied correlation with Coccosteus) |
| Dean [211]: p. 130 | 3 m (“10 feet”) | Unstated |
| Hussakof [116]: pp. 32–34 | 1.67 m (juvenile) 1 2.43 m (“8 feet”, juvenile) 1 3.79 m (extrapolated CMNH 5768) | “Entering angle” of body (sensu Dean [150]). |
| Anonymous [212] | 7.6 m (“25 feet”) | Unstated 2 |
| Hyde [213] | 4.5–6 m (“15 to 20 feet”) | Unstated |
| Romer [214]: p. 49 | 9 m (“may have reached a length of 30 feet”) | Unstated |
| Colbert [215]: p. 36 | 9 m (“30 feet”) | Unstated |
| Denison [61]: p. 88 | 6 m | Unstated |
| Williams [216] 3 | 5 m | Unstated |
| Maisey [217]: pp. 80–81 | 4 m (figured specimen) 5–6 m (typical adult) | Unstated |
| Janvier [218]: p. 12 | 6–7 m | Unstated 4 |
| Young [7] | “6 m, with evidence that some individuals may have doubled that length” | Unstated |
| Anderson and Westneat [8] | 6 m | Unstated |
| Anderson and Westneat [9] | 10 m | Unstated |
| Carr [11] | 4.5–6 m | Unstated |
| Long [6]: pp. 88–90 | 4–8 m | Unstated 5 |
| Sallan and Galimberti [32] | 8 m | Stated to be from Denison [61], but cited length disagrees with latter study. |
| Ferrón et al. [12] | 6.88 m (CMNH 5768), 8.79 m (maximum) | Upper jaw perimeter |
| Long et al. [219]: p. 13 | 6–8 m | Unstated 4 |
| Johanson et al. [29] | ~3 m (juvenile) 6 ~7.1 m (extrapolated CMNH 5768) 6 | Unstated |
| Present Study | 3.4 m (typical adult = CMNH 5768), 3.9–4.1 m (maximum) | Orbit-opercular length |
Disclaimer/Publisher’s Note: The statements, opinions and data contained in all publications are solely those of the individual author(s) and contributor(s) and not of MDPI and/or the editor(s). MDPI and/or the editor(s) disclaim responsibility for any injury to people or property resulting from any ideas, methods, instructions or products referred to in the content. |
© 2023 by the author. Licensee MDPI, Basel, Switzerland. This article is an open access article distributed under the terms and conditions of the Creative Commons Attribution (CC BY) license (https://creativecommons.org/licenses/by/4.0/).
Share and Cite
Engelman, R.K. A Devonian Fish Tale: A New Method of Body Length Estimation Suggests Much Smaller Sizes for Dunkleosteus terrelli (Placodermi: Arthrodira). Diversity 2023, 15, 318. https://doi.org/10.3390/d15030318
Engelman RK. A Devonian Fish Tale: A New Method of Body Length Estimation Suggests Much Smaller Sizes for Dunkleosteus terrelli (Placodermi: Arthrodira). Diversity. 2023; 15(3):318. https://doi.org/10.3390/d15030318
Chicago/Turabian StyleEngelman, Russell K. 2023. "A Devonian Fish Tale: A New Method of Body Length Estimation Suggests Much Smaller Sizes for Dunkleosteus terrelli (Placodermi: Arthrodira)" Diversity 15, no. 3: 318. https://doi.org/10.3390/d15030318