Article

Phenotypic Plasticity Drives the Successful Expansion of the Invasive Plant Pedicularis kansuensis in Bayanbulak, China

1
State Key Laboratory of Desert and Oasis Ecology, Key Laboratory of Ecological Safety and Sustainable Development in Arid Lands, Xinjiang Institute of Ecology and Geography, Chinese Academy of Sciences, Urumqi 830011, China
2
College of Life Sciences, Shihezi University, Shihezi 832003, China
3
College of Resources and Environment, Xinjiang Agricultural University, Urumqi 830052, China
4
Sino-Tajikistan Joint Laboratory for Conservation and Utilization of Biological Resources, Urumqi 830011, China
5
The Specimen Museum of Xinjiang Institute of Ecology and Geography, Chinese Academy of Sciences, Urumqi 830011, China
*
Author to whom correspondence should be addressed.
Diversity 2023, 15(3), 313; https://doi.org/10.3390/d15030313
Submission received: 18 November 2022 / Revised: 9 February 2023 / Accepted: 20 February 2023 / Published: 21 February 2023
(This article belongs to the Section Plant Diversity)

Abstract

:
To better understand the phenotypic plasticity of the highly invasive native weed, Pedicularis kansuensis, we investigated and compared phenotypes (morphology, biomass, and nutrient composition) at different levels of invasion (low: 0 < cover ≤ 30%; medium: 30% < cover ≤ 70%; and high: cover > 70%). With the increase in invasion level, the plasticity of inflorescence length, single-leaf thickness, and specific leaf area increased, while the plasticity of single-leaf area and crown width decreased. During the invasion process, we observed significant density-dependent effects, including changed morphological characteristics, increased total aboveground biomass, and decreased plant height, inflorescence length, root length, crown width, single-leaf area, structure biomass of structures (root, stem, inflorescence), and individual biomass (p < 0.05). During the reproductive period of P. kansuensis, the resource allocation (C, N, and P content, total biomass, biomass allocation) to inflorescence was significantly higher than to root and stem, while the elemental ratios (C:N, C:P, N:P) of inflorescences were significantly lower than those of roots and stems (p < 0.05). When the invasion level increased, the ratio of inflorescence C:N and biomass allocation to roots increased significantly; conversely, inflorescence N and biomass allocation to inflorescences and stems decreased significantly (p < 0.05). This led to a decrease in resource allocation to aboveground parts and more resources allocated to the roots, significantly increasing the root-to-shoot ratio (p < 0.05). Based on the phenotypic differences among different invasion levels, we suggest that P. kansuensis adapted to a competitive environment by regulating morphology, biomass, and nutrient allocation, thereby enhancing the potential of invasion and spread.

1. Introduction

The success of an invasive species is influenced by the invasiveness of the species itself [1], the invasibility of the habitat [2], and their interactions [3]. Phenotypic plasticity is a property by which the same genotype produces different phenotypes in different environments [4], and is considered an important determinant of an invasive species’ capacity and adaptation to heterogeneous habitats [5]. Invasive species adapt by altering their phenotypic structure, metabolic level, or life history at the individual level to reduce the environmental stresses they face, thereby rapidly dispersing across regions and habitats [6,7,8]. Changes in plant phenotypes based on phenotypic plasticity are called phenotypic variations and manifest in various ways, such as morphology, biomass allocation, and nutrient composition [8,9].
Changes in plant morphology, biomass, and nutrient composition [9,10,11,12] are related and reflect plant trade-offs in resource allocation [13,14]. Measuring such changes at different invasion levels helps researchers to better understand a plant’s invasion strategies. As the invasion level increased, invasive species rapidly adapted to environmental changes through phenotypic shifts, such as by increasing plant height and root length to compete for light and nutrients [10,15], increasing belowground biomass allocation for nutrients, and increasing aboveground biomass allocation for light [13]. Similarly, invasive species adapt a “growth competitive strategy” for nutrient uptake that allows for rapid growth and mass reproduction and “tolerance” or “resource conservation” strategies to cope with nutrient-poor environments [9,12,16]. However, as population density increases, plants also show a density-dependent effect [10]. For Ambrosia artemisiifolia (Asteraceae), plants at low density had higher root biomass, stem biomass, and total biomass than plants at high density [17]. This is because plants of the same species have the same resource requirements, and increased density leads to intraspecific competition [18,19,20].
Invasive species are “species that spread spatially and have negative effects on already existing species” [21]. Pedicularis kansuensis (Orobanchaceae) is an annual or biennial hemiparasitic herb endemic to the Qinghai–Tibetan Plateau [22,23]. This species has a high seed set, is frequently clustered, adapts to different habitats, and spreads rapidly through grassland ecosystems. Around 2000 AD, the species appeared in the Bayanbulak Grassland of the Tian Shan and spread rapidly, causing damage to 40 thousand ha in 2008 [24], with an additional 1.2 million km2 of potentially suitable habitat under the current climatic climate [9]. The rapid spread of P. kansuensis resulted in the decrease in the yield of Poaceae (e.g., Elymus nutans and Stipa purpurea) and Fabaceae (e.g., Astragalus adsurgens and Oxytropis kansuensis), and changed the plant community structure and function, which negatively affected the development of local animal husbandry [25]. Li et al. (2019) found that P. kansuensis’s cover, aboveground biomass, branch number, and root length increased with increasing plant density, while belowground biomass decreased with increasing plant density [26]. However, the phenotypic characteristics of P. kansuensis at different invasion levels and their shifts remain unclear. This study assessed the phenotypes of P. kansuensis in Bayanbulak Grassland and analyzed the morphological variation, biomass allocation, and nutrient characteristics among different levels of invasion to elucidate the phenotypic shifts during the invasion.

2. Materials and Methods

2.1. Overview of the Study Site

The study site is in the Bayanbulak Grassland, in the middle of the Tianshan Mountains, 270 km long from east to west and 136 km wide from north to south, with a total area of 2.3 × 10⁴ km2 and an average altitude of 1500–2500 m. The site experiences a typical alpine climate: windy with no significant frost-free periods. The average annual temperature is −4.7 °C, and the annual rainfall is 276.2 mm, mainly rainfall supplemented with snowfall. The average annual wind speed is 2.6 m/sec, annual evaporation is 1022.9–1247.5 mm, and sunshine hours are 2466–2616 h. The bottom of the basin is extremely cold in winter, with a minimum temperature of −48.1 °C. The study sites did not differ regarding topography, soil type, or spatial heterogeneity.

2.2. Field Sample Collection

We conducted fieldwork and collections from late July to mid-August 2021, when P. kansuensis was flowering and fruiting. We conducted fieldwork in Bayanbulak Grassland and collected from three locations (42°50′14″ N, 84°30′27″ E; 42°48′6″ N, 84°31′43″ E; 42°50′38″ N, 83°43′33″ E), which are relatively close to each other with similar environmental factors, species composition of the community, and invasion level. Invasion was categorized into three levels based on P. kansuensis coverage: low (0 < cover ≤ 30%), medium (30% < cover ≤ 70%), and high (cover > 70%). Nine 30 m × 30 m plots and five 0.5 m × 0.5 m sample squares per plot were set at each level of invasion for 27 plots and 135 sample squares. After recording numbers and crown widths in each quadrat, all P. kansuensis were cut from the ground. Thirty intact individuals of P. kansuensis were randomly dug up from each square. For each square, a healthy leaf was taken from the second leaf whorl of 30–40 randomly selected individuals. All samples were brought back to the laboratory for processing.

2.3. Determination of Morphological Indicators

The branch numbers of P. kansuensis were measured and recorded. The natural height from the base of the plant to the canopy is taken as the plant height. The inflorescence length is the length from the base of the stalk to the very tip of the inflorescence. The length of the taproot is used as the root length. The area of each leaf was measured separately using the FS-leaf1000 (Syas, Shijiazhuang, China), and the average value was taken as the single-leaf area. The thickness of five leaves was measured using Vernier calipers (V5967; i-Quip, Santa Clara Valley, CA, USA); the single-leaf thickness was calculated based on the measurement of five leaves. All weights are measured using the same method: dry to constant weight (24–48 h) in an oven (DGG-9626A; DongLu, Shanghai, China) at 65 °C, and then use a microbalance (+/−0.001 g) (ME203 electronic balance; Mettler Toledo, Zurich, Switzerland) to measure. Specific leaf area (SLA) was calculated as follows: SLA (cm2·g1) = single-leaf area/single-leaf weight [27].

2.4. Biomass Determination

The weight of P. kansuensis cut from the ground in each quadrat was used as the total aboveground biomass. The weight of the intact individual was used as individual biomass. All samples were divided into three parts (roots, stems, and inflorescences) and measured.

2.5. Determination of Nutrient Characteristics

The C content of roots, stems, inflorescences, and aboveground parts of P. kansuensis was measured using the potassium dichromate external heating method (Titrette digital bottle mouth titrator; Prandle, Wertheim, Germany), N using the Kjeldahl method (Auto Analyzer 3; Bran+Luebbe, Hamburg, Germany), and P with the molybdenum antimony colorimetric method (UV-1900i; Shimazu, Kyoto, Japan) [28].

2.6. Statistical Analyses

Data were analyzed using SPSS 19.00 [9]. Density, plant height, root length, inflorescence length, branch number, single-leaf area, single-leaf thickness, and single-leaf weight of P. kansuensis were analyzed among different levels of invasion using one-way ANOVA. Multiple comparisons were made using the least significant difference (LSD) method and Games–Howell method. One-way ANOVAs and multiple comparisons were performed for the biomass of roots, stems, and inflorescences; biomass allocation to roots (root mass fraction, RMF), stems (stem mass fraction, SMF), and inflorescences (inflorescence mass fraction, IMF); root-to-shoot ratio (R/S) and C, N, and P contents and their ratios (C:N, C:P, N:P) among different levels of invasion, and within the same invasion level, respectively. The data are presented as the mean ± standard error (SE; n = 2). All data were plotted using Origin 8.0 [9]. Biomass allocation was calculated as structure biomass/individual biomass [29]. To investigate the plasticity of the different morphological traits, we calculated the phenotypic plasticity index (PPI): (highest value of a trait-lowest value of a trait)/highest value of a trait [30].

3. Results

3.1. Morphological Characteristics of P. kansuensis

Most morphological characteristics differed significantly (plant height, FLevel,df=2 = 10.266, p = 0.001; inflorescence length, FLevel,df=2 = 4.950, p = 0.016; root length, FLevel,df=2 = 4.271, p = 0.026; branch number, FLevel,df=2 = 5.342, p = 0.012; single-leaf area, FLevel,df=2 = 7.349, p = 0.003; density, FLevel,df=2 = 113.847, p < 0.001; crown width, FLevel,df=2 = 9.769, p = 0.001) among the different levels of invasion, primarily decreasing with increasing invasion, except for the density and leaf thickness which increased with increasing invasion (Table 1). Among different levels of invasion, morphological characteristics exhibited different phenotypic variations (Table 2). The characteristics with the highest PPI are single-leaf weight, branch number, and single-leaf weight in low, medium, and high invasion, respectively. Conversely, SLA in low invasion, SLA in medium invasion, and plant height in high invasion had the lowest PPI (Table 2). The plasticity of plant height, branch number, and root length did not differ significantly among the different invasion levels. The PPI of inflorescence length, single-leaf thickness, and SLA tended to increase with increasing invasion. The PPI of single-leaf weight was the lowest within medium invasion and higher within low and high invasion. The PPI of single-leaf area and crown width gradually decreased with increasing invasion (Table 2).

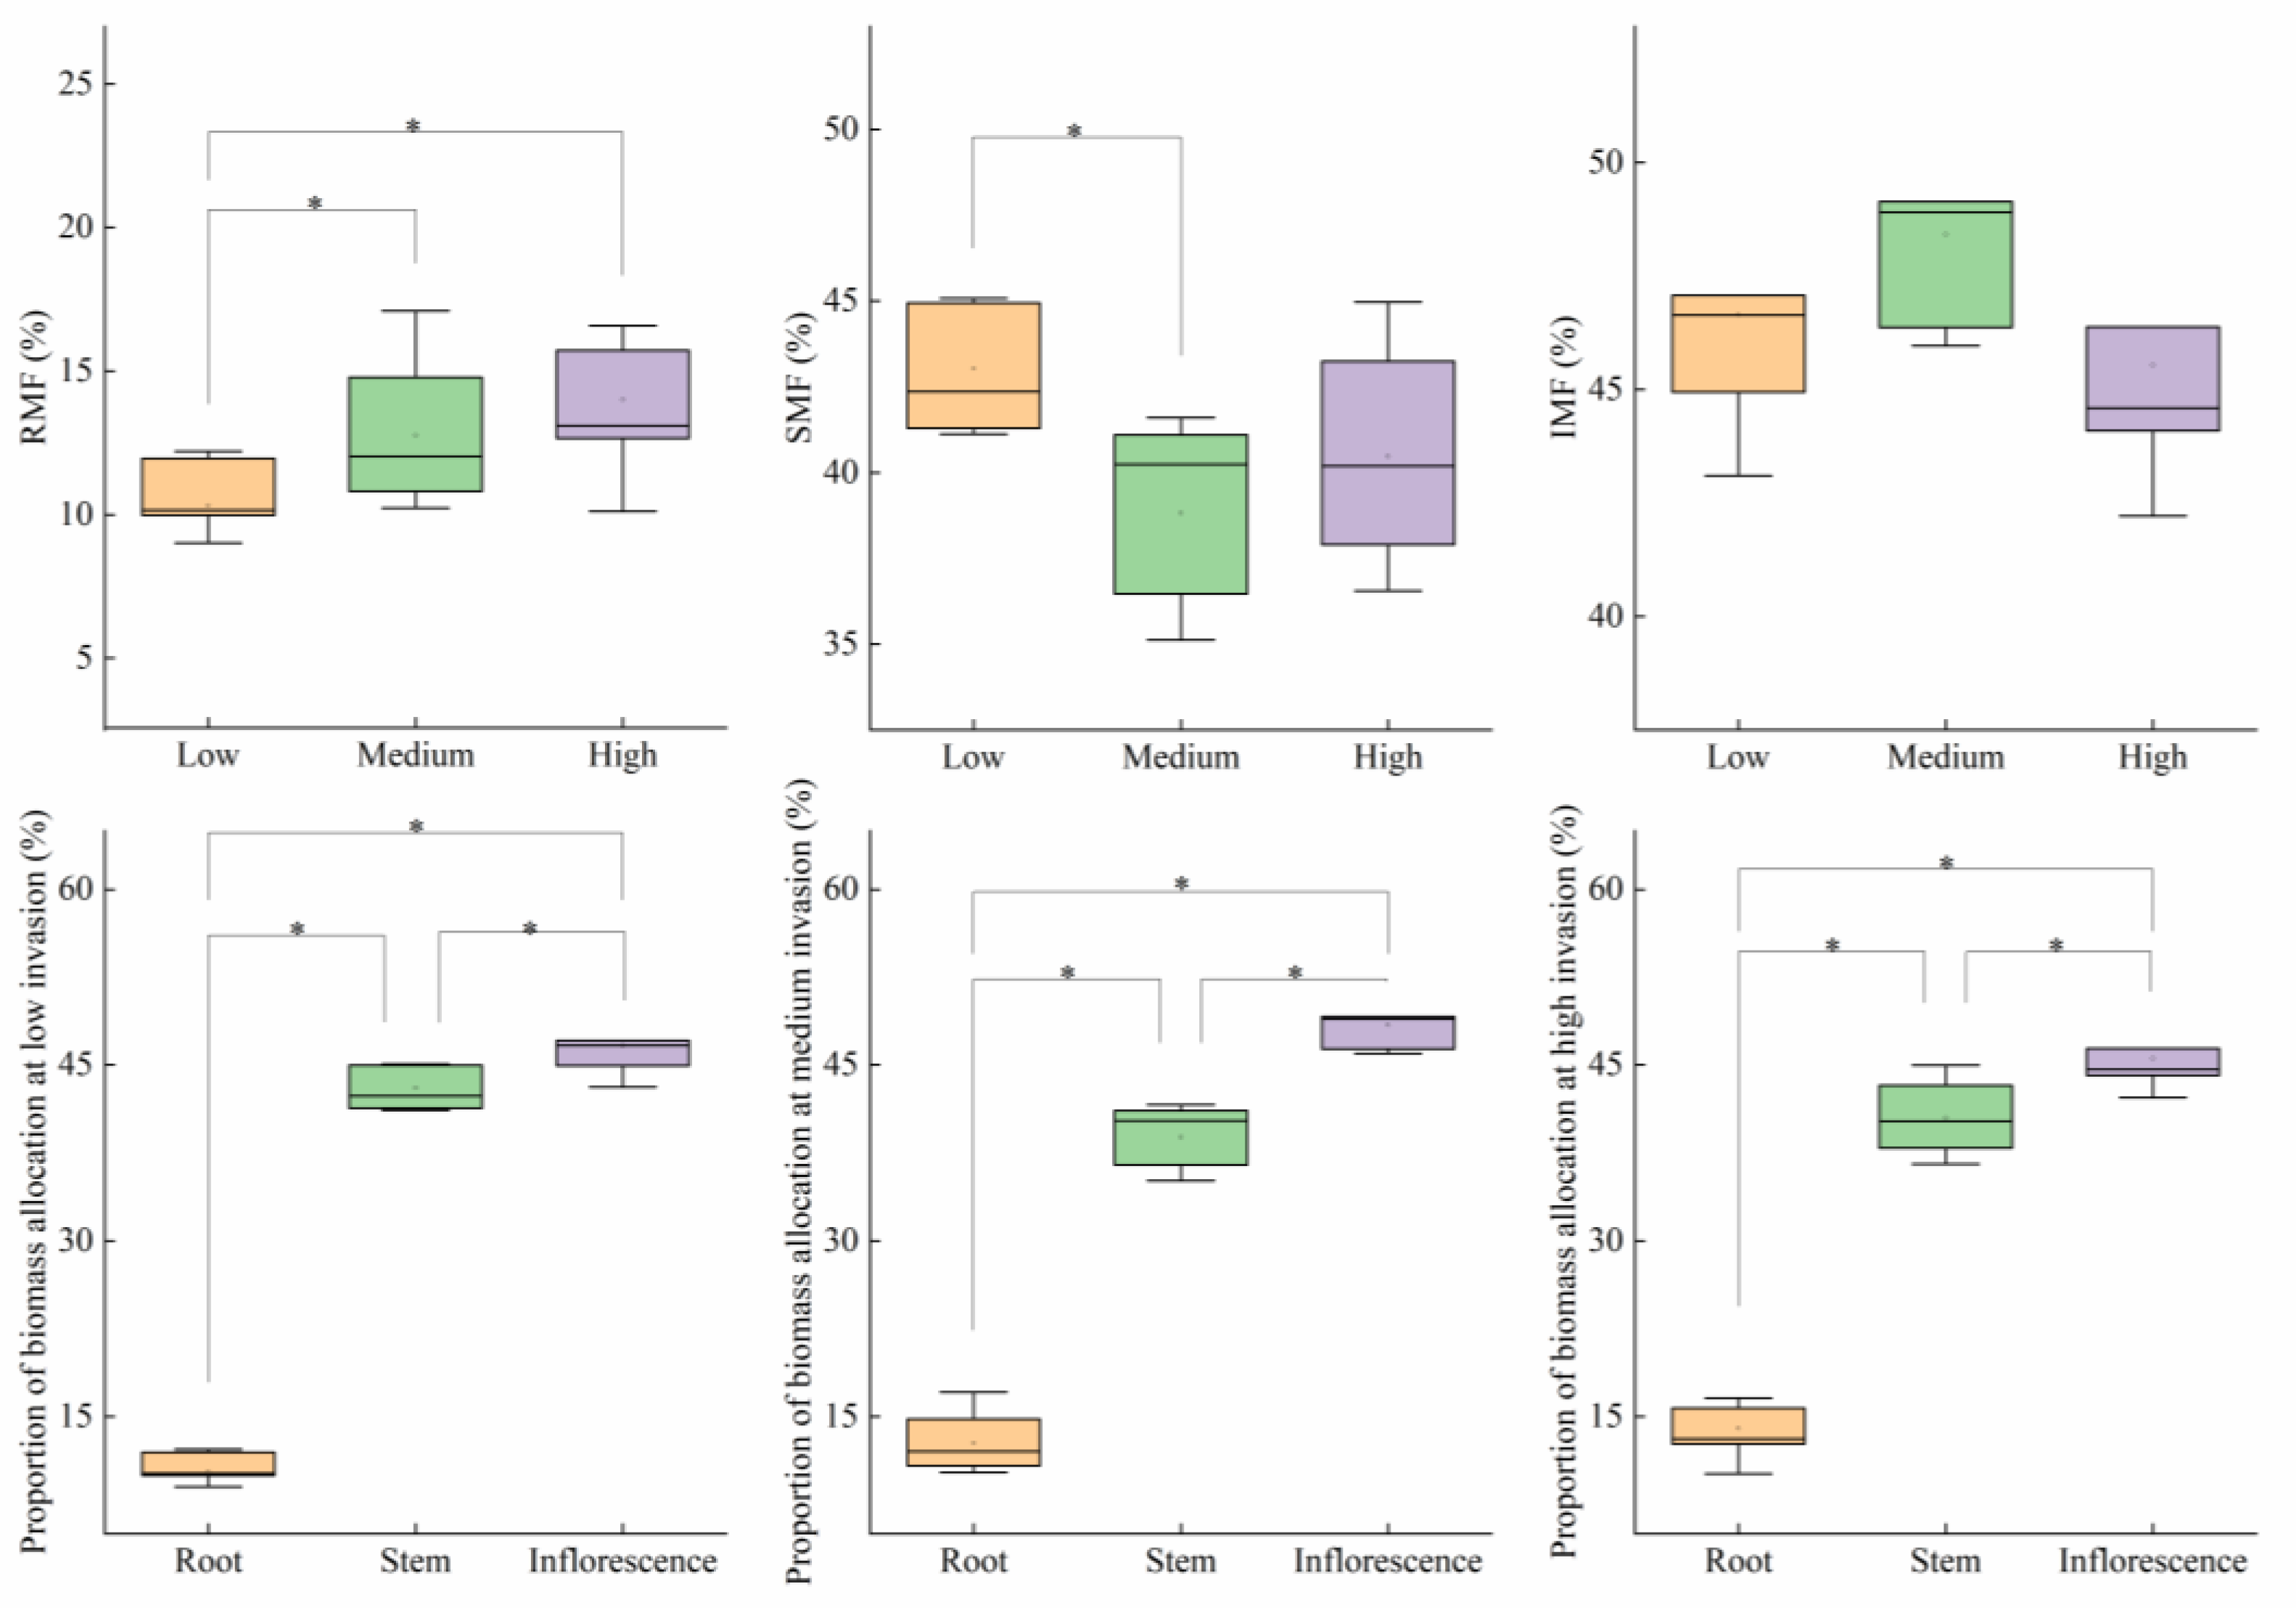
3.2. Biomass Accumulation and Allocation of P. kansuensis

The biomass of different structures is shown as inflorescences > stems > roots within the same degree of invasion (Table 3). There was no significant difference between inflorescences and stems, but both were significantly higher than roots (biomass in low invasion, FStructure,df=2 = 17.429, p < 0.001; biomass in medium invasion, FStructure,df=2 = 23.777, p < 0.001; biomass in high invasion, FStructure,df=2 = 8.737, p = 0.002) (Table 3). Total aboveground biomass increased significantly (FLevel,df=2 = 93.120, p < 0.001) with increasing invasion, root, stem, inflorescence, and individual biomass showed a decreasing trend with increasing invasion (Table 3). Stem and individual biomass were significantly higher (stem biomass, FLevel,df=2 = 93.120, p < 0.001; individual biomass, FLevel,df=2 = 5.550, p = 0.011) for low than for medium and high invasion (Table 3). Root and inflorescence biomass were significantly higher for low invasion than for high invasion (root biomass, FLevel,df=2 = 3.918, p = 0.034; inflorescence biomass, FLevel,df=2 = 3.879, p = 0.036) (Table 3).
Within the same invasion level, biomass allocation to the roots, stems, and inflorescences was significantly different (inflorescences > stems > roots) (biomass allocation in low invasion, FStructure,df=2 = 417.446, p < 0.001; biomass allocation in medium invasion, FStructure,df=2 = 405.133, p < 0.001; biomass allocation in high invasion, FStructure,df=2 = 244.483, p < 0.001) (Figure 1). The biomass allocation of roots, stems and inflorescences showed different trends with increasing invasion. RMF tended to increase with increasing invasion and was significantly lower for low (10.3%) than for medium (12.8%) and high invasion (14.0%) (FLevel,df=2 = 5.165, p = 0.014). SMF decreased significantly and then increased with increasing invasion; low invasion (43.0%) was significantly higher than medium invasion (38.8%) (FLevel,df=2 = 4.243, p = 0.026) (Figure 1). R/S tended to increase with increasing invasion and was significantly lower in the low (11.7%) than in the medium (15.4%) and high (16.9%) invasion groups (FLevel,df=2 = 4.407, p = 0.023) (Figure 2).

3.3. Nutrient Characteristics of P. kansuensis

3.3.1. Nutrient Characteristics of Aboveground Parts among the Three Invasion Levels

The C content, C:N, C:P, and N:P of the aboveground parts generally increased with increasing invasion, and we observed that C:N and C:P at low invasion were significantly lower than that at high invasion (C:N, FLevel,df=2 = 3.692, p = 0.040; C:P, FLevel,df=2 = 3.807, p = 0.037). N and P content decreased with increasing invasion, and P content was significantly higher (P content, FLevel,df=2 = 3.710, p = 0.039) for low than for high invasion, with a 22.3% decrease for high invasion (Table 4).

3.3.2. Nutrient Characteristics of Each Structure in the Three Invasion Levels

The C, N, and P content of different structures showed different trends with increasing invasion (Table 5). Root C, N, and P were highest in medium invasion, but only root C showed a significant difference (root C, FLevel,df=2 = 5.277, p = 0.013) in medium compared to high invasion. Stem C and N were highest in medium invasion, and stem P decreased with increasing invasion, but stem C, N, and P were not significantly different among the different invasion levels. Inflorescence C, N, and P gradually decreased with increasing invasion, but only inflorescence N decreased significantly (inflorescence N, FLevel,df=2 = 19.446, p < 0.001) (Table 5). The C, N, and P content of all structures showed the same trend within the same invasion level (inflorescence > stem > root) (Table 5). Stem P and root P were not significantly different, but both were significantly lower than inflorescence P (P content in low invasion, FStructure,df=2 = 66.556, p < 0.001; P content in medium invasion, FStructure,df=2 = 58.069, p < 0.001; P content in high invasion, FStructure,df=2 = 58.069, p < 0.001). Stem N and root N were significantly lower than inflorescence N for medium invasion (N content in medium invasion, FStructure,df=2 = 32.356, p < 0.001), and inflorescence N > stem N > root N for low and high invasion (N content in low invasion, FStructure,df=2 = 352.732, p < 0.001; N content in high invasion, F = 70.507, p < 0.001). Inflorescence C > stem C > root C for low invasion (C content in low invasion, FStructure,df=2 = 55.274, p < 0.001), and inflorescence C and stem C were significantly higher than root C for medium and high invasion (C content in medium invasion, FStructure,df=2 = 45.893, p < 0.001; C content in high invasion, FStructure,df=2 = 70.269, p < 0.001) (Table 5).
We observed significant differences in how P. kansuensis allocates nutrients to structure. Inflorescence C:N, C:P, and N:P were the lowest of the structures measured in all three invasion levels; C:N showed root > stem > inflorescence, and C:P and N:P showed stem > root > inflorescence (Figure 3). C:N was significantly different between roots, stems, and inflorescences in low invasion (C:N in low invasion, FStructure,df=2 = 114.836, p < 0.001), and roots and stems were significantly higher than inflorescences for medium and high invasion (C:N in medium invasion, FStructure,df=2 = 12.813, p < 0.001; C:N in high invasion, FStructure,df=2 = 28.823, p < 0.001). C:P was higher in roots and stems than in inflorescences for low and medium invasion (C:P in low invasion, FStructure,df=2 = 17.046, p < 0.001; C:P in medium invasion, FStructure,df=2 = 42.038, p < 0.001), and stems > roots > inflorescences in high invasion (C:P in high invasion, FStructure,df=2 = 122.517, p < 0.001). N:P in stems was significantly higher than in inflorescences in medium invasion (N:P in medium invasion, FStructure,df=2 = 3.483, p = 0.047), and N:P in roots and stems was significantly higher than in inflorescences at high invasion (N:P in high invasion, FStructure,df=2 = 12.836, p < 0.001) (Figure 3).
Elemental ratios of the structures differed among the different levels of invasion. Inflorescence C:N increased with increasing invasion and was significantly higher for high (24.98) than for low (21.19) and medium (22.63) invasion (Inflorescence C:N, FLevel,df=2 = 13.043, p< 0.001). The remaining elemental ratios showed different trends with increasing invasion, but not significantly. For example, inflorescence C:P gradually increased with increasing invasion, whereas inflorescence N:P gradually decreased with increasing invasion (Figure 4).

4. Discussion

4.1. Pedicularis kansuensis Has Strong Phenotypic Plasticity

Phenotypic plasticity is fundamental to biological adaptation and phenotypic evolution [31], and is one of the primary pathways through which species adapt to heterogeneous habitats [5]. Pedicularis kansuensis exhibits phenotypic plasticity in several circumstances [26,32]. In the present study, P. kansuensis exhibited strong phenotypic plasticity for some morphological characteristics, even within the same level of invasion. PPI for branch number was higher than 0.5 within all three invasion levels, and PPI for single-leaf weight was 0.60 and 0.70 in low and high invasion, respectively. Inflorescence length, biomass, and N decreased significantly with increasing invasion, but RMF and R/S increased significantly.

4.2. Morphological Characteristics of P. kansuensis in Different Invasion Levels

Morphological shifts are the most intuitive indicator of plant adaptation to environmental changes [33]. We observed that the density of P. kansuensis increased with increasing invasion, but several plant metrics (e.g., plant height, inflorescence length, root length, branch number, single- leaf area, and crown width) decreased, possibly because of intraspecific competition and significant density constraints [34]. Species display clear density-dependent effects in high density, such as Corispermum macrocarpum (Amaranthaceae) [35] and Salsola collina (Amaranthaceae) [36]. Conversely, Li et al. (2019) found that P. kansuensis’s plant height, cover, and root length increased with increasing plant density in the Gahai Wetland [26]. This may be because their high-density plots (54–75 plants/m2) are far less dense than our medium and high invasion plots (117 and 256 plants/m2, respectively).
Increased population density will lead to the lateral and longitudinal elongation of neighboring plants, creating a shaded environment. Plastic changes in morphology are adaptive changes in a competitive environment [37,38,39,40]. We found that the highly intraspecific competition leads to the decrease in single-leaf weight, single-leaf thickness, and SLA. However PPI of single-leaf weight, single-leaf thickness, and SLA increased with increasing invasion. This may increase the plant’s capture of light. This adaptability gives P. kansuensis a competitive growth advantage in variable environments [27], facilitating population expansion and making it easier for P. kansuensis to survive during invasion.

4.3. Biomass Allocation of P. kansuensis in Different Invasion Levels

Organisms allocate resources to critical aspects of their life history (e.g., growth, survival, and reproduction) when resources are limited [41,42], and plants use different biomass allocation strategies under different selection pressures [11,43]. Under highly competitive pressure, population density often significantly negatively affects plant component biomass [17]. For example, with the reduction in structure biomass of P. kansuensis in our study. Individual plants of the same species compete for the same resources, and to reduce resource consumption, changes in the biomass of components occur, with slower growth rates and reduced biomass [11]. We found that a higher invasion level led to an adjustment of biomass allocation, i.e., decreased IMF and SMF, and increased RMF. Simultaneously, R/S increased significantly with increasing invasion, indicating that P. kansuensis increased its R/S to improve nutrients and water access. These findings reflected the trade-off between aboveground and belowground resource allocation, and confirmed that invasion level is an important factor influencing biomass allocation patterns in a highly intraspecific competition.

4.4. Nutrient Characteristics of P. kansuensis Components under Different Invasion Levels

N and P are essential nutrients that limit plant growth in most ecosystems [44]. The limiting element for plant growth was N when plant N:P < 14. The limiting element for plant growth was P when N:P > 16. Both N and P are limiting elements, or neither is a limiting element when 14 < N:P < 16 [45]. The N:P ratio in this study was < 14, and the N and P content of each structure showed inflorescence > stem > root within the same level of invasion. This indicated that P. kansuensis allocates more resources to reproduction. However, inflorescence N decreased significantly with increasing invasion, indicating that intraspecies competition increased the effect of N limitation, and P. kansuensis reduced nutrient allocation to reproductive structures, instead prioritizing stems and roots to ensure survival [44,46]. At the same time, the P content of aboveground parts decreased with increasing invasion, which indicates that P also becomes a limiting nutrient in high invasion.
Elemental ratios can reflect plants’ nutritional strategy, growth rate, and nutrient use efficiency [47,48,49,50]. High C:N ratios indicate high carbon assimilation efficiency, slow growth, and low nutrient requirements of plants [51]; whereas, low N:P and C:P ratios indicate high plant growth rates [52,53,54]. As the invasion level increases, invasive plants adjust their elemental ratios in response to their environment [55,56]. In this study, the C, N, and P contents of all structures within the same invasion level showed inflorescence > stem > root, while C:N, C:P, and N:P in inflorescences were lower than in roots and stems, indicating that P. kansuensis allocated more C, N, and P to inflorescences within the same invasion level. Inflorescence N significantly decreased, but C:N significantly increased with increasing invasion, indicating that the inflorescence N-use efficiency increased significantly with increasing invasion. Within the same time period, the elemental ratios of all structures showed an increasing trend with increasing invasion in this study. However, the elemental ratios of inflorescences were always significantly lower than those of roots and stems, indicating that the inflorescence of P. kansuensis requires more nutrients and has a higher reproductive output.

5. Conclusions

Our study demonstrates that P. kansuensis displayed phenotypic plasticity at the individual level and responded to changing environmental pressures from increased invasion by altering morphology and regulating biomass and nutrient allocation. As the level of invasion increased, P. kansuensis’s growth was stunted and showed significant density-dependent effects. This study improves our understanding of the phenotypic plasticity of invasive plants, and provides a scientific basis for the study of the invasion mechanism of P. kansuensis.

Author Contributions

Sample collection and experiments, W.L. (Wenchao Li), L.H., L.Y., Y.L., H.C. and W.L. (Wenjun Li); data analysis and processing, W.L. (Wenchao Li), L.H., L.Y. and H.C.; writing—original draft, W.L. (Wenchao Li) and L.H.; writing—review and editing, W.L. (Wenjun Li); project administration, W.L. (Wenjun Li) and L.Y.; funding acquisition, W.L. (Wenjun Li) All authors have read and agreed to the published version of the manuscript.

Funding

The work was supported by the Natural Science Foundation of China (U1903104), the Tianshan Youth Program of Xinjiang Uygur Autonomous Region (2019Q036), and the Youth Innovation Promotion Association Foundation of the Chinese Academy of Sciences, China (No. 2019429).

Institutional Review Board Statement

Not applicable.

Informed Consent Statement

Not applicable.

Data Availability Statement

Not applicable.

Acknowledgments

We thank Bayanbulak Grassland Station and the local agriculture department for their help. This guaranteed that our experiment could proceed.

Conflicts of Interest

The authors declare no conflict of interest.

References

  1. Drenovsky, R.E.; Grewell, B.J.; D’antonio, C.M.; Funk, J.L.; James, J.J.; Molinari, N.; Psker, I.M.; Richards, C.L. A functional trait perspective on plant invasion. Ann. Bot. 2012, 110, 141–153. [Google Scholar] [CrossRef] [Green Version]
  2. Warren, R.J.; Candeias, M.; Lafferty, A.; Chick, L.D. Regional-scale environmental resistance to non-native ant invasion. Biol. Invasions 2020, 22, 813–825. [Google Scholar] [CrossRef]
  3. Aldorfová, A.; Knobová, P.; Münzbergová, Z. Plant–soil feedback contributes to predicting plant invasiveness of 68 alien plant species differing in invasive status. Oikos 2020, 129, 1257–1270. [Google Scholar] [CrossRef]
  4. Bradshaw, A.D. Evolutionary significance of phenotypic plasticity in plants. Adv. Genet. 1965, 13, 115–155. [Google Scholar]
  5. Ren, L.; Guo, X.; Liu, S.; Yu, T.; Guo, W.; Wang, R.; Ye, S.; Lambertini, C.; Brix, H.; Eller, F. Intraspecific variation in Phragmites australis: Clinal adaption of functional traits and phenotypic plasticity vary with latitude of origin. J. Ecol. 2020, 108, 2531–2543. [Google Scholar] [CrossRef]
  6. Etges, W.J.; Trotter, M.V.; de Oliveira, C.C.; Rajpurohit, S.; Gibbs, A.G.; Tuljapurkar, S. Deciphering life history transcriptomes in different environments. Mol. Ecol. 2015, 24, 151–179. [Google Scholar] [CrossRef] [PubMed] [Green Version]
  7. Liao, Z.Y.; Scheepens, J.F.; Li, W.T.; Wang, R.F.; Zheng, Y.L.; Feng, Y.L. Biomass reallocation and increased plasticity might contribute to successful invasion of Chromolaena odorata. Flora 2019, 256, 79–84. [Google Scholar] [CrossRef]
  8. Rathee, S.; Ahmad, M.; Sharma, P.; Singh, H.P.; Batish, D.R.; Kaur, S.; Kaur, A.; Yadav, S.; Kohli, R.K. Biomass allocation and phenotypic plasticity are key elements of successful invasion of Parthenium hysterophorus at high elevation. Environ. Exp. Bot. 2021, 184, 104392. [Google Scholar] [CrossRef]
  9. Wang, J.H.; Chen, W.; Zhu, H. Ecological stoichiometry and invasive strategies of two alien species (Bidens pilosa and Mikania micrantha) in subtropical China. Ecol. Res. 2019, 34, 612–623. [Google Scholar] [CrossRef]
  10. Postma, J.A.; Hecht, V.L.; Hikosaka, K.; Nord, E.A.; Pons, T.L.; Poorter, H. Dividing the pie: A quantitative review on plant density responses. Plant Cell Environ. 2021, 44, 1072–1094. [Google Scholar] [CrossRef]
  11. Rehling, F.; Sandner, T.M.; Matthies, D. Biomass partitioning in response to intraspecific competition depends on nutrients and species characteristics: A study of 43 plant species. J. Ecol. 2021, 109, 2219–2233. [Google Scholar] [CrossRef]
  12. Ren, G.; He, F.; Sun, J.; Hu, W.; Azeem, A.; Qi, S.; Yang, B.; Cui, M.; Jiang, K.; Du, D. Resource conservation strategy helps explain patterns of biological invasion in a low-N environment. Biochem. Syst. Ecol. 2021, 94, 104205. [Google Scholar] [CrossRef]
  13. Bloom, R.G.; Mallik, A.U. Indirect effects of black spruce (Picea mariana) cover on community structure and function in sheep laurel (Kalmia angustifolia) dominated heath of eastern Canada. Plant Soil 2004, 265, 279–293. [Google Scholar] [CrossRef]
  14. Elser, J. Biological stoichiometry: A chemical bridge between ecosystem ecology and evolutionary biology. Am. Nat. 2006, 168, S25–S35. [Google Scholar] [CrossRef] [PubMed]
  15. Dybzinski, R.; Kelvakis, A.; McCabe, J.; Panock, S.; Anuchitlertchon, K.; Vasarhelyi, L.; McCormack, M.; McNickle, G.; Poorter, H.; Trinder, C.; et al. How are nitrogen availability, fine-root mass, and nitrogen uptake related empirically? Implications for models and theory. Glob. Change Biol. 2019, 25, 885–899. [Google Scholar] [CrossRef] [PubMed] [Green Version]
  16. Funk, J.L.; Vitousek, P.M. Resource-use efficiency and plant invasion in low-resource systems. Nature 2007, 446, 1079–1081. [Google Scholar] [CrossRef]
  17. Zhao, W.X.; Liu, T.; Liu, Y.; Wang, H.Y.; Wang, R.L.; Ma, Q.Q.; Dong, H.G.; Bi, X. The significance of biomass allocation to population growth of the invasive species Ambrosia artemisiifolia and Ambrosia trifida with different densities. BMC Ecol. Evol. 2021, 21, 1–13. [Google Scholar] [CrossRef]
  18. Poorter, H.; Niinemets, Ü.; Poorter, L.; Wright, I.J.; Villar, R. Causes and consequences of variation in leaf mass per area (LMA): A meta-analysis. New Phytol. 2009, 182, 565–588. [Google Scholar] [CrossRef]
  19. Poorter, H.; Niklas, K.J.; Reich, P.B.; Oleksyn, J.; Poot, P.; Mommer, L. Biomass allocation to leaves, stems and roots: Meta-analyses of interspecific variation and environmental control. New Phytol. 2012, 193, 30–50. [Google Scholar] [CrossRef] [PubMed]
  20. Freschet, G.T.; Swart, E.M.; Cornelissen, J.H. Integrated plant phenotypic responses to contrasting above-and below-ground resources: Key roles of specific leaf area and root mass fraction. New Phytol. 2015, 206, 1247–1260. [Google Scholar] [CrossRef]
  21. Alpert, P.; Bone, E.; Holzapfel, C. Invasiveness, invasibility and the role of environmental stress in the spread of non-native plants. Perspect. Plant Ecol. Evol. Syst. 2000, 3, 52–66. [Google Scholar] [CrossRef] [Green Version]
  22. Olmstead, R.G.; de Pamphilis, C.W.; Wolfe, A.D.; Young, N.D.; Elisons, W.J.; Reeves, P.A. Disintegration of the Scrophulariaceae. Am. J. Bot. 2001, 88, 348–361. [Google Scholar] [CrossRef] [PubMed]
  23. Yang, H.B.; Holmgren, N.H.; Mill, R.R.; Pedicularis, L. Flora of China; Wu, Z.Y., Peter, H.R., Hong, D.Y., Eds.; Missouri Botanical Garden Press: St. Louis, MO, USA; Science Press: Beijing, China, 1998; Volume 18, pp. 97–209. [Google Scholar]
  24. Sui, X.; Kuss, P.; Li, W.; Yang, M.; Guan, K.; Li, A. Identity and distribution of weedy Pedicularis kansuensis Maxim.(Orobanchaceae) in Tianshan Mountains of Xinjiang: Morphological, anatomical and molecular evidence. J. Arid Land 2016, 8, 453–461. [Google Scholar] [CrossRef] [Green Version]
  25. Bao, G.S.; Suetsugu, K.j.; Wang, H.S.; Yao, X.; Liu, L.; Ou, J.; LI, C.J. Effects of the hemiparasitic plant Pedicularis kansuensis on plant community structure in a degraded grassland. Ecol. Res. 2015, 30, 507–515. [Google Scholar] [CrossRef]
  26. LI, X.P.; Zhao, C.Z.; REN, Y.; Zhang, j.; Lei, L. Relationship between root forks and link number, branch angle of Pedicularis kansuensis under different density conditions in Gahai Wetland. Acta Ecol. Sin. 2019, 39, 3670–3676. [Google Scholar]
  27. Poorter, H.; Niinemets, Ü.; Ntagkas, N.; Siebenkäs, A.; Mäenpää, M.; Matsubara, S.; Pons, T. A meta-analysis of plant responses to light intensity for 70 traits ranging from molecules to whole plant performance. New Phytol. 2019, 223, 1073–1105. [Google Scholar] [CrossRef] [PubMed] [Green Version]
  28. Bao, S.D. The Agro-Chemical Analysis of Soil; China Agriculture Press: Beijing, China, 2000. (In Chinese) [Google Scholar]
  29. Song, S.; Leng, H.; Feng, S.; Meng, C.; Luo, B.; Zhao, L.; Zhang, C. Biomass allocation pattern of urban shrubs in the Yangtze River Delta region, China–A field observation of 13 shrub species. Urban For. Urban Green. 2021, 63, 127228. [Google Scholar] [CrossRef]
  30. Lamarque, L.J.; Porte, A.J.; Eymeric, C.; Lasnier, J.B.; Lortie, C.J.; Delzon, S. A test for pre-adapted phenotypic plasticity in the invasive tree Acer negundo L. PLoS ONE 2013, 8, e74239. [Google Scholar] [CrossRef] [Green Version]
  31. Huey, R.B.; Gilchrist, G.W.; Carlson, M.L.; Berrigan, D.; Serra, L. Rapid evolution of a geographic cline in size in an introduced fly. Science 2000, 287, 308–309. [Google Scholar] [CrossRef] [Green Version]
  32. Li, W.J. Taxonomy of Pedicularis in Xinjiang and Genetic Diversity and Distribution Model of P. kansuensis Maxim. Doctoral Dissertation, University of Chinese Academy of Sciences:, Beijing, China, 2016. (In Chinese). [Google Scholar]
  33. Hou, Z.J.; Zhao, C.Z.; Li, Y.; Zhang, Q.; Ma, X.L. Trade-off between height and branch numbers in Stellera chamaejasme on slopes of different aspects in a degraded alpine grassland. Chin. J. Plant Ecol. 2014, 38, 281–288. (In Chinese) [Google Scholar]
  34. Doust, J.L.; Silvertown, J.W. Introduction to plant population ecology. J. Ecol. 1988, 76, 912. [Google Scholar] [CrossRef]
  35. Fan, G.H.; Zhang, J.W.; Huang, Y.X.; Shen, X.J.; Yu, P.J.; Zhao, X.Y. Influence of population density on morphological traits and allometric growth of Corispermum macrocarpum. Acta Ecol. Sin. 2018, 38, 3931–3942. (In Chinese) [Google Scholar]
  36. Zheng, W.; Fan, G.H.; Huang, Y.X.; Wang, T.; Yu, P.J.; Wang, H.Q. Allometric relationships between the morphological traits and biomass allocation strategies of Salsola collina under different population density. Acta Ecol. Sin. 2021, 41, 2845–2854. (In Chinese) [Google Scholar]
  37. Burns, J.H.; Strauss, S.Y. Effects of competition on phylogenetic signal and phenotypic plasticity in plant functional traits. Ecology 2012, 93, S126–S137. [Google Scholar] [CrossRef]
  38. Heger, T.; Jacobs, B.S.; Latimer, A.M.; Kollmann, J.; Rice, K.J. Does experience with competition matter? Effects of source competitive environment on mean and plastic trait expression in Erodium cicutarium. Perspect. Plant Ecol. Evol. Syst. 2014, 16, 236–246. [Google Scholar] [CrossRef]
  39. Semchenko, M.; Saar, S.; Lepik, A. Plant root exudates mediate neighbour recognition and trigger complex behavioural changes. N. Phytol. 2014, 204, 631–637. [Google Scholar] [CrossRef]
  40. Belter, P.R.; Cahill, J.F. Disentangling root system responses to neighbours: Identification of novel root behavioural strategies. Aob Plants 2015, 7, plv059. [Google Scholar] [CrossRef] [PubMed] [Green Version]
  41. Sterner, R.W.; Elser, J.J. Ecological Stoichiometry: The Biology of Elements from Molecules to the Biosphere; Princeton University Press: Princeton, NJ, USA, 2002. [Google Scholar]
  42. Cuassolo, F.; Balseiro, E.; Modenutti, B. Alien vs. native plants in a Patagonian wetland: Elemental ratios and ecosystem stoichiometric impacts. Biol. Invasions 2012, 14, 179–189. [Google Scholar] [CrossRef]
  43. Kleyer, M.; Trinogga, J.; Cebrián-Piqueras, M.A.; Trenkamp, A.; Fløjgaard, C.; Ejrnæs, R.; Bouma, T.J.; Minden, V.; Maier, M.; Mantilla-Contreras, J.; et al. Trait correlation network analysis identifies biomass allocation traits and stem specific length as hub traits in herbaceous perennial plants. J. Ecol. 2019, 107, 829–842. [Google Scholar] [CrossRef] [Green Version]
  44. Vitousek, P.M.; Howarth, R.W. Nitrogen limitation on land and in the sea: How can it occur? Biogeochemistry 1991, 13, 87–115. [Google Scholar] [CrossRef]
  45. Koerselman, W.; Meuleman, A.F. The vegetation N: P ratio: A new tool to detect the nature of nutrient limitation. J. Appl. Ecol. 1996, 33, 1441–1450. [Google Scholar] [CrossRef]
  46. Guo, Q.; Wu, X.; Korpelainen, H.; Li, C. Stronger intra-specific competition aggravates negative effects of drought on the growth of Cunninghamia lanceolata. Environ. Exp. Bot. 2020, 175, 104042. [Google Scholar] [CrossRef]
  47. Güsewell, S.; Koerselman, W.; Verhoeven, J.T. Biomass N: P ratios as indicators of nutrient limitation for plant populations in wetlands. Ecol. Appl. 2003, 13, 372–384. [Google Scholar] [CrossRef]
  48. Elser, J.J.; Peace, A.L.; Kyle, M.; Wojewodzic, M.; McCrackin, M.L.; Andersen, T.; Hessen, D.O. Atmospheric nitrogen deposition is associated with elevated phosphorus limitation of lake zooplankton. Ecol. Lett. 2010, 13, 1256–1261. [Google Scholar] [CrossRef]
  49. Penuelas, J.; Sardans, J.; Llusià, J.; Owen, S.M.; Carnicer, J.; Giambelluca, T.W.; Glambelluca, E.L.; Rezende, M.W.; ÜLO, N. Faster returns on ‘leaf economics’ and different biogeochemical niche in invasive compared with native plant species. Glob. Change Biol. 2010, 16, 2171–2185. [Google Scholar] [CrossRef] [Green Version]
  50. Sardans, J.; Peñuelas, J. The role of plants in the effects of global change on nutrient availability and stoichiometry in the plant-soil system. Plant Physiol. 2012, 160, 1741–1761. [Google Scholar] [CrossRef] [Green Version]
  51. Naddafi, R.; Eklöv, P.; Pettersson, K. Stoichiometric constraints do not limit successful invaders: Zebra mussels in Swedish lakes. PLoS ONE 2009, 4, e5345. [Google Scholar] [CrossRef] [Green Version]
  52. Makino, W.; Cotner, J.B.; Sterner, R.W.; Elser, J.J. Are bacteria more like plants or animals? Growth rate and resource dependence of bacterial C: N: P stoichiometry. Funct. Ecol. 2003, 17, 121–130. [Google Scholar] [CrossRef] [Green Version]
  53. González, A.L.; Kominoski, J.S.; Danger, M.; Ishida, S.; Iwai, N.; Rubach, A. Can ecological stoichiometry help explain patterns of biological invasions? Oikos 2010, 119, 779–790. [Google Scholar] [CrossRef]
  54. Elser, J.J.; Acharya, K.; Kyle, M.; Cotner, J.; Makino, W.; Markow, T.; Watts, T.; Hobbie, S.; Fagan, W.; Schade, J.; et al. Growth rate–stoichiometry couplings in diverse biota. Ecol. Lett. 2003, 6, 936–943. [Google Scholar] [CrossRef] [Green Version]
  55. Jing, H.; Zhou, H.; Wang, G.; Xue, S.; Liu, G.; Duan, M. Nitrogen addition changes the stoichiometry and growth rate of different organs in Pinus tabuliformis seedlings. Front. Plant Sci. 2017, 8, 1922. [Google Scholar] [CrossRef] [PubMed] [Green Version]
  56. Song, M.; Yu, L.; Jiang, Y.; Lei, Y.; Korpelainen, H.; Niinemets, Ü.; Li, C. Nitrogen-controlled intra-and interspecific competition between Populus purdomii and Salix rehderiana drive primary succession in the Gongga Mountain glacier retreat area. Tree Physiol. 2017, 37, 799–814. [Google Scholar] [CrossRef] [PubMed] [Green Version]
Figure 1. Differences in biomass allocation in different structures of Pedicularis kansuensis in different invasion levels. * indicates a significant difference (p < 0.05).
Diversity 15 00313 g001
Figure 2. Differences in R/S of Pedicularis kansuensis among different invasion levels. * indicates a significant difference (p < 0.05).
Diversity 15 00313 g002
Figure 3. Differences of C:N, C:P, and N:P in structures of Pedicularis kansuensis within the same invasion level. * indicates a significant difference (p < 0.05).
Diversity 15 00313 g003
Figure 4. Differences of C:N, C:P, and N:P in structures of Pedicularis kansuensis among the different invasion levels. * indicates a significant difference (p < 0.05).
Diversity 15 00313 g004
Table 1. Morphological characteristics of Pedicularis kansuensis in different invasion levels.
Level of InvasionPlant Height (cm)Inflorescence Length (cm)Root Length (cm)Branch NumberSingle-Leaf Weight (mg)Single-Leaf Thickness (mm)SLA (cm2 g−1)Single-Leaf Area (cm2)Density (Plant·m−2)Crown Width (cm)
Low22.28 ± 0.84 a8.74 ± 0.34 a7.14 ± 0.29 a7.31 ± 0.64 a11.18 ± 1.13 a0.35 ± 0.02 a163.66 ± 3.90 a1.81 ± 0.17 a20.40 ± 3.82 c17.92 ± 1.19 a
Medium18.89 ± 0.65 b7.67 ± 0.33 ab6.43 ± 0.36 ab5.92 ± 0.41 ab10.00 ± 0.45 a0.35 ± 0.01 a160.86 ± 5.01 a1.60 ± 0.08 a117.07 ± 7.40 b13.66 ± 0.39 b
High18.05 ± 0.58 b6.72 ± 0.63 b5.81 ± 0.31 b4.85 ± 0.52 b9.17 ± 1.24 a0.38 ± 0.03 a142.89 ± 12.78 a1.19 ± 0.06 b255.91 ± 16.35 a13.49 ± 0.61 b
Note: Different lowercase letters indicate significant differences among invasion levels (p < 0.05); values are mean ± standard error.
Table 2. Plasticity of morphological characteristics of Pedicularis kansuensis in different invasion levels.
Level of InvasionPPI
Plant HeightInflorescence LengthRoot LengthBranch NumberSingle-Leaf WeightLeaf ThicknessSLASingle-Leaf AreaCrown Width
Low0.270.270.340.550.600.370.190.570.47
Medium0.260.290.410.540.380.350.230.430.26
High0.270.570.350.550.700.540.580.370.33
Note: Values are mean.
Table 3. Biomass accumulations of Pedicularis kansuensis in different invasion levels.
Level of InvasionStem Biomass (g)Inflorescence Biomass (g)Root Biomass (g)Individual Biomass (g)Total Aboveground Biomass (g)
Low1.93 ± 0.24 Aa2.12 ± 0.3 Aa0.43 ± 0.04 Ba4.47 ± 0.55 a53.67 ± 3.26 c
Medium1.17 ± 0.11 Ab1.47 ± 0.16 Aab0.38 ± 0.04 Bab3.02 ± 0.28 b111.41 ± 5.96 b
High0.89 ± 0.13 Ab1.15 ± 0.26 Ab0.27 ± 0.04 Bb2.42 ± 0.45 b212.71 ± 12.76 a
Note: Different lowercase letters indicate significant differences among invasion levels (p < 0.05). Different uppercase letters indicate significant differences within the same invasion level (p < 0.05); values are mean ± standard error.
Table 4. Nutrient characteristics of aboveground parts of Pedicularis kansuensis among different invasion levels.
Level of InvasionC (g/kg)N (g/kg)P (g/kg)C:NC:PN:P
Low426.39 ± 2.37 a18.74 ± 0.58 a2.51 ± 0.17 a22.97 ± 0.66 b178.35 ± 14.15 b7.93 ± 0.83 a
Medium426.74 ± 2.35 a17.79 ± 0.41 a2.32 ± 0.14 ab24.11 ± 0.46 ab191.86 ± 14.34 ab8.02 ± 0.69 a
High435.19 ± 4.29 a17.42 ± 0.33 a1.95 ± 0.13 b25.11 ± 0.53 a233.09 ± 15.33 a9.26 ± 0.50 a
Note: Different lowercase letters indicate significant differences among invasion levels (p < 0.05); values are mean ± standard error.
Table 5. C, N, and P content of structures of Pedicularis kansuensis with different invasion levels.
StructureLevel of InvasionC (g/kg)N (g/kg)P (g/kg)
RootLow391.48 ± 4.68 Cab11.00 ± 0.16 Ca1.33 ± 0.04 Ba
Medium399.86 ± 3.35 Ba12.68 ± 0.85 Ba1.40 ± 0.04 Ba
High379.96 ± 4.86 Bb11.54 ± 0.20 Ca1.37 ± 0.05 Ba
StemLow427.48 ± 3.23 Ba13.38 ± 0.27 Ba1.55 ± 0.13 Ba
Medium435.91 ± 2.88 Aa14.16 ± 0.66 Ba1.46 ± 0.06 Ba
High431.18 ± 3.59 Aa13.28 ± 0.43 Ba1.44 ± 0.03 Ba
InflorescenceLow443.53 ± 2.50 Aa20.98 ± 0.36 Aa2.88 ± 0.12 Aa
Medium442.62 ± 3.88 Aa19.58 ± 0.25 Ab2.78 ± 0.16 Aa
High440.35 ± 2.96 Aa17.74 ± 0.46 Ac2.66 ± 0.11 Aa
Note: Different lowercase letters indicate significant differences among invasion levels (p < 0.05). Different uppercase letters indicate significant differences within the same invasion level (p < 0.05); values are mean ± standard error.
Disclaimer/Publisher’s Note: The statements, opinions and data contained in all publications are solely those of the individual author(s) and contributor(s) and not of MDPI and/or the editor(s). MDPI and/or the editor(s) disclaim responsibility for any injury to people or property resulting from any ideas, methods, instructions or products referred to in the content.

