
Floristic Homogenization and Differentiation under Deer Grazing in a Subalpine Zone in Central Japan


Forest Research Division, Yamanashi Forest Research Institute, Yamanashi 400-0502, Japan
Diversity 2023, 15(2), 192; https://doi.org/10.3390/d15020192
Submission received: 27 December 2022
/
Revised: 27 January 2023
/
Accepted: 28 January 2023
/
Published: 30 January 2023
(This article belongs to the Section Plant Diversity)
Abstract
:Changes of vegetation due to deer grazing may result in floristic homogenization or differentiation. The relationships between the changes caused by grazing are still being debated. Vascular plants and grazing by Cervus nippon were recorded in 2010 and 2018 in Betula forests and tall grassland communities in a subalpine zone, central Japan. Species composition differed significantly between vegetation types in both censuses. The α-diversity had declined significantly in both vegetation types. Metrics related to species replacement made a greater contribution to β-diversity than those related to nestedness in both vegetation types. A decrease of β-diversity based on incidence data from 2010 to 2018 in the Betula forests indicated that floristic homogenization had occurred; an increase of β-diversity based on abundance data from 2010 to 2018 in the grasslands indicated that floristic differentiation had occurred. Changes of α-diversity in both vegetation types and of β-diversity in the grasslands were significantly correlated with grazing intensity. These results showed that deterministic processes, which originally differed between the Betula forests and grasslands, would be the dominant causes of floristic changes under deer-grazing pressure.
1. Introduction
Studies of the effects of ungulate herbivory on vegetation are an important component of biodiversity research due to the need to elucidate the mechanisms by which plant communities are formed and maintained and to manage the effects of herbivory [1]. Although some vegetation types were formed and maintained from long-term grazing and browsing by ungulate herbivores [2,3], recently colonized and overabundant ungulate herbivores could severely impact vegetation. The number of long-term studies (e.g., >20 years) regarding changes of vegetation caused by ungulate herbivory has been increasing, and some of the results have shown changes of α- and β-diversity that have reflected changes of the number, abundance, and composition of plant species [1,4,5]. Ungulate herbivory can substantially and rapidly affect the composition of vegetation, even in the short term (e.g., ≤10 years) [4,6]. After devastating and lasting changes, it is difficult to rehabilitate vegetation or restore it to its original state [7]. To detect signs of such changes, it is necessary to study not only long-term but also short-term changes of vegetation in response to ungulate herbivory, particularly in sites where vegetation should be conserved (e.g., nature reserves).
The number and abundance of palatable and unpalatable species depend on the original vegetation types, which in turn are governed by environmental conditions and grazing intensity [8,9]. The effects of ungulate grazing on vegetation are complicated not only by changes in the number of species [1,5], but also by decreases in the abundance of palatable species and increases in the abundance of unpalatable species [8,9,10,11]. Biotic homogenization, which is defined generally as the process by which the genetic, taxonomic, or functional similarities of biotas increase over time [12], has been documented in the case of vegetation [13,14]. Since floristic homogenization involves a temporal decrease in β-diversity (i.e., an increase of the similarity of species composition among sites) [15], dissimilarity metrics are typically used to detect homogenization (e.g., [8,16]). Floristic homogenization is caused by changes in species richness—either an increase [17] or a decrease [18]—and changes in species attributes such as an increase in the number of generalist species [8], a loss of specialists [16], or an increase in the numbers of exotic [18,19] or native species [17,20]. Ungulate grazing could promote either floristic homogenization or differentiation shaping such changes [4,21,22,23]. Thus, factors affecting floristic homogenization or differentiation were unclear until now. Also, to understand the changes in plant community, it is important to clarify the mechanisms behind the relative importance of deterministic processes (niche-related, including interspecific interactions, and environmental forcing) and stochastic processes (unselective, including colonization or extinction dynamics, and ecological drift) [24,25]. The results of efforts to elucidate the effects of ungulate grazing on these processes are still being debated, and no conclusions have been reached [25,26,27] since grazing reduces the predictability of both successional trends and species-level dynamics [26]. It is thus necessary to better understand the relationship between the floristic changes (homogenization or differentiation) caused by grazing and the processes that originally formed vegetation types.
In Japan, the numbers of sika deer (Cervus nippon), an indigenous species, have increased since about 2000 as a result of decreased hunting pressure, land use change by depopulation in rural areas and so on [28,29]. The effects of their browsing, grazing, and debarking have been severe in the last two decades (e.g., [14,30,31]), unlike the effects of long-term grazing by domestic animals (e.g., [26]). The area inhabited by sika deer has been expanding from the lowlands to the highlands [29] and to nature reserves [28,32], as a result of changes in habitat selection due to culling designed to manage deer population and hunting [33,34]. Natural and some semi-natural vegetation originally established in the absence of grazing has been significantly affected by the recent heavy grazing [10,35]. The effects of this grazing on vulnerable and important vegetation should be evaluated to enable the establishment of conservation targets that will provide protection from grazing [36].
In this study, I examined changes of two types of natural vegetation (dwarf Betula forests and grasslands) that have evolved under different natural conditions in a subalpine zone of central Japan. The objectives of this study were to determine vegetation changes due to deer grazing on α- and β-diversity and to evaluate the potential role of deer grazing in changing the abundance and distribution towards floristic homogenization or differentiation.
2. Materials and Methods
2.1. Study Site
The study site was at elevations of 2200–2800 m on the side of Mt. Kita (elevation, 3193 m), which is the second-tallest mountain in Japan and is located in Yamanashi Prefecture, central Japan. Mt. Kita and the surrounding area are registered and preserved as the Minami Alps Biosphere Reserve (302,474 ha) and the Minami Alps National Park (35,752 ha). In this area, no sika deer were found at elevations higher than about 1000 m until two decades ago (S. Izumiyama, personal communication). However, the estimated sika deer density in this area increased from about 10 individuals/km2 in 2010 to 16 individuals/km2 in 2018 (ref. [29] and unpublished data).
Two types of vegetation dominate the subalpine zone of this area, namely dwarf Betula ermanii forests and tall grassland communities, which are mainly dominated by Trollius shinanensis and Ranunculus acris var. nipponicus [37]. These vegetation types are broadly distributed in the core areas (24,970 ha) of the biosphere reserve. These types of vegetation were chosen as study sites since grazing and browsing by deer have been heavy on these vegetation types [32]. The Betula forests are edaphic climax forests, and the frequent sprouting of B. ermanii reflects the effects of heavy snow pressure and avalanches [37]. The grasslands of this study site are found on slopes along ravines and on subalpine, gentle, leeward slopes where forests have not become established due to the over-moist conditions created by late melting of snow [38].
The two vegetation types were adjacent to each other, and had no human intervention. Detailed information about the study area can be found in Nagaike [32].
2.2. Experimental Design
Transects were set up along a trail (about 1 m wide and unpaved) through each vegetation community at approximately 30-m intervals in 2010 (ref. [32], Figure S1). The transects were approximately 20 m long and straddled the trail. Quadrats (1 m × 1 m) were set up every ~5 m along both sides of the trail (i.e., 5 quadrats on each side—10 quadrats in total—along each transect) and located 1–2 m from the trail edge (Figure S1). There were 16 transects in the Betula forests and 26 in the tall grassland communities. In total, 420 quadrats were set up. The elevation of the study transects was 2406–2730 m in the Betula forests and 2219–2812 m in the tall grasslands. None of the quadrats was affected by human intervention since walking outside a trail is forbidden. The transects were located at precisely the same places in both censuses using global positioning systems. The locations of the quadrats were measured and placed at 5-m intervals along the trail associated with each transect. The quadrats were thus not placed at exactly the same places during the censuses. Places impacted by heavy trampling by sika deer were apparent (e.g., sika deer trails) and were avoided to focus the study on grazing effects. The names of the vascular plants (<2 m tall) occurring in each quadrat were recorded (presence/absence data) to evaluate the effects of grazing on understory vegetation. Whether the species found in each quadrat had been grazed by sika deer was also recorded. This census was conducted in late August of 2010 and 2018.
2.3. Study of Plant Diversity
The presence/absence data for each species and whether the species had been grazed by sika deer in each quadrat were summed for each transect (i.e., 0–10 for each species in a transect). The frequencies of occurrence of each species of vegetation and of grazing by sika deer on each species were thus obtained for each transect. The grazing ratios (the number of grazed quadrats divided by the total number of quadrats) were calculated for each species and transect. The α-diversity (species richness [the number of species per transect], the Shannon–Wiener diversity index (H′; [39]), and the evenness index (J′; [39])) was calculated for each transect. The values of H′ and J′ were quantified by using the frequency of occurrence of each species. H′ and J′ were calculated from the frequency (1–10) of occurrence of each species per transect. The H′ and J′ indices were calculated using the following formulae:
where pi is the frequency of occurrence of each species relative to the total frequency of occurrence of all species in each transect, and m is the number of species in each transect.
To calculate β-diversity with incidence and abundance data, I used a partitioning technique for the β-diversity of vegetation in accordance with the framework of Baselga [40,41] as follows (Table 1). For incidence data, βSOR = βSIM + βSNE; where βSOR (Sørensen dissimilarity) represents the total difference in species composition between censuses in a transect and among transects in each vegetation type, and βSIM (Simpson dissimilarity) and βSNE (nestedness-driven dissimilarity) are the “turnover” and “nestedness” components, respectively, of the species composition. For abundance data, βBC = βBC.BAL + βBC.GRA, where βBC (Bray–Curtis dissimilarity) represents the total difference in species composition, and βBC.BAL (the individuals of some species in one transect or census are replaced by the same number of individuals of a different species in another transect or census; substitution) and βBC.GRA (some individuals are lost from one transect to the other or between census periods; subset) are its “replacement and balanced variation in abundance” and “nestedness in abundance gradients” components, respectively [41].
2.4. Data Analysis
A multi-response permutation procedure (MRPP) was used to test for compositional differences between vegetation types and across censuses. The MRPP is a nonparametric procedure for testing the hypothesis of no difference between two or more groups, which is established a priori by comparing the average within-group similarity with the similarity among transects [42]. Sørensen (incidence data) and Bray-Curtis (abundance data) similarity indexes were used for the MRPP. Being nonparametric, the MRPP was well suited to my data, which were on discontinuous scales and included a high proportion of zeroes [43].
Indicator Species Analysis [44] was carried out to find the changes of the frequency of occurrence between 2010 and 2018 of the species assigned to each vegetation type. The significance of the changes was evaluated using a Monte Carlo simulation with 1000 runs, in which samples were randomly reassigned to either 2010 or 2018, and the changes were recalculated. For α- and β-diversity metrics and grazing ratios, the differences between 2010 and 2018 and between vegetation types were tested by using the exact Wilcoxon signed-rank test and the Wilcoxon rank-sum test, respectively. Simple correlations between grazing ratios and α- and β-diversity metrics were tested for significance based on the significance of Pearson’s product-moment correlation coefficients.
All analyses were performed in R version. 3.5.2 software [45] by using the “vegan” package for MRPP [46], the “exactRankTests” package for the exact Wilcoxon signed-rank test [47], the “betapart” package for β-diversity [40,41,48] and the “indicspecies” package for Indicator Species Analysis [44]. Plant nomenclature followed that of Yonekura and Kajita [49].
3. Results
3.1. Changes in α- and β-Diversity
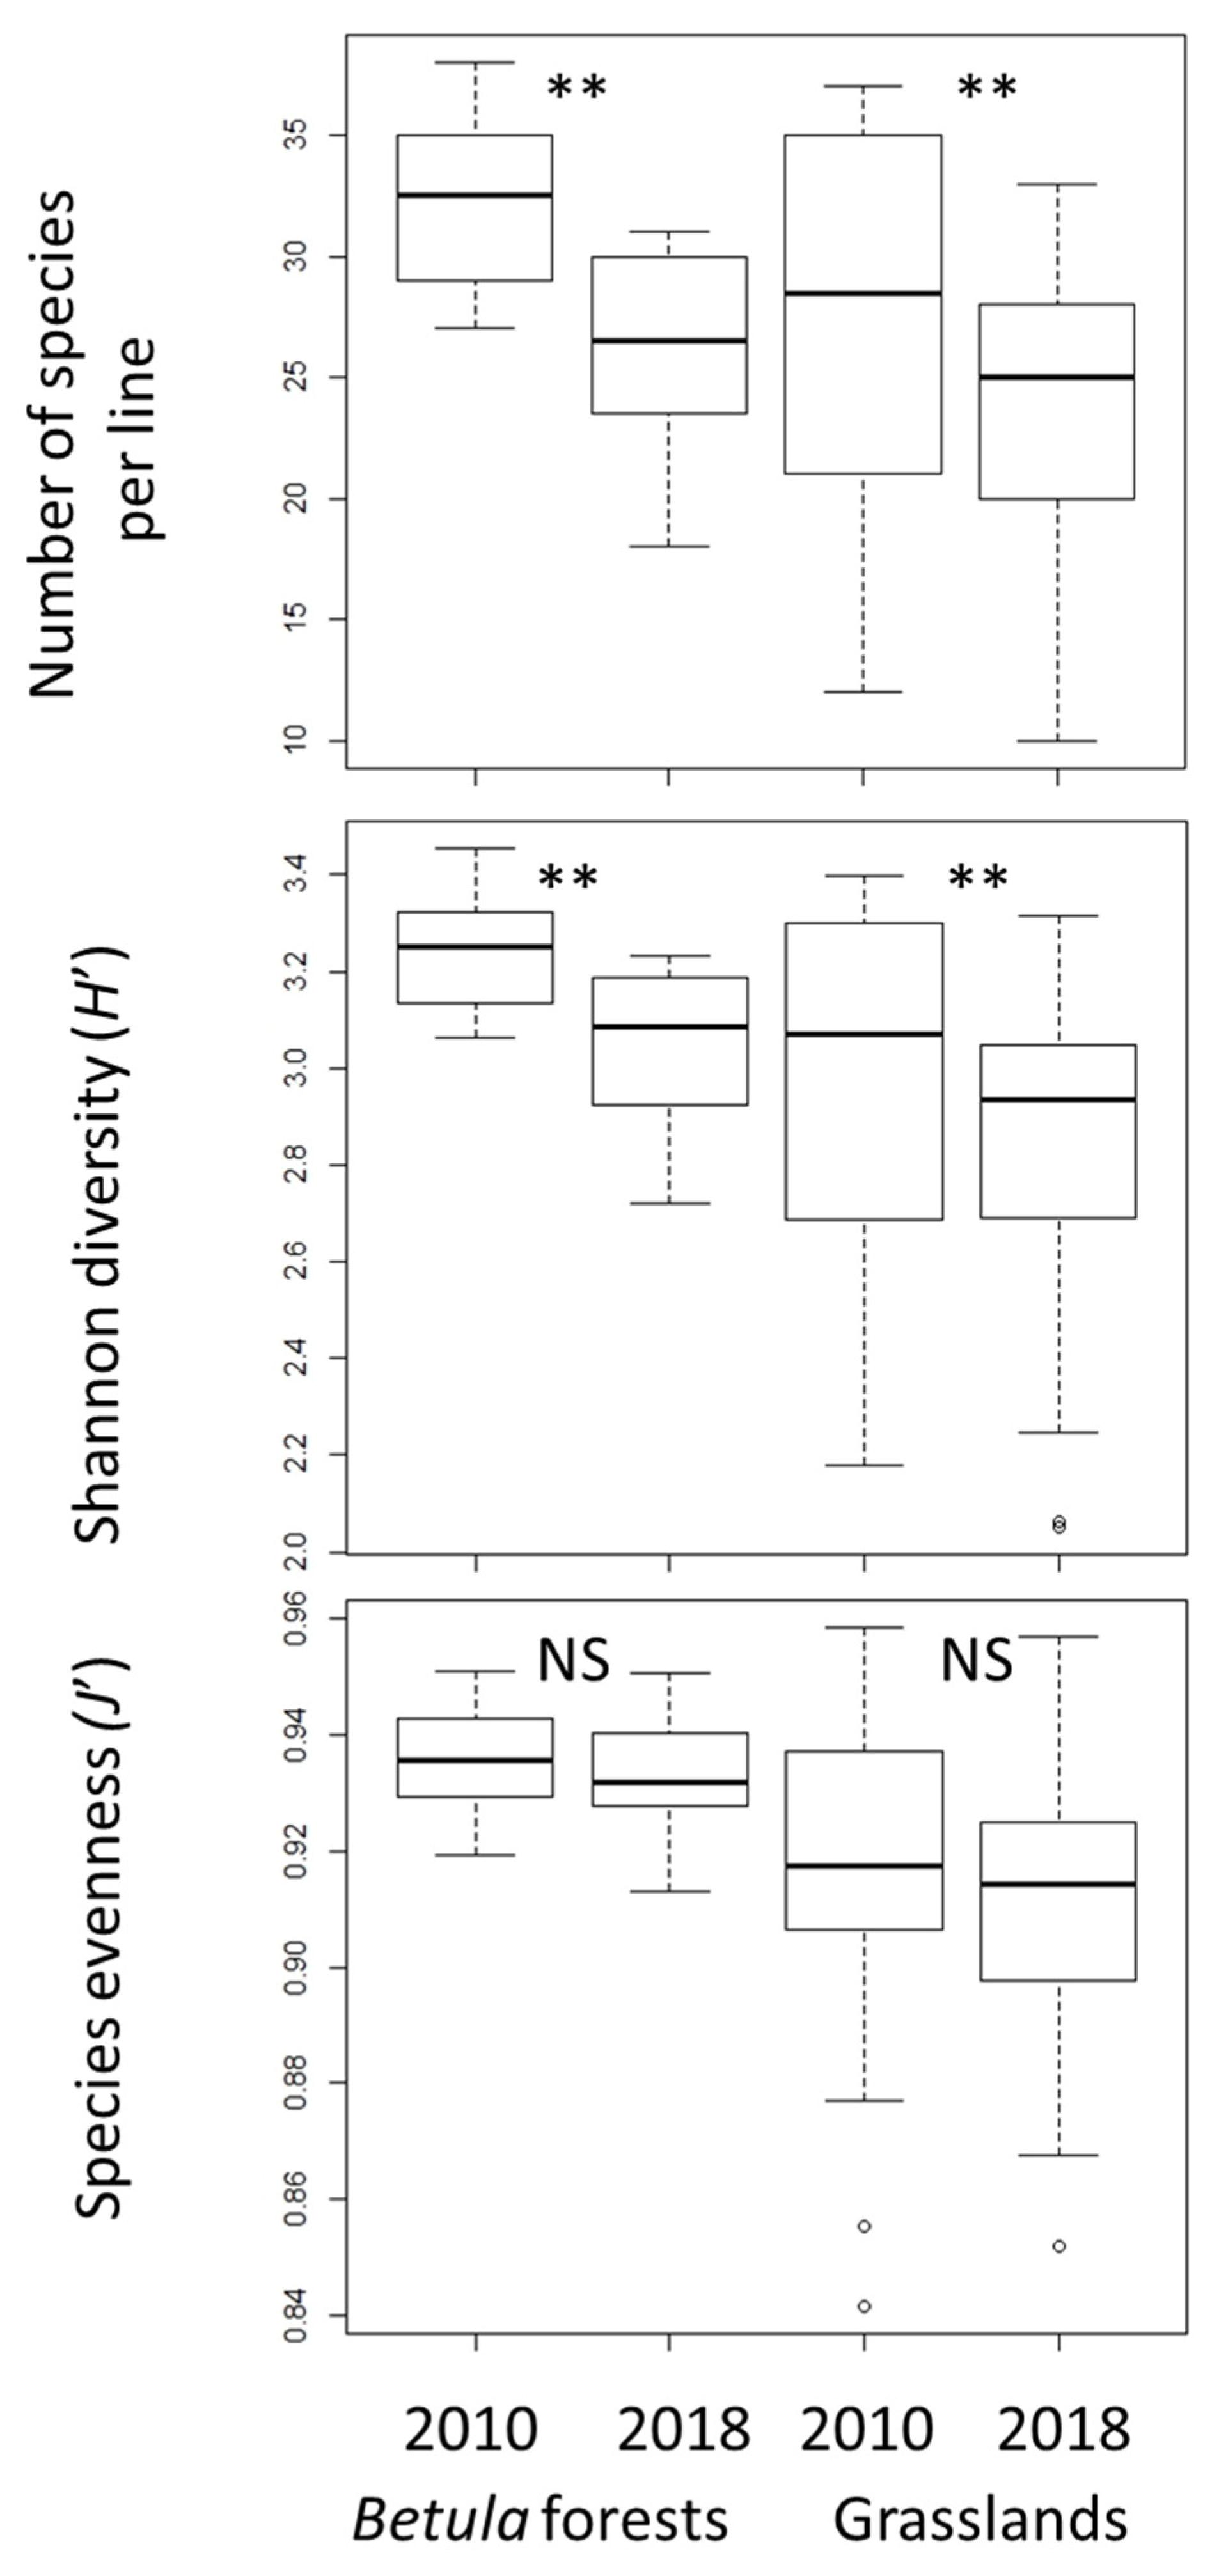
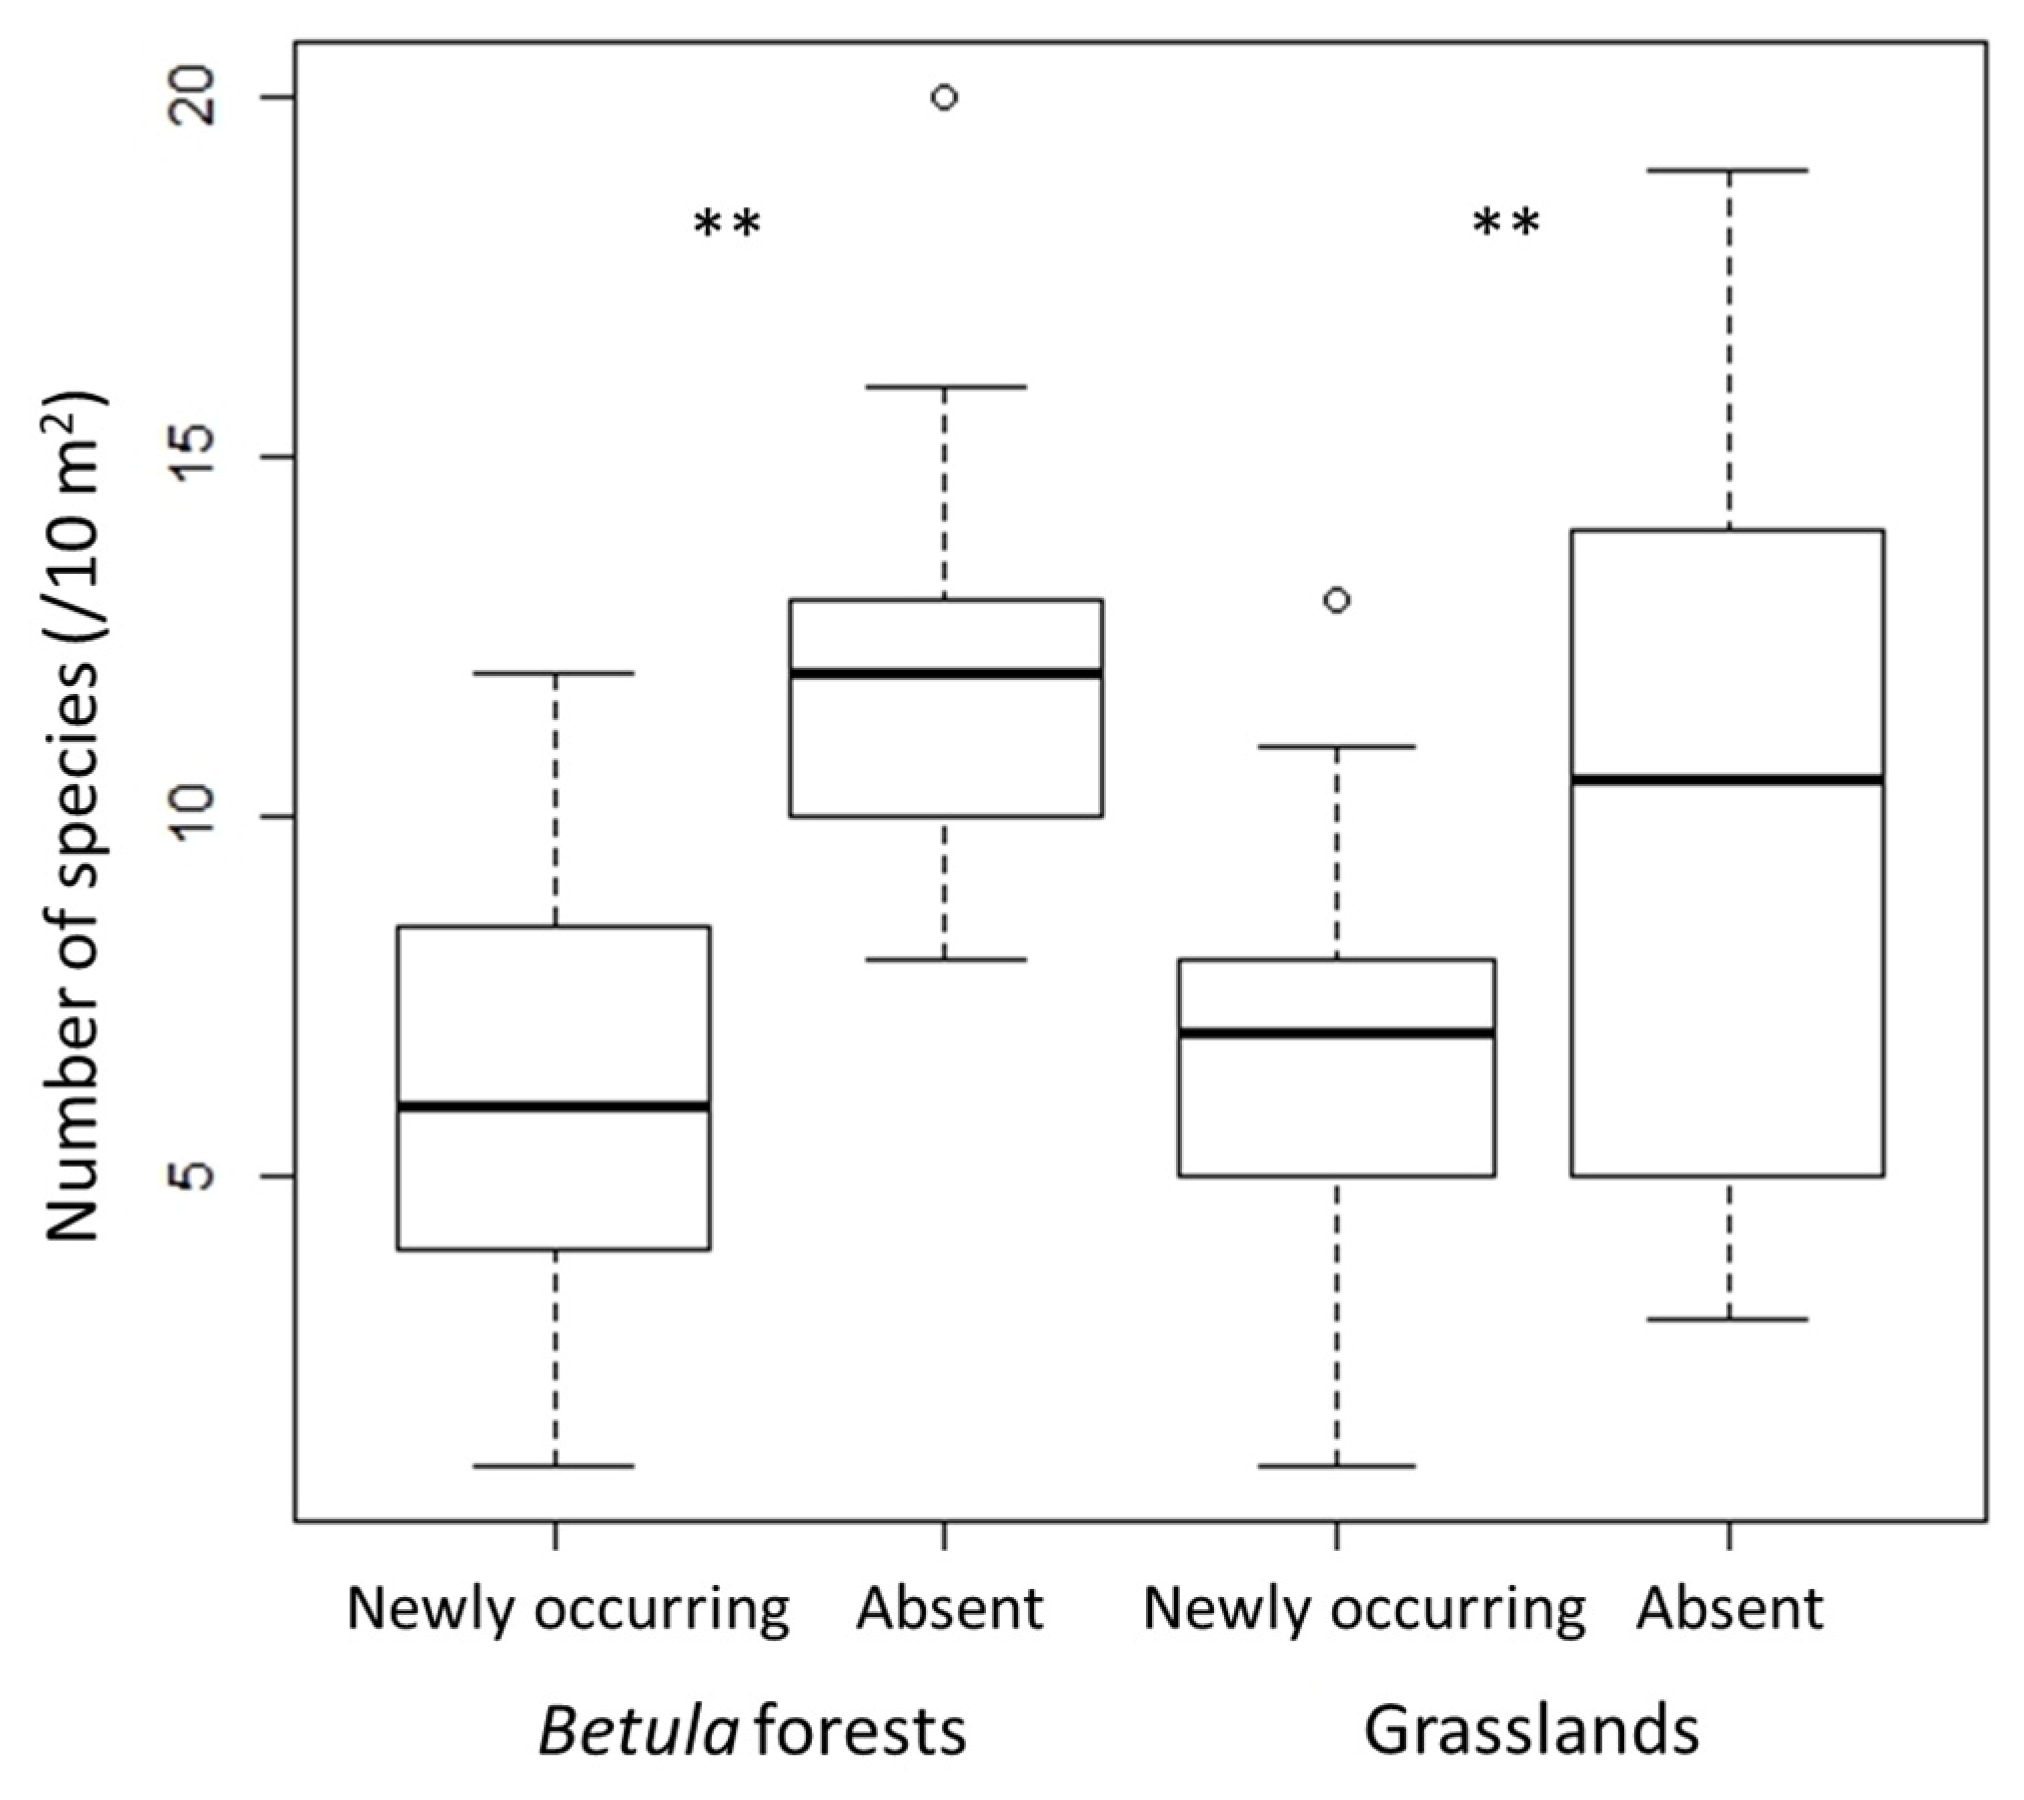
In both Betula forests and grasslands, species richness and H′ were significantly lower in 2018 than in 2010, whereas J′ did not change significantly (Figure 1). The decrease of species richness and H′ from 2010 to 2018 was greater in the Betula forests than in the grasslands. Species richness and diversity (H′ and J′) were higher in the Betula forests than in the grasslands (p < 0.01 in both censuses). The number of species that disappeared from 2010 to 2018 was significantly greater than the number of new species that appeared in both vegetation types (Figure 2).
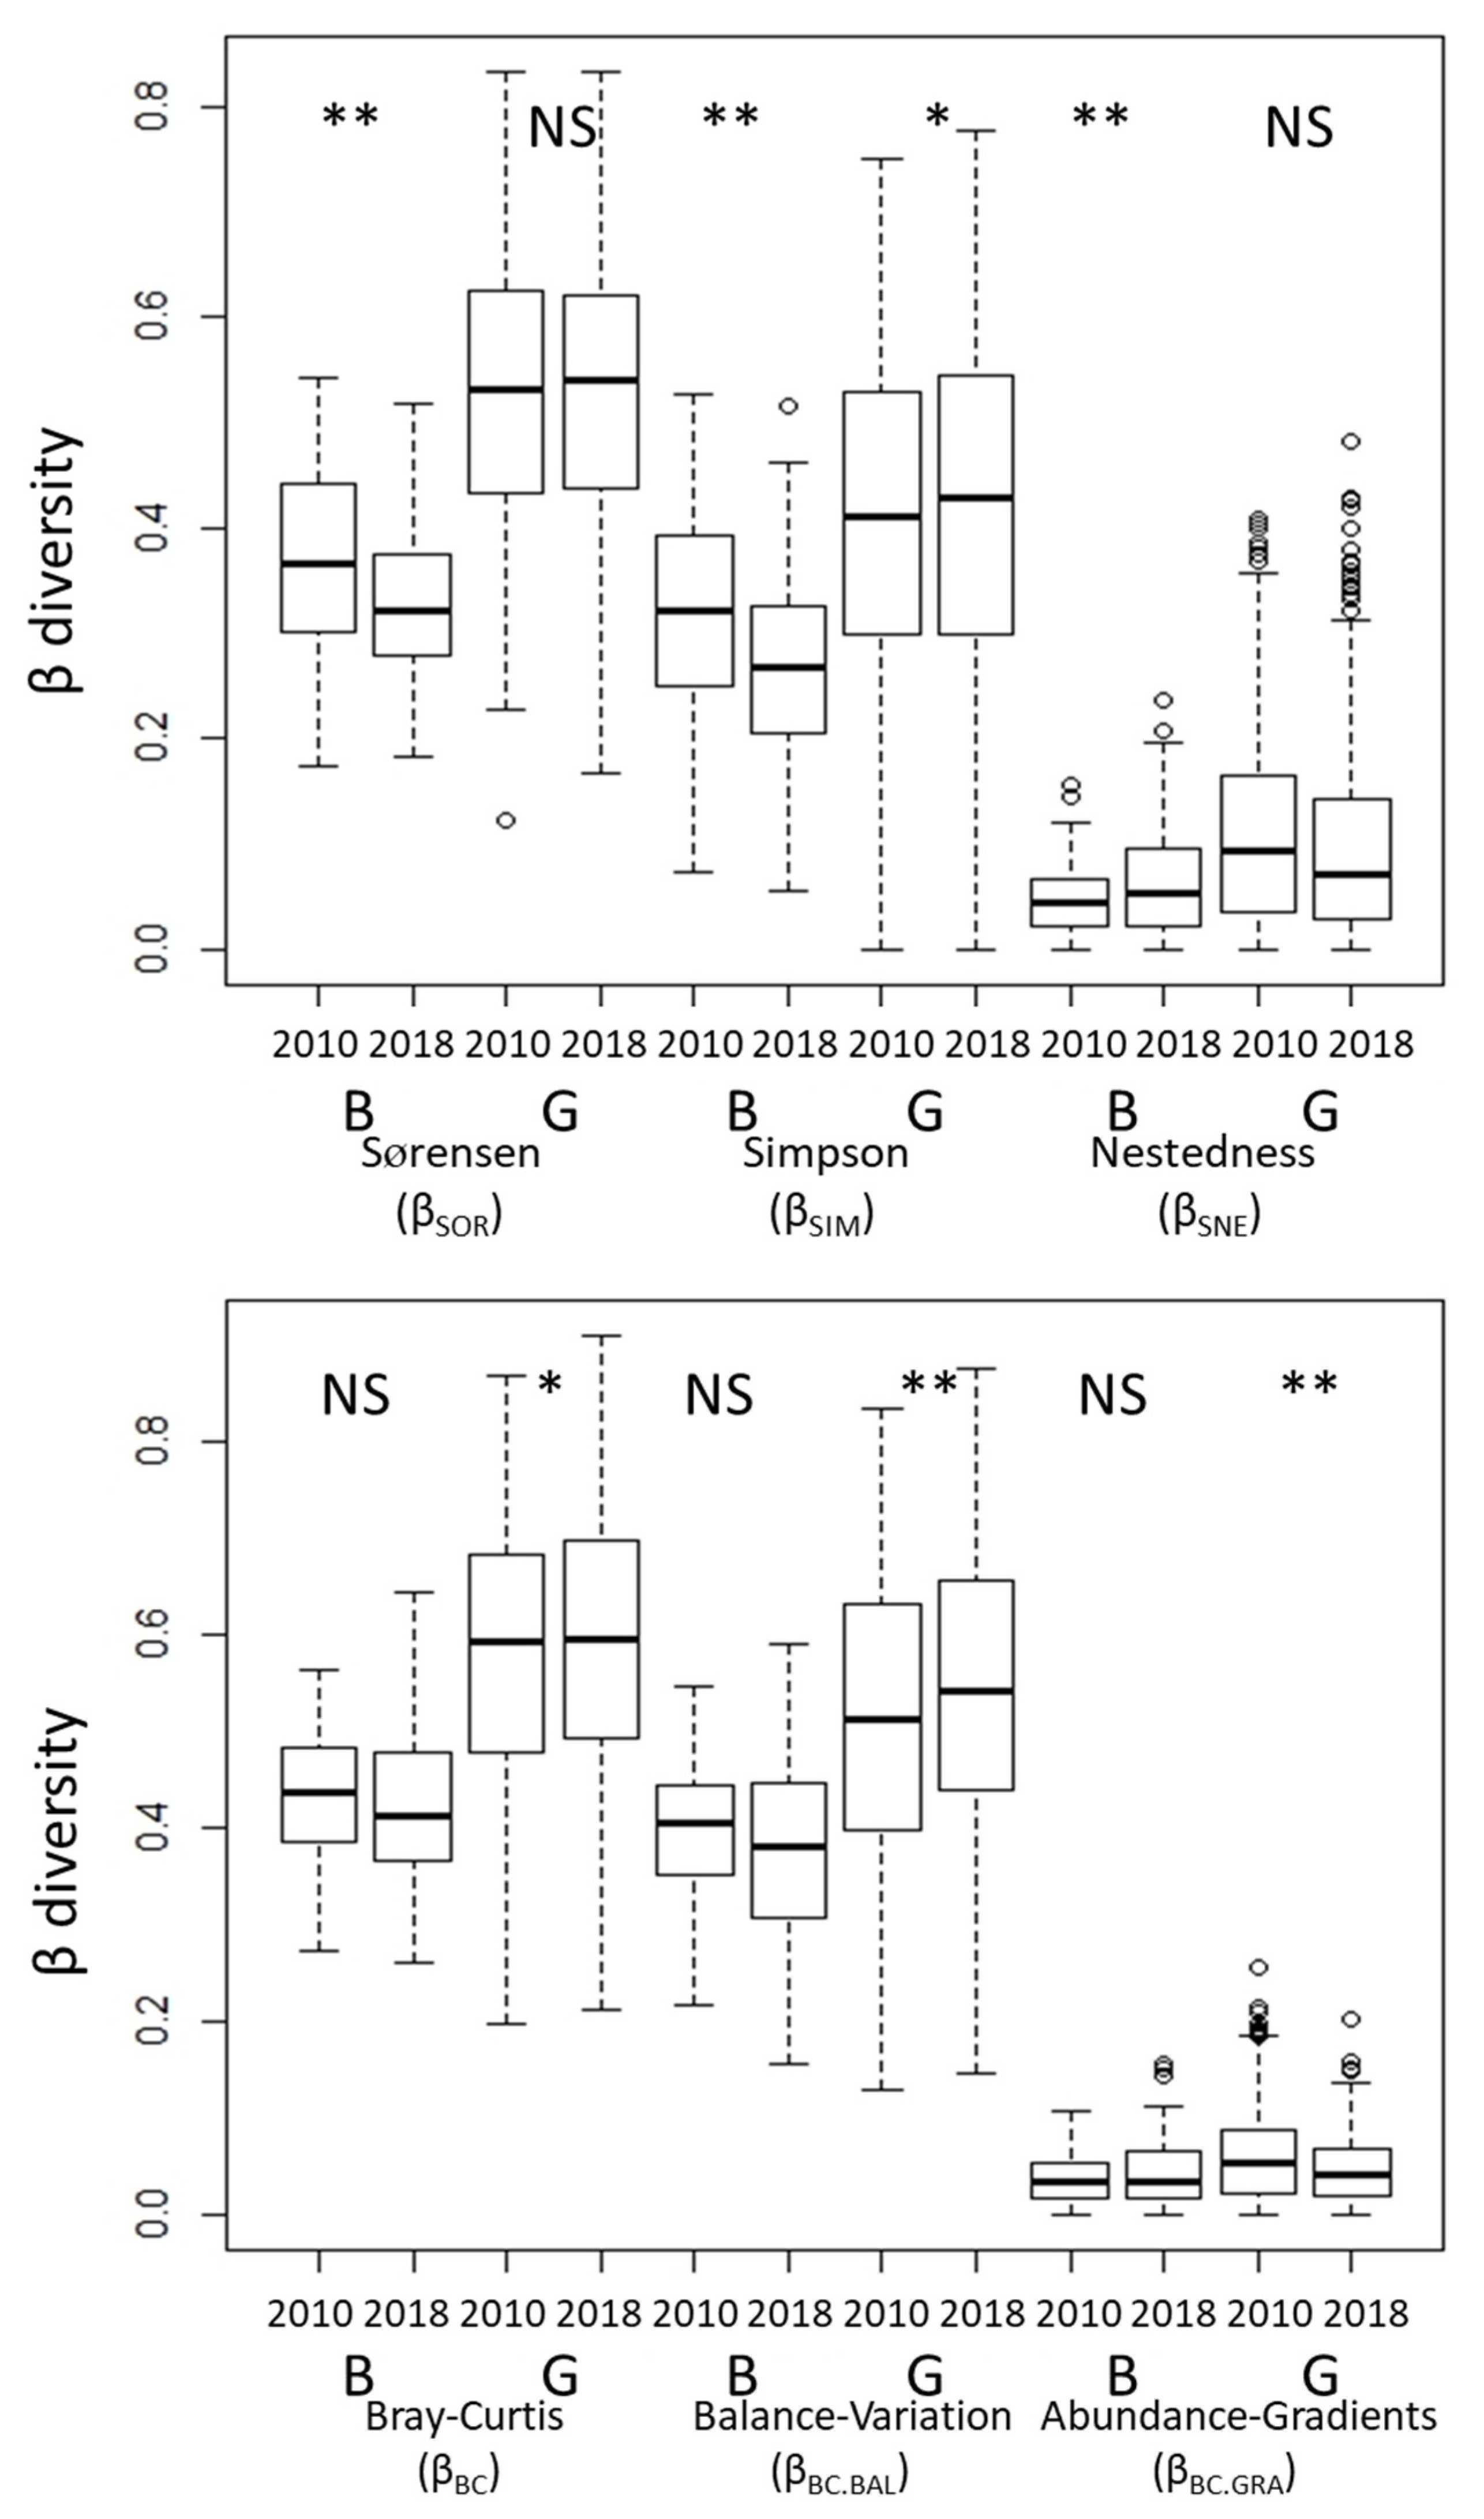
The changes of β-diversity among transects in each vegetation type from 2010 to 2018 differed between metrics of incidence and abundance (Figure 3). Among the incidence metrics, βSOR (Sørensen dissimilarity) and βSIM (Simpson dissimilarity) decreased significantly, and βSNE (nestedness-driven dissimilarity) increased significantly from 2010 to 2018 in the Betula forests. Among the abundance metrics, βBC (Bray–Curtis dissimilarity) and βBC.BAL (substitution) increased significantly, and βBC.GRA (subset) decreased from 2010 to 2018 in the grasslands. The β-diversity among transects did not change significantly between vegetation types based on either incidence or abundance metrics (Figure S2). The metrics associated with species replacement (βSIM for incidence data and βBC.BAL for abundance data) made a greater contribution to total β-diversity than those associated with nestedness (βSNE for incidence data and βBC.GRA for abundance data) (Figure 3 and Figure S2).
There were more low-frequency species in the grasslands than in the Betula forests (Figure S3). Occurrence frequencies in most of the transects declined from 2010 to 2018 (Figure S4). The fact that the correlation coefficient between occurrence frequencies in 2010 and 2018 was significantly positive in the grasslands (p < 0.01) but not in the Betula forests indicated that the occurrence frequencies of species in the Betula forests were similar in both 2010 and 2018.
Species composition differed significantly between vegetation types in both censuses (p < 0.01, Table S1).
3.2. Grazing by Sika Deer
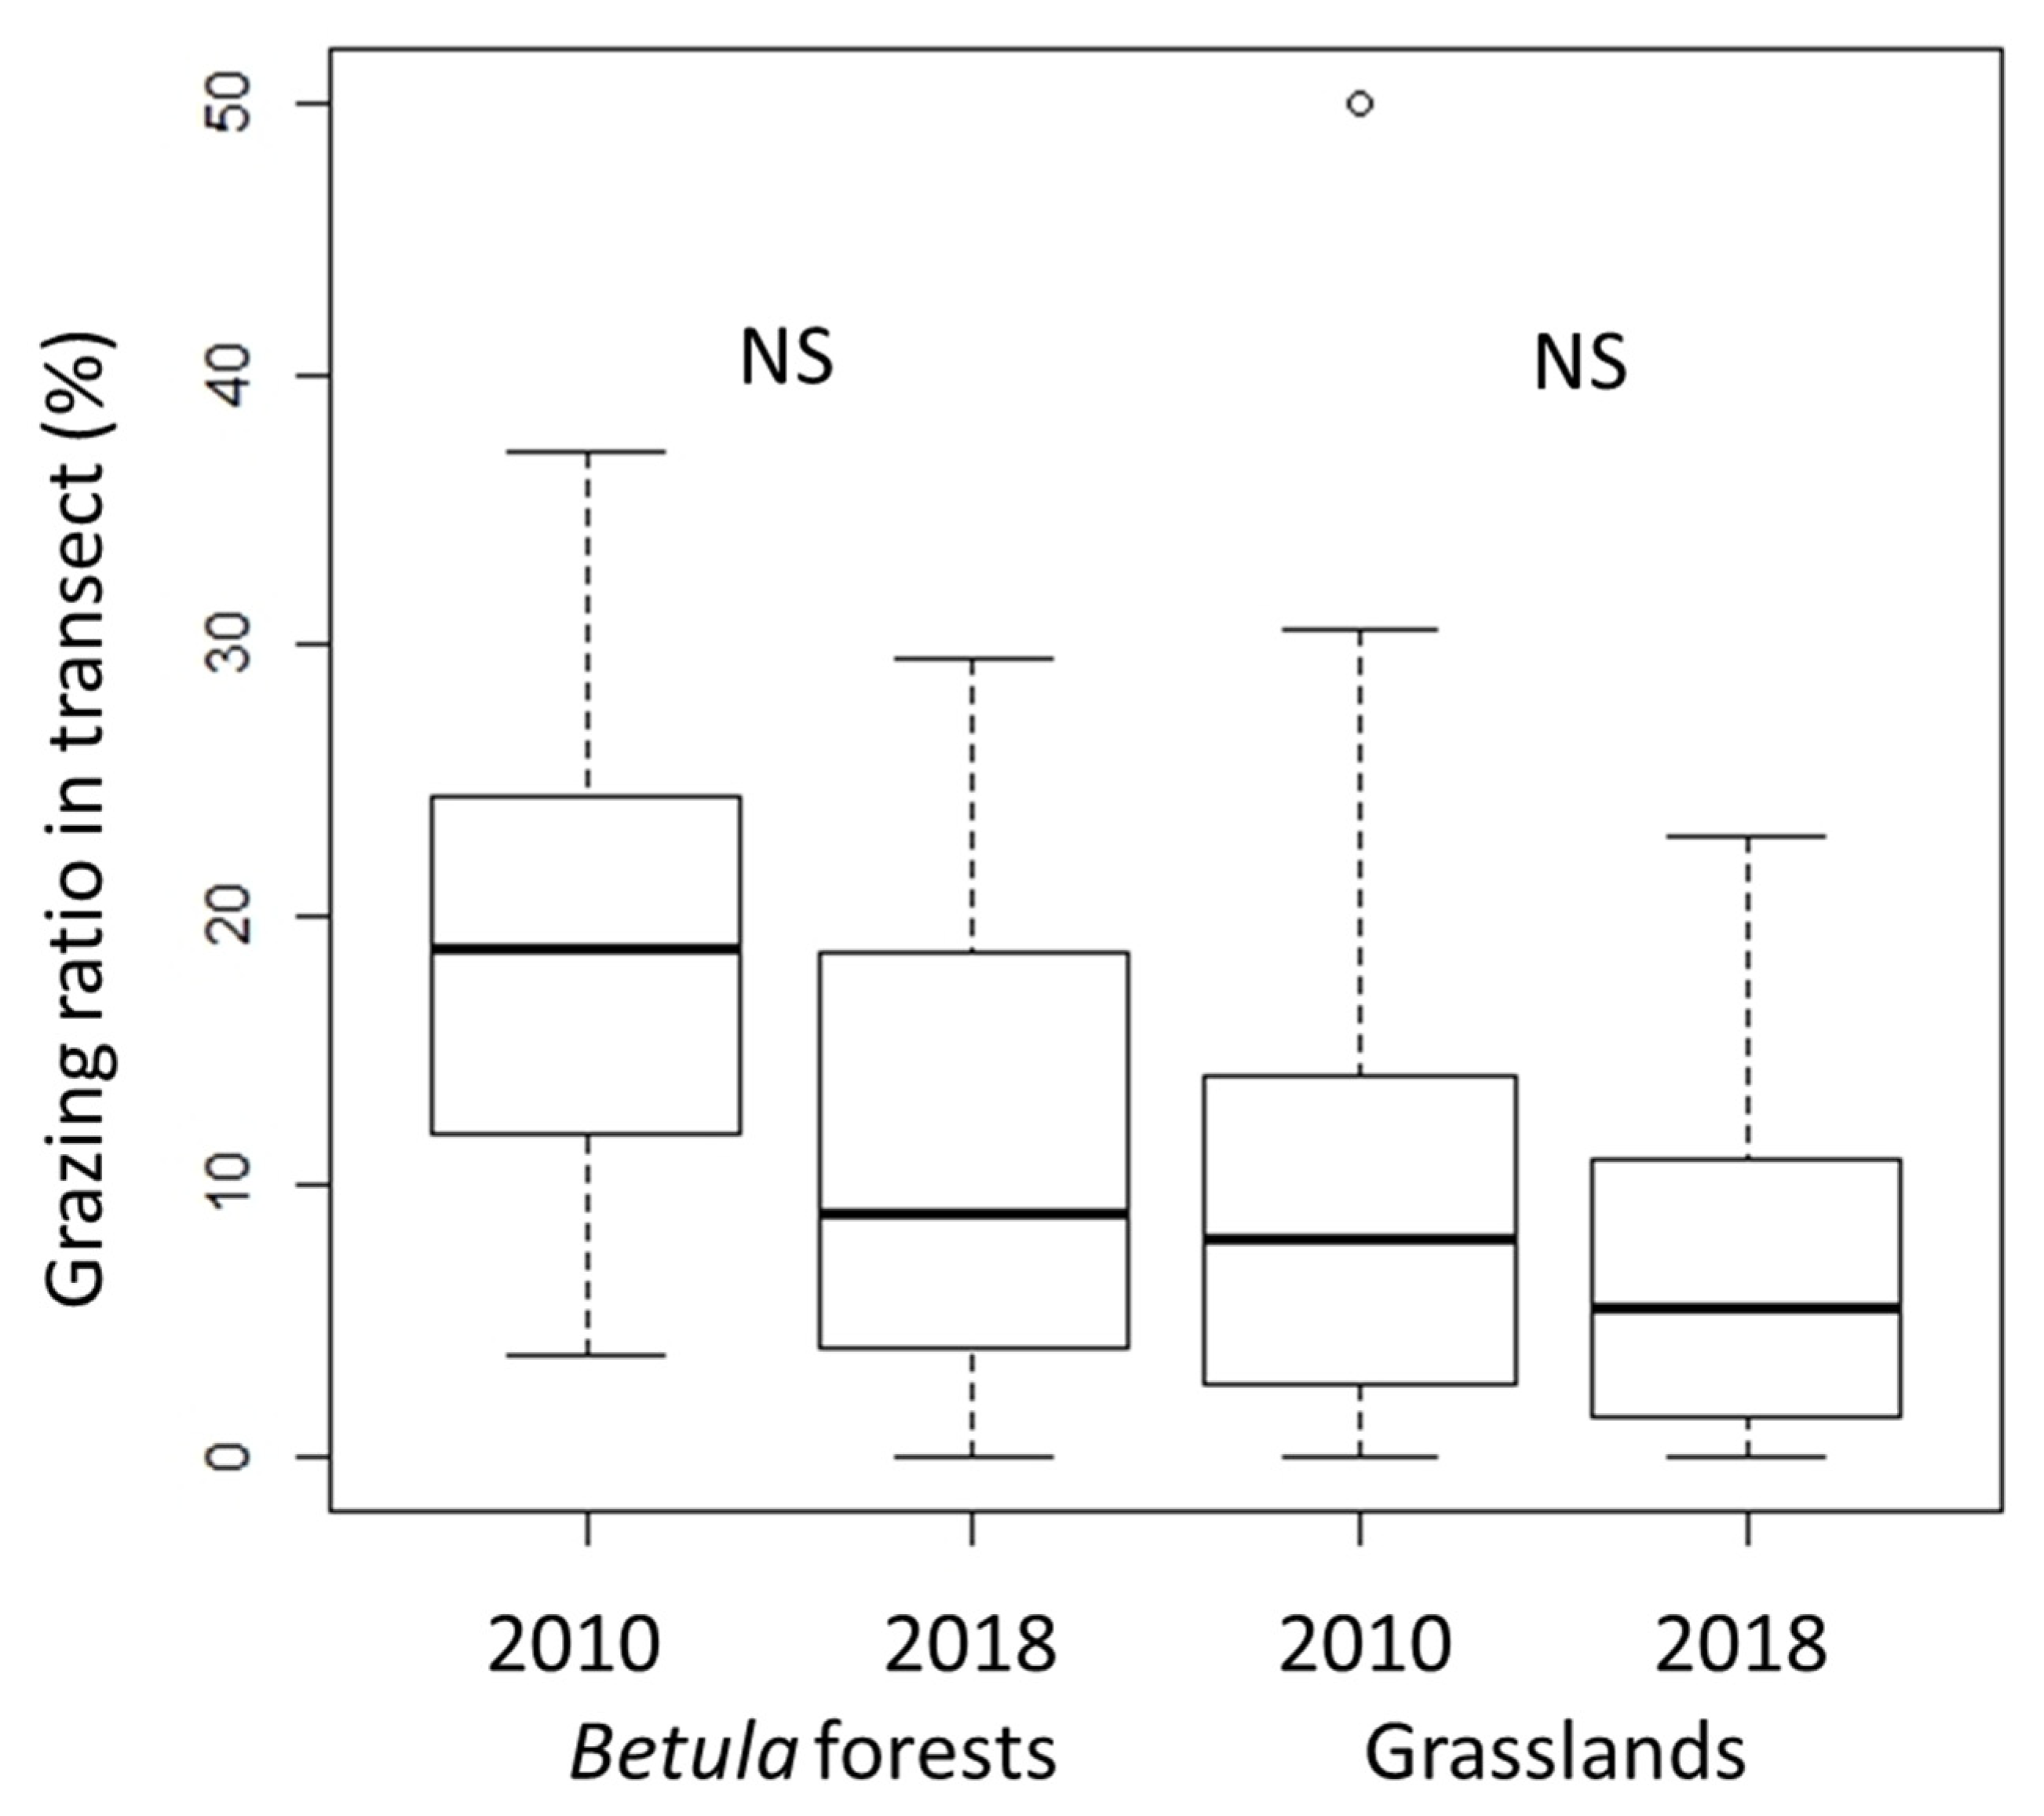
In both types of vegetation, the grazing ratio did not differ significantly between 2010 and 2018 (Figure 4), but the grazing ratio was higher in the Betula forests than in the grasslands (p < 0.01 in both censuses). The grazing pressure was thus maintained throughout the study period, particularly in the Betula forests.
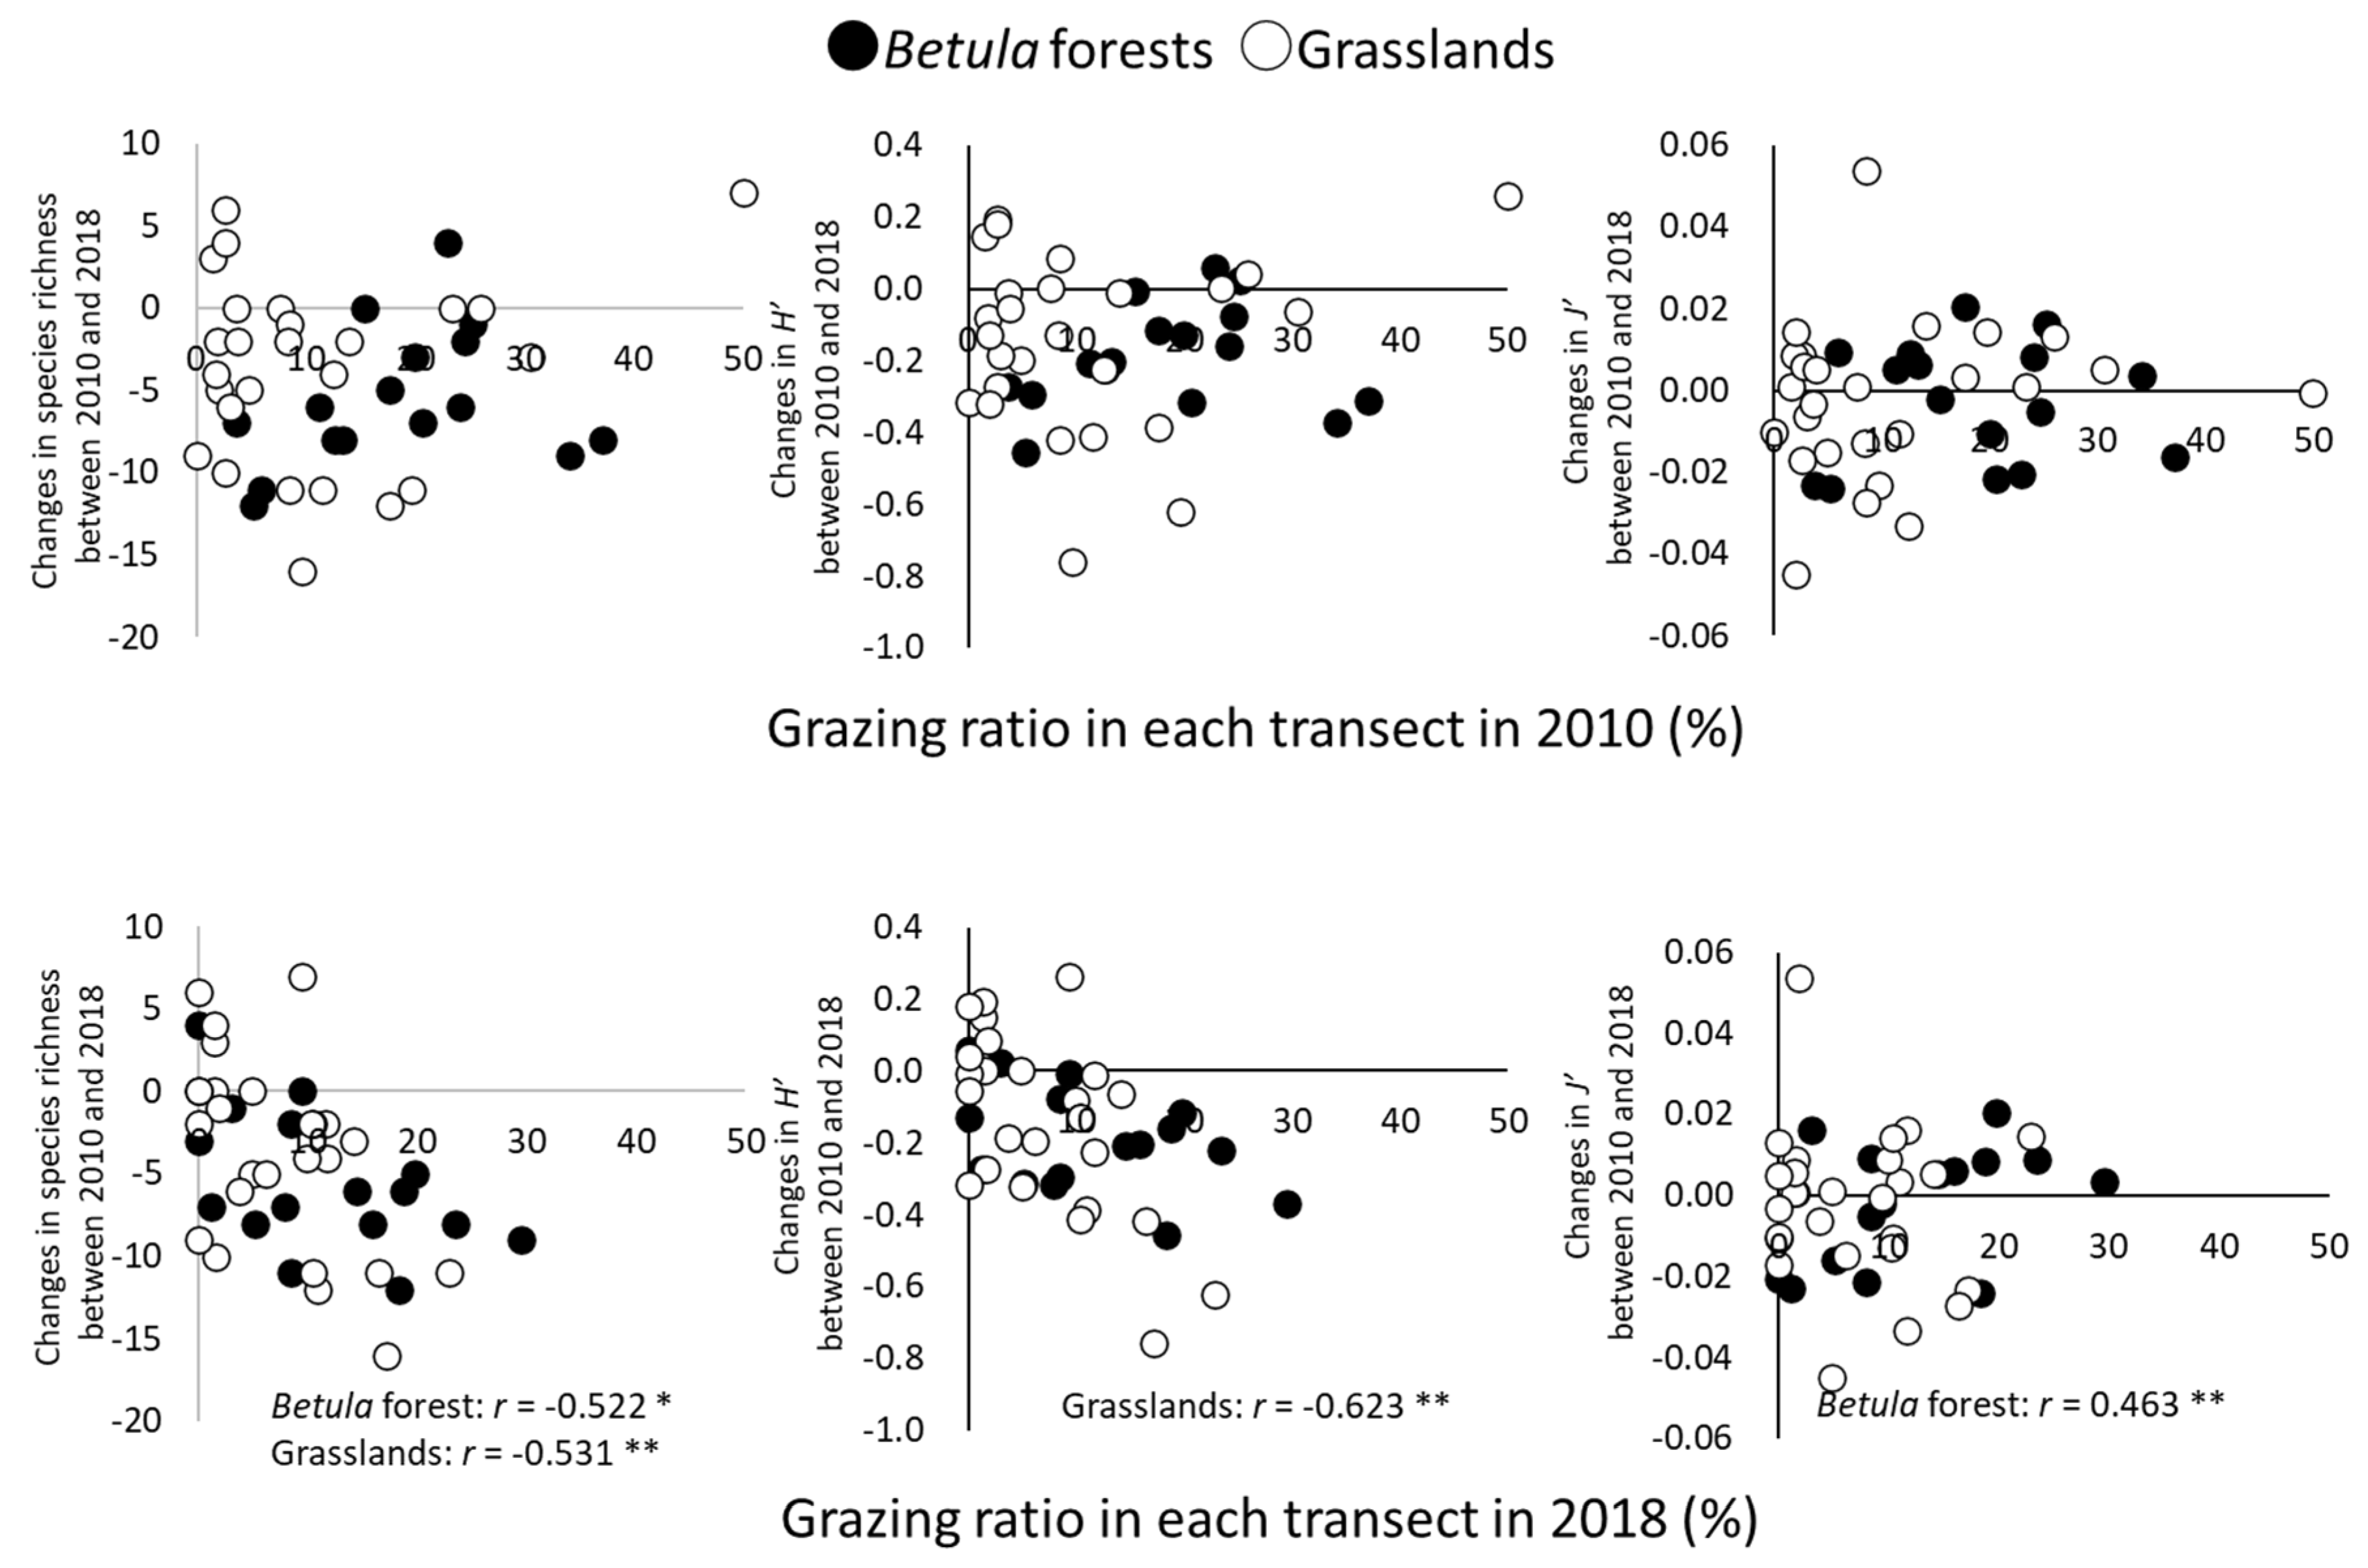
Changes in species richness from 2010 to 2018 were significantly and negatively correlated with the grazing ratio in 2018 for both types of vegetation (p < 0.05 in Betula forests; p < 0.01 in grasslands) (Figure 5). Changes in H′ were significantly and negatively correlated with the grazing ratio in the grasslands (p < 0.01), whereas changes in J′ were significantly and positively correlated with the grazing ratio in the Betula forests (p < 0.01).
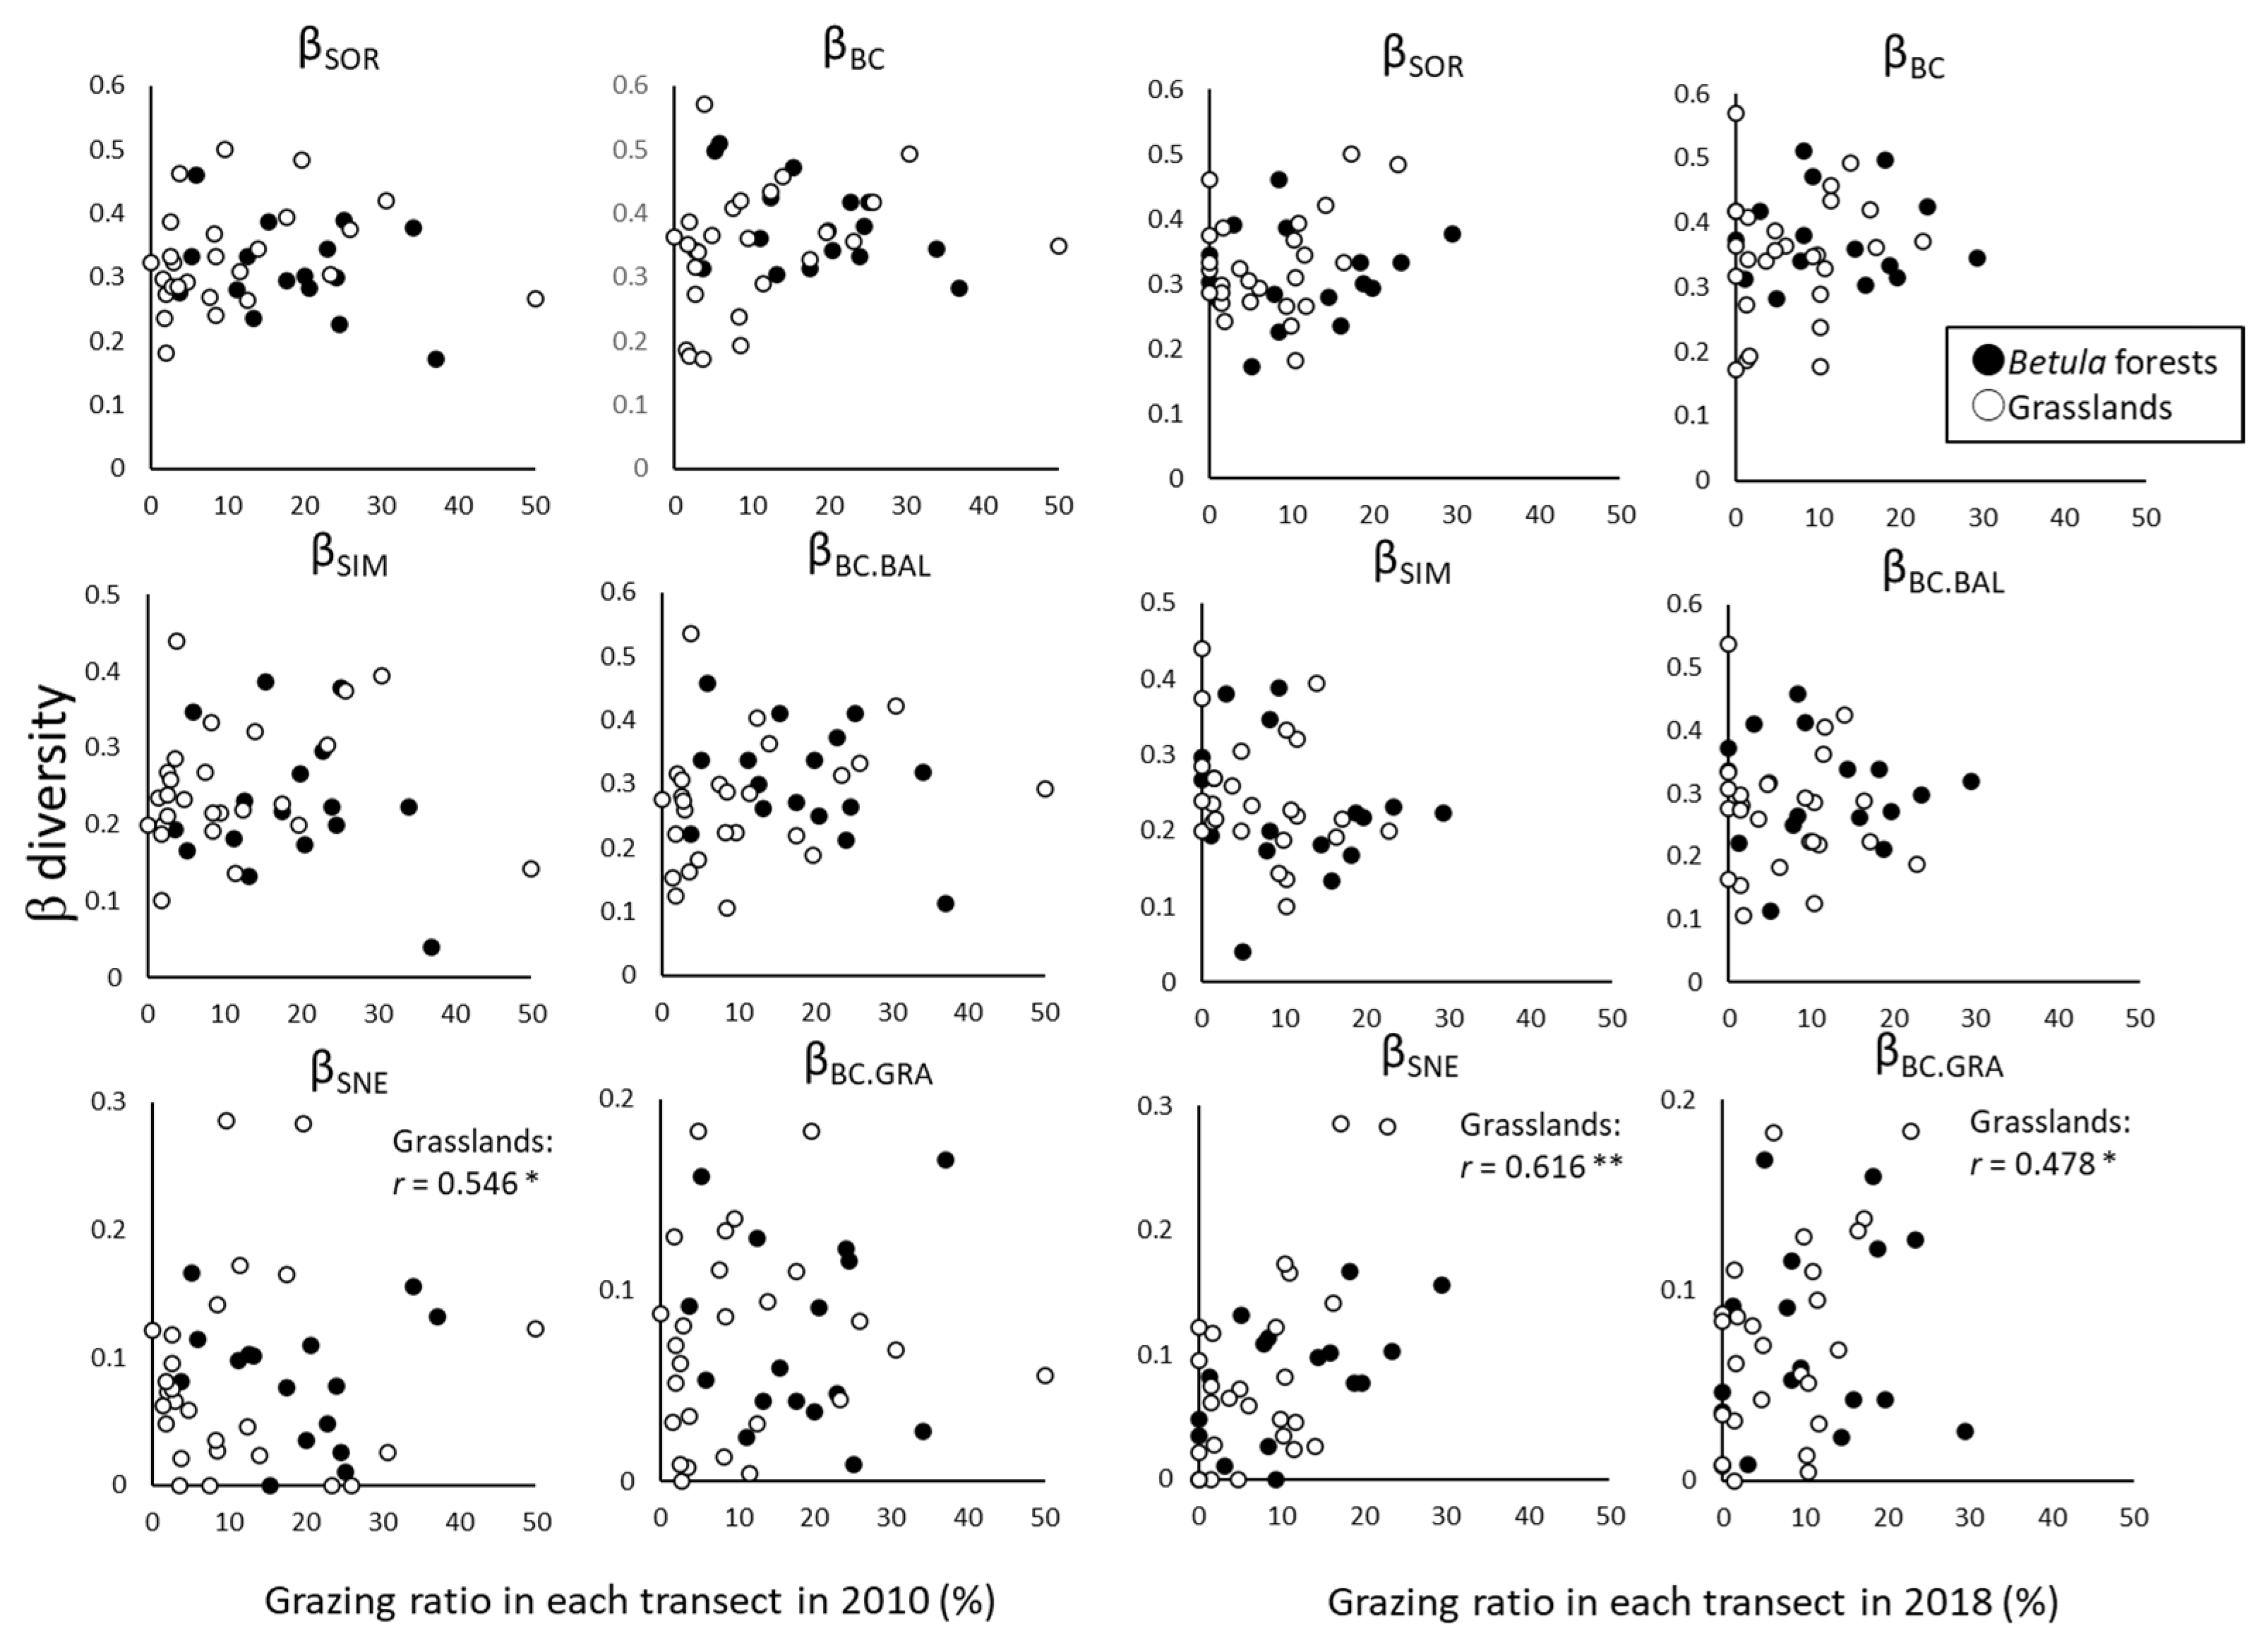
The change of β-diversity between 2010 and 2018 in each transect was significantly and positively correlated with the grazing ratio in only the grasslands (βSNE in 2010 and βSNE and βBC.GRA in 2018), and the β-diversity metrics that changed were related to nestedness (Figure 6).
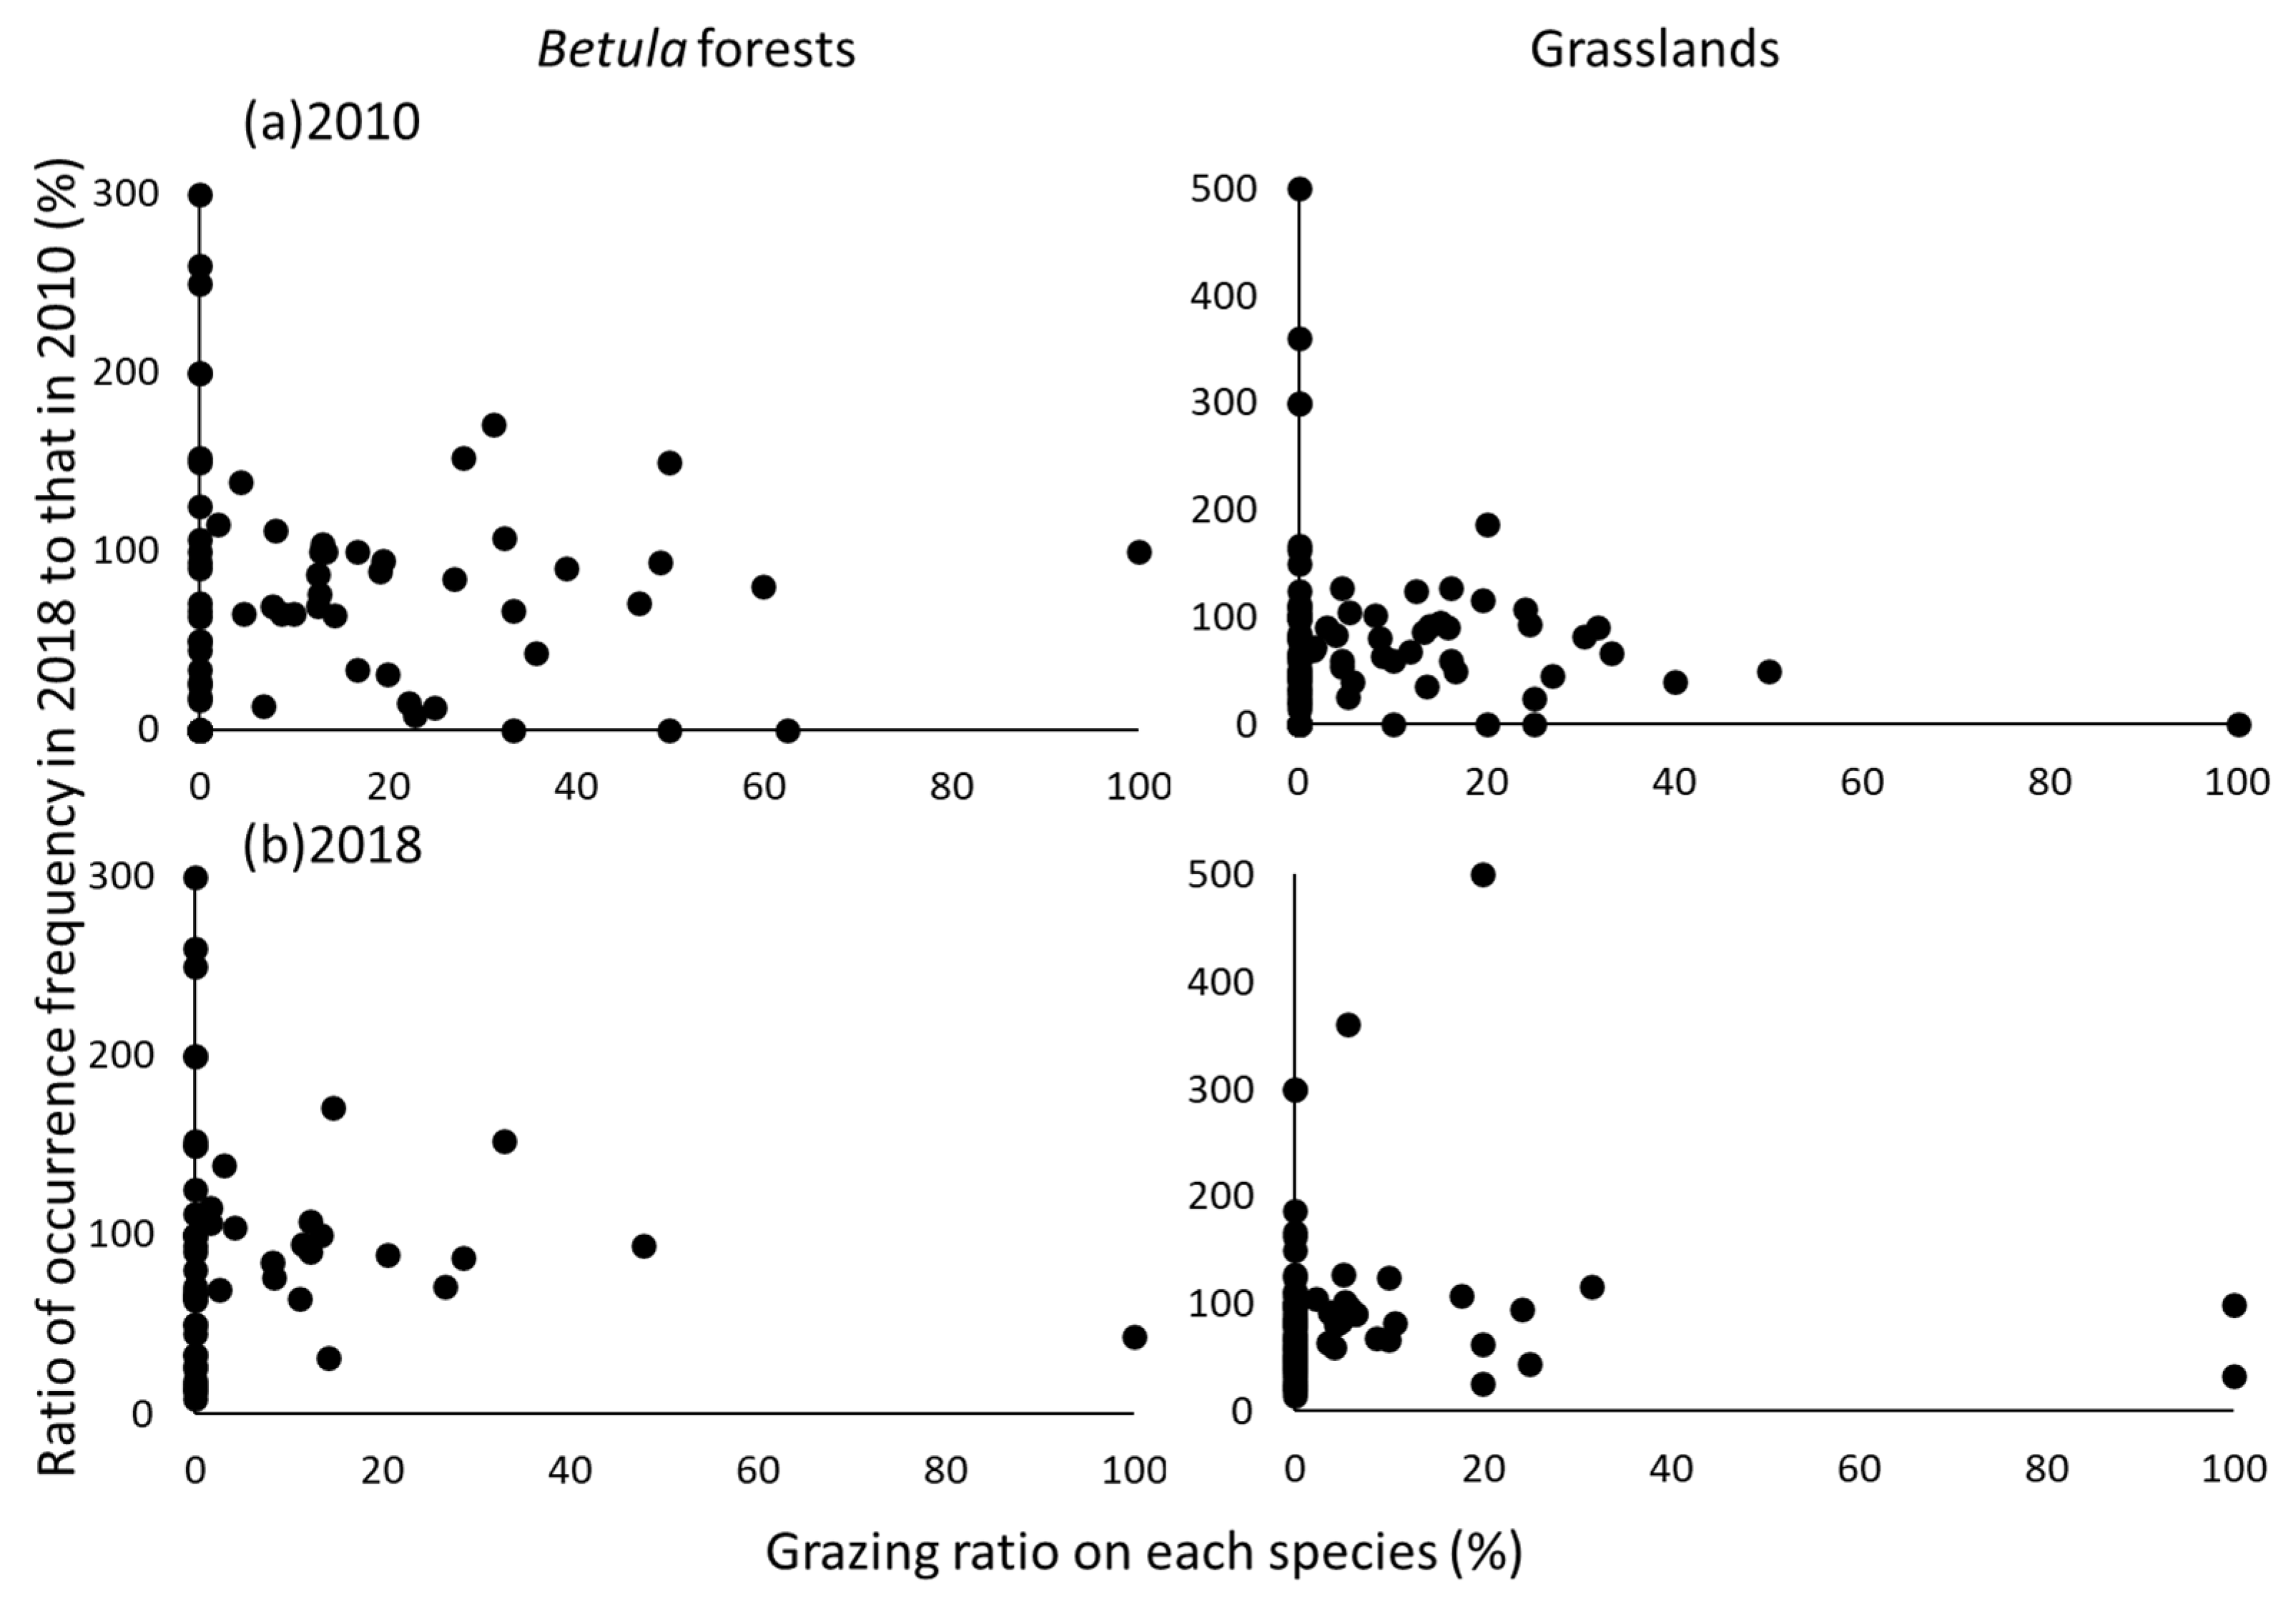
The grazing ratios of individual species were not significantly correlated with the changes of the occurrence frequencies of those species between censuses (Figure 7). The fact that the occurrence frequencies of some species declined with or without grazing indicated that changes of the occurrence frequency were not dependent on the grazing ratio. The ratio of the number of ungrazed species to the total number of species in each vegetation type increased from 50% in 2010 to 66% in 2018 in the Betula forests and from 60% in 2010 to 67% in 2018 in the grasslands. The Indicator Species Analysis revealed that the occurrence frequencies of eight species (Aconitum senanense subsp. Senanense, Astilbe microphylla var. microphylla, Cimicifuga simplex var. simplex, Dryopteris coreanomontana, Luzula oligantha, Pedicularis resupinata subsp. teucriifolia, Sorbus matsumurana, and Thalictrum aquilegiifolium var. intermedium) in the Betula forests and five species (Aconitum senanense subsp. senanense, Athyrium distentifolium, Epilobium amurense. subsp. Cephalostigma, Filipendula camtschatica, and Pedicularis resupinata subsp. teucriifolia) in the grasslands differed significantly between censuses (p < 0.05), and the occurrence frequencies of all of these species were significantly higher in 2010 than in 2018. Most of these species were heavily grazed in 2010, and they consequently declined in abundance or disappeared (Table S2).
4. Discussion
4.1. Changes in α- and β-Diversity
The incidence-based metrics indicated that there had been a floristic homogenization in the Betula forests relative to the grasslands (Figure 3). Previous studies have shown that homogenization of vegetation can be accompanied by either increasing [17,50,51] or decreasing species richness [13,16,52]. Also, a gain of common species and generalists [4,8,50] and loss of rare species and specialists [16,53] can cause floristic homogenization [but see [22]]. Some cases of biotic homogenization have been caused by low species turnover between censuses [5]. In Betula forests, species richness, H′, and βSIM, which reflect species turnover, significantly decreased between 2010 and 2018 (Figure 1, Figure 3 and Figure 4). There were more low-frequency species in the grasslands than in the Betula forests (Figure S3). These decreases might have reflected the fact that constant grazing pressure led to floristic homogenization.
In contrast, floristic differentiation in the grasslands was apparent in the abundance metrics of β-diversity (Figure 3). This pattern has occurred due to a decline of α-diversity and changes of occurrence frequency and species replacement. Temporal floristic differentiation (i.e., increasing β-diversity between censuses) could result from colonization by new species as well as changes of occurrence frequency [5,22]. These results could reflect the fact that less frequent species, the numbers of which were variable and fluctuated between censuses, were abundant (e.g., Agrostis flaccida, Helonias orientalis) in the grasslands (Figure S3).
4.2. Effects of Grazing on α- and β-Diversity
Floristic differentiation by grazing was appeared in the grasslands and not in the Betula forests (Figure 6). The effects of grazing on α-diversity were apparent in 2018 but not in 2010 (Figure 5). This difference was caused by the constant grazing pressure on the vegetation (Figure 4) and the stability of the sika deer population in the study site revealed by photographs taken with camera traps (T. Nagaike and H. Iijima, unpublished data). The effects on α-diversity resulted from changes in the abundance of species the sika deer preferred to graze heavily (e.g., Angelica pubescens var. matsumurae, Cirsium senjoense, Rumex alpestris subsp. lapponicus) (Table S2). However, the occurrence frequency of species that went ungrazed—which I surmised were unpalatable or less preferred (e.g., Maianthemum dilatatum)—increased in 2018 (Figure 7). Constant grazing intensity would result in a loss of species preferred by the deer [21]. In contrast, some studies have shown that grazing can increase species richness [5]. These differences reflect the variability of responses and the duration of grazing. Grazing creates and maintains high species richness in woody pastures and grasslands that have been under traditional land use for a long time [5,6]. Sika deer were not present at my study sites until 20 years ago, but their numbers subsequently increased [32]. Therefore, species that had poor tolerance to grazing have disappeared from these sites, and their disappearance could have caused the declines in species richness and H′ (Figure 1). In fact, the species richness was significantly lower on transects where higher grazing impact was observed (Figure 5). The responses of species to grazing were quite variable (Figure 7). The occurrence frequency of some species was enhanced, even at sites that were heavily grazed, whereas the occurrence frequency of others declined at those sites. For example, the occurrence frequency of Thelypteris quelpaertensis increased in the Betula forests, regardless of higher deer grazing impact (Figure 7; Table S2).
The variety of vegetation types studied here was the result of differences in natural conditions. For example, delayed melting of snow beds occurred on the grasslands but not in the Betula forests. Two types of vegetation adapted to different conditions (i.e., different deterministic processes) may respond differently to grazing. Baeten et al. [54] have shown that the response to deer grazing of forest understory vegetation over a 30-year period was a marked decrease of local species richness and a shift of the variation in species composition from site to site towards a structure with reduced true species turnover and increased dissimilarity due to nestedness. The results were similar in the Betula forests: a decrease in species richness and diversity and a strengthening of homogenization. In contrast, the grasslands did not develop strong floristic homogenization but instead transitioned toward floristic heterogeneity. The likely reasons for these differences in vegetational change can be summarized as follows. First, unpalatable species or species less preferred for grazing in 2010 might have already been abundant in the grasslands (e.g., Fallopia japonica, Calamagrostis purpurea), whereas preferred species have remained in the Betula forests. In fact, during 2010, the grazing ratio was lower in the grasslands than in the Betula forests [32]. The Betula forests thus developed few new species and instead became less species rich. Since the duration of grazing was not long (<20 years), the type of habitat in which species preferred for grazing by deer remained (i.e., the Betula forests) would have been intensively grazed during the study period and would consequently have lost species. The vegetation in the grasslands have been changed with release from nestedness (Figure 3). Therefore, the plant community in the grasslands at my study site already have changed from sensitive to relatively insensitive species (i.e., through the spread of unpalatable or less preferred species), and thereby have reached a recalcitrant state [55].
The second possible reason for the differences in change between the two vegetation types is that differences in the original vegetation due to environmental filtering (e.g., by natural selection associated with different conditions) could have resulted in different responses. The processes of vegetation change by grazing have also been explained in terms of both deterministic [25] and stochastic [26,27] processes. Large mammalian herbivores act as strong deterministic forces during community assembly and can homogenize plant communities [25]. My study showed that environmental filtering, including filtering by natural selection associated with environmental conditions, governs the initial differences in species composition between types of vegetation (Figure S2). It also showed that the preference of grazers for species is selective (ref. [56], Figure 7). Changes in community assembly processes over time may reflect grazing intensity and species attributes [26]. Ross et al. [13] have shown that previously distinct vegetation types become more similar in composition when they are overgrazed. However, in the two vegetation types I studied here, the species composition remained different (Table S1), and the difference between vegetation types due to deterministic processes has continued to be influenced by grazing.
The responses of vegetation to grazing differed between the two types of vegetation in this study. Pre-deer-grazing differences in species composition likely caused the differences in these responses. The condition of the vegetation when grazing starts can affect the results of homogenization [1,54,57]. To reduce grazing impacts and restore vegetation, it is necessary to consider the characteristics of each type of vegetation, since grazing impacts vary with the abundance of palatable species and the resistance and resilience of vegetation. The factors causing floristic homogenization or differentiation in response to deer grazing are not simple, and further studies that consider spatiotemporal scales are needed.
Supplementary Materials
The following supporting information can be downloaded at: https://www.mdpi.com/article/10.3390/d15020192/s1, Figure S1: Study design; Figure S2: Comparison of β-diversity indices between 2010 and 2018 in each vegetation type. The exact Wilcoxon signed-rank test was used to compare types of vegetation. None of the combinations was significantly different. B: Betula forests, G: Grasslands; Figure S3: Changes in the patterns of species occurrence in each vegetation type. The percentages of the number of transects in which each species occurred to total number of transects for each vegetation type are shown for each of the percentages listed in the key; Figure S4: Relationship between occurrence frequency in each plot in 2010 and 2018. Straight transect is 1:1 relationship; Table S1: Results of multi-response permutation procedure; Table S2: Species list.
Funding
This work was supported by Japan Society for the Promotion of Science Grants-in-Aid for Scientific Research (KAKENHI) grants 16K07801, 20K06136 and 21H02247.
Institutional Review Board Statement
Not applicable.
Informed Consent Statement
Not applicable.
Data Availability Statement
Data used in this study was available from Table S2.
Conflicts of Interest
The author declares no conflict of interest.
References
- Speed, J.D.M.; Austrheim, G.; Mysterud, A. The response of plant diversity to grazing varies along an elevational gradient. J. Ecol. 2013, 101, 1225–1236. [Google Scholar] [CrossRef]
- Li, C.; Hao, X.; Zhao, M.; Han, G.; Willms, W.D. Influence of historic sheep grazing on vegetation and soil properties of a desert steppe in inner Mongolia. Agric. Ecosyst. Environ. 2008, 128, 109–116. [Google Scholar] [CrossRef]
- Sasaki, T.; Okayasu, T.; Jamsran, U.; Takeuchi, K. Threshold changes in vegetation along a grazing gradient in Mongolian rangelands. J. Ecol. 2008, 96, 145–154. [Google Scholar] [CrossRef]
- Holmes, S.A.; Webster, C.R. Herbivore-induced expansion of generalist species as a driver of homogenization in post-disturbance plant communities. Plant Ecol. 2011, 212, 753–768. [Google Scholar] [CrossRef]
- Oldén, A.; Halme, P. Grazers increase β-diversity of vascular plants and bryophytes in wood pastures. J. Veg. Sci. 2016, 27, 1084–1093. [Google Scholar] [CrossRef]
- Perotti, E.; Probo, M.; Pittarello, M.; Lonati, M.; Lombardi, G. A 5-year rotational grazing changes the botanical composition of sub-alpine and alpine grasslands. App. Veg. Sci. 2018, 21, 647–657. [Google Scholar] [CrossRef]
- Suding, K.N.; Hobbs, R.J. Threshold models in restoration and conservation: A developing framework. Trends Ecol. Evol. 2009, 24, 271–279. [Google Scholar] [CrossRef]
- Rooney, T.P. High white-tailed deer densities benefit graminoids and contribute to biotic homogenization of forest ground-layer vegetation. Plant Ecol. 2009, 202, 103–111. [Google Scholar] [CrossRef]
- Speed, J.D.M.; Cooper, E.J.; Jónsdóttir, I.S.; Van Der Wal, R.; Woodin, S.J. Plant community properties predict vegetation resilience to herbivore disturbance in the Arctic. J. Ecol. 2010, 98, 1002–1013. [Google Scholar] [CrossRef]
- Nagaike, T.; Ohkubo, E.; Hirose, K. Vegetation recovery in response to the exclusion of grazing by sika deer (Cervus nippon) in seminatural grassland on Mt. Kushigata, Japan. ISRN Biodivers. 2014, 2014, 493495. [Google Scholar] [CrossRef] [Green Version]
- Pendergast, T.H.; Hanlon, S.M.; Long, Z.M.; Royo, A.A.; Carson, W.P. The legacy of deer overabundance: Long-term delays in herbaceous understory recovery. Can. J. For. Res. 2016, 46, 362–369. [Google Scholar] [CrossRef] [Green Version]
- Olden, J.D.; Rooney, T.P. On defining and quantifying biotic homogenization. Glob. Ecol. Biogeogr. 2006, 15, 113–120. [Google Scholar] [CrossRef]
- Ross, L.C.; Woodin, S.J.; Hester, A.J.; Thompson, D.B.A.; Birks, J.B. Biotic homogenization of upland vegetation: Patterns and drivers at multiple spatial scales over five decades. J. Veg. Sci. 2012, 23, 755–770. [Google Scholar] [CrossRef]
- Ohashi, H.; Hoshino, Y. Disturbance by large herbivores alters the relative importance of the ecological processes that influence the assembly pattern in heterogeneous meta-community. Ecol. Evol. 2014, 4, 766–775. [Google Scholar] [CrossRef]
- Nascimbene, J.; Benesperi, R.; Brunialti, G.; Catalano, I.; Vedove, M.D.; Grillo, M.; Isocrono, D.; Matteucci, E.; Potenza, G.; Puntillo, D.; et al. Patterns and derivers of ꞵ-diversity and similarity of Lobaria pulmonaria communities in Italian forests. J. Ecol. 2013, 101, 493–505. [Google Scholar] [CrossRef] [Green Version]
- Prach, J.; Kopecký, M. Landscape-scale vegetation homogenization in central European sub-montane forests over the past 50 years. App. Veg. Sci. 2018, 21, 373–384. [Google Scholar] [CrossRef]
- Johnson, S.E.; Mudrak, E.L.; Waller, D.M. Local increases in diversity accompany community homogenization in floodplain forest understories. J. Veg. Sci. 2014, 25, 885–896. [Google Scholar] [CrossRef]
- Trentanovi, G.; Von der Lippe, M.; Sitzia, T.; Ziechmann, U.; Kowarik, I.; Cierjacks, A. Biotic homogenization at the community scale: Disentangling the roles of urbanization and plant invasion. Div. Dis. 2013, 19, 738–748. [Google Scholar] [CrossRef] [Green Version]
- Lososová, Z.; Chytrý, M.; Danihelka, J.; Tichý, L.; Ricotta, C. Biotic homogenization of urban floras by alien species: The role of species turnover and richness differences. J. Veg. Sci. 2016, 27, 452–459. [Google Scholar] [CrossRef]
- McCune, J.L.; Vellend, M. Gains in native species promote biotic homogenization over four decades in a human-dominated landscape. J. Ecol. 2013, 101, 1542–1551. [Google Scholar] [CrossRef]
- Peper, J.; Jansen, F.; Pietzsch, D.; Manthey, M. Patterns of plant species turnover along grazing gradients. J. Veg. Sci. 2011, 22, 457–466. [Google Scholar] [CrossRef]
- Naaf, T.; Wulf, M. Habitat specialists and generalists drive homogenization and differentiation of temperate forest plant communities at the regional scale. Biol. Conserv. 2010, 143, 848–855. [Google Scholar] [CrossRef]
- Bernhardt-Römermann, M.; Baeten, L.; Craven, D.; De Frenne, P.; Hédl, R.; Lenoir, J.; Bert, D.; Brunet, J.; Chudomelová, M.; Decocq, G.; et al. Drivers of temporal changes in temperate forest plant diversity vary across spatial scales. Glob. Chang. Biol. 2015, 21, 3726–3737. [Google Scholar] [CrossRef] [PubMed]
- Chase, J.M.; Myers, J.A. Disentangling the importance of ecological niches from stochastic processes across scales. Phil. Trans. Royal Soc. B 2011, 366, 2351–2363. [Google Scholar] [CrossRef] [Green Version]
- Alberti, J.; Bakker, E.S.; Van Klink, R.; Olff, H.; Smit, C. Herbivore exclusion promotes a more stochastic plant community assembly in a natural grassland. Ecology 2017, 98, 961–970. [Google Scholar] [CrossRef] [Green Version]
- Måren, I.E.; Kapfer, J.; Aarrestad, P.A.; Grytnes, J.A.; Vandvik, V. Changing contributions of stochastic and deterministic processes in community assembly over a successional gradient. Ecology 2018, 99, 148–157. [Google Scholar] [CrossRef] [Green Version]
- Nishizawa, K.; Tatsumi, S.; Kitagawa, R.; Mori, A.S. Deer herbivory affects the functional diversity of forest floor plants via changes in competition-mediated assembly rules. Ecol. Res. 2016, 31, 569–578. [Google Scholar] [CrossRef] [Green Version]
- Takatsuki, S. Effects of sika deer on vegetation in Japan: A review. Biol. Conserv. 2009, 142, 1922–1929. [Google Scholar] [CrossRef]
- Iijima, H.; Nagaike, T.; Honda, T. Estimation of deer population dynamics using a Bayesian state–space model with multiple abundance indices. J. Wildl. Manag. 2013, 77, 1038–1047. [Google Scholar] [CrossRef]
- Nagaike, T.; Hayashi, A. Bark-stripping by sika deer (Cervus nippon) in Larix kaempferi plantations in central Japan. For. Ecol. Manag. 2003, 175, 563–572. [Google Scholar] [CrossRef]
- Nagaike, T. Effects of heavy, repeated bark stripping by Cervus nippon on survival of Abies veitchii in a subalpine coniferous forest in central Japan. J. For. Res. 2020, 39, 1139–1145. [Google Scholar] [CrossRef]
- Nagaike, T. Effects of browsing by sika deer (Cervus nippon) on subalpine vegetation at Mt. Kita, central Japan. Ecol. Res. 2012, 27, 467–473. [Google Scholar] [CrossRef]
- Kamei, T.; Takeda, K.; Izumiyama, S.; Ohshima, K. The effect of hunting on the behavior and habitat utilization of sika deer (Cervus nippon). Mammal Study 2010, 35, 235–241. [Google Scholar] [CrossRef]
- Takii, A.; Izumiyama, S.; Taguchi, M. Partial migration and effects of climate on migratory movements of sika deer in Kirigamine Highland, central Japan. Mammal Study 2012, 37, 331–340. [Google Scholar] [CrossRef] [Green Version]
- Otsu, C.; Iijima, H.; Nagaike, T.; Hoshino, Y. Evidence of extinction debt through the survival and colonization of each species in semi-natural grasslands. J. Veg. Sci. 2017, 28, 464–474. [Google Scholar] [CrossRef]
- Koyama, A.; Uchida, K.; Ozeki, M.; Iwasaki, T.; Nakahama, N.; Suka, T. Conservation of endanger and rare plants requires strategies additional to deer-proof fencing for conservation of sub-alpine plant diversity. Appl. Veg. Sci. 2021, 24, e12553. [Google Scholar] [CrossRef]
- Ishida, Y.; Takyu, M.; Nakamura, Y. Species composition and distribution pattern of Betula ermanii forests on Mt. Kitadake, Japanese Southern Alps. Veg. Sci. 2014, 31, 129–142, (In Japanese with English Summary). [Google Scholar]
- Mizuno, K. Habitat types of Ohanabatake vegetation in the Akaishi mountains, central Japan. Geogr. Rev. Jpn. 1984, 6, 384–402, (In Japanese with English Summary). [Google Scholar] [CrossRef]
- Magurran, A.E. Measuring Biological Diversity; Blackwell: Oxford, UK, 2004. [Google Scholar]
- Baselga, A. Separating the two components of abundance-based dissimilarity: Balanced changes in abundance vs. abundance gradients. Methods Ecol. Evol. 2013, 4, 552–557. [Google Scholar] [CrossRef]
- Baselga, A. Partitioning abundance-based multiple-site dissimilarity into components: Balanced variation in abundance and abundance gradients. Methods Ecol. Evol. 2017, 8, 799–808. [Google Scholar] [CrossRef] [Green Version]
- Roberts, M.R. Effects of forest plantation management on herbaceous-layer composition and diversity. Can. J. Bot. 2002, 80, 378–389. [Google Scholar] [CrossRef]
- Peterson, E.B.; McCune, B. Diversity and succession of epiphytic macrolichen communities in low-elevation managed conifer forests in Western Oregon. J. Veg. Sci. 2001, 12, 511–524. [Google Scholar] [CrossRef]
- De Cáceres, M.; Jansen, F.; Dell, N. Indicator Species Analysis. 2020. Available online: https://cran.r-project.org/web/packages/indicspecies/vignettes/indicspeciesTutorial.pdf (accessed on 4 February 2021).
- R Core Team. R: A Language and Environment for Statistical Computing; R Foundation for Statistical Computing: Vienna, Austria, 2018; Available online: https://www.R-project.org/ (accessed on 1 December 2020).
- Oksanen, J.; Simpson, G.L.; Blanchet, F.G.; Kindt, R.; Legendre, P.; Minchin, P.R.; O’Hara, R.B.; Aolymos, P.; Stevens, M.H.H.; Szoecs, E.; et al. Vegan: Community Ecology Package. Version 2.6-4. Available online: https://cran.r-project.org/web/packages/vegan/vegan.pdf (accessed on 1 December 2022).
- Hothorn, T. Exactranktests: Exact Distributions for Rank and Permutation Tests. 2019. Available online: https://cran.r-project.org/web/packages/exactRankTests/exactRankTests.html (accessed on 1 June 2020).
- Baselga, A.; Orme, C.D.L. betapart: An R package for the study of beta diversity. Methods Ecol. Evol. 2012, 3, 808–812. [Google Scholar] [CrossRef]
- Yonekura, K.; Kajita, T. BG Plants: Japanese and Scientific Name Index (YList). 2003. Available online: http://ylist.info/ (accessed on 1 December 2018).
- Bühler, C.; Roth, T. Spread of common species results in local-scale floristic homogenization in grassland of Switzerland. Div. Dis. 2011, 17, 1089–1098. [Google Scholar] [CrossRef]
- Reinecke, J.; Klemm, G.; Heinken, T. Vegetation change and homogenization of species composition in temperate nutrient deficient Scots pine forests after 45 years. J. Veg. Sci. 2014, 25, 113–121. [Google Scholar] [CrossRef]
- Amici, V.; Rocchini, D.; Geri, F.; Bacaro, G.; Marcantonio, M.; Chiarucci, A. Effects of an afforestation process on plant species richness: A retrogressive analysis. Ecol. Comp. 2012, 9, 55–62. [Google Scholar] [CrossRef]
- Arroyo-Rodríguez, V.; Rös, M.; Escobar, F.; Melo, F.P.L.; Santos, B.A.; Tabarelli, M.; Chazdon, R. Plant beta-diversity in fragmented rain forests: Testing floristic homogenization and differentiation hypothesis. J. Ecol. 2013, 101, 1449–1458. [Google Scholar] [CrossRef] [Green Version]
- Baeten, L.; Vangansbeke, P.; Hermy, M.; Peterken, G.; Vanhuyse, K.; Verheyen, K. Distinguishing between turnover and nestedness in the quantification of biotic homogenization. Biodivers. Conserv. 2012, 21, 1339–1409. [Google Scholar] [CrossRef] [Green Version]
- Nuttle, T.; Ristau, T.E.; Royo, A.A. Long-term biological legacies of herbivore density in a landscape-scale experiment: Forest understoreys reflect past deer density treatments for at least 20 years. J. Ecol. 2014, 102, 221–228. [Google Scholar] [CrossRef] [Green Version]
- Suzuki, M.; Miyashita, T.; Kabaya, H.; Ochiai, K.; Asada, M.; Kikvidze, Z. Deer herbivory as an important driver of divergence of ground vegetation communities in temperate forests. Oikos 2013, 122, 104–110. [Google Scholar] [CrossRef]
- Lilleeng, M.S.; Hegland, S.J.; Rydgren, K.; Moe, S.R. Red deer mediate spatial and temporal plant heterogeneity in boreal forests. Ecol. Res. 2016, 31, 777–784. [Google Scholar] [CrossRef] [Green Version]
Figure 1.
Changes in α- diversity indexes. Vertical bars show standard deviations. The exact Wilcoxon signed-rank test was used to compare the 2010 and 2018 data. NS, not significant; ** p < 0.01.
Figure 1.
Changes in α- diversity indexes. Vertical bars show standard deviations. The exact Wilcoxon signed-rank test was used to compare the 2010 and 2018 data. NS, not significant; ** p < 0.01.

Figure 2.
Numbers of newly occurring and absent species in each vegetation type. The exact Wilcoxon signed-rank test was used to compare between the number of those species. ** p < 0.01.
Figure 2.
Numbers of newly occurring and absent species in each vegetation type. The exact Wilcoxon signed-rank test was used to compare between the number of those species. ** p < 0.01.

Figure 3.
Comparison of β-diversity metrics among transects in each census. The exact Wilcoxon signed-rank test was used to compare the 2010 and 2018 data. NS, not significant; * p < 0.05; ** p < 0.01. B: Betula forests, G: Grasslands.
Figure 3.
Comparison of β-diversity metrics among transects in each census. The exact Wilcoxon signed-rank test was used to compare the 2010 and 2018 data. NS, not significant; * p < 0.05; ** p < 0.01. B: Betula forests, G: Grasslands.

Figure 4.
Changes in grazing ratios (%). Grazing ratios were calculated as the ratio of the total grazed occurrence frequency to the total occurrence frequency in each transect. Vertical bars show standard deviations. The exact Wilcoxon signed-rank test was used to compare the 2010 data with later census data. NS, not significant.

Figure 5.
Relationships between grazing ratio (%) in transects and changes in α-diversity between 2010 and 2018. Simple correlation was tested by Pearson’s product-moment correlation. * p < 0.05; ** p < 0.01.
Figure 5.
Relationships between grazing ratio (%) in transects and changes in α-diversity between 2010 and 2018. Simple correlation was tested by Pearson’s product-moment correlation. * p < 0.05; ** p < 0.01.

Figure 6.
Relationships between grazing ratio (%) in transects and β-diversity in 2010 and 2018 in each transect. Simple correlation was tested by Pearson’s product-moment correlation. * p < 0.05; ** p < 0.01.
Figure 6.
Relationships between grazing ratio (%) in transects and β-diversity in 2010 and 2018 in each transect. Simple correlation was tested by Pearson’s product-moment correlation. * p < 0.05; ** p < 0.01.

Figure 7.
Relationships between grazing ratios (%) on each species in (a) 2010 and (b) 2018 and ratios (%) of occurrence frequencies in 2018 to those in 2010. The grazing ratios of individual species were not significantly correlated with the changes of the occurrence frequencies of those species between censuses.


Table 1.
β-diversity indices [41].
Table 1.
β-diversity indices [41].
| Incidence Data | ||
|---|---|---|
| βSOR | Sørensen dissimilarity. The total difference in species composition between censuses in a transect and between two transects in each vegetation type | |
| βSIM | Simpson dissimilarity. Turnover | |
| βSNE | Nestedness-driven dissimilarity. Nestedness | |
| Abundance data | ||
| βBC | Bray–Curtis dissimilarity. The total difference in species composition | |
| βBC.BAL | Replacement and balanced variation in abundance. The individuals of some species in one transect or census are replaced by the same number of individuals of a different species in another transect or census; substitution | |
| βBC.GRA | Nestedness in abundance gradients. Some individuals are lost from one transect to the other or between census periods; subset | |
Disclaimer/Publisher’s Note: The statements, opinions and data contained in all publications are solely those of the individual author(s) and contributor(s) and not of MDPI and/or the editor(s). MDPI and/or the editor(s) disclaim responsibility for any injury to people or property resulting from any ideas, methods, instructions or products referred to in the content. |
© 2023 by the author. Licensee MDPI, Basel, Switzerland. This article is an open access article distributed under the terms and conditions of the Creative Commons Attribution (CC BY) license (https://creativecommons.org/licenses/by/4.0/).
Share and Cite
MDPI and ACS Style
Nagaike, T. Floristic Homogenization and Differentiation under Deer Grazing in a Subalpine Zone in Central Japan. Diversity 2023, 15, 192. https://doi.org/10.3390/d15020192
AMA Style
Nagaike T. Floristic Homogenization and Differentiation under Deer Grazing in a Subalpine Zone in Central Japan. Diversity. 2023; 15(2):192. https://doi.org/10.3390/d15020192
Chicago/Turabian StyleNagaike, Takuo. 2023. "Floristic Homogenization and Differentiation under Deer Grazing in a Subalpine Zone in Central Japan" Diversity 15, no. 2: 192. https://doi.org/10.3390/d15020192
Note that from the first issue of 2016, this journal uses article numbers instead of page numbers. See further details here.