Article

Trophic Ecology during the Ontogenetic Development of the Pelagic Thresher Shark Alopias pelagicus in Baja California Sur, Mexico

by
Clara Sánchez-Latorre
1,
Felipe Galván-Magaña
1,*,
Fernando R. Elorriaga-Verplancken
1,
Arturo Tripp-Valdez
1,
Rogelio González-Armas
1,
Alejandra Piñón-Gimate
1 and
Antonio Delgado-Huertas
2
1
Instituto Politécnico Nacional, Centro Interdisciplinario de Ciencias Marinas, Avenida IPN, s/n Colonia Playa Palo de Santa Rita, La Paz 23096, Baja California Sur, Mexico
2
Instituto Andaluz de Ciencias de la Tierra, CSIC-UGR, 1808 Granada, Spain
*
Author to whom correspondence should be addressed.
Diversity 2023, 15(10), 1057; https://doi.org/10.3390/d15101057
Submission received: 18 August 2023 / Revised: 26 September 2023 / Accepted: 27 September 2023 / Published: 1 October 2023
(This article belongs to the Special Issue Shark Ecology)

Abstract

:
The trophic ecology of the Pelagic Thresher shark (Alopias pelagicus) was evaluated based on chemical ecology using stable isotope ratios of carbon (δ13C) and nitrogen (δ15N) in the vertebrae and muscles. Individuals were caught between August 2013 and October 2019 on both the coasts of Baja California Sur, Mexico. In Bahía Tortugas, the mean vertebrae (n = 35) values were 12.72 ± 1.06‰ (δ15N) and −14.79 ± 0.61‰ (δ13C), while in muscles (n = 32) these values were 16.63 ± 0.76‰ (δ15N) and −17.18 ± 0.39‰ (δ13C). In Santa Rosalía, the mean vertebrae (n = 125) isotopic values were 14.4 ± 1.59‰ (δ15N) and −14.18 ± 0.51‰ (δ13C), while in muscles (n = 43), these values were 18.08 ± 0.96‰ (δ15N) and −16.43 ± 0.34‰ (δ13C). These results show higher δ15N values in Santa Rosalía as an effect of baseline isotopic differences between the two regions, whereas the δ13C values were lower in Bahía Tortugas, suggesting offshore ecological behavior (p < 0.05). In Santa Rosalía, there were significant differences by sex for δ15N in muscle, whereas the δ13C showed ontogenetic shifts, indicating that neonates feed in coastal areas more commonly than juveniles or adults (p < 0.05). Neither sex nor ontogenetic differences were observed in Bahía Tortugas (p > 0.05), suggesting a high overlap between their isotopic niches. Therefore, Alopias pelagicus uses the same ecological niche throughout its life, and there is consistency between sexes. The mean trophic position for both tissues and regions was 4.5, which corresponds to a tertiary predator, without any differences between stages or sex. Due to their higher energetic needs, juveniles and females showed the greatest isotopic niche amplitude; thus, their ecological niche is the widest.

1. Introduction

The Pelagic Thresher shark Alopias pelagicus (Nakamura inhabits tropical and temperate oceanic waters throughout the Indo-Pacific Ocean, including the eastern coast from Mexico to northern Peru, with no records in the Atlantic Ocean. It is found up to 300 m deep, and its length can reach up to 4.28 m [1]. Thresher sharks are characterized by their long tail, which measures half their body length, and that they use to corner and to disorient and stun the fish and pelagic invertebrates that are part of their diet. This species is considered to be oophagous, due to the egg capsules and fragments of shell found in the stomachs of embryos [2]. Liu et al. [3] established that the Pelagic Thresher shark has two embryos per litter, with a long gestation period of nine months, and they mature at the age of eight years, which suggests that this species is extremely vulnerable to overexploitation and in need of close monitoring.
Mexican fisheries land some of the largest shark catches in the world, dominated mainly by mustelids, but other species such as A. pelagicus also represent a significant component [4]. Fisheries along the coasts of Baja California are diverse and opportunistic, while A. pelagicus and Isurus oxyrinchus (Rafinesque) are specifically targeted for their meat and fins [4].
There is scarce knowledge regarding their biology, with few studies carried out into their age, growth, and reproduction in the northwestern Pacific [3,5] and Ecuador [2]. The trophic ecology of A. pelagicus has mainly been examined in the waters off Ecuador [6,7,8], with Lara et al.’s [9] being the only dietary study in Mexican waters. Polo-Silva et al. [6] found the giant squid Dosidicus gigas (d’Orbigny to be the main prey in its diet, followed by the lanternfish Benthosema panamense (Tåning) and the squid Sthenoeuthis oulaniensis (Lesson). Similar results were obtained by Calle-Morán [7], who reported as the main prey the Red Flying Squid Ommastrephes bartramii (Lesueur), the Jumbo Squid D. gigas, the Purpleback Fying Squid S. oualaniensis, and the South Pacific Hake Merluccius gayi (Guichenot). Garcia-Olvera [10] reported anchovy Engraulis mordax (Girard) to be its main prey, followed by the family of lanternfishes Myctophidae, and Paralabrax spp. (Girard). The same topic has been recently studied in Indonesia for the first time [11], with the following identified as the three top prey species: the Frigate Tuna Auxis thazard (Lacepède), the Purpleback Flying Aquid S. oualaniensis, and the Spiny Lanternfish Dasyscopelus spinosus (Steindachner).
The most common method used to analyze prey is to extract the stomach and identify stomach contents to the lowest taxonomical level possible, but it is also possible to obtain samples via non-lethal methods [12]. One technique that has been used previously is stomach flushing, also referred to as gastric lavage. This technique involves pumping water via a tube down the throat of the animal into the stomach, expelling the stomach contents via the mouth [12]. Another less widely used method is applying forceps to evert the stomachs of small sharks. However, since this involves either restraining the shark upside down, or anesthetizing the animal before reaching into its mouth, it is not appropriate for larger species [12].
Stable isotope analysis, particularly using nitrogen and carbon, allows us to evaluate the structure and dynamics of ecological communities, with this approach combining the benefits of both trophic-level and food web paradigms in food web ecology [13]. Moreover, this method is less invasive than others previously mentioned, since stable isotope samples can be taken by extracting blood or by performing biopsies [14]. Values of δ15N are used to estimate trophic levels and breadth; consumers are isotopically enriched by 3–4‰ relative to their prey [13,15]. In contrast, values of δ13C remain relatively unaffected by trophic level (0.5–1‰), providing information about trophic habitat use across the inshore-offshore gradient [15,16].
For slow-growing species such as sharks, the isotopic signals given off by the muscle tissue provide information about the prey assimilated by the predator 1–2 years prior to its consumption [14,16]. Other tissues such as vertebrae are metabolically inert and contain growth layers that can record ecological information over the lifespan of a single individual [16,17]. Ontogenetic shifts in the use of trophic habitat often reflect changes in survival strategies. While juveniles use their energy to grow, adults prioritize activities such as reproduction [18]. These changes in feeding habits are common in sharks and rays, as these species are able to shift their prey types and feeding areas as they grow [19]. Understanding the ecological life history of pelagic species is important to ensure their survival, especially in long-living species such as elasmobranchs [18].
The combined assessment of trophic ontogeny in A. pelagicus from multiple regions, focusing on different tissues and life stages, allows us not only to analyze their feeding behaviors, but also to isotopically compare tissues with different metabolic rates and relate these to areas with unique oceanographic conditions.
Considering that stable isotopes of the Pelagic Thresher shark have only been only studied in Ecuadorian waters, the aim of this study is to examine the trophic ontogeny of this species in both the coastal areas of Baja California Sur, Mexico, by analyzing the nitrogen and carbon stable isotopes in vertebrae and muscles.

2. Materials and Methods

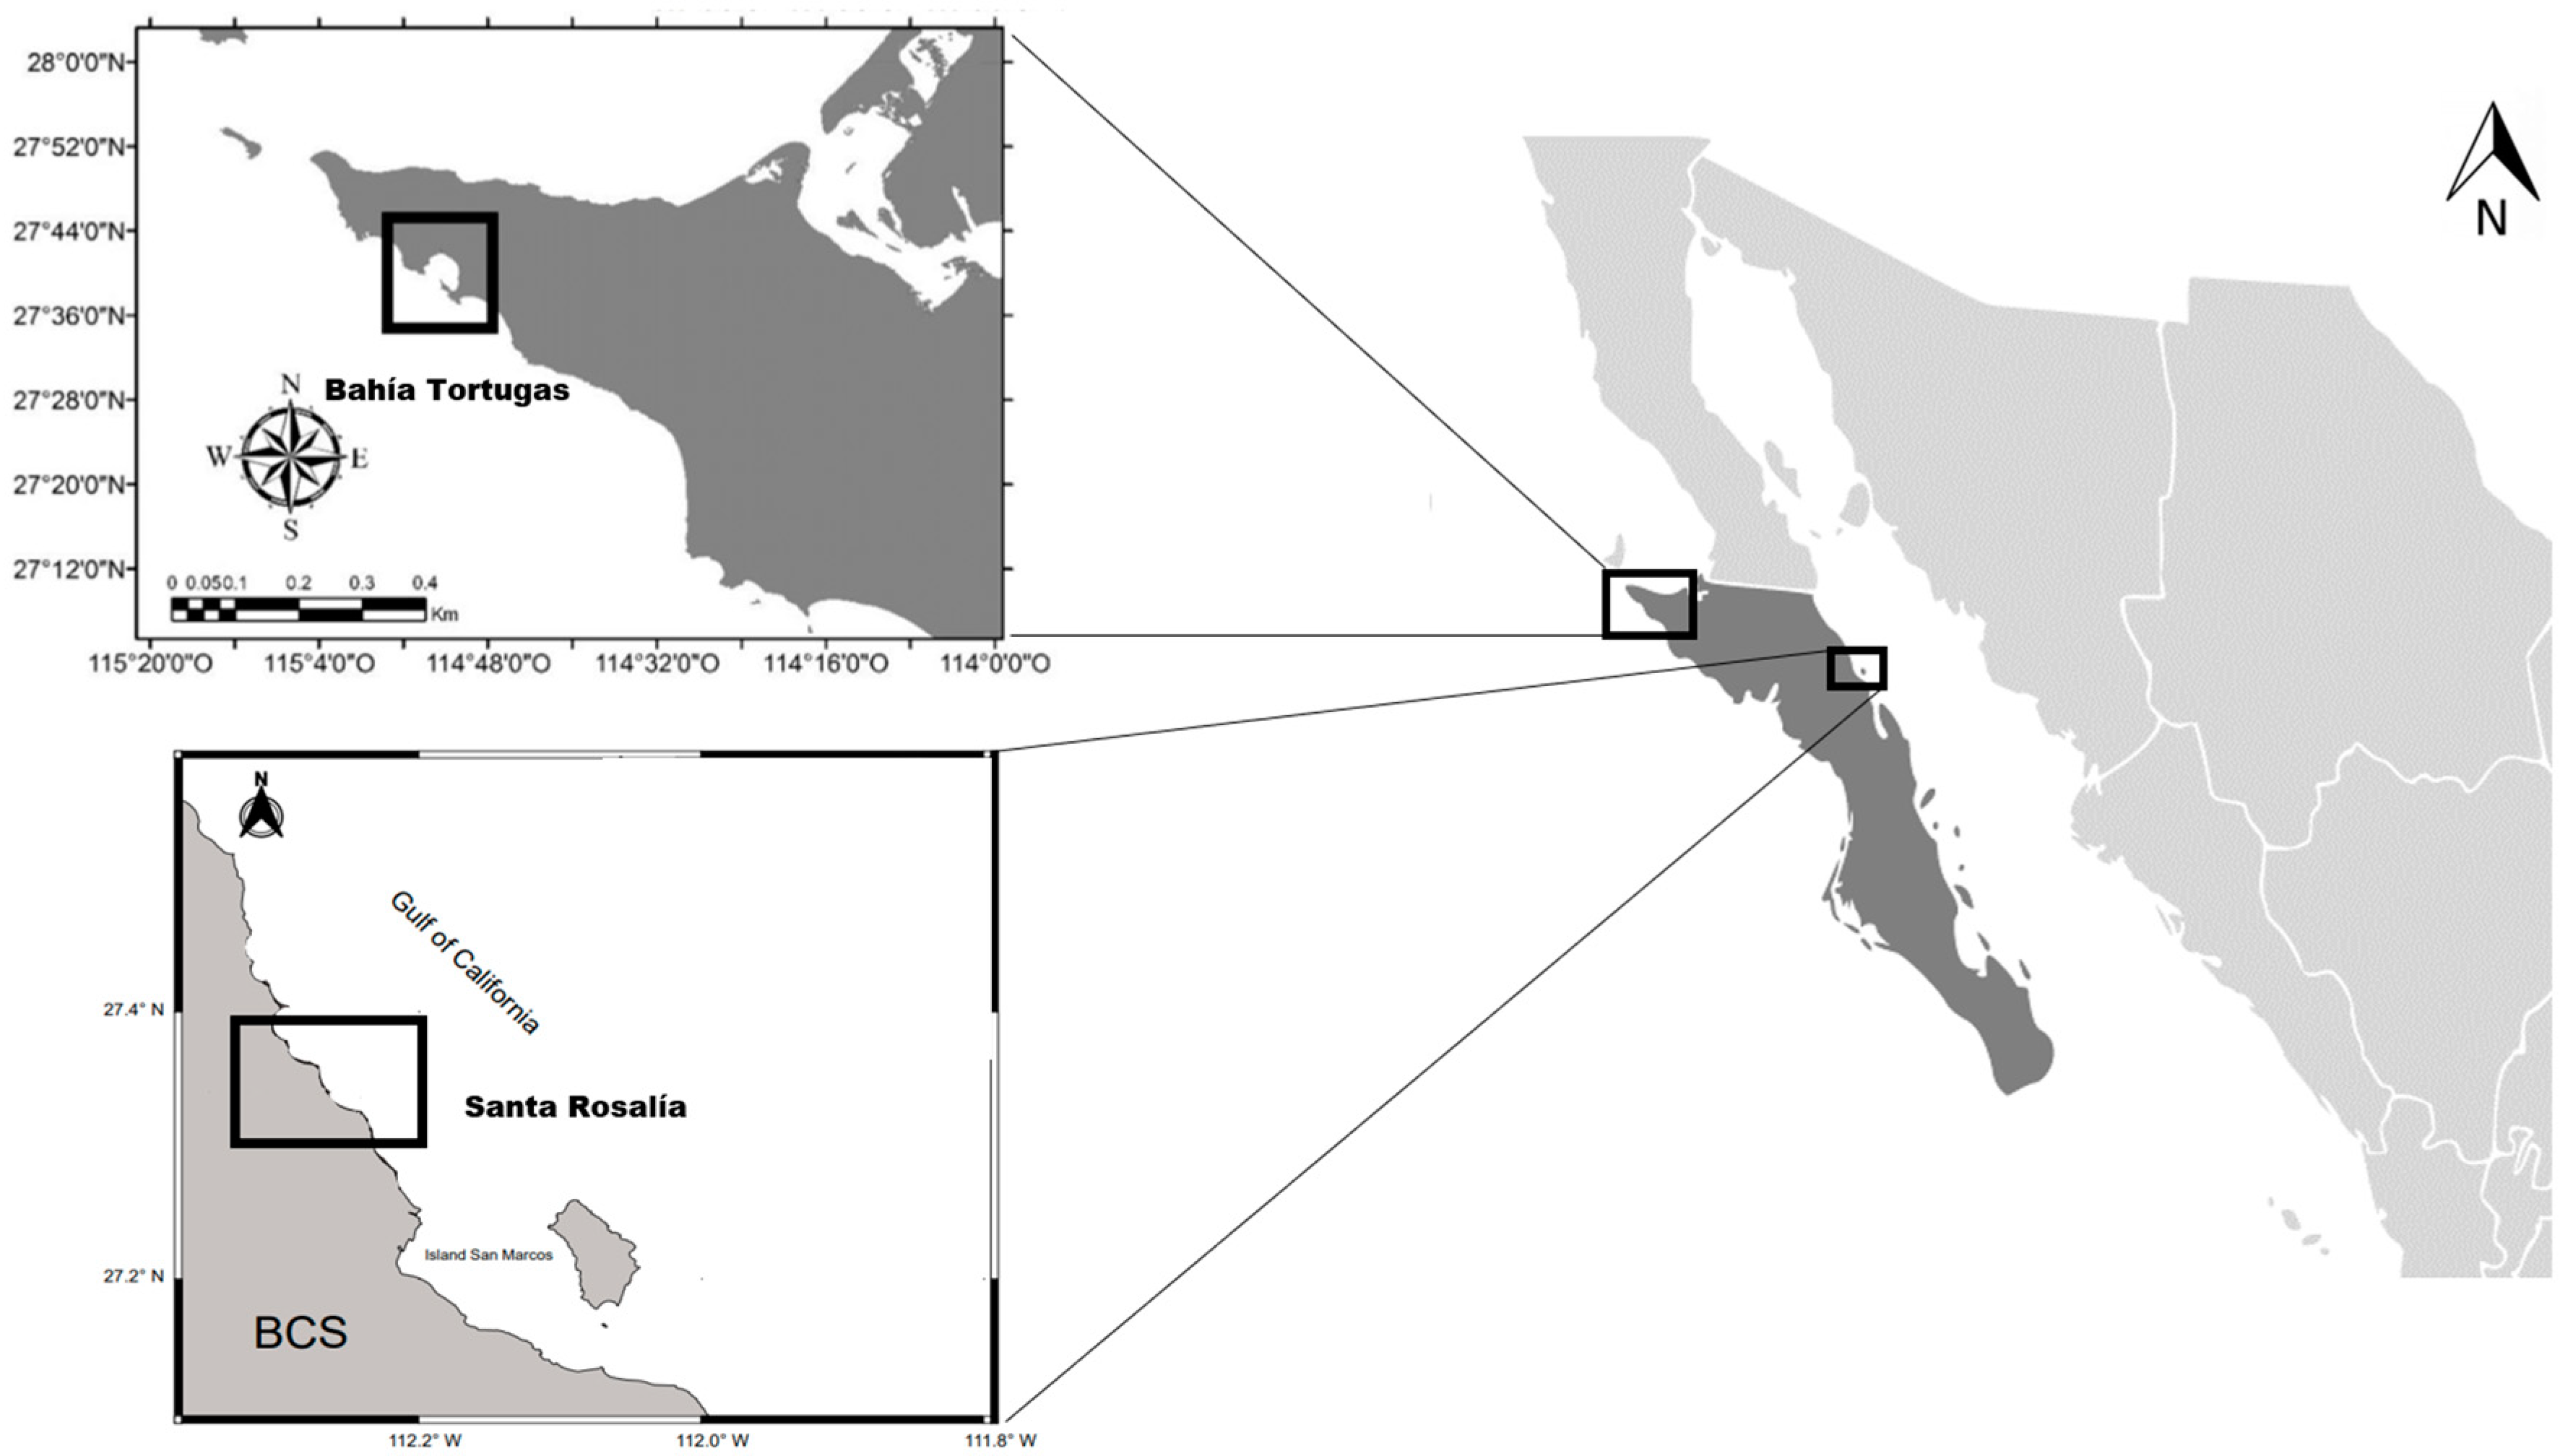
2.1. Study Area and Sample Collection

Samples were collected in two areas: the fishing town of Bahía Tortugas (27°39′35″ N; 114°52′35″ W), located on the western coast of the Baja California Sur Peninsula, and Santa Rosalía (27°20′20″ N; 112°16′01″ W), located on the eastern coast of Baja California Sur (Figure 1).
Bahía Tortugas (BT) is known for the frequent upwelling phenomenon that occurs there, which provides nutrients to the surface that remain available for primary production. Therefore, this region exhibits a high phyto- and zooplankton biomass, which results in the high productivity of fishery resources [20].
Santa Rosalia (SR) is located in the Gulf of California, the only evaporation basin of the Pacific Ocean, due to its location between two hot land masses and the absence of freshwater inflow to the region. The variable depth of the Gulf of California, the characteristics of its habitat, and its unique location in a transition zone between temperate and tropical faunal regions endows the area with a unique biological richness [21].
In BT, samples of A. pelagicus were collected using artisanal long-line fishery equipment from August 2013 to August 2016. In SR, samples were collected by fishermen using gill nets from October 2017 to October 2019. The total and precaudal length (TL and PL) were measured and the sex was determined by the presence of claspers in males. Sexual maturity in males was established via the size and condition of the clasper (rotation, calcification, and semen presence) and the development of the testes. Males were divided into two reproductive stages. Juvenile/Immature: short and non-calcified clasper; testes soft, elongated, and not lobated. Adult/Mature: calcified claspers with fully lobated testes.
Approximately 20 g of muscle along with one or more vertebrae from the dorsal region near the head was sampled from each individual organism. The samples were stored in polyethylene bags properly identified and transported on ice to the CICIMAR-IPN. They were frozen in the laboratory until analysis.

2.2. Laboratory Analysis

The vertebrae were defrosted, cleaned, and dried. The radius of each vertebra was measured using a digital vernier and related to the precaudal length by linear regression. Based on this equation and on the size at maturity, as proposed by Romero-Caicedo et al. [2], three ontogenetic stages in each vertebra were determined. For neonates, the first visible growth layer was sampled. Juvenile samples were those taken from the far end of the growth layer—up to 8.6 mm radius for males and 8.7 mm radius for females. For mature sharks, samples were taken from the outer edge of the vertebra when the radii exceeded 8.6 and 8.7 mm, respectively. Thus, for each vertebra of a mature shark, three samples were taken, while for each vertebra of an immature shark, two samples were taken. The samples were extracted using a microdrill with a 1 mm bit and were exposed for 24 h to a hydrochloric acid steam bath to remove inorganic carbon.
Approximately 5 g of each muscle sample was put into vials. As elasmobranchs retain urea and fat in their tissues, which can influence δ15N and δ13C values (depleting their heavy isotope values), these products had to be removed. Urea was extracted following Kim and Koch‘s [22] methods, using a mechanic bath (Bransonic M 8800) wherein each sample was washed three times with 10 mL deionized water for 15 min. The samples were then lyophilized at 0.123 mbar and −40 °C for 48 h, and then ground and homogenized in an agate mortar. Lipids were not removed since Post et al. [23] suggested an arithmetic correction that could be used to remove lipids from the isotopic signature, as follows:
δ13C corrected = δ13C sample − 3.32 + 0.99 × C:N
The δ13C and δ15N values were determined at the Instituto Andaluz de Ciencias de la Tierra in Granada, Spain, using a DELTA plus XL, Thermo-Finnagen isotope ratio mass spectrometer ( IRMS, Bremen, Germany). The isotopic results are expressed as δ values:
δ13C or δ15N = 1000 × [(Rsample/Rstandard) − 1]
where Rsample and Rstandard are the 13C/12C or 15N/14N ratios of the sample and standard, respectively. The standards were Vienna-Pee Dee Belemnite limestone for carbon and atmospheric N2 for nitrogen. The units are expressed as parts per thousand (per mil, ‰).

2.3. Data Analysis

The normality of data was assessed by the Kolmogorov–Smirnov–Lilliefors test and variance homogeneity by the Levene test. These were used to test the null hypothesis that a set of data originated from a normal and homoscedastic distribution. If they did, we used a parametrical test to assess for significant differences in mean δ13C and δ15N between sexes, stages, and regions. In this case, the most appropriate test was a three-factor analysis of variance (ANOVA), considering that we had three independent categorical variables and one dependent continuous variable. This test reveals whether the variance arose by chance or was the influence by the factors. If the data were not normally distributed, we used a Kruskal–Wallis test, which is accurate when applied to non-parametric data with three categorical variables. Moreover, using this non-parametric test allowed us to perform statistical analysis without necessarily transforming the data.
Estimates of the trophic position (TP) were calculated using the R package tRophicPosition [24]. A different base organism was used for each region: particulate organic matter (POM) for SR (δ15NPOM= 11.1‰, TPPOM = 1) [25] and the pelagic red crab Pleuroncodes planipes (Stimpson) (δ15NPleuroncodes planipes = 12.10‰, TPPleuroncodes planipes = 2) [20] for BT. As the trophic discrimination factor (TDF), 1.95‰ was used for vertebral tissue and 2.44‰ for muscle tissue [14].
To determine the niche breadth and trophic overlap between stages, sexes, and regions, we used the package SIBER (Stable Isotope Bayesian Ellipses in R) from the program R [26]. This analysis uses measurements based on ellipses calculated by a covariance matrix that defines their area (Standard Ellipse Corrected Area, SEAc) to show the trophic niche breadth. Using this method, it is possible to obtain the overlap between ellipses, whereby values close to 1 represent high trophic overlap [26].

3. Results

For BT, a total of 35 vertebrae and 32 muscle samples were used. For SR, a total of 125 vertebrae and 32 muscle samples were used.
Non-parametrical tests were applied to the δ13C vertebrae data in BT (F = 8.405, p = 0.007), as well as to the δ15N (D = 0.094, p = 0.007) and δ13C (F = 6.178, p = 0.003) vertebrae data in SR, since these did not follow a normal or homoscedastic distribution.
The δ15N values in vertebrae and muscles were higher in SR than in BT (X2 = 37.848, p = 7.648 × 10⁻¹⁰ and F = 49.54, p = 8.84 × 10⁻¹⁰, respectively), and the δ13C also presented less negative vertebrae and muscle values in SR (X2 = 26.854, p = 2.194 × 10⁻⁷ and F = 75.8, p = 6.62 × 10⁻¹³, respectively) (Figure 2; Table 1). In BT and SR, the isotopic niches presented an overlap of 39% in the vertebrae and an overlap of 23% in the muscles. Moreover, the δ15N values were 4‰ higher in the muscles than in the vertebrae (X2 = 125.07, p < 2.2 × 10⁻¹⁶) (Figure 2; Table 1).
Statistical tests confirmed the similarity of trophic habits of A. pelagicus in BT between maturity stages (neonates, juveniles, and adults) and sexes (females and males) for both tissues (Table 2). In SR, the δ15N remained constant between stages for both tissues, while the values for female were higher than those for males in the muscles. The δ13C showed significant differences between stages in vertebral tissue (Table 2). Even when statistical differences were only significant in SR, the δ13C values were more negative in both regions in juveniles and more positive in neonates (Table 1). However, females presented lower δ13C values than males in both areas and tissues (Table 1).
The SIBER analysis showed an overlap of between 41% and 68% in all groups (except sexes) for vertebrae in BT (27%) (Figure 3 and Figure 4; Table 3). Juveniles and females presented wider ellipse areas for both tissues in BT and for vertebrae in SR (Table 3).
The estimated TP values obtained in BT were 4.6 (vertebrae) and 4.4 (muscle). These values for SR were 4.3 (vertebrae) and 4.5 (muscle). No statistical differences were shown between regions, tissues, sexes, or maturity groups (p < 0.05).

4. Discussion

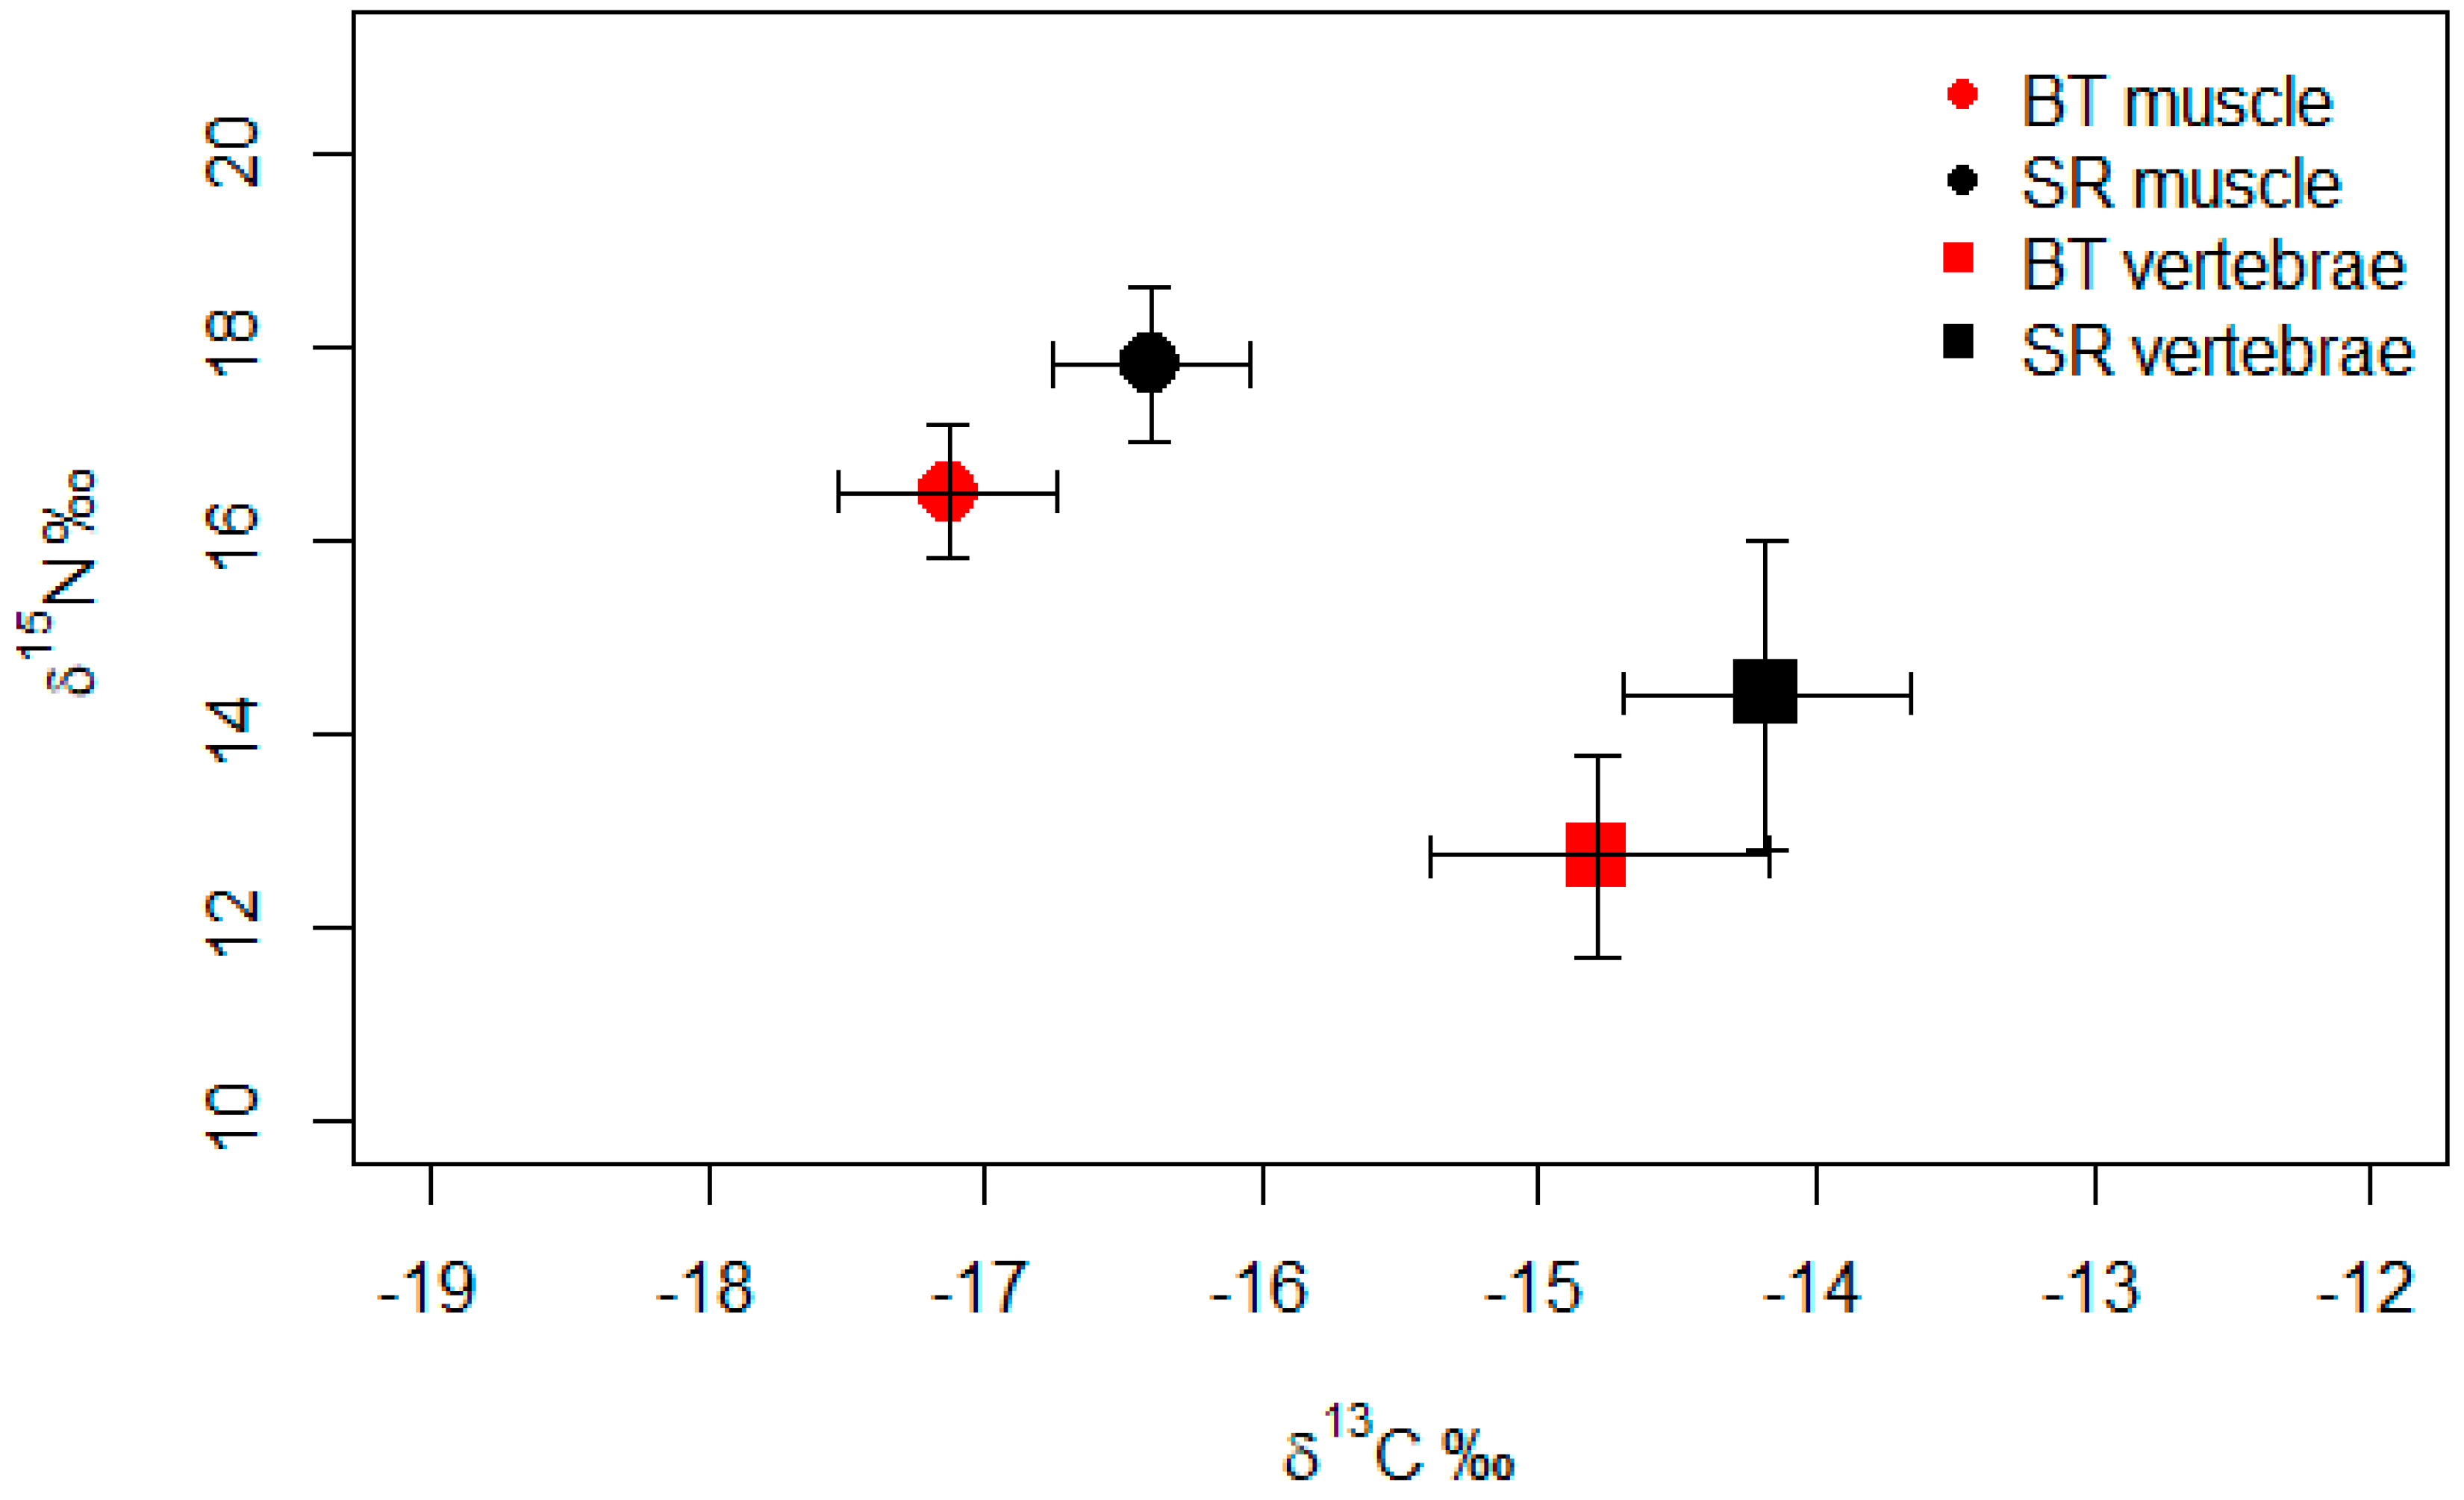
4.1. Comparison between Regions

The Gulf of California presents relatively high baseline δ15N values due to the denitrification processes that occur in the minimum oxygen zone [27], where 14N is mostly consumed, leaving a 15N-enriched nitrate pool [28]. Thus, δ15N values of particulate organic matter in the Gulf of California are higher (11.1‰) than those on the western coast of Baja California Sur (8.5‰) [27]. The same pattern was shown for A. pelagicus in this study, and so the isotopic contrast between both coasts of Baja California Sur is thought to be related to this difference in the trophic baseline, and not to the fact that the sharks showed different trophic positions on each coast.
Fewer negative δ13C values are found in productive inshore waters, such as in upwelling regions, while more negative values are found in less productive offshore waters [28]. The results suggest that in BT, A. pelagicus feed in offshore habitats, while in SR, this shark species presents a trophic inshore habitat. Another explanation for these differences in δ13C values is the narrow continental shelf found in BT, which has a strong offshore influence. Hence, even when sharks fed in both regions at similar distances from the coast, those caught on the oceanic shelf (BT) showed more negative δ13C values. Moreover, environmental conditions such as temperature may also affect the availability of prey in each region. While in summer, the water in SR reaches 30 °C [29], in BT, it stays at 19 °C [30] Thus, the prey in BT come from deeper and colder waters, as compared to the shallower and warmer waters in SR.
Isotopic niches represent the ecological niche based on a determined area inside of the δ space, where the coordinates are δ13C (environmental components) and δ15N (trophic components) [31]. The minimal overlap of isotopic niches from both study areas also indicates the different ecological niches of the Pelagic Thresher shark in each region, as discussed above.

4.2. Comparison between Tissues

For both areas, the δ15N values were higher in muscles than in vertebrae. Likewise, δ13C values were more positive in vertebrae than in muscles. This isotopic variability among tissues has been previously explained by the fact that each tissue has a different metabolic turnover rate and a different TDF. For example, MacNeil et al. [32] demonstrated that vertebrae presented the slowest δ15N turnover rate due to slow layer growth. These authors also found that δ13C decreases with increasing metabolic tissue rates. It has also been observed that muscle presents a higher degree of enrichment (2.44‰) than vertebrae (1.95‰), which could have an influence on the nitrogen isotope ratio [14]. Due to this turnover rate, the vertebrae emit isotopic signals over the lifetime of the organism, while the muscles only yield isotopic information from the last month of the animal’s life [17,32].

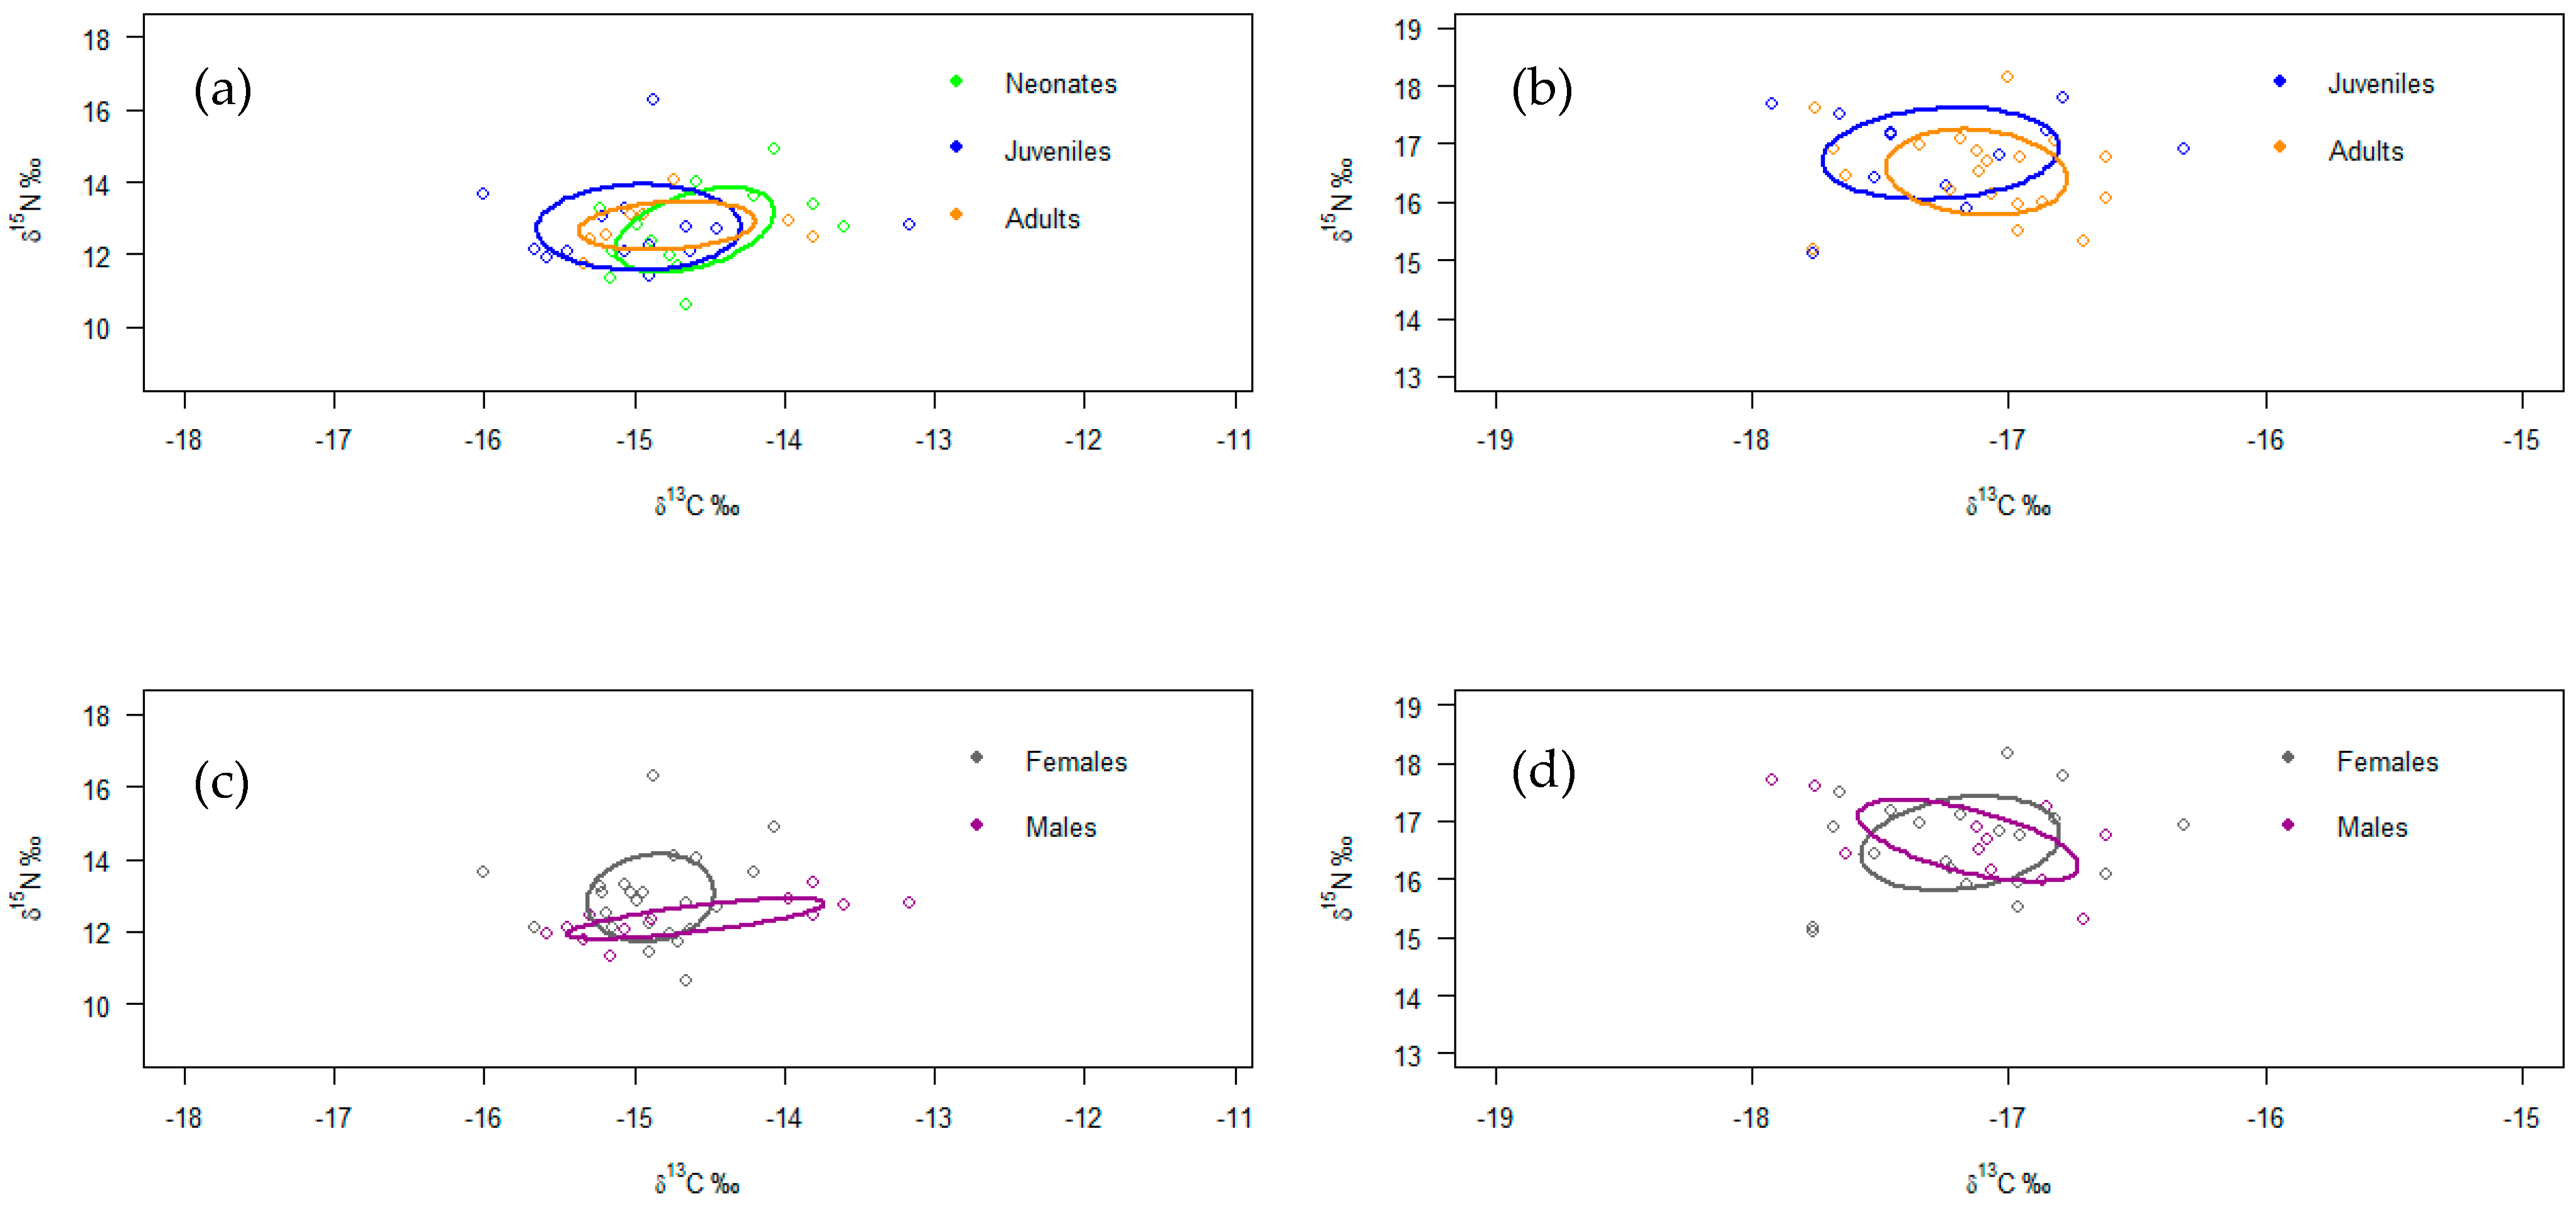
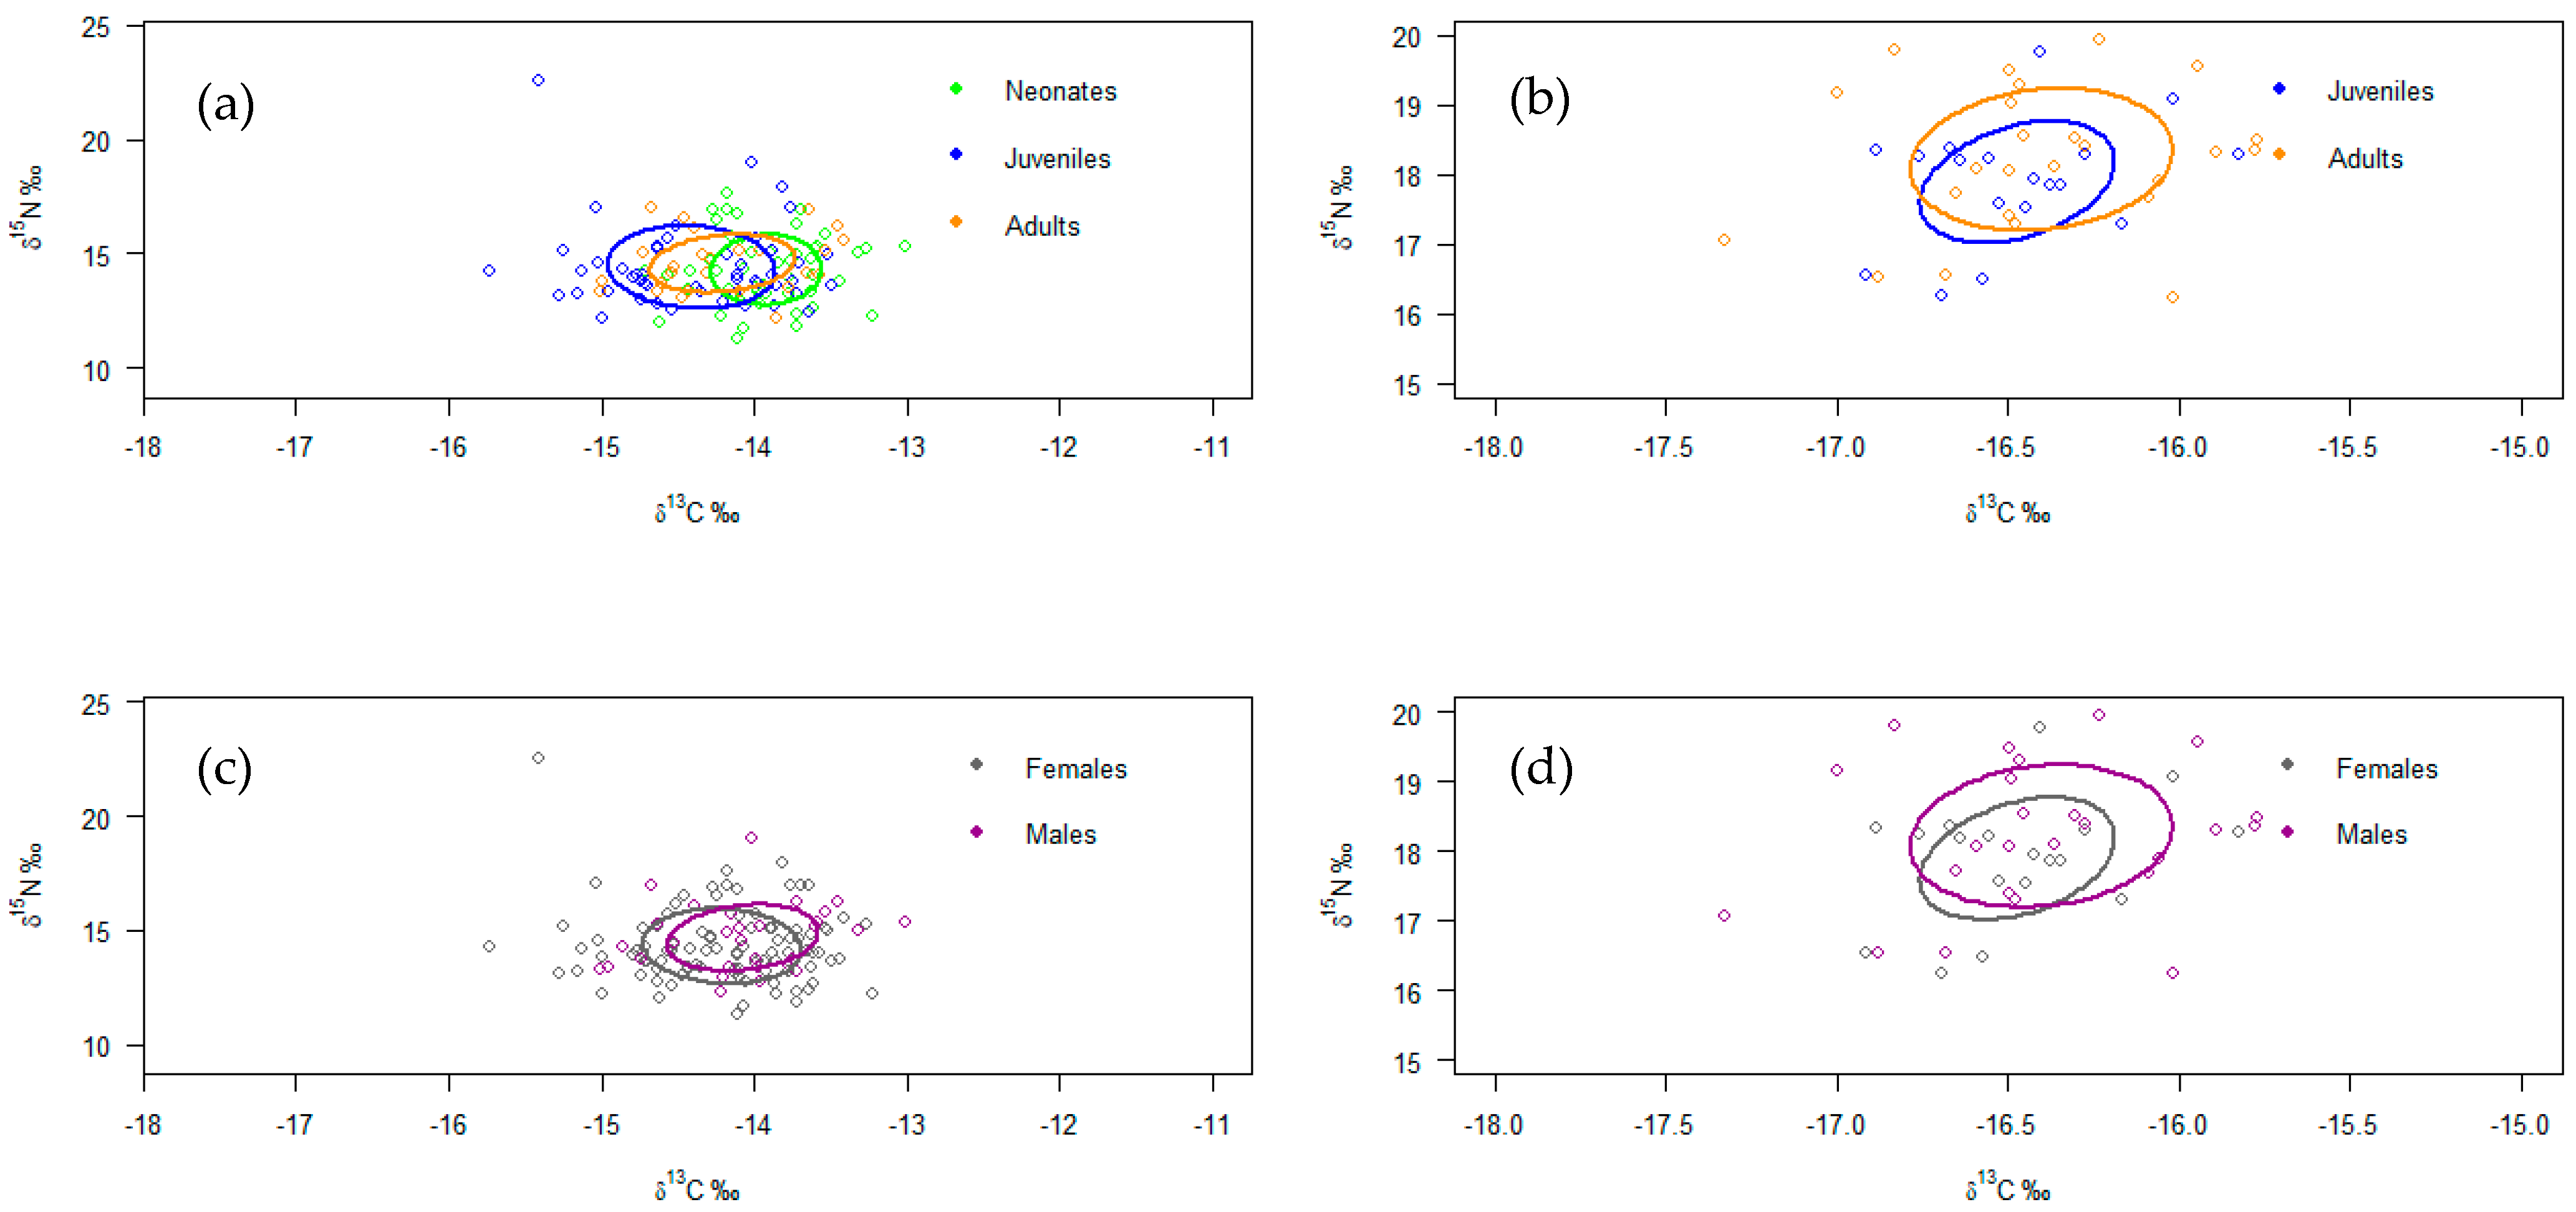
4.3. Isotopic Analysis by Maturity Stages

No ontogenetic differences in δ15N values were found in A. pelagicus, which indicates that this species feeds on the same prey groups throughout its life. In BT, the δ13C values also stayed stable throughout the organism’s life. Similar results were obtained in Ecuador by Calle-Morán [7], with no ontogenetic differences for any isotope ratio. Lara et al. [9] analyzed the stomach contents of A. pelagicus in BT and determined that the sardine Sardinops sagax (Jenyns was the principal prey for mature and immatures sharks, suggesting the same feeding pattern despite maturity stage, thus supporting our results. On the other hand, Estupiñán-Montaño [8] showed that the δ13C values in neonates presented differences from those in juveniles and adults off the Galápagos Islands. Similar results were found in the present study for SR, where the vertebrae presented differences among all maturity stages, from which we can infer a possible ontogenetic inshore–offshore movement for A. pelagicus.
Lowe et al. [19] pointed out that sharks change their diet and ecological needs as they grow, thus exploiting different areas, since they are segregated by size. In this study, the findings for BT do not reflect this behavior, while in SR they do, corroborating that A. pelagicus shows flexibility in its trophic behavior depending on its habitat and the inherent requirements related to its development.
In both areas, juveniles present the lowest δ13C values and the widest isotopic niches, while neonates show the highest δ13C values and most narrow isotopic niches. It can be inferred that on both coasts of Baja California Sur, juvenile individuals of A. pelagicus present a wider and more offshore feeding habitat, while neonates present a narrow and more inshore feeding habitat. Calle-Morán [7] attributed this phenomenon to the limitation of neonates reaching offshore waters, causing their habitat to be restricted to inshore waters. Moreover, as juveniles are not completely developed, they might focus most of their energy on growing, and as such, they need more nutrients and probably a wider ecological niche.

4.4. Isotopic Analysis by Sex

No differences in the δ15N values of A. pelagicus by sex were found in BT for any tissue, which is consistent with Lara et al.’s [9] findings in the same area, where males and females presented similar stomach contents. On the other hand, the δ15N values in SR assessed by sex, were similar in the vertebrae; however, in muscles, they showed significant differences. Once again, a contrast between the tissues is highlighted. These data suggest that male and female A. pelagicus in SR were feeding on prey that belonged to the same trophic level during its lifetime. Therefore, the overlap in their isotopic niches is high (68%). Nevertheless, assessments of the muscle indicate that, during the lasts months before their capture, males and females consumed different prey.
The δ13C values were similar between sexes in both study areas and tissues; however, females presented the lowest values. Moreover, they showed a larger ellipse area than males. Therefore, even if A. pelagicus did not segregate by sex on the coasts of Baja California Sur, females presented inclination towards a wider and more oceanic trophic habitat than males. This may indicate that females have greater energy and nutritional needs than males, related to the requirements of pregnancy [16].
It is important to consider that ontogenetic and sex differences were only seen in SR, while in BT, all sharks presented the same trophic behavior, regardless of their sex and size. These results indicate that the ecological habitat in SR is more heterogeneous than in BT, as A. pelagicus presented a wider isotopic niche (2.6‰2) during its lifetime in the Gulf of California than on the western coast of Baja California Sur (2.1‰2).

4.5. Trophic Position

Polo-Silva et al. [16] reported that the most appropriate TDF is that published by Kim et al. [33], who carried out a study on the feeding habits of the Leopard Shark Triakis semifasciata over 1250 days. Nevertheless, in the present study, we used the TDF proposed by Hussey et al. [14]. Even though the experiment was shorter (around 365 days), these authors developed the factor for vertebrae as well as for muscle.
In both study areas, the TP for the Pelagic Thresher shark was around 4.5, classifying it as a tertiary predator, with no changes by sex or stage. These results agree with those of Lara et al. [9] and Fernández-Aguirre (in process), who reported the sardine Sardinops sagax as the main prey for A. pelagicus in BT, and anchovy Engraulis mordax in SR. Since both these prey feed on plankton, they have a similar TP and consequently, A. pelagicus presented a similar TP in both areas.
No variability in the TP by sex or stage was found in this study, which was also reported by Polo-Silva et al. [6], who derived a TP of 3.9 for this species. On the other hand, Calle-Morán [7] obtained the same results (4.5) as we did in our study. Therefore, once more, it can be inferred that A. pelagicus shows flexible trophic behavior depending on the availability of prey in the surrounding environment.

5. Conclusions

The present study is the first to analyze the chemical ecology of A. pelagicus using stable isotopes in Mexican waters. It provides information on the trophic ontogeny of this species on the western and eastern coasts of Baja California Sur. On the western coast, both isotopes remained stable by sex and stage; thus, this area presented stable feeding habitats for A. pelagicus. On the eastern coast, the δ13C values showed no differences between sexes, and did so only between stages, as neonates probably fed close to the coast. On both coasts, neonates presented a narrow and onshore feeding habit, while juveniles presented a wide and offshore one. A. pelagicus was classified as a tertiary predator in our study area.
The use of stable isotopes to measure ontogenetic changes is a very useful tool, especially in environments that are highly variable, such as SR. The use of vertebrae as an indicator of ontogenetic changes is more utile; however, this type of tool is complementary rather than exclusive. For example, the isotopic signatures in muscles show variations that could be explained by the isotopic signatures in the vertebrae. This study makes a novel contribution to the ecological knowledge base (including habitat use) regarding the Thresher Shark in waters off the Mexican Pacific and Gulf of California coasts, providing potential tools for the better management of the species in both areas.

Author Contributions

Conceptualization, C.S.-L., F.G.-M. and F.R.E.-V.; data curation, F.G.-M.; formal analysis, C.S.-L.; investigation, C.S.-L., F.G.-M., F.R.E.-V., A.T.-V., R.G.-A., A.P.-G. and A.D.-H.; methodology, C.S.-L.; resources, F.R.E.-V., A.P.-G. and A.D.-H.; supervision, A.T.-V., R.G.-A., A.P.-G. and A.D.-H.; writing—original draft, C.S.-L.; writing—review and editing, C.S.-L., F.G.-M., A.T.-V., R.G.-A., A.P.-G. and A.D.-H. All authors have read and agreed to the published version of the manuscript.

Funding

Thanks to Instituto Politécnico Nacional, Project SIP-IPN 20220579 for support.

Institutional Review Board Statement

Not applicable.

Data Availability Statement

To get data supporting results contact Clara Sánchez Latorre.

Acknowledgments

R.G.-A., F.G.-M., F.R.E.-V., A.P.-G., and A.T.-V. Thanks to Instituto Politécnico Nacional for fellowships granted (COFAA, EDI).

Conflicts of Interest

The authors declare no conflict of interest.

References

  1. Weigmann, S. Annotated checklist of the living sharks, batoids and chimaeras (Chondrichthyes) of the world, with a focus on biogeographical diversity. J. Fish Biol. 2016, 88, 837–1037. [Google Scholar] [CrossRef] [PubMed]
  2. Romero-Caicedo, A.F.; Galván-Magaña, F.; Martinez-Ortiz, J. Reproduction of the pelagic thresher shark Alopias pelagicus in the equatorial Pacific. J. Mar. Biol. Assoc. 2014, 94, 1501–1507. [Google Scholar] [CrossRef]
  3. Liu, K.-M.; Chen, C.-T.; Liao, T.-H.; Joung, S.-J. Age, Growth, and Reproduction of the Pelagic Thresher Shark, Alopias pelagicus in the Northwestern Pacific. Copeia 1999, 1999, 68–74. [Google Scholar] [CrossRef]
  4. Smith, W.D.; Bizzarro, J.J.; Cailliet, G.M. La pesca artesanal de elasmobranquios en la costa oriental de Baja California, México: Características y consideraciones de manejo. Cienc. Mar. 2009, 35, 209–236. [Google Scholar] [CrossRef]
  5. Drew, M.; White, W.T.; Dharmadi; Harry, A.V.; Huveneers, C. Age, growth and maturity of the pelagic thresher Alopias pelagicus and the scalloped hammerhead Sphyrna lewini. J. Fish Biol. 2015, 86, 333–354. [Google Scholar] [CrossRef] [PubMed]
  6. Polo-Silva, C.; Rendón, L.; Galván-Magaña, F. Descripción de la dieta de los tiburones zorro (Alopias pelagicus) y (Alopias superciliosus) durante la época lluviosa en aguas ecuatorianas. PANAMJAS 2009, 4, 556–571. [Google Scholar]
  7. Calle-Morán, M.D. Ecología Trófica del Tiburón Zorro Pelágico Alopias pelagicus en Santa Rosa de Salinas, Pacífico Ecuatoriano. Master’s Thesis, Universidad Nacional Autónoma de México, Mexico City, Mexico, 2010. [Google Scholar]
  8. Estupiñán-Montaño, C. Ontogenia Alimentaria de Tres Especies de Tiburones Pelágicos: Alopias pelagicus, Carcharhinus falciformis y Prionace glauca en la Reserva Marina de Galápagos, Ecuador. Master’s Thesis, Instituto Politécnico Nacional, Centro Interdisciplinario de Ciencias Marinas, La Paz, Mexico, 2016. [Google Scholar]
  9. Lara, A.; Galván-Magaña, F.; Elorriaga-Verplancken, F.; Marmolejo-Rodríguez, A.J.; González-Armas, R.; Arreola-Mendoza, L.; Sujitha, S.B.; Jonathan, M.P. Bioaccumulation and trophic transfer of potentially toxic elements in the pelagic thresher shark Alopias pelagicus in Baja California Sur, Mexico. Mar. Pollut. Bull. 2020, 156, 111192. [Google Scholar] [CrossRef]
  10. García-Olvera, M.E. Ecología Trófica de los Tiburones Zorro (Alopias pelagicus) y Piloto (Carcharhinus falciformis) en los Puertos de Santa Rosalía y Punta Lobos, Baja California Sur. Bachelor’s Thesis, Universidad Autónoma de Ciudad Juarez, Ciudad Juarez, Mexico, 2023; 41p. [Google Scholar]
  11. Alghozali, F.A.; Salsabila, R.; Gustianto, M.W.D.; Putri, H.M.I.H.; Himawan, M.R.; Yuneni, R.R.; Hatmoro, C.K.; Rezkiani, M. Diet analyses of the pelagic thresher shark, Alopias pelagicus (Lamniformes: Alopiidae), from the Lombok Strait waters, Indonesia. Biodiversitas J. Biol. Divers. 2023, 24, 3708–3714. [Google Scholar] [CrossRef]
  12. Barnett, A.; Redd, K.S.; Frusher, S.D.; Stevens, J.D.; Semmens, J.M. Non-lethal method to obtain stomach samples from a large marine predator and the use of DNA analysis to improve dietary information. J. Exp. Mar. Biol. Ecol. 2010, 393, 188–192. [Google Scholar] [CrossRef]
  13. Post, D.M. Using stable isotopes to estimate trophic position: Models, methods, and assumptions. Ecology 2002, 83, 703–718. [Google Scholar] [CrossRef]
  14. Hussey, N.E.; Brush, J.; McCarthy, I.D.; Fisk, A.T. Δ15N and δ13C diet–tissue discrimination factors for large sharks under semi-controlled conditions. Comp. Biochem. Physiol. Part A Mol. Integr. Physiol. 2010, 155, 445–453. [Google Scholar] [CrossRef] [PubMed]
  15. Peterson, B.J.; Fry, B. Stable Isotopes in Ecosystem Studies. Annu. Rev. Ecol. Syst. 1987, 18, 293–320. [Google Scholar] [CrossRef]
  16. Polo-Silva, C.; Newsome, S.D.; Galván-Magaña, F.; Grijalba-Bendeck, M.; Sanjuan-Muñoz, A. Trophic shift in the diet of the pelagic thresher shark based on stomach contents and stable isotope analyses. Mar. Biol. Res. 2013, 9, 958–971. [Google Scholar] [CrossRef]
  17. Estrada, J.A.; Rice, A.N.; Natanson, L.J.; Skomal, G.B. Use of Isotopic Analysis of Vertebrae in Reconstructing Ontogenetic Feeding Ecology in White Sharks. Ecology 2006, 87, 829–834. [Google Scholar] [CrossRef] [PubMed]
  18. Grubbs, R.D. Ontogenetic shifts in movements and habitat use. In Sharks and Their Relatives II; CRC Press: Boca Raton, FL, USA, 2010; pp. 335–366. [Google Scholar]
  19. Lowe, C.G.; Wetherbee, B.M.; Crow, G.L.; Tester, A.L. Ontogenetic dietary shifts and feeding behavior of the tiger shark, Galeocerdo cuvier, in Hawaiian waters. Environ. Biol. Fishes 1996, 47, 203–211. [Google Scholar] [CrossRef]
  20. Martínez-Ayala, J.C. Ecología Trófica del Cazón Mamón Mustelus lunulatus en la Costa Occidental de Baja California Sur, México. Master’s Thesis, Instituto Politécnico Nacional, Centro Interdisciplinario de Ciencias Marinas, La Paz Mexico, 2018. [Google Scholar]
  21. Bizzarro, J.J.; Smith, W.D.; Hueter, R.E.; Tyminski, J.; Márquez, J.F.; Castillo, J.L.; Cailliet, G.M. El Estado Actual de los Tiburones y Rayas Sujetos a Explotación Comercial en el Golfo de California: Una Investigación Aplicada al Mejoramiento de su Manejo Pesquero y Conservación; Moss Landing Marine Laboratories Technical Publication: Moss Landing, CA, USA, 2007. [Google Scholar]
  22. Kim, S.L.; Koch, P.L. Methods to collect, preserve, and prepare elasmobranch tissues for stable isotope analysis. Environ. Biol. Fishes 2012, 95, 53–63. [Google Scholar] [CrossRef]
  23. Post, D.M.; Layman, C.A.; Arrington, D.A.; Takimoto, G.; Quattrochi, J.; Montaña, C.G. Getting to the fat of the matter: Models, methods and assumptions for dealing with lipids in stable isotope analyses. Oecologia 2007, 152, 179–189. [Google Scholar] [CrossRef]
  24. Quezada-Romegialli, C.; Jackson, A.L.; Hayden, B.; Kahilainen, K.K.; Lopes, C.; Harrod, C. TRophicPosition, an r package for the Bayesian estimation of trophic position from consumer stable isotope ratios. Methods Ecol. Evol. 2018, 9, 1592–1599. [Google Scholar] [CrossRef]
  25. Aurioles-Gamboa, D.; Rodríguez-Pérez, M.Y.; Sánchez-Velasco, L.; Lavín, M.F. Habitat, trophic level, and residence of marine mammals in the Gulf of California assessed by stable isotope analysis. Mar. Ecol. Prog. Ser. 2013, 488, 275–290. [Google Scholar] [CrossRef]
  26. Jackson, A.L.; Inger, R.; Parnell, A.C.; Bearhop, S. Comparing isotopic niche widths among and within communities: SIBER—Stable Isotope Bayesian Ellipses in R. J. Anim. Ecol. 2011, 80, 595–602. [Google Scholar] [CrossRef]
  27. Altabet, M.A.; Pilskaln, C.; Thunell, R.; Pride, C.; Sigman, D.; Chavez, F.; Francois, R. The nitrogen isotope biogeochemistry of sinking particles from the margin of the Eastern North Pacific. Deep. Sea Res. Part I Oceanogr. Res. Pap. 1999, 46, 655–679. [Google Scholar] [CrossRef]
  28. Graham, B.S.; Koch, P.L.; Newsome, S.D.; McMahon, K.W.; Aurioles, D. Using Isoscapes to Trace the Movements and Foraging Behavior of Top Predators in Oceanic Ecosystems. In Isoscapes: Understanding Movement, Pattern, and Process on Earth through Isotope Mapping; West, J., Bowen, G.J., Dawson, T.E., Tu, K.P., Eds.; Springer: Amsterdam, The Netherlands, 2009; pp. 299–318. [Google Scholar]
  29. García-Pámanes, J.; Trasviña-Castro, A.; Lara-Lara, J.R.; Bazán-Guzmán, C. Variaciones estacionales del flujo vertical de materia orgánica particulada en la región central del Golfo de California. Cienc. Mar. 2011, 37, 33–49. [Google Scholar]
  30. Guzman-del Proo, S.A.; Mille-Pagaza, S.R.; Campa-Guzmán, S.; Carrillo-Laguna, J.; Pereira Corona, A.; Belmar-Perez, J.; Parra-Alcocer, M.J.; Luque-Guerrero, A.C. La comunidad bentónica de los bancos de abulón (Haliotis spp. Mollusca: Gastropoda) en Bahía Tortugas, Baja California Sur, México. An. Esc. Nac. Cienc. Biológicas 1991, 36, 27–59. [Google Scholar]
  31. Newsome, S.D.; Rio, C.M.; Bearhop, S.; Phillips, D.L. A niche for isotopic ecology. Front. Ecol. Environ. 2007, 5, 429–436. [Google Scholar] [CrossRef]
  32. MacNeil, M.A.; Skomal, G.B.; Fisk, A.T. Stable isotopes from multiple tissues reveal diet switching in sharks. Mar. Ecol. Prog. Ser. 2005, 302, 199–206. [Google Scholar] [CrossRef]
  33. Kim, S.L.; Casper, D.R.; Galván-Magaña, F.; Ochoa-Díaz, R.; HernándezAguilar, S.B.; Koch, P.L. Carbon and nitrogen discrimination factors for elasmobranch soft tissues based on a long-term controlled feeding study. Environ. Biol. Fishes 2012, 95, 37–52. [Google Scholar] [CrossRef]
Figure 1. Location of two study areas, Bahia Tortugas and Santa Rosalía in Baja California Sur, Mexico.
Diversity 15 01057 g001
Figure 2. δ15N and δ13C values (mean ± SD ‰) of A. pelagicus in Bahía Tortugas (BT) and Santa Rosalía (SR) in vertebrae and muscles.
Diversity 15 01057 g002
Figure 3. Isotopic niche (ellipses) by stage, sex, and tissue of A. pelagicus in Bahía Tortugas (BT). (a) Vertebral tissue by stage; (b) muscle tissue by stage; (c) vertebral tissue by sex (d); muscle tissue by sex.
Diversity 15 01057 g003
Figure 4. Isotopic niche (ellipses) by stage, sex, and tissue from A. pelagicus in Santa Rosalía (SR). (a) Vertebral tissue by stage; (b) muscle tissue by stage; (c) vertebral tissue by sex; (d) muscle tissue by sex.
Diversity 15 01057 g004
Table 1. Summary of δ15N and δ13C values (mean ± SD ‰) by maturity stage and sex in vertebrae and muscles of A. pelagicus in Bahía Tortugas (BT) and Santa Rosalía (SR).
Vertebrae BT (n = 35)Muscle BT (n = 32)Vertebrae SR (n = 125)Muscle SR (n = 43)
δ15Nδ13Cδ15Nδ13Cδ15Nδ13Cδ15Nδ13C
Neonates12.67 ± 1.17−14.6 ± 0.53 14.91 ± 1.59−13.84 ± 0.41
Juveniles12.74 ± 1.18−14.97 ± 0.6816.83 ± 0.79−17.26 ± 0.4614.47 ± 0.87−14.6 ± 0.4217.78 ± 0.76−16.48 ± 0.29
Adults12.79 ± 0.67−14.78 ± 0.5916.51 ± 0.74−17.12 ± 0.3514.89 ± 1.15−14.27 ± 0.5117.83 ± 0.85−16.32 ± 0.4
Females12.92 ± 1.21−14.89 ± 0.4216.61 ± 0.81−17.19 ± 0.3914.31 ± 1.64−14.21 ± 0.5217.95 ± 0.77−16.42 ± 0.37
Males12.34 ± 0.56−14.59 ± 0.8516.66 ± 0.70−17.16 ± 0.4314.67 ± 1.45−14.08 ± 0.4917.44 ± 0.74−16.29 ± 0.33
Mean12.72 ± 1.06−14.79 ± 0.6116.63 ± 0.76−17.18 ± 0.3914.4 ± 1.59−14.18 ± 0.5118.08 ± 0.96−16.43 ± 0.34
Table 2. δ15N and δ13C ANOVA and Kruskal–Wallis analysis of vertebrae and muscles of A. pelagicus based on maturity stage and sex in Bahía Tortugas (BT) and Santa Rosalía (SR).
Vertebra BTMuscle BTVertebra SRMuscle SR
δ15Nδ13Cδ15Nδ13Cδ15Nδ13Cδ15Nδ13C
FpX2pFpFpX2pX2pFpFp
Stage0.220.642.970.231.590.221.190.281.080.5819.426.08 × 10−52.930.090.380.54
Sex2.370.130.090.750.020.880.0070.932.210.141.110.305.680.020.0420.84
Table 3. Stable Isotope Bayesian Ellipses in R (SIBER) analysis: Standard Ellipse Corrected Area, SEAc (‰2) and overlap (%) from vertebrae and muscles of A. pelagicus based on maturity stages and sex in Bahía Tortugas (BT) and Santa Rosalía (SR).
Vertebra BTMuscle BTVertebra SRMuscle SR
SEAcOverlap SEAc OverlapSEAcOverlapSEAcOverlap
Neonates1.948 1.7949
Juveniles2.74411.24473.17540.7848
Adults1.4 0.861.94 1.27
Males1.1270.83442.28681.3146
Females1.6712.680.9
Overlap of neonates and adults: 41%Overlap of neonates and adults: 55%
Disclaimer/Publisher’s Note: The statements, opinions and data contained in all publications are solely those of the individual author(s) and contributor(s) and not of MDPI and/or the editor(s). MDPI and/or the editor(s) disclaim responsibility for any injury to people or property resulting from any ideas, methods, instructions or products referred to in the content.

