Article

Trophic Partitioning among Three Mesopredatory Shark Species Inhabiting the Northwestern Adriatic Sea

1
Department of Biology, University of Padova, Via Ugo Bassi 58/B, 35121 Padova, Italy
2
Institute for Environmental Protection and Research (ISPRA), Loc. Brondolo, 30015 Venice, Italy
3
National Research Council (CNR), Institute of Marine Biological Resources and Biotechnologies (IRBIM), Largo Fiera della Pesca 1, 60125 Ancona, Italy
4
CoNISMa (Interuniversitary Consortium of Marine Sciences), Piazzale Flaminio 9, 00196 Roma, Italy
*
Author to whom correspondence should be addressed.
Diversity 2023, 15(12), 1163; https://doi.org/10.3390/d15121163
Submission received: 15 October 2023 / Revised: 19 November 2023 / Accepted: 20 November 2023 / Published: 22 November 2023
(This article belongs to the Special Issue Shark Ecology)

Abstract

:
While the general diet of Mediterranean elasmobranchs has been widely studied, little is known about food partitioning and competition among sympatric species, despite these being important forces structuring marine communities. Using stomach content and stable isotope analyses, we investigated diet and trophic levels and evaluated the diet overlap and partitioning of Scyliorhinus canicula, Mustelus mustelus, and M. punctulatus in the northwestern Adriatic Sea. These shark species were confirmed as opportunistic mesopredators, but significant differences in their diets emerged. The two bentho-demersal Mustelus species had a larger trophic overlap with S. canicula than between each other. Given the pronounced morphological similarity of these two Mustelus species, this is likely a strategy to limit competition. The strictly benthic S. canicula showed a more varied diet compared to the other species. Stable isotope analysis highlighted that despite the smaller size and overlapping diets, S. canicula occupied a slightly higher trophic level. A better characterization of the trophic role of these species in the food web of the basin can be obtained from these data. At an ecosystem level, this information is essential to evaluate the possible consequences of the decline or recovery of the population of these exploited species.

1. Introduction

Inter- and intra-specific competition represents an important force in structuring marine communities [1]. By reducing the pressure of competition, resource and food partitioning is the main process allowing for the coexistence of sympatric species or of different life stages of the same species [2,3]. Food partitioning is even more important when co-occurring predatory species have similar morphology (i.e., mouth shape, dentition, and body shape with the associated swimming abilities), habitat usage, and foraging habits (i.e., living and feeding either in the water column or close to the sea bottom). Indeed, similar characteristics allow predators to target and hunt the same prey species [2,4], increasing potential competition. This is particularly the case for congeneric species living in the same community given their low evolutionary divergence and similar specialization [5]. Partitioning can occur along different levels, such as time, space, life stages, and trophic niches [6,7,8]. A better characterization of trophic relationships, energy transfer, resource partitioning, and competition occurrence can improve our understanding of the structure, dynamics, and functioning of marine communities [6,9,10].
Elasmobranchs (sharks, skates, and rays) are key top and mesopredatory species whose predatory activity can be highly influential in marine ecosystems [11,12,13], regulating both fish and invertebrate populations [14]. Mesopredatory elasmobranchs are extremely important because they mediate the changes in community structure and functions caused by the loss of apex predators [15,16]; nevertheless, diet information is often lacking [17]. Despite many species, especially opportunistic feeders, showing a significant dietary geographical variation [18,19], data on diet and trophic relationships are often limited to only a few geographic areas and populations. Even fewer data exist on competition and resource partitioning between co-occurring elasmobranch species [20]. Improved knowledge of the trophic ecology of mesopredatory elasmobranchs, including diet composition, characterization of regional diets, niche breadth, and diet overlap between sympatric species, is necessary. Indeed, this information can provide a better understanding of elasmobranchs’ functional role as top-down regulators in marine communities and of the processes of energy transfer in trophic webs and marine ecosystems. In this context, combining the two commonly used techniques of stomach content and stable isotope analysis is beneficial. This approach can overcome the drawbacks of each technique, i.e., a high number of samples required for stomach content analysis and the low specific and temporal resolution of stable isotope analysis, allowing for a better characterization of the diet and trophic role of the investigated species ([21,22,23], and references within).
The northern Adriatic Sea is one of the most productive [24,25] and fished sub-basins of the Mediterranean Sea [26,27]. Shallow waters and muddy–sandy bottoms characterize the Italian coasts, while deeper waters and rocky substrates typify the Slovenian and Croatian side [25]. This offers suitable habitats to a great variety of species, thus sustaining high biodiversity [26]. Several mesopredatory elasmobranchs co-occur in this region [26,28], many of which have been overfished in the past [26,29]. Among these, three of the most abundant shark species, Mustelus mustelus, M. punctulatus, and Scyliorhinus canicula [28], underwent a severe decline [26,29]. These species share similar benthopelagic habits and a diet composed of mainly crustaceans and, in smaller proportions, teleosts, mollusks, and polychaetes [30,31,32]. S. canicula is a small (up to 50.5 cm; [33]), benthic species that inhabits the continental shelf and uppermost slopes on rocky to sandy bottoms down to a depth of 400 m, where it rests in crevices and holes [30]; therefore, it is more abundant on the eastern side of the study area, which is characterized by rocky substrates [25]. This is an oviparous species that lays eggs throughout the year in the study area and reaches maturity at small sizes (around 40–41 cm; [33]). Due to its sedentary habits, S. canicula resides in the northwestern Adriatic Sea throughout the year [33], although some sexual segregation occurs in the study area, as also reported in other populations [33,34,35]. The two Mustelus species are large (up to 158 and 141 cm for M. mustelus and M. punctulatus, respectively; [36]) viviparous species that reach sexual maturity at large sizes (110–120 cm [36]) and share very similar morphology, life history traits [36,37], and habitats. These congeneric species have a demersal habit and spend most of the time swimming in midwater or, more commonly, near the bottom, down to a depth of 350 m [30]. Both species perform seasonal migrations in the study area, arriving when the water temperature starts to increase (April–May) and leaving when temperatures start to drop (November–December; [36]), moving to the southern part of the basin. The northwestern Adriatic Sea is used as a parturition and mating area, and, at different times, mature pregnant females, mature actively reproducing males, and juveniles and neonates of both sexes can be found [36].
The diet of these three species has been previously investigated in different areas [32,38,39,40,41], also including the northeastern Adriatic Sea [42,43,44,45,46]. Nevertheless, apart from a comparison between the two Mustelus species in the Strait of Sicily [31], no data exist on diet overlap and resource partitioning among these three species. Yet, their co-occurrence and similar morphology and habits suggest that a strong trophic competition might exist. Obtaining in-depth information on their trophic ecology is essential to understand their functional role in the ecosystem and the potential top-down consequences of the observed population decline [15,16]. In this context, this study aimed to (1) better characterize the diet and trophic strategy of these three species in the northwestern Adriatic Sea using stomach content and stable isotope analyses; (2) highlight intra-specific diet differences related to sex, size, or season; and (3) identify potential competition, resource partitioning, or diet overlap between the three species.

2. Materials and Methods

2.1. Stomach Content Analysis

Between 2012 and 2013, 480 specimens (Table 1) of Scyliorhinus canicula (N = 243), Mustelus mustelus (N = 114), and M. punctulatus (N = 123) were sampled from the landings of Chioggia’s fishing fleet operating in the northwestern Adriatic Sea [26,47]. S. canicula was identified based on morphological features while, for Mustelus specimens, the species was genetically attributed following Marino et al. [37]. Sex was attributed according to the presence of claspers in males. Total length and body mass were recorded using a measuring tape (0.5 cm accuracy) and a scale (0.1 kg), respectively. Excised stomachs were preserved in 70% ethanol in seawater. After removing excess ethanol with tissue paper, the total mass of the stomach content was measured with a precision scale (0.01 g). Prey was identified using a stereomicroscope to the lowest possible taxonomic level according to the available identification keys [48,49,50,51,52,53,54,55], counted, and weighed (0.01 g). When only body parts were found, the smallest number of individuals from which the fragments could have originated was recorded. Unidentifiable material was not included in the analysis.
To investigate whether a sufficient number of stomachs were analyzed, cumulative diversity curves were made using the lowest taxonomic level of the prey, separately for each species. Using EstimateS software (version 9.1) [56], the order in which the stomachs were analyzed was randomized 500 times, and the Shannon–Weaver index (H′, mean ± standard deviation; see below for its calculation), a proxy for diet diversity, was plotted against the total number of non-empty stomachs [57]. The presence of an asymptote in the curve indicates that enough stomachs were analyzed [58].
For each stomach, the percent fullness (%fullness), a proxy for feeding intensity [59], was calculated by dividing the total mass of the stomach content by the body mass of the specimen and multiplying by 100. Diet breadth was investigated with two diversity indices; the Shannon–Weaver index (H′; [60]) [61] was calculated as:
H = i = 1 n p i · ln ( p i )
where pi is the amount of prey category i (g) relative to the totality of the prey categories found in the stomach (n). The Pielou index is a proxy for diet evenness, highlighting the potential dominance of few prey categories in the diet (J′; [62]), and was computed as:
J′ = H′/Hmax
where Hmax is the maximum value that H′ can assume, equal to log(S), where S is the total number of prey categories found in the stomach.
For each prey category, the percent frequency of occurrence (%FOi), the prey-specific abundance (%PNi), and the prey-specific weight (%PWi) were calculated as:
%FOi = (ni/N) × 100
where ni is the number of stomachs in which prey category i was found, and N is the total number of non-empty stomachs.
% PN i = ( j = 1 n i   N i j ) / n i
where %Nij is the numerical abundance of prey category I in stomach sample j, and ni is the number of stomachs containing prey category i;
% PW i = ( j = 1 n i   W i j ) / n i
where %Wij is the abundance by weight of prey category i in stomach sample j, and ni is the number of stomachs containing prey category i.
Using these indices, the prey-specific index of relative importance (%PSIRIi) was calculated as [63]:
%PSIRIi = 0.5 × %FOi × (%PNi + %PWi)
To investigate feeding strategies, %PNi was plotted against %FOi [64].
To check for the existence of trophic overlap among each predator pair combination, the simplified Morisita–Horn (M–H) index [65] was computed using %PWi:
M H = ( 2 i = 1 n p ij   p ik ) / ( i = 1 n p ij 2 p ik 2 )
where n is the total number of prey categories, pij is the proportion of the prey category i consumed by predator j, and pik is the proportion of the prey category i consumed by predator k. According to the criteria proposed by Langton [66], an M–H value > 0.6 indicates a high dietary overlap, values ranging from 0.3 to 0.59 correspond to a medium overlap, and values < 0.29 indicate a low overlap.

2.2. Stable Isotope Analysis

From a representative subsample of specimens analyzed for the stomach content (Table 1), about 1 cm3 of white muscle was excised from below the first dorsal fin. Additionally, in spring–summer of 2013, individuals of the dominant prey categories (teleosts, crustaceans, and mollusks) were collected from catches from otter-trawl vessels fishing in the northern Adriatic Sea (Table S4). At least three individuals for each prey category were processed to obtain muscle tissue (about 2 g). For the smallest prey, different samples were pooled and analyzed together.
Muscle samples were oven-dried at 60 °C for 48 h, then ground into a fine powder using a combusted mortar and pestle. Samples were not subjected to lipid extractions since they all had consistently low lipid content (carbon (C): nitrogen (N) < 4.0; [67]). The stable C and N ratios were measured using an Isotope Ratio Mass Spectrometer DeltaV Advantage (Thermo Fisher Scientific, Bremen, Germany) together with a CHN Analyzer Flash 2000 (Thermo Fisher Scientific, Bremen, Germany). The ratio of stable isotopes was expressed in delta (δ) notation:
δ = [(Rsample/Rstandard) − 1)] × 103
where δ is the isotope ratio of the sample relative to the standards (international standard Vienna Pee Dee Belemnite (VPDB) for C and atmospheric nitrogen for N). Rsample is the fraction of heavy to light isotopes in the sample, while Rstandard is the fraction measured in the standard. The multiplication by 1000 is used to express the δ notation as units of parts per thousand (‰). An internal standard (mussel muscle) was analyzed throughout each run and was both accurate and precise (−20.5 ± 0.5‰ for δ13C and 5.7 ± 0.2‰ for δ15N). For both δ13C and δ15N, the analytical precision of measurements was 0.2%. Sucrose IAEA CH6 (International Atomic Energy Agency, Vienna, Austria), L-glutamic acid (RM 8574, National Institute of Standards and Technology, NIST, Gaithersburg, MA, USA), caffeine (National Institute of Standards and Technology, NIST, Gaithersburg, MA, USA), and urea (National Institute of Standards and Technology, NIST, Gaithersburg, MA, USA) were used as certified reference materials.
Using δ15N, the trophic level of species was estimated according to Fortibuoni et al. [68] with an enrichment factor ΔN of 3.4‰. The δ15N value of Adriatic zooplankton (6.6 ‰) used as a baseline for the primary consumer of trophic level one was assumed from Berto, D. (Institute for Environmental Protection and Research (ISPRA), Venice, Italy), unpublished data, 2023.

2.3. Data Analysis

To test differences in diet, three dichotomous factors were taken into consideration: season (warm or cold), sex, and size (small or big). We considered size rather than sexual maturity because, in elasmobranchs, size accounts for dietary ontogenetic shifts and predatory abilities [7,69]. The mean total length observed in the northern Adriatic Sea (males and females combined: 41.5, 92.9, and 76.1 cm for S. canicula, M. mustelus, and M. punctulatus, respectively; [33,36]) was used as a threshold to allocate individuals to the big- or the small-sized group. Species sampled during spring or summer (March–August) were allocated to the warm season group, while those sampled during autumn or winter (September–February) were allocated to the cold season group.
Before analysis, the normality and the homogeneity of variance of the datasets were checked with the Shapiro–Wilk test and Lavene’s test, respectively. If, after transformation, data were not normally distributed, non-normal distributions or non-parametric tests were used. For a better description of the sample and for the interpretation of the results, separately for each species, chi-squared tests were used to investigate differences in the proportion of males and females between the two size groups and between the two seasons and to test differences in the proportion of big and small individuals between the two seasons. Potential differences in %fullness, H’, and J’ between sexes, size groups, and seasons were tested. A linear model was used, including sex, size, and their interaction as fixed factors. Due to the small sample size, a separate linear model was used to test the factor season. Before analysis, an arcsin of the square root transformation of %fullness data was used [70]; for clarity, results were reported as percentages.
A permutational multivariate analysis of variance (PERMANOVA), including sex, size, season, and their interaction, was used to highlight any intraspecific differences in diet [5,71,72,73,74]. The analysis was based on the Bray–Curtis similarity matrix obtained from the square root transformation of the prey biomass data. A non-metric multidimensional scaling (nMDS) was performed to graphically represent the dissimilarity between the different groups [5]. Prior to the analysis, prey categories with %FOi lower than 5% were aggregated in larger categories according to taxonomic and ecological criteria, with the exclusion of prey belonging to species of commercial values or showing high abundance in the diet of one of the species (Table S1). A PERMANOVA test including the factor species (three levels) was used to investigate any interspecific differences in diet composition. To identify differences between species pairs, pairwise PERMANOVA comparisons were performed. A similarity percentage (SIMPER) analysis based on square root transformed biomass data was used to identify the percent dissimilarities between the groups and the percent contribution of the different prey categories to the observed differences [5,71,72,73,74].
Given the lack of normality, potential differences in stable isotope values were investigated using non-parametric Kruskal–Wallis tests. Differences between size groups (big and small) within each species (except for S. canicula) and differences between the three species were tested separately.
Results were reported as mean ± standard deviation (S.D.). A significance level of α = 0.05 was used for the tests. Data were analyzed using R statistical software (version 4.2.2), with lme4 [75], lsmeans [76], and emmeans [77] packages (R Core team 2021) and Statsoft (Ver. 5.0). Multivariate analyses were performed using PRIMER 6 and PERMANOVA+.

3. Results

Of the analyzed stomachs, 35 (14.4%), 12 (10.5%), and 10 (8.1%) contained only parasites (cestodes and nematodes) in Scyliorhinus canicula, Mustelus mustelus, and M. punctulatus, respectively. They were thus considered empty and not included in the analyses. A summary of the total length and of the number of males/females for each species, size group, and season is reported in Table 1 and Figure S1. In M. mustelus, the proportion of males and females in the big- and the small-sized groups significantly differed (χ2 = 13.01, p < 0.001), while it was similar in S. canicula2 = 0.98, p = 0.32) and M. punctulatus2 = 0.10, p = 0.74). In S. canicula, a significantly higher proportion of females was observed in the cold season (χ2 = 13.95, p < 0.001), while the proportion of small and big animals did not differ between seasons (χ2 = 0.65, p = 0.42). All the M. punctulatus specimens and all the big M. mustelus females were sampled only in the warm season; therefore, the factor season was excluded from the analyses for these two species.
The cumulative diversity curves reached an asymptote for the three species, indicating that the number of analyzed stomachs was high enough to describe their diet (Figure 1).

3.1. Intraspecific Analysis

3.1.1. Scyliorhinus canicula

The main taxonomic categories in the diets were crustaceans (%PSIRI = 59.6%) and teleost fishes (25.3%), followed by cephalopods (9.5%) and polychaetes (4.7%; Table S1). In particular, the crustaceans Liocarcinus depurator, unidentified Caridea, unidentified Portunidae, unidentified Brachiura, Liocarcinus sp., and Rissoides desmaresti were the most important prey categories (%PSIRI > 4%; Table S1). S. canicula had a generalist feeding strategy, as almost all prey categories were rare, being present in less than 25% of the analyzed stomachs, and all having a prey-specific abundance (%PN) lower than 50% (Figure 2a). Sex and size, but not their interaction, and season had a significant effect on %fullness; values were higher in females, in small animals, and in the warm season. Size, sex, and their interaction did not have a significant effect on the diversity indices, while H’ and J’ were both significantly higher in the warm season (Table 2). PERMANOVA highlighted significant trophic differences between sexes and seasons, but not between size groups (Table 3; Figure 3a,b). The average diet similarity within males and females was 15.3% and 18.5%, respectively, and the average dissimilarity between sexes was 86.2%. The average similarity within the warm and the cold season was 20.9% and 15.4%, respectively, while the average difference between the two seasons was 82.5%. Table 4 reports the main prey categories contributing to the observed differences.

3.1.2. Mustelus mustelus

This diet was almost exclusively composed of crustaceans (%PSIRI = 95.3%). In particular, Squilla mantis, L. depurator, unidentified Portunidae, Ethusa mascarone, Liocarcinus sp., unidentified Brachiura, and Carcinus aestuarii were the most important prey categories (Table S1). Almost all prey categories were rare; however, S. mantis was present in more than 45% of the stomachs, and L. depurator and unidentified Decapoda had a prey-specific abundance higher than 40% (Figure 2b). This suggests that M. mustelus had mostly a generalist feeding strategy, apart from a weak specialization for the abovementioned prey categories. Size, sex, and their interaction did not have a significant effect on %fullness or the H’ or the J’ index (Table 2). PERMANOVA analysis highlighted the significant effects of the interaction between sex and size and of the factor size (Table 3 and Figure 3c); the pairwise test highlighted that small and big animals were significantly different from one another independently from the sex, but small females and big males did not differ (Table 5); however, only a few big males were sampled (N = 6). The average diet similarity within small and big animals was 25.0% and 42.3%, respectively, while the average dissimilarity between size groups was 77.6% (Table 4; see Table S2 in Supplementary Materials for the results of the interaction between sex and size).

3.1.3. Mustelus punctulatus

This diet was dominated by crustaceans (66.2%), but polychaetes (14.1%), teleosts (9.0%), and cephalopods (8.7%) were also present. According to %PSIRI, unidentified Processidae, Dardanus sp., unidentified Caridea, and Dardanus calidus were the most important prey (Table S1). Almost all prey categories were rare, apart for unidentified polychaetes and unidentified Processidae, which were present in more than 60% and 40% of the stomachs, respectively, and L. depurator and unidentified Processidae, which had a prey-specific abundance approaching 50% and higher than 55%, respectively (Figure 2c). This suggests that M. punctulatus had a weak specialization for polychaetes, L. depurator, and Processidae, and otherwise, a mostly generalist feeding strategy. Size, but neither sex nor their interaction, had a significant effect on %fullness; values for small animals were significantly higher than those measured in big animals. Size, sex, and their interaction did not have a significant effect on H’ or J’ index (Table 2). PERMANOVA analysis highlighted a significant difference in the diet between size groups (Table 3, Figure 3d). The average similarity in the diet within small and big animals was 22.5% and 23.5%, respectively, while the average dissimilarities between size groups was 92.6% (Table 4).

3.2. Interspecific Comparison
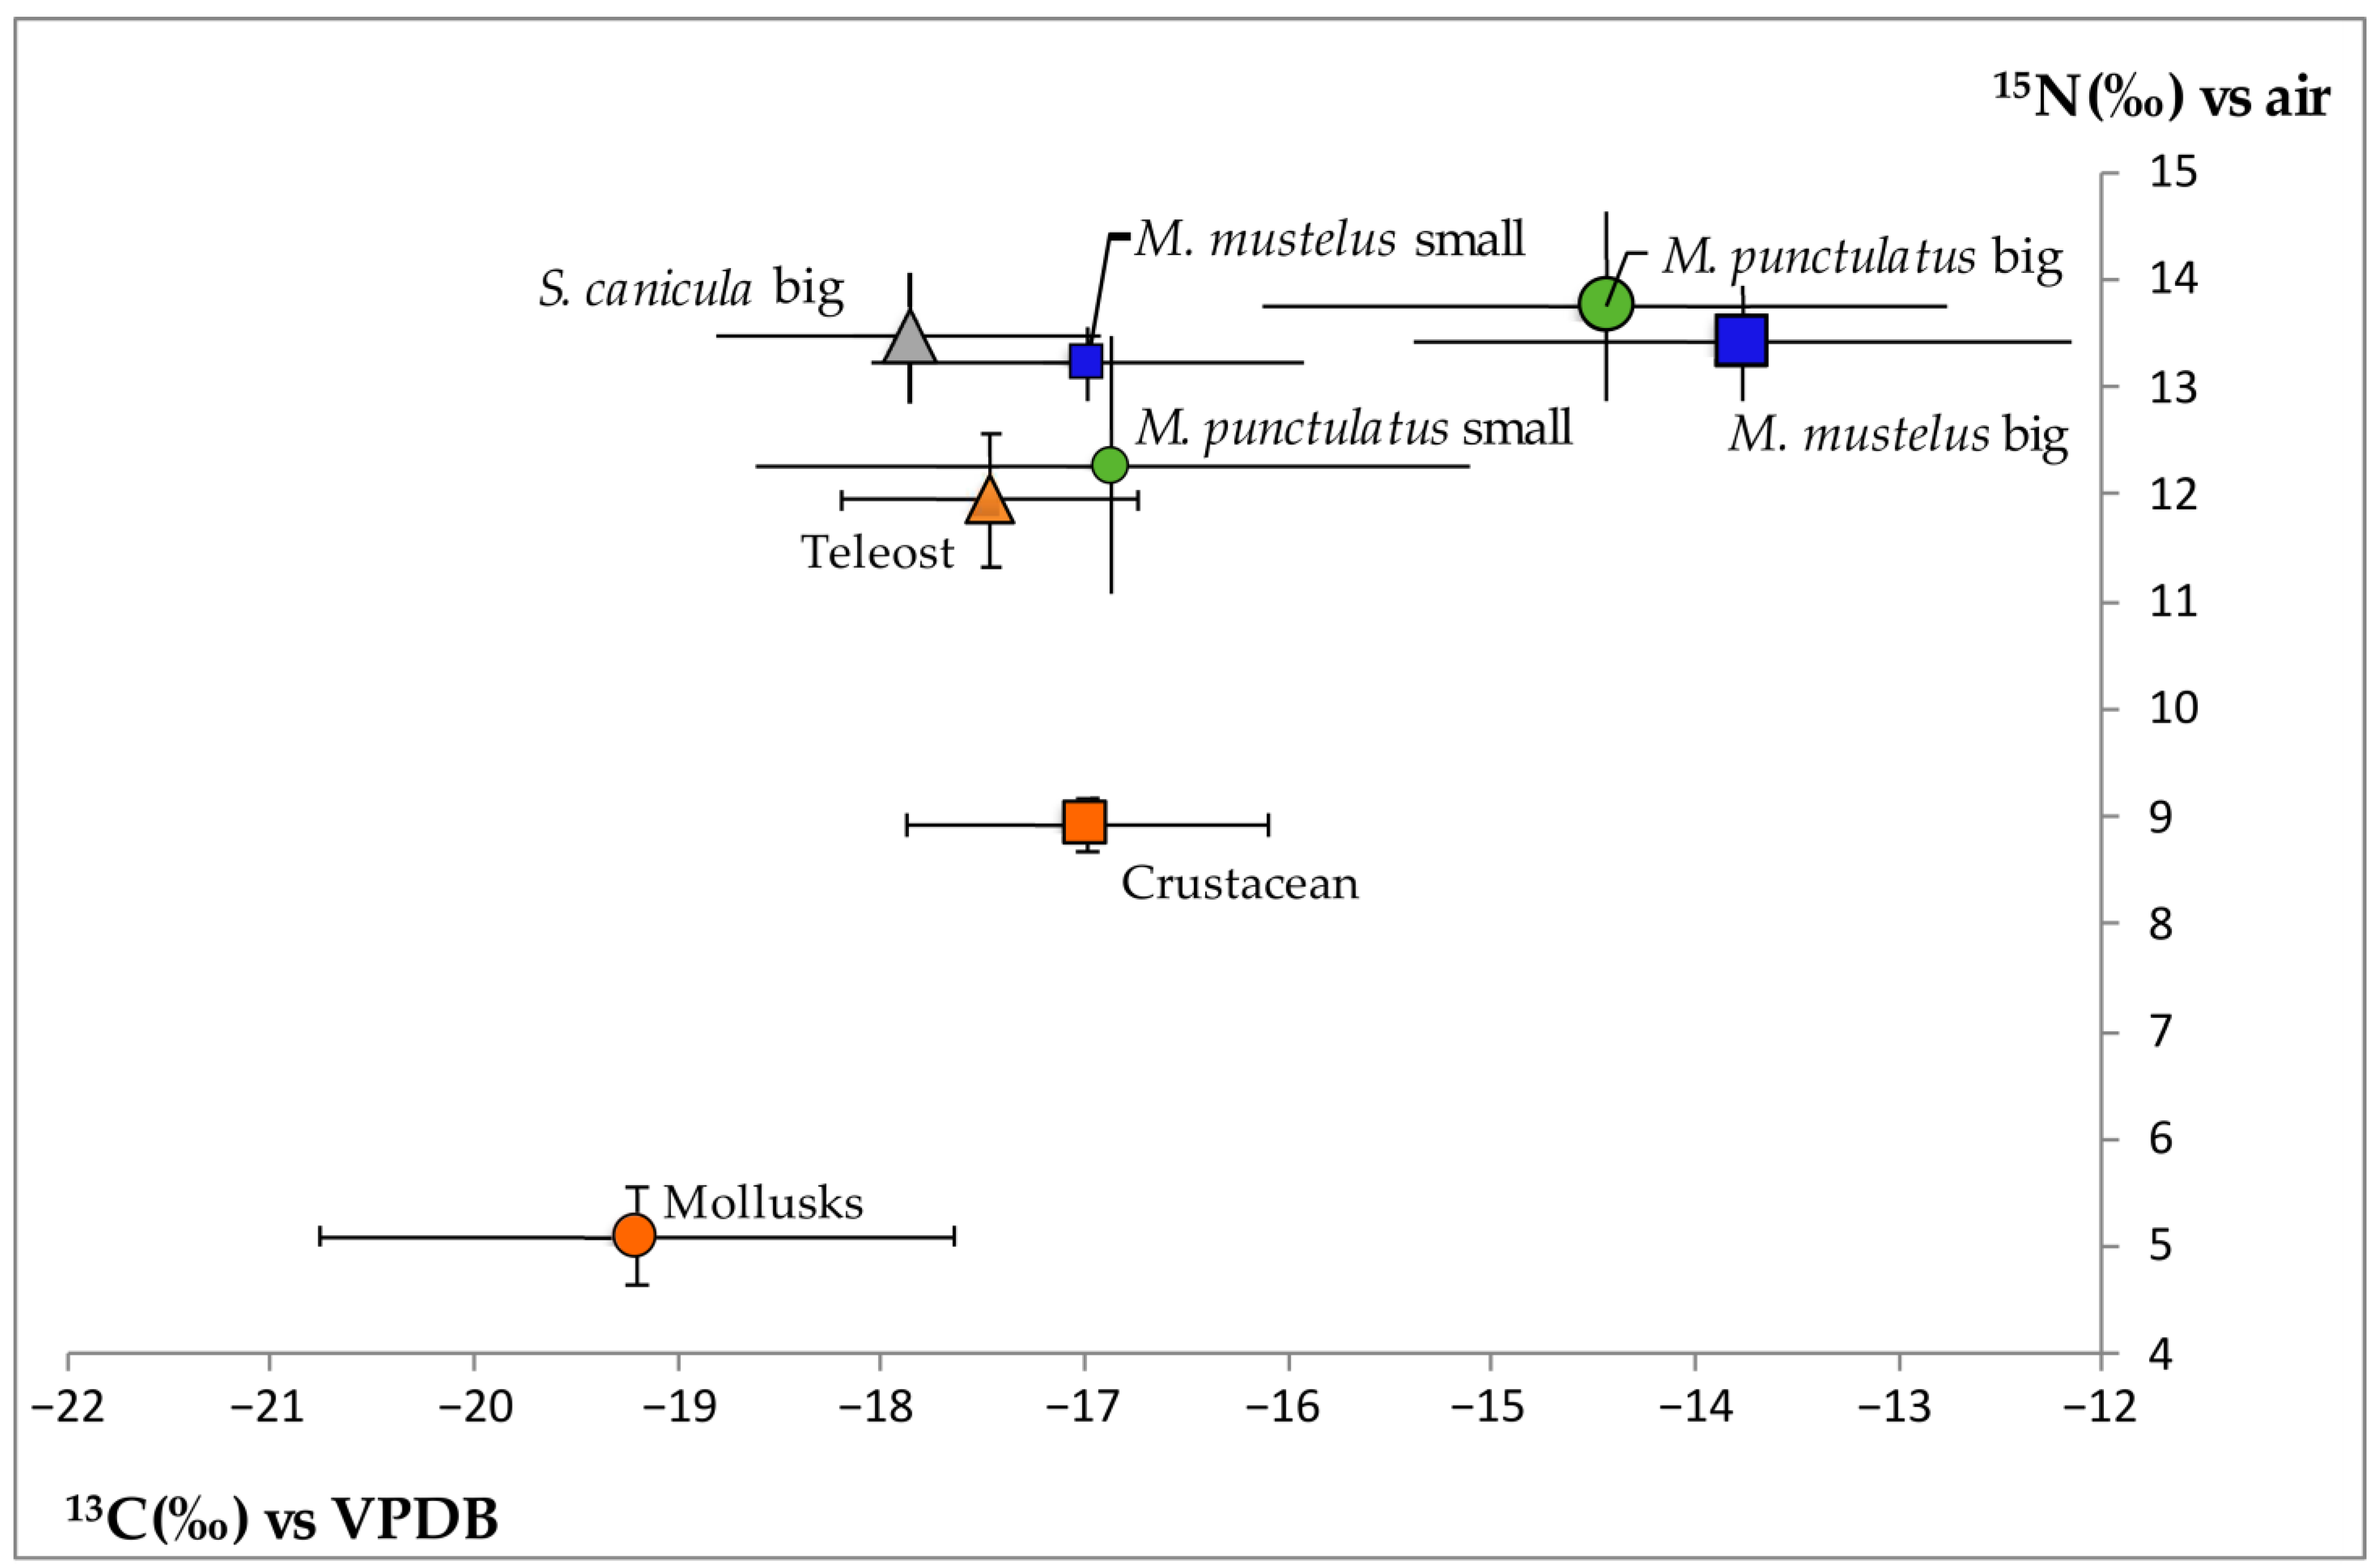
The simplified Morisita–Horn index is equal to 0.71 between the pair S. canicula and M. mustelus, 0.54 between S. canicula and M. punctulatus, and 0.32 between M. mustelus and M. punctulatus. PERMANOVA analysis highlighted a significant difference in the diet between the three species, and the pairwise test showed that all species differed from each other (Figure 4; Table 6). The average diet similarity was 16.1% within S. canicula, 28.3% within M. mustelus, and 17.9% within M. punctulatus. The average dissimilarity was 87.4% between S. canicula and M. mustelus, 89.5% between S. canicula and M. punctulatus, and 91.1% between M. mustelus and M. punctulatus (Table 7).

3.3. Stable Isotope

Variation in average δ15N per species was restricted, ranging from 12.09‰ to 13.59‰; on the opposite, δ13C values ranged from −13.13‰ to −17.60‰ (Figure 5, Table S3). δ15N did not differ significantly among the three species, nor between big- and small-sized individuals for M. mustelus (p > 0.05), while for M. punctulatus, significant differences were observed (H1,23 = 7.111, p = 0.008). No significant differences were found between sexes within species (all p > 0.05). δ13C showed high variation within species (Figure 5, Table S3), presenting significantly higher values (always above −16.00‰) in big individuals of M. punctulatus (H1,21 = 6.788, p = 0.009) and M. mustelus (H1,15 = 9.070, p = 0.003) as compared to the small ones. Pertaining to prey, a decreasing trophic position in the food web was observed from teleosts to crustaceans and mollusks (bivalves), with average δ15N decreasing from 11.85‰ to 8.92‰ and 5.09‰, respectively, while δ13C average values ranged from −17.00‰ to −19.20‰ (Figure 5, Table S4).

4. Discussion

To better characterize the processes structuring communities in the northwestern Adriatic Sea, we investigated the diet and trophic strategy of three of the most abundant shark species in the area, namely Scyliorhinus canicula, Mustelus mustelus, and M. punctulatus. For the first time for the area, we also assessed their trophic positions via stable isotope analysis and investigated their potential diet overlaps and resource partitioning.
This study confirms the important role of the three studied species in the northern Adriatic Sea as mesopredators [31,78] feeding on crustaceans, teleosts, mollusks, and polychaetes. Moreover, the three species were confirmed as generalist predators [79], although the two Mustelus species showed some weak specializations for some prey categories. Despite the general common preponderance of crustaceans in the diet of the three species, some dissimilarities emerged from the comparisons with dietary studies conducted in the Atlantic Ocean [80,81,82,83,84,85,86,87], other areas of the Mediterranean Sea [31,32,40,41,88,89], and even the northeastern Adriatic Sea [42,43,44,45,46,90]. This pronounced geographic variability likely results from the opportunistic foraging strategy of these species, whose diet reflects prey availability in different areas [18,19,32,40,87]. For the northern Adriatic Sea, differences in habitats between the two sides of the basin may account for the reported diet variability. Indeed, the importance of polychaetes in the diet that we observed in the northwestern Adriatic Sea for S. canicula and, especially, M. punctulatus can be attributed to the preponderance of muddy habitats in comparison with the rocky substrates of the eastern side [25].
Feeding intensity (i.e., stomach fullness; [59]) was higher in small S. canicula and M. punctulatus [45], and in female S. canicula. It is likely that both groups require higher amounts of energetic resources: young, small individuals to sustain faster growth rates [91,92], and females to sustain reproduction [32,34]. Stomach fullness was also higher in the warm season in S. canicula, potentially to sustain the faster metabolism associated with higher temperatures [93,94]. S. canicula diet was more diverse and homogeneous in the warm season, likely because of seasonal differences in prey availability [41]. As also reported in other areas [32], the diet of S. canicula differed between sexes. This species shows sexual segregation [34,35], with males and females occupying different habitats and, therefore, feeding on different prey. Alternatively, the sexual dimorphism of teeth and mouth morphology can explain the sexual dietary difference. Males have longer, sharper teeth that are more efficient at capturing soft-bodied prey [95], and indeed, a greater importance of Sepiolidae in the diet of male S. canicula is observed. Contrarily to previous studies [32,34,46], no ontogenetic shifts in diet were highlighted in S. canicula, possibly because of the narrow size range and low number of small animals sampled. Broadening the investigated size ranges could allow for highlighting patterns related to ontogenetic shifts in diet. On the other hand, ontogenetic diet shifts were confirmed in the two Mustelus species [31,41,44,88]. Smaller crustaceans (Ethusa mascarone and Anomura, mostly Dardanus sp. and Processidae) were more or exclusively present in the diet of small animals, while larger (Portunidae, S. mantis, and Brachiura) and faster prey (teleosts and cephalopods) were more abundant in the diet of big animals. In aquatic environments, predation is limited by the mouth gap [96], and as an individual grows, it is able to prey upon larger animals [41] thanks to a greater crushing capacity [87] and stronger bite and suction force [97]. Moreover, as animals grow, their swimming abilities also improve, allowing them to hunt faster animals [98]. In the northwestern Adriatic Sea, big Mustelus co-occur with smaller ones [26,36,37]; therefore, ontogenetic diet shifts are essential in reducing competition, allowing co-occurrence, and increasing survival and fitness [2,3,7].
Although the investigated species are generalist predators, their diets significantly differed. The important crustacean composition of the Mustelus species’ diet [31,38,42,44] conforms to their dentition, presenting molariform teeth with weak cusps fused together at the base, creating a strong plate that can efficiently crush crustacean shells [30]. On the other hand, S. canicula has sharp teeth with two to four lateral cusps, also suitable for holding soft-bodied prey such as teleosts and mollusks [95]. Moreover, S. canicula is a small, benthic, sedentary species that lives mainly on rocky bottoms [30], while the two Mustelus species are larger [36], benthopelagic, active species. These marked ecological and morphological dissimilarities may explain the dietary differences observed between S. canicula and the two Mustelus species. On the other hand, M. mustelus and M. punctulatus co-occur in the same macro-geographic areas, exploit similar habitats, and have overlapping bathymetric distribution [26,99] and very similar morphology [37]; nonetheless, these two species differ in their diet. M. mustelus attains larger sizes [36] and can hunt larger and/or faster prey [96,98,100], as suggested by the higher importance of large crustaceans (Portunidae, S. mantis, and Brachiura) in its diet. Nevertheless, the diets of these two species also differed when larger M. mustelus were excluded from the analysis (Figure S2 and Tables S5 and S6), and therefore, size difference cannot be the only explanation. Despite similar morphology, the mouth and dermal denticles’ shape vary between the two species [37], and preliminary observations suggest that body morphology also differs, including the shape and dimension of the first dorsal, pectoral, and caudal fins [101,102]. Fins are fundamental in determining swimming type, maneuverability, and performance [103,104,105]. Similarly, specific dermal denticles’ morphologies are associated with the enhancement of swimming performance through drag reduction [106,107]. The difference existing in dermal denticles and fin morphology, along with those in mouth shape [108], possibly accounting for different swimming performances and predatory and feeding abilities, could be responsible for the observed diet dissimilarities. This would allow the two species to target different prey and finely differentiate the occupied habitat within the same broad geographic area and benthopelagic zone [103,104,105], as observed in other sympatric Mustelus species [87]. M. mustelus, consuming almost exclusively benthic crustaceans, seems to feed in close proximity to the seabed. On the other hand, M. punctulatus seems to also exploit the water column immediately above the sea bottom, as its diet is mostly composed of benthic prey but also benthopelagic teleost and mollusks.
The observed differentiated diets fit with those predicted by ecological theories for sympatric species; indeed, some degree of differentiation in the diets of species living in the same geographic area and habitat is functional to ensure resource partitioning and reduce the intensity of competition [2,3,7,109,110]. This mechanism could be the basis of the lower similarities between the two congeneric species respective to those with S. canicula. Contrarily, S. canicula has a broader diet, foraging opportunistically on all the variety of prey present in the rocky-bottom habitat it occupies [111], converging in the use of food resources with both Mustelus species without entering in strong competition with them [2,3,7,109]. Indeed, the diet similarity within S. canicula samples is the lowest observed among the three species, with the highest total number of prey taxa identified (Table S1). Both M. mustelus and M. punctulatus showed some, albeit weak, specializations in prey categories, while S. canicula showed none. All these observations seem to support the broad generalist foraging of S. canicula.
The results obtained from stomach content analysis are confirmed by isotope analysis, even considering the relatively limited number of data, especially for prey. The δ15N values of the three species did not reveal significant differences in the trophic position [21,22,23]. In addition, no change for this parameter was observed when size and sex were considered, except for M. punctulactus, and only for size. While this result shows that the three species occupy the same trophic level, δ13C highlights that this condition is mirrored by differences in terms of carbon sources in their diet [21,22,23]. In fact, for this parameter, marked and significant differences were observed between small and big individuals of the Mustelus species, a result that is consistent with the ontogenetic shift observed in these species through stomach content analyses. The direction of such change indicates a shift toward less negative values of δ13C of large-sized specimens. Similar results were reported by Espinoza et al. [112] for other elasmobranch species, in which size was a relevant driver for the changes in δ13C associated with differences in diet composition.
In terms of absolute values, the δ15N observed in the muscle of the three shark species is compatible with the prevalence of crustaceans in their diet and a possible increase of about 3.0–3.4‰ with an increase of one trophic level [113]. However, the relevant prey categories of S. canicula and M. punctulatus also included other taxa, as shown by the stomach data. In this context, the still relatively low proportion of prey presenting either a higher trophic level (such as teleosts) or lower trophic level species (like bivalves) as compared to intermediate levels (crustaceans) could have prevented the emergence of clear differences in the trophic position of the three species. Such a pattern could have also been influenced by the fact that, as reported by Fortibuoni et al. [68], the δ15N of elasmobranchs may present lower values as compared to the actual trophic position of the species due to high levels of urea retained by sharks for osmoregulatory purposes. In terms of δ13C, S. canicula and small Mustelus specimens showed values similar to those observed in their main prey, while larger M. mustelus and M. punctulatus presented higher δ13C values. The higher δ13C estimates for the big-sized individuals reflect an increase of the lighter 12C isotope with respect to the heavier 13C, likely favored by dietary adjustments determined by several factors, such as habitat changes, movement patterns, and predatory capacity. In this regard, it is likely that large-sized Mustelus specimens present a habitat use where prey have a higher incidence of carbon source related to marine productivity processes as compared to the coastal, inshore ones, which are characterized by lower (i.e., more negative) δ13C values [21,22]. Therefore, large-sized specimens have a prevalence of food intake from sources of carbon from the open sea, possibly reflecting an ontogenetic shift in habitat.
Other factors that were not investigated could influence the diet, isotope values, and trophic relationships observed in this study. Isotopic values integrate diet over long periods [21,22,23]; because Mustelus species undertake seasonal migrations [36], their isotopic values could be influenced by the prey consumed during the period spent outside the study area. On the other hand, as stomach content analysis reflects more closely the prey consumed in a short period of time [21,22,23], the results obtained from this technique reliably represent the diet of the species in the study area. However, the results of the stomach content analysis accord with those of the stable isotope analysis, suggesting that these species also feed on prey with similar trophic levels outside the study area. Nevertheless, broadening the spatial scale of the assessment could further allow for distinguishing patterns related to changes in habitat use. The different bentho-demersal communities present in the habitats occupied by S. canicula and the Mustelus species could also have influenced the observed trophic partitioning [18,19,32,40,87]. However, refined information on small-scale distributions of prey species is not yet available. Finally, other mesopredatory bentho-demersal elasmobranchs could compete with the investigated species and influence the trophic relationships in the area. Indeed, several shark (S. stellaris and Squalus acanthias), skate (Raja clavata and R. asterias), and ray species (Pteroplatytrygon violacea, Dasyatis pastinaca, Myliobatis aquila, and Aetomylaeus bovinus) are abundant in the northwestern Adriatic Sea [26,28], and some of them, at least in other areas, show similar diets to those of the species investigated in this study [74,114,115,116,117]. Improving the knowledge of the diet of these species in the area will better characterize the trophic and community dynamics of the basin.

5. Conclusions

Our study confirmed the important mesopredatory role of the three investigated shark species, simultaneously highlighting some unexpected resource partitioning and, at the same time, trophic similarities between them. Given that most of the elasmobranch species living in the northern Adriatic Sea are exposed to high fishing pressures [26] and have undergone severe declines [26,29], further research is needed. Ultimately, these data should be used in ecosystem models aimed at investigating potential top-down consequences of the decline of these species [26].

Supplementary Materials

The following supporting information can be downloaded at: https://www.mdpi.com/article/10.3390/d15121163/s1, Figure S1: Length frequency distribution of the samples for each species; Figure S2: Non-metric multidimensional scaling ordination of dietary composition by biomass of small sized M. mustelus and M. punctulatus; Table S1: List of all prey categories from the stomachs of the three elasmobranch species; Table S2: Results of the SIMPER analysis in M. mustelus; Table S3: Carbon and nitrogen stable isotopes ratios; Table S4: Carbon and nitrogen stable isotopes ratios and estimated trophic value of the main prey items; Table S5: Results of permutational multivariate analysis of variance on the dietary composition by biomass of small sized M. mustelus and M. punctulatus. Table S6. Results of the SIMPER analysis in small sized M. mustelus and M. punctulatus.

Author Contributions

Conceptualization: L.F., C.M. and D.B.; Methodology: L.F., D.B. and F.R.; Data collection: L.F., D.B. and F.R.; Data analysis: L.F., D.B., F.R. and S.R.; Investigation: L.F., D.B. and F.R.; Writing—original draft preparation: L.F.; Writing—review and editing: D.B., F.R., S.B., S.R. and C.M.; Supervision: C.M.; Funding acquisition: C.M. and D.B. All authors have read and agreed to the published version of the manuscript.

Funding

This research was supported by funding from the Ministero dell’Istruzione, dell’Università e della Ricerca (MIUR) to CM.

Institutional Review Board Statement

Ethical review and approval were not required for this study since all the specimens were obtained from the catches of a commercial fishery and were not sacrificed to achieve the purposes of this study.

Data Availability Statement

Publicly available datasets were analyzed in this study. This data can be found in the figshare repository at: https://doi.org/10.6084/m9.figshare.24299407.

Acknowledgments

We wish to thank all the fishers who provided samples, as well as F. Badalamenti for advice in the sample collection.

Conflicts of Interest

The authors declare no conflict of interest.

References

  1. Krebs, C.J. Ecology; Benjamin Cummings: San Francisco, CA, USA, 2001. [Google Scholar]
  2. Langeland, A.; L’abée-lund, J.H.; Jonsson, B.; Jonsson, N. Resource partitioning and niche shift in Arctic charr Savelinus alpinus and brown trout Salmo trutta. J. Anim. Ecol. 1991, 60, 895–912. [Google Scholar] [CrossRef]
  3. Ross, S.T. Resource partitioning in fish assemblages: A review of field studies. Copeia 1986, 1986, 352–388. [Google Scholar] [CrossRef]
  4. Sibbing, F.A.; Nagelkerke, L.A.J. Resource partitioning by Lake Tana barbs predicted from fish morphometrics and prey characteristics. Rev. Fish Biol. Fish. 2001, 10, 393–437. [Google Scholar] [CrossRef]
  5. Fanelli, E.; Badalamenti, F.; D’Anna, G.; Pipitone, C.; Riginella, E.; Azzurro, E. Food partitioning and diet temporal variation in two coexisting sparids, Pagellus erythrinus and Pagellus acarne. J. Fish Biol. 2011, 78, 869–900. [Google Scholar] [CrossRef] [PubMed]
  6. Bornatowski, H.; Navia, A.F.; Braga, R.R.; Abilhoa, V.; Corrêa, M.F.M. Ecological importance of sharks and rays in a structural foodweb analysis in southern Brazil. ICES J. Mar. Sci. 2014, 71, 1586–1592. [Google Scholar] [CrossRef]
  7. Papastamatiou, Y.P.; Wetherbee, B.M.; Lowe, C.J.; Crow, G.L. Distribution and diet of four species of carcharhinid shark in the Hawaiian Islands: Evidence for resource partitioning and competitive exclusion. Mar. Ecol. Prog. Ser. 2006, 320, 239–251. [Google Scholar] [CrossRef]
  8. White, W.T.; Platell, M.E.; Potter, I.C. Comparisons between the diets of four abundant species of elasmobranchs in a subtropical embayment: Implications for resource partitioning. Mar. Biol. 2004, 144, 439–448. [Google Scholar] [CrossRef]
  9. Bizzarro, J.J.; Carlisle, A.B.; Smith, W.D.; Cortés, E. Diet composition and trophic ecology of Northeast Pacific Ocean sharks. Adv. Mar. Biol. 2017, 77, 111–148. [Google Scholar]
  10. Navia, A.F.; Cortés, E.; Mejía-Falla, P. Topological analysis of the ecological importance of elasmobranch fishes: A food web study on the Gulf of Tortugas, Colombia. Ecol. Model. 2010, 221, 2918–2926. [Google Scholar] [CrossRef]
  11. Cortés, E. Standardized diet compositions and trophic levels of sharks. J. Mar. Sci. 1999, 56, 707–717. [Google Scholar] [CrossRef]
  12. Heithaus, M.R. Predator–prey interactions. In Biology of Sharks and Their Relatives; Carrier, C., Musick, J.A., Heithaus, M.R., Eds.; CRC Press: Boca Raton, FL, USA, 2004. [Google Scholar]
  13. Lucas, Z.; Stobo, W.T. Shark inflicted mortality on a population of harbour seals (Phoca vitulina) at Sable Island, Nova Scotia. J. Zool. 2000, 252, 405–414. [Google Scholar] [CrossRef]
  14. Ellis, J.R.; Pawson, M.G.; Shackley, S.E. The comparative feeding ecology of six species of shark and four species of ray (Elasmobranchii) in the North-East Atlantic. J. Mar. Biol. Assoc. UK 1996, 76, 89–106. [Google Scholar] [CrossRef]
  15. Ferretti, F.; Worm, B.; Britten, G.L.; Heithaus, M.R.; Lotze, H.K. Patterns and ecosystem consequences of shark declines in the ocean. Ecol. Lett. 2010, 13, 1055–1071. [Google Scholar] [CrossRef] [PubMed]
  16. Ritchie, E.G.; Johnson, C.N. Predator interactions, mesopredator release and biodiversity conservation. Ecol. Lett. 2009, 12, 982–998. [Google Scholar] [CrossRef]
  17. Jacobsen, I.P.; Bennett, M.B. A comparative analysis of feeding and trophic level ecology in stingrays (Rajiformes: Myliobatoidei) and electric rays (Rajiformes: Torpedinoidei). PLoS ONE 2013, 8, e71348. [Google Scholar] [CrossRef]
  18. Ebert, D.A.; Cowley, P.D. Diet, feeding behaviour and habitat utilisation of the blue stingray Dasyatis chrysonata (Smith, 1828) in south African waters. Mar. Freshw. Res. 2003, 54, 957–965. [Google Scholar] [CrossRef]
  19. Munroe, S.E.M.; Heupel, M.R.; Aaron, T.; Fisk, A.; Simpfendorfer, C.A. Geographic and temporal variation in the trophic ecology of a small bodied shark: Evidence of resilience to environmental change. Can. J. Fish. Aquat. Sci. 2015, 72, 343–351. [Google Scholar] [CrossRef]
  20. Valls, M.; Quetglas, A.; Ordines, F.; Moranta, J. Feeding ecology of demersal elasmobranchs from the shelf and slope off the Balearic Sea (western Mediterranean). Sci. Mar. 2011, 75, 633–639. [Google Scholar] [CrossRef]
  21. Chipps, S.R.; Garvey, J.E. Assessment of food habits and feeding patterns. In Analysis and Interpretation of Freshwater Fisheries Data; Guy, C.S., Brown, M.L., Eds.; American Fisheries Society: Bethesda, MD, USA, 2007. [Google Scholar]
  22. Shiffman, D.S.; Gallagher, A.J.; Boyle, M.D.; Hammerschlag-Peyer, C.M.; Hammerschlag, N. Stable isotope analysis as a tool for elasmobranch conservation research: A primer for non-specialists. Mar. Freshw. Res. 2012, 63, 635–643. [Google Scholar] [CrossRef]
  23. Barría, C.; Coll, M.; Navarro, J. Unravelling the ecological role and trophic relationships of uncommon and threatened elasmobranchs in the western Mediterranean Sea. Mar. Ecol. Prog. Ser. 2015, 539, 225–240. [Google Scholar] [CrossRef]
  24. Fonda Umani, S. Pelagic production and biomass in the Adriatic Sea. Sci. Mar. 1996, 60, 6–77. [Google Scholar]
  25. Giani, M.; Djakovac, T.; Degobbis, D.; Cozzi, S.; Solidoro, C.; Fonda Umani, S. Recent changes in the marine ecosystems of the northern Adriatic Sea. Estuar. Coast. Shelf Sci. 2012, 115, 1–13. [Google Scholar] [CrossRef]
  26. Barausse, A.; Correale, V.; Curkovic, A.; Finotto, L.; Riginella, E.; Visentin, E.; Mazzoldi, C. The role of fisheries and the environment in driving the decline of elasmobranchs in the Northern Adriatic Sea. ICES J. Mar. Sci. 2014, 71, 1593–1603. [Google Scholar] [CrossRef]
  27. Fortibuoni, T.; Giovanardi, O.; Pranovi, F.; Raicevich, S.; Solidoro, C.; Libralato, S. Analysis of long-term changes in a Mediterranean marine ecosystem based on fishery landings. Front. Mar. Sci. 2017, 4, 33. [Google Scholar] [CrossRef]
  28. Relini, G.; Mannini, A.; De Ranieri, S.; Bitetto, I.; Follesa, M.C.; Gancitano, V.; Manfredi, C.; Casciaro, L.; Sion, L. Chondrichthyes caught during the MEDITS surveys in Italian waters. Biol. Mar. Mediterr. 2010, 17, 186–204. [Google Scholar]
  29. Ferretti, F.; Osio, G.C.; Jenkins, C.J.; Rosenberg, A.A.; Lotze, H.K. Long-term change in a meso-predator community in response to prolonged and heterogeneous human impact. Sci. Rep. Cetacean Res. 2013, 3, 1057. [Google Scholar] [CrossRef] [PubMed]
  30. Compagno, L.J.V. Sharks of the World: An Annotated and Illustrated Catalogue of Shark Species Known to Date, Part 2, Carcharhiniformes; FAO: Rome, Italy, 1984. [Google Scholar]
  31. Di Lorenzo, M.; Vizzini, S.; Signa, G.; Andolina, C.; Palo, G.B.; Gristina, M.; Mazzoldi, C.; Colloca, F. Ontogenetic trophic segregation between two threatened smoothhound sharks in the Central Mediterranean Sea. Sci. Rep. 2020, 10, 11011. [Google Scholar] [CrossRef]
  32. Kousteni, V.; Karachle, P.K.; Megalofonou, P. Diet of the small-spotted catshark Scyliorhinus canicula in the Aegean Sea (eastern Mediterranean). Mar. Biol. Res. 2017, 13, 161–173. [Google Scholar] [CrossRef]
  33. Finotto, L.; Gristina, M.; Garofalo, G.; Riginella, E.; Mazzoldi, C. Contrasting life history and reproductive traits in two populations of Scyliorhinus canicula. Mar. Biol. 2015, 162, 1175–1186. [Google Scholar] [CrossRef]
  34. Rodríguez-Cabello, C.; Sánchez, F.; Olaso, I. Distribution patterns and sexual segregations of Scyliorhinus canicula (L.) in the Cantabrian Sea. J. Fish Biol. 2007, 70, 1568–1586. [Google Scholar] [CrossRef]
  35. Sims, D.W. Differences in habitat selection and reproductive strategies of male and female sharks. In Sexual Segregation in Vertebrates: Ecology of the Two Sexes; Ruckstuhl, K.E., Neuhaus, P., Eds.; Cambridge University Press: Cambridge, UK, 2005; p. 488. [Google Scholar]
  36. Riginella, E.; Correale, V.; Marino, I.A.M.; Rasotto, M.B.; Vrbatovic, A.; Zane, L.; Mazzoldi, C. Contrasting life-history traits of two sympatric smooth-hound species: Implication for vulnerability. J. Fish Biol. 2020, 96, 853–857. [Google Scholar] [CrossRef]
  37. Marino, I.A.M.; Finotto, L.; Colloca, F.; Di Lorenzo, M.; Gristina, M.; Farrell, E.D.; Zane, L.; Mazzoldi, C. Resolving the ambiguities in the identification of two smooth-hound sharks (Mustelus mustelus and Mustelus punctulatus) using genetics and morphology. Mar. Biodivers. 2018, 48, 1551–1562. [Google Scholar] [CrossRef]
  38. Filiz, H. Diet composition of smooth-hound, Mustelus mustelus (Linnaeus, 1758), in Aegean Sea, Turkey. Belg. J. Zool. 2009, 139, 81–84. [Google Scholar]
  39. Gravino, F.; Dimech, M.; Schembri, P.J. Feeding Habits of the Small-Spotted Catshark Scyliorhinus Canicula (L. 1758) in the Central Mediterranean. Paper presented at the Rapport du Congrès de la Commission Internationale pour l’Exploration Scientifique de la Mer Méditerranée. CIESM Meet. Rapp. Comm. Int. Mer Médit. 2010, 39, 1. [Google Scholar]
  40. Saïdi, B.; Bradaï, M.N.; Bouaïn, A. Reproductive biology and diet of Mustelus punctulatus (Risso, 1826) (Chondrichthyes: Triakidae) from the Gulf of Gabès, central Mediterranean Sea. Sci. Mar. 2009, 73, 249–258. [Google Scholar] [CrossRef]
  41. Saïdi, B.; Enajjar, S.; Bradaï, M.N.; Bouaïn, A. Diet composition of smooth-hound shark, Mustelus mustelus (Linnaeus, 1758), in the Gulf of Gabès, southern Tunisia. J. Appl. Ichthyol. 2009, 25, 113–118. [Google Scholar] [CrossRef]
  42. Gračan, R.; Mladineo, I.; Lazar, B. Insight into the diet composition and gastrointestinal parasite community of the common smooth-hound, Mustelus mustelus (Carcharhiniformes: Triakidae), in the northern Adriatic Sea. Nat. Croat. 2014, 23, 35–44. [Google Scholar]
  43. Jardas, I.; Šantić, M.; Nerlović, N.; Pallaoro, A. Diet composition of blackspotted smooth-hound, Mustelus punctulatus (Risso, 1826), in the eastern Adriatic Sea. J. Appl. Ichthyol. 2007, 23, 279–281. [Google Scholar] [CrossRef]
  44. Jardas, I.; Šantić, M.; Nerlović, N.; Pallaoro, A. Diet of the smooth-hound, Mustelus mustelus (Chondrichthyes: Triakidae), in the eastern Adriatic Sea. Cybium Int. J. Ichthyol. 2007, 31, 459–464. [Google Scholar]
  45. Lipej, L.; Mavrič, B.; Rešek, S.; Chérif, M.; Capapé, C. Food and feeding habits of the blackspotted smooth-hound, Mustelus punctulatus (Elasmobranchii: Carcharhiniformes: Triakidae), from the northern Adriatic. Acta Ichthyol. Piscat. 2011, 41, 171–177. [Google Scholar] [CrossRef]
  46. Šantić, M.; Rađa, B.; Pallaoro, A. Feeding habits of small-spotted catshark (Scyliorhinus canicula Linnaeus, 1758) from the eastern central Adriatic Sea. Mar. Biol. Res. 2012, 8, 1003–1011. [Google Scholar] [CrossRef]
  47. Barausse, A.; Michieli, A.; Riginella, E.; Palmeri, L.; Mazzoldi, C. Long-term changes in community composition and lifehistory traits in a highly exploited basin (northern Adriatic Sea): The role of environment and anthropogenic pressures. J. Fish Biol. 2011, 79, 1453–1486. [Google Scholar] [CrossRef]
  48. AFORO. Available online: http://aforo.cmima.csic.es/index.jsp (accessed on 14 July 2023).
  49. Falciai, L.; Minervini, R. Guida dei Crostacei Decapodi d’Europa; Franco Muzzio Editore: Padova, Italy, 1992; p. 282. [Google Scholar]
  50. Fischer, W.; Bauchot, M.L.; Schneider, M. Fiches FAO D’identification des Espèces Pour les Besoins de la Pêche. Méditerranée et Mer Noire. Zone de Pêche 37 (Vol. Volume I. Végétaux et Invertébrés); FAO: Rome, Italy, 1987. [Google Scholar]
  51. Louisy, P. Guida all’identificazione dei Pesci Marini d’Europa e del Mediterraneo. (Ed. italiana a cura di Trainito E.); Il Castello: Perugia, Italy, 2006. [Google Scholar]
  52. Riedl, R. Fauna e Flora del Mediterraneo; Franco Muzzio Editore: Padova, Italy, 1991. [Google Scholar]
  53. Šoljan, T. I pesci dell’Adriatico; Arnoldo Mondadori Editore: Verona, Italy, 1975. [Google Scholar]
  54. Tortonese, E.; Lanza, B. Piccola Fauna Italiana: Pesci, Anfibi e Rettili; Martello Editore: Milano, Italy, 1968. [Google Scholar]
  55. Whitehead, P.J.P.; Bauchot, M.L.; Hureau, J.C.; Nielsen, J.; Tortonese, E. Fishes of the North-Eastern Atlantic and Mediterranean (Vol. 1, 2, 3); UNESCO: Paris, France, 1986. [Google Scholar]
  56. Colwell, R.K.; EstimateS: Statistical Estimation of Species Richness and Shared Species from Samples. Version 9. Available online: http://purl.oclc.org/estimates (accessed on 14 July 2023).
  57. Bizzarro, J.J.; Robison, H.J.; Rinewalt, C.S.; Ebert, D.A. Comparative feeding ecology of four sympatric skate species off central California, USA. Environ. Biol. Fishes 2007, 80, 197–220. [Google Scholar] [CrossRef]
  58. Ferry, L.A.; Cailliet, G.M. Sample Size and Data Analysis: Are We Characterizing and Comparing Diet Properly? In Proceedings of the Feeding Ecology and Nutrition in Fish, Symposium Proceedings, San Francisco, CA, USA, 14–18 July 1996. [Google Scholar]
  59. Hyslop, E.J. Stomach contents analysis—A review of methods and their application. J. Fish Biol. 1980, 17, 411–429. [Google Scholar] [CrossRef]
  60. Shannon, C.E.; Weaver, W. The Mathematical Theory of Communication; Urbans, University of Illionis Press: Champaign, IL, USA, 1949. [Google Scholar]
  61. Fanelli, E.; Badalamenti, F.; D’Anna, G.; Pipitone, C.; Romano, C. Trophodynamic effects of trawling on the feeding ecology of pandora, Pagellus erythrinus, off the northern Sicily coast (Mediterranean Sea). Mar. Freshw. Res. 2010, 61, 408–417. [Google Scholar] [CrossRef]
  62. Pielou, E.C. The measurement of diversity in different types of biological collections. J. Theor. Biol. 1966, 13, 131–144. [Google Scholar] [CrossRef]
  63. Brown, S.C.; Bizzarro, J.J.; Cailliet, G.M.; Ebert, D.A. Breaking with tradition: Redefining measures for diet description with a case study of the Aleutian skate Bathyraja aleutica (Gilbert 1896). Environ. Biol. Fishes 2012, 95, 3–20. [Google Scholar] [CrossRef]
  64. Amundsen, P.A.; Gabler, H.M.; Staldvik, F.J. A new approach to graphical analysis of feeding strategy from stomach contents data—Modification of the Costello (1990) method. J. Fish Biol. 1996, 48, 607–614. [Google Scholar] [CrossRef]
  65. Krebs, C.J. Ecological Methodology; Harper & Row Publishers: New York, NY, USA, 1989. [Google Scholar]
  66. Langton, R.S. Diet overlap between the Atlantic cod, Gadus morhua, silver hake, Merluccius bilinearis and fifteen other northwest Atlantic finfish. Fish. Bull.-Natl. Ocean. Atmos. Adm. 1982, 80, 745–759. [Google Scholar]
  67. Ehrich, D.; Tarroux, A.; Stien, J.; Lecomte, N.; Killengreen, S.; Berteaux, D.; Yoccoz, N.G. Stable isotope analysis: Modelling lipid normalization for muscle and eggs from arctic mammals and birds. Methods Ecol. Evol. 2011, 2, 66–76. [Google Scholar] [CrossRef]
  68. Fortibuoni, T.; Noventa, S.; Rampazzo, F.; Gion, C.; Formalewicz, M.; Berto, D.; Raicevich, S. Evidences of butyltins biomagnification along the Northern Adriatic food web (Mediterranean Sea) elucidated by stable isotopes ratios. Environ. Sci. Technol. 2013, 47, 3370–3377. [Google Scholar] [CrossRef] [PubMed]
  69. Simpfendorfer, C.A.; Goodreid, A.B.; McAuley, R.B. Size, sex and geographic variation in the diet of the tiger shark, Galeocerdo cuvier, from Western Australian waters. Environ. Biol. Fishes 2001, 61, 37–46. [Google Scholar] [CrossRef]
  70. Gotelli, N.J.; Ellison, A.M. A Primer of Ecological Statistics, 2nd ed.; Sinauer Associates, Inc.: Sunderland, MA, USA, 2004. [Google Scholar]
  71. Yemisken, E.; Forero, M.G.; Megalofonou, P.; Eryilmaz, L.; Navarro, J. Feeding habits of three Batoids in the Levantine Sea (north-eastern Mediterranean Sea) based on stomach content and isotopic data. J. Mar. Biol. Assoc. UK 2017, 98, 89–96. [Google Scholar] [CrossRef]
  72. Pagliarini, C.D.; da Silva Riberiro, C.; Spada, L.; Delariva, R.L.; Araújo Chagas, J.M.; dos Anjos, L.A.; Ramos, I.P. Trophic ecology and metabolism of two species of nonnative freshwater stingrays (Chondrichthyes: Potamotrygonidae). Hydrobiologia 2020, 847, 2895–2908. [Google Scholar] [CrossRef]
  73. Gonzalez-Pestana, A.; Silva-Garay, L.; Quiñones, J.; Mayaute, L.; Manrique, M.; Segura-Cobeña, E.; Espinoza, P.; Moscoso, V.; Vélez-Zuazo, X.; Alfaro-Shigueto, J.; et al. Geographic and ontogenetic variation in the diet of two commonly exploited batoids (Chilean eagle ray and Pacific guitarfish) off Peru: Evidence of trophic plasticity. Environ. Biol. Fishes 2021, 104, 1525–1540. [Google Scholar] [CrossRef]
  74. Fanelli, E.; Da Ros, Z.; Martino, I.; Azzurro, E.; Bargione, G.; Donato, F.; Lucchetti, A. Crowding in the middle of marine food webs: A focus on Raja asterias and other mediterranean batoids. Mar. Environ. Res. 2022, 183, 105830. [Google Scholar] [CrossRef] [PubMed]
  75. Bates, D.; Maechler, M.; Bolker, B.; Walker, S. Fitting linear mixed-effects models using lme4. J. Stat. Softw. 2015, 67, 1–48. [Google Scholar] [CrossRef]
  76. Lenth, R.V. Least-Squares Means: The R Package lsmeans. J. Stat. Softw. 2016, 69, 1–33. [Google Scholar] [CrossRef]
  77. Lenth, R.V. Emmeans: Estimated Marginal Means, aka Least-Squares Means. Available online: https://CRAN.R-project.org/package=emmeans (accessed on 14 July 2023).
  78. Wieczorek, A.M.; Power, A.M.; Browne, P.; Graham, C.T. Stable-isotope analysis reveals the importance of soft-bodied prey in the diet of lesser spotted dogfish Scyliorhinus canicula. J. Fish Biol. 2017, 93, 685–693. [Google Scholar] [CrossRef]
  79. Olaso, I.; Sánchez, F.; Rodríguez-Cabello, C.; Velasco, F. The feeding behaviour of some demersal fish species in response to artificial discarding. Sci. Mar. 2002, 66, 301–311. [Google Scholar] [CrossRef]
  80. Eales, N.B. The food of the dogfish, Scyliorhinus caniculus L. J. Mar. Biol. Assoc. UK 1949, 28, 791–793. [Google Scholar] [CrossRef]
  81. Henderson, A.C.; Dunne, J. Food of the lesser-spotted dogfish Scyliorhinus canicula (L.) in Galway Bay. Ir. Nat. J. 1999, 26, 191–194. [Google Scholar]
  82. Martinho, F.; Sá, C.; Falcão, J.; Cabral, H.N.; Pardal, M.A. Comparative feeding ecology of two elasmobranch species, Squalus blainville and Scyliorhinus canicula, off the coast of Portugal. Fish. Bull. 2012, 110, 71–84. [Google Scholar]
  83. Olaso, I.; Velasco, F.; Pérez, N. Importance of discarded blue whiting (Micromesistius poutassou) in the diet of lesser spotted dogfish (Scyliorhinus canicula) in the Cantabrian Sea. ICES J. Mar. Sci. 1998, 55, 331–341. [Google Scholar] [CrossRef]
  84. Olaso, I.; Velasco, F.; Sánchez, F.; Serrano, A.; Rodríguez-Cabello, C.; Cendrero, D. Trophic relations of lesser-spotted catshark (Scyliorhinus canicula) and blackmouth catshark (Galeus melastomus) in the Cantabrian Sea. J. Northwest Atl. Fish. Sci. 2005, 36, 481–494. [Google Scholar] [CrossRef]
  85. Saldanha, L.; Almeida, A.J.; Andrade, F.; Guerreiro, J. Observations on the diet of some slope dwelling fishes of southern Portugal. Int. Rev. Der Gesamten Hydrobiol. Hydrogr. 1995, 80, 217–234. [Google Scholar] [CrossRef]
  86. Serrano, A.; Velasco, F.; Olaso, I.; Sánchez, F. Macrobenthic crustaceans in the diet of demersal fish in the Bay of Biscay in relation to abundance in the environment. Sarsia 2003, 88, 36–48. [Google Scholar] [CrossRef]
  87. Smale, M.J.; Compagno, L.J.V. Life history and diet of two southern African smoothhound sharks, Mustelus mustelus (Linnaeus, 1758) and Mustelus palumbes Smith, 1957 (Pisces: Triakidae). S. Afr. J. Mar. Sci. 1997, 18, 229–248. [Google Scholar] [CrossRef]
  88. Kara, A.F.; Al Hajaji, M.; Ghmati, H.; Shakman, E.A. Food and feeding habits of Mustelus mustelus (Linnaeus, 1758) (Chondrichthyes: Triakidae) along the Western coast of Libya. Ann. Ser. Hist. Nat. 2019, 29, 197–204. [Google Scholar] [CrossRef]
  89. Karachle, P.K.; Stergiou, K.I. Food and Feeding Habits of Nine Elasmobranch Species in the Aegean Sea. Rapp. Comm. Int. Mer. Médit. 2010, 39, 553. [Google Scholar]
  90. Jardas, I. Supplement to the knowledge of ecology of some Adriatic cartilaginous fishes (Chondrichthyes) with special reference to nutrition. Act. Adriat. 1972, 14, 1–60. [Google Scholar]
  91. Boscolo Palo, G.; Di Lorenzo, M.; Gancitano, S.; Ragonese, S.; Mazzoldi, C.; Colloca, F. Sharks do not always grow slowly: Tagging data reveal a different pattern of growth, longevity and maturity for threatened smooth-hounds in the central Mediterranean Sea. J. Mar. Sci. Eng. 2022, 10, 1647. [Google Scholar] [CrossRef]
  92. Ivory, P.; Jeal, F.; Nolan, C.P. Age determination, growth and reproduction in the lesser-spotted dogfish, Scyliorhinus canicula (L.). J. Northwest Atl. Fish. Sci. 2004, 35, 89–106. [Google Scholar] [CrossRef]
  93. Chabot, D.; Steffensen, J.F.; Farrell, A.P. The determination of standard metabolic rate in fishes. J. Fish Biol. 2016, 88, 81–121. [Google Scholar] [CrossRef]
  94. Whitney, N.M.; Lear, K.O.; Gaskins, L.C.; Gleiss, A.C. The effects of temperature and swimming speed on the metabolic rate of the nurse shark (Ginglymostoma cirratum, Bonaterre). J. Exp. Mar. Biol. Ecol. 2016, 477, 40–46. [Google Scholar] [CrossRef]
  95. Ellis, J.R.; Shackley, S.E. Ontogenic changes and sexual dimorphism in the head, mouth and teeth of the lesser spotted dogfish. J. Fish Biol. 1995, 47, 155–164. [Google Scholar] [CrossRef]
  96. Wilga, C.D.; Motta, P.J.; Sanford, C.P. Evolution and ecology of feeding in elasmobranchs. Int. Comp. Biol. 2007, 47, 55–69. [Google Scholar] [CrossRef]
  97. Kolmann, M.A.; Huber, D.R.; Motta, P.J.; Grubbs, R.D. Feeding biomechanics of the cownose ray, Rhinoptera bonasus, over ontogeny. J. Anat. 2015, 227, 341–351. [Google Scholar] [CrossRef]
  98. Kemper, J.M.; Bizzarro, J.J.; Ebert, D.A. Dietary variability in two common Alaskan skates (Bathyraja interrupta and Raja rhina). Mar. Biol. 2017, 164, 52. [Google Scholar] [CrossRef]
  99. Colloca, F.; Enea, M.; Ragonese, S.; Di Lorenzo, M. A century of fishery data documenting the collapse of smooth-hounds (Mustelus spp.) in the Mediterranean Sea. Aquat. Conserv. Mar. Freshw. 2017, 27, 1145–1155. [Google Scholar] [CrossRef]
  100. Herrel, A.; Gibb, A.C. Ontogeny of performance in vertebrates. Physiol. Biochem. Zool. 2006, 79, 1–6. [Google Scholar] [CrossRef]
  101. Bressan, G. Studio Morfologico Della Pinna Caudale di Trentatré Specie di Squali (Elasmobranchii). Bachelor’s Thesis, University of Padova, Padova, Italy, 2019. [Google Scholar]
  102. Scarpa, A. Differenze Morfologiche fra i Palombi Mustelus Mustelus (Linnaeus, 1758) e Mustelus Punctulatus Risso, 1827 (Elasmobranchii, Triakidae). Bachelor’s Thesis, University of Padova, Padova, Italy, 2017. [Google Scholar]
  103. Deynat, P. Les Requins. Identification des Nageoires. Guide Pratique; Editions Quae: Versailles, France, 2010. [Google Scholar]
  104. Irschick, D.J.; Fu, A.; Lauder, G.V.; Wilga, C.D.; Kuo, C.Y.; Hammerschlag, N. A comparative morphological analysis of body and fin shape for eight shark species. Biol. J. Linn. Soc. 2017, 122, 589–604. [Google Scholar] [CrossRef]
  105. Lipej, L.; De Maddalena, A.; Soldo, A. Sharks of the Adriatic Sea; Knjiznica Annales Majora: Koper, Slovenia, 2004. [Google Scholar]
  106. Lauder, G.V.; Wainwright, D.K.; Domel, A.G.; Weaver, J.C.; Wen, L.; Bertoldi, K. Structure, biomimetics, and fluid dynamics of fish skin surfaces. Physic. Rev. Fluids 2016, 1, 060502. [Google Scholar] [CrossRef]
  107. Raschi, W.; Tabit, C. Functional aspects of placoid scales: A review and update. Aust. J. Mar. Freshw. Res. 1992, 43, 123–147. [Google Scholar] [CrossRef]
  108. Rodríguez-Mendoza, R.; Muñoz, M.; Saborido-Rey, F. Ontogenetic allometry of the bluemouth, Helicolenus dactylopterus dactylopterus (Teleostei: Scorpaenidae), in the Northeast Atlantic and Mediterranean based on geometric morphometrics. Hydrobiologia 2011, 670, 5–22. [Google Scholar] [CrossRef]
  109. Wetherbee, B.M.; Cortés, E.; Bizzarro, J.J. Food consumption and feeding habits. In Biology of Sharks and their Relatives; Carrier, J.C., Musick, J.A., Heithaus, M.R., Eds.; CRC Press: Boca Raton, FL, USA, 2012; pp. 239–263. [Google Scholar]
  110. Baje, L.; Chin, A.; White, W.T.; Simpfendorfer, C.A. Dietary overlap of carcharhinid sharks in the Gulf of Papua. Mar. Freshw. Res. 2022, 73, 605–614. [Google Scholar] [CrossRef]
  111. Ross, S.T. Patterns of resource partitioning in searobins (Pisces: Triglidae). Copeia 1977, 1977, 561–571. [Google Scholar] [CrossRef]
  112. Espinoza, M.; Munroe, S.E.M.; Clarke, T.M.; Fisk, A.T.; Wehrtmann, I.S. Feeding ecology of common demersal elasmobranch species in the Pacific coast of Costa Rica inferred from stable isotope and stomach content analyses. J. Exp. Mar. Biol. Ecol. 2015, 470, 12–25. [Google Scholar] [CrossRef]
  113. Post, D.M. Using Stable Isotopes to Estimate Trophic Position: Models, Methods, and Assumptions. Ecology 2002, 83, 703–771. [Google Scholar] [CrossRef]
  114. Demirhan, S.A.; Seyhan, K.; Başusta, N. Dietary overlap in spiny dogfish (Squalus acanthias) and thornback ray (Raja clavata) in the southeastern Black Sea. Ekoloji 2007, 16, 1–8. [Google Scholar]
  115. Šantić, M.; Rada, B.; Pallaoro, A. Diet and feeding strategy of thornback ray Raja clavata. J. Fish Biol. 2012, 81, 1070–1084. [Google Scholar] [CrossRef] [PubMed]
  116. Lipej, L.; Mavrič, B.; Paliska, D.; Capapé, C. Feeding habits of the pelagic stingray Pteroplatytrygon violacea (Chondrichthyes: Dasyatidae) in the Adriatic Sea. J. Mar. Biol. Assoc. UK 2013, 93, 285–290. [Google Scholar] [CrossRef]
  117. Kadri, H.; Marouani, S.; Bradai, M.N.; Bouaïn, A. Diet and feeding strategy of thornback ray, Raja clavata (Chondrichthyes; Rajidae) from the Gulf of Gabes (Tunisia–Central Mediterranean Sea). J. Mar. Biol. Assoc. UK 2014, 94, 1509–1516. [Google Scholar] [CrossRef]
Figure 1. Shannon–Weaver diversity index (Mean, solid line ± standard deviation, dotted lines) for the cumulative diversity curve of Scyliorhinus canicula (SC, grey), Mustelus mustelus (Mm, blue), and M. punctulatus (Mp, green).
Diversity 15 01163 g001
Figure 2. Feeding strategy of (a) S. canicula, (b) M. mustelus, and (c) M. punctulatus represented as the prey-specific abundance (%PN) of every prey category identified in the diet plotted against its percent frequency of occurrence (%FOi). Each black dot corresponds to a different prey category identified in the diet of the species.
Diversity 15 01163 g002
Figure 3. Non-metric multidimensional scaling (nMDS) ordination of dietary composition by biomass of (a) sexes (females, F: orange ●; males, M: green ■) and (b) seasons in S. canicula (cold season, Cold: blue ■; warm season, Warm: red ●), (c) the combination of the levels of sex and size factors in M. mustelus (small females, F Small: red ●; small males, M Small: orange ■; big females, F Big: blue ●; big males, M Big: light blue ■), and (d) sizes in M. punctulatus (small animals, Small: red ●; big animals, Big: dark blue ■).
Diversity 15 01163 g003
Figure 4. Non-metric multidimensional scaling (nMDS) ordination of dietary composition by biomass of S. canicula (Sc, grey ▲), M. mustelus (Mm, blue ■), and M. punctulatus (Mp, green ●).
Diversity 15 01163 g004
Figure 5. Bidimensional plot of carbon (δ13C) and nitrogen (δ15N) stable isotopes ratios (mean ± standard deviation) for the three shark species categorized for size (S. canicula: grey ▲; M. mustelus: blue ■; M. punctulatus: green ●) and for their main prey categories (Teleost: orange ▲; Crustacean: orange ▲; Mollusks: orange ▲). Data are reported as the isotope ratio of the sample relative to the standards (international standard Vienna Pee Dee Belemnite (VPDB) for C and atmospheric nitrogen for N).
Diversity 15 01163 g005
Table 1. Total length (cm; mean ± standard deviation) of Scyliorhinus canicula, Mustelus mustelus, and M. punctulatus used for stomach content (non-empty stomach) and stable isotope analyses. Data are presented and divided into sex, size, and season groups in S. canicula and for sex and size groups in M. mustelus and M. punctulatus. Numbers in parentheses represent the sample size of each group.
Stomach content analysisScyliorhinus canicula
SmallBigTotal
Cold seasonHot seasonCold seasonWarm season
Males41.3 ± 0.4 (2)35.3 ± 2.5 (3)45.8 ± 2.7 (6)45.5 ± 2.2 (31)44.6 ± 3.5 (42)
Females40.3 ± 1.4 (11)40.1 ± 1.9 (18)44.6 ± 1.6 (70)44.4 ± 1.8 (59)43.7 ± 2.4 (158)
Total39.8 ± 2.2 (34)44.8 ± 1.9 (166)
Mustelus mustelus
SmallBigTotal
Males62.0 ± 12.8 (21)106.4 ± 10.0 (6)71.9 ± 22.4 (27)
Females63.4 ± 13.3 (28)118.7 ± 16.3 (47)98.1 ± 30.9 (75)
Total62.8 ± 13.0 (49)117.3 ± 16.2 (53)
Mustelus punctulatus
SmallBigTotal
Males39.0 ± 3.0 (49)106.9 ± 11.0 (12)52.4 ± 27.7 (61)
Females38.9 ± 5.0 (43)108.9 ± 11.1 (9)51.0 ± 27.5 (52)
Total39.0 ± 4.0 (92)107.8 ± 10.8 (21)
Stable isotope analysisScyliorhinus canicula
SmallBigTotal
Males/45.2 ± 1.8 (12)
Females/45.3 ± 1.8 (12)
Total/45.2 ± 1.8 (24)
Mustelus mustelus
SmallBigTotal
Males73.0 ± 9.4 (4)114.2 ± 14.4 (6)97.7 ± 24.4 (10)
Females69.8 ± 11.5 (6)125.5 (1)77.8 ± 23.5 (7)
Total71.1 ± 10.3 (10)115.8 ± 13.8 (7)
Mustelus punctulatus
SmallBigTotal
Males53.7 ± 6.4 (5)101.0 ± 9.6 (9)84.1 ± 25.0 (14)
Females50.5 (1)105.1 ± 15.5 (9)99.6 ± 22.6 (10)
Total53.2 ± 5.9 ()103.0 ± 12.7 (18)
Table 2. Results of the linear models testing the effect of size, sex, season, and the interaction between size and sex on fullness% and Shannon–Wiener and Pielou diversity indices for S. canicula (Sc), M. mustelus (Mm), and M. punctulatus (Mp). Statistically significant results are in bold. The mean (±standard deviation) of each group is reported.
Fullness%Shannon–WienerPielou
ScMmMpScMmMpScMmMp
SizeF2,197 = 4.45
p < 0.001
F3,98 = 0.44
p = 0.66
F3,109 = 4.02
p < 0.001
F3,196 = 0.96,
p = 0.34
F3,98 = 0.51
p = 0.61
F3,109 = 0.88
p = 0.38
F3,178 = 0.23 p = 0.82F3,90 = 0.49
p = 0.62
F3,101 = 0.27
p = 0.79
Big1.90 ± 1.88%1.29 ± 0.72%0.68 ± 0.49%0.70 ± 0.460.73 ± 0.410.85 ± 0.520.62 ± 0.260.64 ± 0.220.66 ± 0.24
Small4.32 ± 3.47%2.08 ± 1.41%1.48 ± 0.92%0.82 ± 0.420.70 ± 0.460.89 ± 0.470.63 ± 0.220.58 ± 0.260.75 ± 0.22
SexF2,197 = 2.45
p = 0.02
F3,98 =0.05
p = 0.96
F3,109 =1.64
p = 0.10
F3,196 = 0.62,
p = 0.53
F3,98 = 0.71
p = 0.48
F3,109 = 0.91
p = 0.37
F3,178 = 1.28
p = 0.20
F3,90 = 0.33
p = 0.74
F3,101 = 0.07
p = 0.95
Males1.41 ± 1.47%1.65 ± 1.16%1.32 ± 0.88%0.76 ± 0.450.70 ± 0.490.88 ± 0.460.72 ± 0.230.59 ± 0.280.74 ± 0.19
Females2.55 ± 2.54%1.68 ± 1.18%1.35 ± 0.95%0.71 ± 0.460.72 ± 0.410.89 ± 0.490.59 ± 0.260.61 ± 0.230.72 ± 0.26
Size × sexF3,196 = 1.28
p = 0.20
F3,98 = 0.16
p = 0.87
F3,109 = 1.81
p = 0.07
F3,196 = 0.64 p = 0.52F3,98 = 0.82
p = 0.41
F3,109 = 1.03
p = 0.31
F3,178 = 0.05
p = 0.96
F3,90 = 0.41
p = 0.68
F3,101 = 0.01
p = 0.99
SeasonF1,198 = 2.14
p = 0.03
//F1,198 = 2.15
p = 0.03
//F1,180= 2.22
p = 0.06
//
Warm2.33 ± 2.22% 0.84 ± 0.42 0.69 ± 0.21
Cold2.28 ± 2.62% 0.58 ± 0.47 0.53 ± 0.28
Table 3. Results of the permutational multivariate analysis of variance (PERMANOVA) on the dietary composition by biomass of S.canicula, M. mustelus, and M. punctulatus. Bold values highlight statistical significance. df = degrees of freedom, SS = sum of squares, and MS = mean sum of squares.
SourcedfSSMSPseudo-FP (perm)Unique Perms
S. caniculaSize13631.93631.91.0080.420999
Sex110131101312.8110.003997
Season17303.97303.92.0270.034999
Size × Sex13867.83867.81.0730.370999
Size × Season14132.54132.51.1470.319999
Sex × Season13229.43229.40.8960.571999
Size × Sex × Season13468.83468.80.9650.474998
Residual1926.9 × 1053603.9
Total1997.4 × 105
M. mustelusSize120353203538.1560.001999
Sex11390.31390.30.5570.737999
Size × Sex16193.46193.42.4820.039999
Residual982.4 × 1052495.5
Total1012.9 × 105
M. punctulatusSize1414624146213.1230.001997
Sex13348.93348.91.0600.391999
Size × Sex14254.84254.81.3470.204996
Residual1093.4 × 1053159.5
Total1123.9 × 105
Table 4. Results of the similarity percentage (SIMPER) analysis reporting the average biomass and percentage contribution of the different prey categories to the difference observed between sex and season groups in the diet of S. canicula, and between size groups in the diet of M. mustelus and M. punctulatus. Only prey categories contributing at least 4% to the difference were included in the table.
SpeciesFactorPrey CategoryAverage BiomassAverage BiomassContribution (%)
S. caniculaSex FemalesMales
Portunidae1.150.3321.77
Unid. Teleosts0.440.249.24
Other Caridea0.140.337.45
Unid. Crustaceans0.190.226.62
Sepiolidae0.170.225.91
Other Brachiura0.180.195.82
Rissoides desmaresti0.110.144.63
Cepola macrophthalma0.150.124.36
Alpheus glaber0.080.174.19
Flatfishes0.290.064.10
Season Cold seasonWarm season
Portunidae0.950.9924.02
Unid. Teleosts0.460.3510.70
Flatfishes0.360.146.54
Unid. Crustaceans0.110.266.35
Other Brachiura0.160.205.46
Sepiolidae0.110.234.97
Deltentosteus quadrimaculatus0.220.114.62
Other Caridea0.140.224.61
Cepola macrophthalma0.090.194.31
Unid. Polychaete0.120.134.10
M. mustelusSize Small animalsBig animals
Portunidae1.395.8339.39
Squilla mantis1.402.5921.43
Other Brachiura0.400.697.48
Ethusa mascarone0.850.006.68
Unid. Crustaceans0.390.254.24
Other Stomatopoda0.220.374.20
M. punctulatusSizePortunidae0.042.2025.17
Squilla mantis0.020.859.13
Unid. Teleosts0.150.697.30
Other Polychaete0.400.496.41
Pelagic fishes0.130.485.45
Other Brachiura0.200.465.35
Other0.020.485.00
Unid. Cephalopods0.140.414.56
Anomura0.350.074.36
Unid. Processidae0.360.004.19
Table 5. Results of the pairwise test investigating the effect of the interaction between the factors sex and size on the dietary composition by biomass of M. mustelus. Bold values highlight statistical significance. SF = small females, SM = small males, BF = big females, and BM = big males.
ComparisontP (perm)Unique Perms
SF, SM1.25790.140998
SF, BF3.34070.001999
SF, BM1.32710.120998
SM, BF3.47840.001999
SM, BM1.81450.008995
BF, BM1.29520.173998
Table 6. Results of permutational multivariate analysis of variance (PERMANOVA) on the dietary composition by biomass of the three species and of the associated pairwise tests. Bold values highlight statistical significance. Sc = S. canicula, Mm = M. mustelus, and Mp = M. punctulatus. df = degrees of freedom, SS = sum of squares, and MS = mean sum of squares.
PERMANOVA
SourcedfSSMSPseudo-FP (perm)Unique Perms
Species21.8 × 1059173326.520.001998
Residual4121.4 × 1053459.1
Total4141.6 × 105
Pairwise comparison
Pair-wise comparisontP (perm)Unique perms
Sc, Mm5.2110.001999
Sc, Mp4.4920.001999
Mm, Mp6.0020.001999
Table 7. Results of the similarity percentage (SIMPER) analysis reporting the average biomass and percentage contribution of the different prey categories to the difference observed in the diet between S. canicula and M. mustelus, S. canicula and M. punctulatus, and M. mustelus and M. punctulatus. Only prey categories contributing at least 4% to the difference were included in the table.
Prey CategoryAverage BiomassAverage BiomassContribution (%)
S. caniculaM. mustelus
Portunidae0.973.7031.01
Squilla mantis0.012.0218.80
Other Brachiura0.180.556.75
Unid. Teleosts0.400.275.24
Ethusa mascarone0.000.415.17
Unid. Crustaceans0.190.324.57
S. caniculaM. punctulatus
Portunidae0.970.4417.72
Unid. Teleosts0.400.258.32
Other Polychaete0.130.427.30
Unid. Crustaceans0.190.256.60
Processidae0.100.296.57
Anomura0.010.306.00
Other Brachiura0.180.255.75
Other Caridea0.180.185.52
Sepiolidae0.180.134.50
M. mustelusM. punctulatus
Portunidae3.700.4430.86
Squilla mantis2.020.1718.62
Other Brachiura0.550.256.77
Ethusa mascarone0.410.115.52
Unid. Crustaceans0.320.254.78
Other Polychaete0.040.424.18
Disclaimer/Publisher’s Note: The statements, opinions and data contained in all publications are solely those of the individual author(s) and contributor(s) and not of MDPI and/or the editor(s). MDPI and/or the editor(s) disclaim responsibility for any injury to people or property resulting from any ideas, methods, instructions or products referred to in the content.

