Article

A Cocktail of Plankton and Organochlorines for Whale Shark in the Foraging Areas of Nosy Be (Madagascar)

1
Department of Physical Sciences, Earth, and Environment, University of Siena, Via Mattioli, 4, 53100 Siena, Italy
2
Sharks Studies Center—Scientific Institute, 58024 Massa Marittima, Italy
*
Author to whom correspondence should be addressed.
Diversity 2023, 15(8), 911; https://doi.org/10.3390/d15080911
Submission received: 6 July 2023 / Revised: 1 August 2023 / Accepted: 2 August 2023 / Published: 4 August 2023
(This article belongs to the Special Issue Shark Ecology)

Abstract

:
Seas and oceans are contaminated by persistent organic pollutants (POPs), which are released into the environment by human activities. The chemical-physical properties of POPs induce high persistence and toxicity in marine organisms from the lowest to the highest trophic levels. Phyto- and zooplankton are at the base of the food chain, and they can adsorb and accumulate these xenobiotic compounds. Therefore, all planktophagous species, including the whale shark (Rhincodon typus), are susceptible to ingesting these contaminants during feeding. From October to December, whale sharks migrate along the north-west coast of Madagascar in search of dense patches of plankton. During scientific expeditions to the whale sharks’ foraging areas in the waters of the island of Nosy Be (which is in the north-west of Madagascar), plankton samples were taken. In these samples, the presence and levels of some chlorinated xenobiotics (HCB, DDT and its metabolites, and PCBs) were evaluated in order to estimate the possible impact of whale shark diet on organochlorine (OC) accumulation. The fresh plankton biomass sampled from this region did not seem to be sufficient for the sustenance of the animals, which suggests that the daily contamination input of Rhincodon typus individuals, depending on their plankton diet, is minimal.

1. Introduction

Zooplankton plays an important role in regulating the patterns and mechanisms through which both matter and energy are transferred from the base to the upper levels of food webs [1]. Zooplankton is a key vehicle through which persistent contaminants entering the marine environment are transferred from primary producers to higher trophic levels, since it accumulates pollutants from both water and food [2]. Zooplankton provides an essential food source for numerous species, and its fluctuations in spatio-temporal distribution might influence the biodiversity trends in various marine organisms [3], including whale sharks.
The whale shark, Rhincodon typus (Smith, 1828), is the largest known fish-like vertebrate in the world, with an uncertain maximum size [4]. It has been included in the CITES Appendix II since 2002. The species was also listed as vulnerable in the IUCN Red List in 2000 [5], a status that was confirmed in 2005 [6], and in 2016, the conservation status was then reclassified as endangered in order to address its decreasing population trend [7]. Whale sharks are panoceanic planktivores and are cosmopolitan in distribution, inhabiting all tropical and warm temperate seas, except the Mediterranean [8]. They spend, on average, 7.5 h/day feeding at the surface on dense plankton dominated by calanoids, copepods, sergestids, chaetognaths, and fish larvae [9,10,11,12,13]. The filtering apparatus of R. typus, unlike that of Cetorhinus maximus and Megachasma pelagios, is incapable of filtering large volumes of water, but it seems to be adapted to a combination of filter and suction feeding, making it more versatile than that of the other two filtering sharks, and thereby allowing whale sharks to target a wider variety of prey [14].
Most of the information on the species of the whale shark is derived from studies conducted in coastal areas [15,16], where, seasonally, various individuals aggregate based on environmental factors, such as the seasonal productivity of plankton [17,18,19,20], the reproduction in fish [21], crab egg releases [22,23], and ocean current trends [24]. The discovery of several aggregation sites of these animals around the world, including in the waters of Nosy Be Island in Madagascar, has significantly increased the number of sightings in recent years, and in many areas, these encounters have helped to develop a profitable and increasingly popular tourism industry [8,25,26,27,28].
However, increasing human activity in whale shark feeding grounds has, in turn, increased chemical pollution from urban wastewaters, vessels, agriculture, and also waste. Primary information regarding contaminant uptake in elasmobranch species is still lacking, though, as well as the potential physiological effects of pollutants on the whale shark species [20,29]. As a result, even if pollution has not yet been considered as one of the main threats to the survival of the whale shark species, the negative effects on the health of this organism may worsen the situation [30,31]. Contaminants entering the marine environment are readily absorbed by organic matter, and they are taken up and absorbed by plankton at the base of marine food webs [32,33]. Marine zooplankton has relatively high lipid reserves, and it can accumulate hydrophobic organochlorine compounds (OCs) [34,35,36]. Several studies have shown that sharks bioaccumulate and biomagnify certain metals and metalloids in their tissues as well as organochlorine contaminants [2]. Although POPs have been regulated since the 1970s and banned in production and in use by the 2001 Stockholm Convention (initially there were 12, called the “dirty dozen”, but there are now a total of 29, plus another 6 that are under review) [37], large quantities of persistent organic pollutants (POPs) have been released into the environment. Due to their propensity for long-range transport, high environmental persistence, bioaccumulation potential, and intrinsic toxicity, POPs continue to present a global problem today [38]. Dichlorodiphenyltrichloroethane (DDT) and polychlorinated biphenyls (PCBs), for instance, are still found in countries within the Northern Hemisphere, where they have actually been banned already for a long period of time [2]. Contamination of marine environments has been linked to increasing levels of lethal and sub-lethal effects to individuals, populations, and ecosystems [24,39]. Chronic or intermittent exposure to OCs and trace elements results in severe effects on aquatic organisms at different physiological, cellular, and behavioral levels [24]. In this study, zooplankton samples were collected between November and December of 2019 along the coast of Nosy Be Island in the foraging areas of whale sharks. The samples were analyzed in order to evaluate the presence and the levels of OCs, particularly hexachlorobenzene (HCB), 29 PCB congeners, and DDT with its metabolites (DDTs). Knowing the feeding habits of the whale shark [9] and the amount of fresh plankton biomass present in this area at the time of the elasmobranch visitation [12], it was also possible to evaluate the input of organochlorine contamination through the animal’s diet.

2. Materials and Methods
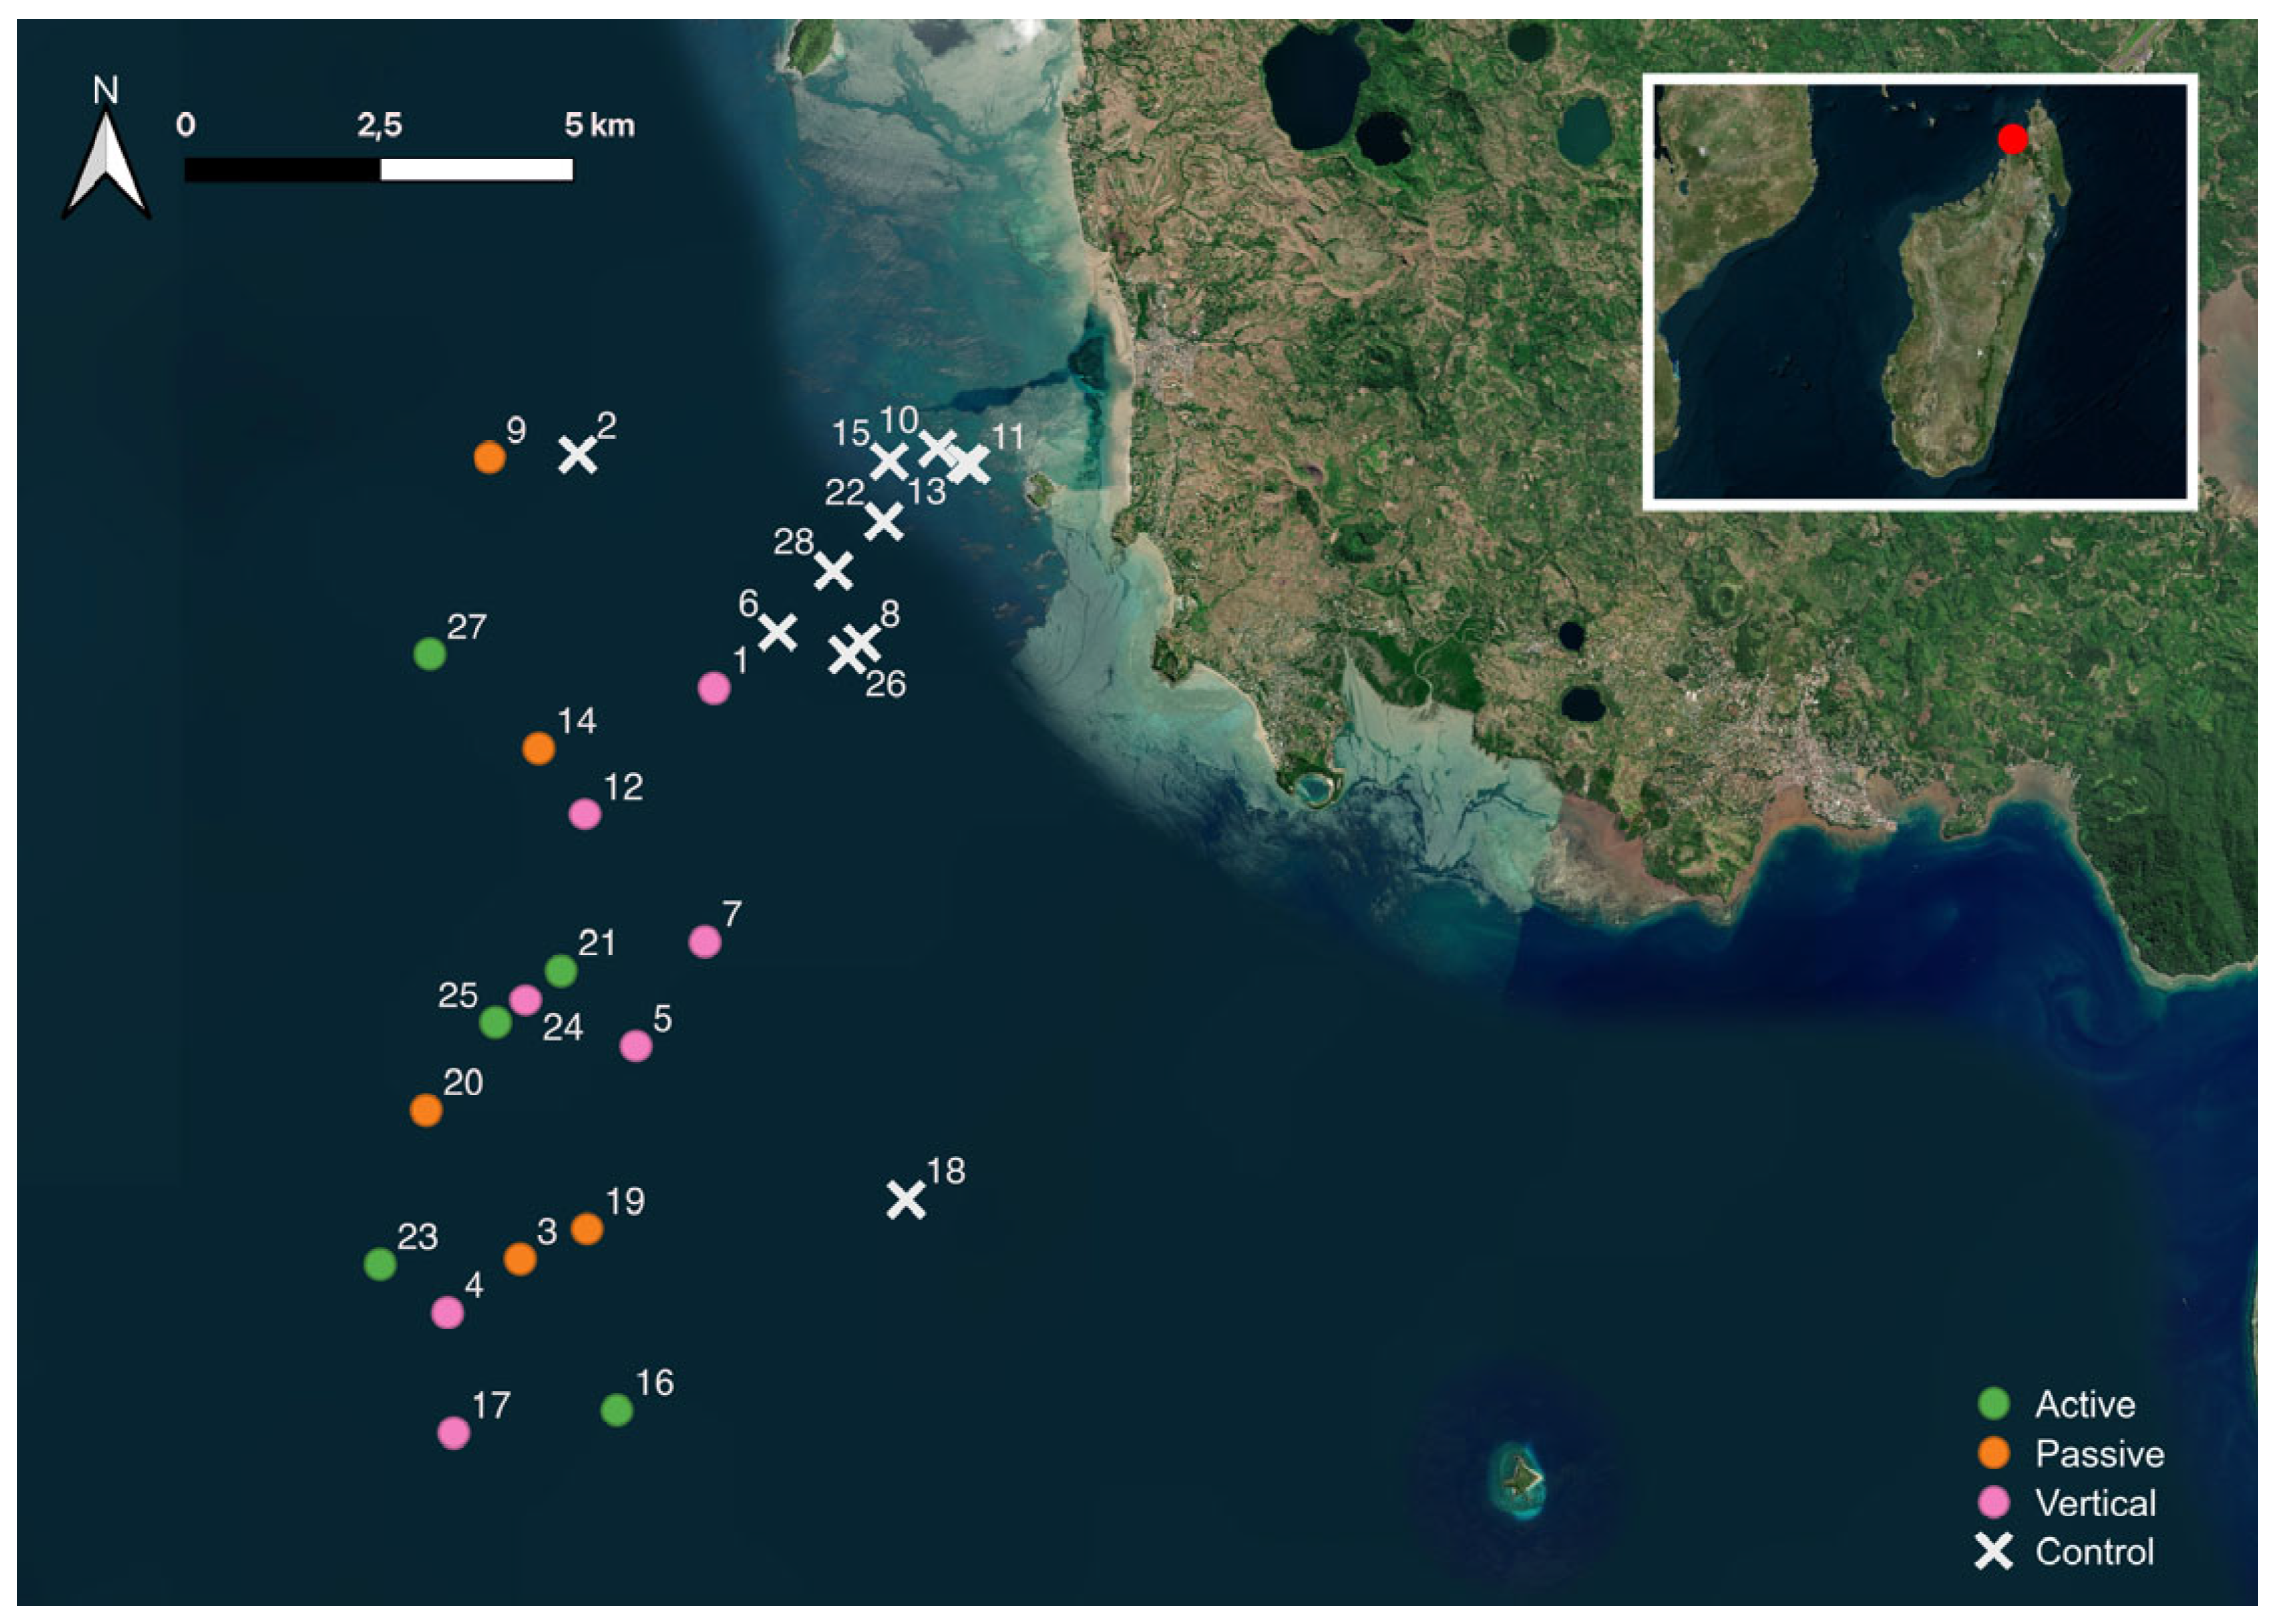
2.1. Study Area

Nosy Be (≈13°39′ S; 40°20′ E), in the Antsiranana Province, is a volcanic island located in the Mozambique Channel, 8 km (km) off the Northwest coast of Madagascar (Figure 1). The island is roughly 22.5 km long and 15 km wide with an area of 312 square km, and Mont Lokobe is its highest peak at 450 m. Water depths on the continental platform around Nosy Be are generally shallow, rarely exceeding 40 m. Water temperatures around Nosy Be vary from about 24 °C in August to about 28 °C in February. The difference between the lowest and highest possible tides is 4.44 m, with an average of 2.22 m. This great fluctuation in tidal level gives rise to strong tidal currents in restricted channel areas [40]. Nosy Be is a small island of Madagascar, famous for its own largely endemic animal and plant biodiversity [41]. The distribution, status, and abundance of whale sharks are poorly documented in Madagascar [42,43]. North-western Madagascar is a significant hotspot for marine megafauna species, including whale sharks, cetaceans, and sea turtles, as well as for coral biodiversity [44]. Nosy Be, specifically, is likely to be a feeding area for planktivores: R. typus here is often associated with surface schools of mackerel tuna feeding on small pelagic fishes (Clupeidae) [45]. The population structure of whale sharks, the majority of which are juvenile males, is common within their coastal feeding areas [46]. Among the various impacts in Nosy Be and the larger Madagascar area, both anthropogenic (fishing methods, uncontrolled tourism, and recreational activities) and environmental (tropical cyclones—from November to April—and climate change effects generally) have amplified over the last four decades, and the stress related to increased pollution associated with dredging, coastal development, deforestation, and intensive agriculture should not be overlooked [45]. This is particularly the case for those species, such as the whale shark, which are already considered at risk, and that will be in need of conservation in the near future.

2.2. Samples Collection

One expedition, coordinated by the Sharks Studies Centre, was carried out in November–December of 2019 with the logistical support of Manta Diving boats. Departing from the beach of Ampasikely (S 13°20′47.9335″ E 48°11′19.824″) on small tourist boats, the team collected zooplankton samples in the coastal waters of the south-eastern side of the island from approximately 08:30 to 13:30. The plankton samples were collected with a 200 μm mesh size net with a 50 cm diameter mouth. Once the net had been ballasted (2–5 kg) and tied with a rope to the boat, it was towed for 10 min at a speed of 2 knots. Afterwards, the net was recovered and repeatedly rinsed with sea water from the outside to the inside in order to recover any material stuck to its walls. Plankton entrapped in the collector at the base of the net was then retrieved and filtered through a 0.50 μm filter, wrapped in a sheet of aluminum foil using a spatula, placed inside plastic jars, and, finally, stored in a refrigerator. Zooplankton collected in the feeding area of the whale sharks was sampled during or immediately after the sharks displayed a feeding behavior (active, passive, and vertical), following the definition by [47]. Furthermore, upon returning from each sampling trip, a control sample was taken near the coast where, according to the local guides and fishermen, whale sharks are never encountered. This was conducted at a depth of at least 10 m in order to avoid breaking the net along the seafloor. Upon returning from the survey, each sample was divided into sub-samples for the different analyses. A part of the sample was used for taxonomic investigations [12], and another aliquot was frozen at −20 ° C for toxicological analyses. A total of 28 zooplankton samples were analyzed for OC determination (Figure 1).

2.3. Sample Preparation and OC Determination

Frozen plankton samples were weighed. All samples were <1 g, so a standard weight of 0.100 g was used for OC determination. HCB, DDTs, and PCBs were determined according to U.S. Environmental Protection Agency (EPA) method 8081/8082 modified according to Marsili et al. (2016) [39]. Samples were then freeze-dried for 2 days, and were subsequently homogenized manually with a mortar. Cellulose thimbles were pre-extracted in a Soxhlet for 9 h with 150 mL of n-hexane in order to remove impurities. Next, the thimbles were evaporated under a fume hood for one hour and placed in the stove at 100 °C for another hour. A total of 0.100 g of the plankton samples were loaded into each cellulose thimble, spiked with 100 μL 1 ng/μL of PCB n° IUPAC30 (International Union of Pure and Applied Chemistry) [47], and then extracted in a Soxhlet apparatus for 9 h with 200 mL of n-hexane. The extracted organic material (EOM%; lipid content) was calculated gravimetrically in each sample.
The extract was then saponified with 10 mL of sulphuric acid (98% AnalR © Normapur, VWR chemicals) for 12 h to obtain lipid sedimentation. Supernatant solution was recovered and evaporated to 10 mL with Rotavapor 110 at constant temperature of 45 °C. The extract then underwent liquid chromatography on a column containing Florisil (VWR chemicals, ph 8.5; mesh size 150–250 μm) that had been dried at 110 °C for 1 h, and everything was eluted with 90 mL of n-hexane. This phase further purified the apolar phase of the lipids that could not be saponified. The extract was then evaporated and spiked with 100 μL of hexane 0.15 ng/μL of PCB209, which was used as the second internal standard.
The analytical method used was High Resolution Capillary Gas Chromatography with an Agilent 6890 N and a 63 Ni ECD and an SBP-5 bonded phase capillary column (30 m long, 0.2 mm internal diameter). The carrier gas was nitrogen with a head pressure of 15.5 psi (splitting ratio 50/1). The scavenger gas was argon/methane (95/5) at 40 mL/min. The oven temperature was 100 °C for the first 10 min, after which it was increased to 280 °C at 5 °C/min. The injector and detector temperatures were 200 and 280 °C, respectively. A mixture of specific isomers was used to calibrate the system, evaluate recovery, and confirm the results.
The standard injected was prepared with 50 ng/mL of HCB, 100 ng/mL of DDT (pp′DDT, pp′DDD, pp′DDE, op′DDD, op′DDE), 200 ng/mL of op′DDT, and 2 μg/mL of Arochlor 1260. For the evaluation of the linearity in the instrumental response and the instrumental sensitivity, the following quantities of the standard were injected: 1, 2, and 4 μL. Capillary gas chromatography revealed 29 PCB congeners (IUPAC no. 95, 99, 101, and 118—pentachlorobiphenyls; 128, 135, 138, 144, 146, 149, 151, 153, and 156—hexachlorobiphenyls; 170, 171, 172, 174, 177, 178, 180, 183, and 187—heptachlorobiphenyls; 194, 195, 196, 199, 201, and 202—octachlorobiphenyls; and 206—nonachlorobiphenyls). Total PCBs (∑PCBs) were quantified as the sum of all congeners. Total DDTs (∑DDTs) were calculated as the sum of the isomers op′DDT, pp′DDT, op′DDD, pp′DDD, op′DDE, and pp′DDE. The limit of detection (LOD) for all compounds analyzed was 0.1 ng/kg (ppt).

2.4. Data Analysis

Data were processed with STATISTICA 7.1 software. A Shapiro–Wilk test was used to check the distribution of the data. The Shapiro–Wilk test utilizes the null hypothesis principle: the null hypothesis is that the population is normally distributed (p > 0.05). In the non–normally distributed data, a Kruskal–Wallis test was applied, and in those normally distributed or normalized with Log transformation, a t-test and a Pearson test were applied.

3. Results and Discussion

3.1. POP Concentrations in Plankton Samples

Table 1 summarizes POP concentrations, expressed in ng/g dry weight (d.w.), detected in plankton samples, and divided between the functions of the shark feeding behavior (active (A), passive (P), vertical (V)), and the control area (C)) where the shark was not present.
In the (V) samples, the mean levels of HCB and PCBs were higher than in the other samples; DDTs had levels comparable to those of sample (P), and both were higher than (A) and (C). The differences between the four groups, however, were not statistically significant (p < 0.05) with the non-parametric Kruskal–Wallis H test. This is probably due to the low sample number evaluated and the high standard deviation that was detected. The average abundance pattern for the target contaminants in plankton was PCBs > DDTs > HCB, regardless of the type of feeding behavior and the sampling area. Considering all of the zooplankton samples together, PCBs ranged from 26.16 ng/g d.w. to 436.49 ng/g d.w. ( x ¯ = 64.71 ± 77.14), DDTs ranged from 14.54 ng/g d.w. to 93.57 ng/g d.w. ( x ¯ = 35.14 ± 18.46), and HCB ranged from 0.41 ng/g d.w. to 10.90 ng/g d.w ( x ¯ = 1.42 ± 2.05). Evaluating the representativeness of these results from a quantitative point is challenging, especially because sources for bibliographic comparison are scarce. There are very few previous studies on OC levels in plankton globally (Table 2), and only one was conducted near the wide-ranging area covered by this study [2].
The results obtained in our study were in line with those conducted in Portugal [54], while those recorded in the Southern Ocean [50] were considerably lower. The most interesting comparison is with the study conducted in Djibouti [2], which is 3000 km north of Nosy Be, in which PCB levels were higher despite the similarity of the area. On the other hand, DDTs were consistent with the aforementioned studies [2,50,54].
The only two studies in which HCB analysis was carried out were those conducted in the Mediterranean Sea [55] and in Weizhou Island [59], and in both cases, our results were higher.

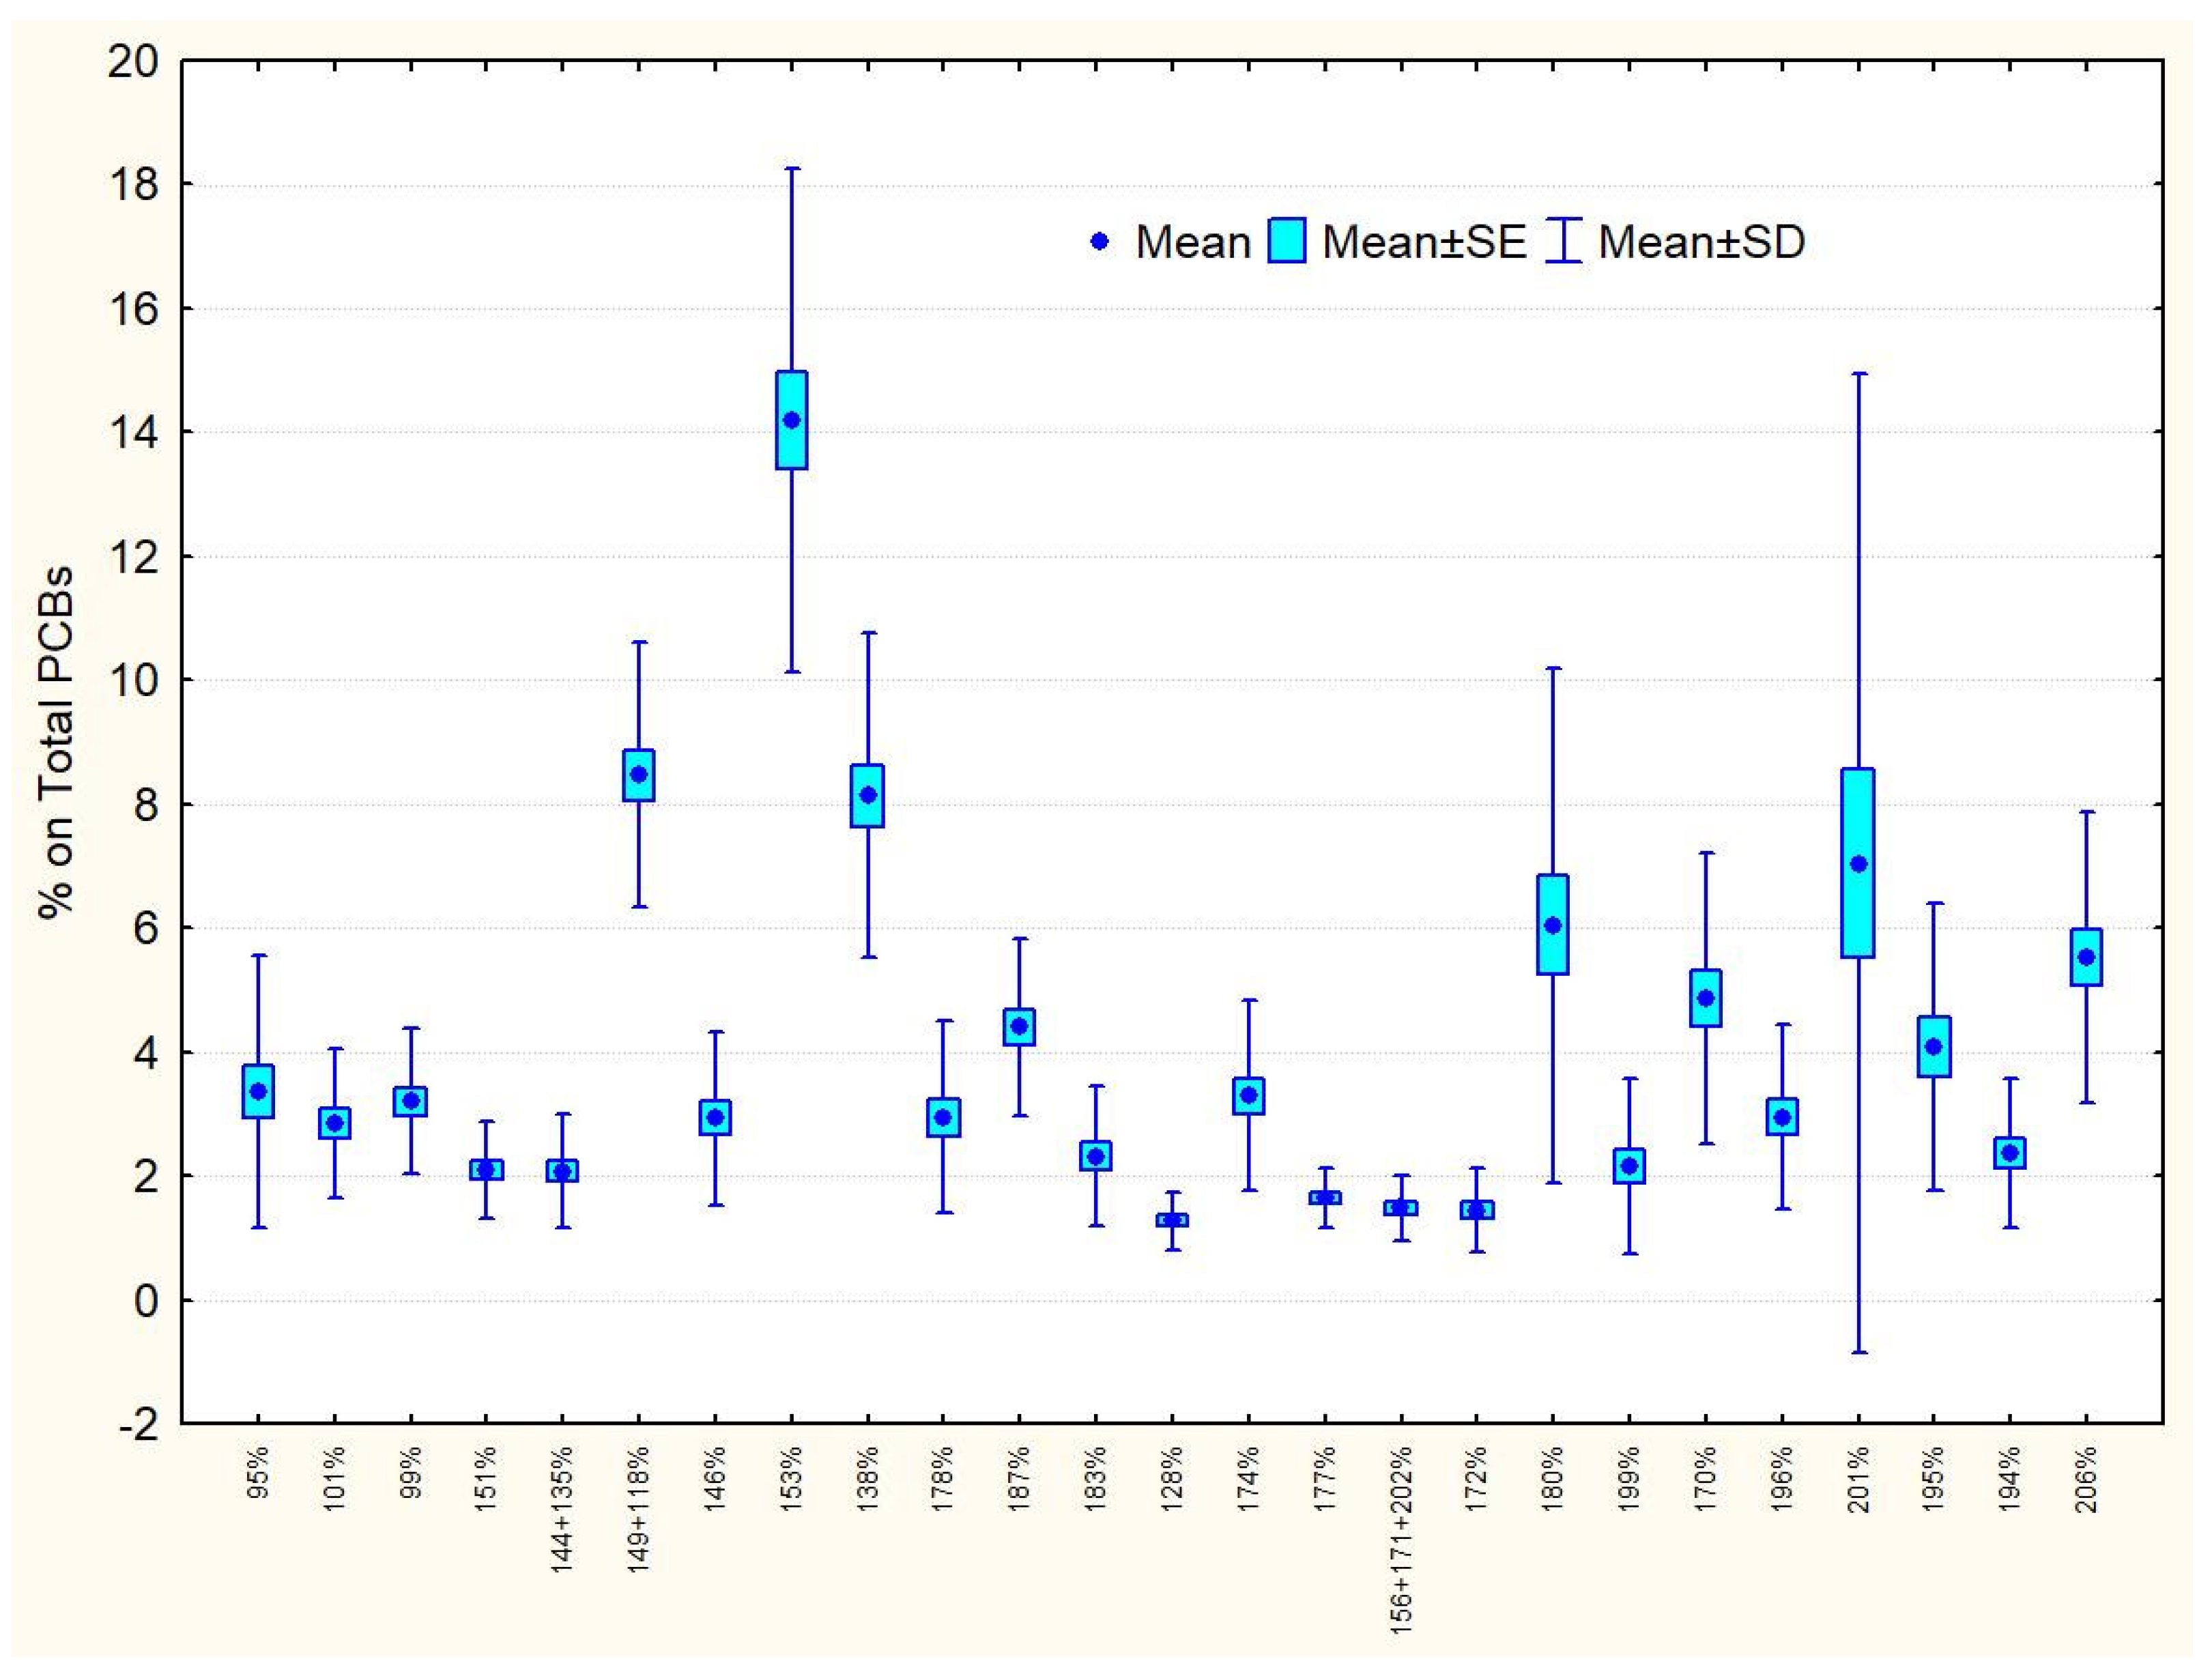
3.2. PCB Congeners Composition

The PCB content was mostly dominated by eight congeners: PCB(149 + 118), PCB153, PCB138, PCB180, PCB170, PCB201, and PCB206, with contributions > 50% (Figure 2).
It should be emphasized that the PCB abundance model is very similar to what is usually reported for biotic matrices, where the most recalcitrant PCB congeners (in particular, PCB153, PCB138, and PCB180) constituted the majority of PCB burdens. Among these, congener 22′44′55′ (PCB153) was the most abundant in all of the samples, probably due to the fact that this congener is particularly persistent as it has chlorines in positions 2, 4, and 5 of both rings of the biphenyl [60,61,62] and has no adjacent unsubstituted carbons in the ortho-meta position [63]. It is also very important in toxicological terms as a mutagenic, teratogenic, and carcinogenic compound, and also as an endocrine disruptor [64]. PCB118—which was present in high percentages in all of the samples—is also important toxicologically because it shares the previously mentioned characteristics [64]. Figure 2 shows the very high SDs, particularly for the congeners PCB153, PCB180, and PCB201. Therefore, we investigated whether the differences in feeding behavior type could be related to a different PCB fingerprint between the groups. With the t-test, performed following the verification of the Gaussian distribution of the data and considering the percentage values, significant differences (p < 0.05) were identified: (V) differs from (P) for PCB178 and PCB196 as well as from (A) for PCB172, and only in the case of PCB196 we had the highest percentages in (V); (P) differs from (A) and from (C) for PCB99, always in lower percentages in (P); (P) differs from (A) for PCB151 and from (C) for PCB178, and PCB178 were present with higher percentages in (P), unlike PCB151; and, finally, (A) had significantly higher percentages of PCB172 and PCB199 than (C). Thus, only a few congeners differ significantly between the different feeding behaviors, and among these, the most representative PCB congeners were not present. This result could have been influenced by the high SD recorded within each group for the individual samples that were analyzed. For this purpose, the PCB fingerprint results are reported separately for the four behavioral groups (Table 3). Analyzing the data, PCB180 has a high SD both in (V) and in (P), PCB201 has a high SD in both (V) and in (C), and even in (C), the SD for PCB201 is greater than the mean value.

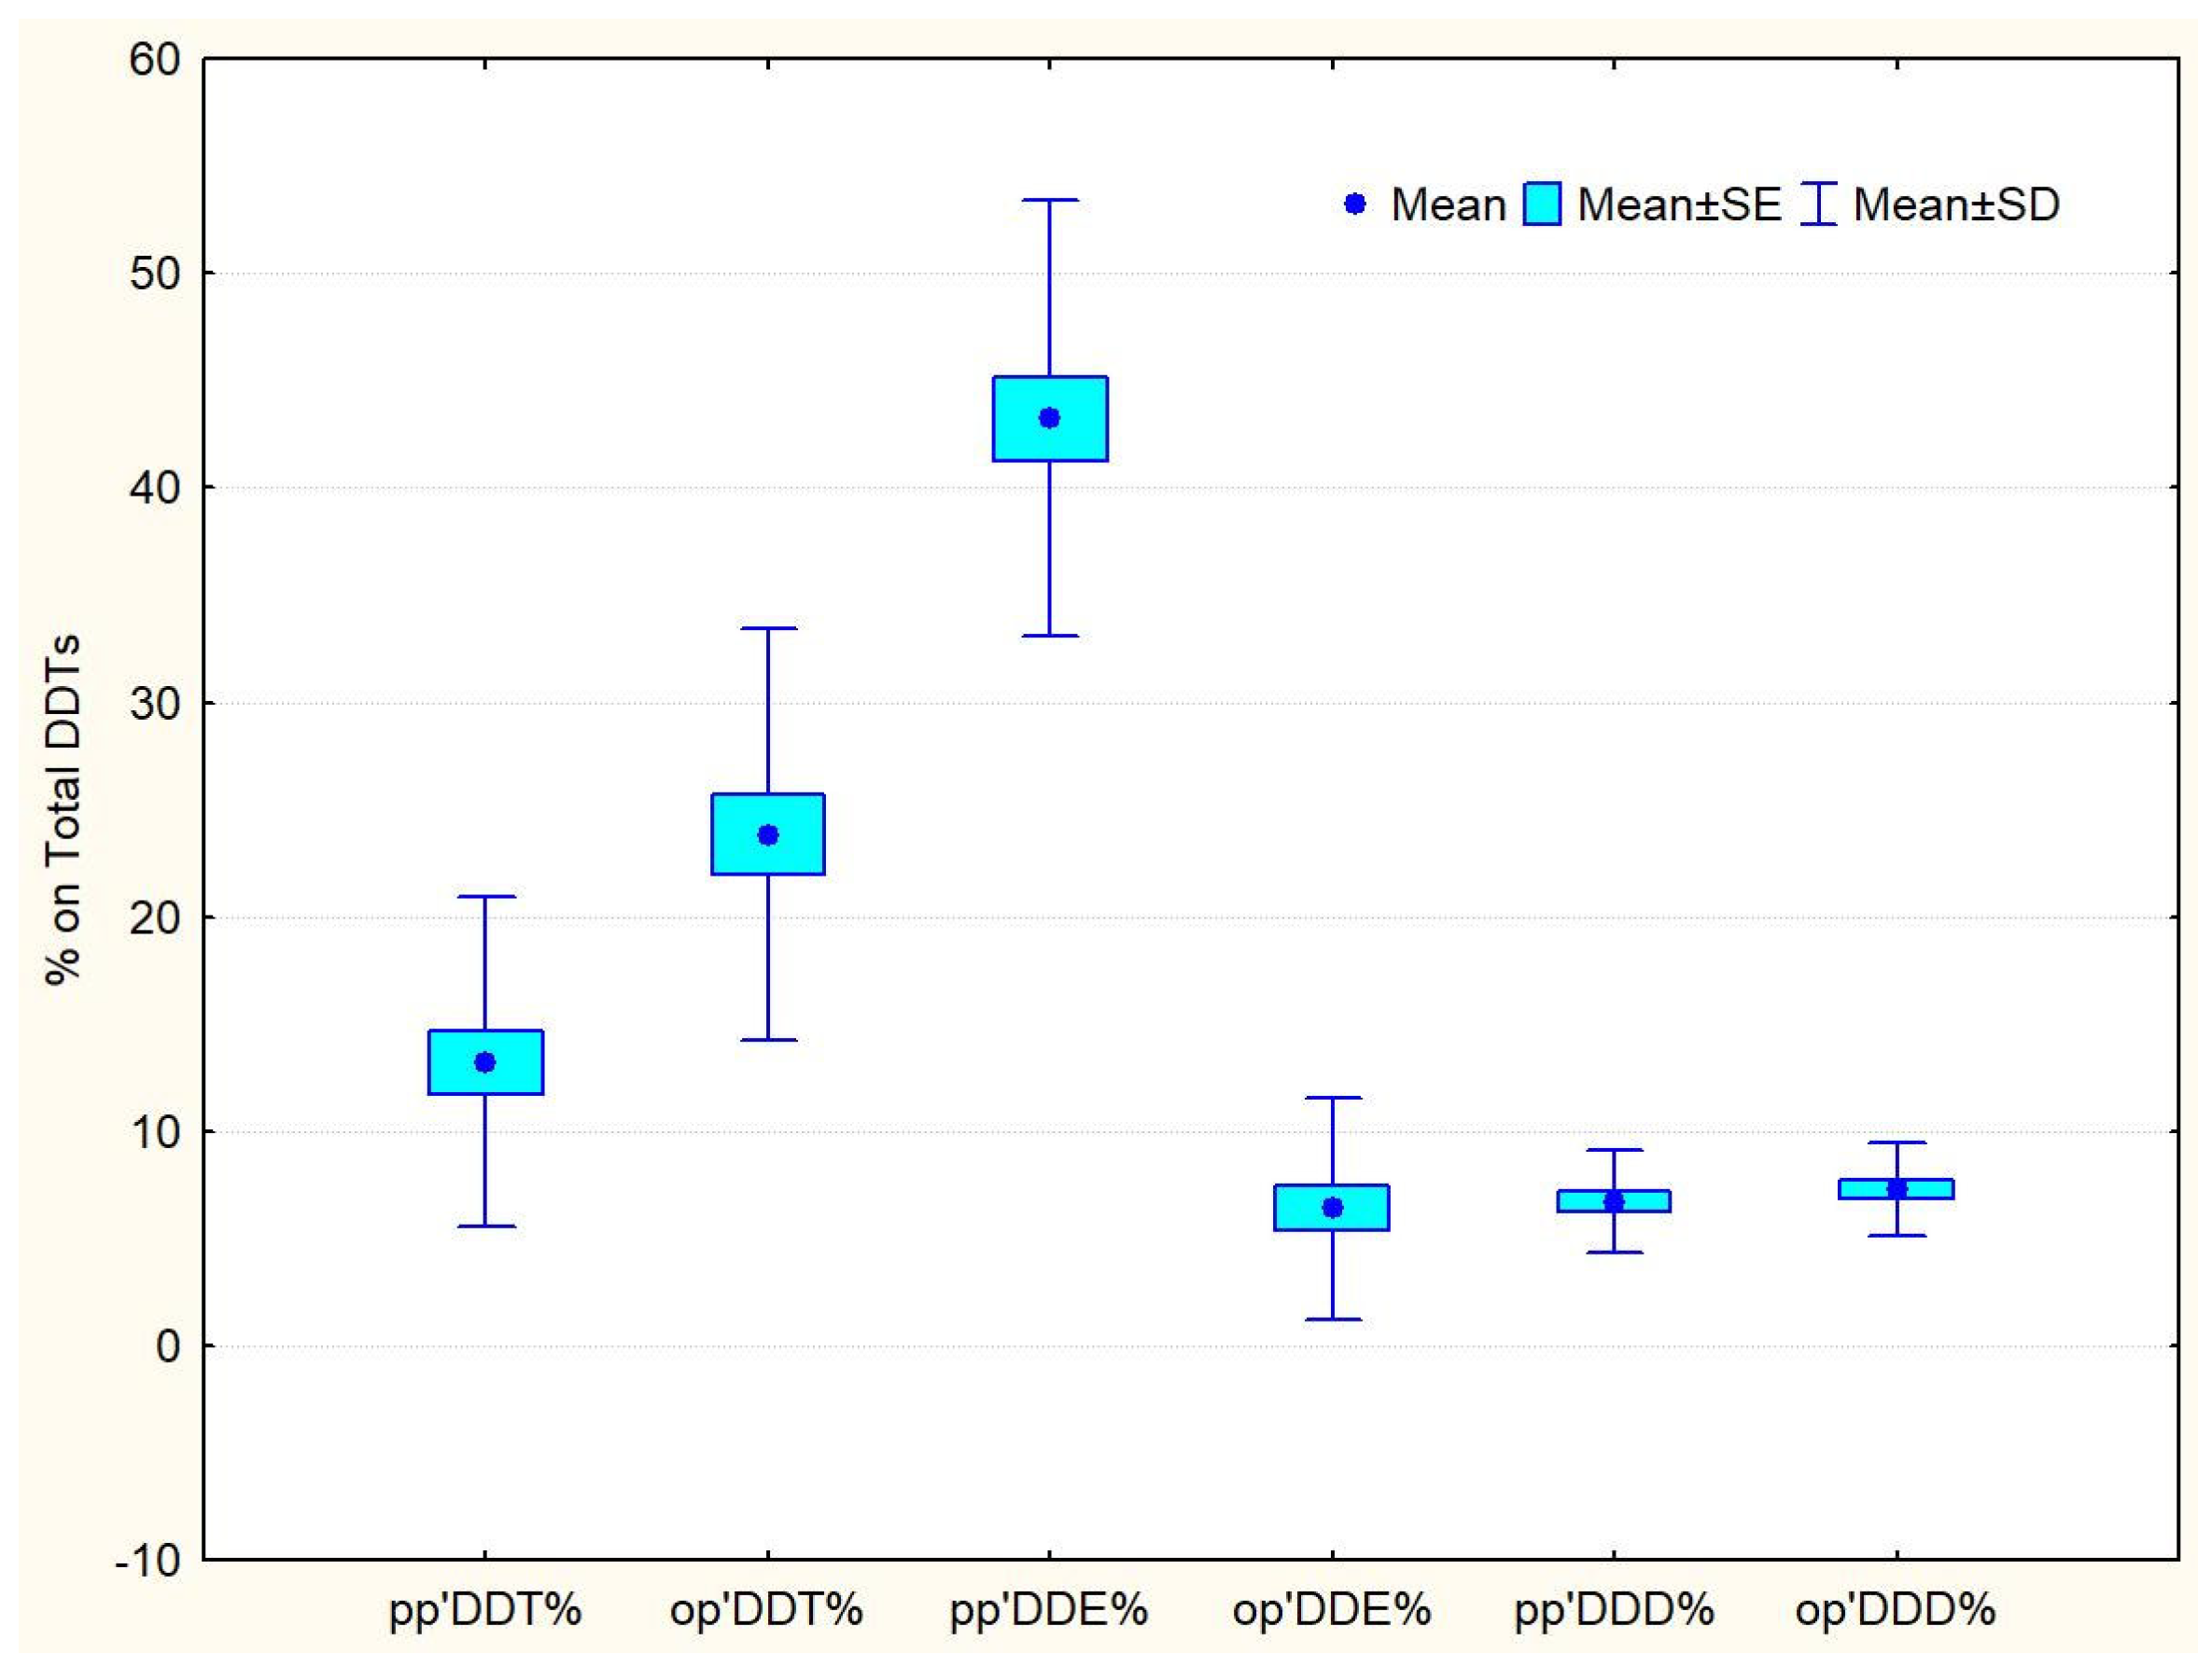
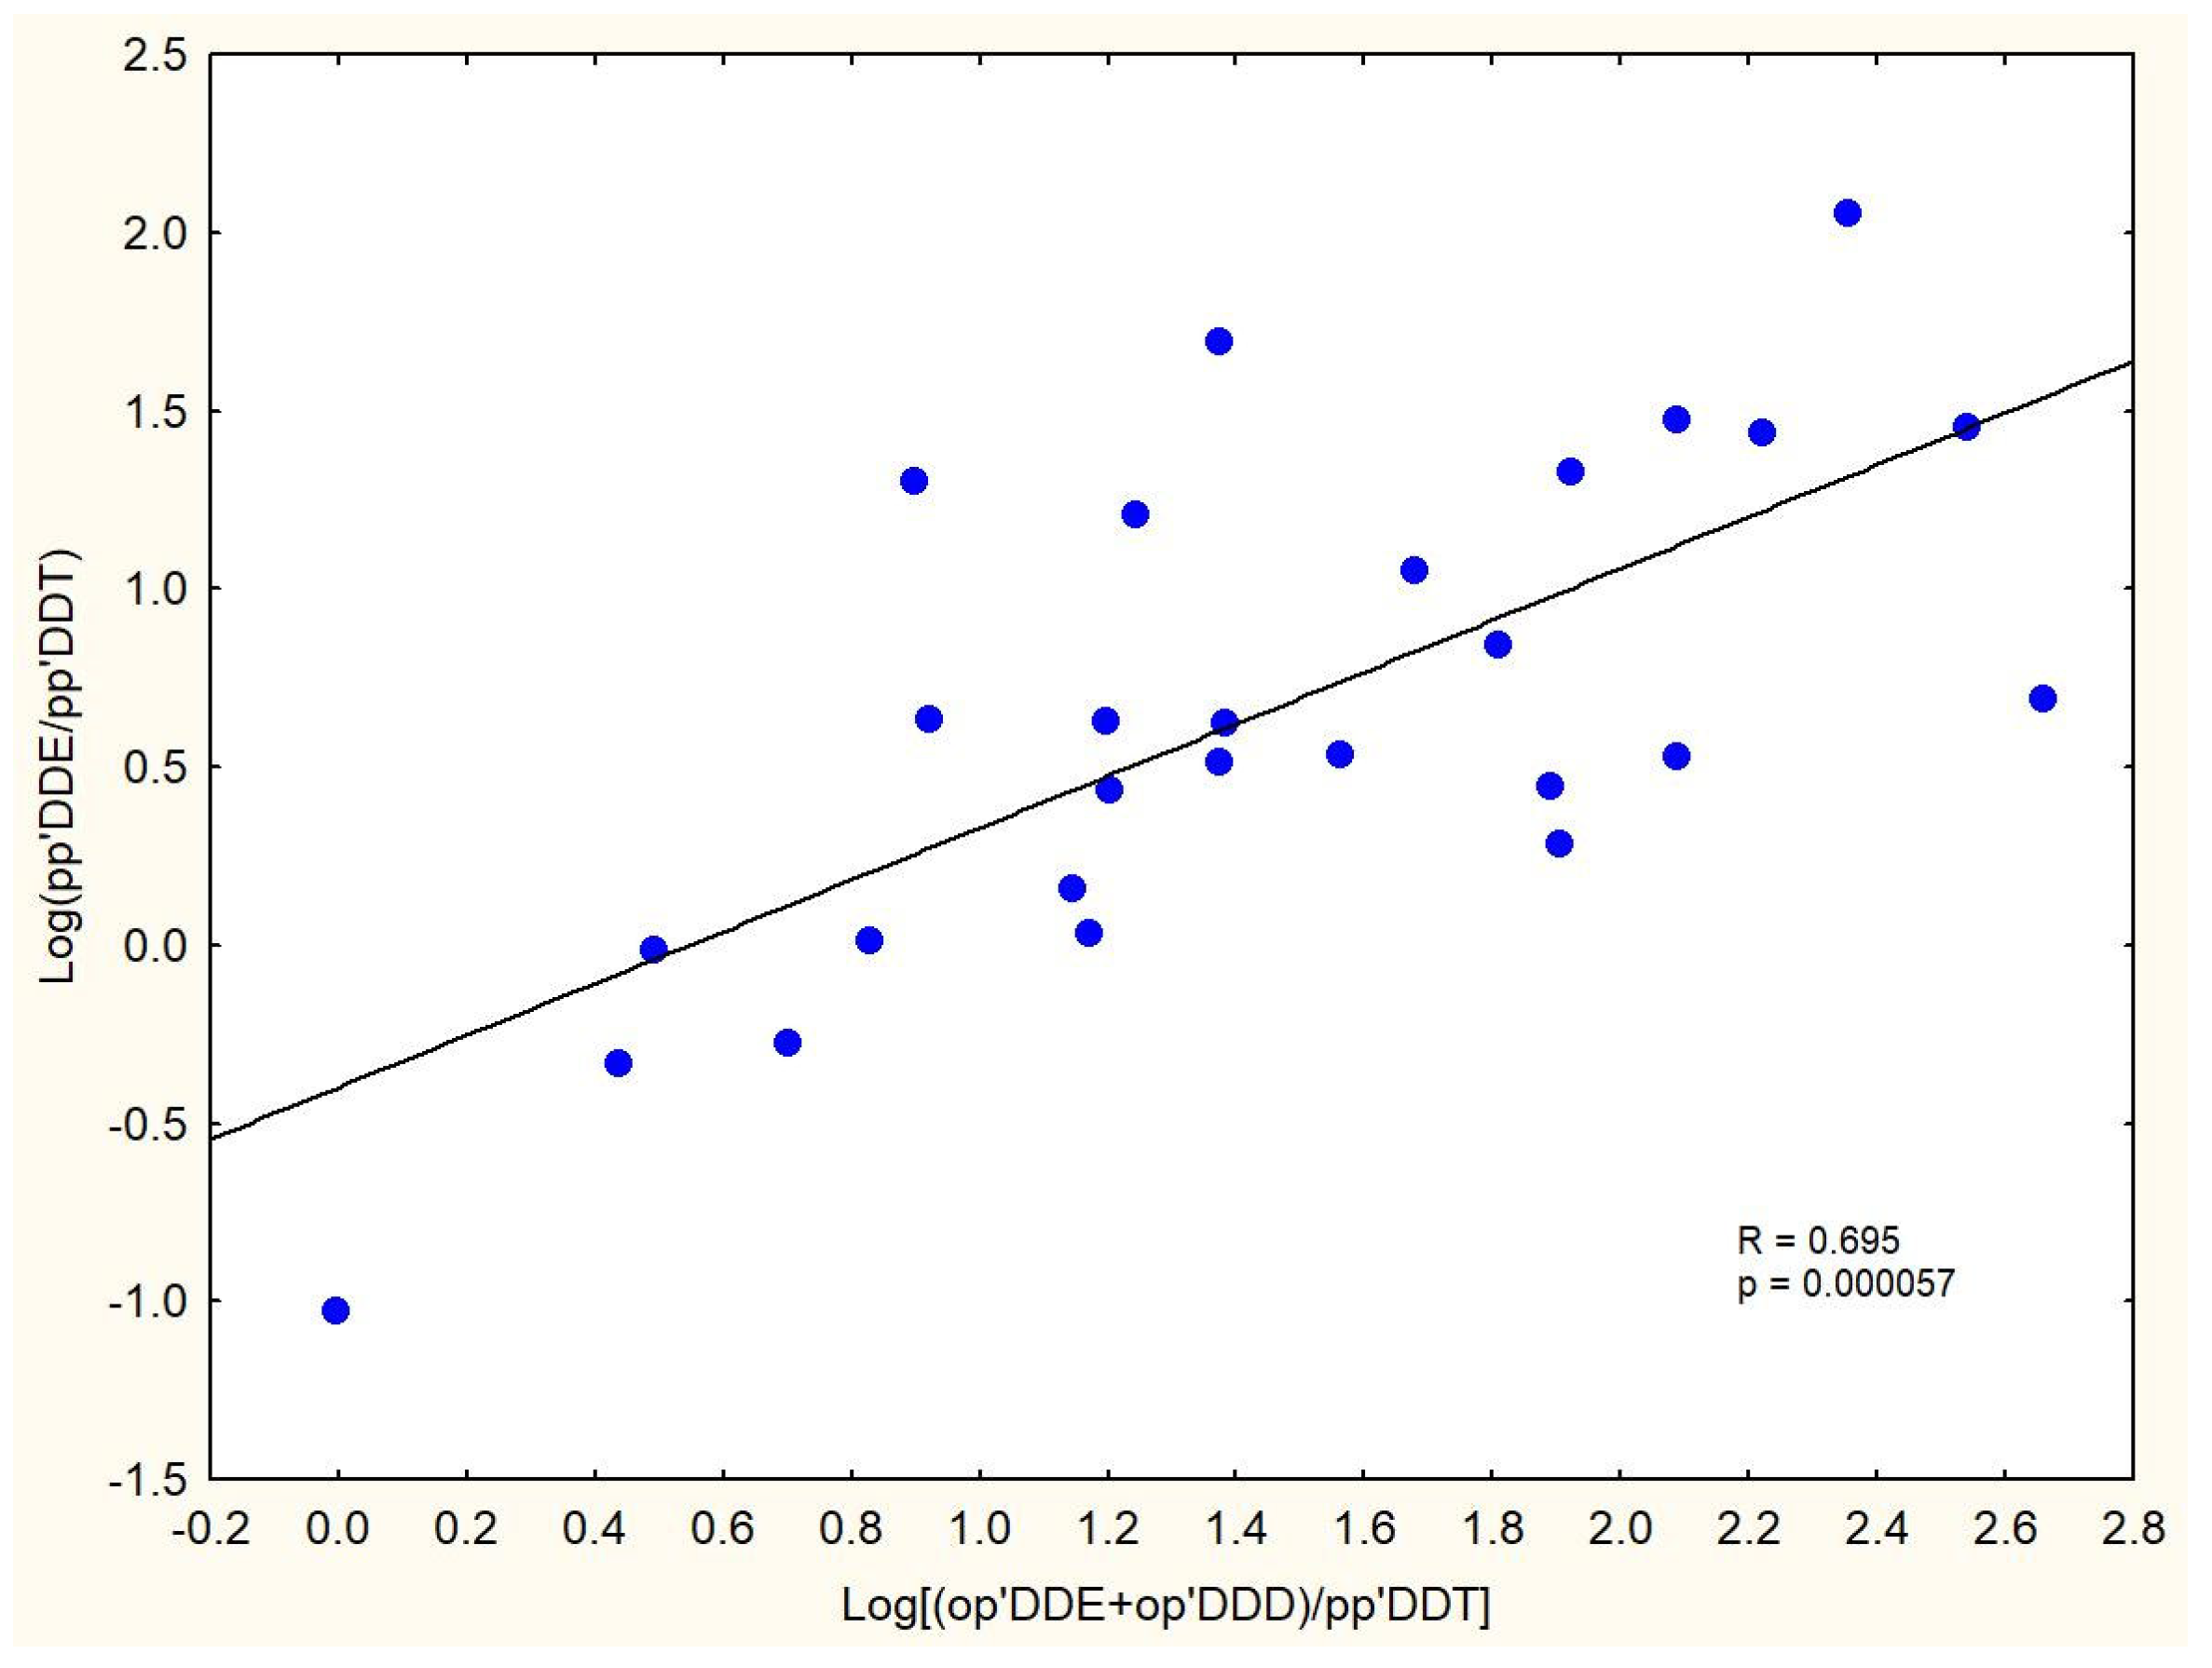
3.3. DDT Isomer Composition and Ratios

The relative contribution to the total DDT content (Figure 3) was pp′DDE (43.2%) > op′DDT (23.8%) > pp′DDT (13.2%) > op′DDD (7.3%) > pp′DDD (6.7%) >op′DDE (6.4%). For the first three isomers (pp′DDE, op′DDT, and pp′DDT), a similar trend was observed in the behavioral groups, while minimal differences existed for op′DDD, pp′DDD, and op′DDE (Table 4). The only significant difference between the groups was between (V) and (A) for pp′DDT, with a higher percentage in group (A). Typically, technical DDT is composed of pp′DDT (77.1%), op′DDT (14.9%), pp′DDD (0.3%), op′DDD (0.1%), pp′DDE (4.0%), op′DDE (0.1%), unidentified compounds (3.5%) [65], and a (pp′DDE/pp′DDT) ratio of 0.05. If the ratio (pp′DDE/pp′DDT) has high values, it can be deduced that the majority of the active substance (pp′DDT) has been degraded to pp′DDE, and, therefore, there were no recent deposits of insecticide into that ecosystem [66]. In all the zooplankton samples the pp′DDE/pp′DDT ratio had a mean value of 4.55, with a range from 0.78 to 12.97. Clearly, this is a value higher than 0.05 of the technical DDT, but is not so high as to suggest an historic introduction of the pesticide. The (pp′DDE/DDTs) ratio, as well as having a similar meaning to the (pp′DDE/pp′DDT) ratio, can also indicate the efficiency of the metabolic processes [67]. In fact, the (ppDDE/DDTs) ratio indicates the relative abundance of metabolized forms of DDT. In this study, zooplankton showed a ratio that varied from 0.23 to 0.65, with a mean of 0.43. A value of this ratio equal to 0.6 is considered critical, while higher values indicate that there are no new contamination inputs in the study area [68]. The value found in our samples thus highlighted an alarming situation.
Another ratio used as an indicator of fresh or altered residues [69] was that between the sum of pp′DDE and pp′DDD on the pp′DDT [(pp′DDE + pp′DDD)/pp′DDT].
Normally, a value of 1 is taken to distinguish between legacy and recent DDT inputs [70]. The mean value found for all of the samples was 5.23, with a range in different feeding behavior from 3.30 (A) to 7.80 (V). A total of 100% of the 28 samples had a value of this ratio > 1. These results suggest the recent use of DDT in the Nosy Be area, likely illegally. This theory is further supported by the relationship that is seen between the op′ isomers of DDT and DDTs [(op′DDE + op′DDD + op′DDT)/DDTs]. A sum of op′ isomers that exceed 20% of total DDT suggests a non-insecticide (or industrial) source of this xenobiotic [71]. In fact, the waste products from the processing of technical DDT are generally enriched with op′ isomers with respect to pp′DDT: the resulting compound finds application on an industrial level, and it is not subject to regulation for the use of DDT insecticide mixtures [72]. The value for all of the samples was 0.37, with a range of 0.21–0.56. The same results were obtained by separating the four types of sampling with the values of this ratio that were higher than 20% (Table 4), and this suggests that there is an excess of op′ isomers used in DDT mixtures, which possibly indicates that the xenobiotic is of industrial origin. Furthermore, the (op′DDT/pp′DDT) ratio is considered a discriminating indicator between the use of Technical DDT and dicofol [69,73]. The latter is a miticidal pesticide and acaricide synthesized from DDT and, thus, the isomers op′DDT, op′DDE, pp′DDT, or pp′-Cl-DDT (1,2,2,2-tetrachloro-1,1-bis(4-chlorophenyl)ethane—a chlorinated DDT intermediate that leads to dicofol prior hydrolysis)––are usually found in formulations of this pesticide [60,74]. Dicofol is very toxic to aquatic organisms, and it is highly bioaccumulative and degrades moderately slowly in both soil and sediments. It can be identified as a POP in terms of its long-range transport potential exhibiting a higher Arctic contamination potential [75]. Dicofol is also known to be neurotoxic and to possess endocrine disrupting properties, and this is the case both as an original product and with decomposition products [76]. Dicofol was listed in Annex A of the Stockholm Convention on Persistent Organic Pollutants only after the ninth meeting of the Conference of the Parties held in 2019 [77].
The concentration range of DDT impurities can vary widely. The total DDT content was found between 0.3% and 14.3% of the total weight of dicofol [78], although dicofol produced in China was reported to have on average 20% of DDT [73,79]. Given that in technical DDT, it is typically ~0.19 [80], and given that op′DDT shows a shorter half-life than pp′DDT in the environment [81], it seems reasonable to assume the influence of dicofol-type contamination when encountering an (op′DDT/pp′DDT) value > 0.2. In these samples, the mean value of this ratio was 2.42, ranging from 0.36 to 7.79. Values of this ratio > 0.2 were observed in 37% of the samples, and this indicates possible dicofol contamination. After applying the data log transformation to meet the criterion for normality, an attempt was made to evaluate whether there was a correlation between the [(pp′DDE+pp′DDD)/pp′DDT] and (pp′DDE/pp′DDT) ratios, which would have further confirmed the possible presence of dicofol. This is always linked to the degradation of the pp′-Cl-DDT impurity of dicofol, which, by degrading into pp′DDE, would increase the values of the ratios. The significant Pearson correlation coefficient (Figure 4) suggests this as a possible route of contamination for the analyzed zooplankton.
Finally, we evaluated the relationship between DDTs and PCBs, the ratio of which (DDTs/PCBs) is indicative of contamination that is more likely to be of agricultural origin if the value is >1, and more likely to be of industrial origin if the value is <1 [82]. A total mean value for 28 samples of 0.65 with a range in the different groups between 0.64 (V) and 0.68 (A) indicates that in the waters of Nosy Be, where the plankton were sampled, the greatest impact is likely to be generated from the industrialized areas. This seems to contrast with the fact that agriculture (cotton, tobacco, coffee, cacao, and cinnamon, as well as other spices) is the main activity in the area and makes the largest contribution to Madagascar’s economy, employing about 85% of the population, followed by tourism, the production of goods with low added value, and then the mining sector [83]. However, the area surrounding Madagascar, which is very important for the richness of biodiversity, is considered as one of the areas with the greatest human impact [84].

3.4. Potential POPs Uptake in the Whale Shark

Three samples collected in the control area and three in the feeding area for each of the feeding behaviors were analyzed for mesozooplankton composition, and the results were reported in Bava et al. [12]. No significant differences were found between the feeding and the control areas. The total number of individuals was 472.44 ± 44.32 ind/m3 (mean ± S.E.). The most common taxonomic group was Copepoda, followed by Appendicularia, Mollusca, and Chaetognatha. Biomass was calculated for each sample with the method of Di Capua et al. [85]. Wet biomass was 30.51 ± 3.57 mg/m3, and 80% was represented by size class ≤ 2 mm, mostly by Copepoda. Wet biomass was higher in the control area compared to the feeding area, probably due to the absence of predator pressure, including the whale shark. However, this difference was not statistically significant. In the Nosy Be area at the time of zooplankton sampling, 48 whale sharks of approximately 4 m (m) were identified. On average, a whale shark about 4 m in length filters 326 m3/h of water [9]. In a habitat rich in planktonic species, such as Cabo Catoche (Mexico), which has a fresh plankton biomass of 4.5 g/m3, a 4 m long individual collects about 1467 g/h of plankton. By filtering for 7.5 h/day on the surface, it takes in about 11,002.5 g of plankton per day, which at 1.357 kJ/g corresponds to 14,931 kJ/day (3569 kcal/day) [9]. Considering that the total fresh biomass found in Nosy Be is about 30.51 mg/m3, a 4 m whale shark could ingest about 74.60 g of plankton per day, which would correspond to about 101.23 kJ/day (24.19 kcal/day). This calculation allows us to deduce that in the waters of the island of Nosy Be, the individuals of R. typus cannot obtain the energy necessary to maintain their body biomass from plankton alone, and this is insufficient for their survival. In the feeding grounds in which whale sharks were identified in Nosy Be, in addition to plankton, there are also tuna, anchovies, mackerels, and other small nektonic species, and, as suggested by Diamant et al. [86], based on routine visual observations of sharks following—and occasionally successfully feeding on—bait fish, they could be the primary target when the sharks are near Nosy Be. There are not many studies in the literature that demonstrate this hypothesis, with the exception of the work by Boldrocchi and Bettinetti [87] carried out in the Gulf of Tadjoura (Djibouti), where whale sharks were filmed while feeding on a school of anchovies, probably belonging to the genera Encrasicholina or Stolephorus, or also in Honduras [88], the Philippines [89], the Azores [90], and Baja California (Mexico) [91]. The low amount of plankton ingested daily, on average, by the whale shark makes this ingestion route of little importance in the contribution to the total load of contamination assumed with the diet by the large filter feeder. To quantify the input of organochlorines through the ingestion of plankton based on the toxicological results obtained, we determined 74.60 g/day diet of plankton × 101.27 ng/g (HCB + DDTs + PCBs) in plankton = 7554.74 ng/day input of OCs with the plankton. Considering that a 4 m shark weighs about 500 kg [92], our findings would correspond to a daily intake of OCs equal to 15.11 ng/kg. This value turns out to be even lower than the quantity established for humans, which is defined as the daily allowable level without experiencing any harmful effects. The thresholds estimated by the World Health Organization (WHO) are 60 and 1200 μg/person/day, respectively, for PCBs and DDTs [93]. Considering a man who weighs 73 kg, these values correspond to an allowance of 822 ng/kg/day of PCBs and 16,438 ng/kg/day of DDTs. The EFSA Scientific Panel on Contaminants [94] estimated an average daily intake of non-dioxin like PCBs (NDL-PCBs) of about 15 ng/kg of body weight (assuming a body weight of 60 kg) per day for the “average” consumer, 20 ng/kg of body weight per day for large consumers of meat products, and about 35 ng/kg of body weight per day for large consumers of fish and fishery products. These comparisons were reported to demonstrate that a local whale shark’s intake of these xenobiotics on a plankton-only diet is negligible. It would be interesting to have subcutaneous biopsies of these animals in order to evaluate the real levels of the accumulated organochlorines, and also to consider other routes of intake, such as small fishes, as has been suggested by Diamant et al. [86].

4. Conclusions

This study was the first to evaluate organochlorines in mesozooplankton along the island of Nosy Be that were sampled during the seasonal aggregation of whale sharks, and that were toxicologically evaluated by the function of the different feeding behaviors in this species. The results were preliminary, especially since the number of samples for each group was limited. Despite this, we can still conclude that the levels of the three xenobiotics investigated were lower than in other areas of the world. The fingerprint of DDTs is particularly interesting as it seems to highlight an important contamination by dicofol or, in any case, a recent introduction of DDT. Additionally, a greater presence of PCBs was observed compared to other xenobiotics, in particular of the congeners considered more recalcitrant, such as PCB153, PCB138, and PCB180. There were also no substantial differences between the feeding areas of the whale shark and those where the whale shark was not encountered, either in terms of the characterization and the volume of biomass or the levels of contamination. Finally, we found that the amount of plankton consumed on average per day by the whale shark may not only be insufficient for the growth of its biomass and for its overall energy requirements but that it may also contribute a truly negligible amount of contaminants, and so it absolutely cannot be considered a potential toxicological hazard for this filter feeder shark.

Author Contributions

Conceptualization, L.M., G.C. and P.M.; data curation, L.M., G.C., P.B. and P.M.; formal analysis, L.M. and G.C.; investigation, L.M., G.C., P.R., R.R., P.B., F.R.R. and P.M.; methodology, L.M., G.C. and P.M.; project administration, L.M. and P.M.; resources, L.M. and P.M.; supervision, L.M. and P.M.; validation, L.M. and G.C.; writing—original draft, L.M., G.C. and P.M.; writing—review and editing, L.M., G.C. and P.M. All authors have read and agreed to the published version of the manuscript.

Funding

This research received no external funding.

Institutional Review Board Statement

The study did not require ethical approval.

Informed Consent Statement

Not applicable.

Data Availability Statement

Not applicable.

Acknowledgments

The authors are grateful to the staff of Manta Diving Center (Nosy Be) for the logistic support.

Conflicts of Interest

The authors declare no conflict of interest.

References

  1. Bettinetti, R.; Manca, M. Understanding the Role of Zooplankton in Transfer of Pollutants through Trophic Food Webs. In Zooplankton: Species Diversity, Distribution and Seasonal Dynamics; Nova Science Publishers, Inc.: Hauppauge, NY, USA, 2013; p. 18. [Google Scholar]
  2. Boldrocchi, G.; Moussa Omar, Y.; Rowat, D.; Bettinetti, R. First Results on Zooplankton Community Composition and Contamination by Some Persistent Organic Pollutants in the Gulf of Tadjoura (Djibouti). Sci. Total Environ. 2018, 627, 812–821. [Google Scholar] [CrossRef]
  3. Nybakken, J.W. Marine Biology: An Ecological Approach, 5th ed.; Benjamin Cummings: San Francisco, CA, USA, 2001; ISBN 9780321030764. [Google Scholar]
  4. Compagno, L.J.V. Bullhead, Mackerel and Carpet Sharks: Heterodontiformes, Lamniformes and Orectolobiformes. In Sharks of the World: An Annotated and Illustrated Catalogue of Shark Species Known to Date; Food and Agriculture Organization of the United Nations: Rome, Italy, 2001; ISBN 9789251045435. [Google Scholar]
  5. Norman, B. Rhincodon typus. In The IUCN Red List of Threatened Species 2000; IUCN: Gland, Switzerland, 2000. [Google Scholar]
  6. Norman, B. Rhincodon typus. In The IUCN Red List of Threatened Species 2005; IUCN: Gland, Switzerland, 2005. [Google Scholar]
  7. Pierce, S.J.; Norman, B. Rhincodon typus. In The IUCN Red List of Threatened Species 2016; IUCN: Gland, Switzerland, 2016. [Google Scholar]
  8. Colman, J.G. A Review of the Biology and Ecology of the Whale Shark. J. Fish Biol. 1997, 51, 1219–1234. [Google Scholar] [CrossRef]
  9. Motta, P.J.; Maslanka, M.; Hueter, R.E.; Davis, R.L.; de la Parra, R.; Mulvany, S.L.; Habegger, M.L.; Strother, J.A.; Mara, K.R.; Gardiner, J.M.; et al. Feeding Anatomy, Filter-Feeding Rate, and Diet of Whale Sharks Rhincodon Typus during Surface Ram Filter Feeding off the Yucatan Peninsula, Mexico. Zoology 2010, 113, 199–212. [Google Scholar] [CrossRef]
  10. Hacohen-Domené, A.; Galván-Magaña, F.; Ketchum-Mejia, J. Abundance of Whale Shark (Rhincodon Typus) Preferred Prey Species in the Southern Gulf of California, Mexico. Cybium 2006, 30, 99–102. [Google Scholar]
  11. Reyes-Mendoza, O.; Cárdenas-Palomo, N.; Herrera-Silveira, J.; Mimila-Herrera, E.; Trujillo-Córdova, J.; Chiappa-Carrara, X.; Arceo-Carranza, D. Quantity and Quality of Prey Available for the Whale Shark (Rhincodon typus, Smith 1828) at the Mexican Caribbean Aggregation Site. Reg. Stud. Mar. Sci. 2021, 43, 101696. [Google Scholar] [CrossRef]
  12. Bava, P.; Micarelli, P.; Buttino, I. Zooplankton Assemblage Diversity in the Whale Shark Rhincodon Typus Aggregation Area of Nosy Be (Madagascar). Estuar. Coast. Shelf Sci. 2022, 279, 108159. [Google Scholar] [CrossRef]
  13. Petatán-Ramírez, D.; Whitehead, D.A.; Guerrero-Izquierdo, T.; Ojeda-Ruiz, M.A.; Becerril-García, E.E. Habitat Suitability of Rhincodon Typus in Three Localities of the Gulf of California: Environmental Drivers of Seasonal Aggregations. J. Fish Biol. 2020, 97, 1177–1186. [Google Scholar] [CrossRef]
  14. Taylor, L.R.; Compagno, L.J.V.; Struhsaker, P.J. Megamouth—A New Species, Genus, and Family of Lamnoid Shark (Megachasma pelagios, Family Megachasmidae) from the Hawaiian Islands. Proc. Calif. Acad. Sci. 1983, 43, 87–110. [Google Scholar]
  15. Rowat, D.; Brooks, K.; March, A.; McCarten, C.; Jouannet, D.; Riley, L.; Jeffreys, G.; Perri, M.; Vely, M.; Pardigon, B.; et al. Long-Term Membership of Whale Sharks (Rhincodon typus) in Coastal Aggregations in Seychelles and Djibouti. Mar. Freshw. Res. 2011, 62, 621–627. [Google Scholar] [CrossRef] [Green Version]
  16. Sequeira, A.M.M.; Mellin, C.; Fordham, D.A.; Meekan, M.G.; Bradshaw, C.J.A. Predicting Current and Future Global Distributions of Whale Sharks. Glob. Change Biol. 2014, 20, 778–789. [Google Scholar] [CrossRef]
  17. Castro, A.L.F.; Stewart, B.S.; Wilson, S.G.; Hueter, R.E.; Meekan, M.G.; Motta, P.J.; Bowen, B.W.; Karl, S.A. Population Genetic Structure of Earth’s Largest Fish, the Whale Shark (Rhincodon typus). Mol. Ecol. 2007, 16, 5183–5192. [Google Scholar] [CrossRef]
  18. Pierce, S.J.; Méndez-Jiménez, A.; Collins, K.; Rosero-Caicedo, M.; Monadjem, A. Developing a Code of Conduct for Whale Shark Interactions in Mozambique. Aquat. Conserv. Mar. Freshw. Ecosyst. 2010, 20, 782–788. [Google Scholar] [CrossRef]
  19. Berumen, M.L.; Braun, C.D.; Cochran, J.E.M.; Skomal, G.B.; Thorrold, S.R. Movement Patterns of Juvenile Whale Sharks Tagged at an Aggregation Site in the Red Sea. PLoS ONE 2014, 9, e103536. [Google Scholar] [CrossRef] [Green Version]
  20. Fossi, M.C.; Baini, M.; Panti, C.; Galli, M.; Jiménez, B.; Muñoz-Arnanz, J.; Marsili, L.; Finoia, M.G.; Ramírez-Macías, D. Are Whale Sharks Exposed to Persistent Organic Pollutants and Plastic Pollution in the Gulf of California (Mexico)? First Ecotoxicological Investigation Using Skin Biopsies. Comp. Biochem. Physiol. Part C Toxicol. Pharmacol. 2017, 199, 48–58. [Google Scholar] [CrossRef]
  21. Heyman, W.D.; Graham, R.T.; Kjerfve, B.; Johannes, R.E. Whale Sharks Rhincodon Typus Aggregate to Feed on Fish Spawn in Belize. Mar. Ecol. Prog. Ser. 2001, 215, 275–282. [Google Scholar] [CrossRef]
  22. Meekan, M.G.; Jarman, S.N.; McLean, C.; Schultz, M.B.; Meekan, M.G.; Jarman, S.N.; McLean, C.; Schultz, M.B. DNA Evidence of Whale Sharks (Rhincodon typus) Feeding on Red Crab (Gecarcoidea natalis) Larvae at Christmas Island, Australia. Mar. Freshw. Res. 2009, 60, 607–609. [Google Scholar] [CrossRef]
  23. Meekan, M.G.; Bradshaw, C.J.A.; Press, M.; McLean, C.; Richards, A.; Quasnichka, S.; Taylor, J.G. Population Size and Structure of Whale Sharks Rhincodon typus at Ningaloo Reef, Western Australia. Mar. Ecol. Prog. Ser. 2006, 319, 275–285. [Google Scholar] [CrossRef] [Green Version]
  24. Boldrocchi, G.; Monticelli, D.; Butti, L.; Omar, M.; Bettinetti, R. First Concurrent Assessment of Elemental- and Organic-Contaminant Loads in Skin Biopsies of Whale Sharks from Djibouti. Sci. Total Environ. 2020, 722, 137841. [Google Scholar] [CrossRef]
  25. Davis, D.; Banks, S.; Birtles, A.; Valentine, P.; Cuthill, M. Whale Sharks in Ningaloo Marine Park: Managing Tourism in an Australian Marine Protected Area. Tour. Manag. 1997, 18, 259–271. [Google Scholar] [CrossRef]
  26. Graham, R.; Irvine, T.R.; Keesing, J.K. Iterative Planning and Adaptive Management of Whale Shark Tourism in Belize: Global Implications of Lessons Learnt from 1998 and 2004. In CSIRO Marine and Atmospheric Research; CSIRO: Canberra, Australia, 2007; pp. 73–74. [Google Scholar]
  27. Quiros, A.L. Tourist Compliance to a Code of Conduct and the Resulting Effects on Whale Shark (Rhincodon typus) Behavior in Donsol, Philippines. Fish. Res. 2007, 84, 102–108. [Google Scholar] [CrossRef]
  28. Rowat, D.; Meekan, M.G.; Engelhardt, U.; Pardigon, B.; Vely, M. Aggregations of Juvenile Whale Sharks (Rhincodon typus) in the Gulf of Tadjoura, Djibouti. Environ. Biol. Fishes 2007, 80, 465–472. [Google Scholar] [CrossRef]
  29. Fossi, M.C.; Coppola, D.; Baini, M.; Giannetti, M.; Guerranti, C.; Marsili, L.; Panti, C.; de Sabata, E.; Clò, S. Large Filter Feeding Marine Organisms as Indicators of Microplastic in the Pelagic Environment: The Case Studies of the Mediterranean Basking Shark (Cetorhinus maximus) and Fin Whale (Balaenoptera physalus). Mar. Environ. Res. 2014, 100, 17–24. [Google Scholar] [CrossRef]
  30. Tiktak, G.P.; Butcher, D.; Lawrence, P.J.; Norrey, J.; Bradley, L.; Shaw, K.; Preziosi, R.; Megson, D. Are Concentrations of Pollutants in Sharks, Rays and Skates (Elasmobranchii) a Cause for Concern? A Systematic Review. Mar. Pollut. Bull. 2020, 160, 111701. [Google Scholar] [CrossRef]
  31. Consales, G.; Marsili, L. Assessment of the Conservation Status of Chondrichthyans: Underestimation of the Pollution Threat. Eur. Zool. J. 2021, 87, 165–180. [Google Scholar] [CrossRef]
  32. Chiuchiolo, A.L.; Dickhut, R.M.; Cochran, M.A.; Ducklow, H.W. Persistent Organic Pollutants at the Base of the Antarctic Marine Food Web. Environ. Sci. Technol. 2004, 38, 3551–3557. [Google Scholar] [CrossRef] [Green Version]
  33. Castro-Jiménez, J.; Bănaru, D.; Chen, C.-T.; Jiménez, B.; Muñoz-Arnanz, J.; Deviller, G.; Sempéré, R. Persistent Organic Pollutants Burden, Trophic Magnification and Risk in a Pelagic Food Web from Coastal NW Mediterranean Sea. Environ. Sci. Technol. 2021, 55, 9557–9568. [Google Scholar] [CrossRef]
  34. Mäkinen, K.; Elfving, M.; Hänninen, J.; Laaksonen, L.; Rajasilta, M.; Vuorinen, I.; Suomela, J.-P. Fatty Acid Composition and Lipid Content in the Copepod Limnocalanus Macrurus during Summer in the Southern Bothnian Sea. Helgol. Mar. Res. 2017, 71, 11. [Google Scholar] [CrossRef] [Green Version]
  35. Harmelin-Vivien, M.; Bănaru, D.; Dromard, C.R.; Ourgaud, M.; Carlotti, F. Biochemical Composition and Energy Content of Size-Fractionated Zooplankton East of the Kerguelen Islands. Polar Biol. 2019, 42, 603–617. [Google Scholar] [CrossRef]
  36. Basu, S.; Chanda, A.; Gogoi, P.; Bhattacharyya, S. Organochlorine Pesticides and Heavy Metals in the Zooplankton, Fishes, and Shrimps of Tropical Shallow Tidal Creeks and the Associated Human Health Risk. Mar. Pollut. Bull. 2021, 165, 112170. [Google Scholar] [CrossRef]
  37. UNEP. Report of the Persistent Organic Pollutants Review Committee on the Work of Its Seventeenth Meeting. In Proceedings of the Seventeenth Meeting of the Persistent Organic Pollutants Review Committee, Geneva, Switzerland, 24–28 January 2022; p. 56. [Google Scholar]
  38. Marsili, L.; Jiménez, B.; Borrell, A. Chapter 7—Persistent Organic Pollutants in Cetaceans Living in a Hotspot Area: The Mediterranean Sea. In Marine Mammal Ecotoxicology; Fossi, M.C., Panti, C., Eds.; Academic Press: Cambridge, MA, USA, 2018; pp. 185–212. ISBN 978-0-12-812144-3. [Google Scholar]
  39. Marsili, L.; Coppola, D.; Giannetti, M.; Casini, S.; Fossi, M.C.; van Wyk, J.; Sperone, E.; Tripepi, S.; Micarelli, P.; Rizzuto, S. Skin Biopsies as a Sensitive Non-Lethal Technique for the Ecotoxicological Studies of Great White Shark (Carcharodon carcharias) Sampled in South Africa. Expert Opin. Environ. Biol. 2016, 4, 1000126. [Google Scholar] [CrossRef] [Green Version]
  40. Maddocks, R.F. Distribution Patterns of Living and Subfossil Podocopid Ostracodes in the Nosy Bé Area, Northern Madagascar. Univ. Kans. Paleontol. Contrib. 1966, 72, 12. [Google Scholar]
  41. Goodman, S.M.; Benstead, J.P. (Eds.) The Natural History of Madagascar; University of Chicago Press: Chicago, IL, USA, 2003; ISBN 9780226303062. [Google Scholar]
  42. Jonahson, M.; Harding, S. Occurrence of Whale Sharks (Rhincodon typus) in Madagascar. Fish. Res. 2007, 84, 132–135. [Google Scholar] [CrossRef]
  43. Kiszka, J.; van der Elst, R. 11. Elasmobranchs (Sharks and Rays): A Review of Status, Distribution and Interaction with Fisheries of the Southwest Indian Ocean. In Offshore Fisheries of the Southwest Indian Ocean; Oceanographic Research Institute: Durban, South Africa, 2015; pp. 365–390. [Google Scholar]
  44. Brenier, A.; Vogel, A. Integrating Conservation and Development in Madagascar’s Marine Protected Areas. In Marine Protected Areas: Interactions with Fishery Livelihoods and Food Security; FAO: Rome, Italy, 2017; ISBN 9789251096062. [Google Scholar]
  45. Diamant, S.; Rohner, C.A.; Kiszka, J.J.; d’Echon, A.G.; d’Echon, T.G.; Sourisseau, E.; Pierce, S.J. Movements and Habitat Use of Satellite-Tagged Whale Sharks off Western Madagascar. Endanger. Species Res. 2018, 36, 49–58. [Google Scholar] [CrossRef] [Green Version]
  46. Rohner, C.A.; Richardson, A.J.; Prebble, C.E.M.; Marshall, A.D.; Bennett, M.B.; Weeks, S.J.; Cliff, G.; Wintner, S.P.; Pierce, S.J. Laser Photogrammetry Improves Size and Demographic Estimates for Whale Sharks. PeerJ 2015, 3, e886. [Google Scholar] [CrossRef] [Green Version]
  47. Nelson, J.D.; Eckert, S.A. Foraging Ecology of Whale Sharks (Rhincodon typus) within Bahía de Los Angeles, Baja California Norte, México. Fish. Res. 2007, 84, 47–64. [Google Scholar] [CrossRef]
  48. Giam, C.S.; Wong, M.K.; Hanks, A.R.; Sackett, W.M.; Richardson, R.L. Chlorinated Hydrocarbons in Plankton from the Gulf of Mexico and Northern Caribbean. Bull. Environ. Contam. Toxicol. 1973, 9, 376–382. [Google Scholar] [CrossRef]
  49. Linko, R.R.; Raniamaki, P.; Urpo, K. PCB Residues in Plankton and Sediment in the Southwestern Coast of Finland. Bull. Environ. Contam. Toxicol. 1974, 12, 733–738. [Google Scholar] [CrossRef]
  50. Joiris, C.R.; Overloop, W. PCBs and Organochlorine Pesticides in Phytoplankton and Zooplankton in the Indian Sector of the Southern Ocean. Antarct. Sci. 1991, 3, 371–377. [Google Scholar] [CrossRef] [Green Version]
  51. Focardi, S.; Bargagli, R.; Corsolini, S. Organochlorines in Antarctic Marine Food Chain at Terranova Bay (Ross Sea). Korean J. Polar Res. 1993, 4, 73–77. [Google Scholar]
  52. Ray, S.; Paranjape, M.A.; Koenig, B.; Paterson, G.; Metcalfe, T.; Metcalfe, C. Polychlorinated Biphenyls and Other Organochlorine Compounds in Marine Zooplankton off the East Coast of Newfoundland, Canada. Mar. Environ. Res. 1999, 47, 103–116. [Google Scholar] [CrossRef]
  53. Fossi, M.C.; Borsani, J.F.; Di Mento, R.; Marsili, L.; Casini, S.; Neri, G.; Mori, G.; Ancora, S.; Leonzio, C.; Minutoli, R.; et al. Multi-Trial Biomarker Approach in Meganyctiphanes Norvegica: A Potential Early Indicator of Health Status of the Mediterranean “Whale Sanctuary”. Mar. Environ. Res. 2002, 54, 761–767. [Google Scholar] [CrossRef]
  54. Quental, T.; Ferreira, A.M.; Vale, C. The Distribution of PCBs and DDTs in Seston and Plankton along the Portuguese Coast. Acta Oecol. 2003, 24, S333–S339. [Google Scholar] [CrossRef]
  55. Berrojalbiz, N.; Dachs, J.; Ojeda, M.J.; Valle, M.C.; Castro-Jiménez, J.; Wollgast, J.; Ghiani, M.; Hanke, G.; Zaldivar, J.M. Biogeochemical and Physical Controls on Concentrations of Polycyclic Aromatic Hydrocarbons in Water and Plankton of the Mediterranean and Black Seas. Glob. Biogeochem. Cycles 2011, 25, GB4003. [Google Scholar] [CrossRef] [Green Version]
  56. Frouin, H.; Dangerfield, N.; Macdonald, R.W.; Galbraith, M.; Crewe, N.; Shaw, P.; Mackas, D.; Ross, P.S. Partitioning and Bioaccumulation of PCBs and PBDEs in Marine Plankton from the Strait of Georgia, British Columbia, Canada. Prog. Oceanogr. 2013, 115, 65–75. [Google Scholar] [CrossRef]
  57. Desforges, J.-P.W.; Dangerfield, N.; Shaw, P.D.; Ross, P.S. Heightened Biological Uptake of Polybrominated Diphenyl Ethers Relative to Polychlorinated Biphenyls Near-Source Revealed by Sediment and Plankton Profiles along a Coastal Transect in British Columbia. Environ. Sci. Technol. 2014, 48, 6981–6988. [Google Scholar] [CrossRef]
  58. Morales, L.; Dachs, J.; Fernández-Pinos, M.-C.; Berrojalbiz, N.; Mompean, C.; González-Gaya, B.; Jiménez, B.; Bode, A.; Ábalos, M.; Abad, E. Oceanic Sink and Biogeochemical Controls on the Accumulation of Polychlorinated Dibenzo-p-Dioxins, Dibenzofurans, and Biphenyls in Plankton. Environ. Sci. Technol. 2015, 49, 13853–13861. [Google Scholar] [CrossRef]
  59. Kang, Y.; Zhang, R.; Yu, K.; Han, M.; Pei, J.; Chen, Z.; Wang, Y. Organochlorine Pesticides (OCPs) in Corals and Plankton from a Coastal Coral Reef Ecosystem, South China Sea. Environ. Res. 2022, 214, 114060. [Google Scholar] [CrossRef]
  60. Wolff, M.S.; Thornton, J.; Fischbein, A.; Lilis, R.; Selikoff, I.J. Disposition of Polychlorinated Biphenyl Congeners in Occupationally Exposed Persons. Toxicol. Appl. Pharmacol. 1982, 62, 294–306. [Google Scholar] [CrossRef]
  61. Safe, S.; Bandiera, S.; Sawyer, T.; Zmudzka, B.; Mason, G.; Romkes, M.; Denomme, M.A.; Sparling, J.; Okey, A.B.; Fujita, T. Effects of Structure on Binding to the 2,3,7,8-TCDD Receptor Protein and AHH Induction—Halogenated Biphenyls. Environ. Health Perspect. 1985, 61, 21–33. [Google Scholar] [CrossRef] [Green Version]
  62. Bush, B.; Snow, J.; Koblintz, R. Polychlorobiphenyl (PCB) Congeners,p,P′-DDE, and Hexachlorobenzene in Maternal and Fetal Cord Blood from Mothers in Upstate New York. Arch. Environ. Contam. Toxicol. 1984, 13, 517–527. [Google Scholar] [CrossRef]
  63. Clarke, J.U. Structure-Activity Relationships in PCBs: Use of Principal Components Analysis to Predict Inducers of Mixed-Function Oxidase Activity. Chemosphere 1986, 15, 275–287. [Google Scholar] [CrossRef]
  64. Marsili, L.; D’Agostino, A.; Bucalossi, D.; Malatesta, T.; Fossi, M.C. Theoretical Models to Evaluate Hazard Due to Organochlorine Compounds (OCs) in Mediterranean Striped Dolphin (Stenella coeruleoalba). Chemosphere 2004, 56, 791–801. [Google Scholar] [CrossRef]
  65. World Health Organization (WHO) (Ed.) DDT and Its Derivatives: Environmental Aspects; World Health Organization: Geneva, Switzerland, 1989; ISBN 9789241542838. [Google Scholar]
  66. Aguilar, A. Relationship of DDE/ΣDDT in Marine Mammals to the Chronology of DDT Input into the Ecosystem. Can. J. Fish. Aquat. Sci. 1984, 41, 840–844. [Google Scholar] [CrossRef]
  67. Borrell, A.; Aguilar, A. Variations in DDE Percentage Correlated with Total DDT Burden in the Blubber of Fin and Sei Whales. Mar. Pollut. Bull. 1987, 18, 70–74. [Google Scholar] [CrossRef]
  68. Tsydenova, O.; Minh, T.B.; Kajiwara, N.; Batoev, V.; Tanabe, S. Recent Contamination by Persistent Organochlorines in Baikal Seal (Phoca Sibirica) from Lake Baikal, Russia. Mar. Pollut. Bull. 2004, 48, 749–758. [Google Scholar] [CrossRef]
  69. Qiu, X.; Zhu, T.; Li, J.; Pan, H.; Li, Q.; Miao, G.; Gong, J. Organochlorine Pesticides in the Air around the Taihu Lake, China. Environ. Sci. Technol. 2004, 38, 1368–1374. [Google Scholar] [CrossRef]
  70. Muñoz-Arnanz, J.; Jiménez, B. New DDT Inputs after 30 Years of Prohibition in Spain. A Case Study in Agricultural Soils from South-Western Spain. Environ. Pollut. 2011, 159, 3640–3646. [Google Scholar] [CrossRef]
  71. Nowell, L.H.; Capel, P.D.; Dileanis, P.D. Pesticides in Stream Sediment and Aquatic Biota: Distribution, Trends, and Governing Factors; Pesticides in the Hydrologic System; Lewis Publishers: Boca Raton, FL, USA, 1999; ISBN 9781566704694. [Google Scholar]
  72. Viselli, R. La Contaminazione da DDT e Dai Suoi Derivati Nei Comparti Abiotici del Bacino del Basso Toce e del Lago Maggiore; Istituto Superiore per la Protezione e la Ricerca Ambientale: Rome, Italy, 1999. [Google Scholar]
  73. Qiu, X.; Zhu, T.; Yao, B.; Hu, J.; Hu, S. Contribution of Dicofol to the Current DDT Pollution in China. Environ. Sci. Technol. 2005, 39, 4385–4390. [Google Scholar] [CrossRef]
  74. Qiu, X.; Zhu, T. Using the o,P′-DDT/p,P′-DDT Ratio to Identify DDT Sources in China. Chemosphere 2010, 81, 1033–1038. [Google Scholar] [CrossRef]
  75. Li, L.; Liu, J.; Hu, J. Global Inventory, Long-Range Transport and Environmental Distribution of Dicofol. Environ. Sci. Technol. 2015, 49, 212–222. [Google Scholar] [CrossRef]
  76. Beasley, V.R. Direct and Indirect Effects of Environmental Contaminants on Amphibians. In Reference Module in Earth Systems and Environmental Sciences; Elsevier: Amsterdam, The Netherlands, 2020; ISBN 9780124095489. [Google Scholar]
  77. European Commission. Commission Delegated Regulation (EU) 2022/643 of 10 February 2022 Amending Regulation (EU) No 649/2012 of the European Parliament and of the Council as Regards the Listing of Pesticides, Industrial Chemicals, Persistent Organic Pollutants and Mercury and an Update of Customs Codes (Text with EEA Relevance). Off. J. Eur. Union 2022, 118, 14–54. [Google Scholar]
  78. Turgut, C.; Gokbulut, C.; Cutright, T.J. Contents and Sources of DDT Impurities in Dicofol Formulations in Turkey. Environ. Sci. Pollut. Res. 2009, 16, 214–217. [Google Scholar] [CrossRef]
  79. Global Environment Facility—GEF. Improvement of DDT-Based Production of Dicofol and Introduction of Alternative Technologies Including IPM for Leaf Mites Control in China; Global Environment Facility—GEF: Washington, DC, USA, 2006. [Google Scholar]
  80. Wong, F.; Alegria, H.A.; Bidleman, T.F.; Alvarado, V.; Angeles, F.; Galarza, A.Á.; Bandala, E.R.; de la Cerda Hinojosa, I.; Estrada, I.G.; Reyes, G.G.; et al. Passive Air Sampling of Organochlorine Pesticides in Mexico. Environ. Sci. Technol. 2009, 43, 704–710. [Google Scholar] [CrossRef]
  81. Li, J.; Zhang, G.; Qi, S.; Li, X.; Peng, X. Concentrations, Enantiomeric Compositions, and Sources of HCH, DDT and Chlordane in Soils from the Pearl River Delta, South China. Sci. Total Environ. 2006, 372, 215–224. [Google Scholar] [CrossRef]
  82. Aguilar, A.; Borrell, A.; Pastor, T. Biological Factors Affecting Variability of Persistent Pollutant Levels in Cetaceans. J. Cetacean Res. Manag. 1999, 83–116. [Google Scholar] [CrossRef]
  83. United States Department of State. Madagascar; Background Notes Series; Bureau of Public Affairs: Washington, DC, USA, 1987; pp. 1–7. [Google Scholar]
  84. Jenkins, C.N.; Van Houtan, K.S. Global and Regional Priorities for Marine Biodiversity Protection. Biol. Conserv. 2016, 204, 333–339. [Google Scholar] [CrossRef]
  85. Di Capua, I.; Micarelli, P.; Tempesti, J.; Reinero, F.R.; Buttino, I. Zooplankton Size Structure in the Gulf of Tadjoura (Djibouti) during Whale Shark Sighting: A Preliminary Study. Cah. Biol. Mar. 2021, 62, 290–294. [Google Scholar] [CrossRef]
  86. Diamant, S.; Pierce, S.J.; Rohner, C.A.; Graham, R.T.; Guillemain d’Echon, A.; Guillemain d’Echon, T.; Sourisseau, E.; Fidiarisandratra, L.C.; Bakary, G.; Trélanche, S.; et al. Population Structure, Residency, and Abundance of Whale Sharks in the Coastal Waters off Nosy Be, North-Western Madagascar. Aquat. Conserv. Mar. Freshw. Ecosyst. 2021, 31, 3492–3506. [Google Scholar] [CrossRef]
  87. Boldrocchi, G.; Bettinetti, R. Whale Shark Foraging on Baitfish off Djibouti. Mar. Biodivers. 2019, 49, 2013–2016. [Google Scholar] [CrossRef]
  88. Fox, S.; Foisy, I.; De La Parra Venegas, R.; Galván Pastoriza, B.E.; Graham, R.T.; Hoffmayer, E.R.; Holmberg, J.; Pierce, S.J. Population Structure and Residency of Whale Sharks Rhincodon Typus at Utila, Bay Islands, Honduras. J. Fish Biol. 2013, 83, 574–587. [Google Scholar] [CrossRef]
  89. Araujo, G.; Agustines, A.; Tracey, B.; Snow, S.; Labaja, J.; Ponzo, A. Photo-ID and Telemetry Highlight a Global Whale Shark Hotspot in Palawan, Philippines. Sci. Rep. 2019, 9, 17209. [Google Scholar] [CrossRef] [PubMed] [Green Version]
  90. Fontes, J.; McGinty, N.; Machete, M.; Afonso, P. Whale Shark-Tuna Associations, Insights from a Small Pole-and-Line Fishery from the Mid-North Atlantic. Fish. Res. 2020, 229, 105598. [Google Scholar] [CrossRef]
  91. Montero-Quintana, A.N.; Ocampo-Valdez, C.F.; Vázquez-Haikin, J.A.; Sosa-Nishizaki, O.; Osorio-Beristain, M. Correction to: Whale Shark (Rhincodon Typus) Predatory Flexible Feeding Behaviors on Schooling Fish. J. Ethol. 2022, 40, 117. [Google Scholar] [CrossRef]
  92. Matsumoto, R.; Toda, M.; Matsumoto, Y.; Ueda, K.; Nakazato, M.; Sato, K.; Uchida, S. Chapter 2. Notes on Husbandry of Whale Sharks, Rhincodon Typus, in Aquaria. In The Elasmobranch Husbandry Manual II: Recent Advances in the Care of Sharks, Rays and Their Relatives; Ohio Biological Survey: Columbus, OH, USA, 2017; p. 504. [Google Scholar]
  93. FAO; WHO. Joint FAO/WHO Food Standards Programme: Codex Maximum Limits for Pesticides Residues; FAO: Rome, Italy; WHO: Geneva, Switzerland, 1986. [Google Scholar]
  94. EFSA. Opinion of the Scientific Panel on Contaminants in the Food Chain [CONTAM] Related to the Presence of Non Dioxin-like Polychlorinated Biphenyls (PCB) in Feed and Food. EFSA J. 2005, 3, 284. [Google Scholar] [CrossRef]
Figure 1. Study area (south-eastern Nosy Be, in north-western Madagascar). Green dots represent plankton sampled during active feeding behavior of whale sharks. Orange dots represent plankton sampled during passive feeding behavior, and pink dots represent plankton sampled during vertical feeding behavior. White “X”s represent plankton sampled when no whale sharks were present. Numbers near the dots represent sample IDs.
Diversity 15 00911 g001
Figure 2. PCB fingerprint registered in all of the plankton samples. Values are expressed in percentage (%) on total PCBs. X-axis represents the 29 PCB congeners detected in the plankton samples.
Diversity 15 00911 g002
Figure 3. DDT fingerprint registered in all the plankton samples. Values are expressed in percentage (%) on total DDTs.
Diversity 15 00911 g003
Figure 4. Pearson’s correlation between [(op′DDE+op′DDD)/pp′DDT] and (pp′DDE/pp′DDT) in all the analysed plankton samples. R = 0.695; p < 0.0001.
Diversity 15 00911 g004
Table 1. HCB, PCB, and DDT levels in plankton samples divided by the feeding behavior of the whale shark (vertical, passive, and active). Control refers to plankton sampled when no shark was around. N = number of samples; SD = Standard Deviation; Min = Minimum; Max = Maximum; SE = Standard Error. All values are expressed in ng/g dry weight.
Vertical
CompoundNMean ± SD
(Min–Max)
MedianSE
HCB72.80 ± 4.02
(0.47–10.9)
1.351.64
PCBs7114.55 ± 160.04
(26.16–436.49)
47.3965.33
DDTs744.20 ± 29.26
(15.17–93.57)
34.6511.95
DDTs/PCBs70.64 ± 0.22
(0.21–0.83)
0.640.09
Passive
CompoundNMean ± SD
(Min–Max)
MedianSE
HCB51.65 ± 1.05
(0.70–2.93)
1.080.47
PCBs565.81 ± 25.68
(38.95–98.05)
57.1611.48
DDTs544.40 ± 21.06
(23.65–74.98)
37.279.42
DDTs/PCBs50.65 ± 0.06
(0.61–0.76)
0.640.03
Active
CompoundNMean ± SD
(Min–Max)
MedianSE
HCB50.72 ± 0.19
(0.51–1.01)
0.680.09
PCBs541.07 ± 16.10
(28.55–67.91)
34.697.20
DDTs525.85 ± 6.02
(18.11–32.96)
26.282.70
DDTs/PCBs50.68 ± 0.22
(0.44–0.95)
0.630.10
Control
CompoundNMean ± SD
(Min–Max)
MedianSE
HCB110.89 ± 0.81
(0.41–3.31)
0.680.24
PCBs1147.76 ± 14.49
(27.99–73.62)
49.744.37
DDTs1130.21 ± 10.16
(14.54–54.46)
26.813.06
DDTs/PCBs110.65 ± 0.20
(0.46–1.09)
0.600.06
Table 2. Bibliographic research on studies in which PCBs, DDTs, and HCB were evaluated in phyto- and zooplankton all over the world. Values are expressed in mean ± SD or as a range of minimum-maximum. w.w. = wet weight; d.w. = dry weight; l.w. = lipid weight.
AreaSample TypePCBsDDTsHCBRef.
Gulf of Mexico and CaribbeanZooplankton<3–678
ng/g w.w.
0.2–34
ng/g w.w.
[48]
Turku Arcipelago
(Finland)
Zooplankton38
ppm l.w.
[49]
Southern OceanZooplankton and phytoplankton0.30–0.37
ng/g d.w.
19
ng/g d.w.
[50]
Terranova Bay (Antartide)Zooplankton
(copepods)
575
ng/g l.w.
400
ng/g l.w.
109
ng/g l.w.
[51]
East coast of Newfoundland (Canada)Zooplankton85.7
ng/g l.w.
22.3
ng/g lw
6.4
ng/g l.w.
[52]
Pelagos Sanctuary (Maditerranean Sea)Zooplankton
(Meganyctiphanes norvegica)
84.6–210.2
ng/g w.w.
45.3–163.2
ng/g w.w.
3.5–11.6
ng/g w.w.
[53]
PortugalPlankton61–159
ng/g d.w. (February)
[54]
68–155
ng/g d.w.
(April)
48–76
ng/g d.w. (north)
12–63
ng/g d.w.
(July)
3–7
ng/g d.w. (south)
Maditerranean SeaZooplankton0.76–353
ng/g d.w.
2.5
ng/g d.w.
[55]
Strait of Georgia British Columbia (Canada)Zooplankton52.2–364
ng/g l.w.
[56]
Coastal Transect in British Columbia (Canada)Zooplankton0.2–0.8
ng/g l.w. (north)
[57]
0.6–1.2
ng/g l.w. (south)
Atlantic, Indian and Pacific OceansZooplankton30–692
pg/g d.w.
[58]
Gulf of Tadjoura (Djibouti)Zooplankton109.7–636.1
ng/g d.w.
21.42–79.2
ng/g d.w.
[2]
Weizhou Island
(China)
Zooplankton 0.77 ± 0.20
ng/g d.w.
0.20 ± 0.08
ng/g d.w.
[59]
Table 3. PCB fingerprint registered in the plankton samples divided by feeding behavior. Values are expressed in mean percentage (%) on total PCBs ± Standard Deviation.
CompoundVertical
N = 7
Passive
N = 5
Active
N = 5
Control
N = 11
953.48 ± 1.462.74 ± 2.413.26 ± 0.593.61 ± 2.94
1013.14 ± 1.922.68 ± 1.492.81 ± 1.042.78 ± 0.71
993.44 ± 1.602.02 ± 0.753.73 ± 0.943.37 ± 0.92
1512.28 ± 1.161.61 ± 0.552.45 ± 0.442.02 ± 0.70
144 + 1351.89 ± 1.101.69 ± 0.672.32 ± 0.432.25 ± 1.08
149 + 1188.40 ± 2.628.01 ± 3.188.40 ± 2.108.75 ± 1.53
1462.57 ± 0.912.63 ± 2.773.02 ± 1.373.23 ± 0.79
15314.82 ± 3.3815.16 ± 3.5613.80 ± 1.2513.59 ± 5.51
1389.18 ± 3.019.14 ± 1.817.36 ± 1.227.45 ± 3.07
1782.38 ± 0.874.09 ± 1.163.33 ± 2.452.54 ± 1.34
1874.43 ± 1.025.47 ± 2.044.32 ± 0.663.94 ± 1.49
1832.05 ± 0.432.85 ± 2.341.98 ± 0.582.38 ± 0.84
1281.37 ± 0.481.61 ± 0.781.16 ± 0.261.10 ± 0.29
1742.85 ± 1.013.90 ± 1.464.05 ± 2.522.90 ± 1.22
1771.75 ± 0.491.76 ± 0.551.71 ± 0.511.46 ± 0.46
156 + 171 + 2021.55 ± 0.391.93 ± 0.841.24 ± 0.421.32 ± 0.30
1721.23 ± 0.401.41 ± 0.742.34 ± 0.851.23 ± 0.44
1807.66 ± 6.948.02 ± 5.265.06 ± 1.124.70 ± 1.75
1992.17 ± 1.242.49 ± 2.673.15 ± 1.061.53 ± 0.40
1705.54 ± 2.945.51 ± 3.283.77 ± 2.094.68 ± 1.69
1963.40 ± 0.702.09 ± 0.522.62 ± 0.973.23 ± 2.10
2014.43 ± 3.345.20 ± 2.074.31 ± 1.5410.56 ± 11.44
1952.85 ± 1.824.02 ± 3.434.61 ± 2.264.44 ± 2.39
1942.29 ± 0.961.95 ± 1.192.97 ± 1.172.31 ± 1.40
2065.31 ± 2.914.53 ± 2.686.69 ± 1.515.48 ± 2.31
Table 4. DDT fingerprint (expressed in percentage (%) on total DDTs) and DDT isomer ratios registered in the plankton samples divided by feeding behaviour. op′DDTs = (op′DDD + op′DDE + op′DDT).
CompoundVertical
N = 7
Passive
N = 5
Active
N = 5
Control
N = 11
op′DDE6.11±4.598.84 ± 7.452.98 ± 1.177.25 ± 5.15
op′DDD8.10 ± 2.435.41 ± 2.307.94 ± 1.897.45 ± 1.79
op′DDT20.86 ± 10.1224.91 ± 13.4220.01 ± 5.3026.66 ± 9.15
pp′DDE49.45 ± 9.9039.78 ± 9.2542.49 ± 8.2141.73 ± 11.25
pp′DDT8.59 ± 3.6013.95 ± 8.9620.20 ± 11.8512.27 ± 4.57
pp′DDD6.89 ± 1.617.12 ± 3.006.38 ± 2.366.62 ± 2.80
pp′DDE/pp′DDT6.91 ± 3.684.39 ± 3.672.89 ± 1.914.08 ± 2.43
(pp′DDE + pp′DDD)/pp′DDT7.80 ± 3.965.26 ± 4.523.30 ± 2.184.68 ± 2.59
pp′DDE/DDTs0.49 ± 0.100.40 ± 0.090.42 ± 0.080.42 ± 0.11
op′DDTs/DDTs0.35 ± 0.090.39 ± 0.111.47 ± 1.330.40 ± 0.10
op′DDT/pp′DDT2.91 ± 2.452.70 ± 2.101.47 ± 1.332.45 ± 1.20
Disclaimer/Publisher’s Note: The statements, opinions and data contained in all publications are solely those of the individual author(s) and contributor(s) and not of MDPI and/or the editor(s). MDPI and/or the editor(s) disclaim responsibility for any injury to people or property resulting from any ideas, methods, instructions or products referred to in the content.

