Article

Shallow-Water Benthic Communities on Soft Bottoms of a Sub-Arctic Fjord (Southern Barents Sea, Russia) along a Gradient of Ecological Factors

by
Lyudmila V. Pavlova
1,
Yury A. Zuyev
2 and
Alexander G. Dvoretsky
1,*
1
Murmansk Marine Biological Institute of the Russian Academy of Sciences (MMBI RAS), Murmansk 183010, Russia
2
Saint Petersburg branch of VNIRO (GosNIORKH named after L.S. Berg), Saint Petersburg 199053, Russia
*
Author to whom correspondence should be addressed.
Diversity 2023, 15(1), 84; https://doi.org/10.3390/d15010084
Submission received: 18 December 2022 / Revised: 4 January 2023 / Accepted: 4 January 2023 / Published: 8 January 2023

Abstract

:
Kola Bay is the most developed coastal area in the Russian part of the Barents Sea, but despite a long history of research, information about the local shallow-water benthic communities is lacking. For this reason, in this fjord area, we investigated the soft-bottom zoobenthos to determine its distribution and the factors influencing its abundance, biomass, and diversity. An analysis of 24 samples collected by divers at eight stations located at 7–8 and 10–15 m depths revealed 127 benthic taxa with an average abundance and biomass of 12,190 ± 4740 ind. m−2 and 30 ± 8 g m−2, respectively. The most severe abiotic conditions (high rates of sedimentation and eutrophication) were found at the head of the bay while the highest densities of predator red king crabs were registered in the middle part. The total benthic abundance and biomass, as well as the abundances of infauna, mobile taxa, subsurface deposit feeders, and surface deposit feeders, decreased towards the central part of the bay, reflecting gradients in the environmental conditions. In the inner part of the bay, we registered two communities: Cossura pygodactylata + Ciliatocardium ciliatum and Arctica islandica + Laonice cirrata, while the benthos of the middle part was less structured. Redundancy analysis indicated that the faunal abundances were influenced mainly by predator density (negative association) and the organic matter content (positive association). The total benthic biomass was negatively linked to water temperature due to the predominance of cold-water species in the area and a close positive association of this factor with crab abundance. In contrast, the highest diversity was registered at the warmer sites, which may have been a reflection of the borealization process in the Arctic. Our results contribute towards the proper management and conservation of the local benthic ecosystem and provide reference data for future monitoring programs and coastal management guidelines.

1. Introduction

The Barents Sea is one of the largest shelf areas in the world [1,2]. The northern part of the sea is characterized by a cold Arctic climate, relatively low productivity, and ice-associated ecosystems [1,3,4], while the southern part represents warmer areas with highly productive ecosystems [1,5,6]. The high productivity of the Barents Sea supports large-scale fisheries for Atlantic cod, haddock, capelin, beaked redfish, golden redfish, and Greenland halibut. The economically important crustaceans are northern shrimp, red king crab, and snow crab [1,7,8].
The heterogeneous physical, chemical, and biological environments that are structured and interact along a continuum of spatial and temporal scales produce a rich mosaic of habitats and processes, especially with regard to the composition, structure, and functioning of the coastal marine ecosystems [9,10,11,12]. The Barents Sea coastal zone contains diverse benthic communities that are important not only as consumers of primary production and food for various top predators such as fish and crabs, but also for the biogenic structure, nutrient turnover, and sediment stabilization they provide [13,14]. Estuarine benthic ecosystems are subject to great environmental variability [15,16,17,18]. As a result, the life cycles of the marine benthic organisms here show marked seasonal patterns in growth and reproduction [19].
Despite severe environmental conditions and seasonal limitations in the availability of particulate organic matter, the shallow-water marine benthic communities in polar regions can exhibit high faunal abundances and biomass [20,21,22]. However, the factors driving the diversity and distribution of the coastal benthic fauna are not well understood. There are many environmental variables that may influence the composition and structure of the sea floor biota, and variations in the physical environment may create habitat heterogeneity over a range of small and large geographical scales [18]. In cold-water regions, key environmental factors include food supply, substrate properties, sea ice duration, temperature, salinity, light, and nutrient concentrations [23,24,25]. However, the influence of these factors on the distribution of the benthic communities may vary considerably between regions. For example, sediment characteristics have been found to be significant in many locations [24,26,27], while at other sites the relationship between the benthic abundance and diversity indices and the substrate characteristics has been found to be less consistent [28,29,30,31,32], reflecting the possible role of other oceanographical factors and biological interactions [33,34].
Recent studies have shown clear natural and human-mediated climate variability, leading to shifts in water stratification, light regime, ice coverage, acidification, nutrient availability, biogeochemical cycles, and carbon fluxes in the Barents Sea [35,36]. Such environmental changes are expected to influence benthic communities, and thus, the studies focused on the assessment of their structure and functioning are of high relevance. Furthermore, the coastal sites of the Barents Sea are nursery areas for the red king crab Paralithodes camtschaticus (Tilesius, 1815) [37,38], which was introduced from the North Pacific in the 1960s to create a basis for viable fisheries. This species has become very abundant in the Barents Sea, and for many local benthic species, it is currently a primary predator. The total number of crabs can fluctuate within a wide range [39,40,41,42] depending on fishing pressure and climatic factors [8,38,43].
As more than half of the human population lives within 100 km from the shore, coastal zones experience intensive human activities associated with fisheries, aquaculture, transport, oil and gas industries, and tourism [44]. This leads to substantial changes in the natural processes and habitat quality. In most cases, the ability of ecosystems to provide appropriate conditions for the survival of individual organisms, populations, and communities is lower than in offshore zones [45]. Thus, research on coastal benthic communities is important to monitor their ecological status and to evaluate the possible changes in the feeding habits of commercially important species [46,47]. Taking into account the importance of the Arctic as a key development priority, the strategy for the development of the Russian Arctic zone declares “the growth of fishery industries including technological re-equipment of local enterprises, construction of new vessels and infrastructure, introduction of new production facilities and development of aquaculture” [48]. Many of these activities are currently being planned or undertaken in Kola Bay [49], which makes this area a priority for research in order to assess the health status of the local biota.
The benthic communities of Kola Bay have been studied since the early 20th century [50,51,52,53,54,55], but these surveys covered mainly deep-water locations, whereas the shallow-water sites have not yet been well studied due to the difficulties in on-board benthic sampling. For this reason, our study aimed to describe the composition, distribution, and diversity of the shallow-water soft-bottom benthic fauna in Kola Bay and to evaluate the role of environmental factors in driving the structure of the local benthic communities.

2. Materials and Methods
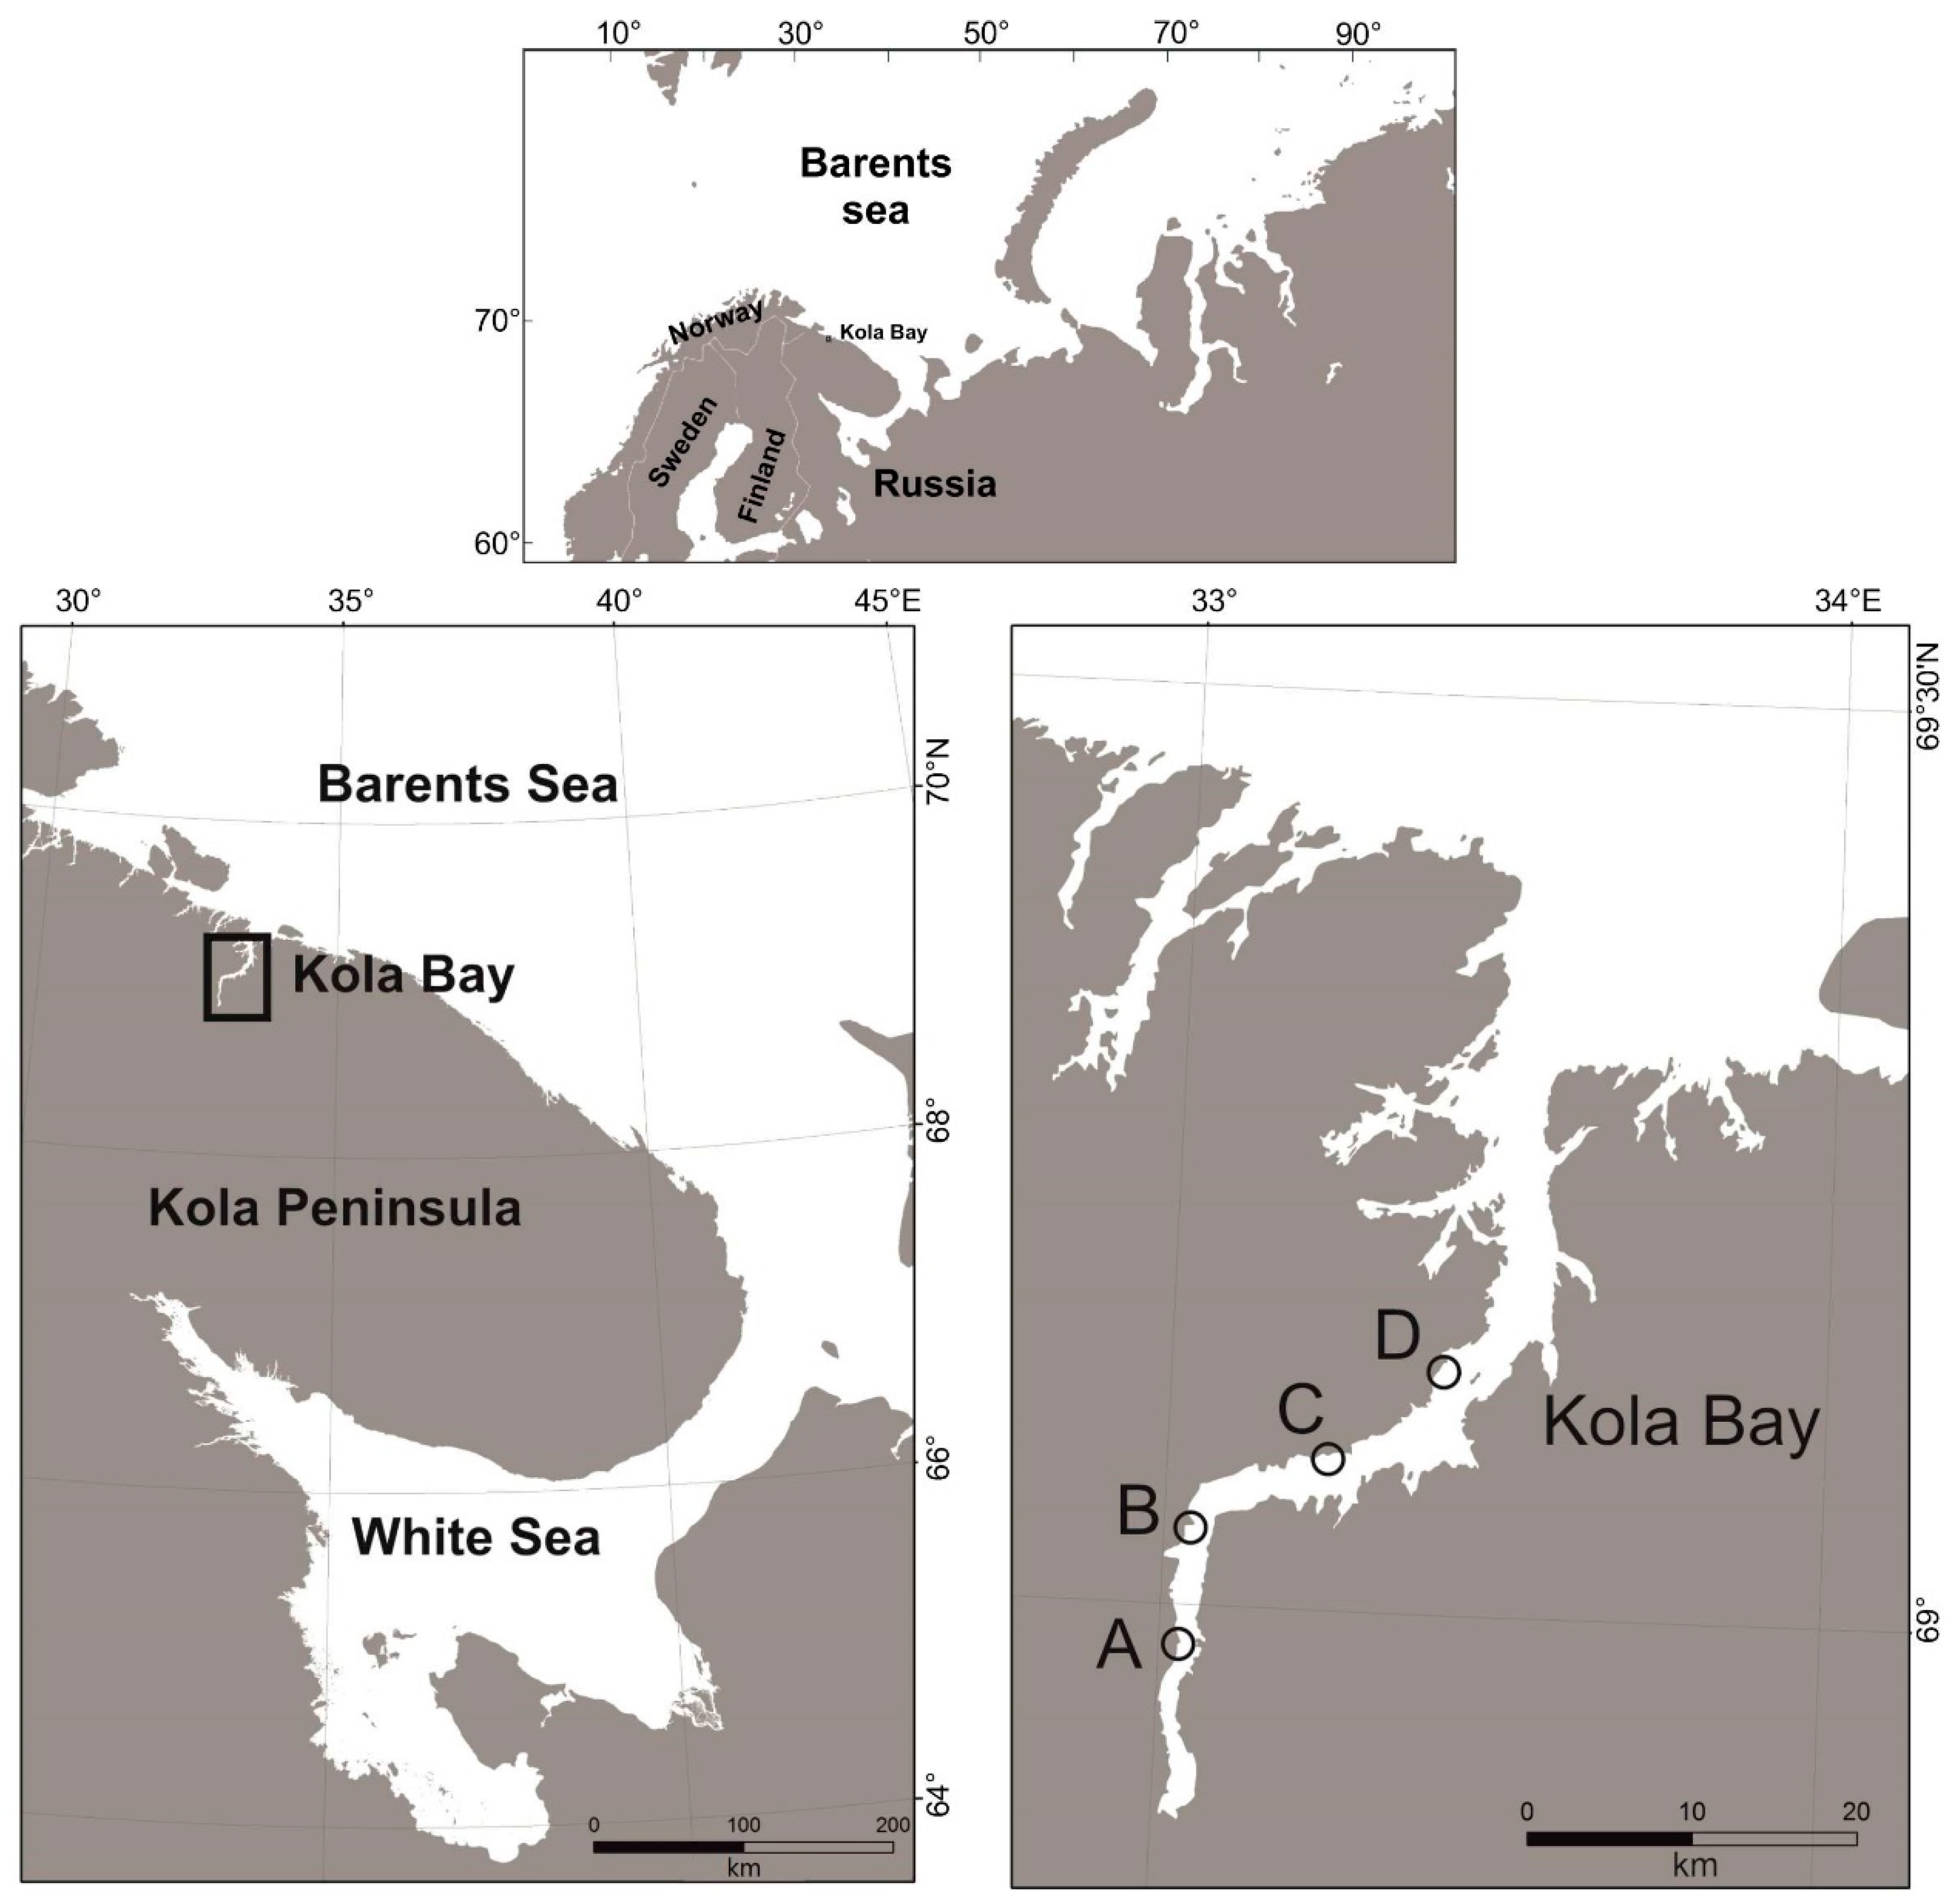
2.1. Study Area

Kola Bay is a typical 51-km long fjord with its width gradually decreasing from 3.0–3.5 km near the entrance to 1.5–2.5 km in the center and to 1.0–1.5 km in the apex of the bay [56]. The total area and the volume of Kola Bay at low tide are 175.295 km2 and 15.494 m3, respectively [57]. There are two bends dividing the area into three parts: the northern, the middle, and the southern. The depth increases from the head (maximum 40 m) to the center (170–180 m) and to the mouth of the basin (>300 m). Kola Bay is separated from the open sea by a sill at 104 m depth. The bottom sediments vary from silt or sandy silt and muddy sand at the deeper sites to sand, pebbles, and rocks at the sites with high water flow velocity [50]. Two rivers flow into the head of the bay with an annual run-off volume of 9.09 km3, and the main interactions between the river and the sea waters occur in this area [57,58]. Although there is a clear gradient in salinity in the surface layer in Kola Bay, the bottom salinity is quite stable (33–34 psu) across the area apart from a small site in its southern part. At 15–20 m depths, the water temperature varies from 0.3 to 1 °C in winter and from 8 to 10 °C in summer [57,59]. At 5 and 10 m depths, the temperature in the southern part of the area is lower than in the central part by 3.5–4.0 °C in summer, 1 °C in autumn, and 0.3 °C in winter. For this reason, the seasonal amplitudes of the water temperatures in the south of Kola Bay are lower (by 4.7 at 5 m and 5.9 °C at 10 m), compared to the central part (5.6 and 7.3 °C, respectively) [59].
The influx of the Atlantic waters prevents the area from freezing, although in extremely cold winters, the southern part is covered with ice. Stratification processes occur during the spring–summer period, forming a distinct halocline and thermocline within the surface layer [56]. The waters of Kola Bay are well aerated, and the oxygen concentration varies from 10.3–10.9 mg L−1 in autumn and winter to 10.3–13.0 mg L−1 in spring and summer [57].
The main benthic predators, red king crabs, have been registered in Kola Bay since the 1990s. The juvenile red king crabs occur at shallow-water sites with higher densities in the central and northern parts of the area. The juvenile crabs prefer bivalve mollusks [60]. The adult crabs migrate to Kola Bay in spring for mating and spawning and in early summer for feeding [61].

2.2. Sample Collection and Analysis

Samples were collected by divers at 4 sites (A, B, C and D) and 8 stations (two at each site) in the central and southern parts of Kola Bay during September–November 2006, at depths ranging from 7 to 15 m (Figure 1).
The sampling sites differed substantially in terms of the distance from the rivers entering the head of Kola Bay, the sediment compositions, and other environmental conditions (Table 1).
At each station, the water temperature was measured with a thermometer (precision = 0.01 °C). Water samples were taken, and in the laboratory, we determined water salinity using an electronic salt meter (precision = 0.005). The data for the seasonal amplitudes in temperature and salinity were obtained from the literature [59].
The data for the sediment granulometry (sediment samples from the upper 5 cm layer) were collected during the diving surveys. The samples were placed in 0.5 L plastic containers and then frozen. The surface sediments (3 cm) were sectioned, dried, homogenized, and sampled for sediment grain size analysis by dry sieving, using the standard methods [62]. The sediments were weighed after sieving, and the modal sediment size and percent composition were calculated. According to particle size, the sediment fractions were divided into 4 categories: pelite (<0.01 mm), aleurite (0.01–0.1 mm), sand (0.1–1.0 mm), and gravel (>1.0 mm). Each station was sampled in triplicate.
A sediment sorting coefficient (Hr) that represents the degree of mixing of the different sediment types was calculated according to Romanovsky [63]:
H r = i = 1 n p i ln p i ln n
where n is the number of sediment fractions in a sample, and pi is the frequency of occurrence of fraction i. Ideally sorted or homogeneous sediments (Hr = 0) occur in high-energy areas, while unsorted or heterogeneous sediments (Hr = 1) normally occur in low-energy areas.
The sediments were dried at 525 °C, and the content of organic matter (OM) as a calcination product was determined according to the standard methods [64].
Three quantitative benthic samples (0.0625 m2 each) were collected per station in all the accessible habitats (n = 24 samples). The divers collected the upper sediment layer (15 cm) using a 25 × 25 cm metal frame with a mesh bag. Each sample was washed through a 0.5 m sieve and then fixed with 4% neutral-buffered formalin. In the laboratory, the benthic samples were washed again, fixed in 75% ethanol, and identified to the lowest taxonomic level possible. Taxon abundance and biomass were recorded for each station by counting and weighing (precision = 0.0001 g) the individuals collected per sample. The mollusks were weighed with shells; the polychaetes that exhibited tube secretion were weighed with tubes; and the tube-dwelling encrusting polychaetes were weighed without tubes. The abundance and biomass data were calculated as individuals per m2 and grams per m2, respectively.
The trophic structure of the benthic communities was determined according to the biomasses, abundance, and contribution of the major taxa. For classification, we used published data on the life-history traits of the benthic species [65,66,67].
The diversity indices included the total number of species, the Shannon index (H’), Pielou evenness (J’), and the Simpson index (D’) [68].
To describe the feeding behavior of the soft-bottom benthic communities, which reflects their health status, we calculated the infaunal trophic index (ITI) [69]:
I T I = 100 33 0 n 1 + 1 n 2 + 2 n 3 + 2 n 4 n 1 + n 2 + n 3 + n 4
where n1n4 are the numbers of individual suspension feeders, surface detritus feeders, surface deposit feeders, and subsurface deposit feeders, respectively. The ITI score varies from 0 to 100, and the results can be interpreted as follows: 60.0–100.0 = normal community; 30.0–59.9 = changed community; and 0–29.9 = degraded community. We selected the ITI because this index is known to be sensitive to changes in the environmental conditions caused by organic pollution [69].
The ecological status of the benthic communities was also evaluated with the difference of evenness index (DE) [70]:
D E = J A J B lg S
where JA and JB are Shannon diversity indices calculated by abundance and biomass, respectively, and S is the total number of species in a sample. DE ranges from −1 (no stress) to +1 (very strong stress), and 0 is the transition point from the unstressed to the stressed state.
The density and biomass data for the red king crabs at the sampling sites (Table 1) were obtained from Pavlova and Zuyev [61].

2.3. Statistical Analysis
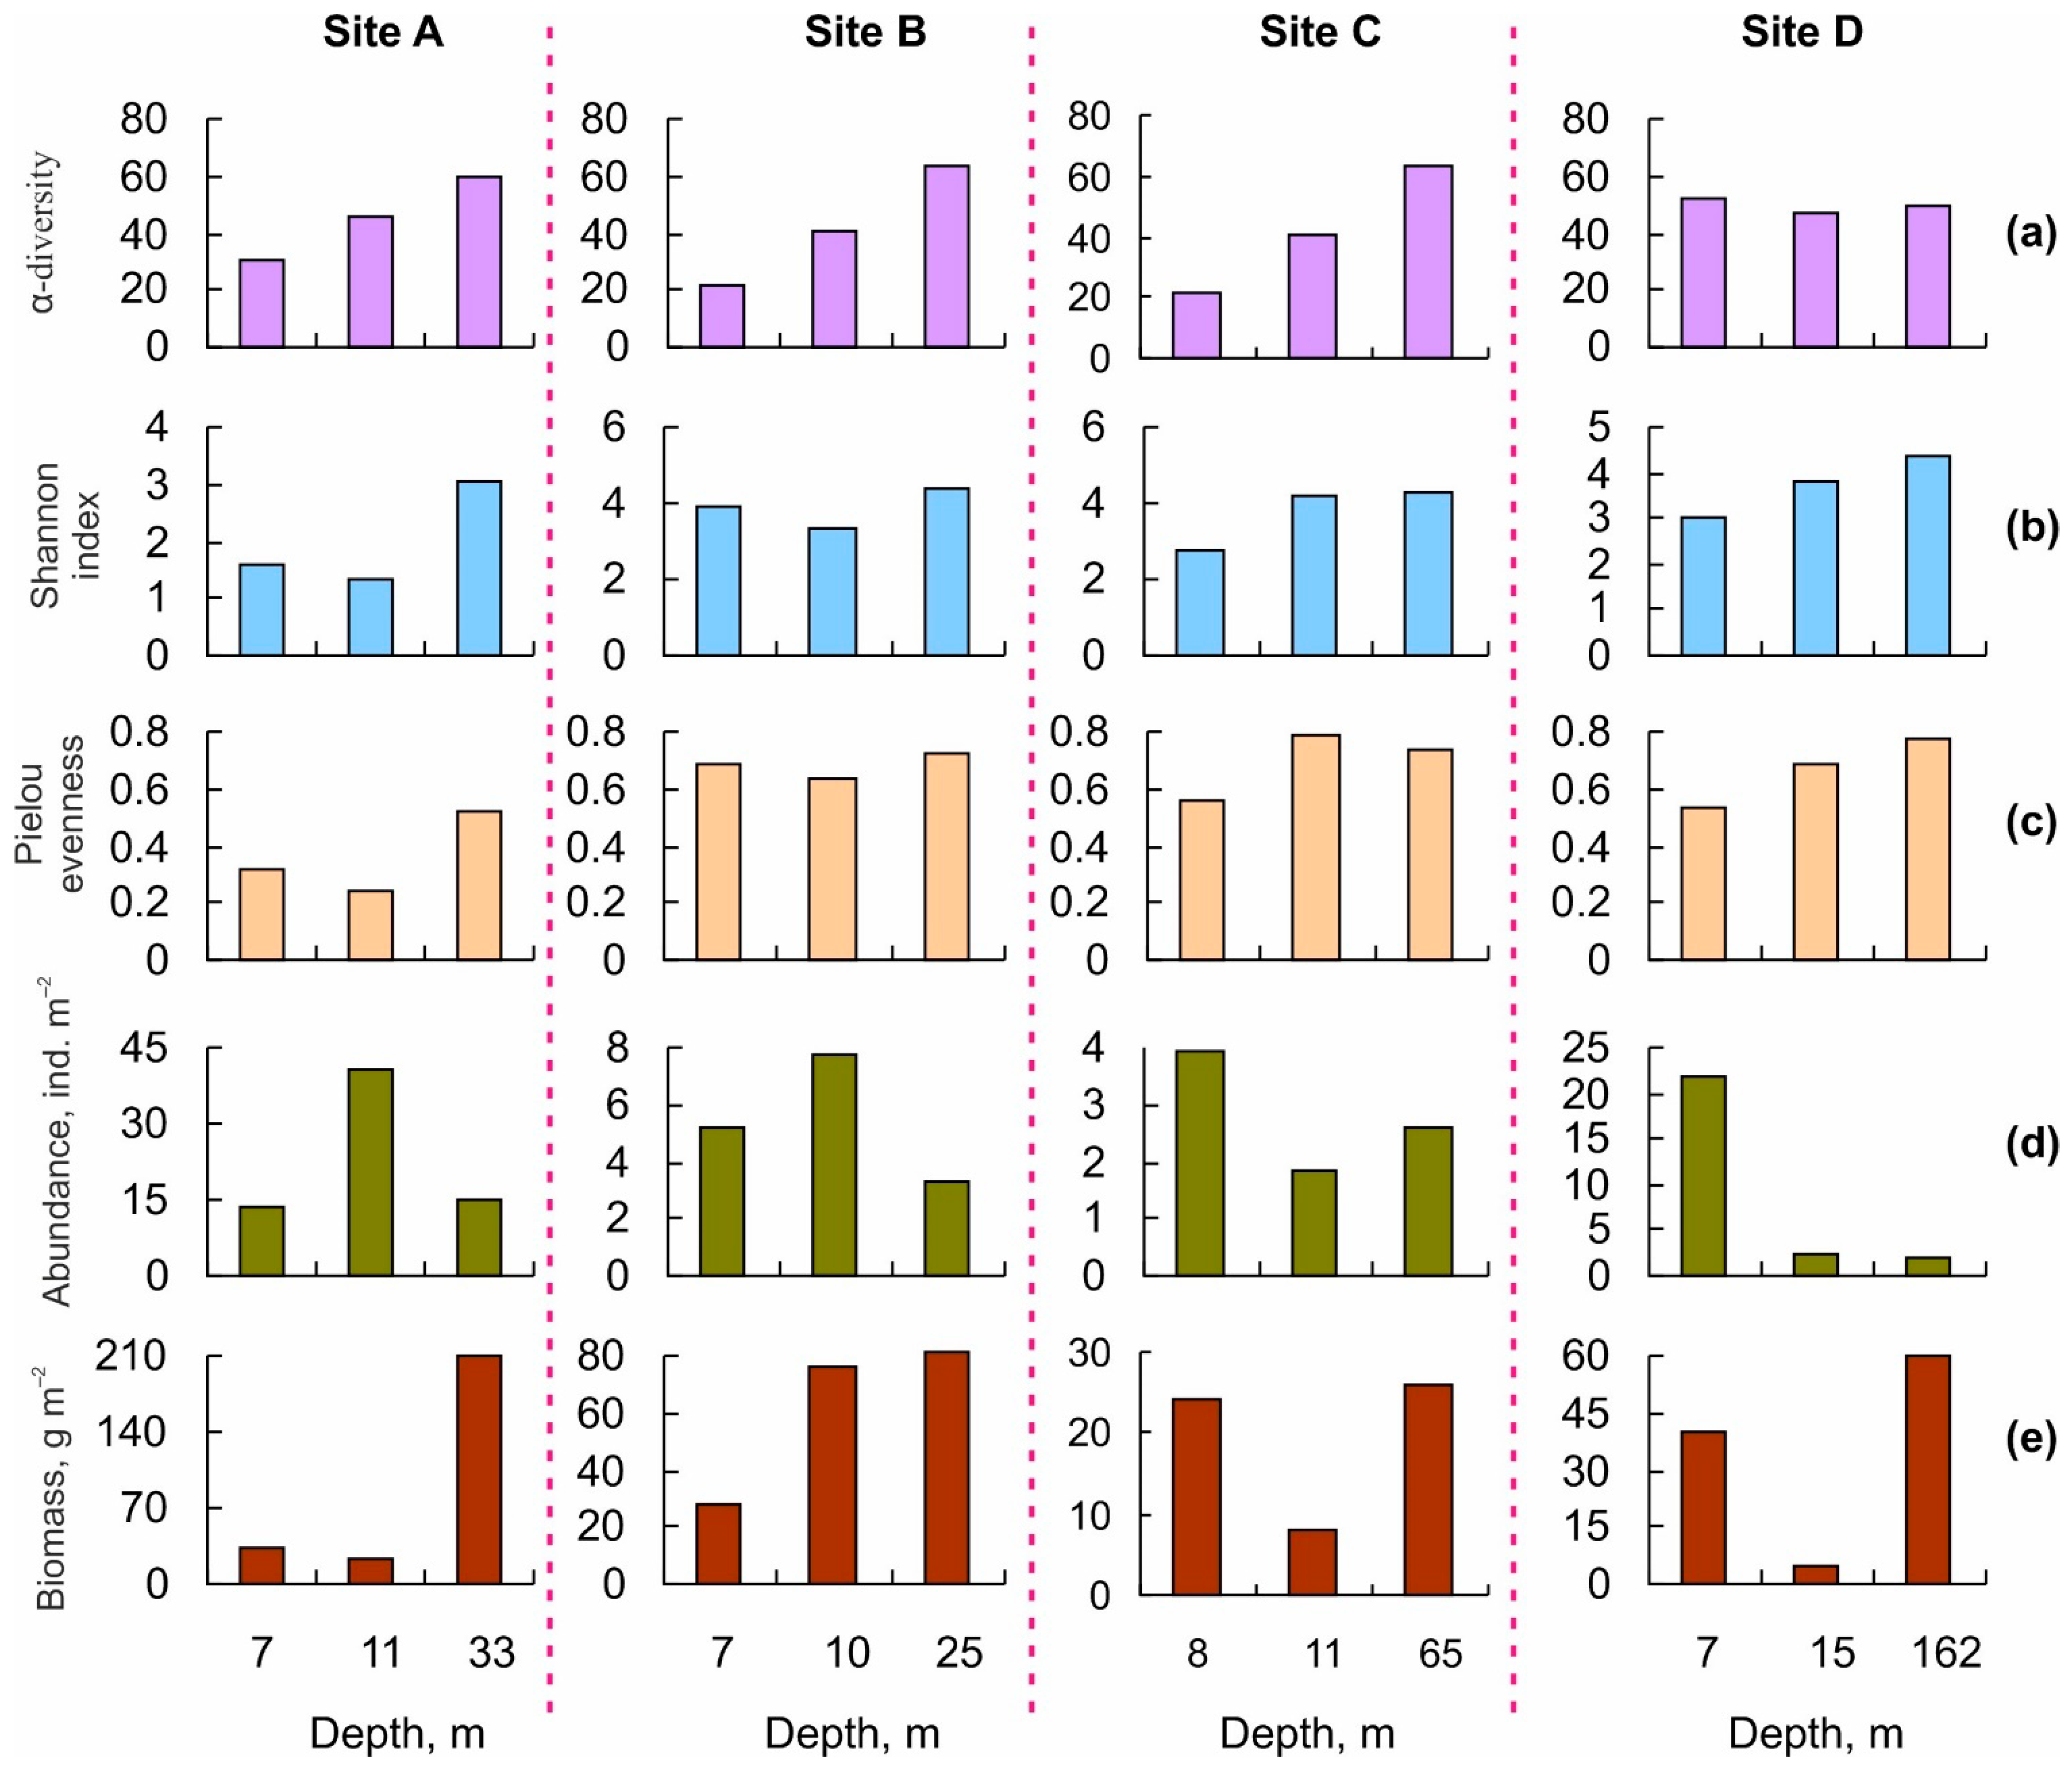
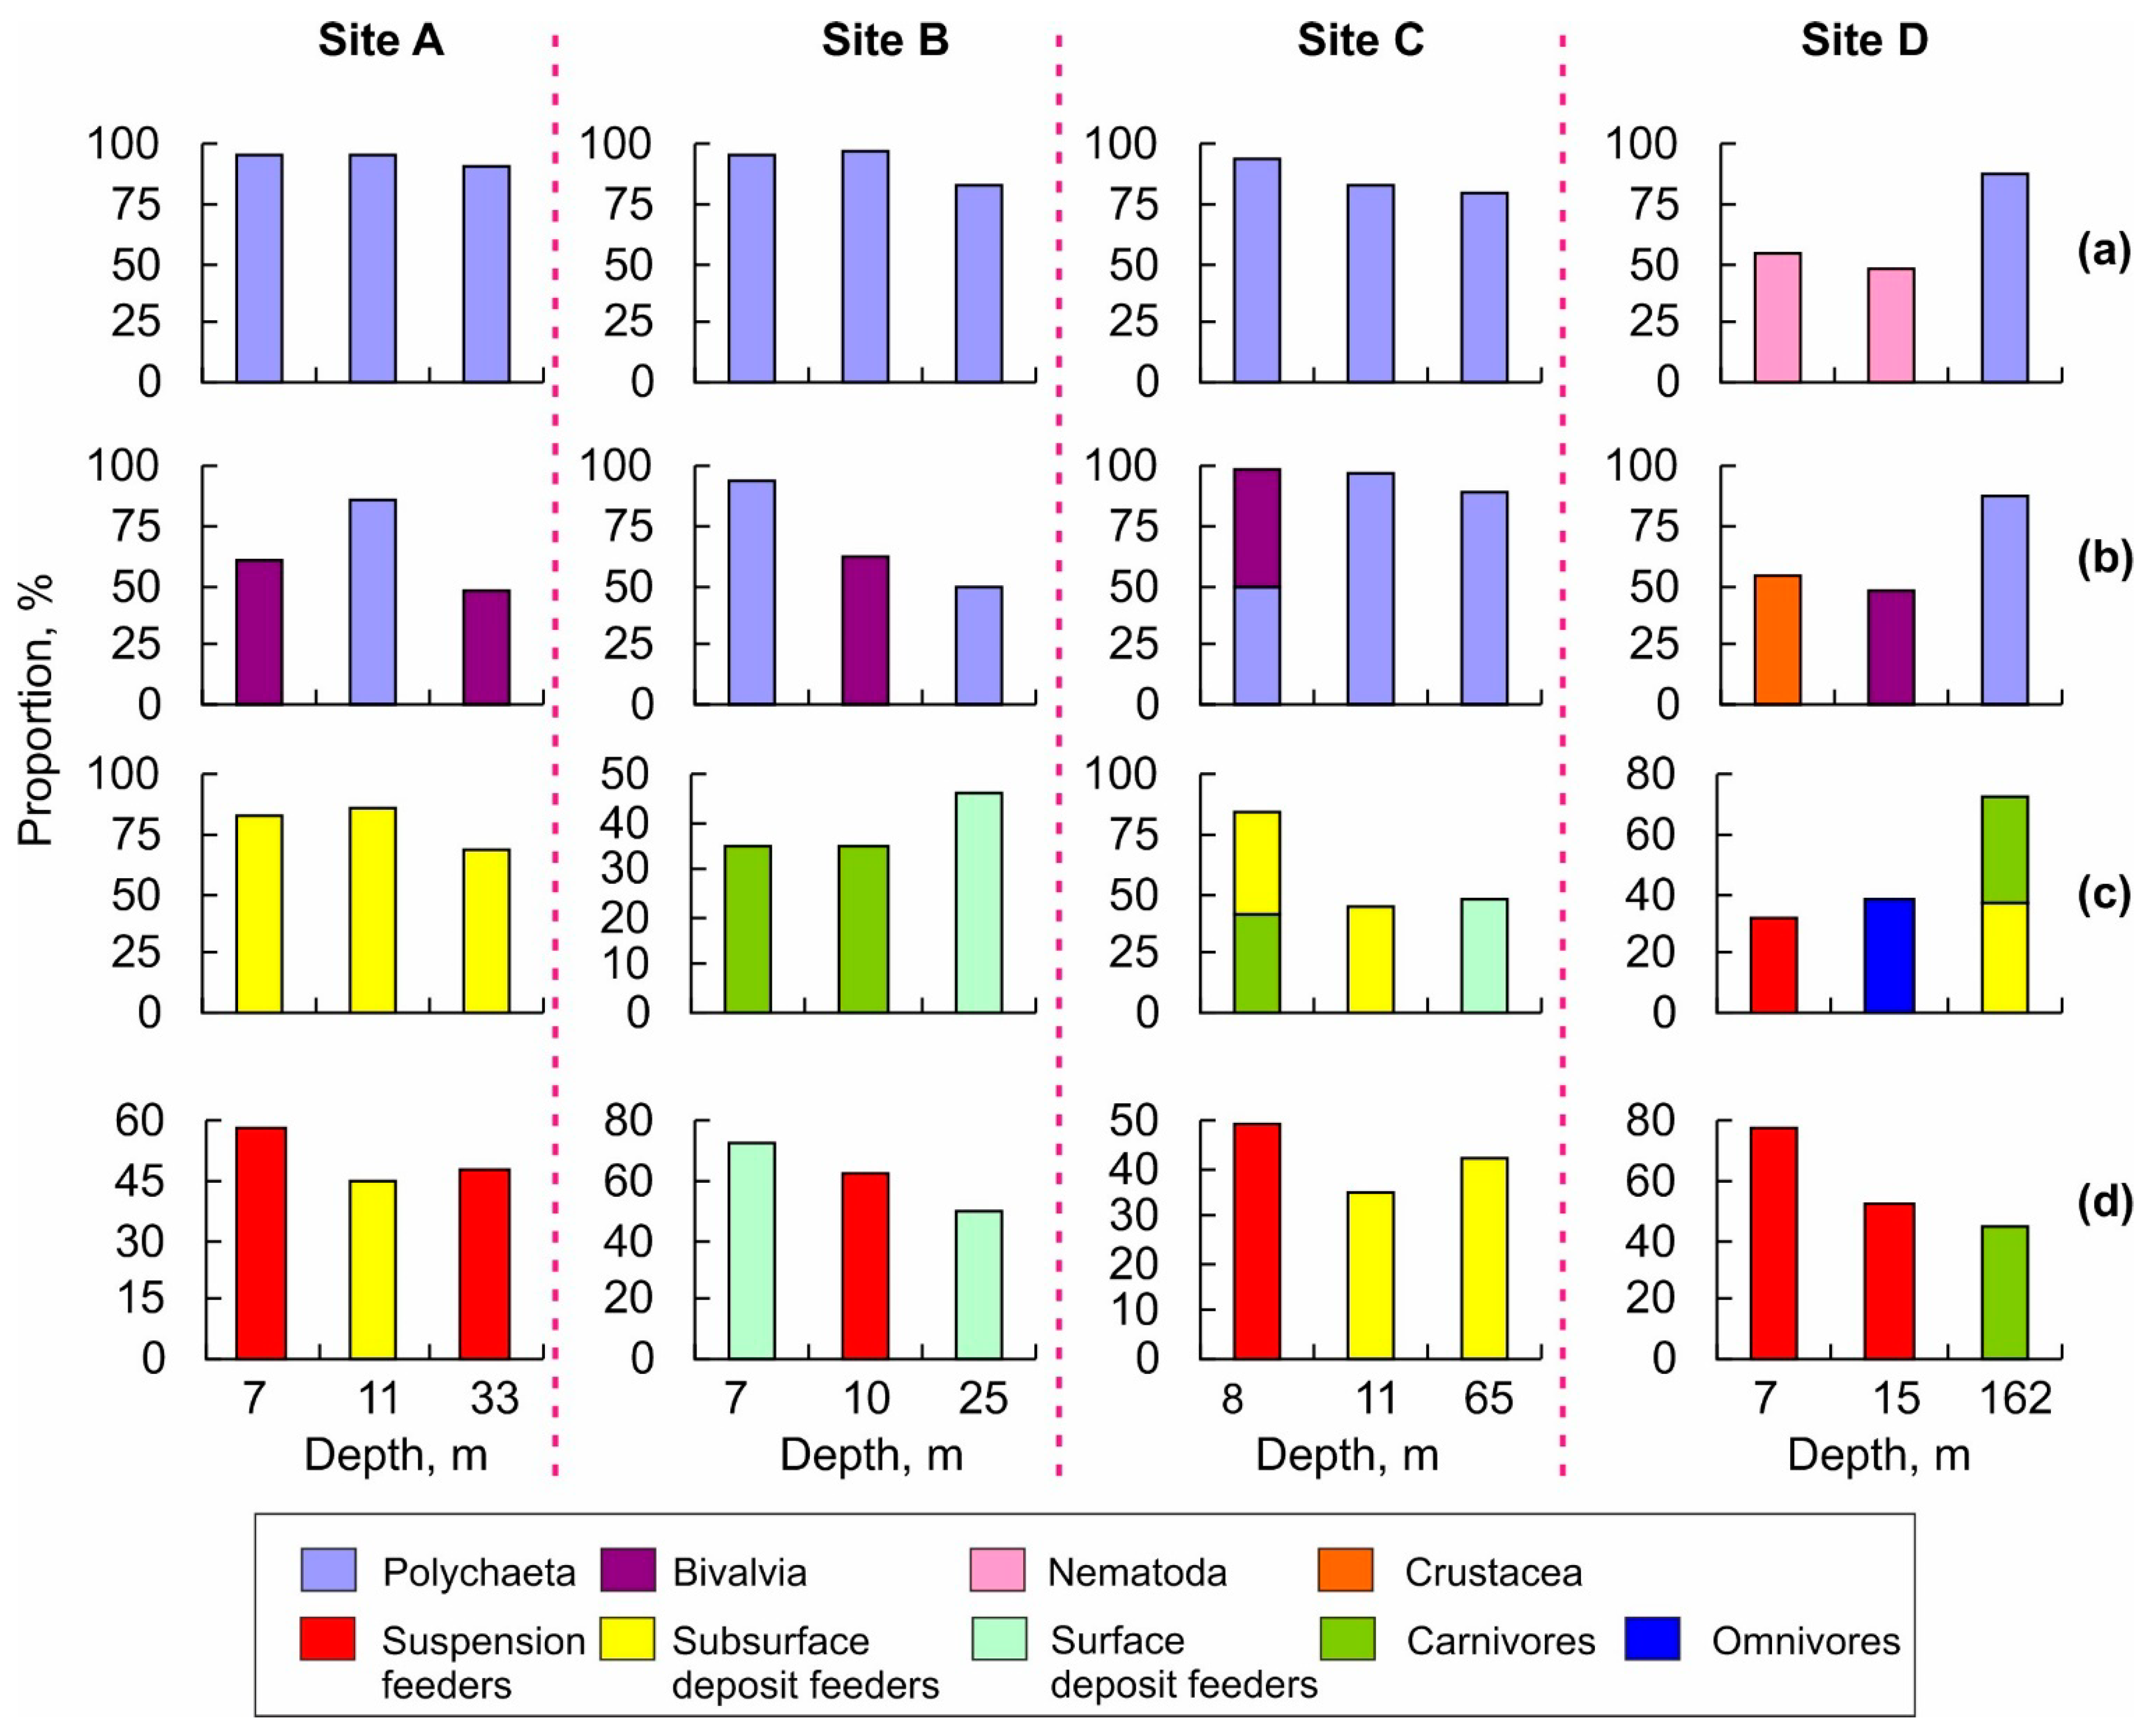
A permutational multivariate analysis of variance (PERMANOVA) using 999 permutations on the Bray–Curtis dissimilarity index was performed in order to compare the significant differences in the sediment composition among the sampling sites. The differences in the sediment composition between the pairs of stations were assessed using a non-parametric 2 Sample Kolmogorov–Smirnov test in PAST 3.26.
Cluster analysis was used to distinguish the spatial communities based on the Bray–Curtis similarity measure and group average linkage classification. The similarities between the station groups based on hierarchical clustering were tested using analysis of similarities (ANOSIM), in which global R = 1 indicates a complete separation of groups and global R = 0 indicates no separation [71]. The species responsible for the differences between the station groups were identified by SIMPER analysis [71]. Prior to the analyses, the data were square root transformed. All calculations were performed in the software package PRIMER 5.0.
The relationships between the local environmental variables and the benthic abundances, biomass, diversity, and stress indicators were examined using a redundancy analysis (RDA). This approach was chosen because the preliminary detrended correspondence analysis indicated that the length of the first axis was <3 standard deviation units, showing the linear ordination method to be preferable [72]. The input dataset of the environmental variables included sediment type (proportions of gravel, sand, aleurite, and pelite at each station), water temperature, and salinity and their seasonal amplitudes, OM, Hr, depth, and red king crab density and biomass. Four datasets were used for the response variables: two included the abundances and biomass of the most common species (n = 42), the third included N, H’, J, and D, and the fourth dataset included the abundances of the functional and trophic groups. A Monte Carlo permutation test (n = 999) was used to reveal the explanatory variables that best explained the benthic abundance, biomass, and diversity data. All the ordinations were performed using CANOCO for Windows v. 4.5 [72]. Prior to the analyses, the species abundance and biomass datasets were log(x + 1) transformed to avoid the highest values from dominating the analyses [72]. In addition, the Pearson correlation coefficients were calculated to analyze the significance of the linear relationships between the selected environmental and biological variables.
The mean values are presented with standard errors.

3. Results

3.1. Environmental Conditions

The near-bottom temperature and salinity demonstrated a smooth increase from site A (7 °C, 32.4 psu)) to site D (8 °C, 34.6 psu) (Table 1). The highest annual sea water amplitude occurred at station C1 (7.3 °C), while the minimum was found at station A1 (5.3 °C). With respect to the annual sea water salinity amplitude, the latter station had the highest value (5.7 psu), while the lowest amplitude was registered for station D2 (Table 1).
According to Hr, the stations A1, A2, C1, C2, D1, and D2 were located on poorly sorted sediments, while stations B1 and B2 were located on unsorted sediments (Table 1).
The major sediment type changed from aleurite silt in the southern part to coarse sand with gravel in the central part of Kola Bay. The sediment composition differed significantly among the sampling sites (PERMANOVA, pseudo-F = 8.841, p = 0.001). The pair-wise comparisons indicated significant differences between neighboring sites (A–B, B–C and C–D) at the same depth (λ = 1.77–6.19, p < 0.003). The stations located at 7–8 and 11–15 m depths also demonstrated significant differences (λ = 2.6–4.07, p < 0.01), except for stations A1 and A2 (λ = 0.69, p = 0.73). The highest contents of fine sediment particles and OM were found at site A. The sediments at stations B1 and B2 were composed of coarser fractions at 7 m but not at 11 m, whereas the OM concentration decreased by three times. The proportion of fine sediment particles tended to decrease at sites C and D. The sediment at sites B and D contained higher proportions of sand and gravel at 7–8 m when compared to 10–15 m. The opposite situation was registered at site C. The highest OM values were observed in the central part of the bay. The OM content was positively correlated with clay (rs = 0.81, p = 0.006) and negatively with sand content (rs = −0.82, p = 0.0003).

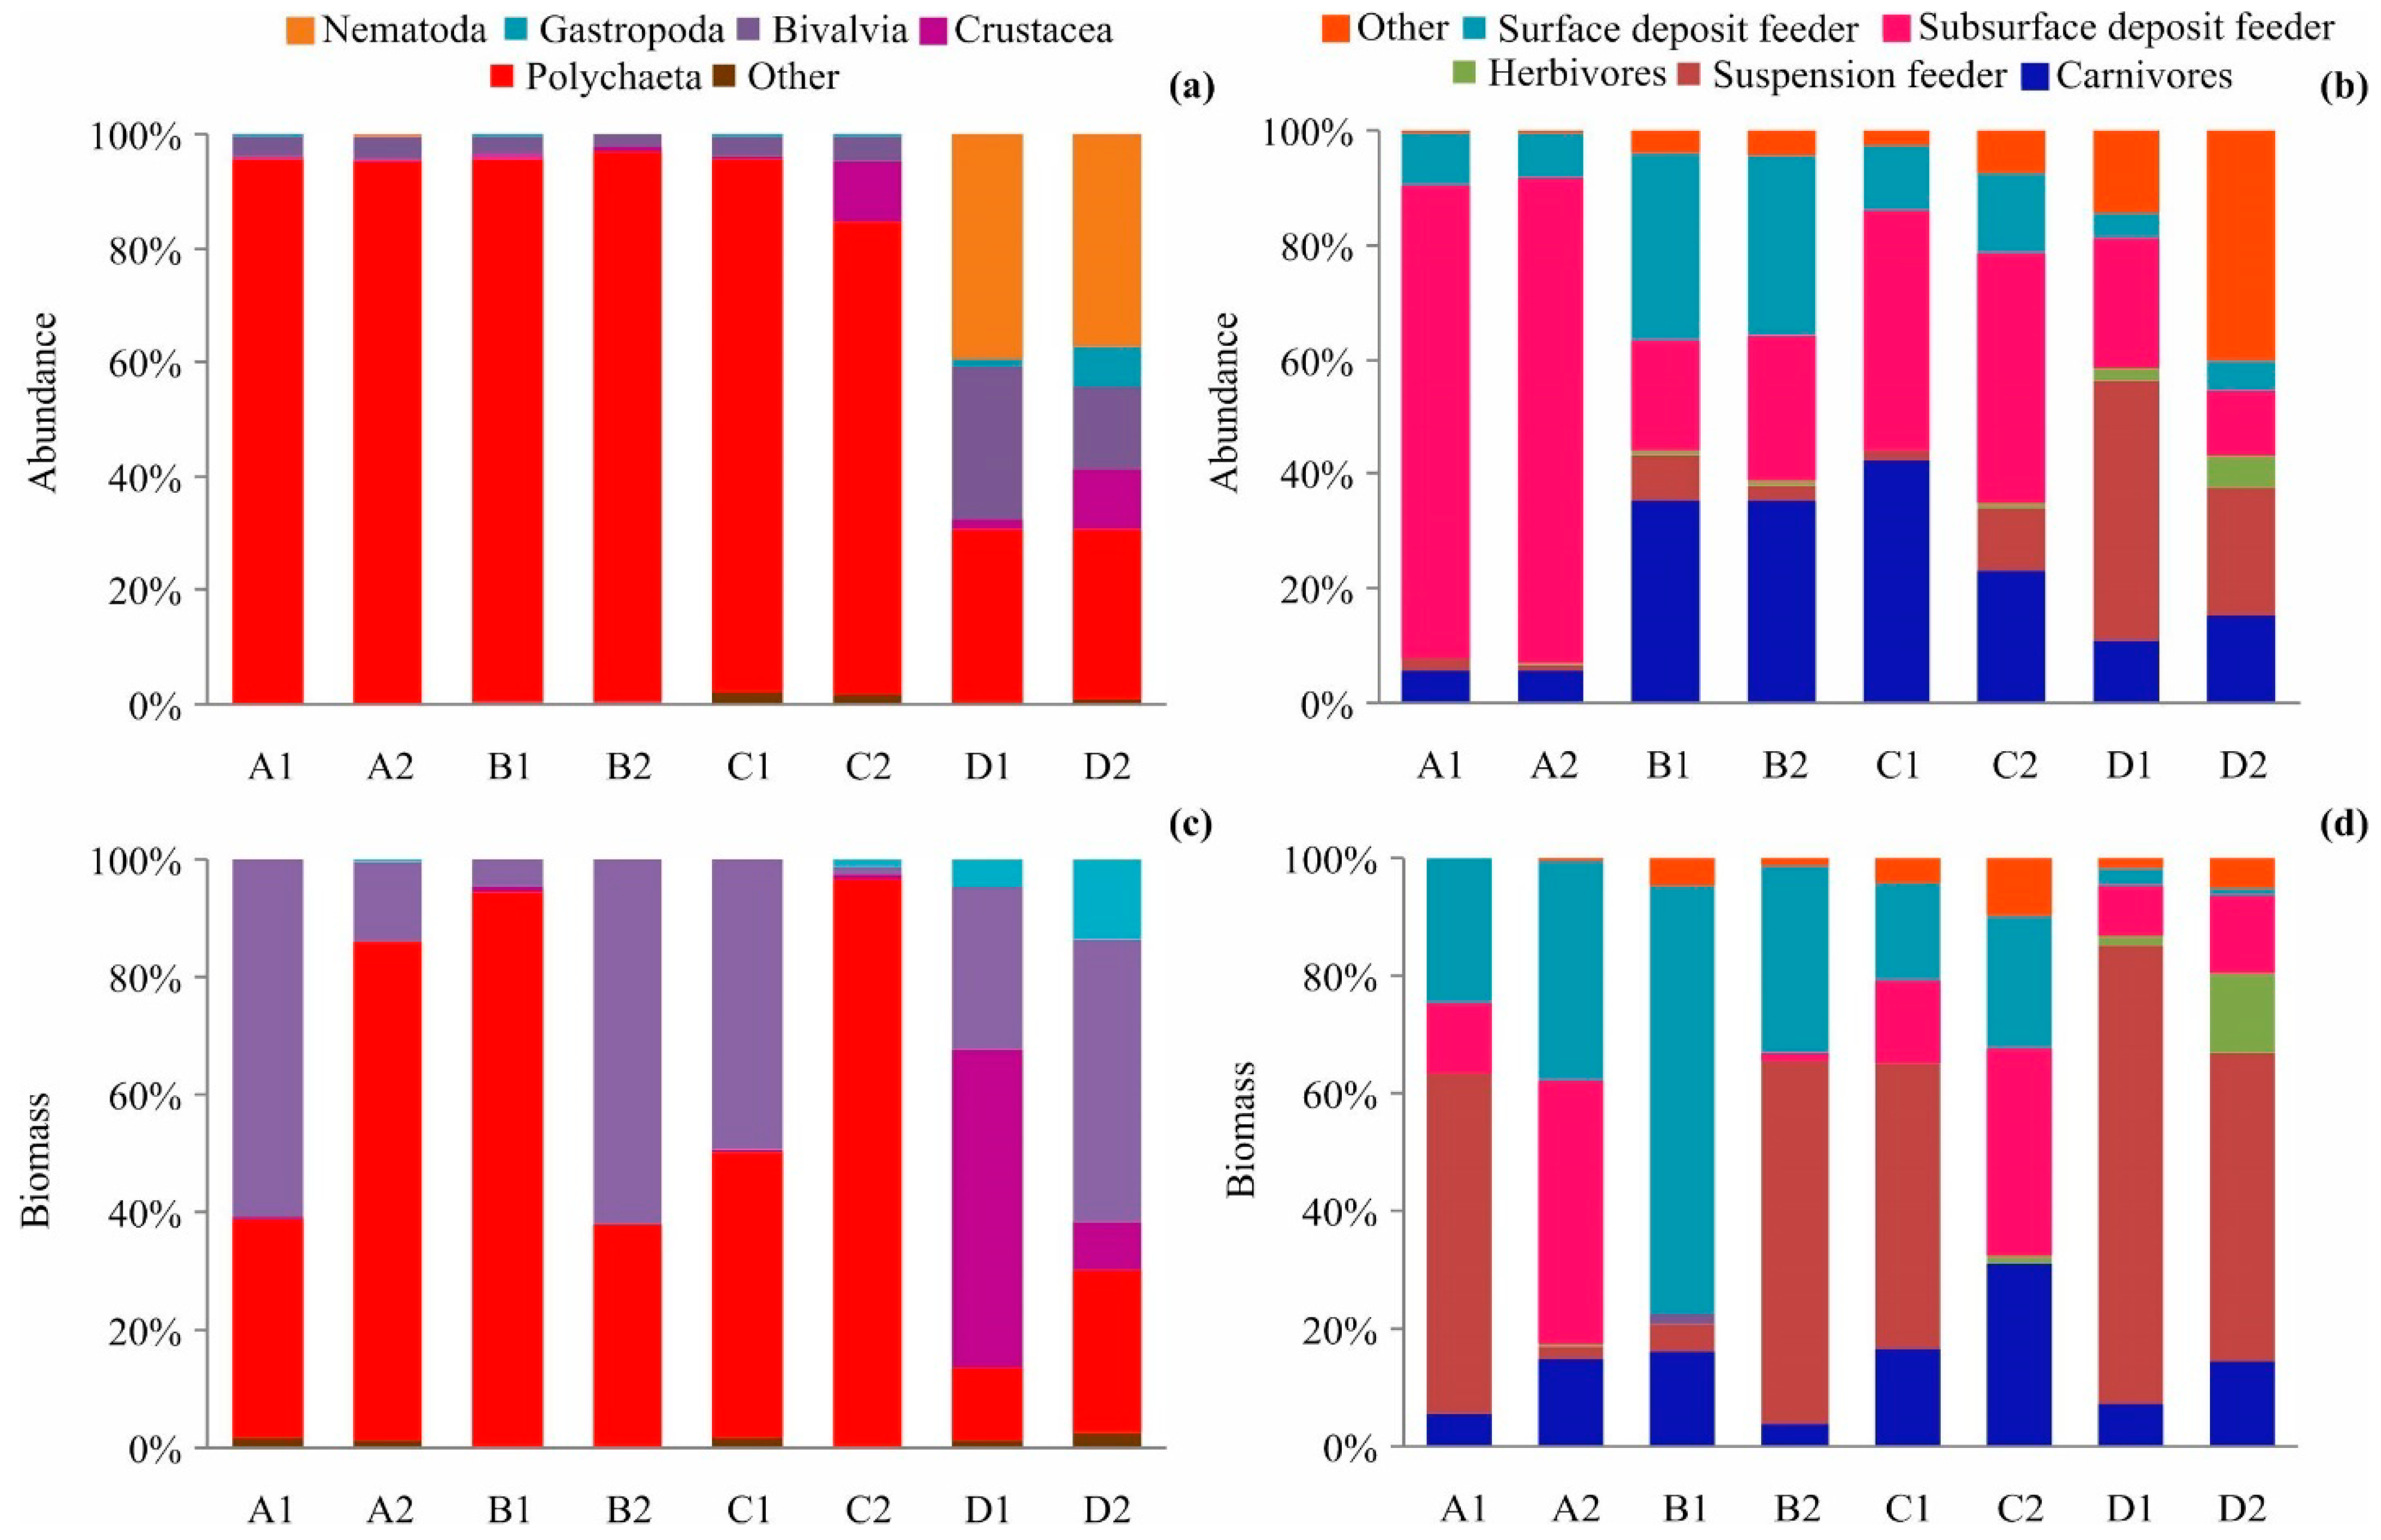
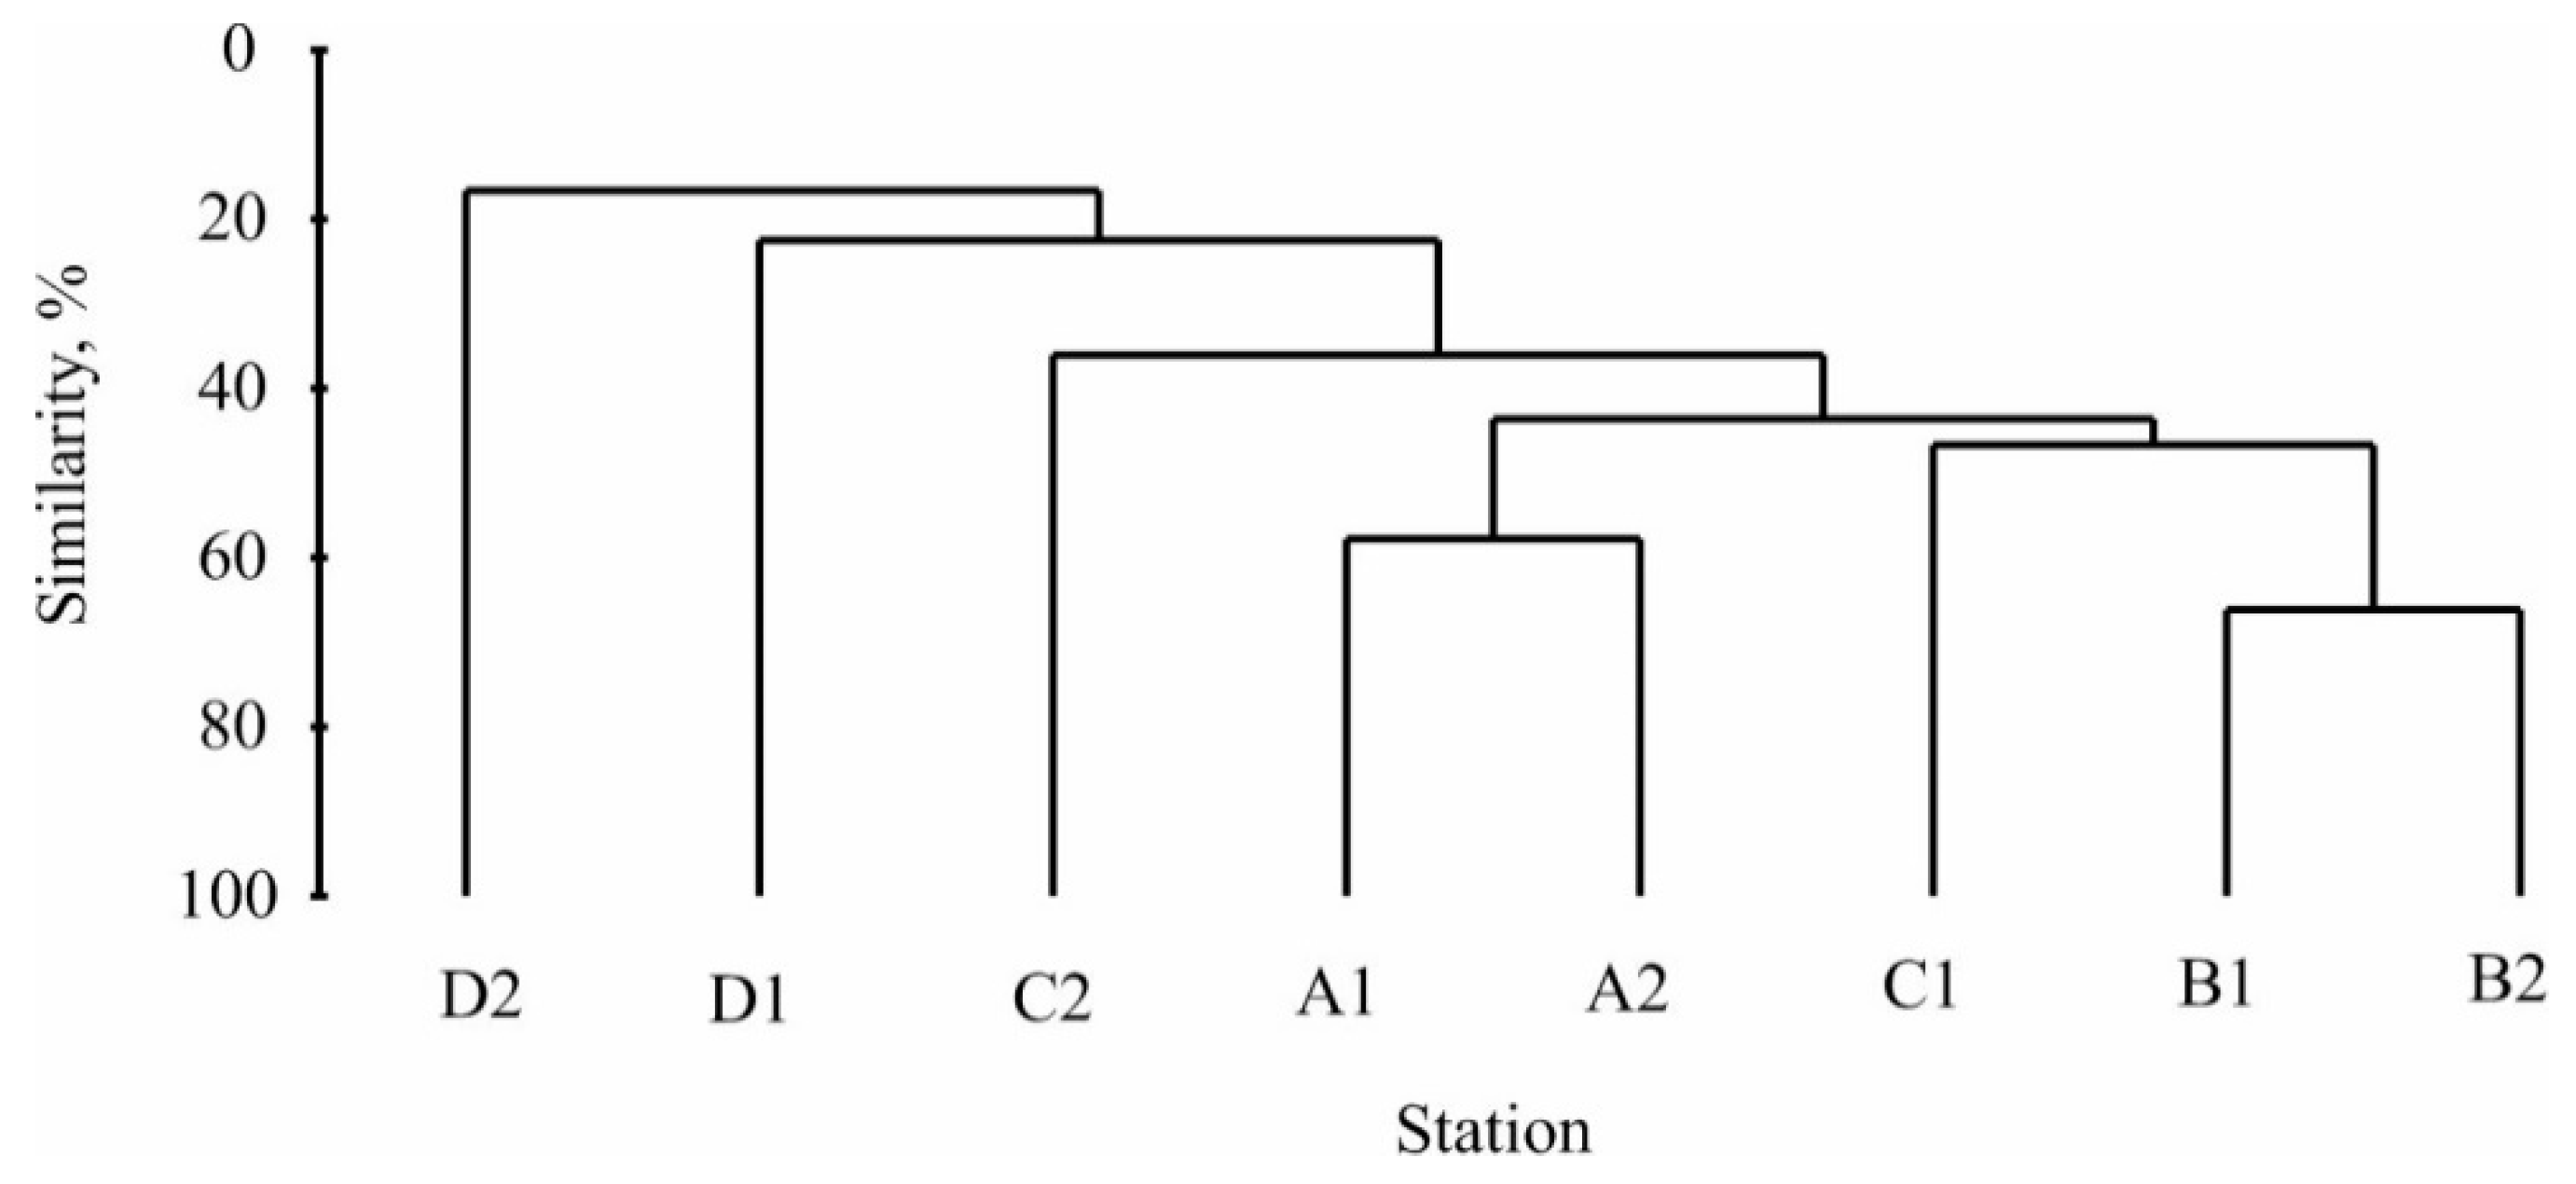
3.2. Benthic Community Structure

A total of 127 taxa were identified, with individuals from six phyla where annelids and mollusks were dominant. The taxa richness varied from 21 to 52 species per station, with the highest values at stations A2 and D1 (Table 2).
A frequency of occurrence exceeding 50% was registered for 14 species: the polychaetes Pholoe assimilis (96%), Eteone flava (92%), Chaetozone setosa (92%), Cistenides hyperborea (84%), Micronephthys neotena (76%), Capitella capitata (76%), Cossura pygodactylata (76%), Paraougia caeca (60%), Laonice cirrata (60%), Chone duneri (56%), and Leitoscoloplos acutus (52%) and the bivalves Macoma calcarea (80%), Parvicardium pinnulatum (68%), and Mytilus edulis (56%). About one-third of all the taxa were found in single samples.
The mean values of the benthic abundance and biomass were 12,190 ± 4740 ind. m−2 and 30 ± 8 g m−2, respectively. The most common species are presented in Table 3. The highest faunal abundances were registered in the southern part of Kola Bay. Some species, such as the polychaete Cossura pygodactylata at stations A1 and A2, were extremely abundant. The expressed predominance of different polychaete worms at stations A1 and A2 resulted in the lowest H’ and J’ indices and the highest value of D’ at site A.
The structure of the benthic communities showed substantial differences along the axis of Kola Bay (Figure 2).
Polychaeta was the most common group at sites A, B, and C, while Nematoda prevailed at site D. The total abundance of polychaetes was positively correlated with the pelite content (r = 0.79, p = 0.02) and negatively with water temperature (r = −0.91, p = 0.002). The highest biomass was registered either for the polychaetes or for the bivalves but without significant correlations with the environmental variables. At station D1, the cirripedians were the most common in terms of biomass. Significant correlations were found for the crustacean biomass and gravel (r = 0.71, p = 0.05), aleurite (r = −0.74, p = 0.03), and pelite (r = −0.81, p = 0.01). In the southern part of the study area on thin-grained sediments, the total biomass of benthic infauna was much higher than that of the epifauna, whereas in the central part on the coarse-grained sediments, the proportion of infauna decreased so that at station D1 the epifaunal biomass was higher than that of the infaunal one. The biomass of the epifauna was significantly positively correlated with the sand content (r = 0.80, p = 0.02).
The highest proportion of mobile taxa was registered at site A (85%); in the remaining sites, this parameter varied from 53 to 63%. The abundance of this group was positively correlated with the pelite content (r = 0.70, p = 0.05). The sessile organisms demonstrated an increase in the contribution to the total material from 0.6% at site A to 9.6% at site D.
The dominating trophic groups were composed of different benthic taxa throughout the study area (Table 2, Figure 2b). The contributions of dominants to the total abundance and biomass were often low, indicating unstable conditions. The average abundance of surface deposit feeders was positively correlated with the pelite content (r = 0.74, p = 0.03), while the average biomass of this group was negatively correlated with the bottom temperature (r = −0.76, p = 0.03). The abundance of subsurface deposit feeders increased with the increasing OM content (r = 0.78, p = 0.023) and decreasing water temperature (r = −0.81, p = 0.01). The average biomass of the carnivorous taxa showed negative correlations with the abundance and biomass of red king crabs (r = −0.74, p = 0.04, and r = −0.74, p = 0.03, respectively).
The biogeographic affinity of the benthic taxa found in Kola Bay indicated the predominance of Boreo-Arctic species (63%), followed by boreal species (35%). The latter group demonstrated higher species richness in the middle part (32% vs. 20% in the southern part) of the study area and at 10–15 m depths (28% vs. 25% at 7–8 m).
The ITI calculated for the infaunal taxa was extremely low at site A (Table 2), indicating a high proportion of subsurface deposit feeders. The highest ITI (predominance of surface deposit feeders) was registered at station B1. This index decreased at site C and increased again at site D. The positive values of DE, which meant a predominance of r-strategists, confirmed the stress conditions of the benthic communities at site A (Table 2). Intermediate values were registered for stations C1, D1, and D2, indicating less stressed communities. According to the DE, the best conditions were confirmed for stations B1, B2, and C2
The cluster analysis performed with the biomass data separated our benthic stations into two distinct groups, at a 43.6% level of similarity with the three outliers (stations C2, D1, and D2) (Figure 3).
The ANOSIM indicated that there were significant differences in the contributions of benthic species for the groupings delineated with the cluster analysis (Global R = 0.97, p = 0.020). Cluster I was composed of stations A1 and A2 and was dominated by the polychaete Cossura pygodactylata and the bivalve Ciliatocardium ciliatum (mean abundance 30,015 ± 11,800 ind m−2, mean biomass 29 ± 8 g m−2). Cluster II included stations B1, B2, and C1. The dominant taxa in this cluster were the ocean quahog Arctica islandica and the spionid polychaete Laonice cirrata (5300 ± 570 ind m−2 and 39 ± 14 g m−2, respectively). The SIMPER analysis showed that five taxa (three bivalve mollusks and two polychaete worms) primarily accounted for observed differences in the benthic groups, with the clam Arctica islandica being the most important (Table 4).

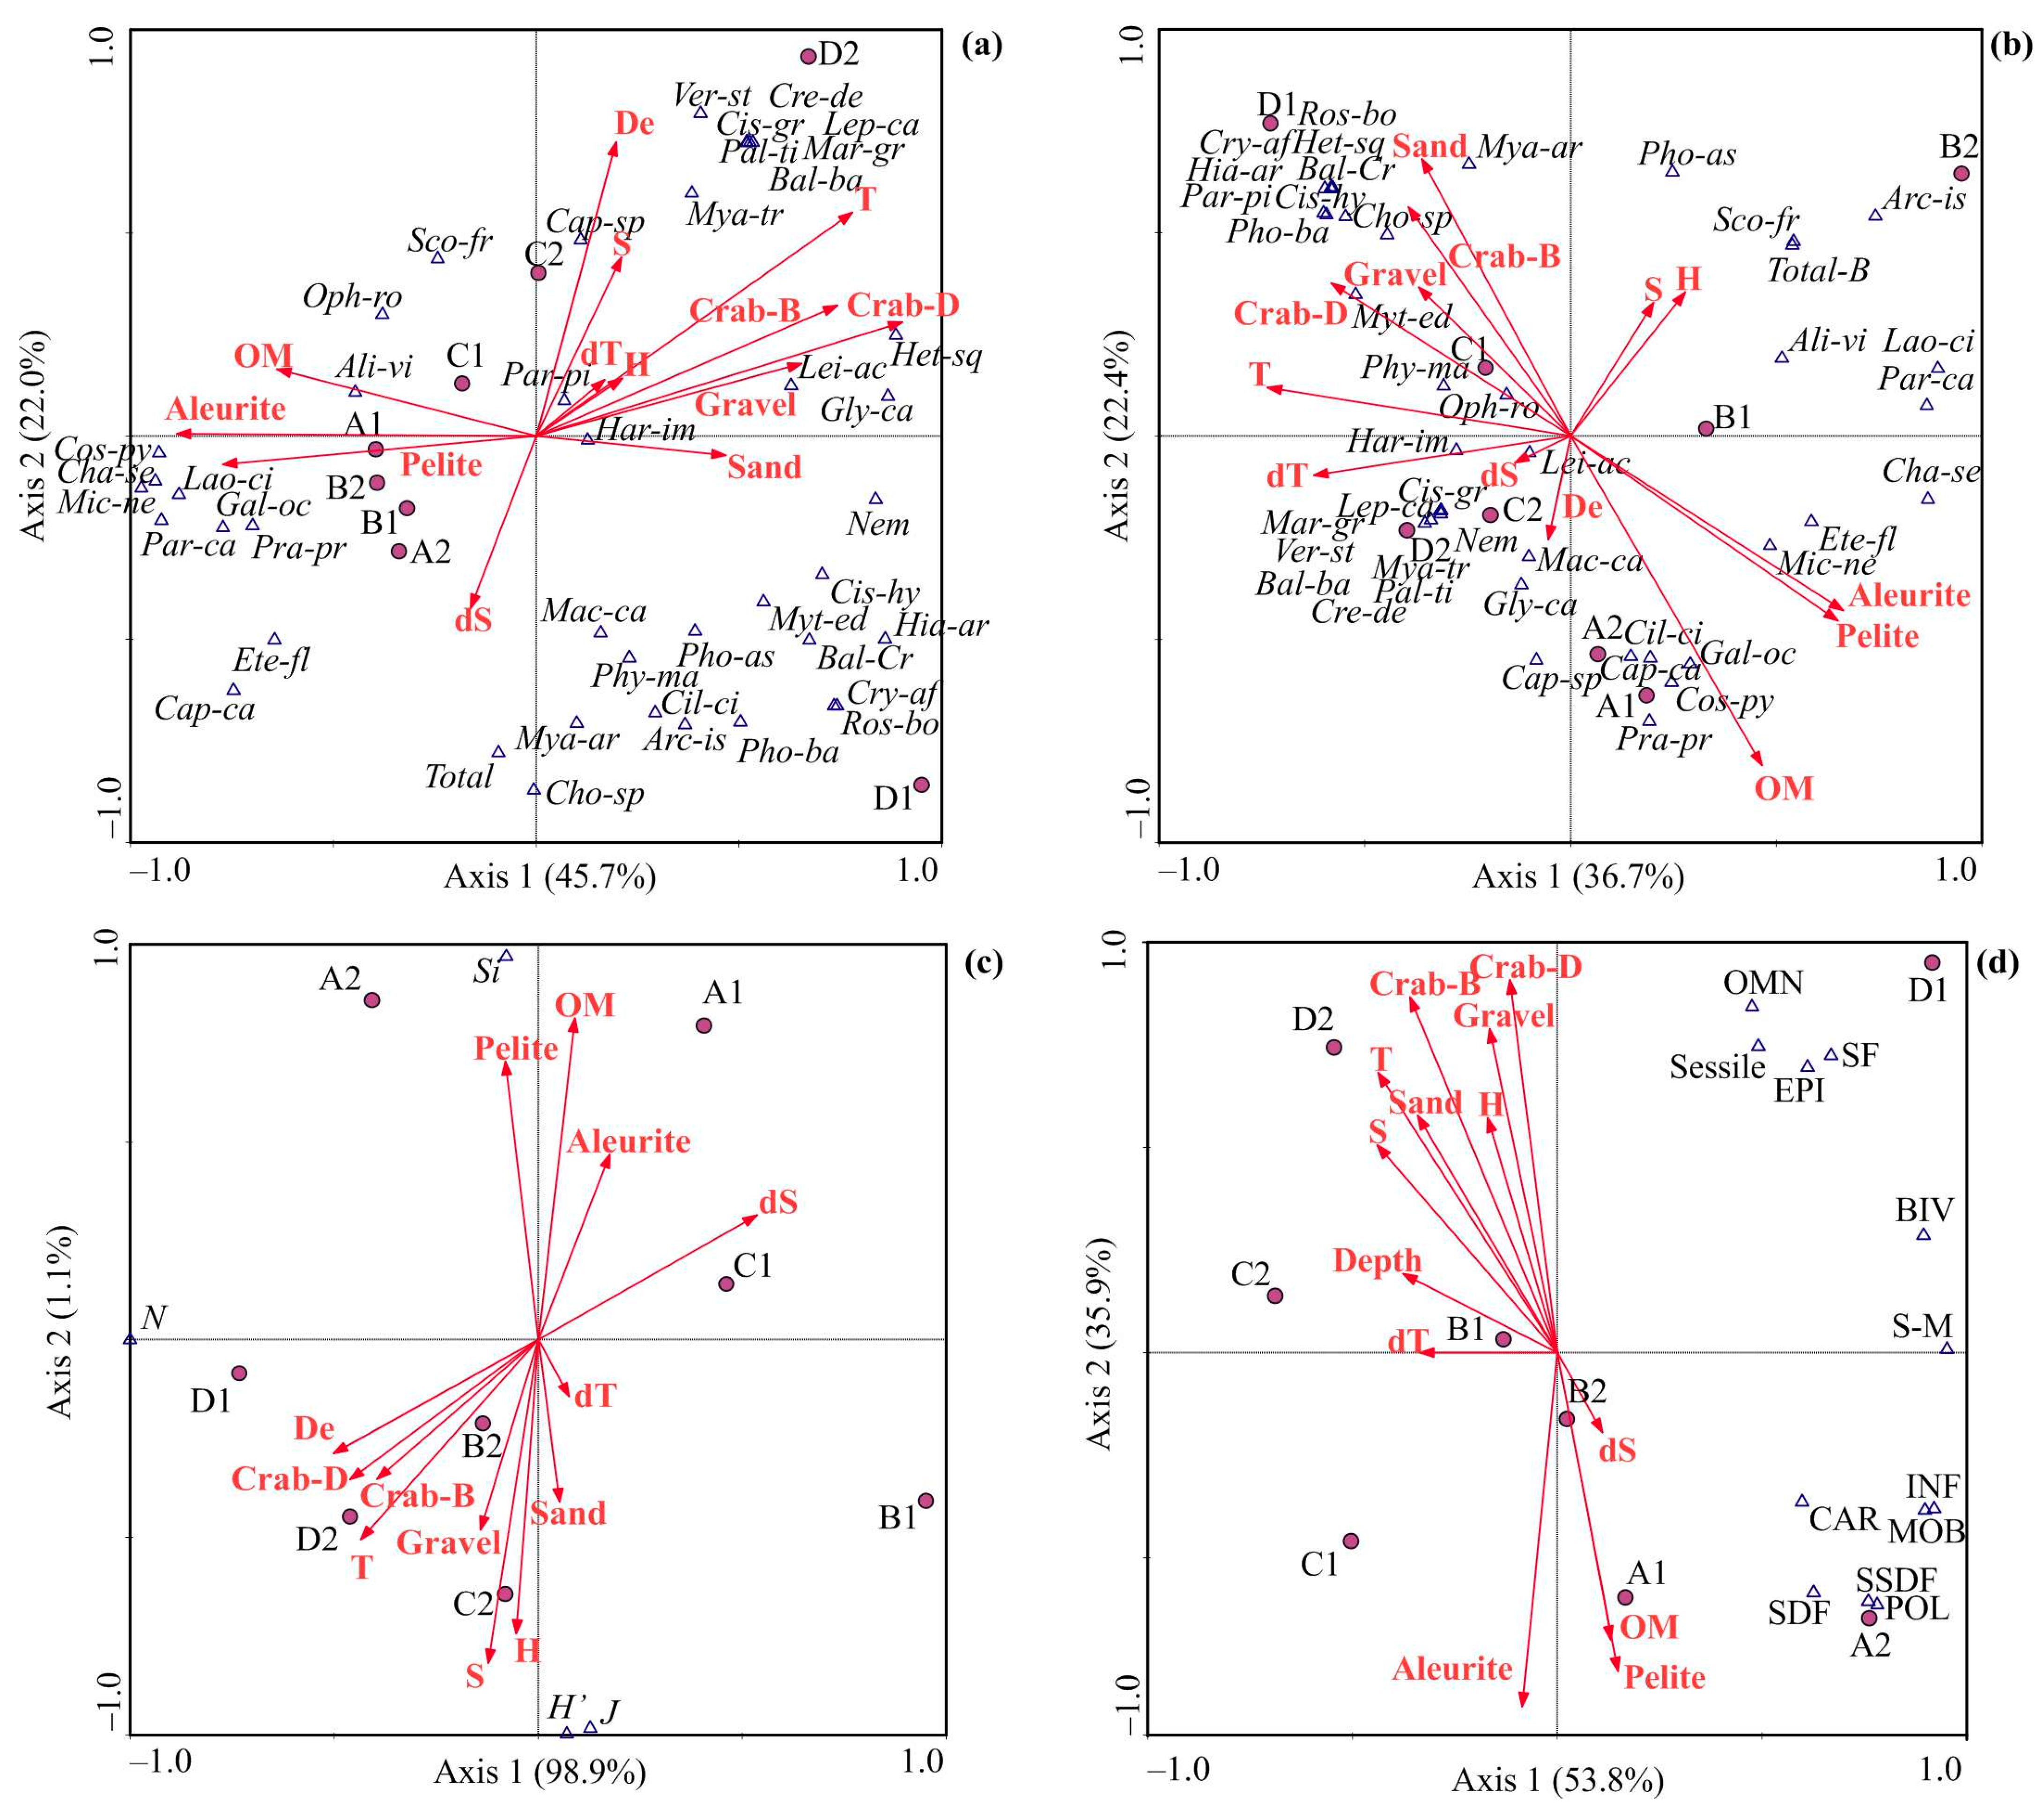
3.3. Environmental Control of Benthic Communities

The RDA based on the abundance data of the benthic fauna showed that the first two axes explained a large proportion of the total variation (67.7%). Axis 1 was strongly positively correlated with crab density and biomass and water temperature, and negatively–with aleurite and pelite, while Axis 2 was positively correlated with depth and temperature (Figure 4a).
The RDA based on benthic biomass indicated that Axis 1 and Axis 2 explained 36.7% and 22.4% of the variance in the data, respectively. Axis 1 was strongly negatively correlated with water temperature and crab density and biomass, while Axis 2 was negatively correlated with OM and positively–with sand content (Figure 4b). The first axis separated the benthic stations located on the thin-grained and coarse-grained sediments (Figure 4a,b). The mollusks and barnacles tended to be more abundant on the seafloor composed of sand and gravel, while the polychaetes, especially Cossura pygodactylata, Chaetozone setosa, Eteone flava, Micronephthys neotena, Galathowenia oculata, and Laonice cirrata preferred pelite and aleurite (Figure 4a,b). The biomasses of the subsurface deposit feeders, such as the polychaetes Cossura pygodactylata, Galathowenia oculata, and Praxillella praetermissa and the bivalve mollusks Ciliatocardium ciliatum, increased as the OM content increased.
In the case of the RDA based on the diversity indices, the water temperature and crab indices demonstrated negative correlations with both Axis 1 and Axis 2 (Figure 4c). The first axis explained 98.9% of the total variation. When we considered the average abundance of the different functional and trophic groups, we found that the first two axes were significant and together explained 89.6% of the variation. Both canonical axes were strongly negatively correlated with aleurite and pelite and negatively with the crab indices, gravel, sand, and Hr. The second axis separated the stations with the predominance of epifauna and infauna and the stations with higher contributions of sessile rather than deposit-feeding species and higher proportions of carnivore rather than omnivore species (Figure 4d).
The forward selection procedure (permutation Monte Carlo test) revealed the factors that contributed significantly to each RDA model (Table 5).
These factors were crab density and OM for benthic abundance, water temperature for benthic biomass, and diversity indices as well as the sorting index Hr for abundances of functional and trophic groups. In general, higher crab abundance led to lower abundances of the other benthic taxa, while the OM content had either positive or negative effects depending on the species. A higher temperature led to lower total benthic biomass but higher diversity indices, except for D’. The epifaunal, sessile, and omnivorous taxa tended to be more abundant on the heterogeneous sediments while the infauna and deposit-feeders preferred more homogeneous sediments.

4. Discussion

4.1. Environmental Conditions

All fjords have some freshwater inflow, and many such systems have large rivers discharging into them, usually at the head. The river run-offs and the complex interplay between the external forces from both terrestrial and open ocean systems and the internal structuring factors result in strong spatial gradients in the environmental variables and strong stratification in the fjords [73]. This situation is registered in Kola Bay as well. Indeed, different parts of this area differed in terms of the local thermohaline processes. In the southern part, the water in the upper layer is colder and less saline. The salinity amplitude is higher and the temperature amplitude is lower than in the central part of the fjord.
The sediments at our sampling stations were composed of different-sized fractions (Table 1), and this pattern is usually registered in most parts of the Barents Sea [74]. Although the flow velocity of the tidal currents in the shallow waters of Kola Bay is high [75], the sediments here are not well sorted. The predominance of grain sediment particles as well as the high OM content in the sediment at site A reflects significant sedimentation of the mineral particulate matter and detritus. As a result of the freshwater discharge of large rivers, the OM content in the southern part is 1.6 times higher than in the middle part of Kola Bay [76].
At the head of the bay, the main sources of OM are riverine inputs and human sewage from local communities. We registered high OM content at site A only. Overall, the concentrations of biogenic compounds are much higher in the southern part than in the middle part of the area, except for N–NO2 [77]. This enhances the production processes and leads to higher phytoplankton concentrations, which also contribute to the total OM available for benthic animals. In general, the sedimentation of suspended mineral solid particles at the head of Kola Bay is less intense than in many glacier fjords in the Canadian Arctic or Svalbard [78,79].
The oxygen concentrations in the upper water layers (0–20 m) are higher than 9 mL L−1 [77], and therefore, hypoxic events in the bottom animals are unlikely. The intense wave flowing activity and high velocity of the tidal currents (5 to 20 cm s−1 [75]) are, probably, the most important factors responsible for the lower OM content at the 7 m depth in comparison to that at the 11 m depth at site A and for the better-sorted sediments from a depth of 8 m at site C (Table 1). A similar influence of tidal and current activity on the particle size of the sediments and OM content has been registered for the shallow-water zone (7–10 m depths) in some Norwegian fjords [80].
The distribution of red king crabs also had a clear longitudinal gradient: the average density of juveniles was higher in the middle part of the bay because this area is closer to the outer part of the fjord, whose grounds serve as the main spawning and nursery areas for red king crab in Kola Bay [61].
Thus, the inner part of our study area has the most extreme abiotic conditions for benthic animals, whereas, in the outer part, the benthos is mainly influenced by biotic factors.

4.2. Benthic Community Structure

The relatively low number of benthic taxa in the shallow water of Kola Bay is explained by the limited sampling efforts and a narrow depth range. Polychaeta and Bivalvia were the most important groups and a similar pattern has been reported for numerous Arctic fjords [81]. We registered a series of benthic assemblages that changed successively along the estuarine gradients in both the biotic and abiotic the factors. Because our clusters were composed of stations belonging to different sites, coincident boundaries between the assemblages were not expressed (Figure 3). The differences between sites A and B were associated not so much with the changes in the species compositions as with the differences in the community structure, i.e., the proportional distribution of different functional groups. In the middle part of the bay, the differences between sites C and D were mainly caused by shifts in the taxa composition resulting from the higher sediment heterogeneity and a wide range of ecological niches in this area (Table 4). The tendency for complicated habitat conditions to increase the number of species and alter the community structure is a common pattern among benthic studies worldwide [82,83].
A remarkable feature of the shallow-water benthos in Kola Bay is a clear trend towards an increase in the invertebrate abundance under eutrophic conditions, and the small subsurface deposit-feeding polychaete Cossura pygodactylata is largely responsible for this pattern. Holte and Oug [80] also reported enrichment effects for benthic animals from discharges of municipal sewage and fish factory effluents in two polluted Norwegian fjords, but their abundance calculations for benthos were lower (2000–8000 ind. m−2) than at station A2 in Kola Bay. In Tromsøysund, peaks in benthic abundances were associated with dense populations of Capitella capitata [80]. In Kola Bay, this species, which is considered an indicator of organic pollution and hypoxic conditions, had 16–20-fold lower abundance than did Cossura pygodactylata. It should be noted that such substantial increases in benthic abundances have not been evident in the inner parts of the non-polluted and less closed fjord systems along the Norwegian coast [84] and in the Arctic fjords in Svalbard [23]. The extremely high abundance of polychaetes and bivalves at station D (Table 2) is explained by the presence of small juveniles.
Most stations within our study area were characterized by high abundances of a limited number of species, resulting in lower diversity and higher stress indices and only at site B can the state of the macrozoobenthos be judged as normal. According to the previously published data, deeper-water benthic communities in the southern part of the bay (site A) had intermediate stress indices [55] in contrast to the high values recorded for the shallow-water stations in the present study, indicating a vertical gradient in disturbance. Eutrophic conditions have been shown to promote benthic communities with a dominance of animals which feed on detritus beneath the sediment surface [69]. In our case, high abundances of such organisms, including the detritus-feeding polychaetes Cossura pygodactylata and Capitella capitata, as well as the omnivorous polychaete worm Micronephthys neotena, led to low ITI at site A, where the active water circulation is more favorable for suspension-feeding taxa. The low ITI values at sites C and D (Table 1) reflect a decrease in the proportion of suspension feeders, most likely due to the feeding activity of the red king crabs. This species is able to reduce the abundance of bivalve mollusks in a short period of time, thus altering the structure of the benthic communities [60]. The foraging activity of this crab predator may also be responsible for the reduction in the total benthic biomass at 10–15 m depths in the middle part of Kola Bay [85,86,87].
The shallow-water benthic communities in Kola Bay demonstrated decreased proportions of the common trophic groups and an increased contribution of carnivorous taxa to the total biomass that contradicts the structure of the shelf benthic communities where the proportion of carnivorous species does not exceed 10% [88]. Similar patterns have been found for other regions [89,90] and reflect differences in the physical, chemical, and biological factors at different depth ranges [88,91].
In the sub-Arctic Norwegian fjords, deeper sites were found to harbor more diverse benthic fauna and higher abundances of surface deposit feeders with maximum densities at 7–25 m [80,84]. To reveal the possible vertical patterns in the structure of the benthic communities, we compared the current results with a previous study conducted at the same sites in Kola Bay but at deeper locations [55]. We found an increase in the number of species per station (α-diversity) as the depth increased at sites A, B, and C (Figure 5a).
A decrease in the invertebrate abundance with depth was evident at site D only; at the remaining sites, the maximum values were registered at 10–11 m or shallower (Figure 5d). A trend towards an increase in benthic biomass was observed in the southern part of the bay, especially at site A, where the total biomass at the deep-water stations was seven times higher than at the shallow-water stations (Figure 5e). Such a peak is associated with significant inputs of organic material to the seafloor and favorable food conditions for the deep-water benthos [55].
With respect to abundance, Polychaeta dominated both the shallow- and the deep-water sites, whereas Bivalvia dominated the shallow-water locations in terms of benthic biomass (Figure 6a). Surface deposit feeders dominated the benthic communities at the deeper stations at sites B and C. In the inner part of Kola Bay, we registered a predominance of subsurface deposit feeders, while subsurface deposit feeders and carnivorous taxa prevailed in the central part of the fjord (Figure 6c). When considering the biomass data, one can see more dominant groups than in the case of the abundance dataset (Figure 6d).

4.3. Environmental Control of Benthic Communities

The community composition and structure of marine soft-bottom benthic communities reflect an array of environmental variables; many of them are the products of an interaction between sediment composition, particle mobility at the sediment–water interface, and complex interactions between the physical (temperature, salinity, oxygen concentration, and wave activity), chemical (biogen and nutrient concentrations), and biological (predator density and competition) factors operating over long time periods [92,93,94,95,96,97]. Our results also demonstrated that both abiotic and biotic factors play a role in shaping the benthic communities in Kola Bay.
An expressed temperature gradient between the southern and middle parts of Kola Bay was found to directly influence the diversity indices of the shallow-water benthos. This factor was also negatively scaled with the total benthic biomass, explaining 26% of the RDA model. An increase in species richness may be explained by the arrival of boreal species [98], while a decrease in benthic biomass may be associated with a lower production of cold-water species and a higher abundance and predation pressure of red king crab in warmer waters [60]. Both vertical and horizontal salinity gradients occur in Kola Bay, but these gradients seem to have no effect on the local benthic communities because these are composed of euryhaline species, which are well adapted to significant tidal and seasonal fluctuations in water salinity.
The sediment composition determines such important habitat conditions as stability, diversity of ecological niches, and food availability [99,100]. In Kola Bay, we found both longitudinal (for shallow water) and vertical (for most sites) gradients in the sediment composition. The former gradient had greater significance for the benthos in the southern part while the latter was particularly important for the benthic organisms occupying the stations located in the central part of Kola Bay. This gradient coupled with fluctuations in other factors explains the poor cluster grouping we found for the stations in the middle part.
We found positive correlations between the polychaete abundance and pelite (Figure 5a). This pattern is explained by the fact that burrowing polychaetes prefer thin-grained sediments [101]. A degree of sediment sorting would be important for bivalves because this parameter has been found to directly relate to near-bottom water dynamics and mixing processes [102]. According to the RDA model, the OM content was a significant driver of the benthic taxa abundances, explaining 19% of the total variance (Table 5). So, great inputs of OM and intense sedimentation processes form very mobile deposits, which are rich in nutrients, at stations located at the head of Kola Bay, and, as a result, the local fauna is composed of small mobile subsurface deposit feeders capable of survival in such labile sediments [103] while the epifauna is poor. We found strong positive correlations between OM and the biomasses of the polychaetes Cossura pygodactylata, Galathowenia oculata, and Praxillella praetermissa and the bivalve mollusks Ciliatocardium ciliatum and can suggest that these species are reliable indicators of eutrophication. According to the RDA, the sediment sorting coefficient explained 7% of the total variation in the abundance of the trophic and functional groups. As the proportion of coarse particles increases and the OM content decreases, the number of epifaunal as well as the number of sand- and gravel-associated taxa increases, and, in turn, the proportion of semi-mobile and sessile species also increases, and the suspension feeders become the dominating trophic group. Similar patterns have been reported for some Svalbard fjords where small polychaetes and bivalves occupied the zones affected by inputs from large tidal glaciers. Such communities are well adapted to fine sediment fractions and have similar alterations in J’ [33,79]. In contrast to the Svalbard waters, where the OM is dispersed with terrigenous material and strong freshwater discharges, in Kola Bay the OM remains available for the benthic animals and supports high population abundances.
In the middle part of our study area, the zonation of the benthos was found to be primarily under the control of predator–prey interactions. The RDA results indicated a negative correlation between crab density and the total benthic abundance in Kola Bay, and this factor explained 40% of the variance. Previous studies have shown that red king crabs are opportunistic predators and that their diet includes a variety of benthic animals [104]. Their feeding activity has been suggested to alter the benthic community structure [60,87,105,106,107,108]. In the coastal zone of the Barents Sea, including Kola Bay, the crab predation pressure on the local benthic communities may vary seasonally depending on recruitment patterns. The crab recruitment, in turn, is driven by natural population processes, variations in climatic factors, and fishing pressure [37,38,43,109,110].
Moreover, it is known that predation crops the prey populations, often leading to decreased competition among benthic species that would otherwise exclude each other and, thus, allow more species to occupy the same region [111,112,113]. This may partly explain the fact that the highest diversity indices were found at stations with higher abundances of red king crabs, which are known to feed primarily on bivalves, polychaetes, and echinoderms [60]. Predators can also act as disturbance agents on soft-bottom communities and influence the structure and functioning of benthic systems [114]. Norwegian authors have shown that after the red king crab introduction, the sediment habitat quality in some fjords was reduced due to hypoxic conditions and low biological activity below the surface layers as a result of the removal of important benthic organisms which performed bio-irrigation and sediment reworking [115]. Thus, red king crabs seem to reduce faunal abundance in Kola Bay not only by direct consumption but also through the mortality caused by their activities that disturb benthic communities.

5. Conclusions

Ocean warming through climate change is considered to have substantial effects on the composition and structure of marine benthic communities, including changes in the distributional boundaries of species and the replacement of cold-water organisms by warm-water taxa. Biological invasions are considered to be another global environmental problem for marine ecosystems in general and benthic communities in particular. Finally, organic water pollution leading to eutrophication can also alter aquatic systems. Although the current study was conducted within a relatively small area, the results of our benthic surveys are in line with the mentioned global trends. We found that the invasive red king crab significantly affected the faunal biomasses of benthic species, leading to their decrease at some sites. Water temperature was found to be a significant factor driving the total community biomass (negatively) and benthic diversity (positively). The higher diversity may have been a result of the warming that promoted the range expansion of boreal species in the Arctic. The distribution and structure of the shallow-water benthic communities in Kola Bay are also driven by sedimentation processes and organic matter inputs. The benthos of Kola Bay experiences strong disturbance, and the main causes of stress conditions are the intense sedimentation and eutrophication in the southern part and the predator pressure in the middle part. The latter factor, coupled with more heterogeneous habitat conditions in the middle part of Kola Bay, leads to significant spatial variations in the species composition of the benthic communities. As the structure of the soft-bottom benthic communities in Kola Bay has already been altered, each kind of human activity in this area should be undertaken with great caution to prevent the possible negative scenarios associated with diversity loss and the degradation of benthic habitats.

Author Contributions

Conceptualization, L.V.P. and Y.A.Z.; data curation, L.V.P. and A.G.D.; formal analysis, L.V.P. and A.G.D.; methodology, L.V.P. and Y.A.Z.; project administration, A.G.D.; software, A.G.D.; validation, L.V.P., A.G.D. and Y.A.Z.; visualization, L.V.P. and A.G.D.; writing—original draft, L.V.P. and A.G.D.; writing—review and editing, L.V.P., A.G.D. and Y.A.Z. All authors have read and agreed to the published version of the manuscript.

Funding

This study was funded by the Ministry of Science and Higher Education of the Russian Federation.

Institutional Review Board Statement

Not applicable.

Informed Consent Statement

Not applicable.

Data Availability Statement

The data are available on request from the corresponding author.

Acknowledgments

We are grateful to Goldin S.V. for the diving works. We also thank the reviewers for the thoughtful comments that improved the manuscript.

Conflicts of Interest

The authors declare no conflict of interest.

References

  1. Jakobsen, T.; Ozhigin, V.K. (Eds.) The Barents Sea: Ecosystem, Resources, Management: Half a Century of Russian-Norwegian Co-operation; Tapir Academic Press: Trondheim, Norway, 2011. [Google Scholar]
  2. Dvoretsky, A.G.; Dvoretsky, V.G. Ecology and distribution of red king crab larvae in the Barents Sea: A review. Water 2022, 14, 2328. [Google Scholar] [CrossRef]
  3. Wassmann, P.; Reigstad, M.; Haug, T.; Rudels, B.; Carroll, M.L.; Hop, H.; Gabrielsen, G.W.; Falk-Petersen, S.; Denisenko, S.G.; Arashkevich, E.; et al. Food webs and carbon flux in the Barents Sea. Prog. Oceanogr. 2006, 71, 232–287. [Google Scholar] [CrossRef]
  4. Dvoretsky, V.G.; Dvoretsky, A.G. Structure of mesozooplankton community in the Barents Sea and adjacent waters in August 2009. J. Nat. Hist. 2013, 47, 2095–2114. [Google Scholar] [CrossRef]
  5. Dvoretsky, V.G.; Dvoretsky, A.G. Estimated copepod production rate and structure of mesozooplankton communities in the coastal Barents Sea during summer–autumn 2007. Polar Biol. 2012, 35, 1321–1342. [Google Scholar] [CrossRef]
  6. Dvoretsky, V.G.; Dvoretsky, A.G. Coastal mesozooplankton assemblages during spring bloom in the eastern Barents Sea. Biology 2022, 11, 204. [Google Scholar] [CrossRef]
  7. Dvoretsky, A.G.; Dvoretsky, V.G. Commercial fish and shellfish in the Barents Sea: Have introduced crab species affected the population trajectories of commercial fish? Rev. Fish Biol. Fish. 2015, 25, 297–322. [Google Scholar] [CrossRef]
  8. Dvoretsky, A.G.; Dvoretsky, V.G. Red king crab (Paralithodes camtschaticus) fisheries in Russian waters: Historical review and present status. Rev. Fish Biol. Fish. 2018, 28, 331–353. [Google Scholar] [CrossRef]
  9. Kraan, C.; van der Meer, J.; Dekinga, A.; Piersma, T. Patchiness of macrobenthic invertebrates in homogenized intertidal habitats: Hidden spatial structure at a landscape scale. Mar. Ecol. Prog. Ser. 2009, 383, 211–224. [Google Scholar] [CrossRef] [Green Version]
  10. Munari, C.; Borja, A.; Corinaldesi, C.; Rastelli, E.; Lo Martire, M.; Pitacco, V.; Mistri, M. First application of the ambi index to the macrobenthic soft-bottom community of Terra Nova Bay (Ross Sea, Southern Ocean). Water 2022, 14, 2994. [Google Scholar] [CrossRef]
  11. Zhao, Y.; Yang, T.; Shan, X.; Jin, X.; Teng, G.; Wei, C. Stable isotope analysis of food web structure and the contribution of carbon sources in the sea adjacent to the Miaodao Archipelago (China). Fishes 2022, 7, 32. [Google Scholar] [CrossRef]
  12. Dauvin, J.-C.; Pezy, J.-P.; Poizot, E.; Lozach, S.; Trentesaux, A. A multidisciplinary approach for a better knowledge of the benthic habitat and community distribution in the central and western English Channel. J. Mar. Sci. Eng. 2022, 10, 1112. [Google Scholar] [CrossRef]
  13. Denisenko, S.G.; Denisenko, N.V.; Lehtonen, K.K.; Andersin, A.B.; Laine, A.O. Macrozoobenthos of the Pechora Sea (SE Barents Sea): Community structure and spatial distribution in relation to environmental conditions. Mar. Ecol. Prog. Ser. 2003, 258, 109–123. [Google Scholar] [CrossRef] [Green Version]
  14. Cochrane, S.K.; Denisenko, S.G.; Renaud, P.E.; Emblow, C.S.; Ambrose Jr, W.G.; Ellingsen, I.H.; Skarðhamar, J. Benthic macrofauna and productivity regimes in the Barents Sea—Ecological implications in a changing Arctic. J. Sea Res. 2009, 61, 222–233. [Google Scholar] [CrossRef]
  15. Hunt, C.D. Variability in the benthic Mn flux in coastal marine ecosystems resulting from temperature and primary production. Limnol. Oceanogr. 1983, 28, 913–923. [Google Scholar] [CrossRef]
  16. McLusky, D.S.; Elliott, M. The Estuarine Ecosystem: Ecology, Threats and Management, 3rd ed.; Oxford University Press: Oxford, UK, 2004. [Google Scholar]
  17. Degen, R.; Jørgensen, L.L.; Ljubin, P.; Ellingsen, I.H.; Pehlke, H.; Brey, T. Patterns and drivers of megabenthic secondary production on the Barents Sea shelf. Mar. Ecol. Prog. Ser. 2016, 546, 1–16. [Google Scholar] [CrossRef] [Green Version]
  18. Aller, R.C.; Cochran, J.K. The critical role of bioturbation for particle dynamics, priming potential, and organic C remineralization in marine sediments: Local and basin scales. Front. Earth Sci. 2019, 7, 157. [Google Scholar] [CrossRef] [Green Version]
  19. Coma, R.; Ribes, M.; Gili, J.M.; Zabala, M. Seasonality in coastal benthic ecosystems. Trends Ecol. Evol. 2000, 15, 448–453. [Google Scholar] [CrossRef]
  20. Thomson, D.H. Marine benthos in the eastern Canadian High Arctic: Multivariate analyses of standing crop and community structure. Arctic 1982, 35, 61–74. [Google Scholar] [CrossRef] [Green Version]
  21. Dayton, P.K.; Mordida, B.J.; Bacon, F. Polar marine communities. Am. Zool. 1994, 34, 90–99. [Google Scholar] [CrossRef] [Green Version]
  22. Andrade, C.; Ríos, C.; Gerdes, D.; Brey, T. Trophic structure of shallow-water benthic communities in the sub-Antarctic Strait of Magellan. Polar Biol. 2016, 39, 2281–2297. [Google Scholar] [CrossRef]
  23. Lyubina, O.S.; Zimina, O.L.; Frolova, E.A.; Lyubin, P.A.; Frolov, A.A.; Dikaeva, D.R.; Ahmetchina, O.Y.; Garbul, E.A. Features of the benthic communities distribution in the fjords of West Spitsbergen. Probl. Arctic Antarctic 2011, 1, 28–40. (In Russian) [Google Scholar]
  24. Meyer, K.S.; Sweetman, A.K.; Young, C.M.; Renaud, P.E. Environmental factors structuring Arctic megabenthos—A case study from a shelf and two fjords. Front. Mar. Sci. 2015, 2, 22. [Google Scholar] [CrossRef] [Green Version]
  25. Dunlop, K.; Renaud, P.E.; Berge, J.; Jones, D.O.B.; Harbour, R.P.; Tandberg, A.H.S.; Sweetman, A.K. Benthic scavenger community composition and carrion removal in Arctic and Subarctic fjords. Polar Biol. 2021, 44, 31–43. [Google Scholar] [CrossRef]
  26. Kröger, K.; Rowden, A.A. Polychaete assemblages of the northwestern Ross Sea shelf: Worming out the environmental drivers of Antarctic macrobenthic assemblage composition. Polar Biol. 2008, 31, 971–989. [Google Scholar] [CrossRef]
  27. Roy, V.; Iken, K.; Archambault, P. Environmental drivers of the Canadian Arctic megabenthic communities. PloS ONE 2014, 9, e100900. [Google Scholar] [CrossRef] [Green Version]
  28. Ambrose, W.G., Jr.; Renaud, P.E.; Cochrane, S.K.; Denisenko, S.G.; Skarðhamar, J. Polychaete diversity patterns on two Arctic shelves: Impacts of ice and primary production? Zoosymposia 2009, 2, 457–485. [Google Scholar] [CrossRef] [Green Version]
  29. Molina, È.J.; Silberberger, M.J.; Kokarev, V.; Reiss, H. Environmental drivers of benthic community structure in a deep sub-arctic fjord system. Estuar. Coast. Shelf Sci. 2019, 225, 106239. [Google Scholar] [CrossRef]
  30. Gutt, J.; Arndt, J.; Kraan, C.; Dorschel, B.; Schröder, M.; Bracher, A.; Piepenburg, D. Benthic communities and their drivers: A spatial analysis off the Antarctic Peninsula. Limnol. Oceanogr. 2019, 64, 2341–2357. [Google Scholar] [CrossRef] [Green Version]
  31. Waga, H.; Hirawake, T.; Grebmeier, J.M. Recent change in benthic macrofaunal community composition in relation to physical forcing in the Pacific Arctic. Polar Biol. 2020, 43, 285–294. [Google Scholar] [CrossRef]
  32. Evseeva, O.Y.; Ishkulova, T.G.; Dvoretsky, A.G. Environmental drivers of an intertidal bryozoan community in the Barents Sea: A case study. Animals 2022, 12, 552. [Google Scholar] [CrossRef]
  33. Wlodarska-Kovalczuk, M.; Pearson, T. Soft-bottom faunal associations and factors affecting species distributions in an Arctic glacial fjord (Kongsfjord, Spitsbergen). Polar Biol. 2004, 27, 155–167. [Google Scholar] [CrossRef]
  34. Kaczmarek, H.; Wlodarska-Kowalczuk, M.; Legezinska, J.; Zajaczkowsky, M. Shallow sublittoral macrozoobenthos in Kongsfjord, West Spitsbergen, Svalbard. Pol. Polar Res. 2005, 26, 137–155. [Google Scholar]
  35. Pecuchet, L.; Blanchet, M.-A.; Frainer, A.; Husson, B.; Jørgensen, L.L.; Kortsch, S.; Primicerio, R. Novel feeding interactions amplify the impact of species redistribution on an Arctic food web. Glob. Change Biol. 2020, 26, 4894–4906. [Google Scholar] [CrossRef] [PubMed]
  36. Makarevich, P.R.; Vodopianova, V.V.; Bulavina, A.S. Dynamics of the spatial chlorophyll-a distribution at the Polar Front in the marginal ice zone of the Barents Sea during spring. Water 2022, 14, 101. [Google Scholar] [CrossRef]
  37. Dvoretsky, A.G.; Dvoretsky, V.G. Population dynamics of the invasive lithodid crab, Paralithodes camtschaticus, in a typical bay of the Barents Sea. ICES J. Mar. Sci. 2013, 70, 1255–1262. [Google Scholar] [CrossRef]
  38. Dvoretsky, A.G.; Dvoretsky, V.G. Effects of environmental factors on the abundance, biomass, and individual weight of juvenile red king crabs in the Barents Sea. Front. Mar. Sci. 2020, 7, 726. [Google Scholar] [CrossRef]
  39. Dvoretsky, A.G.; Dvoretsky, V.G. New echinoderm-crab epibiotic associations from the coastal Barents Sea. Animals 2021, 11, 917. [Google Scholar] [CrossRef]
  40. Dvoretsky, A.G.; Dvoretsky, V.G. Epibiotic communities of common crab species in the coastal Barents Sea: Biodiversity and infestation patterns. Diversity 2022, 14, 6. [Google Scholar] [CrossRef]
  41. Dvoretsky, A.G.; Dvoretsky, V.G. Renewal of the recreational red king crab fishery in Russian waters of the Barents Sea: Potential benefits and costs. Mar. Policy 2022, 136, 104916. [Google Scholar] [CrossRef]
  42. Dvoretsky, A.G.; Dvoretsky, V.G. Epibionts of an introduced king crab in the Barents Sea: A second five-year study. Diversity 2023, 15, 29. [Google Scholar] [CrossRef]
  43. Dvoretsky, A.G.; Dvoretsky, V.G. Inter-annual dynamics of the Barents Sea red king crab (Paralithodes camtschaticus) stock indices in relation to environmental factors. Polar Sci. 2016, 10, 541–552. [Google Scholar] [CrossRef]
  44. Martínez, M.L.; Intralawan, A.; Vázquez, G.; Pérez-Maqueo, O.; Sutton, P.; Landgrave, R. The coasts of our world: Ecological, economic and social importance. Ecol. Econ. 2007, 63, 254–272. [Google Scholar] [CrossRef]
  45. Mangan, S.; Bulmer, R.H.; Greenfield, B.L.; Hailes, S.F.; Carter, K.; Hewitt, J.E.; Lohrer, A.M. Resilience and species accumulation across seafloor habitat transitions in a northern New Zealand harbour. Diversity 2022, 14, 998. [Google Scholar] [CrossRef]
  46. Sampaio, L.; Moreira, J.; Rubal, M.; Guerrero-Meseguer, L.; Veiga, P. A Review of coastal anthropogenic impacts on mytilid mussel beds: Effects on mussels and their associated assemblages. Diversity 2022, 14, 409. [Google Scholar] [CrossRef]
  47. Coccia, C.; Vega, C.; Fierro, P. Macroinvertebrate-based biomonitoring of coastal wetlands in Mediterranean Chile: Testing potential metrics able to detect anthropogenic impacts. Water 2022, 14, 3449. [Google Scholar] [CrossRef]
  48. Dvoretsky, A.G.; Dvoretsky, V.G. Cucumaria in Russian waters of the Barents Sea: Biological aspects and aquaculture potential. Front. Mar. Sci. 2021, 8, 613453. [Google Scholar] [CrossRef]
  49. Dvoretsky, V.G.; Dvoretsky, A.G. Winter zooplankton in a small arctic lake: Abundance and vertical distribution. Water 2021, 13, 912. [Google Scholar] [CrossRef]
  50. Deryugin, K.M. Fauna of the Kola Fjord and the conditions of its existence. Trans. Imper. Acad. Sci. St. Petersburg 1915, 34, 1–929. (In Russian) [Google Scholar]
  51. Zenkevitch, L.A. Biology of the Seas of the USSR; Wiley-Interscience Publishers: New York, NY, USA, 1963. [Google Scholar]
  52. Antipova, T.V. Some data on the current state of benthos in the Kola Bay. In Benthos of the Barents Sea: Distribution, Ecology and Population Structure; Matishov, G.G., Ed.; KSC RAS Press: Apatity, Russia, 1984; pp. 44–47. (In Russian) [Google Scholar]
  53. Frolova, E.A. Ecological condition of benthos of the Kola Bay. In Ecological Situation and Protection of Flora and Fauna of the Barents Sea; Matishov, G.G., Ed.; KSC RAS Press: Apatity, Russia, 1991; pp. 121–125. (In Russian) [Google Scholar]
  54. Frolova, E.A.; Mitina, E.G.; Gudimov, A.V.; Sikorsky, A.V. Bottom fauna of sublitoral. In The Kola Bay: Oceanography, Biology, Ecosystems, Pollutants; Matishov, G.G., Ed.; KSC RAS Press: Apatity, Russia, 1997; pp. 101–123. (In Russian) [Google Scholar]
  55. Pavlova, L.V.; Akhmetchina, O.Y.; Garbul, E.A.; Dikaeva, D.R.; Zimina, O.L.; Noskovich, A.E.; Frolov, A.A.; Frolova, E.A. The new data on the benthos condition of the Kola Bay (Barents Sea). Trans. Kola Sci. Cent. RAS 2019, 6, 35–75. (In Russian) [Google Scholar]
  56. Dvoretsky, V.G.; Dvoretsky, A.G. Life cycle of Oithona similis (Copepoda, Cyclopoida) in Kola Bay (Barents Sea). Mar. Biol. 2009, 156, 1433–1446. [Google Scholar] [CrossRef]
  57. Dzhenyuk, S.L.; Moiseev, D.V.; Borovaya, L.I.; Ipatov, A.N. Oceanological characteristics and processes. In Kola Bay: Development and Rational Use of Natural Resources; Matishov, G.G., Ed.; Nauka: Moscow, Russia, 2009; pp. 20–45. (In Russian) [Google Scholar]
  58. Ilyin, G.V.; Karnatov, A.N. Physico-geographical characteristics of Kola Bay. In Kola Bay and oil: Biota, Vulnerability Maps, Pollution; Shavykin, A.A., Ed.; Renome RAS: Saint-Petersburg, Russia, 2018; pp. 52–70. (In Russian) [Google Scholar]
  59. Zuyev, Y.A. The Upper Sublitoral Megabenthos of Kola Bay (Barents Sea). PhD Thesis, Murmansk Marine Biological Institute RAS (MMBI RAS), Murmansk, Russia, 2012. (In Russian). [Google Scholar]
  60. Pavlova, L.V.; Dvoretsky, G. Prey selectivity in juvenile red king crabs from the coastal Barents Sea. Diversity 2022, 14, 568. [Google Scholar] [CrossRef]
  61. Pavlova, L.V.; Zuyev, Y.A. The red king crab (Paralithodes camtschaticus) in Kola bay: Distribution, population and size/age structure changes from 2006 to 2008. Rybn Khoz. 2010, 6, 66–69. (In Russian) [Google Scholar]
  62. GOST 12536-2014; Methods of Laboratory Granulometric (Grain-Size) and Microaggregate Distribution. Interstate Council for Standardization, Metrology and Certification, STI: Moscow, Russia, 2015. (In Russian)
  63. Romanovsky, S.I. Sedimentological Foundations of Lithology; Nedra: Saint Petersburg, Russia, 1977. [Google Scholar]
  64. GOST 23740-2016; Soils. Methods of Laboratory Determination of Organic Composition. Interstate Council for Standardization, Metrology and Certification, Standartinform: Moscow, Russia, 2017. (In Russian)
  65. Macdonald, T.A.; Burd, B.J.; Macdonald, V.I.; van Roodselaar, A. Taxonomic and feeding guild classification for the marine benthic macroinvertebrates of the Strait of Georgia, British Columbia. Can. Tech. Rep. Fish. Aquat. Sci. 2010, 2874, 1–63. [Google Scholar]
  66. Jumars, P.A.; Dorgan, K.M.; Lindsay, S.M. Diet of worms emended: An update of polychaete feeding guilds. Ann. Rev. Mar. Sci. 2015, 7, 497–520. [Google Scholar] [CrossRef] [Green Version]
  67. Gagaev, S.Y. Polychaetes (Annelida: Polychaeta) of the Kara Sea. Proc. Zool. Inst. RAS 2021, 325, 183–196. [Google Scholar] [CrossRef]
  68. Magurran, A.E. Measuring Biological Diversity; Blackwell Publishing: Oxford, UK, 2004; p. 256. [Google Scholar]
  69. Word, J.Q. The Infaunal Trophic Index; Annual Report 1978; Coastal Water Research Project: El Segundo, CA, USA, 1978. [Google Scholar]
  70. Denisenko, S.G.; Barbashova, M.A.; Skvortsov, V.V.; Belyakov, V.P.; Kurashov, E.A. The results of assessment of the ecological state of zoobenthos communities according to the “Difference of Evenness” Index (DE′). Inland Water Biol. 2013, 6, 39–47. [Google Scholar] [CrossRef]
  71. Clarke, K.R.; Warwick, R.M. Changes in Marine Communities: An Approach to Statistical Analysis and Interpretation, 2nd ed.; PRIMER-E: Plymouth, UK, 2001. [Google Scholar]
  72. Ter Braak, C.J.F.; Smilauer, P. CANOCO Reference Manual and CanoDraw for Windows User’s Guide: Software for Canonical Community Ordination (Version 4.5); Microcomputer Power: Ithaca, NY, USA, 2002. [Google Scholar]
  73. McGovern, M.; Poste, A.E.; Oug, E.; Renaud, P.E.; Trannum, H.C. Riverine impacts on benthic biodiversity and functional traits: A comparison of two sub-Arctic fjords. Estuar. Coast. Shelf Sci. 2020, 240, 106774. [Google Scholar] [CrossRef]
  74. Pavlidis, M.A. Lithology of modern sediments in the eastern Barents Sea. Ber. Polarforsch. 1996, 212, 126–135. [Google Scholar]
  75. Potanin, V.A.; Larin, B.V. Dynamics of waters of the southern part of the Kola Bay. Prir. Hoz. Sev. 1989, 17, 66–71. (In Russian) [Google Scholar]
  76. Mityaev, M.V.; Gerasimova, M.V. Suspended Matter in the Southern and Middle Part of the Bay. Kola Bay: Development and Rational Nature Management; Nauka: Moscow, Russia, 2009; pp. 52–55. (In Russian) [Google Scholar]
  77. Ishkulova, T.G.; Pastukhov, I.A. The current hydrochemical state of the Kola Bay water area in autumn. Trans. Kola Sci. Cent. RAS 2019, 6, 13–22. (In Russian) [Google Scholar]
  78. Dale, J.E.; Aitken, A.E.; Gilbert, R.; Risk, M.J. Macrofauna of Canadian Arctic fjords. Mar. Geol. 1989, 85, 331–358. [Google Scholar] [CrossRef]
  79. Hop, H.; Pearson, T.; Hegseth, E.N.; Kovacs, K.M.; Wiencke, C.; Kwasniewski, S.; Eiane, K.; Mehlum, F.; Gulliksen, B.; Wlodarska-Kowalczuk, M.; et al. The marine ecosystem of Kongsfjorden, Svalbard. Polar Res. 2002, 21, 167–208. [Google Scholar] [CrossRef]
  80. Holte, B.; Oug, E. Soft-bottom macrofauna and responses to organic enrichment in the subarctic waters of Tromso, Northern Norway. J. Sea Res. 1996, 36, 227–237. [Google Scholar] [CrossRef]
  81. Węsławski, J.M.; Kendall, M.A.; Włodarska-Kowalczuk, M.; Iken, K.; Kędra, M.; Legezynska, J.; Sejr, M.K. Climate change effects on Arctic fjord and coastal macrobenthic diversity–observations and predictions. Mar. Biodiv. 2011, 41, 71–85. [Google Scholar] [CrossRef] [Green Version]
  82. Mikac, B.; Licciano, M.; Jaklin, A.; Iveša, L.; Giangrande, A.; Musco, L. Diversity and distribution patterns of hard bottom polychaete assemblages in the north Adriatic Sea (Mediterranean). Diversity 2020, 12, 408. [Google Scholar] [CrossRef]
  83. Gallucci, F.; Christofoletti, R.A.; Fonseca, G.; Dias, G.M. The effects of habitat heterogeneity at distinct spatial scales on hard-bottom-associated communities. Diversity 2020, 12, 39. [Google Scholar] [CrossRef] [Green Version]
  84. Holte, B.; Oug, E.; Cochrane, S. Depth-related benthic macrofaunal biodiversity patterns in three undisturbed north Norwegian fjords. Sarsia 2004, 89, 91–101. [Google Scholar] [CrossRef]
  85. Pavlova, L.V.; Britayev, T.A.; Rzhavsky, A.V. Benthos elimination by juvenile red king crabs Paralithodes camtschaticus (Tilesius, 1815) in the Barents Sea coastal zone: Experimental data. Dokl. Biol. Sci. 2007, 414, 231–234. [Google Scholar] [CrossRef]
  86. Pavlova, L.V. Effect of juvenile red king crabs on zoobenthos in Kola Bay (Barents Sea). Dokl. Biol. Sci. 2008, 422, 312–315. [Google Scholar] [CrossRef]
  87. Pavlova, L.V. The red king crab Paralithodes camchaticus (Tilesius, 1815) (Decapoda: Anomura): The use of species equality indicators to assess the influence on the benthos of the Barents Sea. Russ. J. Mar. Biol. 2021, 47, 508–514. [Google Scholar] [CrossRef]
  88. Kuznetsov, A.P. Ecology of Bottom Communities in the World Ocean (Trophic Structure of Bottom Fauna); Nauka Press: Moscow, Russia, 1980. (In Russian) [Google Scholar]
  89. Commito, J.A.; Ambrose, W.G., Jr. Multiple trophic levels in soft-bottom communities. Mar. Ecol. Prog. Ser. 1985, 26, 289–293. [Google Scholar] [CrossRef]
  90. Calizza, E.; Careddu, G.; Sporta Caputi, S.; Rossi, L.; Costantini, M.L. Time-and depth-wise trophic niche shifts in Antarctic benthos. PLoS ONE 2018, 13, e0194796. [Google Scholar] [CrossRef] [PubMed] [Green Version]
  91. Smith, R.W.; Bergen, M.; Weisberg, S.B.; Cadien, D.; Dalkey, A.; Montagne, D.; Stull, J.K.; Velarde, R.G. Benthic response index for assessing infaunal communities on the southern California mainland shelf. Ecol. Appl. 2001, 11, 1073–1087. [Google Scholar] [CrossRef]
  92. Pearson, T.H.; Rosenberg, R. Macrobenthic succession in relation to organic enrichment and pollution of the marine environment. Oceanogr. Mar. Biol. Ann. Rev. 1978, 16, 229–311. [Google Scholar]
  93. Fleischack, P.C.; de Freitas, A.J. Physical parameters influencing the zonation of surf zone benthos. Estuar. Coast. Shelf Sci. 1989, 28, 517–530. [Google Scholar] [CrossRef]
  94. Rosenberg, R. Benthic marine fauna structured by hydrodynamic processes and food availability. Neth. J. Sea Res. 1995, 34, 303–317. [Google Scholar] [CrossRef]
  95. Kim, S.-L.; Yu, O.-H. Understanding the spatial and temporal distribution and environmental characteristics of polychaete assemblages in the coastal waters of ulleungdo, East Sea of Korea. J. Mar. Sci. Eng. 2021, 9, 1310. [Google Scholar] [CrossRef]
  96. Boutoumit, S.; Bououarour, O.; El Kamcha, R.; Pouzet, P.; Zourarah, B.; Benhoussa, A.; Maanan, M.; Bazairi, H. Spatial patterns of macrozoobenthos assemblages in a sentinel coastal lagoon: Biodiversity and environmental drivers. J. Mar. Sci. Eng. 2021, 9, 461. [Google Scholar] [CrossRef]
  97. Tine, M.; Diop, P.; Diadhiou, H.D. Benthic fauna assessment along the navigation channel from the mouth of the casamance estuary to Ziguinchor city. Conservation 2022, 2, 367–387. [Google Scholar] [CrossRef]
  98. Chan, F.T.; Stanislawczyk, K.; Sneekes, A.C.; Dvoretsky, A.; Gollasch, S.; Minchin, D.; David, M.; Jelmert, A.; Albretsen, J.; Bailey, S.A. Climate change opens new frontiers for marine species in the Arctic: Current trends and future invasion risks. Glob. Change Biol. 2019, 25, 25–38. [Google Scholar] [CrossRef]
  99. Gray, J.S. Animal-sediment relationships. Oceanogr. Mar. Biol. Ann. Rev. 1974, 12, 223–261. [Google Scholar]
  100. Herman, P.M.; Middelburg, J.J.; Heip, C.H. Benthic community structure and sediment processes on an intertidal flat: Results from the ECOFLAT project. Cont. Shelf Res. 2001, 21, 2055–2071. [Google Scholar] [CrossRef]
  101. Shull, D.H.; Yasuda, M. Size-selective downward particle transport by cirratulid polychaetes. J. Mar. Res. 2001, 59, 453–473. [Google Scholar] [CrossRef] [Green Version]
  102. Kolyuchkina, G.A.; Syomin, V.L.; Grigorenko, K.S.; Basin, A.B.; Lyubimov, I.V. The role of abiotic factors in the vertical distribution of macrozoobenthos on the northeastern Black Sea coast. Zool. Zhurnal 2020, 99, 784–800. (In Russian) [Google Scholar] [CrossRef]
  103. Moore, P.G. Inorganic particulate suspensions in the sea and their effects on marine animals. Oceanogr. Mar. Biol. Ann. Rev. 1977, 15, 225–363. [Google Scholar]
  104. Anisimova, N.; Berenboim, B.; Gerasimova, O.; Manushin, I.; Pinchukov, M. On the effect of red king crab on some components of the Barents Sea ecosystem. Ecosystem dynamics and optimal long-term harvest in the Barents Sea fisheries. IMR/PINRO Jt. Rep. Ser. 2005, 2005/2, 298–306. [Google Scholar]
  105. Britayev, T.A.; Rzhavsky, A.V.; Pavlova, L.V.; Dvoretskij, A.G. Studies on impact of the alien Red King Crab (Paralithodes camtschaticus) on the shallow water benthic communities of the Barents Sea. J. Appl. Ichthyol. 2010, 26 (Suppl. 2), 66–73. [Google Scholar] [CrossRef]
  106. Fuhrmann, M.M.; Pedersen, T.; Ramasco, V.; Nilssen, E.M. Macrobenthic biomass and production in a heterogenic subarctic fjord after invasion by the red king crab. J. Sea Res. 2015, 106, 1–13. [Google Scholar] [CrossRef]
  107. Oug, E.; Sundet, J.H.; Cochrane, S.K.J. Structural and functional changes of soft-bottom ecosystems in northern fjords invaded by the red king crab (Paralithodes camtschaticus). J. Mar. Syst. 2018, 180, 255–264. [Google Scholar] [CrossRef]
  108. Pavlova, L.V. Ration of the red king crab on coastal shoals of the Barents Sea. Dokl. Biol. Sci. 2015, 463, 200–204. [Google Scholar] [CrossRef]
  109. Dvoretsky, A.G.; Dvoretsky, V.G. Size-at-age of juvenile red king crab (Paralithodes camtschaticus) in the coastal Barents Sea. Cah. Biol. Mar. 2014, 55, 43–48. [Google Scholar]
  110. Dvoretsky, A.G.; Dvoretsky, V.G. Size at maturity of female red king crab, Paralithodes camtschaticus, from the costal zone of Kola Peninsula (southern Barents Sea). Cah. Biol. Mar. 2015, 56, 49–54. [Google Scholar]
  111. Hixon, M.A.; Menge, B.A. Species diversity: Prey refuges modify the interactive effects of predation and competition. Theor. Popul. Biol. 1991, 39, 178–200. [Google Scholar] [CrossRef]
  112. Diehl, S. Fish predation and benthic community structure: The role of omnivory and habitat complexity. Ecology 1992, 73, 646–1661. [Google Scholar] [CrossRef]
  113. Ellis, R.D. Red grouper (Epinephelus morio) shape faunal communities via multiple ecological pathways. Diversity 2019, 11, 89. [Google Scholar] [CrossRef]
  114. Kvitek, R.G.; Oliver, J.S.; DeGange, A.R.; Anderson, B.S. Changes in Alaskan soft-bottom prey communities along a gradient in sea otter predation. Ecology 1992, 73, 413–428. [Google Scholar] [CrossRef]
  115. Oug, E.; Cochrane, S.K.J.; Sundet, J.H.; Norling, K.; Nilsson, H.C. Effects of the invasive red king crab (Paralithodes camtschaticus) on soft-bottom fauna in Varangerfjorden, northern Norway. Mar. Biodiv. 2011, 41, 467–479. [Google Scholar] [CrossRef]
Figure 1. Map of the study area and location of sampling sites.
Diversity 15 00084 g001
Figure 2. Taxonomic (a,c) and trophic (b,d) structure of the shallow-water benthos in Kola Bay.
Diversity 15 00084 g002
Figure 3. Dendrogram resulting from clustering performed on the Bray–Curtis similarity matrix produced from the square root transformed benthic biomass data in Kola Bay.
Diversity 15 00084 g003
Figure 4. Ordination of samples by redundancy analysis with respect to benthic abundance (a), biomass (b), diversity (c), and functional and trophic groups (d) and their relations to environmental variables in Kola Bay. The proportions of the total variability explained by the first two axes are given. Biological variables: Ali-vi—Alitta virens, Arc-is—Arctica islandica, Bal-ba—Balanus balanus, Bal-Cr—Balanus crenatus, Cap-ca—Capitella capitata, Cap-sp—Capitella sp., Cha-se—Chaetozone setosa, Cho-sp—Chone sp., Cil-ci—Ciliatocardium ciliatum, Cis-gr—Cistenides granulata, Cis-hy—Cistenides hyperborea, Cos-py—Cossura pygodactylata, Cre-de—Crenella decussata, Cry-af—Cryptonatica affinis, Ete-fl—Eteone flava, Gal-oc—Galathowenia oculata, Gly-ca—Glycera capitata, Har-im—Harmothoe imbricata, Het-sq—Heteranomia squamula, Hia-ar—Hiatella arctica, Lao-ci—Laonice cirrata, Lei-ac—Leitoscoloplos acutus, Lep-ca—Lepeta caeca, Mac-ca—Macoma calcarea, Mar-gr—Margarites groenlandicus, Mic-ne—Micronephthys neotena, Mya-ar—Mya arenaria, Mya-tr—Mya truncata, Myt-ed—Mytilus edulis, Nem—Nematoda g.sp., Oph-ro—Ophiura robusta juv., Pal-ti—Palliolum tigerinum, Par-ca—Parougia caeca, Par-pi—Parvicardium pinnulatum, Pho-as—Pholoe assimilis, Pho-ba—Pholoe baltica, Phy-ma—Phyllodoce maculata, Pra-pr—Praxillella praetermissa, Ros-bo—Rostroculodes borealis, Sco-fr—Scoletoma fragilis, Ver-st—Verruca stroemia, N—number of species, H’—Shannon index, J—Pielou index, Si—Simpson index, EPI—epifauna, IN—infauna, Sessile—sessile organisms, Mob—mobile, S-M—semi-mobile, CAR—carnivores, OMN—omnivorous, POL—Polychaeta, BIV—Bivalvia, SF—suspension feeders, SDF—surface deposit feeders, SSDF—subsurface deposit feeders. Environmental variables: gravel, sand, aleurite, and pelite—sediment type, T—water temperature, S—salinity, dT—seasonal temperature amplitude, dS—seasonal salinity amplitude, OM—organic matter, H—sediment sorting index, Crab-D—crab density, Crab-B—crab biomass, De—depth.
Diversity 15 00084 g004
Figure 5. Diversity, abundance, and biomass of benthic communities in shallow (present study) and deep waters [55] of Kola Bay. (a)—α-diversity, (b)—Shannon index, (c)—Pielou evenness, (d)—abundance, (e)—biomass.
Diversity 15 00084 g005
Figure 6. Structure of benthic communities in shallow (present study) and deep waters [55] of Kola Bay. (a)—dominant taxa by abundance, (b)—dominant taxa by biomass, (c)—dominant trophic groups by abundance, (d)—dominant trophic groups by biomass.
Diversity 15 00084 g006
Table 1. Summary of characteristics of sampling stations in Kola Bay.
ParameterStation
A1A2B1B2C1C2D1D2
Latitude69.9736468.9734469.0396669.0395769.0788669.0782369.1178769.11787
Longitude33.029233.0304133.0322533.0344333.2004333.2007133.3931833.39404
Distance from the fjord head, km1010171725253434
Abiotic variables
Depth, m711710811715
Bottom temperature, °C77778888
Bottom salinity, psu32.433.234.234.433.134.033.334.6
Seasonal temperature amplitude, °C *5.35.95.64.77.37.06.05.6
Seasonal salinity amplitude, psu *5.71.03.50.93.02.43.30.5
SedimentsSiltSiltSilty sandSilty sandSilty sandSilty sandSand,
gravel
Sand, gravel, pebbles
Size categories of sediment grains:
Pebble>10 mm000000011.0
Gravel>5 mm005.60001.1130.54
5–2 mm0.05016.731.011.860.354.6621.85
2–1 mm0.100.0010.430.861.280.6013.964.63
Sand1–0.5 mm0.610.059.742.071.861.2032.283.47
0.5–0.25 mm1.520.309.704.458.774.7729.886.84
0.25–0.1 mm6.792.2224.5213.9457.5827.8011.2813.72
Aleurite0.1–0.05 mm2.650.2519.2920.7024.4833.336.136.90
0.05–0.01 mm51.5650.700.7727.161.2115.240.110.21
Pelite0.01–0.005 mm12.5016.900.139.940.544.420.140.17
0.005–0.001 mm3.917.611.032.650.272.950.450.67
<0.001 mm20.3121.972.0617.222.159.340.000.00
Sediment sorting coefficients0.620.620.830.820.550.750.720.79
Organic matter content, %9.538.902.713.011.402.340.492.84
Biotic variables
Red king crab density, ind 1000 m−2 **00222234130
Red king crab biomass, g 1000 m−2 **0071.271.26060465.83406
Note. *—taken from Zuyev [59], **—taken from Pavlova and Zuyev [61].
Table 2. Benthic characteristics of sampling stations in Kola Bay.
ParameterStation
A1A2B1B2C1C2D1D2
Number of phyla55645444
α-diversity (species per station)3146214130405247
Taxonomic compositionAn 65%
Nm 3%
Ar 6%
Mo 23%
Ed 3%
An 70%
Nm 4%
Ar 4%
Mo 20%
Ed 2%
Cn 2%
An 75%
Nm 2%
Ar 6%
Mo 14%
Ed 2%
An 76%
Ar 7%
Mo 15%
Ed 2%
An 67%
Nm 3%
Ar 3%
Mo 23%
Ed 3%
An 72%
Ar 13%
Mo 13%
Ed 3%
An 40%
Ar 15%
Mo 38%
Ed 6%
An 46%
Ar 9%
Mo 43%
Ed 2%
Mean abundance (SE), ind. m−213,790
(6100)
40,830
(17,480)
5150
(510)
7780
(450)
3906
(510)
1850
(1400)
21,936
(2905)
2300
(450)
Mean biomass (SE), g m−234(19)25(15)28(4)76(60)24(6)8(7)40(6)5(1)
Dominant by abundanceCP
(77%)
CP
(81%)
CS
(22%)
CS
(25%)
CP
(32%)
CH
(17%)
NG
(39%)
NG
(37%)
Dominant by biomassCC
(54%)
CP
(37%)
LC
(57%)
AS
(61%)
ME
(39%)
LA
(30%)
BC
(52%)
ME
(20%)
H’1.561.343.883.352.764.183.043.77
J’0.320.240.690.630.560.790.530.68
D0.600.660.110.150.240.080.210.17
ITI6.54.545.436.217.116.235.038.1
DE0.170.32–0.24–0.290.07–0.19–0.030.05
Epifauna:infauna ratio by biomass1:491:121:91:991:1.31:2.32.3:11:1
Dominant trophic group by abundanceSSDF (83%)SSDF (85%)CAR (35%)CAR (35%)CAR (42%)
SSDF (42%)
SSDF (44%)SF
(32%)
OMN (38%)
Dominant trophic group by biomassSF
(58%)
SSDF (45%)SDF (73%)SF
(62%)
SF
(49%)
SSDF (35%)SF
(78%)
SF
(52%)
Note: An—Annelida, Ar—Arachnida, Cn—Cnidaria, Ed—Echinodermata, Mo—Molusca, Nm—Nemertea, CP—Cossura pygodactylata, CS—Chaetozone setosa, CH—Cistenides hyperborea, NG—Nematoda g. sp., CC—Ciliatocardium ciliatum, LC—Laonice cirrata, AS—Arctica islandica, ME—Mytilus edulis, LA—Leitoscoloplos acutus, BC—Balanus crenatus, SSDF—Subsurface deposit feeder, CAR—Carnivores, SF—Suspension feeder, OMN—Omnivorous, SDF—surface deposit feeder, H’—Shannon index, J’—Pielou evenness index, D—Simpson dominance index, ITI—infaunal trophic index, DE—difference of evenness index, SE—standard error.
Table 3. Ten most numerous taxa at each station (bold font) in Kola Bay.
GroupTaxonStation
A1A2B1B2C1C2D1D2
Abundance, ind. m−2
NmtNematoda g.sp.01330160218640860
ArtBalanus crenatus0000661760
ArtVerruca stroemia000001810213
PolAlitta virens005980127400
PolCapitella capitata6501440300672188128800
PolCapitella sp.12800000060
PolChaetozone setosa690116011201920363801642
PolChone sp.104912301120514080
PolCistenides hyperborea8371551231753103285112
PolCossura pygodactylata10,06033,1404751160126015005
PolEteone flava1041714642721061079637
PolGalathowenia oculata64240484801100
PolGlycera capitata051006167560
PolLaonice cirrata4010129318165300
PolLeitoscoloplos acutus005911021313885
PolMicronephthys neotena61617608601560136312300
PolParougia caeca404212322418500
PolPholoe assimilis3219237988050961160190
PolPholoe baltica01600601600
PolPhyllodoce maculata0371103116800
BivHiatella arctica00000022805
BivMacoma calcarea36014001169564362460
BivMya arenaria16060532502930
BivMytilus edulis1122021601902357117
BivParvicardium pinnulatum242111162501160
OphOphiura robusta81111167011511
Biomass, g m−2
NemNemertea g. sp.0.6300.1400000
ArtBalanus balanus00000000.18
ArtBalanus crenatus00000.040.0120.640
ArtRostroculodes borealis0000000.510
PolAlitta virens001.230.630.050.7900
PolCapitella capitata0.411.070.090.120.240.030.040
PolChaetozone setosa3.865.053.776.972.000.300.010.01
PolCistenides hyperborea0.010.400.140.092.760.393.240
PolCistenides granulata00000000.48
PolCossura pygodactylata3.109.510.090.480.330.0200.00
PolEteone flava0.530.631.370.420.430.140.070.01
PolGlycera capitata00.770.7000.031.020.150.25
PolHarmothoe imbricata000.0100.141.070.120
PolLaonice cirrata3.000.9016.2116.811.641.4700
PolLeitoscoloplos acutus0.0200.120.1902.540.130.06
PolMicronephthys neotena0.631.670.660.711.280.0800
PolPholoe assimilis0.010.230.370.350.040.050.400.04
PolPraxillella praetermissa0.370.390.010.0200.0100
PolScoletoma fragilis000.941.461.590.1000.12
PolSpio limicola000.300.040.090.0200
GasCryptonatica affinis0000001.350
GasLepeta coeca00000000.23
GasMargarites groenlandicus00000000.18
BivArctica islandica000.0946.51000.170
BivCiliatocardium ciliatum18.550.300000.030
BivCrenella decussata00000000.13
BivHeteranomia squamula00000.010.010.950.02
BivHiatella arctica0000001.480.01
BivMacoma calcarea1.142.900.040.220.180.081.100.04
BivMya arenaria0.6101.110.510.6803.210
BivMya truncata00.01000000.75
BivMytilus edulis0.090.100.0109.3002.210.87
BivPalliolum tigerinum00000000.22
BivParvicardium pinnulatum0.200.150.070.101.5901.810.07
Note: Art—Artropoda, Gas—Gastropoda, Nem—Nemertea, Nmt—Nematoda, Pol—Polychaeta, Biv—Bivalvia, Oph—Ophiuroidea.
Table 4. Results of SIMPER analysis: contribution of benthic species (cut-off 90%) to the total dissimilarity between Cluster 1 and Cluster 2 delineated with cluster analysis in Kola Bay.
SpeciesAverage Dissimilarity = 76.58%
Av. DissSDContribCum
Arctica islandica14.710.6519.219.2
Laonice cirrata13.621.2917.7836.99
Ciliatocardium ciliatum13.340.8817.4254.41
Cossura pygodactylata9.531.3712.4566.86
Mytilus edulis5.860.667.6574.51
Macoma calcarea2.951.483.8678.37
Chaetozone setosa2.781.393.6382.00
Scoletoma fragilis2.002.512.6284.61
Cistenides hyperborea1.770.762.3186.92
Parvicardium pinnulatum0.970.741.2788.19
Alitta virens0.940.981.2289.42
Capitella capitata0.921.331.290.62
Note: Av. Diss—average dissimilarity (%), SD—standard deviation, Contrib—contribution (%), Cum—cumulative contribution (%).
Table 5. List of environmental variables that contributed to the RDA models based on the benthic abundance, biomass, diversity, and functional groups data in Kola Bay.
VariableAbundanceBiomass
EVFPVariableEVFP
Crab-D403.930.001T262.090.026
OM202.980.038OM192.090.074
Crab-B141.580.213S191.750.101
T122.720.076dS121.530.286
H72.240.120H91.670.363
S52.420.337Sand91.060.420
Gravel201.000Gravel601.000
VariableDiversityFunctional and Trophic Structure
EVFPVariableEVFP
T3622.250.007H743.220.048
dS282.390.180Aleurite263.290.080
H171.670.247Crab-D143.240.085
S141.130.318Crab-B343.140.103
Gravel414.840.068Gravel71.990.210
OM15.600.175Pelite121.630.234
Sand001.000Sand001.000
Note: T—temperature (°C); S—salinity; dS—seasonal salinity amplitude; OM—organic matter (%); H—sediment sorting index; gravel, sand, pelite—sediment type; Crab-D—crab density (ind. 1000 m−2); Crab-B—crab biomass (g 1000 m−2); EV—explained variation (%); F—pseudo F-ratio; P—probability level.
Disclaimer/Publisher’s Note: The statements, opinions and data contained in all publications are solely those of the individual author(s) and contributor(s) and not of MDPI and/or the editor(s). MDPI and/or the editor(s) disclaim responsibility for any injury to people or property resulting from any ideas, methods, instructions or products referred to in the content.

