Cognitive Aspects of Human-Computer Interaction for GIS

A special issue of ISPRS International Journal of Geo-Information (ISSN 2220-9964).

Deadline for manuscript submissions: closed (28 February 2019) | Viewed by 60478

Printed Edition Available!
A printed edition of this Special Issue is available here.

Special Issue Editor


E-Mail Website
Guest Editor
1. Institute for Photogrammetry, University of Stuttgart, 70147 Stuttgart, Germany
2. Institute of Distributed and Parallel Systems, University of Stuttgart, 70147 Stuttgart, Germany
Interests: geographical information science; computer vision; computer graphics; computer games; photogrammetry; remote sensing and statistical inference
Special Issues, Collections and Topics in MDPI journals

Special Issue Information

Dear Colleagues,

The widespread use of emerging technologies for 3D modelling and 3D visualization, such as Augmented Reality, Virtual Reality, and 3D/4D App developments, offers GIS new interfaces for Human–Computer Interactions. This also goes along with progress in big data analyses using machine learning and deep learning methods, but this is still in its infancy with regard to GIS data analysis. Most of the high-quality urban scenes, such as 3D vectorized buildings and city models, are output by interactive workflows, which should be replaced, step-by-step, by more automation in near future. Therefore, this Special Issue will deliver the state-of-the-art in 3D modeling using interactive and semi-automated and fully-automated workflows, in particular when 3D urban scenes have to be interpreted and vectorized.

Today we may let tell 3D objects its own stories, in text and messages, audio, and video. This requires the definition of storyboards to present further geometries, images, and semantics. Therefore, an integration of semantic models/ontologies with geometric data and metadata is necessary—also in order to offer semantic details in coarse-to-fine modes, just to adapt it to the user level. A child in kindergarten may play with a 2D, 3D and 4D GIS app, purely for fun, school pupils might use it to learn about their home town and its history, while students [DM1] and adults might expect more complex and dense information.

GIS is no longer the only bridge for disciplines in surveying—it has become one of many fascinating fields and technologies collaborating together, as given in the following figure. This means the data collectors, data processors and data presenters should collaborate closely; for example, we may link photogrammetry and computer vision with geoinformatics and building information modeling on the one hand, and with computer graphics and serious gaming on the other hand. The boundaries of the different fields intersect and it is exciting to see the output of these intersections. Serious gaming offers platforms for advanced 3D modeling and rendering and, therefore, also plays an important role in cognitive aspects of Human–Computer Interaction.

text

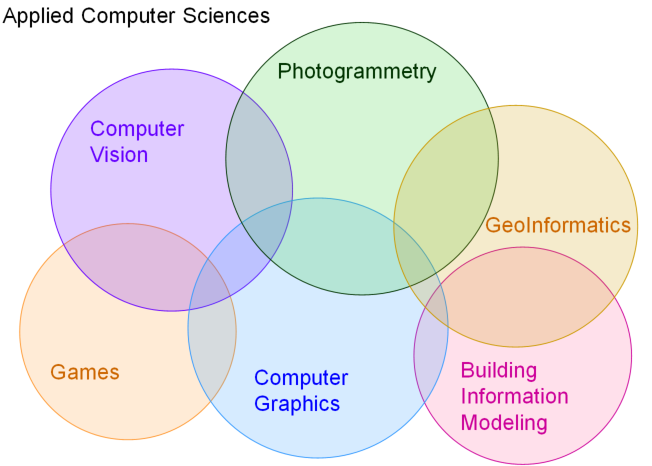
Figure 1. Collaboration of several scientific fields in 2D, 3D and 4D modeling and visualization.

Therefore, this issue is open for all articles dealing with the state-of-the-art in Human–Computer Interaction and new developments, integrating Mixed Realities, 3D/4D app developments and progress in automated 3D urban scene modeling.

Prof. Dr. Dieter Fritsch
Guest Editor

Manuscript Submission Information

Manuscripts should be submitted online at www.mdpi.com by registering and logging in to this website. Once you are registered, click here to go to the submission form. Manuscripts can be submitted until the deadline. All submissions that pass pre-check are peer-reviewed. Accepted papers will be published continuously in the journal (as soon as accepted) and will be listed together on the special issue website. Research articles, review articles as well as short communications are invited. For planned papers, a title and short abstract (about 100 words) can be sent to the Editorial Office for announcement on this website.

Submitted manuscripts should not have been published previously, nor be under consideration for publication elsewhere (except conference proceedings papers). All manuscripts are thoroughly refereed through a single-blind peer-review process. A guide for authors and other relevant information for submission of manuscripts is available on the Instructions for Authors page. ISPRS International Journal of Geo-Information is an international peer-reviewed open access monthly journal published by MDPI.

Please visit the Instructions for Authors page before submitting a manuscript. The Article Processing Charge (APC) for publication in this open access journal is 1700 CHF (Swiss Francs). Submitted papers should be well formatted and use good English. Authors may use MDPI's English editing service prior to publication or during author revisions.

Keywords

  • 3D and 4D App Developments
  • Augmented Reality
  • Virtual Reality
  • Storyboard Design
  • Adaptive Ontology
  • Machine Learning
  • Deep Learning

Published Papers (10 papers)

Order results
Result details
Select all
Export citation of selected articles as:

Editorial

Jump to: Research, Review

9 pages, 5067 KiB  
Editorial
Guest Editor’s Editorial “Cognitive Aspects of Human-Computer Interaction for GIS”
by Dieter Fritsch
ISPRS Int. J. Geo-Inf. 2019, 8(8), 337; https://doi.org/10.3390/ijgi8080337 - 30 Jul 2019
Cited by 1 | Viewed by 3300
Abstract
The first Hypertext System and HCI [...] Full article
(This article belongs to the Special Issue Cognitive Aspects of Human-Computer Interaction for GIS)
Show Figures

Figure 1

Research

Jump to: Editorial, Review

20 pages, 6735 KiB  
Article
Gender and Age Differences in Using Indoor Maps for Wayfinding in Real Environments
by Chengshun Wang, Yufen Chen, Shulei Zheng and Hua Liao
ISPRS Int. J. Geo-Inf. 2019, 8(1), 11; https://doi.org/10.3390/ijgi8010011 - 27 Dec 2018
Cited by 20 | Viewed by 5163
Abstract
Users more easily become lost in complex indoor environments than in outdoor environments. Users with diverse backgrounds encounter different self-location, route memorization, and route following problems during wayfinding. This study intends to explore gender and age effects on the use of indoor maps [...] Read more.
Users more easily become lost in complex indoor environments than in outdoor environments. Users with diverse backgrounds encounter different self-location, route memorization, and route following problems during wayfinding. This study intends to explore gender and age effects on the use of indoor maps for wayfinding in real environments. We used eye-tracking and retrospective verbal protocol methods to conduct a wayfinding experiment in a newly opened building. Statistical data were collected and three findings were obtained. Finding 1: Males had no significant differences with females in indoor self-location, route reading, and route following. However, males paid less visual attention to the landmark and legend than females during route reading. Finding 2: Age-related differences were significant in indoor wayfinding. Younger adults generally outperformed elderly adults in wayfinding in real indoor environments. Finding 3: Gender and age interactive effects were significant in self-location and route memorization. The mean differences of visual attention on the self-location map reading and route memorization between males and females increased with age. Full article
(This article belongs to the Special Issue Cognitive Aspects of Human-Computer Interaction for GIS)
Show Figures

Figure 1

25 pages, 3886 KiB  
Article
Collaborative Immersive Virtual Environments for Education in Geography
by Čeněk Šašinka, Zdeněk Stachoň, Michal Sedlák, Jiří Chmelík, Lukáš Herman, Petr Kubíček, Alžběta Šašinková, Milan Doležal, Hynek Tejkl, Tomáš Urbánek, Hana Svatoňová, Pavel Ugwitz and Vojtěch Juřík
ISPRS Int. J. Geo-Inf. 2019, 8(1), 3; https://doi.org/10.3390/ijgi8010003 - 23 Dec 2018
Cited by 73 | Viewed by 11977
Abstract
Immersive virtual reality (iVR) devices are rapidly becoming an important part of our lives and forming a new way for people to interact with computers and each other. The impact and consequences of this innovative technology have not yet been satisfactory explored. This [...] Read more.
Immersive virtual reality (iVR) devices are rapidly becoming an important part of our lives and forming a new way for people to interact with computers and each other. The impact and consequences of this innovative technology have not yet been satisfactory explored. This empirical study investigated the cognitive and social aspects of collaboration in a shared, immersive virtual reality. A unique application for implementing a collaborative immersive virtual environment (CIVE) was developed by our interdisciplinary team as a software solution for educational purposes, with two scenarios for learning about hypsography, i.e., explanations of contour line principles. Both scenarios allow switching between a usual 2D contour map and a 3D model of the corresponding terrain to increase the intelligibility and clarity of the educational content. Gamification principles were also applied to both scenarios to augment user engagement during the completion of tasks. A qualitative research approach was adopted to obtain a deep insight into the lived experience of users in a CIVE. It was thus possible to form a deep understanding of very new subject matter. Twelve pairs of participants were observed during their CIVE experience and then interviewed either in a semistructured interview or a focus group. Data from these three research techniques were analyzed using interpretative phenomenological analysis, which is research method for studying individual experience. Four superordinate themes—with detailed descriptions of experiences shared by numerous participants—emerged as results from the analysis; we called these (1) Appreciation for having a collaborator, (2) The Surprising “Fun with Maps”, (3) Communication as a challenge, and (4) Cognition in two realities. The findings of the study indicate the importance of the social dimension during education in a virtual environment and the effectiveness of dynamic and interactive 3D visualization. Full article
(This article belongs to the Special Issue Cognitive Aspects of Human-Computer Interaction for GIS)
Show Figures

Figure 1

25 pages, 1997 KiB  
Article
Evaluation of User Performance in Interactive and Static 3D Maps
by Lukáš Herman, Vojtěch Juřík, Zdeněk Stachoň, Daniel Vrbík, Jan Russnák and Tomáš Řezník
ISPRS Int. J. Geo-Inf. 2018, 7(11), 415; https://doi.org/10.3390/ijgi7110415 - 26 Oct 2018
Cited by 29 | Viewed by 4954
Abstract
Interactive 3D visualizations of geospatial data are currently available and popular through various applications such as Google EarthTM and others. Several studies have focused on user performance with 3D maps, but static 3D maps were mostly used as stimuli. The main objective [...] Read more.
Interactive 3D visualizations of geospatial data are currently available and popular through various applications such as Google EarthTM and others. Several studies have focused on user performance with 3D maps, but static 3D maps were mostly used as stimuli. The main objective of this paper was to identify differences between interactive and static 3D maps. We also explored the role of different tasks and inter-individual differences of map users. In the experimental study, we analyzed effectiveness, efficiency, and subjective preferences, when working with static and interactive 3D maps. The study included 76 participants and used a within-subjects design. Experimental testing was performed using our own testing tool 3DmoveR 2.0, which was based on a user logging method and open web technologies. We demonstrated statistically significant differences between interactive and static 3D maps in effectiveness, efficiency, and subjective preferences. Interactivity influenced the results mainly in ‘spatial understanding’ and ‘combined’ tasks. From the identified differences, we concluded that the results of the user studies with static 3D maps as stimuli could not be transferred to interactive 3D visualizations or virtual reality. Full article
(This article belongs to the Special Issue Cognitive Aspects of Human-Computer Interaction for GIS)
Show Figures

Figure 1

7 pages, 2198 KiB  
Communication
Determining Optimal Video Length for the Estimation of Building Height through Radial Displacement Measurement from Space
by Andrew Plowright, Riccardo Tortini and Nicholas C. Coops
ISPRS Int. J. Geo-Inf. 2018, 7(9), 380; https://doi.org/10.3390/ijgi7090380 - 18 Sep 2018
Cited by 4 | Viewed by 3195
Abstract
We presented a methodology for estimating building heights in downtown Vancouver, British Columbia, Canada, using a high definition video (HDV) recorded from the International Space Station. We developed an iterative routine based on multiresolution image segmentation to track the radial displacement of building [...] Read more.
We presented a methodology for estimating building heights in downtown Vancouver, British Columbia, Canada, using a high definition video (HDV) recorded from the International Space Station. We developed an iterative routine based on multiresolution image segmentation to track the radial displacement of building roofs over the course of the HDV, and to predict the building heights using an ordinary least-squares regression model. The linear relationship between the length of the tracking vector and the height of the buildings was excellent (r2 ≤ 0.89, RMSE ≤ 8.85 m, p < 0.01). Notably, the accuracy of the height estimates was not improved considerably beyond 10 s of outline tracking, revealing an optimal video length for estimating the height or elevation of terrestrial features. HDVs are demonstrated to be a viable and effective data source for target tracking and building height prediction when high resolution imagery, spectral information, and/or topographic data from other sources are not available. Full article
(This article belongs to the Special Issue Cognitive Aspects of Human-Computer Interaction for GIS)
Show Figures

Graphical abstract

19 pages, 4311 KiB  
Article
4D Time Density of Trajectories: Discovering Spatiotemporal Patterns in Movement Data
by Yebin Zou, Yijin Chen, Jing He, Gehu Pang and Kaixuan Zhang
ISPRS Int. J. Geo-Inf. 2018, 7(6), 212; https://doi.org/10.3390/ijgi7060212 - 04 Jun 2018
Cited by 12 | Viewed by 4948
Abstract
Modern positioning and sensor technology enable the acquisition of movement positions and attributes on an unprecedented scale. Therefore, a large amount of trajectory data can be used to analyze various movement phenomena. In cartography, a common way to visualize and explore trajectory data [...] Read more.
Modern positioning and sensor technology enable the acquisition of movement positions and attributes on an unprecedented scale. Therefore, a large amount of trajectory data can be used to analyze various movement phenomena. In cartography, a common way to visualize and explore trajectory data is to use the 3D cube (e.g., space-time cube), where trajectories are presented as a tilted 3D polyline. As larger movement datasets become available, this type of display can easily become confusing and illegible. In addition, movement datasets are often unprecedentedly massive, high-dimensional, and complex (e.g., implicit spatial and temporal relations and interactions), making it challenging to explore and analyze the spatiotemporal movement patterns in space. In this paper, we propose 4D time density as a visualization method for identifying and analyzing spatiotemporal movement patterns in large trajectory datasets. The movement range of the objects is regarded as a 3D geographical space, into which the fourth dimension, 4D time density, is incorporated. The 4D time density is derived by modeling the movement path and velocity separately. We present a time density algorithm, and demonstrate it on the simulated trajectory and a real dataset representing the movement data of aircrafts in the Hong Kong International and the Macau International Airports. Finally, we consider wider applications and further developments of time density. Full article
(This article belongs to the Special Issue Cognitive Aspects of Human-Computer Interaction for GIS)
Show Figures

Figure 1

19 pages, 3936 KiB  
Article
2DPR-Tree: Two-Dimensional Priority R-Tree Algorithm for Spatial Partitioning in SpatialHadoop
by Ahmed Elashry, Abdulaziz Shehab, Alaa M. Riad and Ahmed Aboul-Fotouh
ISPRS Int. J. Geo-Inf. 2018, 7(5), 179; https://doi.org/10.3390/ijgi7050179 - 09 May 2018
Cited by 10 | Viewed by 4484
Abstract
Among spatial information applications, SpatialHadoop is one of the most important systems for researchers. Broad analyses prove that SpatialHadoop outperforms the traditional Hadoop in managing distinctive spatial information operations. This paper presents a Two Dimensional Priority R-Tree (2DPR-Tree) as a new partitioning technique [...] Read more.
Among spatial information applications, SpatialHadoop is one of the most important systems for researchers. Broad analyses prove that SpatialHadoop outperforms the traditional Hadoop in managing distinctive spatial information operations. This paper presents a Two Dimensional Priority R-Tree (2DPR-Tree) as a new partitioning technique in SpatialHadoop. The 2DPR-Tree employs a top-down approach that effectively reduces the number of partitions accessed to answer the query, which in turn improves the query performance. The results were evaluated in different scenarios using synthetic and real datasets. This paper aims to study the quality of the generated index and the spatial query performance. Compared to other state-of-the-art methods, the proposed 2DPR-Tree improves the quality of the generated index and the query execution time. Full article
(This article belongs to the Special Issue Cognitive Aspects of Human-Computer Interaction for GIS)
Show Figures

Figure 1

16 pages, 3250 KiB  
Article
Estimating the Performance of Random Forest versus Multiple Regression for Predicting Prices of the Apartments
by Marjan Čeh, Milan Kilibarda, Anka Lisec and Branislav Bajat
ISPRS Int. J. Geo-Inf. 2018, 7(5), 168; https://doi.org/10.3390/ijgi7050168 - 02 May 2018
Cited by 94 | Viewed by 10084
Abstract
The goal of this study is to analyse the predictive performance of the random forest machine learning technique in comparison to commonly used hedonic models based on multiple regression for the prediction of apartment prices. A data set that includes 7407 records of [...] Read more.
The goal of this study is to analyse the predictive performance of the random forest machine learning technique in comparison to commonly used hedonic models based on multiple regression for the prediction of apartment prices. A data set that includes 7407 records of apartment transactions referring to real estate sales from 2008–2013 in the city of Ljubljana, the capital of Slovenia, was used in order to test and compare the predictive performances of both models. Apparent challenges faced during modelling included (1) the non-linear nature of the prediction assignment task; (2) input data being based on transactions occurring over a period of great price changes in Ljubljana whereby a 28% decline was noted in six consecutive testing years; and (3) the complex urban form of the case study area. Available explanatory variables, organised as a Geographic Information Systems (GIS) ready dataset, including the structural and age characteristics of the apartments as well as environmental and neighbourhood information were considered in the modelling procedure. All performance measures (R2 values, sales ratios, mean average percentage error (MAPE), coefficient of dispersion (COD)) revealed significantly better results for predictions obtained by the random forest method, which confirms the prospective of this machine learning technique on apartment price prediction. Full article
(This article belongs to the Special Issue Cognitive Aspects of Human-Computer Interaction for GIS)
Show Figures

Figure 1

18 pages, 17028 KiB  
Article
An Efficient Visualization Method for Polygonal Data with Dynamic Simplification
by Mingguang Wu, Taisheng Chen, Kun Zhang, Zhimin Jing, Yangli Han, Menglin Chen, Hong Wang and Guonian Lv
ISPRS Int. J. Geo-Inf. 2018, 7(4), 138; https://doi.org/10.3390/ijgi7040138 - 02 Apr 2018
Cited by 6 | Viewed by 5738
Abstract
Polygonal data often require rendering with symbolization and simplification in geovisualization. A common issue in existing methods is that simplification, symbolization and rendering are addressed separately, causing computational and data redundancies that reduce efficiency, especially when handling large complex polygonal data. Here, we [...] Read more.
Polygonal data often require rendering with symbolization and simplification in geovisualization. A common issue in existing methods is that simplification, symbolization and rendering are addressed separately, causing computational and data redundancies that reduce efficiency, especially when handling large complex polygonal data. Here, we present an efficient polygonal data visualization method by organizing the simplification, tessellation and rendering operations into a single mesh generalization process. First, based on the sweep line method, we propose a topology embedded trapezoidal mesh data structure to organize the tessellated polygons. Second, we introduce horizontal and vertical generalization operations to simplify the trapezoidal meshes. Finally, we define a heuristic testing algorithm to efficiently preserve the topological consistency. The method is tested using three OpenStreetMap datasets and compared with the Douglas Peucker algorithm and the Binary Line Generalization tree-based method. The results show that the proposed method improves the rendering efficiency by a factor of six. Efficiency-sensitive mapping applications such as emergency mapping could benefit from this method, which would significantly improve their visualization performances. Full article
(This article belongs to the Special Issue Cognitive Aspects of Human-Computer Interaction for GIS)
Show Figures

Figure 1

Review

Jump to: Editorial, Research

25 pages, 727 KiB  
Review
Progress and Challenges on Entity Alignment of Geographic Knowledge Bases
by Kai Sun, Yunqiang Zhu and Jia Song
ISPRS Int. J. Geo-Inf. 2019, 8(2), 77; https://doi.org/10.3390/ijgi8020077 - 06 Feb 2019
Cited by 25 | Viewed by 4621
Abstract
Geographic knowledge bases (GKBs) with multiple sources and forms are of obvious heterogeneity, which hinders the integration of geographic knowledge. Entity alignment provides an effective way to find correspondences of entities by measuring the multidimensional similarity between entities from different GKBs, thereby overcoming [...] Read more.
Geographic knowledge bases (GKBs) with multiple sources and forms are of obvious heterogeneity, which hinders the integration of geographic knowledge. Entity alignment provides an effective way to find correspondences of entities by measuring the multidimensional similarity between entities from different GKBs, thereby overcoming the semantic gap. Thus, many efforts have been made in this field. This paper initially proposes basic definitions and a general framework for the entity alignment of GKBs. Specifically, the state-of-the-art of algorithms of entity alignment of GKBs is reviewed from the three aspects of similarity metrics, similarity combination, and alignment judgement; the evaluation procedure of alignment results is also summarized. On this basis, eight challenges for future studies are identified. There is a lack of methods to assess the qualities of GKBs. The alignment process should be improved by determining the best composition of heterogeneous features, optimizing alignment algorithms, and incorporating background knowledge. Furthermore, a unified infrastructure, techniques for aligning large-scale GKBs, and deep learning-based alignment techniques should be developed. Meanwhile, the generation of benchmark datasets for the entity alignment of GKBs and the applications of this field need to be investigated. The progress of this field will be accelerated by addressing these challenges. Full article
(This article belongs to the Special Issue Cognitive Aspects of Human-Computer Interaction for GIS)
Show Figures

Figure 1

Back to TopTop