Article

Experimental Study of the TVOC Distribution in a Car Cabin

Air Quality Group, Department of Mechanical and Environmental Engineering, ESTACA, Paris Saclay Campus, 78180 Montigny-le-Bretonneux, France
*
Author to whom correspondence should be addressed.
Air 2023, 1(3), 184-195; https://doi.org/10.3390/air1030014
Submission received: 16 May 2023 / Revised: 10 July 2023 / Accepted: 2 August 2023 / Published: 9 August 2023
(This article belongs to the Special Issue Indoor Air Quality: Risk Assessment and Public Health)

Abstract

:
The vehicle in-cabin is subject to several types of pollutants infiltrating from the outdoors or emitted directly inside it, such as Volatile Organic Compounds (VOCs). The concentration of TVOC (total volatile organic compounds) is the result of the emission from different equipment surfaces that compose the car cabin. In the present study, the experimental characterization of TVOC emission from the interior surfaces of a car cabin is discussed by considering the influence of two parameters: the temperature and ventilation modes. A measurement location grid was used to measure TVOC’s emissions from 267 points on all surfaces of the car’s interior equipment. Three different temperatures and two ventilation modes (recirculation and outdoor air) were investigated. The results indicate that the concentration of TVOC increases with the temperature inside the cabin with a contribution that varies with the type of cabin equipment including the dashboard, center console, seats, and carpets. On the other hand, the concentration distributions of TVOC showed relative differences of 10–13% and 2–5% for surface and volumetric measurements, respectively. This implies no preferential positioning of the in-cabin probe for TVOC volumetric concentration measurements. In addition, the recirculation ventilation mode results in a higher accumulation of TVOC; therefore, higher concentrations are measured.

1. Introduction

In modern societies, people spend more than 70% of their time inside indoor spaces, including in car interiors [1]. Therefore, ensuring good air quality in confined spaces has become a major health issue for public authorities even before the COVID pandemic. Poor air quality can lead to various health problems, including headaches, dizziness, fatigue, and respiratory problems, especially for people sensitive to allergens or pollutants. Factors contributing to poor indoor air quality have received significant attention from the research community. However, despite the fact that many people spend more than an hour a day on average inside vehicles in industrialized countries [2], and even though more and more air purification devices intended for cars are produced and sold, the available data on air quality in vehicle interiors remains limited for several pollutants compared to those available on air quality in buildings [3].
Volatile Organic Compounds (VOCs) are known as one type of family of pollutants that can be found inside vehicles. These types of pollutants consist of carbon-based chemicals that evaporate easily at ambient temperatures and are commonly found in a variety of products such as paints, cleaners, adhesives, and building materials. Exposure to VOCs has been associated with a variety of health effects, including eye, nose, and throat irritation, headaches, nausea, and even cancer [4,5,6].
Studies have reported that the level of TVOC inside vehicle cabins is higher than that in the external environment, due to the accumulation of pollutants inside the car cabin [7]. The World Health Organization (WHO) does not provide a specific guideline limit value for TVOC in car cabins. However, it is recommended that the total concentration of indoor VOCs should not exceed 500 µg/m3 to prevent adverse health effects [8]. It is worth noting that TVOC is a general indicator of indoor air quality and does not indicate the specific types or concentrations of individual VOCs, which may have different health effects at different concentrations.
In the interior of a car, a wide range of volatile organic compounds, of varying concentrations, are present. In Japan, 275 organic compounds were identified in the interior air of 101 different car models assigned for private use [9]. Most (80–90%) of the collected compounds could be measured quantitatively. It was found that aliphatic and aromatic hydrocarbons in high concentrations are the main compounds contributing to cabin air pollution. Several characteristic compounds related to plastics, rubbers, and resins, which are widely used in automotive manufacturing, have been reported in car interiors [9]. The concentration of TVOC emitted in vehicle interiors depends on several parameters such as the age of the vehicle [10], the engine idle mode [11], the in-cabin temperature [12] and the ventilation mode in the passenger compartment [13].
Several studies on indoor air quality have been carried out specifically on second-hand vehicles, and research has mainly examined the concentration of TVOCs from outdoor sources. In contrast, there are relatively few studies conducted on the interior of new and unused vehicles [9,14,15]. Zhang et al. [15] analyzed four organic compounds in 802 new passenger cars, some of which were up to three years old. You et al. [16] identified 82 compounds in a single new car, 61 compounds in a one-year-old car, and 36 compounds in a five-year-old car. Chien [17], on the other hand, has investigated 12 of the most frequently detected compounds in five different new vehicles. Results showed that the concentrations of certain compounds vary considerably depending on the vehicle model. Differences in the finishing materials used in the vehicle’s interior had an influence on the number of organic compounds emitted, which ranged from 139 to 210. The most extensive investigation was conducted by Yoshida et al. [9]. They examined 101 types of Japanese passenger cars up to 3 years old and found that aliphatic and aromatic hydrocarbons were the major compounds contributing to cabin air pollution. With regard to the influence of the age of the vehicle, a comparison between a new and a used vehicle of the same model revealed differences in TVOC concentration levels. In used vehicles, the concentration of BTEX, a type of VOC associated with combustion, increases with vehicle mileage. In particular, BTEX concentration increased most significantly with mileage beyond 11,000 km [10].
Fedoruk et al. [18] studied the concentration of different types of TVOCs released inside the car cabin by various components. The study was conducted in the car cabins of five different sedan car types, both in static conditions (parked and unventilated) and under specific operational conditions (driving mode with air conditioning only, ventilation mode only, or with the driver’s window partially opened). Levels of concentration TVOC inside the car cabins during the operating and ventilation condition were 10 to 20 lower compared with the condition where the vehicles were tested in the static measurement mode in hot conditions. The lowest level f the TVOC concentration inside the car cabin was detected during the test when the driver’s window half opened.
The presence of VOCs inside a new vehicle is mainly linked to the interior emission of materials used in cabin equipment (degassing of materials). The materials that contribute most to VOCs emissions are hard plastics, elastomers, rubber, natural or synthetic leather, fabrics, and fibers [9,14,16,19,20]. Interior trim materials (leather or fabric) have also a significant impact on VOCs levels inside a vehicle [17,21]. Carpets, for example, can be a source of styrene emissions [19], while 1-butanol and 2,6-di-t-butyl-4-methenol are characteristic of interiors containing various plastics, rubbers, and resins [9]. The influence on the in-cabin air quality and on VOCs concentrations, of the interior equipment as well as the differences in materials used has been described by [22]. The TVOC concentration depends mainly on the interior materials, temperature, humidity, ventilation, age, and general conditions of the vehicle [9,10,17,20,23]. Among these parameters, the interior temperature seems to be a particularly important factor influencing TVOC emissions, since on summer days the temperature in the car’s cabin can exceed 40 °C [24]. As the temperature inside a car increases, so does the vaporization and outgassing of various organic compounds from cabin materials. The measurement method used in most studies on TVOC emission is diffusive sampling. This method is used to identify the groups of compounds and to measure an average concentration within the volume. The primary objective of this study was to evaluate the distribution of VOC surface emissions in a new vehicle using an innovative method. The focus of the study was to characterize the concentration of TVOC emitted from various surfaces within the car cabin, including the dashboard, front and rear seats, and carpets. To achieve this, a grid-based localization technique was employed to assess the TVOC emission rate of each cabin surface, enabling the creation of a visual map representing the distribution of TVOC concentration across the car interior. Two key parameters were examined in the study: the impact of temperature on VOC concentration levels and the influence of ventilation type on the emissions from different car components. By analyzing these parameters, the study aimed to gain insights into the factors affecting VOC levels in car cabins and their potential implications for air quality.

2. Experimental Methodology

The measurement campaign consisted of measuring the local concentrations of VOCs emitted by the different materials composing the interior surfaces of the car cabin. Overall, five sets of measurements were performed. Three measurements allowed us to examine the influence of temperature on VOC emissions, and the two other measurements made it possible to assess the influence of ventilation modes on interior concentrations. The experimental setup and protocol are described as follows.

2.1. Preconditioning Protocol
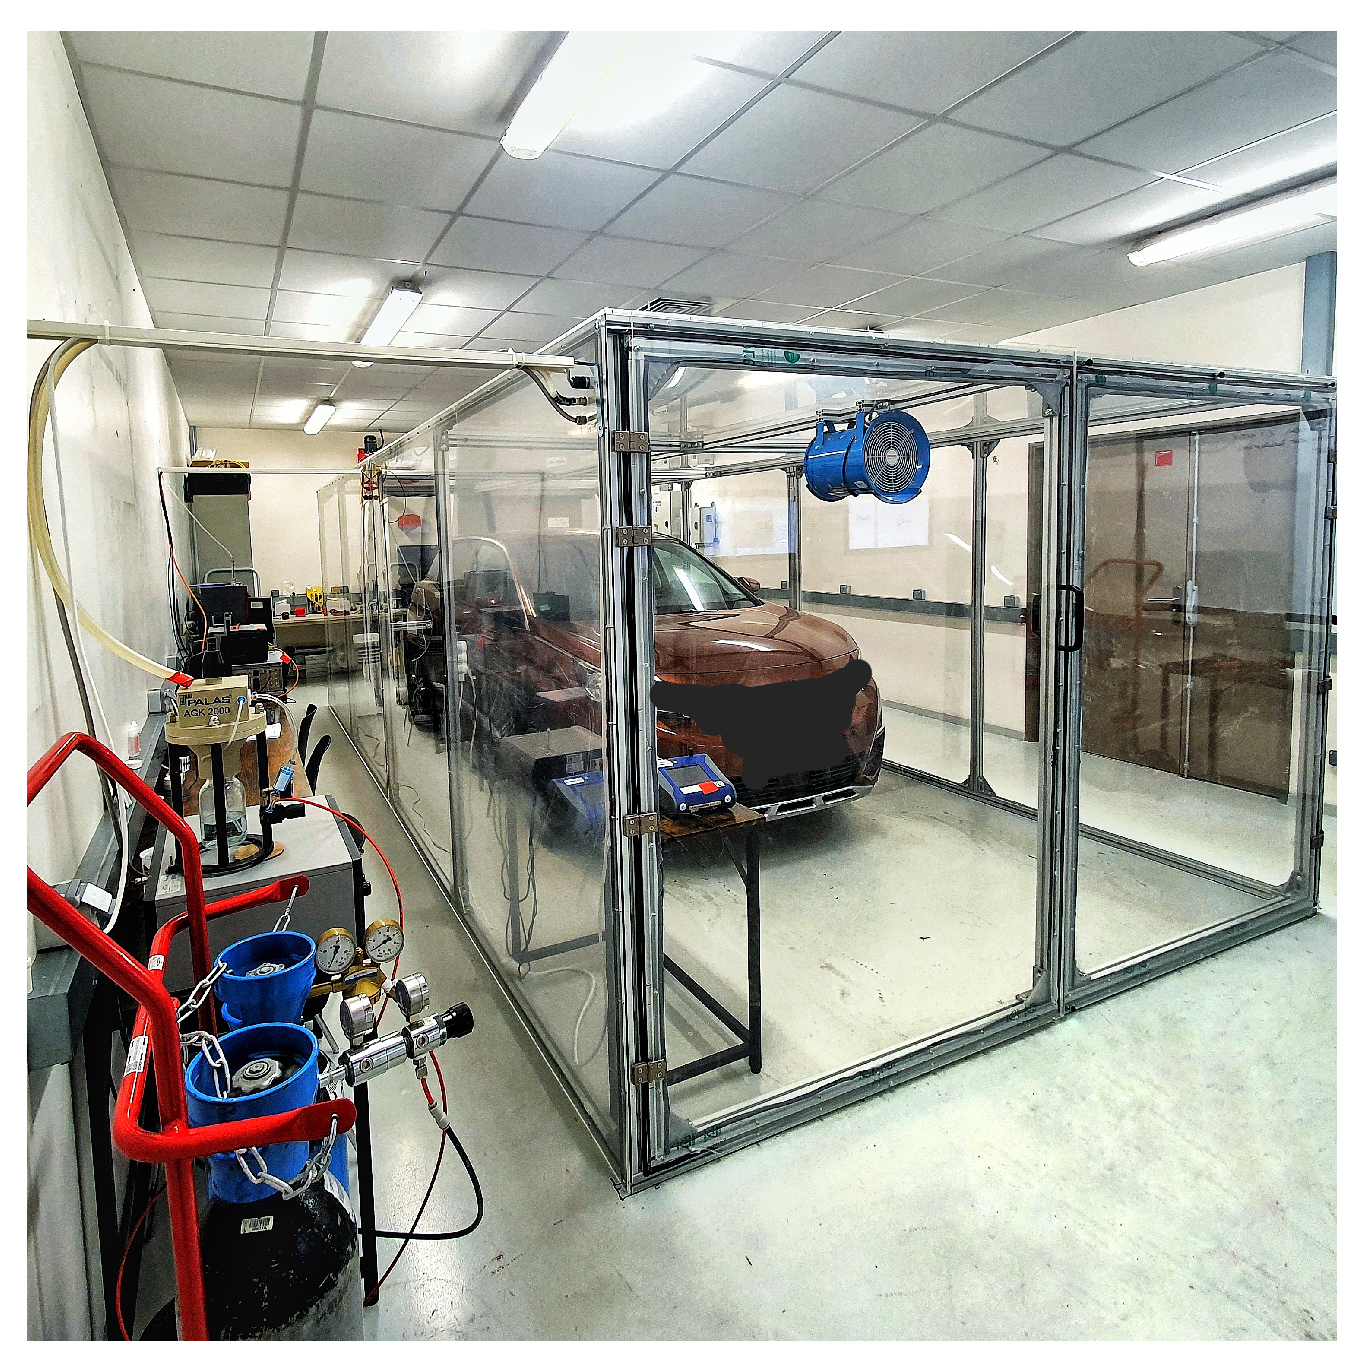
Prior to the measurement campaign, the vehicle was placed inside a 36 m3 closed chamber called `the bubble’ at Estaca. The chamber was equipped with a heating system, cooling system, and air homogenization fan, and was designed to eliminate any external influences (Figure 1). The measurements were carried out at different temperatures inside the car cabin (25, 28, and 32 °C). To determine the influence of in-cabin temperature on TVOC release rate, measurements were taken inside the car cabin with the ventilation system turned off and in recirculated mode. In addition, to examine the influence of the ventilation modes, and more precisely the air vents’ position on the TVOCs emissions, we measured the concentration of TVOCs released inside the car cabin for a temperature of 22 °C for two ventilation modes (air vents position) of the HVAC (Heating Ventilation and Air Conditioning), Closed HVAC (RC) and Opened HVAC (OA). During all the measurements the car cabin ventilation fan was completely turned off (fan speed 0/8). The vehicle used was parked inside the closed enclosure with the temperature set to the value studied and with a relative humidity level of 40 ± 10%. Regarding the materials of the interior, the steering wheel is made of leather, the dashboard is made of soft plastic, the center console is made of hard plastic, the front and rear seats are made of leather and fabric, and the floor mats are made of fabric.

2.2. The Vehicle

A mass-produced car, nearly 5 months old and with less than 100 km, was used for the study. The vehicle was manufactured according to standard production processes and transported with closed windows and air conditioning outlets to prevent contamination. Precautions were taken to ensure that no external off-gassing materials were transported with the vehicle and that the loading truck had a closed container to prevent solar loading during transportation. No cleaning procedures were used to remove the residue. The protective covers and plastic stickers (used to protect the dashboard) were removed when the vehicle arrived. In addition to that, no additional refueling was carried out, only that of the production line. Regarding the materials of the interior, the steering wheel is made of leather, the dashboard is made of soft plastic, the center console is made of hard plastic, the front, and rear seats are made of leather and fabric, and the floor mats are made of fabric.

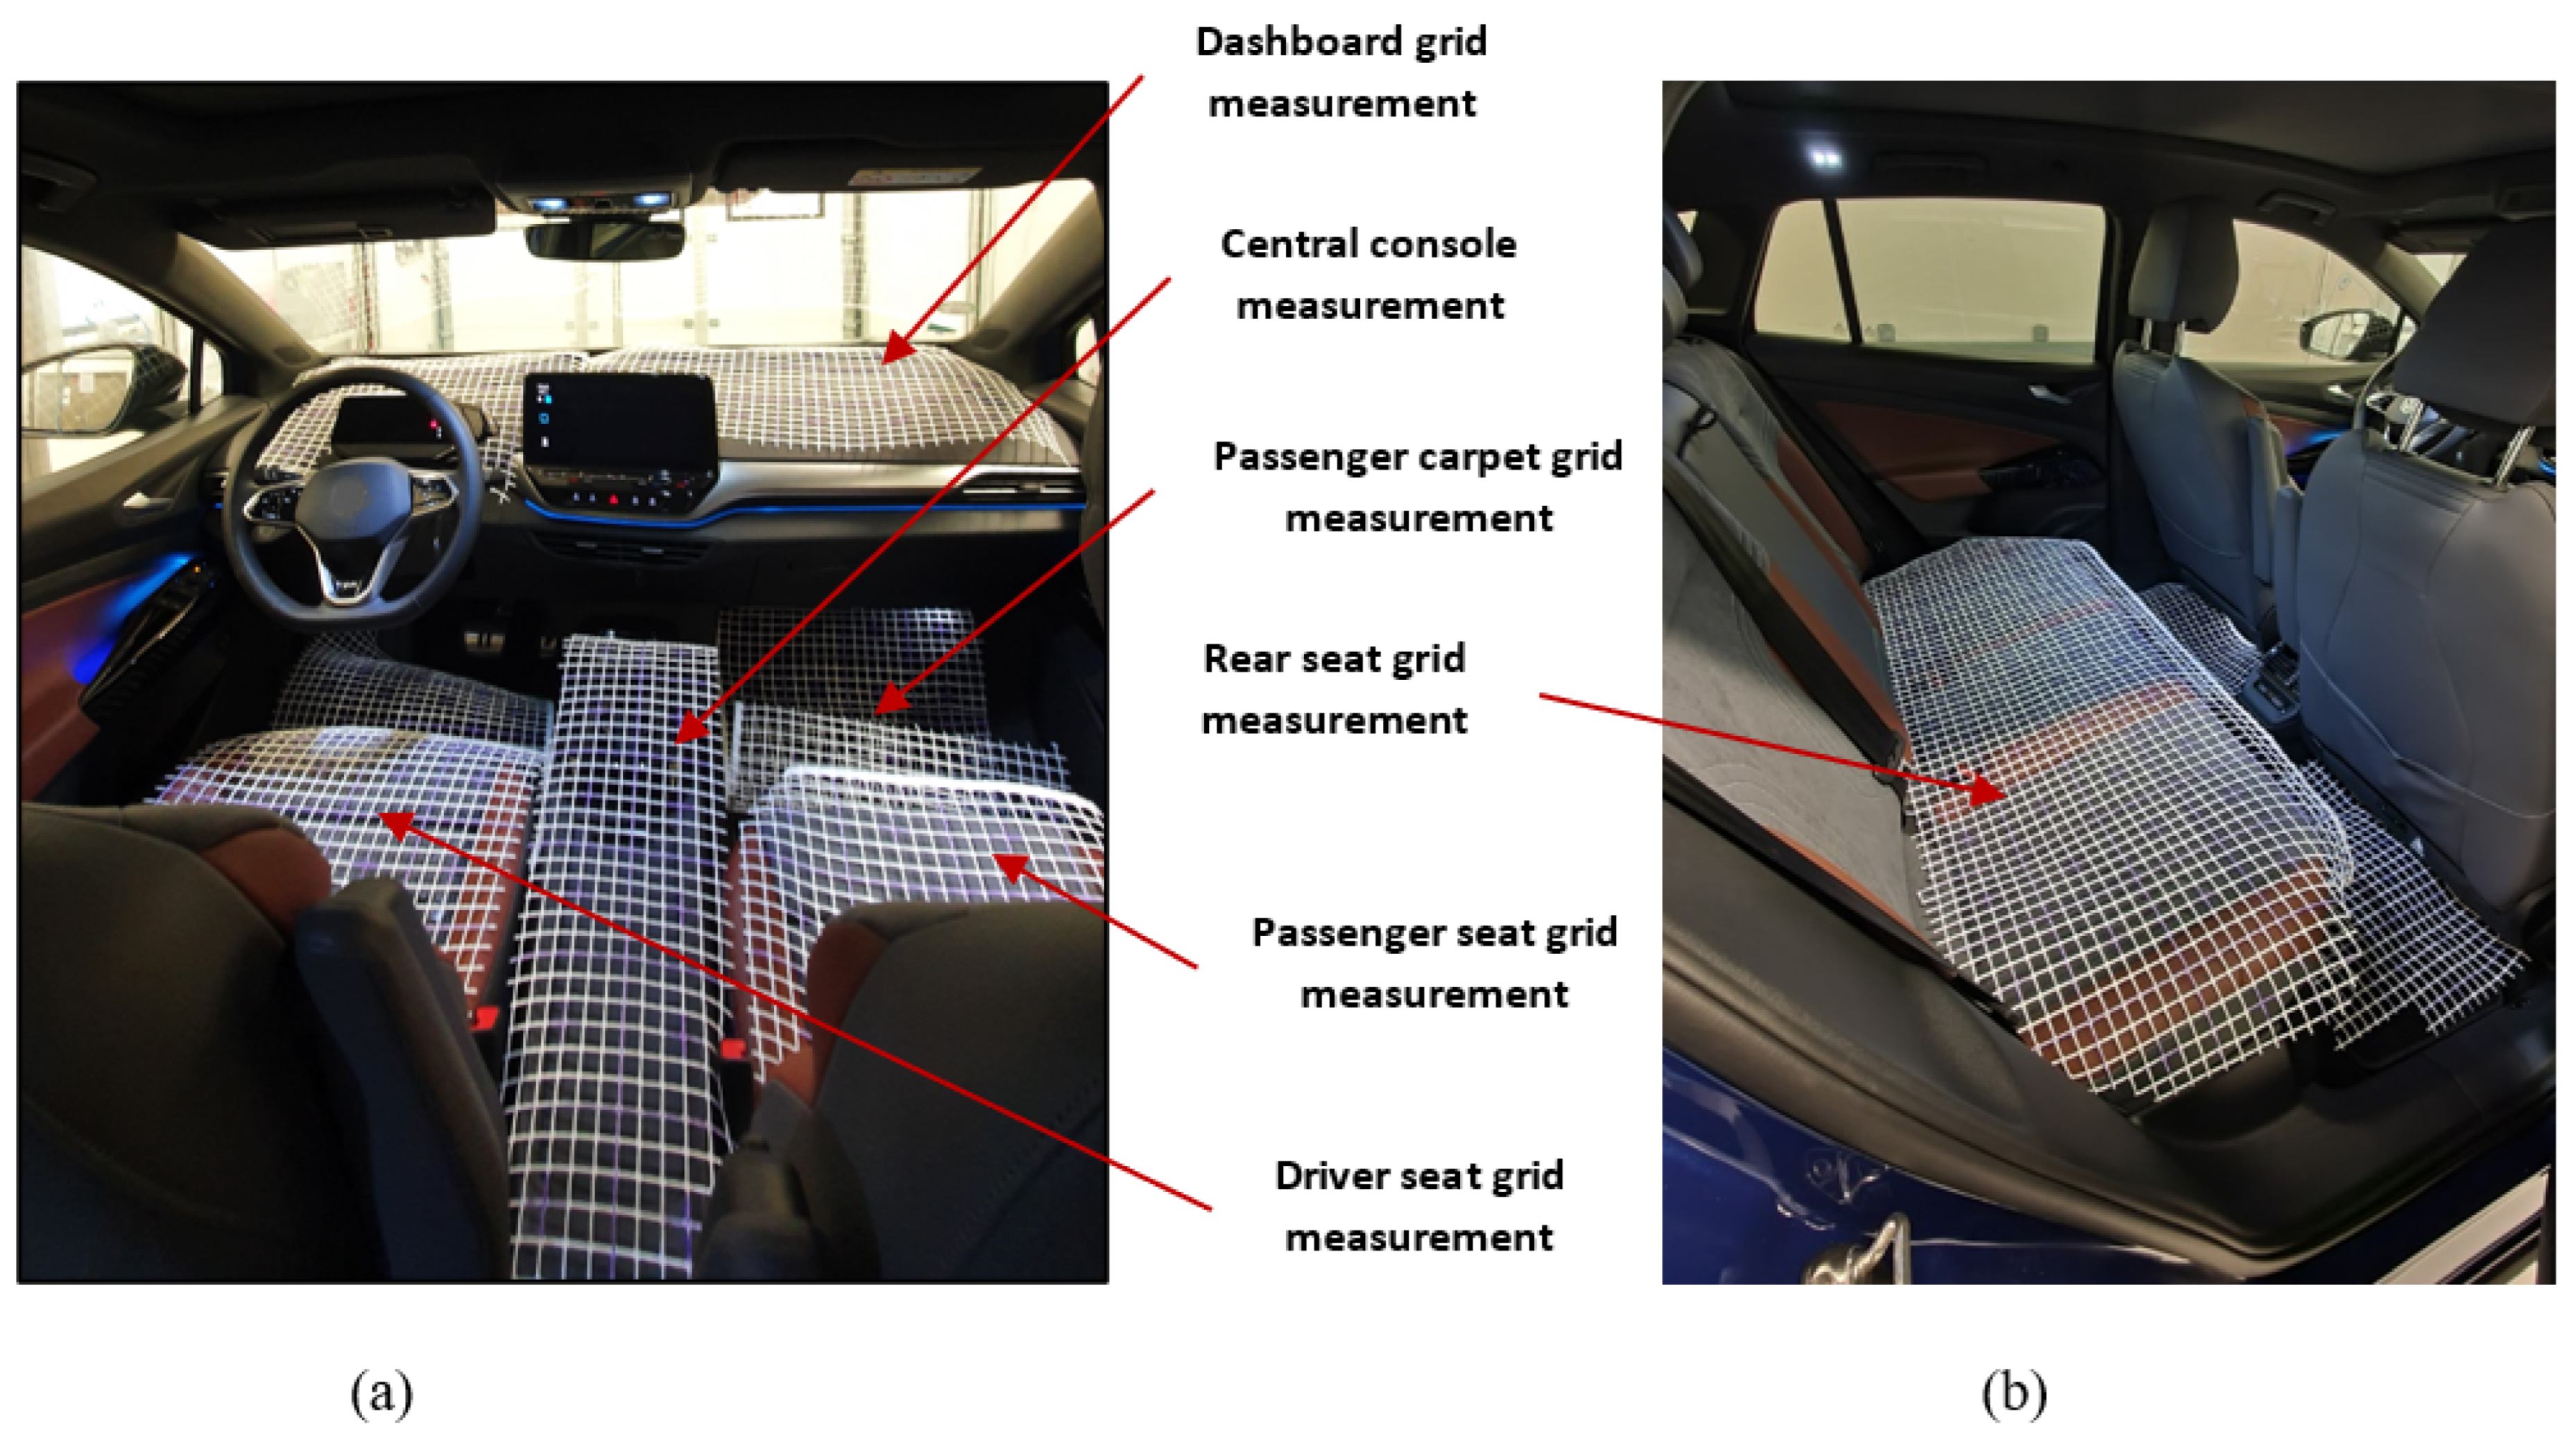
2.3. Instrumentation and Measurements Protocol

Measurements of TVOC concentration were performed using the IonScienceTiger instrument. It is based on the Photon-Ionization-Detection (PID) principle technique that measures volatile organic compound (VOC) in the concentration range of 0 to 20,000 parts per million (ppm) or 20 × 106 (µg/m3), with a minimum sensitivity (resolution) of 0.001 ppm (1 ppb) and 1 µg/m3. The instrument allows sampling at a frequency of 1 Hz and can detect 480 types of VOCs. The Tiger has a 24-h battery life for continuous use. The temperature and the relative humidity (RH) inside the car cabin were measured using a TSI 7525 with a resolution of 0.1 °C and 3%, respectively, for the temperature and the RH. Before each measurement campaign, the vehicle was parked during 24 h in the bubble chamber where the temperature was maintained at a value between 20 °C and 32 °C and relative humidity of 40 ± 10%. The influence of the operators was as weak as possible (non-smoking and non-scented). In addition, no food products or external objects were introduced inside apart from the instrumentation. For the measurements of the concentrations of TVOC emitted by the various components, a grid system was installed on the various measured surfaces of the vehicle interior. These grids cover all the surfaces of the vehicle’s passenger compartment and make it possible to locate sampling areas. The grids are made of plastic that has been tested for TVOC emissions. The TVOC emissions from the plastic grids were assessed in the measurement bubble that was isolated from the external environment. The emission levels were measured using the Ion Science Tiger instrument, which was positioned at different points on the measurement grid. Each sampling point was tested for a duration of 10 s, and the process was repeated three times. The same procedure was followed to measure the TVOC concentration released from different surfaces within the vehicle cabin. The emitted TVOC concentration from the grids was found to be between 20 and 50 µg/m3, which was consistent with the background level of the chamber at a temperature of 32 °C. The total number of measurements was 276 points. The operator made an acquisition of 10 s (at 1 Hz acquisition rate) for each point of the grid at 1 cm high from the surface. The temporal average value obtained was then attributed to that point of the grid. This measurement protocol is valid for all the points located on the grids (276 points) and was repeated three times for each point. The interior surfaces considered in this measurement campaign are the dashboard, driver, and passenger seats, driver and passenger carpets, central console, rear seats, rear carpets, and rear shelf (Figure 2). We conducted volumetric measurements alongside surface emissions concentration measurements to evaluate the TVOC concentration levels at various points within the car cabin. Specifically, we measured the levels at the driver and passenger seat headrests, armrests, and rear seat headrests, which are all located in the breathing region of the car cabin. It is worth noting that these measurements were taken away from the surfaces. The surface materials of the various interior equipment used in this study are of different types: hard plastic on the top of the dashboard, soft plastic and leather for the seats, and center console, and tissue on all carpets and the rear seat.

3. Results and Discussion

In this section, the concentrations of TVOCs released from various surfaces, as well as the volumetric measurements performed are presented. The influence of temperature and ventilation mode (RC and OA) on TVOC concentrations are discussed.

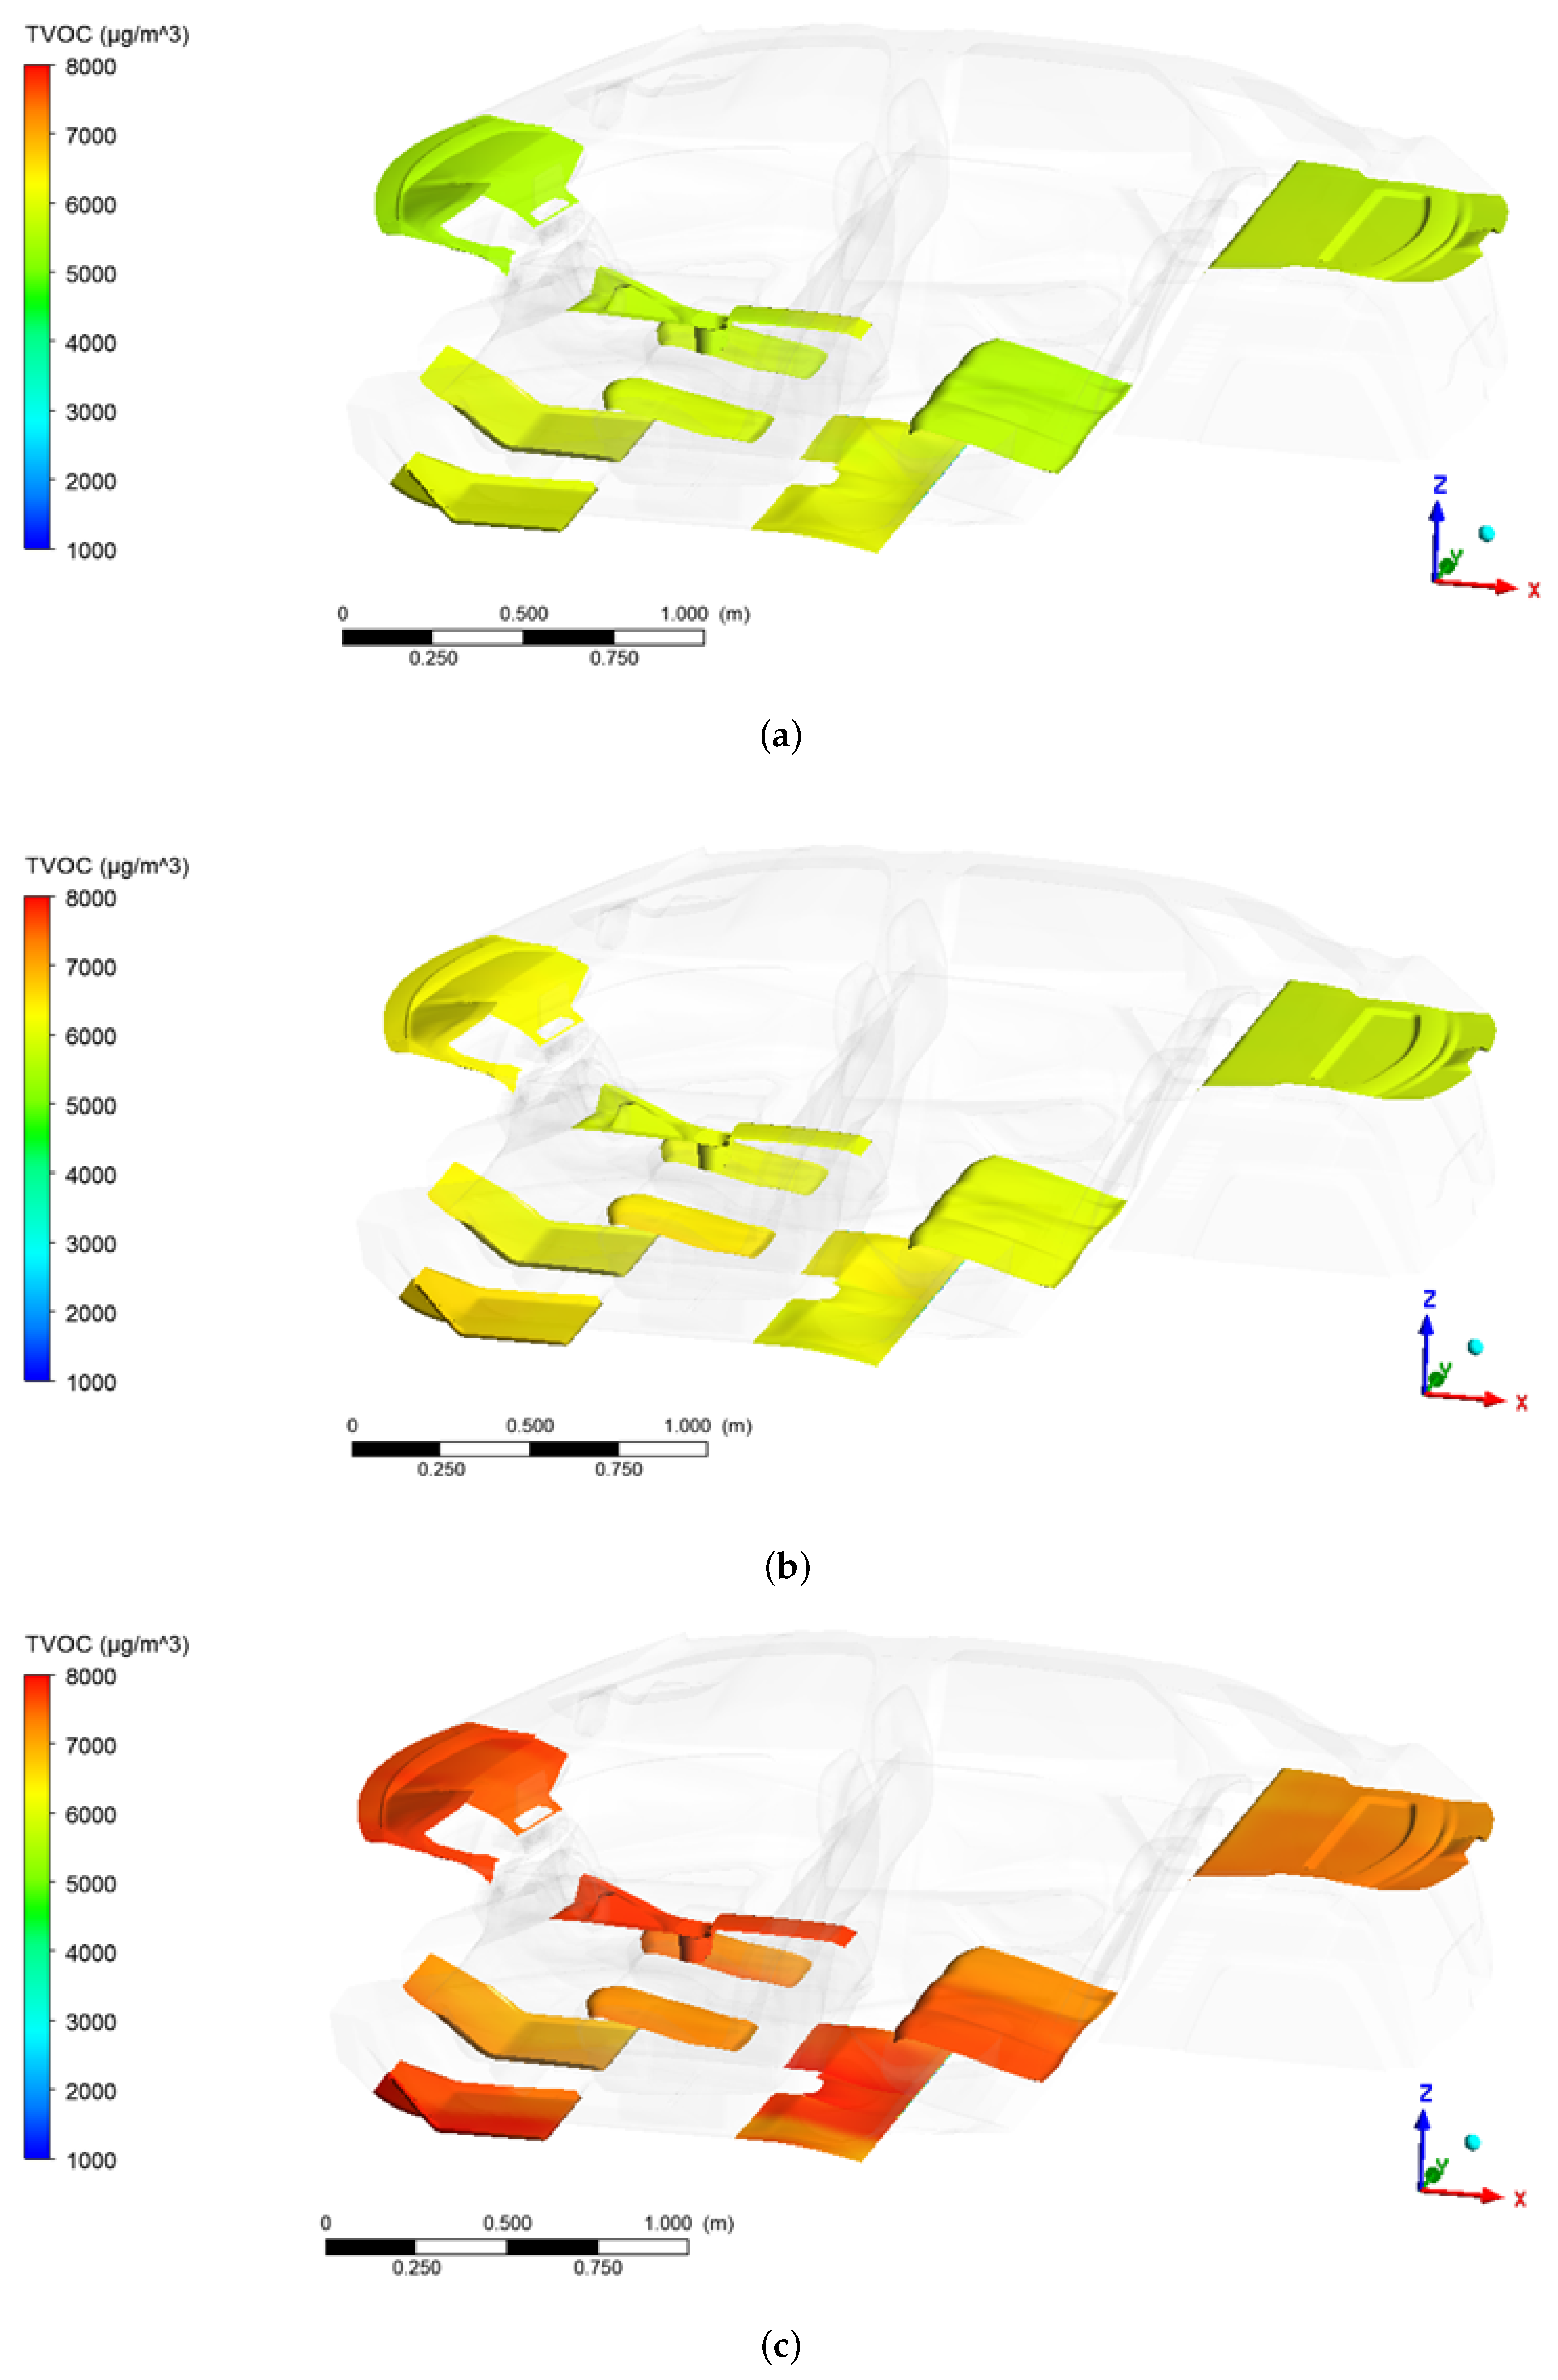
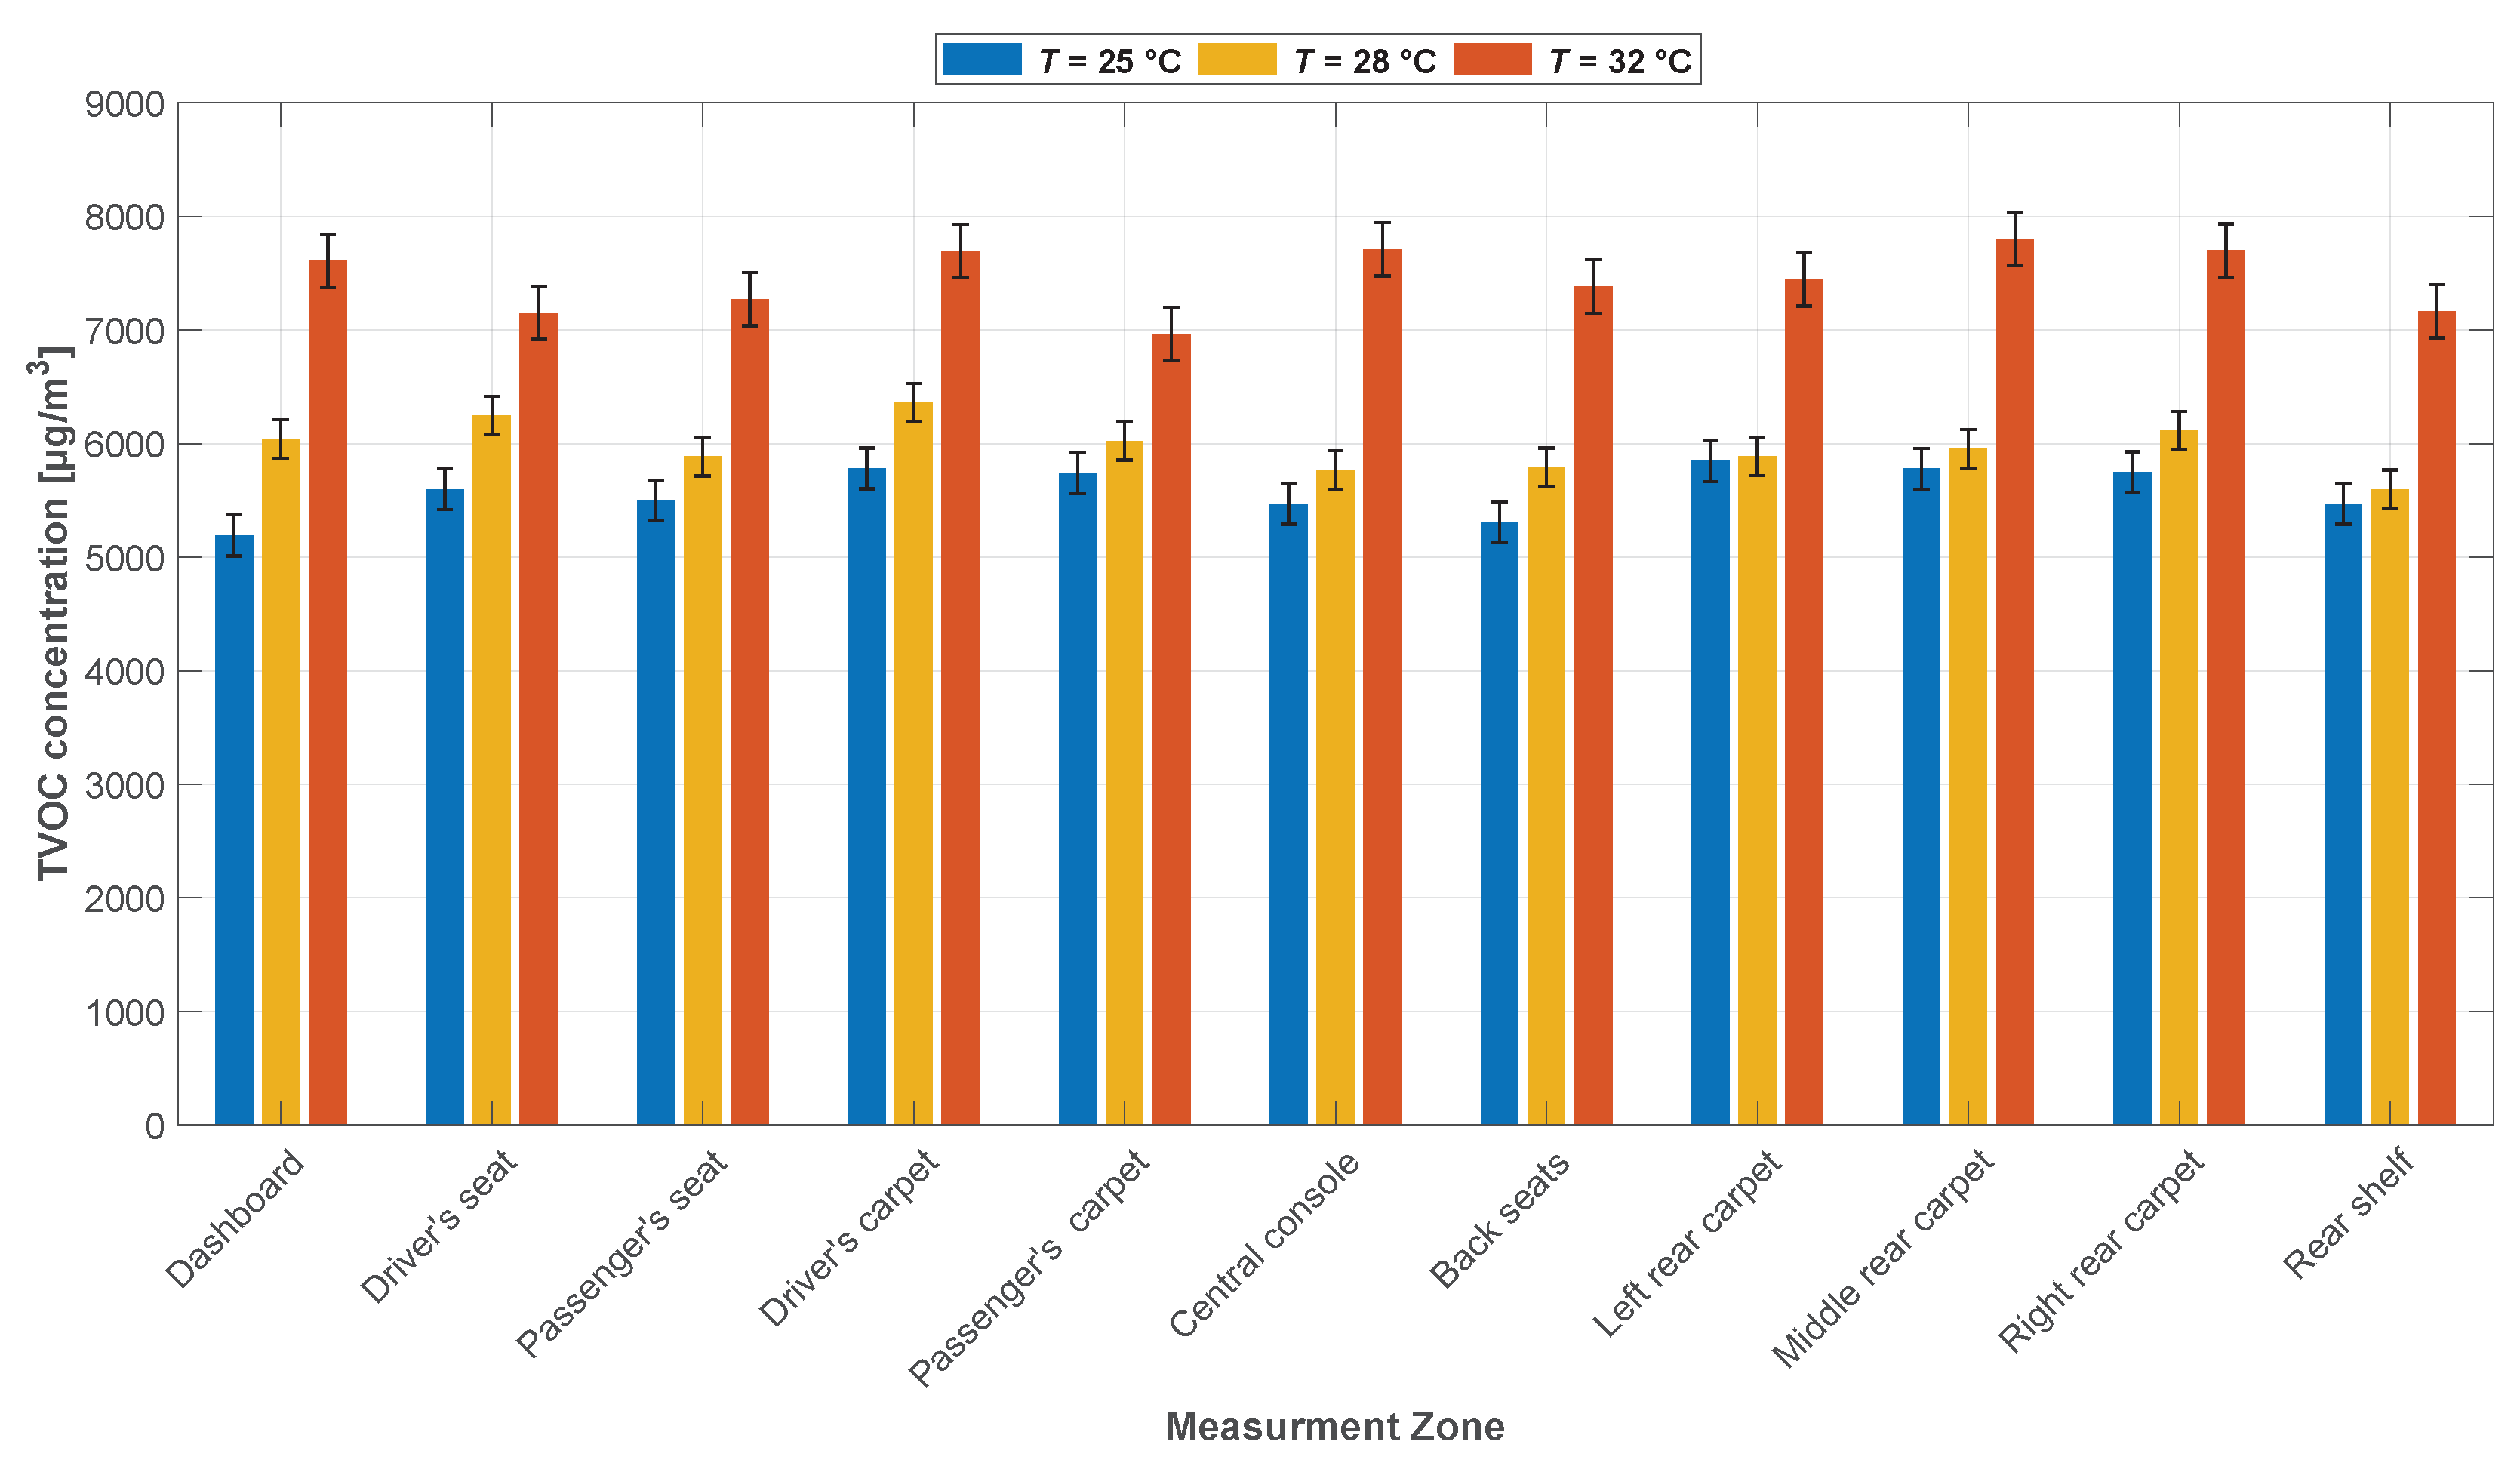
3.1. Influence of Temperature on TVOC Emissions

Figure 3 presents the iso-contours of TVOC emissions from various surfaces at temperatures of 25 °C, 28 °C, and 32 °C, respectively. The results could seem to indicate that TVOC concentrations are relatively homogeneous on all surfaces at each temperature. However, it is noteworthy that the TVOC values appear to be significantly higher on carpet surfaces compared to other surfaces. The difference in TVOC concentrations at surfaces ranged between a minimum value that corresponded generally to the seats or dashboard, and a maximum value found in carpets. The minimum and maximum values of the relative difference between different surface emissions are found to be between 10% at T = 32 °C and 13% at T = 28 °C.
For more details on the contribution and temperature effect on each piece of equipment, Figure 4 shows the averaged TVOC concentration emitted from different surfaces at 25 °C, 28 °C, and 32 °C. At 25 °C, the average TVOC concentration in the car cabin ranges from 5200 µg/m3 to 5800 µg/m3. The highest concentration values were measured on the left rear and the driver carpets, while the lowest was in the dashboard. At T = 28 °C, the TVOC concentration emitted from the various components of the car cabin increased compared to the previous case and ranged from 5800 µg/m3 to 6400 µg/m3. This increase suggests that temperature plays a significant role in the release of TVOC from the car cabin equipment. It was found that the driver’s carpet releases the highest concentration of TVOC with an average of 6400 µg/m3, while the lowest concentration (5800 µg/m3) was released by the back seat. At T = 32 °C, the TVOC concentration emitted by the different components of the car cabin has increased compared to those at 28 °C. The maximum concentration measured was 7800 µg/m3 on the middle rear carpet, while the minimum concentration was 7000 µg/m3 on the passenger carpet.
The highest values of TVOC concentrations measured in the vicinity of the carpet surfaces can be explained by the material composition of the latter. Indeed, carpets used in this car are made of nylon which is a synthetic material that is known to be a significant source of some VOCs such as formaldehyde, benzene, and toluene [25,26]. This can lead to poor indoor air quality and potential health risks for people who are exposed to high concentrations of these VOCs over a long period of time.
In order to provide a global view of TVOC concentration released by all surfaces, we estimated the mean concentration value of TVOC corresponding to all surfaces for the three different temperatures (Table 1). It shows a net increase in the mean TVOC concentrations as a function of temperature. Indeed, the overall concentration of TVOCs released by surfaces inside the vehicle cabin increases slightly between 25 °C and 28 °C with a ratio of 1.07, while it increases more significantly with a ratio of 1.25 between 28 °C and 32 °C. This increase related to the temperature could be attributed to four mechanisms: First, as the temperature rises, the rate of VOC emission from materials increases due to increased volatility [27]. Second, higher temperatures can also increase the diffusion rate of VOCs from materials to the air [12]. Third, the thermal decomposition of materials can occur at higher temperatures, leading to the release of additional VOCs [28]. Finally, higher temperatures can lead to increased humidity levels, which can enhance the release of VOCs from some materials [29].
Concerning the volumetric measurement of TVOC concentration at different locations inside the car cabin, the driver and the passenger’s exposition was assessed, and the results are given in Table 1. Accordingly, the concentration values at the different locations are not notably different with a maximum relative difference that varied between 2% at 28 °C, 4% at 25 °C, and 5% at 32 °C. This indicates homogeneity of the concentrations in the breathing area of the cabin after it has been emitted and diffused from different surfaces. In addition, it can be noticed that the volume concentrations of the three temperatures (25 °C, 28 °C, and 32 °C) are lower than the surface mean values. The ratio of average surface concentrations to the average volumetric concentrations is almost constant around the value 1.11–1.14 (Table 1). This difference can be related to the dilution of the released TCOV in the air volume of the cabin during the diffusion process from emitting surfaces to the volumetric measurements’ points. Based on these results, and on the results concerning the relative differences between volumetric measurements obtained at different points that are weak, we could draw some conclusions: First, concerning the probe positioning for TVOC concentration measurements in the vehicles in-cabins, whatever its position far from surfaces (at least 30 cm), the measured concentration could be admitted that is representative of the global TVOC concentration of the car cabin with a maximum relative imprecision of 5% for temperature lower than 32 °C. Secondly, the global volumetric TVOC concentration could be related to the average concentrations at surfaces since the ratio of the average surface concentration to the average volumetric concentration of TVOc is almost constant around 1.12.

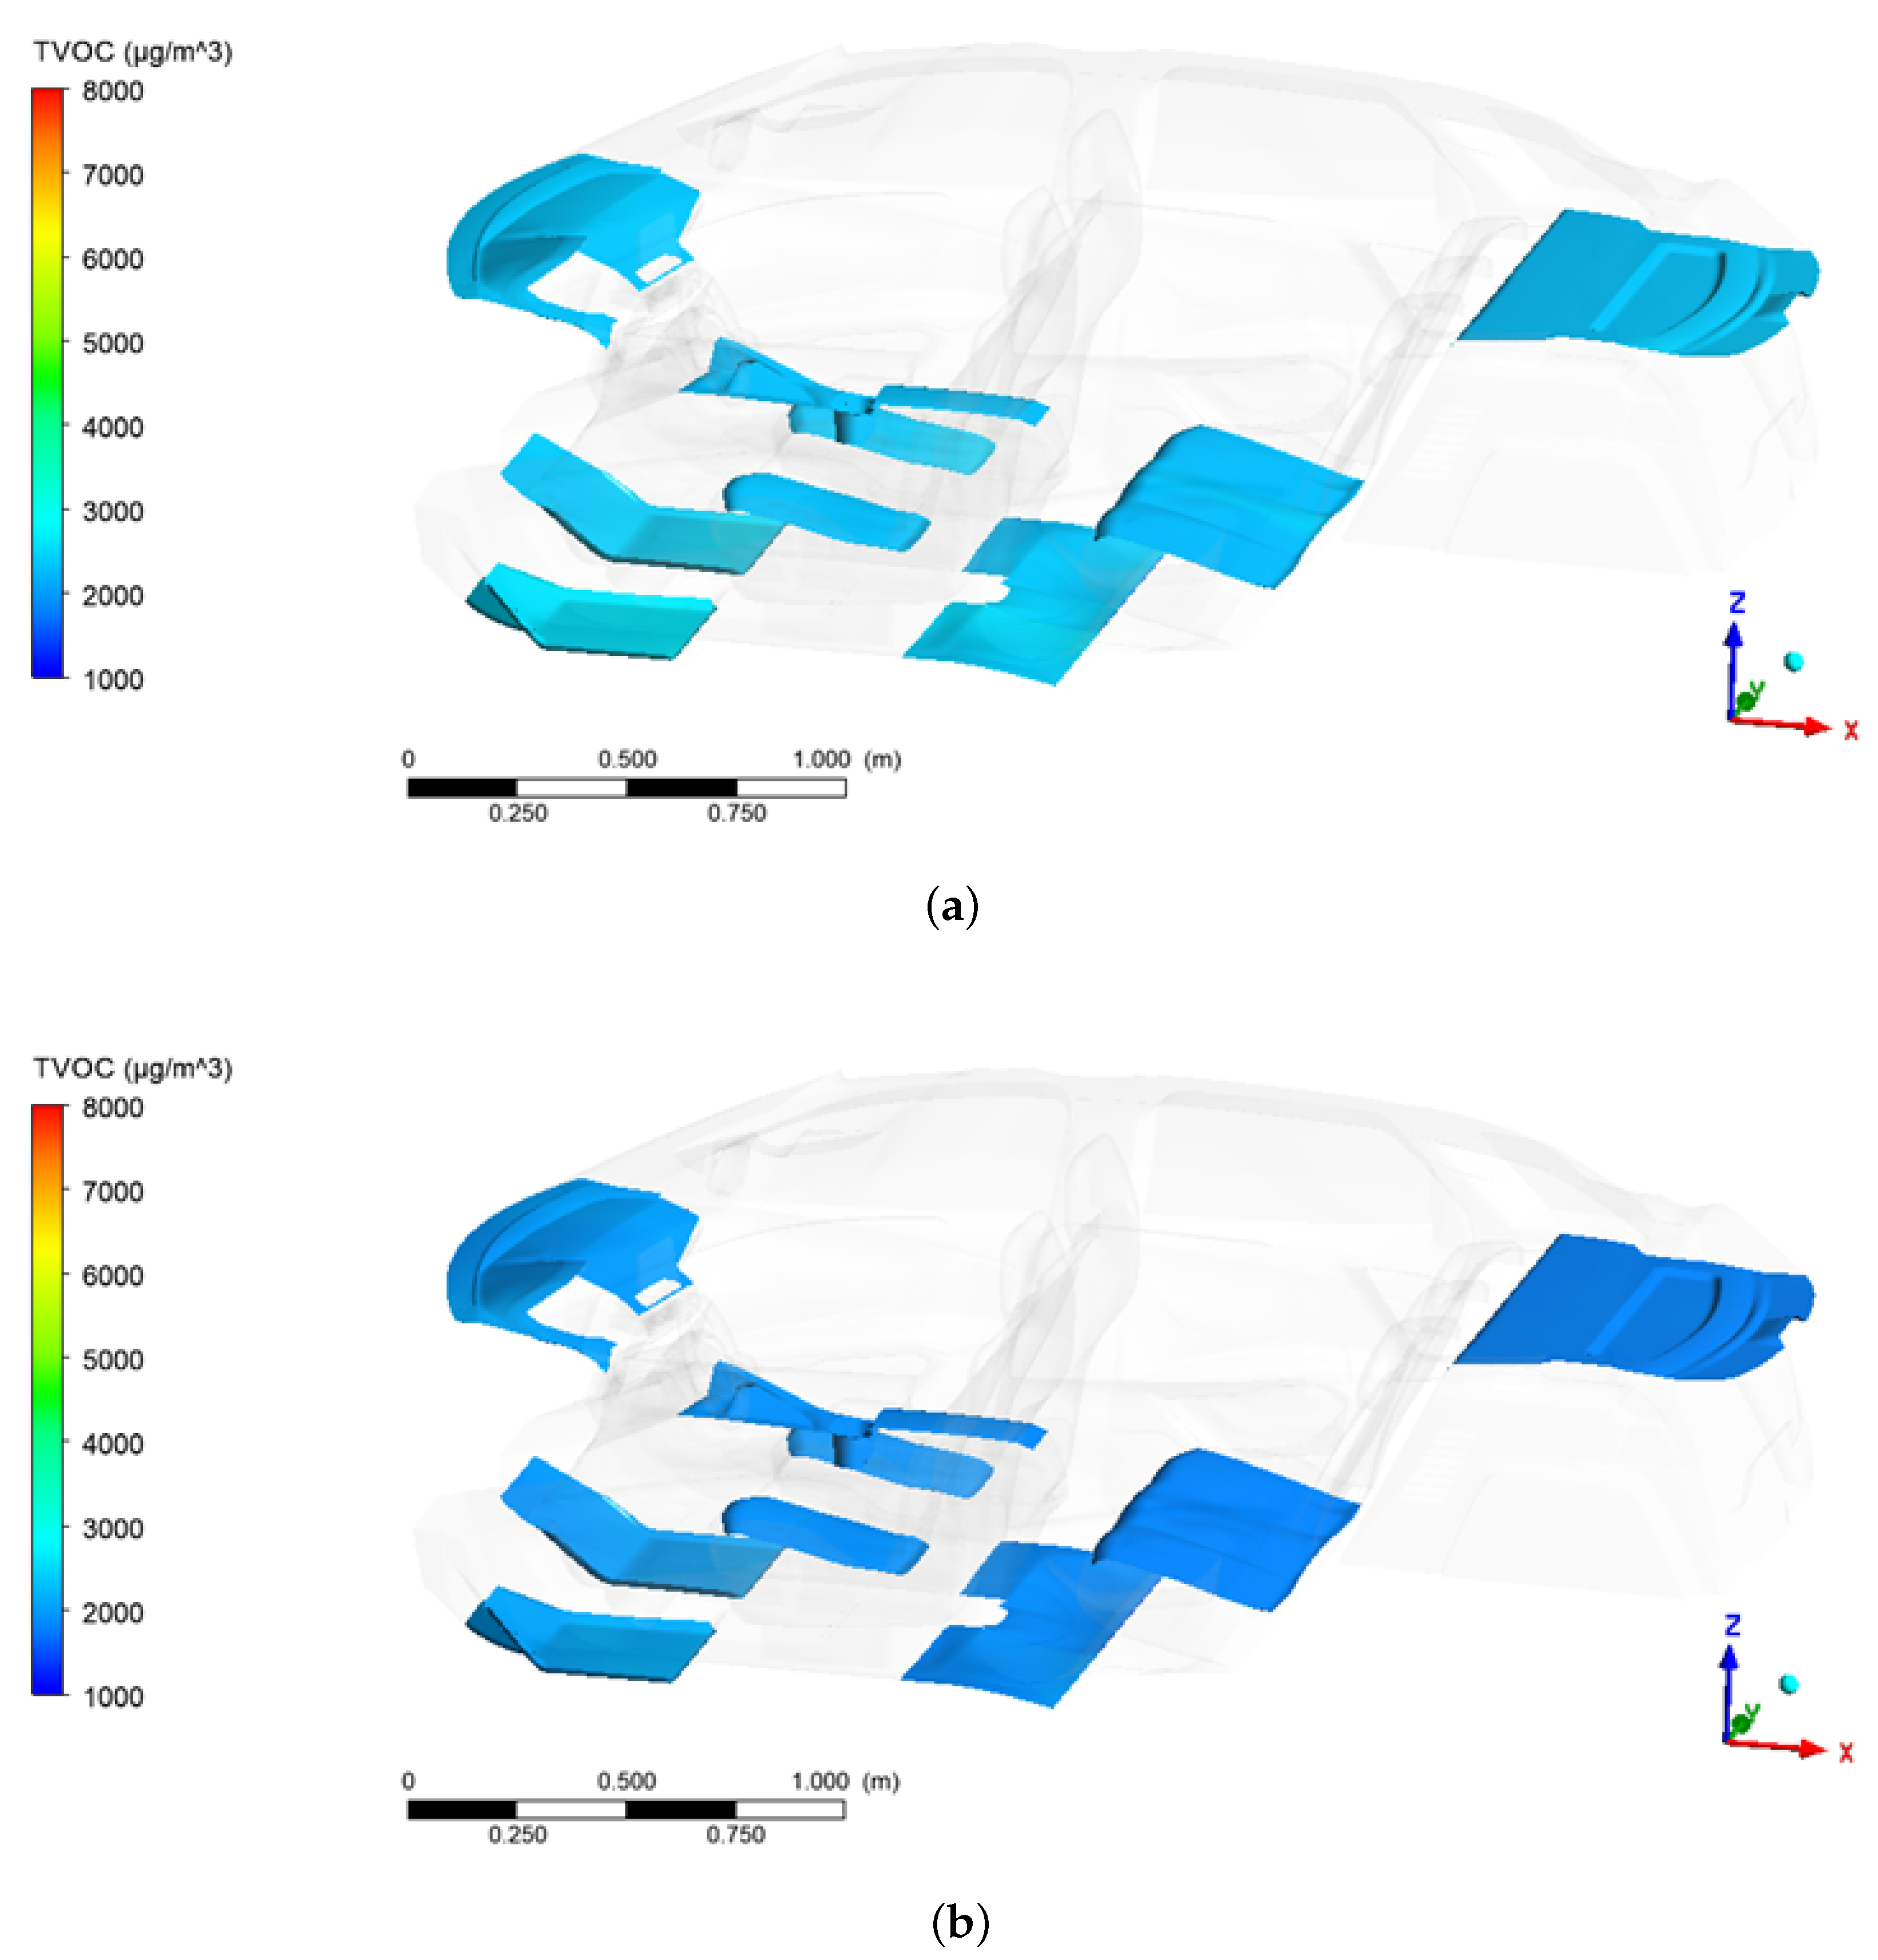
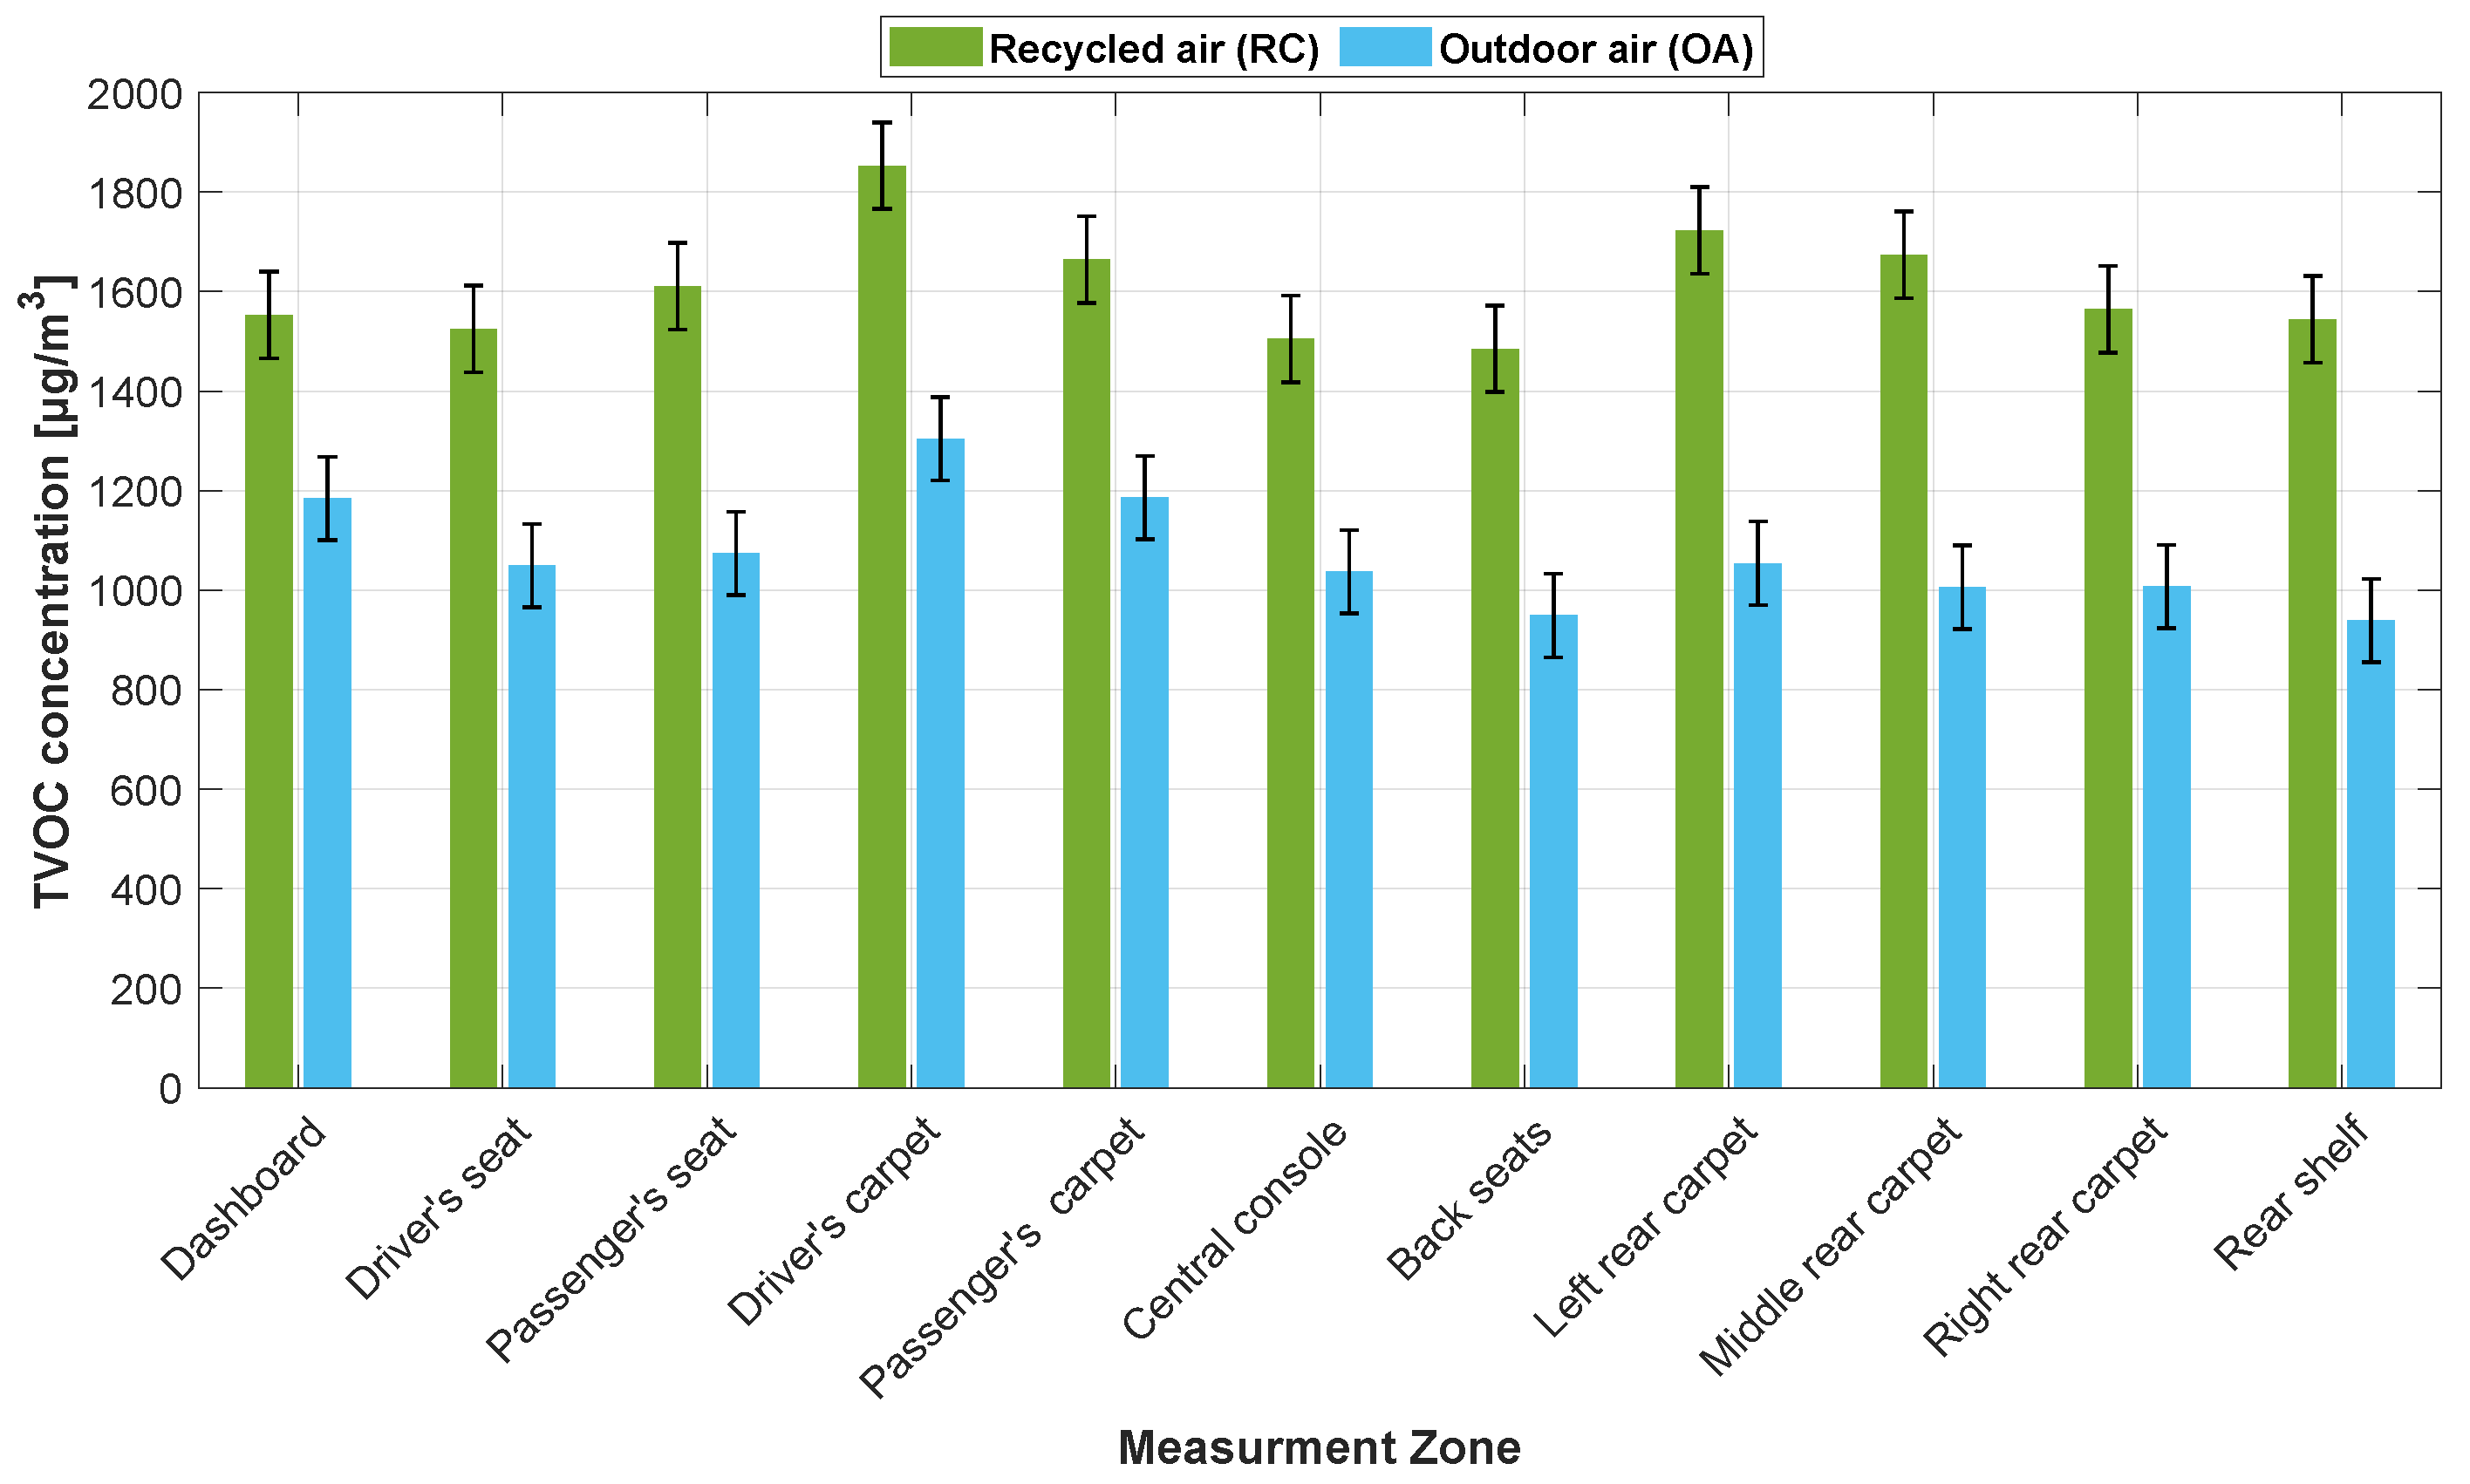
3.2. Influence of Ventilation Setting on TVOC Concentrations

In this section, we present the results concerning the influence of the ventilation system settings and precisely the air vent position, on the TVOC concentration inside the car cabin. Two experiments were performed consisting of measuring the concentration of TVOC emitted by the different cabin interior surfaces for two ventilation modes, the recirculated air mode (RC) for which the air vents are positioned for internal recirculation, and the outside air mode (OA) where the air vents are positioned to promote the outdoor air admission. The temperature inside the car cabin was set to 22 °C during the measurements. The measurement conditions and protocol used in the previous measurements were followed for this study as well.
Figure 5 shows the TVOC concentrations on the car interior surfaces. The spatial inhomogeneity of the distribution of surface emissions of TVOC is clearly noticeable for both ventilation modes. As noted above, carpets are somewhat higher emitters of VOCs than other surfaces. The RC or OA ventilation modes did not influence this spatial inhomogeneity since the fan was set to off and thus there is no mixing that could be promoted by the airflow coming from fan movement. However, the average TVOC concentration is lower in OA mode in comparison to the RC mode due to natural air flow promoting dilution.
In Figure 6, the concentration distributions of TVOC for different surfaces and for each ventilation mode (Recirculated (RC) and outdoor air (OA)) at 22 °C without a ventilation flow rate are presented. First, the influence of temperature on TVOC concentrations is clearly visible when comparing this result with that at 25 °C, 28 °C, or 32 °C. In the recirculated ventilation mode, the measured TVOC concentration values vary between 1485 µg/m3 and 1853 µg/m3 with an average value of 1615 µg/m3. While, in the outdoor ventilation mode, the concentration varies between 938 µg/m3 and 1304 µg/m3 with a mean value of 1085 µg/m3. The difference in TVOC concentration is about one-third between the recirculated and outdoor air modes. Whereas the non-recirculated mode pulls in fresh air from outside which is free from TVOC, this leads to better air quality due to the dilution of gaseous pollutants and extractions. To conclude this section, we can say that the ventilation mode can have a significant impact on the concentration of TVOC in the car cabin. The fresh air intake in the non-recirculated mode can help reduce the concentration of TVOC in the region of low outdoor TVOC concentrations (far from traffic), while the recirculated mode may increase it.

4. Conclusions

Experimental campaigns to characterize the TVOC emissions of the interior equipment surfaces of a new car were conducted. The objective of the study was to examine the TVOC concentrations at the surface level and to correlate them to the volumetric concentration by considering two factors, the influence of temperature increase (25, 28, and 32 °C) and the setting of ventilation modes (recirculated and non-recirculated modes). The methodology consisted of storing the vehicle in a closed volume for 24 h to control outdoor conditions and then measuring the TVOC concentrations, in 267 measurement points, using a grid system covering all surfaces of the main of the car cabin’s equipment. The TSI Tiger instrument was used to measure TVOC concentrations at each point, and the results were displayed in a cabin CAD. The TVOCs concentrations inside the car cabin were found to increase with temperature. It varied on average between 5595, 6006, and 7472 µg/m3 at 25, 28, and 32 °C, respectively. The TVOC concentration distributions show relative differences between equipment that were evaluated to 10–13% and 2–5%, respectively, for surface and volumetric measurements. This implies no preferential positioning of the in-cabin probe for TVOC volumetric concentration measurements. On the other hand, the ratio between the average concentrations at the surface level to the average volumetric concentration is almost constant around 1.12. In addition, it was also found that the ventilation mode has a significant influence on the TVOC concentrations. More precisely, when the ventilation mode was set to recirculation mode, the TVOC concentration was significantly higher than when the ventilation mode was set to the outdoor fresh air intake. These results have important implications for the design and operation of car cabin’s TVOC measurements, on ventilation systems, as well as for public health and safety, given the potential health risks associated with exposure to high levels of VOCs. Analyzing the distribution of TVOC inside car cabins has implications for environmental science, occupational health and safety, automotive engineering, indoor air quality assessment, allergy and asthma research, chemical and material science, and forensic investigations. The insights gained from such analysis can inform various fields, contributing to policymaking, engineering improvements, and strategies for reducing exposure to harmful substances in vehicles. It is important to note that currently, there are no standard guidelines regarding the limitation of TVOC (Total Volatile Organic Compounds) concentration inside the car cabin recommended by an international organization. TVOC concentration levels below 0.3 mg/m3 are categorized as low levels, concentrations from 0.3 mg/m3 to 0.5 mg/m3 are generally acceptable, while concentrations exceeding 1 mg/m3 are considered high levels, and based on the proposed TVOC target and guideline values for industrial workplaces [30]. The absence of such guidelines makes it challenging to establish specific thresholds or limits for TVOC levels in vehicle interiors. Additional research is needed to explore the specific mechanisms underlying these effects, as well as to identify effective strategies for mitigating the risks associated with high levels of VOCs in car cabins.

Author Contributions

N.H.: writing—original draft; methodology; validation, M.D.: writing—original draft; methodology; software, A.B.: software; supervision; validation; writing—review and editing, G.F.: project administration; validation; supervision; writing—review and editing, A.M.: project administration; validation; supervision; writing—review and editing. All authors have read and agreed to the published version of the manuscript.

Funding

Nadir Hafs reports financial support was provided by French Environment and Energy Management Agency.

Institutional Review Board Statement

Not applicable.

Informed Consent Statement

Not applicable.

Data Availability Statement

Data is unavailable due to privacy.

Acknowledgments

The authors would like to express their gratitude to ESTACA’LAB and ADEME for the funding of this project. The authors also gratefully acknowledge Rahman Sadikur and Remy-Onesime Henitsoafidy for their significant help to the experimental campaigns.

Conflicts of Interest

The authors declare no conflict of interest.

References

  1. Hort, C.; Platel, V.; Ondarts, M.; Sochard, S.; Reguer, A.; Moynault, L. Quality and indoor air treatment/Qualite et traitement de l’air interieur. ESSACHESS—J. Commun. Stud. 2008, 1, 79–97. [Google Scholar]
  2. Müller, D.; Klingelhöfer, D.; Uibel, S.; Groneberg, D.A. Car indoor air pollution-analysis of potential sources. J. Occup. Med. Toxicol. 2011, 6, 33. [Google Scholar] [CrossRef] [PubMed] [Green Version]
  3. Kelly, F.J.; Fussell, J.C. Improving indoor air quality, health and performance within environments where people live, travel, learn and work. Atmos. Environ. 2019, 200, 90–109. [Google Scholar] [CrossRef] [Green Version]
  4. McGwin, G., Jr.; Lienert, J.; Kennedy, J.I., Jr. Formaldehyde exposure and asthma in children: A systematic review. Environ. Health Perspect. 2010, 118, 313–317. [Google Scholar] [CrossRef] [PubMed] [Green Version]
  5. Yu, L.; Wang, B.; Cheng, M.; Yang, M.; Gan, S.; Fan, L.; Wang, D.; Chen, W. Association between indoor formaldehyde exposure and asthma: A systematic review and meta-analysis of observational studies. Indoor Air 2020, 30, 682–690. [Google Scholar] [CrossRef]
  6. World Health Organization. WHO Guidelines for Indoor Air Quality: Selected Pollutants; World Health Organization, Regional Office for Europe: Geneva, Switzerland, 2010. [Google Scholar]
  7. Leung, P.L.; Harrison, R.M. Roadside and in-vehicle concentrations of monoaromatic hydrocarbons. Atmos. Environ. 1999, 33, 191–204. [Google Scholar] [CrossRef]
  8. International WELL Building Institute PBC; Delos Living LLC. The WELL Building Standard with Q3 2017 Addenda; Delos Living LLC: New York, NY, USA, 2017. [Google Scholar]
  9. Yoshida, T.; Matsunaga, I.; Tomioka, K.; Kumagai, S. Interior air pollution in automotive cabins by volatile organic compounds diffusing from interior materials: I. Survey of 101 types of Japanese domestically produced cars for private use. Indoor Built Environ. 2006, 15, 425–444. [Google Scholar] [CrossRef]
  10. Faber, J.; Brodzik, K.; Gołda-Kopek, A.; Łomankiewicz, D. Benzene, toluene and xylenes levels in new and used vehicles of the same model. J. Environ. Sci. 2013, 25, 2324–2330. [Google Scholar] [CrossRef]
  11. Barnes, N.M.; Ng, T.W.; Ma, K.K.; Lai, K.M. In-cabin air quality during driving and engine idling in air-conditioned private vehicles in Hong Kong. Int. J. Environ. Res. Public Health 2018, 15, 611. [Google Scholar] [CrossRef] [Green Version]
  12. Yang, T.; Zhang, P.; Xiong, J. Association between the emissions of volatile organic compounds from vehicular cabin materials and temperature: Correlation and exposure analysis. Indoor Built Environ. 2019, 28, 362–371. [Google Scholar]
  13. Kim, K.H.; Szulejko, J.E.; Jo, H.J.; Lee, M.H.; Kim, Y.H.; Kwon, E.; Ma, C.J.; Kumar, P. Measurements of major VOCs released into the closed cabin environment of different automobiles under various engine and ventilation scenarios. Environ. Pollut. 2016, 215, 340–346. [Google Scholar] [CrossRef]
  14. Geiss, O.; Tirendi, S.; Barrero-Moreno, J.; Kotzias, D. Investigation of volatile organic compounds and phthalates present in the cabin air of used private cars. Environ. Int. 2009, 35, 1188–1195. [Google Scholar] [CrossRef]
  15. Zhang, G.S.; Li, T.T.; Luo, M.; Liu, J.F.; Liu, Z.R.; Bai, Y.H. Air pollution in the microenvironment of parked new cars. Build. Environ. 2008, 43, 315–319. [Google Scholar] [CrossRef]
  16. You, K.W.; Ge, Y.S.; Bin, H.; Ning, Z.W.; Zhao, S.T.; Zhang, Y.N.; Peng, X. Measurement of in-vehicle volatile organic compounds under static conditions. J. Environ. Sci. 2007, 19, 1208–1213. [Google Scholar] [CrossRef]
  17. Chien, Y.C. Variations in amounts and potential sources of volatile organic chemicals in new cars. Sci. Total Environ. 2007, 382, 228–239. [Google Scholar] [CrossRef]
  18. Fedoruk, M.J.; Kerger, B.D. Measurement of volatile organic compounds inside automobiles. J. Expo. Sci. Environ. Epidemiol. 2003, 13, 31–41. [Google Scholar] [CrossRef] [PubMed]
  19. Grabbs, J.S.; Corsi, R.L.; Torres, V.M. Volatile organic compounds in new automobiles: Screening assessment. J. Environ. Eng. 2000, 126, 974–977. [Google Scholar] [CrossRef]
  20. Mandalakis, M.; Stephanou, E.G.; Horii, Y.; Kannan, K. Emerging contaminants in car interiors: Evaluating the impact of airborne PBDEs and PBDD/Fs. Environ. Sci. Technol. 2008, 42, 6431–6436. [Google Scholar] [CrossRef] [PubMed]
  21. Kalman, E.L.; Löfvendahl, A.; Winquist, F.; Lundström, I. Classification of complex gas mixtures from automotive leather using an electronic nose. Anal. Chim. Acta 2000, 403, 31–38. [Google Scholar] [CrossRef]
  22. Brodzik, K.; Faber, J.; Łomankiewicz, D.; Gołda-Kopek, A. In-vehicle VOCs composition of unconditioned, newly produced cars. J. Environ. Sci. 2014, 26, 1052–1061. [Google Scholar] [CrossRef]
  23. Rahman, M.M.; Kim, K.H. Exposure to hazardous volatile pollutants back diffusing from automobile exhaust systems. J. Hazard. Mater. 2012, 241, 267–278. [Google Scholar] [CrossRef]
  24. Wang, H.; Guo, D.; Zhang, W.; Zhang, R.; Gao, Y.; Zhang, X.; Liu, W.; Wu, W.; Sun, L.; Yu, X.; et al. Observation, prediction, and risk assessment of volatile organic compounds in a vehicle cabin environment. Cell Rep. Phys. Sci. 2023, 4, 101375. [Google Scholar] [CrossRef]
  25. Ho, D.X.; Kim, K.H.; Ryeul Sohn, J.; Hee Oh, Y.; Ahn, J.W. Emission rates of volatile organic compounds released from newly produced household furniture products using a large-scale chamber testing method. Sci. World J. 2011, 11, 1597–1622. [Google Scholar] [CrossRef] [Green Version]
  26. Hodgson, A.T.; Wooley, J.D.; Daisey, J.M. Emissions of volatile organic compounds from new carpets measured in a large-scale environmental chamber. Air Waste 1993, 43, 316–324. [Google Scholar] [CrossRef] [PubMed]
  27. Van der Wal, J.F.; Hoogeveen, A.W.; Wouda, P. The influence of temperature on the emission of volatile organic compounds from PVC flooring, carpet, and paint. Indoor Air 1997, 7, 215–221. [Google Scholar] [CrossRef]
  28. Jones, L.A.; Ott, A.; Tardio, J.; Morrison, P.; Rosenberg, S.; Gunda, M.; Bhargava, S.K. VOC emission from alumina calcination stacks caused by thermal decomposition of organic additives. J. Environ. Chem. Eng. 2014, 2, 626–631. [Google Scholar] [CrossRef]
  29. Jung, C.; Mahmoud, N.S.A.; Alqassimi, N. Identifying the relationship between VOCs emission and temperature/humidity changes in new apartments in the hot desert climate. Front. Built Environ. 2022, 8, 1018395. [Google Scholar] [CrossRef]
  30. Tuomi, T.; Vainiotalo, S. The guideline and target values for total volatile organic compound concentrations in industrial indoor environments in Finland. Indoor Built Environ. 2016, 25, 424–434. [Google Scholar] [CrossRef]
Figure 1. Closed chamber (the bubble) for outdoor air control and vehicle in-cabin preconditioning.
Air 01 00014 g001
Figure 2. Mesh grid used for localization of the measurement points on different surfaces (a) in the front part of the cabin (b) in the rear part.
Air 01 00014 g002
Figure 3. Contours of TVOC concentration emitted by the surfaces of the car cabin components for three different temperatures ((a) T = 25 °C, (b) T = 28 °C and (c) T = 32 °C).
Air 01 00014 g003
Figure 4. Concentration distribution of TVOC emitted from different car cabin equipment’s surfaces.
Air 01 00014 g004
Figure 5. Contours of TVOC concentration emitted by the surfaces of the car cabin components at T = 22 °C for two different ventilation modes ((a) Recycled air (RC) and (b) Outdoor air (OA)).
Air 01 00014 g005
Figure 6. Concentration distribution of TVOC emitted from different car cabin components surfaces at T = 22 °C for two different ventilation modes (Recycled (RC) and outdoor (OA) air).
Air 01 00014 g006
Table 1. Representative volumetric and comparison to total Surfaces concentration of TVOC [µg/m3] (±values indicate standard deviations).
Measurement ZoneT = 25 °CT = 28 °CT = 32 °C
Driver’s seat (head level) 4939 ± 22 5358 ± 16 6505 ± 55
Passenger seat (head level) 5019 ± 18 5386 ± 9 6260 ± 36
Armrest level 5078 ± 14 5274 ± 14 6596 ± 19
Center rear seat 5135 ± 20 5269 ± 8 6426 ± 15
Average Volum. Conc.504353166551
Average Tot. Surface Conc.558459697449
Surface to volumetric Conc. ratios1.111.121.14
Disclaimer/Publisher’s Note: The statements, opinions and data contained in all publications are solely those of the individual author(s) and contributor(s) and not of MDPI and/or the editor(s). MDPI and/or the editor(s) disclaim responsibility for any injury to people or property resulting from any ideas, methods, instructions or products referred to in the content.

