
Measuring Embedded Human-Like Biases in Face Recognition Models †


1
Department of Applied Artificial Intelligence, Sungkyunkwan University, Seoul 03063, Korea
2
AI Team, Raon Data, Seoul 04522, Korea
*
Author to whom correspondence should be addressed.
†
Presented at the AAAI Workshop on Artificial Intelligence with Biased or Scarce Data (AIBSD), Online, 28 February 2022.
‡
These authors contributed equally to this work.
Comput. Sci. Math. Forum 2022, 3(1), 2; https://doi.org/10.3390/cmsf2022003002
Published: 11 April 2022
(This article belongs to the Proceedings of AAAI Workshop on Artificial Intelligence with Biased or Scarce Data (AIBSD))
Abstract
:Recent works in machine learning have focused on understanding and mitigating bias in data and algorithms. Because the pre-trained models are trained on large real-world data, they are known to learn implicit biases in a way that humans unconsciously constructed for a long time. However, there has been little discussion about social biases with pre-trained face recognition models. Thus, this study investigates the robustness of the models against racial, gender, age, and an intersectional bias. We also present the racial bias with a different ethnicity other than white and black: Asian. In detail, we introduce the Face Embedding Association Test (FEAT) to measure the social biases in image vectors of faces with different race, gender, and age. It measures social bias in the face recognition models under the hypothesis that a specific group is more likely to be associated with a particular attribute in a biased manner. The presence of these biases within DeepFace, DeepID, VGGFace, FaceNet, OpenFace, and ArcFace critically mitigate the fairness in our society.
1. Introduction
Recent advances in machine learning technologies allow computer vision researchers to employ massive datasets from the web to train models with image representations for general purposes from face recognition to image classification [1,2]. However, the absence of scrutinizing those datasets disproportionately can cause negative impacts on racial and ethnic minorities as well as other vulnerable individuals [3]. Without the necessary precautions of these problematic narratives, there can be some issues in image classification and labeling practices that entail stereotypes and prejudices [4,5]. The machine learning models with such datasets may elaborate and normalize these stereotypes, inflicting unprecedented harm on those who already comprise the margins of our society.
Therefore, it is essential to understand how datasets are sourced, labeled, and what representations the models are trained on. One of the common measures called the Word Embedding Association Test (WEAT) is used to assess undesirable associations in word embeddings [6]. That is, WEAT is used to show that both humans and natural language processing reveal many of the same biases with similar significance. For instance, WEAT shows racial bias in the word vector space by quantifying the close relations between pleasant words and European American names and unpleasant words with African American names. Ross et al. [7] extend this work with a metric throughout interaction between vision and language embeddings to measure biases in social and cultural concepts, such as race. We extend prior works with a metric, which we term Face Embedding Association Test (FEAT) to probe race, gender, and age biases in embeddings of pre-trained face recognition models. Unlike the previous measurements that measure bias within the facial image representation itself [8,9], our measurement measures evaluative associations between pairs of semantic categories which resemble the implicit attitudes underlying human cognitive priming procedure [10]. That is, FEAT measures the models’ automatic associations as if estimating humans’ stereotypical discrimination toward social categories represented by associations between a target and an attribute dimension. In addition, a strong advantage of FEAT is its potential for extension to additional discrimination tests. It is adaptable to assess a wide range of biases in our society.
By taking advantage of the expandability of FEAT, we expand to assess social biases toward a relatively unexplored racial group. There have been a lack of studies measuring biases of various races but only focused on white and black ethnicity. It is a significant oversight to invalidate ethnic group differences within racial category, which is another common form of discrimination experienced not only by Asian people but by other racial groups as well [11]. Understanding nuances in how different groups of people are affected by their ethnicities represents the next step in advancing this field of study. Thus, we take the next step to answer the question whether the models are significantly affected by the biases toward other racial groups rather than white and black. To achieve this goal, we employ face images of European American (EU), African American (AF), and Asian American (AS) people. Moreover, we measure an interaction between racial and gender biases that submissiveness and incapable of becoming leaders is prevalent in Asian women [12]. In short, our contributions are:
- We introduce FEAT to measure racial, gender, age, and an intersectional bias in face recognition models with images.
- Our new dataset and implementations are publicly available (https://github.com/sange1104/face-embedding-association-test, accessed on 28 February 2022).
2. Related Work
A bias mitigation method can be largely divided according to the areas of model distribution targeted for pre-processing, in-processing, and post-processing [19]. The most widely used pre-processing technique is to re-balance datasets [20,21] or use synthetic data [22]. In the case of datasets used in face recognition tasks, they proved to have an imbalanced class distribution both in gender and race [23]. To address this problem, several datasets with a balanced number of gender, ethnicity, and the other attributes are proposed by the previous studies, including Racial Faces in Wild [24], Balanced Faces in the Wild [25], and DiveFace [26]. Although, these datasets contribute to mitigating abnormal distributions, but not to demonstrating that training with these datasets leads to impartial results, because labels for ethnicity in the datasets are not widely allowed as ground truth and are overly dependent on the annotator’s decision [27]. This motivates researchers to develop in- and post-processing methods.
In-processing approaches take several methods to get rid of impartiality while training. For example, cost-sensitive training and adversarial learning are used to get rid of sensitive information from functionality [20,21]. Moreover, adjusting parameters of loss functions and taking an unsupervised way of training are used to protect minorities by training models with unbiased representations [26,28]. The examples of post-processing techniques include re-regulating the similarity scores of the two feature vectors based on demographic groups of the images [29] or attaching layers to the feature extractor for removing sensitive information from the representation [26].
Along the line, growing numbers of measurements have appeared to measure the effectiveness of the mitigation approaches. In the natural language processing field, various tests have been proposed to quantify bias in pre-trained word embedding models. Bolukbasi et al. [30] and Manzini et al. [31] employed word analogy tests and demonstrated undesirable bias toward gender, racial, and religious groups in word embeddings. Moreover, Nadeem et al. [32] present a new evaluation metric that measures how close a model is to an idealistic model, showing that word embeddings contain several stereotypical biases.
Though less work has been studied to measure bias in the computer vision area compared to text, there are several approaches to examine embedded bias in visual recognition tasks. Acien et al. [33] investigate to what extent sensitive data such as gender or ethnic origin attributes are present in the face recognition models. Wang et al. [34] propose a set of measurements of the encoded bias in vision tasks and demonstrate that models amplify the gender biases with an existing dataset. Furthermore, recent studies focus on generation models to explore biases in face classification systems [22,35].
One of the widely used methods to examine bias is evaluating the representation produced by the model [6,36], as it can be easily utilized as a tool to analyze human bias [37,38]. To analyze the implicit bias, the WEAT [6] calculates word associations between target words and attribute words. Replacing words to sentences, the Sentence Encoder Association Test (SEAT) is introduced to apply WEAT to measure biases in sentence embeddings [39]. Moreover, recent studies generalize WEAT to contextualized word embeddings and investigate gender bias in contextual word embeddings from ELMo [40,41]. Steed and Caliskan [1] adapt WEAT to the image domain to evaluate embedded social biases. However, to our knowledge, there are no principle tests for measuring bias toward diverse racial subgroups, especially for Asians with face recognition models. Our work aims to generalize WEAT to facial image embeddings in order to examine social biases toward a wide range of subgroups in pre-trained face recognition models.
3. Methods
3.1. Face Embedding Association Test
Existing bias measures in natural language processing assess bias of word or sentence based on an Implicit Association Test administered to humans [6,42,43]. We introduce Face Embedding Association Test (FEAT) by extending the prior works throughout face embeddings. The details of the FEAT are as follows.
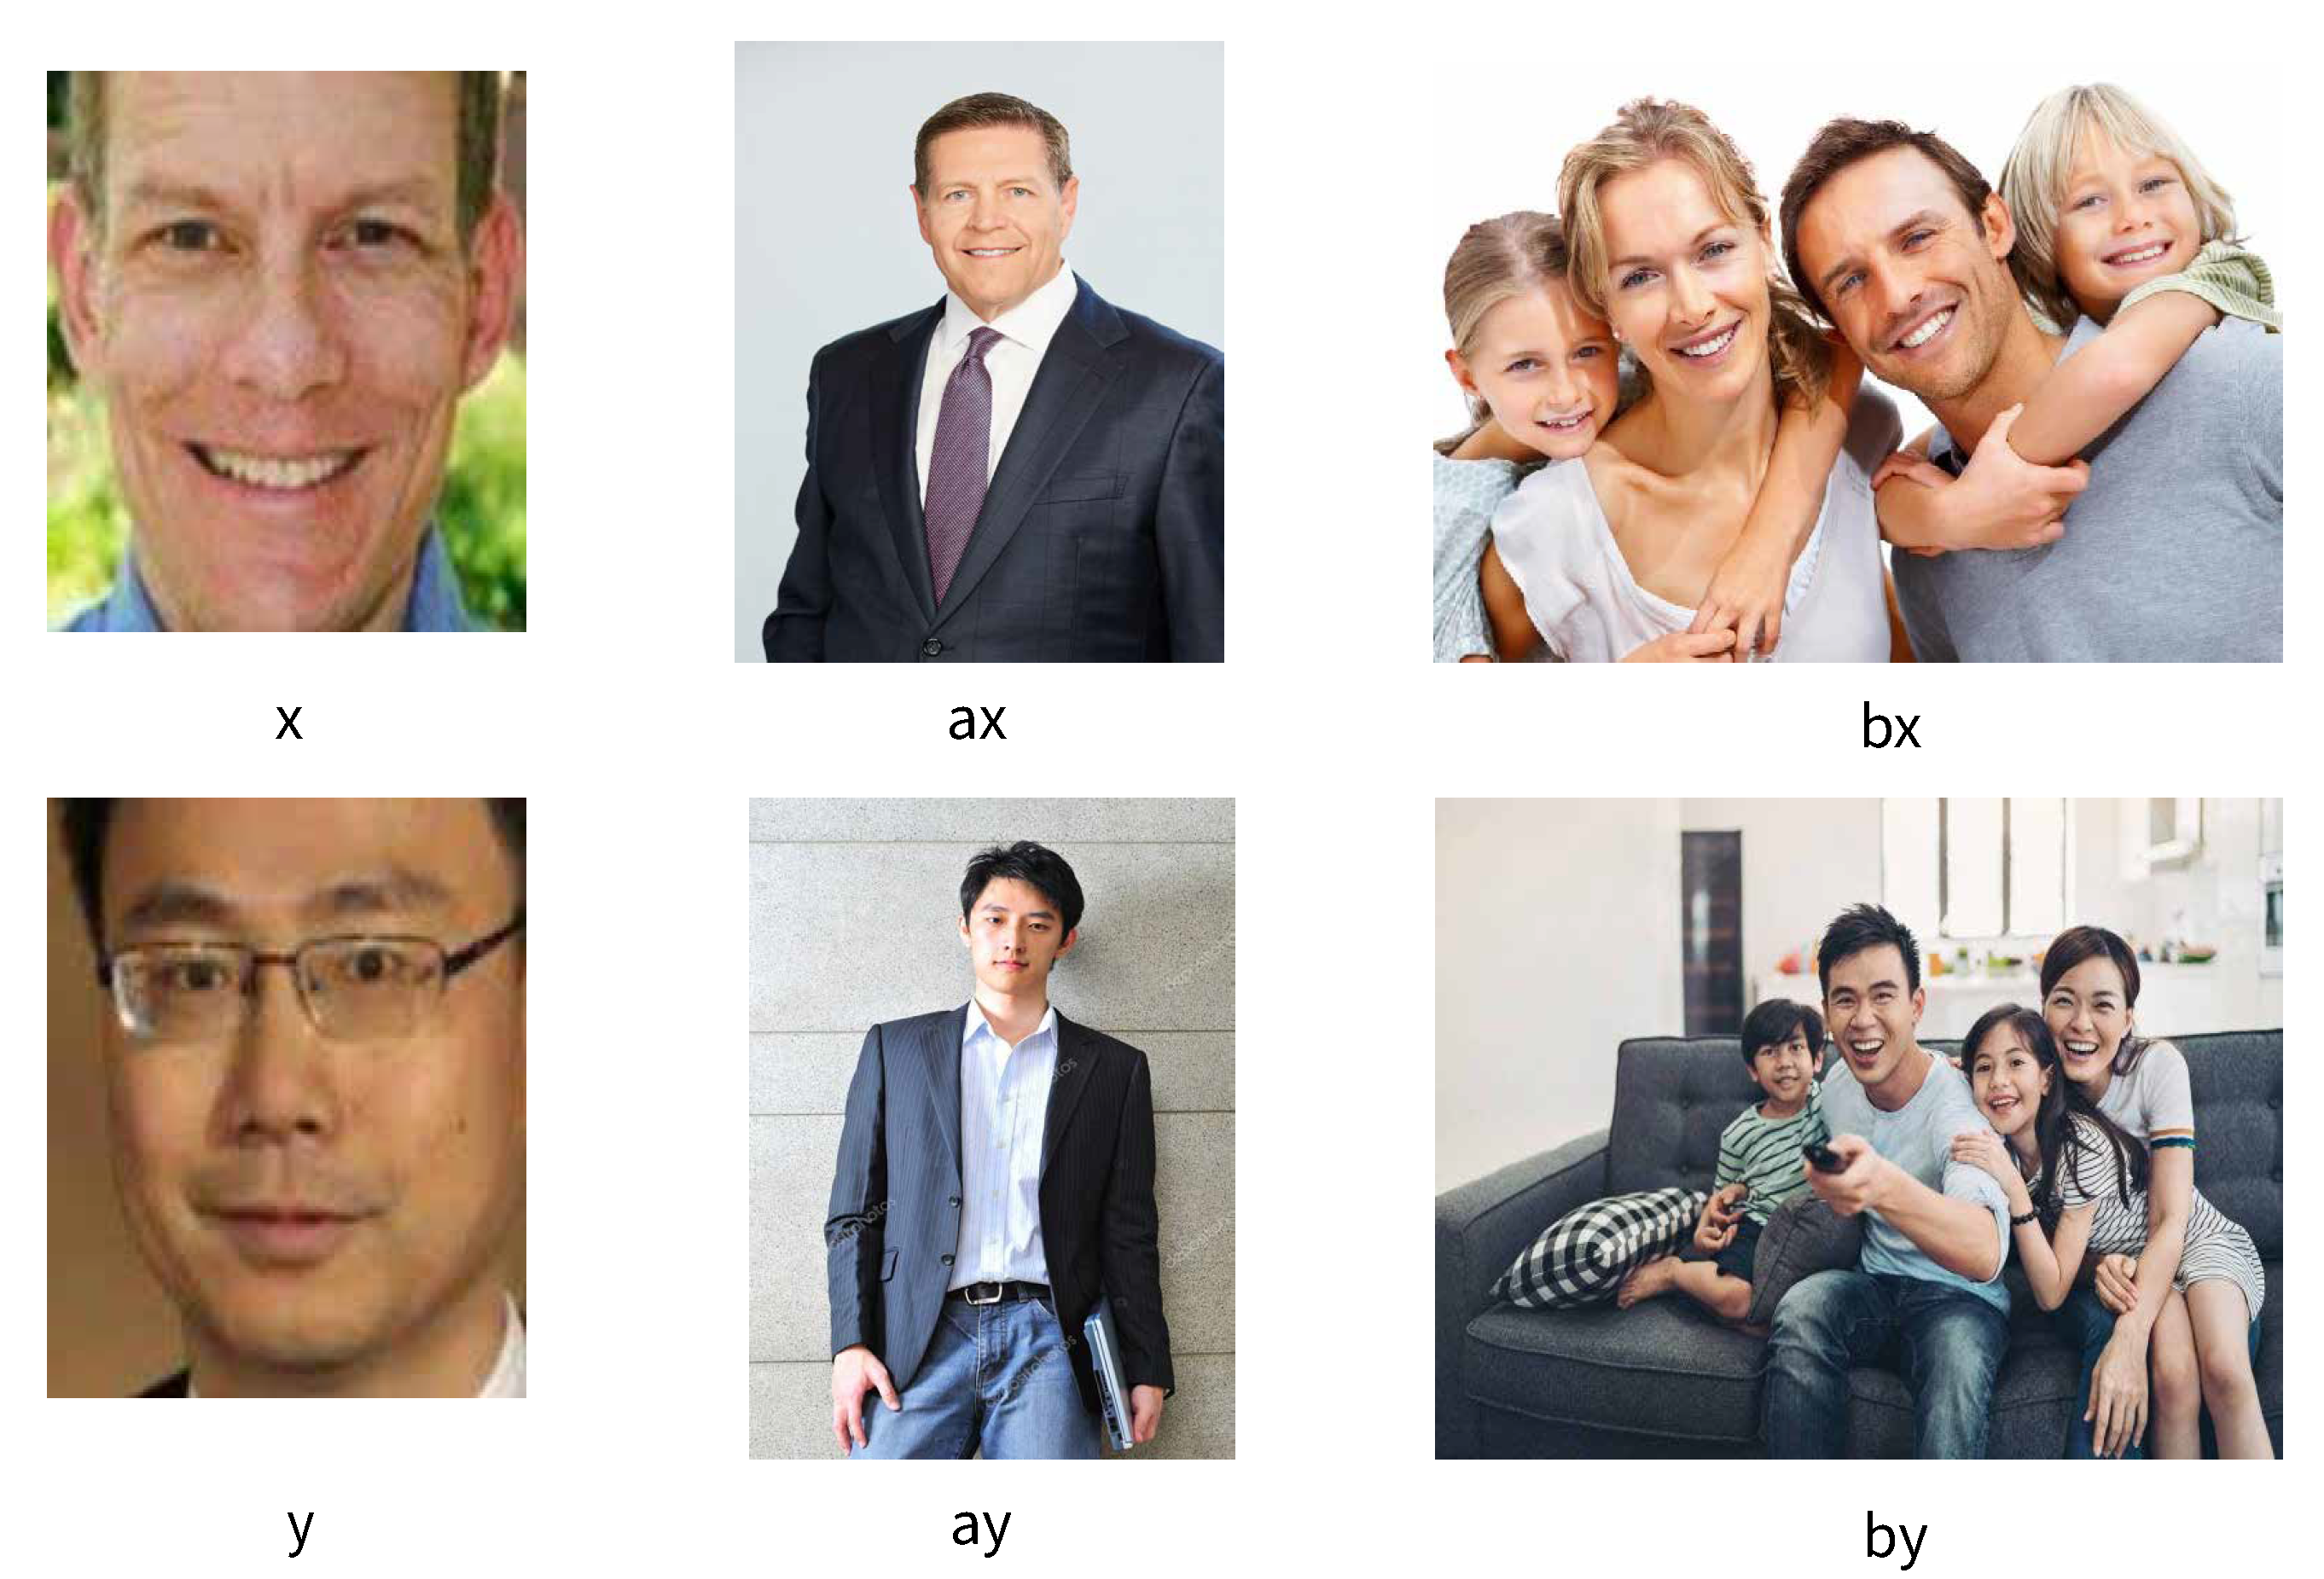
FEAT uses sets of face images, rather than sets of words or sentences, to demonstrate race and gender. Two sets of face images, X and Y, denote two sets of target races of the same size, while A and B are two sets of attribute images. For example, as in Figure 1, a face image x represents EU, while y as AS. One example of career attribute images A denote as a and b is an example of family attributes B. The basis of an indicator of bias is calculated by the average cosine similarity between pairs of images. Equation (1) measures the association of one of the target face images f with different attributes as follows:
where the s function measures how close an average embedding for face image f with attribute set A compared to the B. The relative proximity of f and A opposed to B indicates that both concepts are more closely related.
Then, all target face images (i.e., X and Y) can be used to measure the bias in vector space. Bias is defined as one of the two target sets being significantly closer to one set of attribute images compared to the other. For example, the social bias is present when it comes to one of the target sets EU or AS is significantly closer to the concept of career compared to family. The following equation, , measures the differential association of the two sets of target images with the attribute:
To compute the significance of the association between and , a permutation test on is used as below:
where the probability is computed over the space of partitions of with such that and are of same size. The effect size, a normalized difference of means of , is used to measure the magnitude of the association,
This normalized measure implies how separated the two distributions of associations between the target and attribute are. That is, a larger effect size indicates a larger differential association.
3.2. Face Recognition Models
To evaluate the robustness of the models toward the social biases, we employed popular pre-trained face recognition models. All the models are widely used in real world applications, where the models learn to produce embeddings based on the implicit patterns in the entire training set of image features. Moreover, with different structures of multiple hidden layers, each model learns a different level of abstraction [1]. We extracted image representations from the last layer of each model, where each model encoded a different set of information. The detail of each model is given below:
DeepFace. DeepFace is the face recognition model by adopting a deep neural network. DeepFace uses a pre-trained three-dimensional face geometry model to perform face alignment by using affine transformations after landmark extraction and then learns feature representation from a neural network consisting of convolutional nine layers. This model is trained on the Social Face Classification (SFC) dataset which consists of 4.4 million face images.
DeepID. DeepID is one of the well-known face recognition models. DeepID employs a set of high-level feature representations through deep learning, referred to as deep hidden identity features. This model is trained with CelebFaces dataset and rated by the state-of-the-art score with Labeled Faces in the Wild (LFW) dataset (http://vis-www.cs.umass.edu/lfw/, accessed on 1 December 2021) [44,45].
VGGFace. VGGFace is a very deep CNN model with a VGG16 architecture that employs 15 convolutional layers. The VGGFace is trained by the VGG face dataset, a dataset for a large capacity of face images created from Internet face image searches. This dataset contains over 2.6 million images of 2622 celebrities.
FaceNet. FaceNet is another face recognition model, which returns 128-dimensional face feature representations. To achieve better performance, FaceNet measures face similarity by mapping face images to a compact Euclidean space. The model uses a triplet loss to optimize the weights of the deep convolution layers. This model was pre-trained with MicroSoft Celebrity dataset (MS Celeb) (https://megapixels.cc/msceleb/, accessed on 1 December 2021).
OpenFace. OpenFace is an approximate version of FaceNet. With 3.7 million parameters, it is more frequently adapted in the face recognition field. The model is trained on 500k images from combining the two labeled face recognition datasets, CASIA WebFace [46] and FaceScrub [47].
ArcFace. ArcFace is one of the face recognition models, which learned features from CASIA [46], VGGFace2 [48], ms1m-arcface, and DeepGlint-Face (http://trillionpairs.deepglint.com/overview, accessed on 1 December 2021) datasets. This model proposes a new loss function, Additive Angular Margin Loss, which uses the arc-cosine function to calculate angles between the input features and target weight.
3.3. Dataset
To measure the social biases in face embeddings, we compared the closeness between target images and attribute images. For target images, we used UTKFace dataset (https://susanqq.github.io/UTKFace/, accessed on 1 December 2021), which consists of 24,190 cropped by 200 × 200 face images with diverse demographic profiles. In order to measure racial bias in face recognition models, we randomly selected 3434 images from each EU, AF, and AS, which is the minimum number among three categories. Moreover, for the attribute images, we combined images from Ross et al. [7] and top-ranked hits on Google Images. As we additionally examined racial bias toward Asian American, we collected the same attribute images of Asians as the other racial groups. In detail, we input the search query as Asian, Attribute to obtain the images from a search engine in line with our interest. To measure gender bias, 5244 of male and 5058 of female images were employed. For the attribute images, we used images from Ross et al. [7].
Similar approach was conducted to collect data for measuring age bias. We categorized an individual between 19 to 50 as young adult, while over 60 as old adult [49]. Following this, we randomly selected 851 face images for each young and old adult from the UTKFace dataset. For the attribute images, we crawled images from Google Images by adapting the search rule used in gender query.
In order to measure an intersectional bias in the face recognition models, we employed 1515, 1684, and 1859 images of European American Female, African American Female, and Asian American Female, respectively. To analyze a certain stereotype with respect to incompetence of Asian Female, we employed images from “Competent” and “Incompetent” attribute. Detailed statistics of the collected dataset are described in Table 1.
4. Experiments and Results
In this paper, we validate the FEAT in correspondence with the previous studies [1,6,7] to measure social biases based on the human Implicit Association Test (IAT) [10] with face image stimuli. The FEAT aims to measure the biases embedded during pre-training by comparing the relative association of image embeddings in a systematic process. We present three tests to measure racial, gender, and an intersectional bias:
- Race test, in which two target race concepts are tested for association with a pair of stereotypical attributes (e.g., “European American” vs. “Asian American”, “Pleasant” vs. “Unpleasant”).
- Gender test, where two target gender images are tested for stereotypical association (e.g., “Male” vs. “Female”, “Career” vs. “Family”).
- Age test, where two target age images are tested for stereotypical association (e.g., “Young” vs. “Old”, “Career” vs. “Family”).
- Intersectional test, we term as gendered racism to measure well-known stereotype toward Asian Female; “Asian women are considered as incompetent; not a leader, submissive, and expected to work at a low-level gendered job [12]”.
In line with the human IATs, we find several significant racial biases, gender stereotypes, age biases, and an intersectional bias shared by pre-trained face recognition models.
4.1. Experiment 1: Do Face Recognition Models Contain Racial Biases?
We first present a racial bias test where targets have different ethnicity, including European American, African American, and Asian American. For the attributes, we replicate the same concepts as the original IATs [10]. We adapted sets of attribute pairs, which include Career/Family, Pleasant/Unpleasant, Likable/Unlikable, and Competent/Incompetent, into images. In this experiment, we hypothesized that European American will be significantly related to the first attributes of the pairs, which are career, pleasantness, likable, competences than the others in line with the previous studies [1,6,7,50]. To validate this assumption, we measured the association of races with attributes using FEAT. For example, we calculated s(EU, AF, Career, Family) to compare relative distance between vectors of the target sets, EU and AF, against career attributes such as “business” and “ceo” and family-related attributes such as “children” and “home”.
Effect sizes and p-values from the 100,000 permutation test for each racial bias measurement are reported in Table 2. As we hypothesized, EU is more likely to be related with the attributes career and pleasant compared to other racial groups in all models. In detail, relations show strong bias with presence of large effect size with associations between faces of EU and pleasantness, whereas AF with unpleasantness (VGGFace: d = 0.939, p; FaceNet: d = 1.081, p). Moreover, EU is significantly biased with the attribute likable when embeddings are extracted from all models, except VGGFace.
On the other hand, the differential association of images of EU vs. AS with the attributes show less significant biases. Even though the associations might be significantly different, the effect sizes scored below 0.5, which is considered a small magnitude of biases. Meanwhile, regardless of the race of the counterpart, OpenFace and ArcFace present inherent bias that EU is more likely to be significantly related to the concepts of career, pleasant, likable, and competent (p ).
4.2. Experiment 2: Do Face Recognition Models Contain Gender Stereotypes?
This experiment measures gender biases in the pre-trained face recognition models. To be concrete, the target is a gender pair (i.e., male/female) and attributes are the same as we employed in the racial bias test. To examine gender stereotypes, we calculated the association as s(Male, Female, Career, Family), which measures the relative association of the category men with career attributes and the category women with family-related attributes. We hypothesized male will be highly associated with the concepts including career and competence compared to the other attributes. To examine the magnitude of the gendered biases in the models, we quantified the effect size and p-value as mentioned.
As in Table 3, there are statistically significant gender biases in VGGFace, FaceNet, OpenFace, and ArcFace. As we hypothesized, male is more likely to be associated with career (OpenFace: d = 0.445, p; ArcFace: d = 0.112, p) and competence (VGGFace: d = 0.205, p; OpenFace: d = 0.212, p). These findings parallel with the previous studies that image search results for powerful occupations such as “ceo” systematically under-represented women [30,51]. Moreover, male appears to be more likely to be related with pleasant (ArcFace: d = 0.452, p) and likable attributes (FaceNet: d = 0.237, p; OpenFace: d = 0.053, p). However, overall effect sizes represent the small magnitude of bias (d < 0.5).
On the other hand, there is no presence of gender bias in DeepFace and DeepID, where all the p-values rated at least 0.1. To confirm whether both models are not gender biased, a replication test is left for future work.
4.3. Experiment 3: Do Face Recognition Models Contain Age Stereotypes?
This experiment explores whether face recognition models reproduce stereotypes toward a particular age group, such as elderly are slow, incompetent, and forgetful [52,53]. To measure age bias, we replicated the same attributes as the racial and gender bias tests. Specifically, the target is an age pair (i.e., young/old) and attributes are pairs of Career/Family, Pleasant/Unpleasant, Likable/Unlikable, and Competent/Incompetent. One of the possible stereotypes is that young adults are more likely to be associated with the concepts of career and competence compared to the other attributes. As in the aforementioned experiments, effect sizes and p-values are quantified to examine the magnitude of stereotypes toward each age group.
The results in Table 4 show that DeepID, VGGFace, OpenFace, and ArcFace present age biases. That is, young people are associated with the attributes pleasant (VGGFace: d = 1.406, p, OpenFace: d = 0.551, p), likable (DeepID: d = 0.290, p, VGGFace: d = 1.222, p, OpenFace: d = 0.431, p, ArcFace: d = 0.509, p), and competent (VGGFace: d = 1.046, p, OpenFace: d = 0.225, p). In particular, VGGFace shows age biased representation with all four attributes. Moreover, effect size d of three attributes, including Pleasant/Unpleasant, Likable/Unlikable, and Competent/Incompetent, rated over one, which is considered a large magnitude of bias. On the contrary, we cannot observe any significant differences in associations from DeepFace and FaceNet. Further studies are needed to ensure that neither model shows age bias.
4.4. Experiment 4: Are Face Recognition Models Gendered Racism?
We attempt to replicate a stereotype toward the Asian American Female (ASF). Asian women are usually seen as incapable of being or becoming leaders as they are quiet and lacking leadership qualities. Instead, they are assumed to work at a low-level gendered job, such as being a maid or working in a nail salon [12]. We used incompetent attribute to test this intersectional stereotype, which includes “passive” and “indecisive”. In detail, we set the targets for comparison as European American Female (EUF) and African American Female (AFF). Similar to the bias tests above, we computed the relative distances between the pairs of targets and attributes. For example, s(EUF, ASF, Competent, Incompetent) is used to compare distance between EUF and ASF against the concepts of competence and incompetence. Effect size and p-values are measured to systematically present the gendered racism in the pre-trained models.
Table 5 presents the results of gendered racism of each model, which indicates the biases are prevalent in VGGFace, FaceNet, OpenFace, and ArcFace. In detail, AFF is more likely to be related to competence notions, while ASF is associated with incompetence (VGGFace: d = 1.424, p; FaceNet: d = 0.451, p; OpenFace: d = 0.453, p). Moreover, compared to EUF, ASF is significantly related to incompetence concepts (FaceNet: d = 0.165, p; ArcFace: d = 0.354, p). The results prove the incompetent Asian women stereotype is prevalent in several face recognition models which hampers the accuracy of the models.
In addition to the incompetent Asian women stereotype, it appears that EUF is more likely to be associated with competence, while AFF is related to incompetence (DeepID: d = 0.465, p; FaceNet: d = 0.748, p; ArcFace: d = 0.358, p). This counters the past stereotypes that black women are self-reliant, strength, resourcefulness, autonomy, and the responsibility of providing for the material for their family [54].
4.5. Race Sensitivity Analysis
In order to verify that the racial features of the images result in racial bias in pre-trained models, we measured the differences of racial bias depending on the variances of racial features. We hypothesized that if a strong association between a target and attribute becomes loose as changing the racial features, a model tends to link a certain target that has specific race-dependent features with an attribute. In this regard, we reversed the races of images to measure associations between reversed race targets and attributes with FEAT. We synthesized the set of target images to having reversed races (i.e., EU to AF and AF to EU) by varying the extent of the racial variances by increasing the levels of transformation from 0% to 100% with 25% interval. We preserved the identity-related features of the images while reversing the racially dependent features of the faces. Following the findings of prior research, AF and EU have several differences in external facial features [55]: (1) skin color, (2) nose shape, and (3) lip shape. In detail, skin color is one of the most representative features that can be used to visually distinguish race. Moreover, AF individuals typically have shorter, wider, and shallower noses than the EU population [56]. In addition, their lips are also thicker and wider [57]. Therefore, the aforementioned face features of EU are converted into AF features and vice versa.
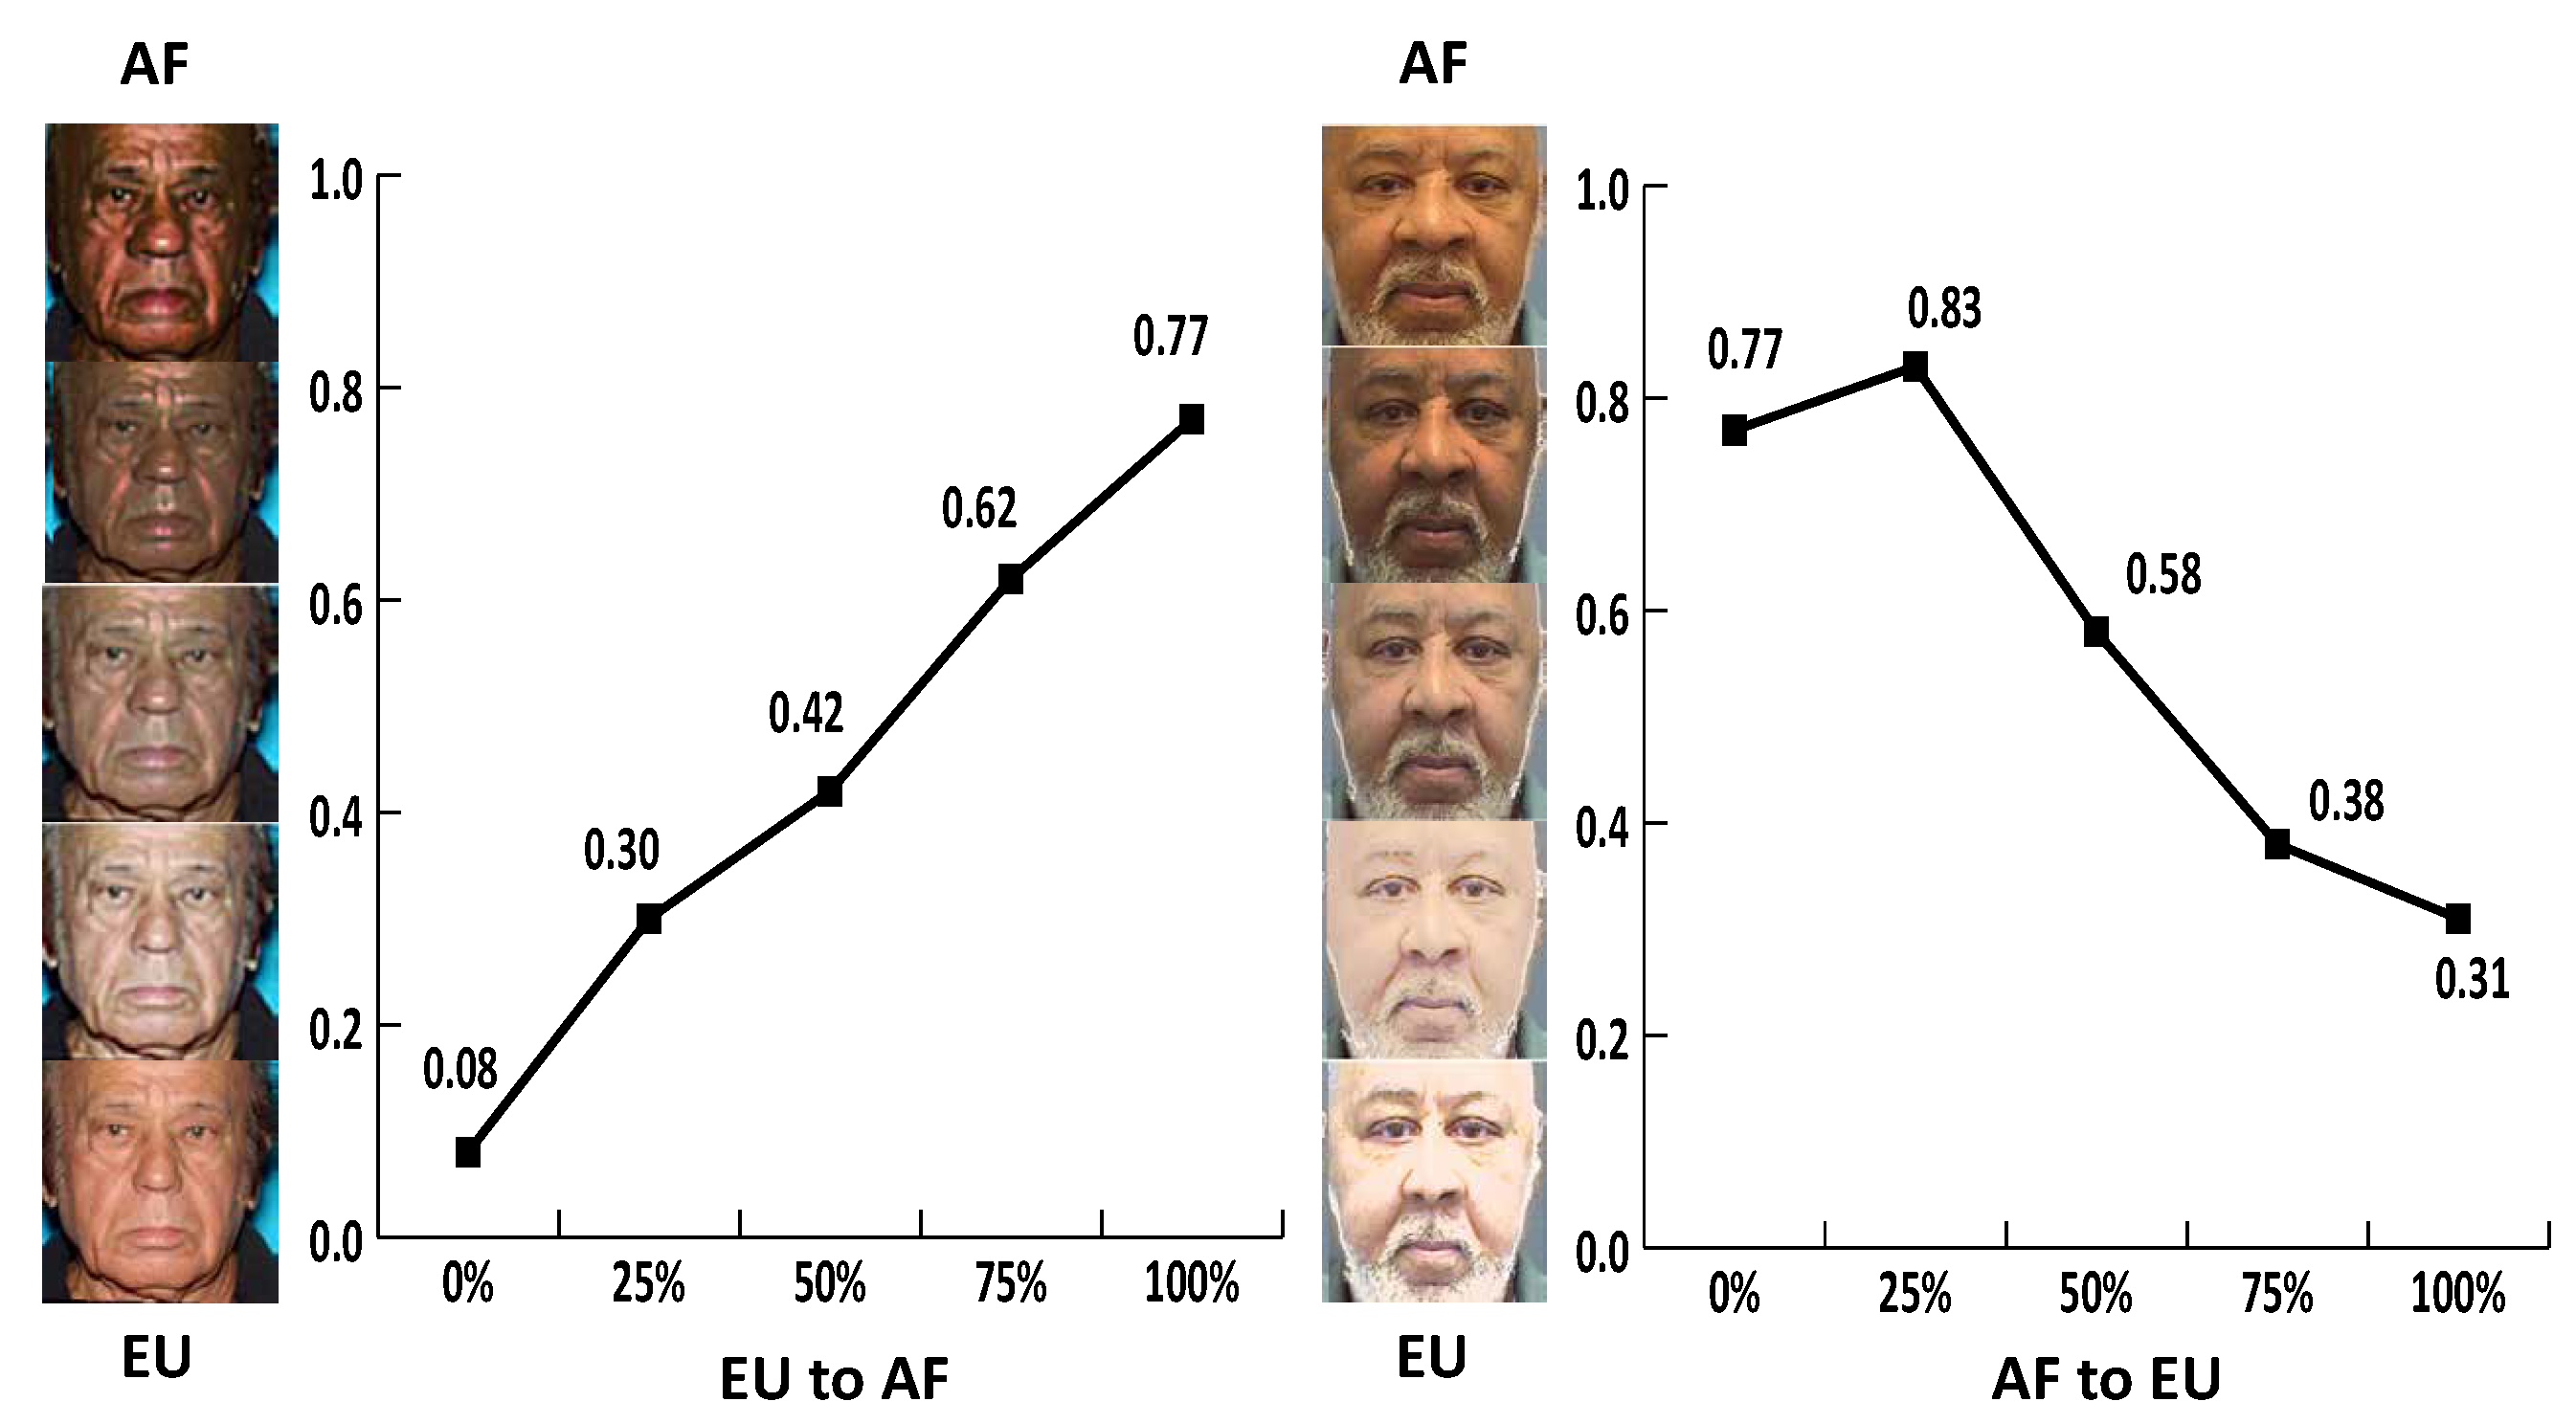
For the reliability of the racial transformation, we validated whether the race of a given image is represented differently as the level of the transformation increased. We employed the convolutional neural network (CNN) model, which has shown good performance with image classification tasks [58], to classify the race of the image. We trained the CNN using a race balanced dataset which consists of 774 EU and 774 AF. By employing the trained CNN, we classified the race transformed dataset which contains 500 EU and 500 AF images into one of the race classes. For each degree of transformation, we averaged the race classification probabilities of transformed images where 0 indicates the EU class and 1 indicates the AF class. The classification probabilities are represented in Figure 2. As the transformation level of EU becoming AF moves from 0% to 100%, there is a probability of EU being classified as AF. Similarly, AF are more likely to be classified into EU throughout the level of race transformation. The classification variances imply that the race of the image is distinguished by the extent of the transformation.
As we verified the racial transformation, we measured the FEAT by varying the racial features of target images. For example, we calculated s(EU25, AF25, Career, Family), where EU25 indicates the EU images transformed into AF at about 25%, while AF25 represents the AF images converted into EU by 25%. Table 6 describes the FEAT result with race sensitivity. Accordingly, as the race converted, the number of significant differences decreases. In other words, as the race becomes converted, the associations between targets and attributes are not significantly different. For instance, EU25 is more likely to be related to a career than family, while EU100 is not significantly related to a certain attribute. In accordance with this result, AF100 is not associated with a certain attribute, but AF25 is linked with family rather than a career.
In particular, for the Career/Family attribute, we found that a significant difference in association only exists in the 25% race transformed embeddings for all models. As the EU becomes AF (i.e., 50% to 100%), and vice versa, the associations between target and the attribute become insignificant. That is, the models are sensitive to racial features which would be the cause of discriminative associations.
5. Discussion
The current study demonstrates that the pre-trained face recognition models are prone to stereotypical bias even though they are widely used as building blocks for various vision tasks. We investigated a wide range of social biases to show how human-like biases are automatically encoded in vector spaces of face recognition models. By introducing FEAT, we systematically evaluated how pre-trained models interpret an image containing a bias target and associate them to a specific attribute. We confirmed racial, gender, age, and an intersectional bias are reproduced through the embeddings from pre-trained models by assessing differences in evaluative associations between pairs of semantic or social categories. To be specific, the results show an intersectional bias in minorities such as females of relatively unexplored ethnicity in the field. This implies a wide range of subgroups and ethnicities should be considered with respect to diagnosing social biases.
The new measurement, FEAT, would be useful for quantification of the social biases from the way people are portrayed in images that are used to train machine learning models. This alerts practitioners to be cautious against using pre-trained models for transfer learning, which implies the importance of monitoring the harms these biases may pose. Moreover, the different levels of social biases in each model emphasize the importance of model selection when fair decisions are to be made in the real world. Leveraging these developments will spur future research in understanding human bias in pre-trained models and further mitigating social biases in models to build a fair society.
However, our study has some limitations to be solved in a future study. There is a lack of exploration as to whether the discriminative associations result from underlying biased data distribution or a training procedure. Moreover, as we collected our test data in the wild, the test set might amplify the biases of the models because most of the models are fine-tuned on task specific datasets. That is, the absence of the fine tuning process with the new dataset might deteriorate the accuracy of the models. Therefore, to confirm the origins of these biases in face images, syntactic and semantic features from the contextual representation would be analyzed in the future study following the previous study [59]. Furthermore, measuring biases depending on each training batch can be another direction for future work. That is, we can test the FEAT with the face embeddings from every batch to detect the stage where the social biases start while training with the pre-trained model. In addition, to analyze the main factors of biases within the embeddings, the bias mitigation techniques would be presented to contribute to the fairness in the field of computer vision.
Author Contributions
Conceptualization, S.L., S.O.; Data curation, S.L.; Formal analysis, S.L., S.O.; Funding acquisition, E.P.; Investigation, S.L., S.O.; Methodology, S.L., S.O.; Project administration, S.L., S.O.; Resources, E.P.; Software, S.L.; Supervision, S.O.; Validation, S.L., S.O.; Visualization, S.L., S.O.; Writing—original draft, S.L., S.O., and M.K.; Writing—review & editing, S.L., S.O. All authors have read and agreed to the published version of the manuscript.
Funding
This research was supported by the MSIT (Ministry of Science, ICT), Korea, under the High-Potential Individuals Global Training Program) (IITP-2021-0-02104) and the ICAN (ICT Challenge and Advanced Network of HRD) program (IITP-2020-0-01816) supervised by the IITP (Institute of Information & Communications Technology Planning & Evaluation).
Institutional Review Board Statement
Not applicable.
Informed Consent Statement
Not applicable.
Data Availability Statement
https://github.com/sange1104/face-embedding-association-test accessed om 1 December 2021.
References
- Steed, R.; Caliskan, A. Image Representations Learned With Unsupervised Pre-Training Contain Human-like Biases. In Proceedings of the 2021 ACM Conference on Fairness, Accountability, and Transparency, Virtual Event, Canada, 3–10 March 2021; pp. 701–713. [Google Scholar]
- Tan, C.; Sun, F.; Kong, T.; Zhang, W.; Yang, C.; Liu, C. A survey on deep transfer learning. In Artificial Neural Networks and Machine Learning—ICANN 2018; Springer: Cham, Switzerland, 2018; pp. 270–279. [Google Scholar]
- Birhane, A.; Cummins, F. Algorithmic injustices: Towards a relational ethics. arXiv 2019, arXiv:1912.07376. [Google Scholar]
- Eubanks, V. Automating Inequality: How High-Tech Tools Profile, Police, and Punish the Poor; St. Martin’s Publishing Group: New York, NY, USA, 2018. [Google Scholar]
- O’neil, C. Weapons of Math Destruction: How Big Data Increases Inequality and Threatens Democracy; Crown Books: New York, NY, USA, 2016. [Google Scholar]
- Caliskan, A.; Bryson, J.J.; Narayanan, A. Semantics derived automatically from language corpora contain human-like biases. Science 2017, 356, 183–186. [Google Scholar] [CrossRef] [PubMed] [Green Version]
- Ross, C.; Katz, B.; Barbu, A. Measuring Social Biases in Grounded Vision and Language Embeddings. In Proceedings of the 2021 Conference of the North American Chapter of the Association for Computational Linguistics: Human Language Technologies, Mexico City, Mexico, 6–11 June 2021; pp. 998–1008. [Google Scholar]
- Glüge, S.; Amirian, M.; Flumini, D.; Stadelmann, T. How (not) to measure bias in face recognition networks. In Artificial Neural Networks in Pattern Recognition; Springer: Cham, Switzerland, 2020; pp. 125–137. [Google Scholar]
- Yucer, S.; Akçay, S.; Al-Moubayed, N.; Breckon, T.P. Exploring racial bias within face recognition via per-subject adversarially-enabled data augmentation. In Proceedings of the IEEE/CVF Conference on Computer Vision and Pattern Recognition Workshops, Seattle, WA, USA, 14–19 June 2020; pp. 18–19. [Google Scholar]
- Greenwald, A.G.; McGhee, D.E.; Schwartz, J.L. Measuring individual differences in implicit cognition: The implicit association test. J. Personal. Soc. Psychol. 1998, 74, 1464. [Google Scholar] [CrossRef]
- Lee, D.L.; Ahn, S. Racial discrimination and Asian mental health: A meta-analysis. Couns. Psychol. 2011, 39, 463–489. [Google Scholar] [CrossRef]
- Mukkamala, S.; Suyemoto, K.L. Racialized sexism/sexualized racism: A multimethod study of intersectional experiences of discrimination for Asian American women. Asian Am. J. Psychol. 2018, 9, 32. [Google Scholar] [CrossRef]
- Taigman, Y.; Yang, M.; Ranzato, M.; Wolf, L. Deepface: Closing the gap to human-level performance in face verification. In Proceedings of the IEEE Conference on Computer Vision and Pattern Recognition, Columbus, OH, USA, 23–28 June 2014; pp. 1701–1708. [Google Scholar]
- Sun, Y.; Wang, X.; Tang, X. Deep learning face representation from predicting 10,000 classes. In Proceedings of the IEEE Conference on Computer Vision and Pattern Recognition, Columbus, OH, USA, 23–28 June 2014; pp. 1891–1898. [Google Scholar]
- Parkhi, O.; Vedaldi, A.; Zisserman, A. Deep Face Recognition. In Proceedings of the 26th British Machine Vision Conference (BMVC), Swansea, UK, 7–10 September 2015; Xie, X., Jones, M.W., Tam, G.K.L., Eds.; BMVA Press: Durham, UK, 2015. [Google Scholar] [CrossRef] [Green Version]
- Schroff, F.; Kalenichenko, D.; Philbin, J. Facenet: A unified embedding for face recognition and clustering. In Proceedings of the IEEE Conference on Computer Vision and Pattern Recognition, Boston, MA, USA, 7–12 June 2015; pp. 815–823. [Google Scholar]
- Amos, B.; Ludwiczuk, B.; Satyanarayanan, M. Openface: A general-purpose face recognition library with mobile applications. CMU Sch. Comput. Sci. 2016, 6, 20. [Google Scholar]
- Deng, J.; Guo, J.; Xue, N.; Zafeiriou, S. Arcface: Additive angular margin loss for deep face recognition. In Proceedings of the IEEE/CVF Conference on Computer Vision and Pattern Recognition, Long Beach, CA, USA, 16–17 June 2019; pp. 4690–4699. [Google Scholar]
- Bellamy, R.K.; Dey, K.; Hind, M.; Hoffman, S.C.; Houde, S.; Kannan, K.; Lohia, P.; Martino, J.; Mehta, S.; Mojsilovic, A.; et al. AI Fairness 360: An extensible toolkit for detecting, understanding, and mitigating unwanted algorithmic bias. arXiv 2018, arXiv:1810.01943. [Google Scholar]
- Huang, C.; Li, Y.; Loy, C.C.; Tang, X. Deep imbalanced learning for face recognition and attribute prediction. IEEE Trans. Pattern Anal. Mach. Intell. 2019, 42, 2781–2794. [Google Scholar] [CrossRef] [Green Version]
- Wang, Z.; Qinami, K.; Karakozis, I.C.; Genova, K.; Nair, P.; Hata, K.; Russakovsky, O. Towards fairness in visual recognition: Effective strategies for bias mitigation. In Proceedings of the IEEE/CVF Conference on Computer Vision and Pattern Recognition, Seattle, WA, USA, 13–19 June 2020; pp. 8919–8928. [Google Scholar]
- Kortylewski, A.; Egger, B.; Schneider, A.; Gerig, T.; Morel-Forster, A.; Vetter, T. Analyzing and reducing the damage of dataset bias to face recognition with synthetic data. In Proceedings of the IEEE/CVF Conference on Computer Vision and Pattern Recognition Workshops, Long Beach, CA, USA, 16–17 June 2019. [Google Scholar]
- Sixta, T.; Junior, J.C.J.; Buch-Cardona, P.; Vazquez, E.; Escalera, S. Fairface challenge at eccv 2020: Analyzing bias in face recognition. In Computer Vision—ECCV 2020 Workshops. ECCV 2020; Springer: Cham, Switzerland, 2020; pp. 463–481. [Google Scholar]
- Wang, M.; Deng, W.; Hu, J.; Tao, X.; Huang, Y. Racial faces in the wild: Reducing racial bias by information maximization adaptation network. In Proceedings of the IEEE/CVF International Conference on Computer Vision, Long Beach, CA, USA, 16–17 June 2019; pp. 692–702. [Google Scholar]
- Robinson, J.P.; Livitz, G.; Henon, Y.; Qin, C.; Fu, Y.; Timoner, S. Face recognition: Too bias, or not too bias? In Proceedings of the IEEE/CVF Conference on Computer Vision and Pattern Recognition Workshops, Seattle, WA, USA, 13–19 June 2020. [Google Scholar]
- Morales, A.; Fierrez, J.; Vera-Rodriguez, R.; Tolosana, R. SensitiveNets: Learning agnostic representations with application to face images. IEEE Trans. Pattern Anal. Mach. Intell. 2020, 43, 2158–2164. [Google Scholar] [CrossRef]
- Del Bino, S.; Bernerd, F. Variations in skin colour and the biological consequences of ultraviolet radiation exposure. British Journal of Dermatology 2013, 169, 33–40. [Google Scholar] [CrossRef] [Green Version]
- Vowels, M.J.; Camgoz, N.C.; Bowden, R. NestedVAE: Isolating common factors via weak supervision. In Proceedings of the IEEE/CVF Conference on Computer Vision and Pattern Recognition, Seattle, WA, USA, 13–19 June 2020; pp. 9202–9212. [Google Scholar]
- Terhörst, P.; Kolf, J.N.; Damer, N.; Kirchbuchner, F.; Kuijper, A. Post-comparison mitigation of demographic bias in face recognition using fair score normalization. Pattern Recognit. Lett. 2020, 140, 332–338. [Google Scholar] [CrossRef]
- Bolukbasi, T.; Chang, K.W.; Zou, J.Y.; Saligrama, V.; Kalai, A.T. Man is to computer programmer as woman is to homemaker? debiasing word embeddings. Adv. Neural Inf. Process. Syst. 2016, 29, 4349–4357. [Google Scholar]
- Manzini, T.; Lim, Y.C.; Tsvetkov, Y.; Black, A.W. Black is to Criminal as Caucasian is to Police: Detecting and Removing Multiclass Bias in Word Embeddings. In Proceedings of the 2019 Annual Conference of the North American Chapter of the Association for Computational Linguistics (NAACL), Minneapolis, MN, USA, 2–7 June 2019. [Google Scholar]
- Nadeem, M.; Bethke, A.; Reddy, S. Stereoset: Measuring stereotypical bias in pretrained language models. arXiv 2020, arXiv:2004.09456. [Google Scholar]
- Acien, A.; Morales, A.; Vera-Rodriguez, R.; Bartolome, I.; Fierrez, J. Measuring the gender and ethnicity bias in deep models for face recognition. In Iberoamerican Congress on Pattern Recognition; Springer: Cham, Switzerland, 2018; pp. 584–593. [Google Scholar]
- Wang, T.; Zhao, J.; Yatskar, M.; Chang, K.W.; Ordonez, V. Balanced datasets are not enough: Estimating and mitigating gender bias in deep image representations. In Proceedings of the IEEE/CVF International Conference on Computer Vision, Long Beach, CA, USA, 16–17 June 2019; pp. 5310–5319. [Google Scholar]
- Albiero, V.; KS, K.; Vangara, K.; Zhang, K.; King, M.C.; Bowyer, K.W. Analysis of gender inequality in face recognition accuracy. In Proceedings of the IEEE/CVF Winter Conference on Applications of Computer Vision Workshops, Seattle, WA, USA, 13–19 June 2020; pp. 81–89. [Google Scholar]
- Dwork, C.; Hardt, M.; Pitassi, T.; Reingold, O.; Zemel, R. Fairness through awareness. In Proceedings of the 3rd Innovations in Theoretical Computer Science Conference, Cambridge, MA, USA, 8–10 January 2012; pp. 214–226. [Google Scholar]
- Garg, N.; Schiebinger, L.; Jurafsky, D.; Zou, J. Word embeddings quantify 100 years of gender and ethnic stereotypes. Proc. Natl. Acad. Sci. USA 2018, 115, E3635–E3644. [Google Scholar] [CrossRef] [PubMed] [Green Version]
- Kozlowski, A.C.; Taddy, M.; Evans, J.A. The geometry of culture: Analyzing the meanings of class through word embeddings. Am. Sociol. Rev. 2019, 84, 905–949. [Google Scholar] [CrossRef] [Green Version]
- May, C.; Wang, A.; Bordia, S.; Bowman, S.R.; Rudinger, R. On measuring social biases in sentence encoders. arXiv 2019, arXiv:1903.10561. [Google Scholar]
- Tan, Y.C.; Celis, L.E. Assessing social and intersectional biases in contextualized word representations. arXiv 2019, arXiv:1911.01485. [Google Scholar]
- Zhao, J.; Wang, T.; Yatskar, M.; Cotterell, R.; Ordonez, V.; Chang, K.W. Gender bias in contextualized word embeddings. arXiv 2019, arXiv:1904.03310. [Google Scholar]
- Chaloner, K.; Maldonado, A. Measuring gender bias in word embeddings across domains and discovering new gender bias word categories. In Proceedings of the First Workshop on Gender Bias in Natural Language Processing, Florence, Italy, 2 August 2019; pp. 25–32. [Google Scholar]
- Kurita, K.; Vyas, N.; Pareek, A.; Black, A.W.; Tsvetkov, Y. Measuring Bias in Contextualized Word Representations. In Proceedings of the First Workshop on Gender Bias in Natural Language Processing, Florence, Italy, 2 August 2019; pp. 166–172. [Google Scholar]
- Huang, G.B.; Mattar, M.; Berg, T.; Learned-Miller, E. Labeled faces in the wild: A database for studying face recognition in unconstrained environments. In Proceedings of the Workshop on Faces in’Real-Life’Images: Detection, Alignment, and Recognition, Marseille, France, 12–18 October 2008. [Google Scholar]
- Liu, Z.; Luo, P.; Wang, X.; Tang, X. Deep Learning Face Attributes in the Wild. In Proceedings of the Proceedings of International Conference on Computer Vision (ICCV), Santiago, Chile, 7–13 December 2015. [Google Scholar]
- Yi, D.; Lei, Z.; Liao, S.; Li, S.Z. Learning face representation from scratch. arXiv 2014, arXiv:1411.7923. [Google Scholar]
- Ng, H.W.; Winkler, S. A data-driven approach to cleaning large face datasets. In Proceedings of the 2014 IEEE International Conference on Image Processing (ICIP), Paris, France, 27–30 October 2014; pp. 343–347. [Google Scholar]
- Cao, Q.; Shen, L.; Xie, W.; Parkhi, O.M.; Zisserman, A. Vggface2: A dataset for recognising faces across pose and age. In Proceedings of the 2018 13th IEEE International Conference on Automatic Face & Gesture Recognition (FG 2018), Xi’an, China, 15–19 May 2018; pp. 67–74. [Google Scholar]
- Balakrishnan, G.; Xiong, Y.; Xia, W.; Perona, P. Towards Causal Benchmarking of Biasin Face Analysis Algorithms. In Deep Learning-Based Face Analytics; Springer: Cham, Switzerland, 2021; pp. 327–359. [Google Scholar]
- Nagpal, S.; Singh, M.; Singh, R.; Vatsa, M. Deep learning for face recognition: Pride or prejudiced? arXiv 2019, arXiv:1904.01219. [Google Scholar]
- Kay, M.; Matuszek, C.; Munson, S.A. Unequal representation and gender stereotypes in image search results for occupations. In Proceedings of the 33rd Annual ACM Conference on Human Factors in Computing Systems, Seoul, Korea, 18–23 April 2015; pp. 3819–3828. [Google Scholar]
- McDonough, C. The effect of ageism on the digital divide among older adults. J. Gerontol. Geriatr. Med. 2016, 2, 1–7. [Google Scholar] [CrossRef] [Green Version]
- Ayalon, L.; Dolberg, P.; Mikulionienė, S.; Perek-Białas, J.; Rapolienė, G.; Stypinska, J.; Willińska, M.; de la Fuente-Núñez, V. A systematic review of existing ageism scales. Ageing Res. Rev. 2019, 54, 100919. [Google Scholar] [CrossRef]
- Dugger, K. Social location and gender-role attitudes: A comparison of Black and White women. Gend. Soc. 1988, 2, 425–448. [Google Scholar] [CrossRef]
- Zhuang, Z.; Landsittel, D.; Benson, S.; Roberge, R.; Shaffer, R. Facial anthropometric differences among gender, ethnicity, and age groups. Ann. Occup. Hyg. 2010, 54, 391–402. [Google Scholar] [PubMed] [Green Version]
- Hosoi, S.; Takikawa, E.; Kawade, M. Ethnicity estimation with facial images. In Proceedings of the Sixth IEEE International Conference on Automatic Face and Gesture Recognition, Seoul, Korea, 19 May 2004; pp. 195–200. [Google Scholar]
- Kau, C.H.; Wang, J.; Davis, M. A cross-sectional study to understand 3D facial differences in a population of African Americans and Caucasians. Eur. J. Dent. 2019, 13, 485. [Google Scholar] [CrossRef] [Green Version]
- Shin, H.C.; Roth, H.R.; Gao, M.; Lu, L.; Xu, Z.; Nogues, I.; Yao, J.; Mollura, D.; Summers, R.M. Deep convolutional neural networks for computer-aided detection: CNN architectures, dataset characteristics and transfer learning. IEEE Trans. Med Imaging 2016, 35, 1285–1298. [Google Scholar] [CrossRef] [Green Version]
- Brunet, M.E.; Alkalay-Houlihan, C.; Anderson, A.; Zemel, R. Understanding the origins of bias in word embeddings. In Proceedings of the International Conference on Machine Learning. PMLR, Long Beach, CA, USA, 9–15 June 2019; pp. 803–811. [Google Scholar]
Figure 1.
One example set of images for measuring race bias, where the targets are face images of European American and Asian American while the attributes are Career and Family. The images labeled with , , , and are images that depict a target in the context of an attribute.
Figure 1.
One example set of images for measuring race bias, where the targets are face images of European American and Asian American while the attributes are Career and Family. The images labeled with , , , and are images that depict a target in the context of an attribute.

Figure 2.
The classification probability of race between AF and EU by extent of the race transformation; x-axis indicates level of race transformation, while y-axis indicates probability of prediction to EU (0) or AF (1).
Figure 2.
The classification probability of race between AF and EU by extent of the race transformation; x-axis indicates level of race transformation, while y-axis indicates probability of prediction to EU (0) or AF (1).


Table 1.
The statistics of dataset used in our paper. To measure racial bias, targets are EU, AF, and AS, while attributes are Career/Family, Pleasant/Unpleasant, Likable/Unlikable, and Competent/Incompetent. For gender bias test, targets are Male and Female, while attributes are same as racial bias test. In age bias measure, targets are young and old, while attributes are also same as in the gender bias test. To measure gendered racism, the most common stereotype of Asian Female (ASF) having Incompetent attribute, we sorted out images of each racial group with a certain gender (i.e., European American Female (EUF) and African American Female (AFF)) and attribute (i.e., Competent/Incompetent).
| Target | EU | AF | AS | M | F | Young | Old | EUF | AFF | ASF | |
|---|---|---|---|---|---|---|---|---|---|---|---|
| 3434 | 3434 | 3434 | 5244 | 5058 | 851 | 851 | 1515 | 1684 | 1859 | ||
| Attribute | Career/Family | 237 | 239 | 280 | 236 | 230 | 264 | 250 | - | - | - |
| Pleasant/Unpleasant | 541 | 579 | 681 | 546 | 541 | 713 | 537 | - | - | - | |
| Likable/Unlikable | 123 | 110 | 153 | 111 | 112 | 160 | 160 | - | - | - | |
| Competent/Incompetent | 177 | 155 | 189 | 158 | 148 | 200 | 197 | 92 | 82 | 92 | |
Table 2.
The results for FEAT on race tests present biases toward races. Each cell represents the effect size, which indicates the magnitude of bias as small (0.2), medium (0.5), and large (0.8). p-values under 0.001 are significant, which are marked as *. Targets for test are European American, African American, and Asian American. Attributes are Career/Family, Pleasant/Unpleasant, Likable/Unlikable, and Competent/Incompetent.
| DeepFace | DeepID | VGGFace | FaceNet | OpenFace | ArcFace | ||
|---|---|---|---|---|---|---|---|
| Career/Family | EU/AF | 0.095 * | 0.078 * | 0.294 * | 0.569 * | 0.148 * | −0.000 |
| EU/AS | −0.006 | −0.209 | −0.476 | −0.097 | 0.372 * | 0.078 * | |
| Pleasant/Unpleasant | EU/AF | 0.507 * | 0.557 * | 0.939 * | 1.081 * | 0.635 * | 0.277 * |
| EU/AS | −0.049 | −0.001 | −0.138 | 0.009 | 0.140 * | 0.165 * | |
| Likable/Unlikable | EU/AF | 0.134 * | 0.647 * | 0.021 | 1.084 * | 0.287 * | 0.517 * |
| EU/AS | −0.032 | −0.112 | −0.829 | −0.121 | 0.111 * | −0.524 | |
| Competent/Incompetent | EU/AF | −0.038 | −0.520 | −1.215 | 0.704 * | −0.575 | −0.200 |
| EU/AS | 0.012 | 0.075 * | 0.223 * | −0.123 | −0.334 | 0.186 * |
Table 3.
The results for FEAT on gender stereotype test that measures biases toward gender. Each cell represents the effect size, which indicates the magnitude of bias as small (0.2), medium (0.5), and large (0.8). p-values under 0.001 are significant, which are marked as *. Targets for test are Male and Female. Attributes are Career/Family, Pleasant/Unpleasant, Likable/Unlikable, and Competent/Incompetent.
| DeepFace | DeepID | VGGFace | FaceNet | OpenFace | ArcFace | ||
|---|---|---|---|---|---|---|---|
| Career/Family | Male/Female | 0.002 | −0.412 | −0.197 | −0.106 | 0.445 * | 0.111 * |
| Pleasant/Unpleasant | 0.001 | −0.194 | −0.089 | −0.042 | 0.020 | 0.452 * | |
| Likable/Unlikable | 0.002 | −0.053 | −0.030 | 0.237 * | 0.053 | −0.243 | |
| Competent/Incompetent | −0.001 | −0.036 | 0.205 * | −0.343 | 0.212 * | 0.035 |
Table 4.
The results for FEAT on age stereotype test that measures biases toward age. Each cell represents the effect size, which indicates the magnitude of bias as small (0.2), medium (0.5), and large (0.8). p-values under 0.001 are significant, which are marked as *. Targets for test are Young and Old. Attributes are Career/Family, Pleasant/Unpleasant, Likable/Unlikable, and Competent/Incompetent.
| DeepFace | DeepID | VGGFace | FaceNet | OpenFace | ArcFace | ||
|---|---|---|---|---|---|---|---|
| Career/Family | Young/Old | −0.055 | −0.376 | 0.344 * | −0.166 | 0.993 | −0.416 |
| Pleasant/Unpleasant | 0.062 | −0.036 | 1.406 * | 0.137 | 0.551 * | −0.260 | |
| Likable/Unlikable | 0.066 | 0.290 * | 1.222 * | 0.000 | 0.431 * | 0.509 * | |
| Competent/Incompetent | −0.021 | −0.001 | 1.046 * | 0.031 | 0.225 * | −0.477 |
Table 5.
The results for FEAT on intersectional bias that measures stereotypes toward Asian females. Each cell represents the effect size, which indicates the magnitude of bias as small (0.2), medium (0.5), and large (0.8). p-values under 0.001 are significant, which are marked as *. Targets are European American Female, African American Female, and Asian American Female. All target pairs are tested with a single attribute pair, Competent and Incompetent.
| DeepFace | DeepID | VGGFace | FaceNet | OpenFace | ArcFace | ||
|---|---|---|---|---|---|---|---|
| Competent/Incompetent | EUF/AFF | −0.017 | 0.465 * | −1.007 | 0.748 * | −0.095 | 0.358 * |
| EUF/ASF | 0.007 | −0.172 | 0.029 | 0.165 * | −0.237 | 0.354 * | |
| AFF/ASF | 0.072 | 0.018 | 1.424 * | 0.451 * | 0.453* | −0.367 |
Table 6.
The results for race sensitivity analysis with FEAT on race transformation by varying the racial features in each image. Each cell represents the effect size, which indicates the magnitude of bias as small (0.2), medium (0.5), and large (0.8). p-values under 0.001 are significant, which are marked as *. Targets for test are EU and AF. Attributes are Career/Family, Pleasant/Unpleasant, Likable/Unlikable, and Competent/Incompetent.
| Race Transformation | Attribute | DeepFace | DeepID | VGGFace | FaceNet | OpenFace | ArcFace |
|---|---|---|---|---|---|---|---|
| 25% | Career/Family | 0.598 * | 0.470 * | 0.354 * | 0.419 * | 0.657 * | 0.523 * |
| Pleasant/Unpleasant | 0.438 * | 0.314 * | 1.723 * | 0.720 * | 0.267 * | 0.901 * | |
| Likable/Unlikable | 0.796 * | 0.202 * | 1.414 * | 0.607 * | 0.756 * | 0.077 | |
| Competent/Incompetent | 0.957 * | 0.717 * | 1.420 * | 0.645 * | 1.306 * | 0.657 * | |
| 50% | Career/Family | −0.007 | −0.560 | −0.689 | −0.770 | −0.281 | −0.443 |
| Pleasant/Unpleasant | −0.029 | −0.409 | 1.591 * | −0.754 | −0.510 | 0.201 * | |
| Likable/Unlikable | 0.008 | −0.961 | 0.834 * | −0.729 | −0.378 | −0.951 | |
| Competent/Incompetent | −0.095 | −0.624 | 0.817 * | −0.716 | 0.308 * | −0.501 | |
| 75% | Career/Family | −0.768 | −1.226 | −1.362 | −1.467 | −1.134 | −1.089 |
| Pleasant/Unpleasant | −0.653 | −0.888 | 1.324 * | −1.547 | −1.188 | −0.475 | |
| Likable/Unlikable | −1.018 | −1.515 | −0.387 | −1.490 | −1.318 | −1.375 | |
| Competent/Incompetent | −1.170 | −1.439 | −0.549 | −1.509 | −1.036 | −1.278 | |
| 100% | Career/Family | −1.112 | −1.538 | −1.586 | −1.725 | −1.490 | −1.382 |
| Pleasant/Unpleasant | −0.999 | −1.200 | 0.761 * | −1.785 | −1.493 | −0.884 | |
| Likable/Unlikable | −1.448 | −1.733 | −1.102 | −1.745 | −1.619 | −1.593 | |
| Competent/Incompetent | −1.536 | −1.697 | −1.046 | −1.755 | −1.493 | −1.628 |
Publisher’s Note: MDPI stays neutral with regard to jurisdictional claims in published maps and institutional affiliations. |
© 2022 by the authors. Licensee MDPI, Basel, Switzerland. This article is an open access article distributed under the terms and conditions of the Creative Commons Attribution (CC BY) license (https://creativecommons.org/licenses/by/4.0/).
Share and Cite
MDPI and ACS Style
Lee, S.; Oh, S.; Kim, M.; Park, E. Measuring Embedded Human-Like Biases in Face Recognition Models . Comput. Sci. Math. Forum 2022, 3, 2. https://doi.org/10.3390/cmsf2022003002
AMA Style
Lee S, Oh S, Kim M, Park E. Measuring Embedded Human-Like Biases in Face Recognition Models . Computer Sciences & Mathematics Forum. 2022; 3(1):2. https://doi.org/10.3390/cmsf2022003002
Chicago/Turabian StyleLee, SangEun, Soyoung Oh, Minji Kim, and Eunil Park. 2022. "Measuring Embedded Human-Like Biases in Face Recognition Models " Computer Sciences & Mathematics Forum 3, no. 1: 2. https://doi.org/10.3390/cmsf2022003002