
Linking Powder Properties, Printing Parameters, Post-Processing Methods, and Fatigue Properties in Additive Manufacturing of AlSi10Mg


Abstract
:1. Introduction
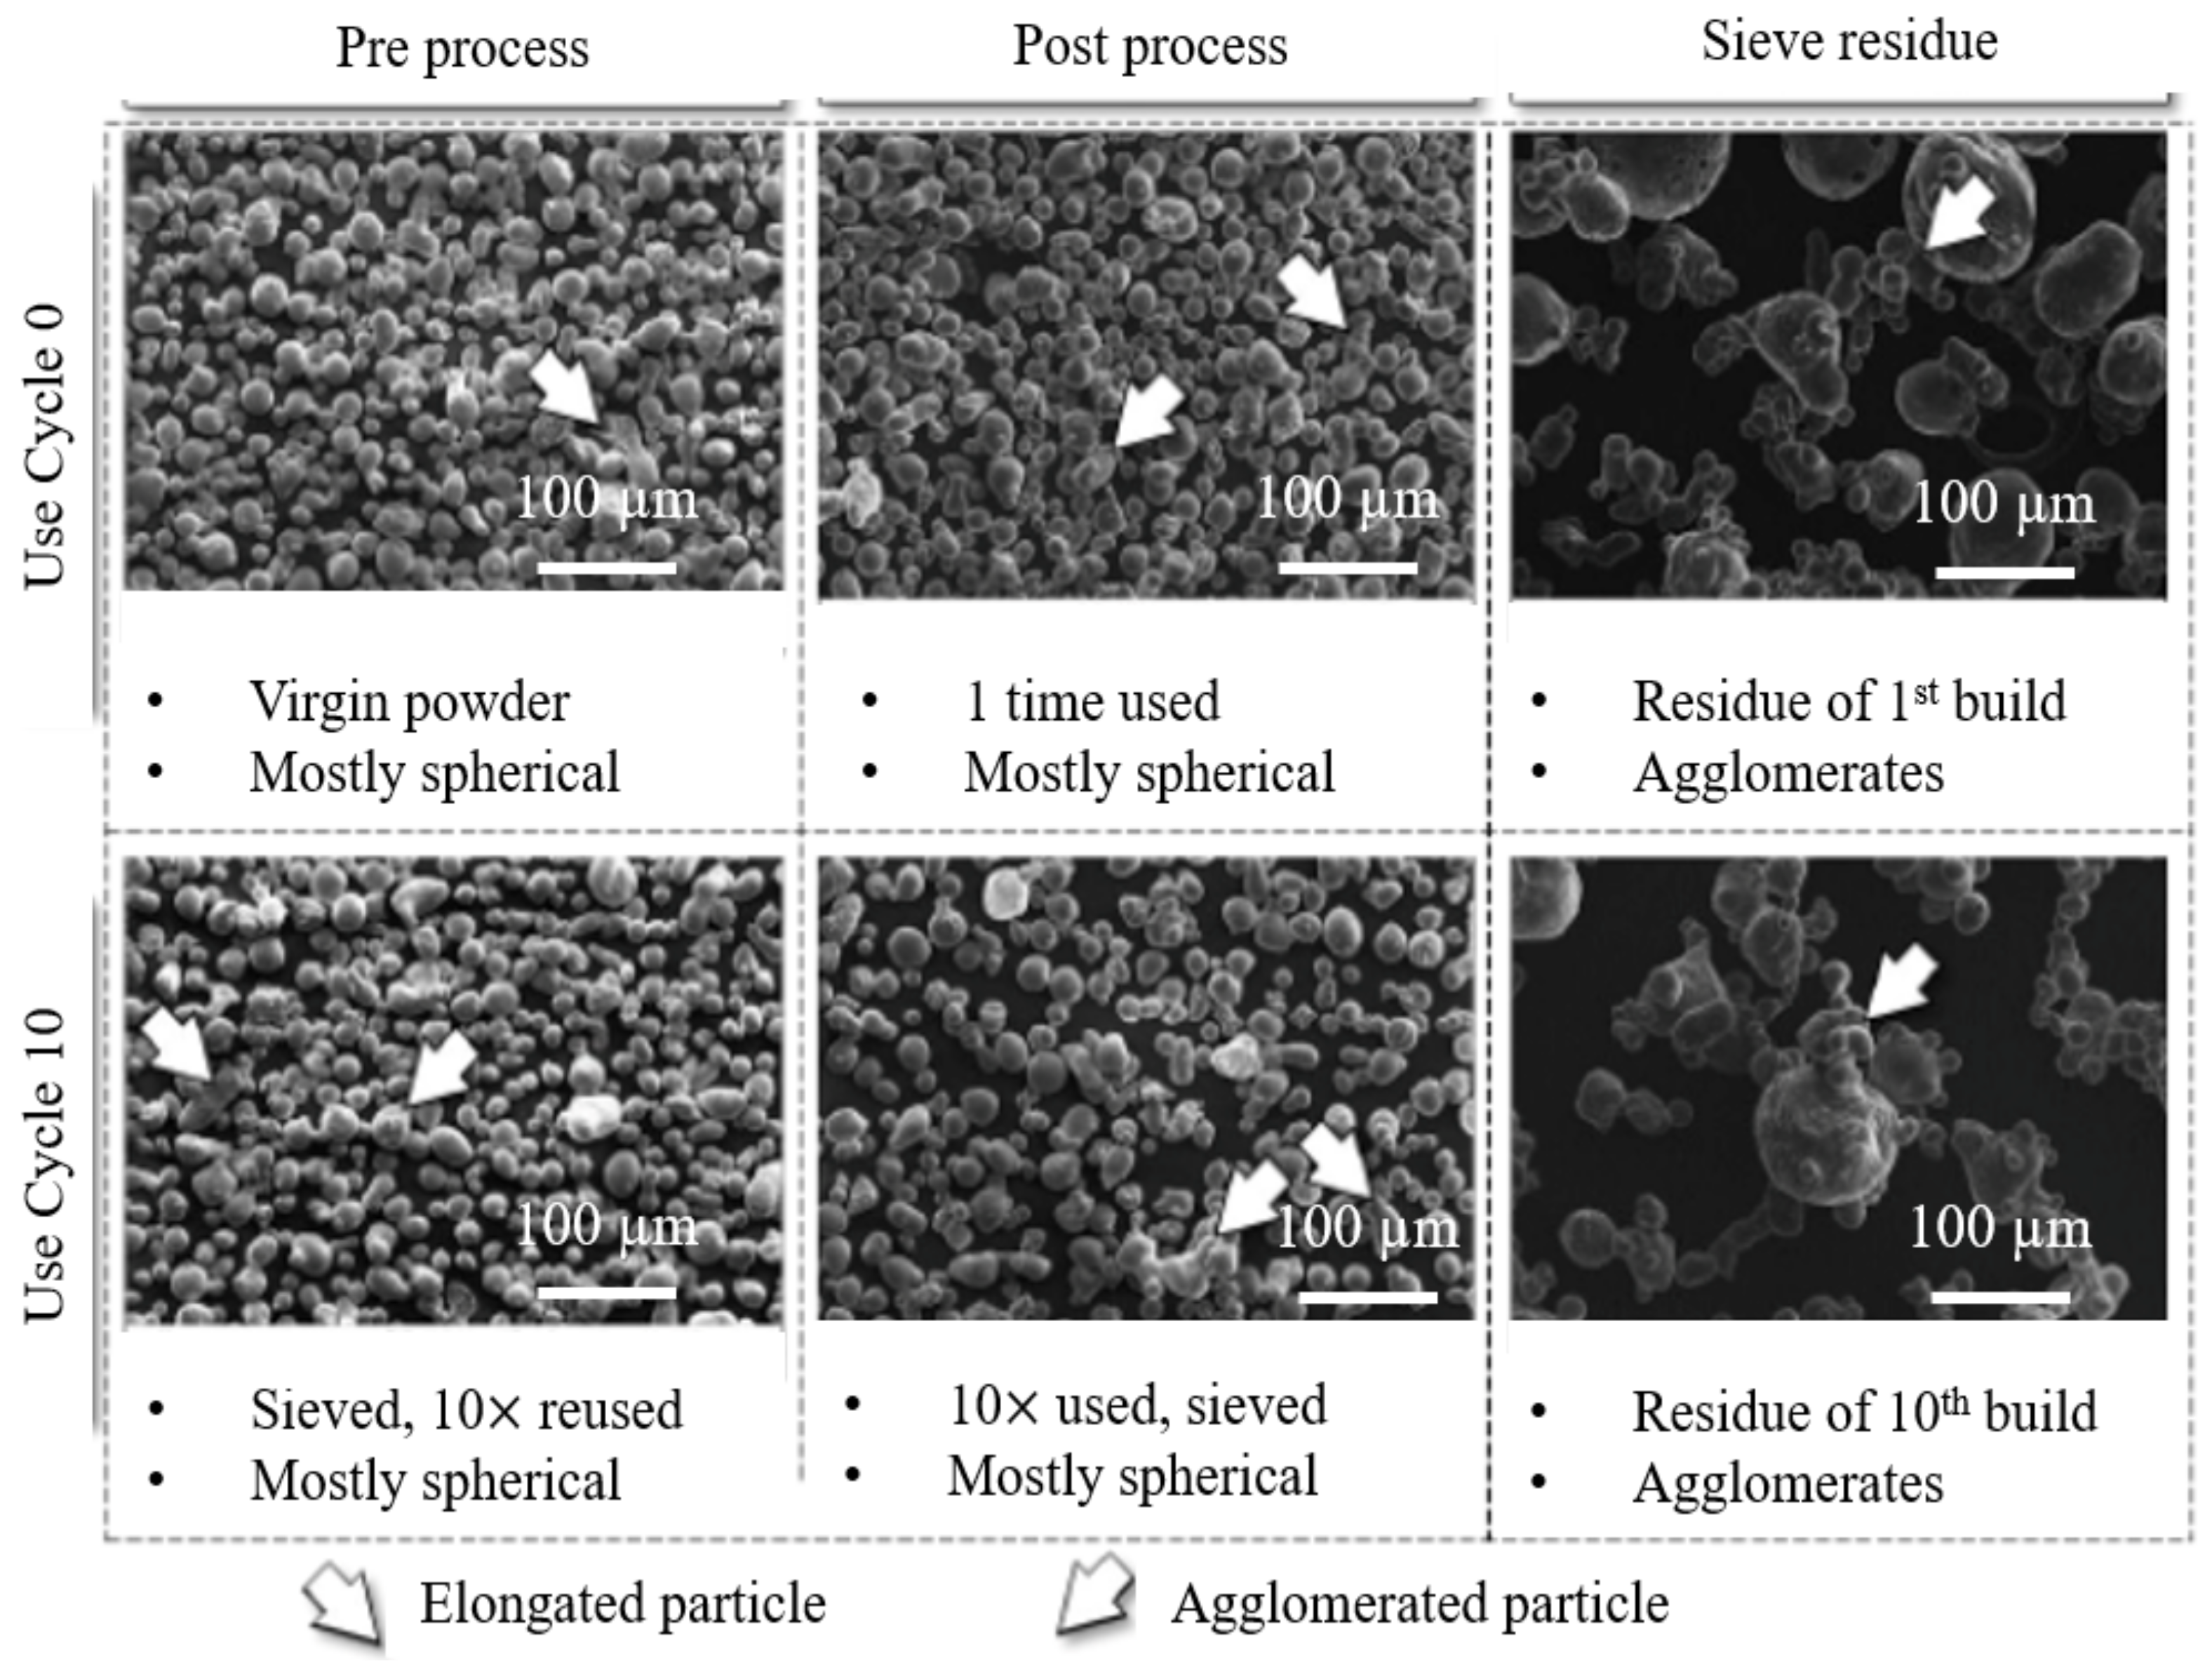
2. Feedstock Properties
- Basic Flow Energy (BFE): The required flow resistance energy during the anticlockwise rotation of the bulldozing blade down through the powder bed.
- Specific Energy (SE): The blade energy required to move upward through the powder bed.
- Aeration Energy (AE): The blade rotation resistance energy required to move through the aerated powder bed base.
- Consolidation Flow Energy (CFE): The energy needed to overcome the resistance of blade rotation in the powder consolidated by controlled tapping.
- Conditioned Bulk Density (CBD): The bulk density of powders in natural state.
- Compressibility Index (CI): The ratio of the compressed powder density to the conditioned bulk density.
- Cohesion Stress (CS): The shear stress that initiates powder flow.

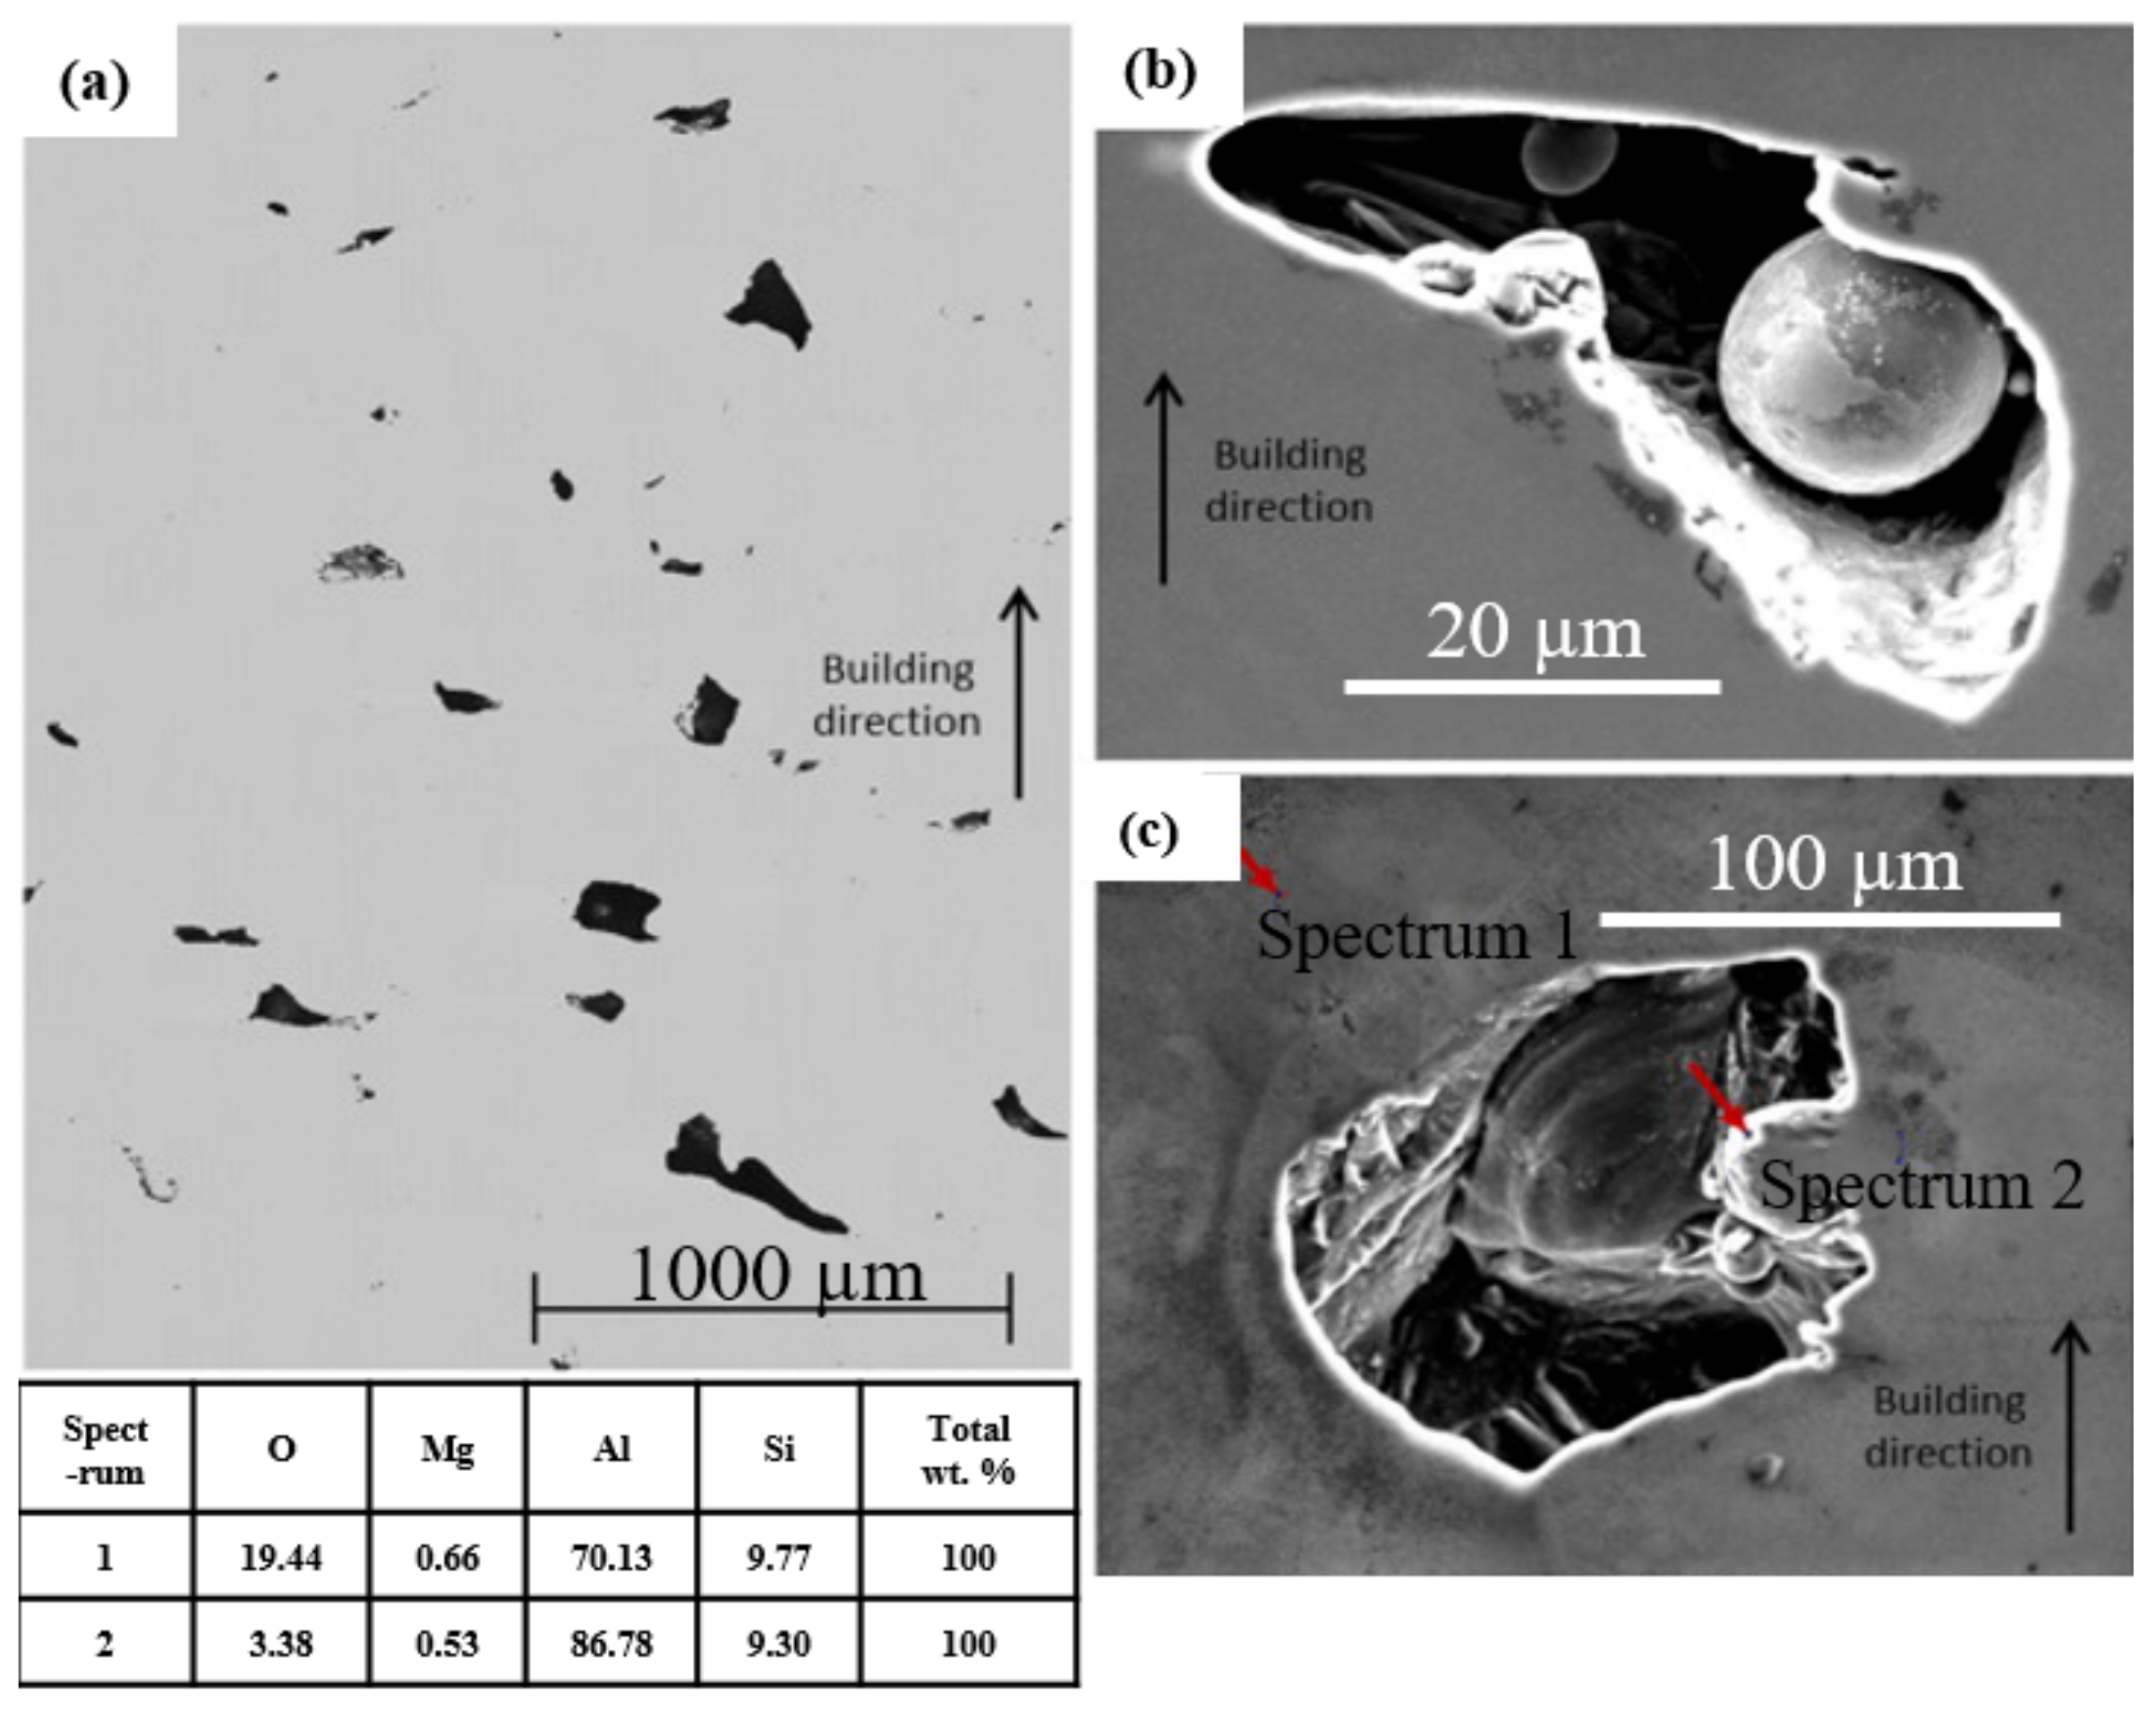
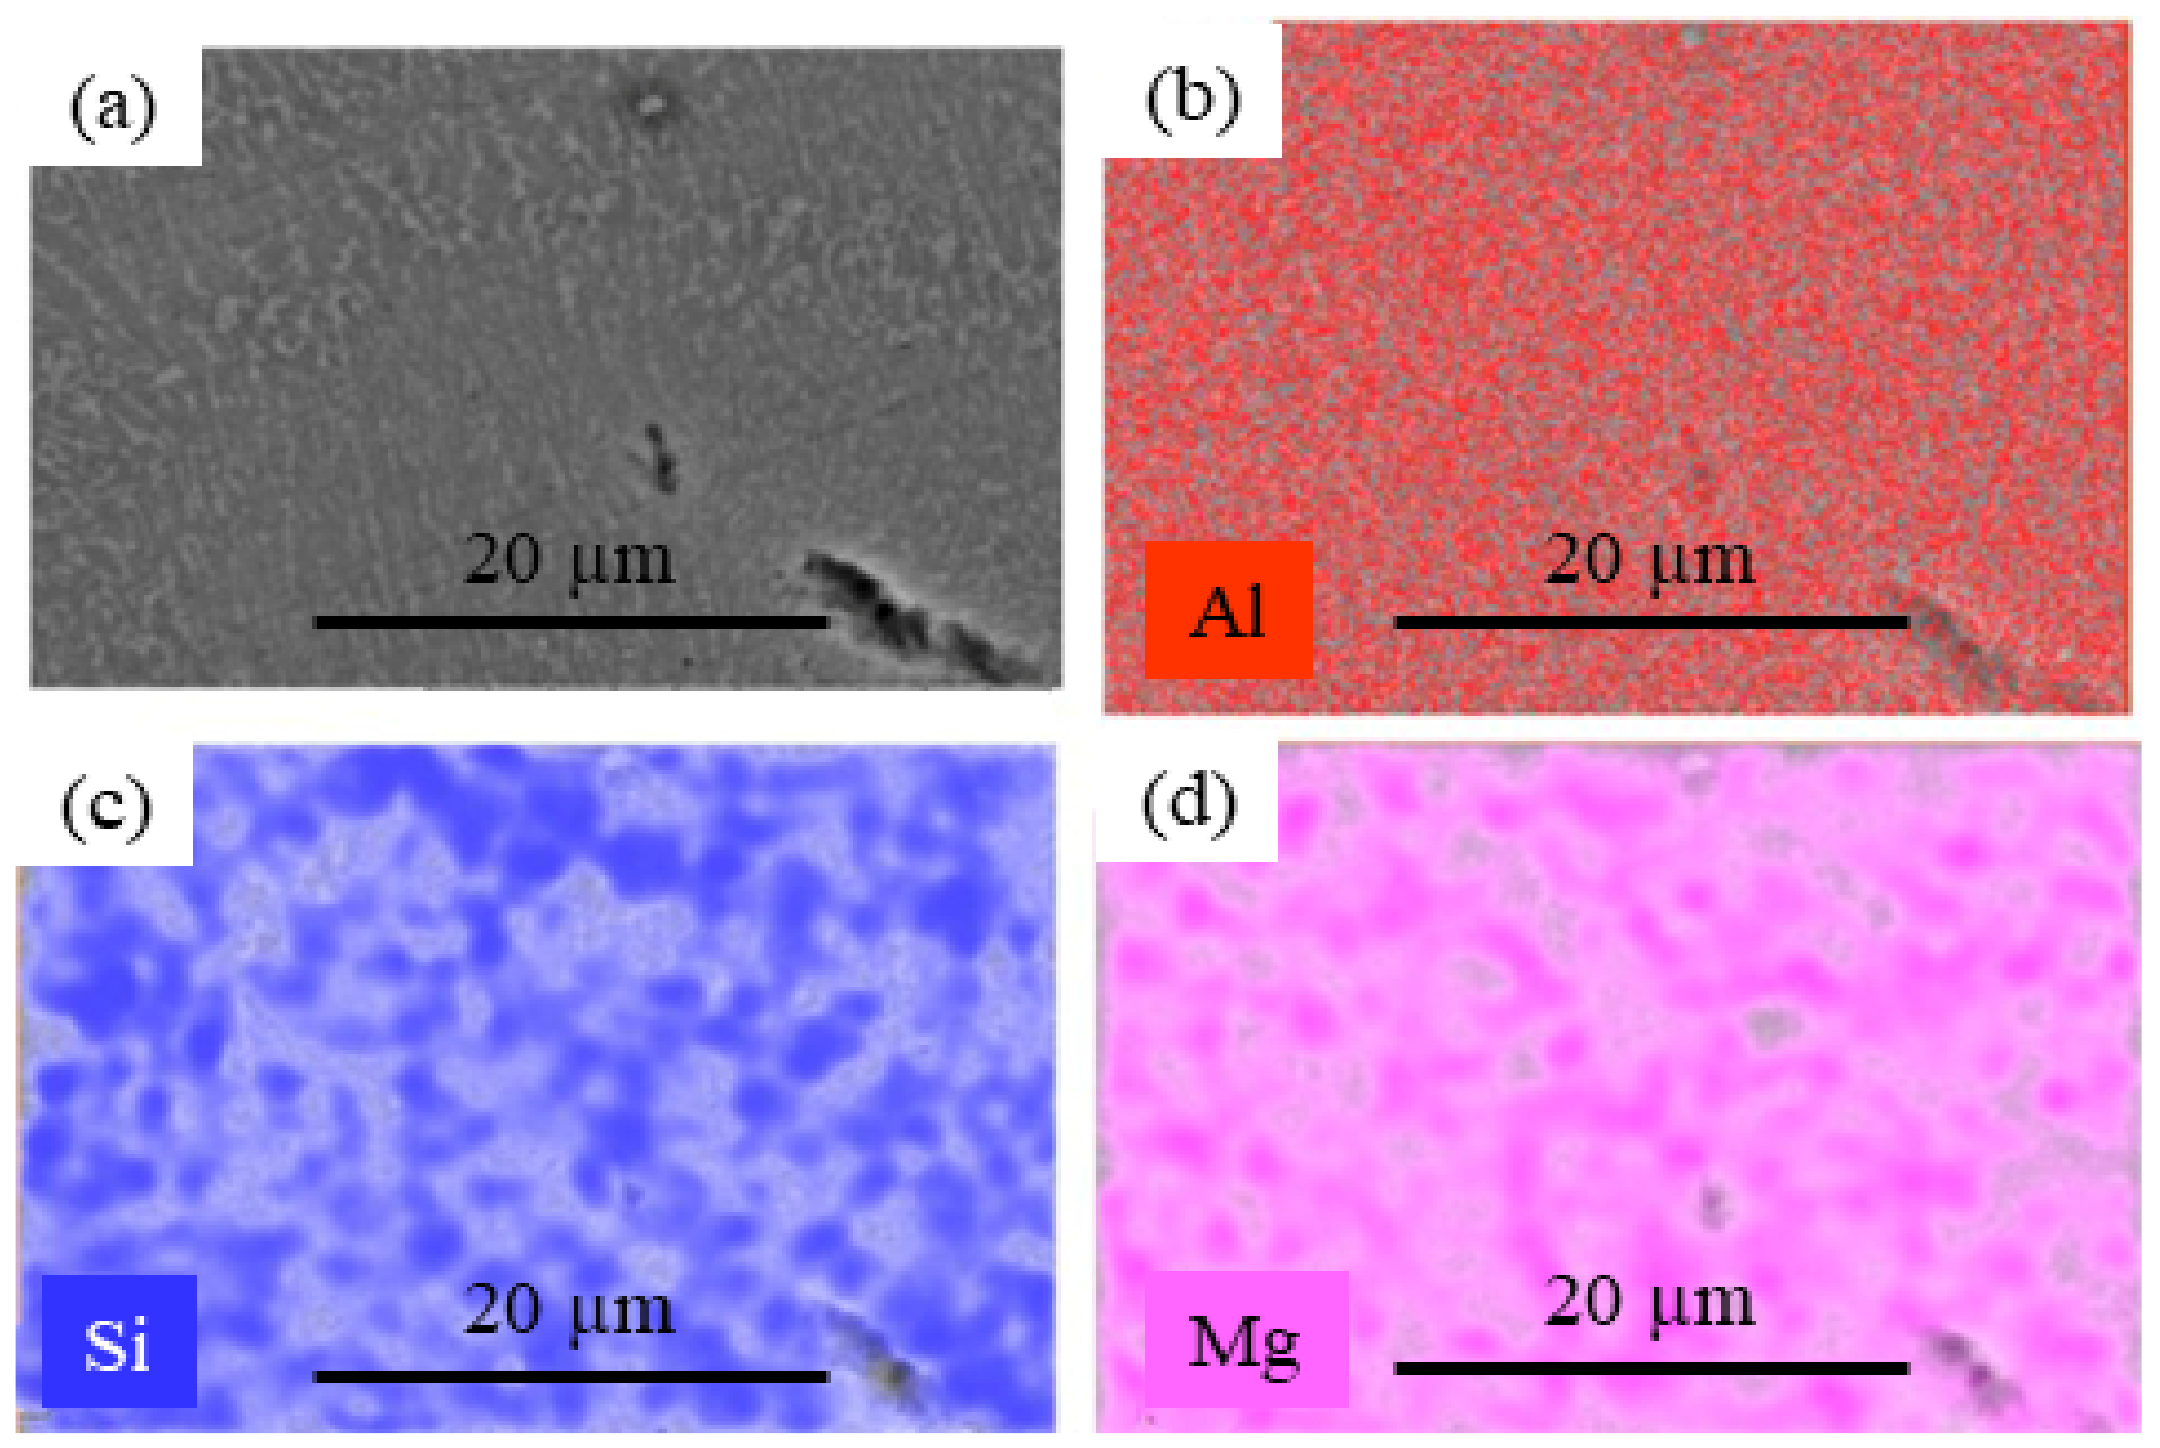
3. Deposit Characteristics
4. Fatigue Properties
4.1. Effect of Powder Reuse
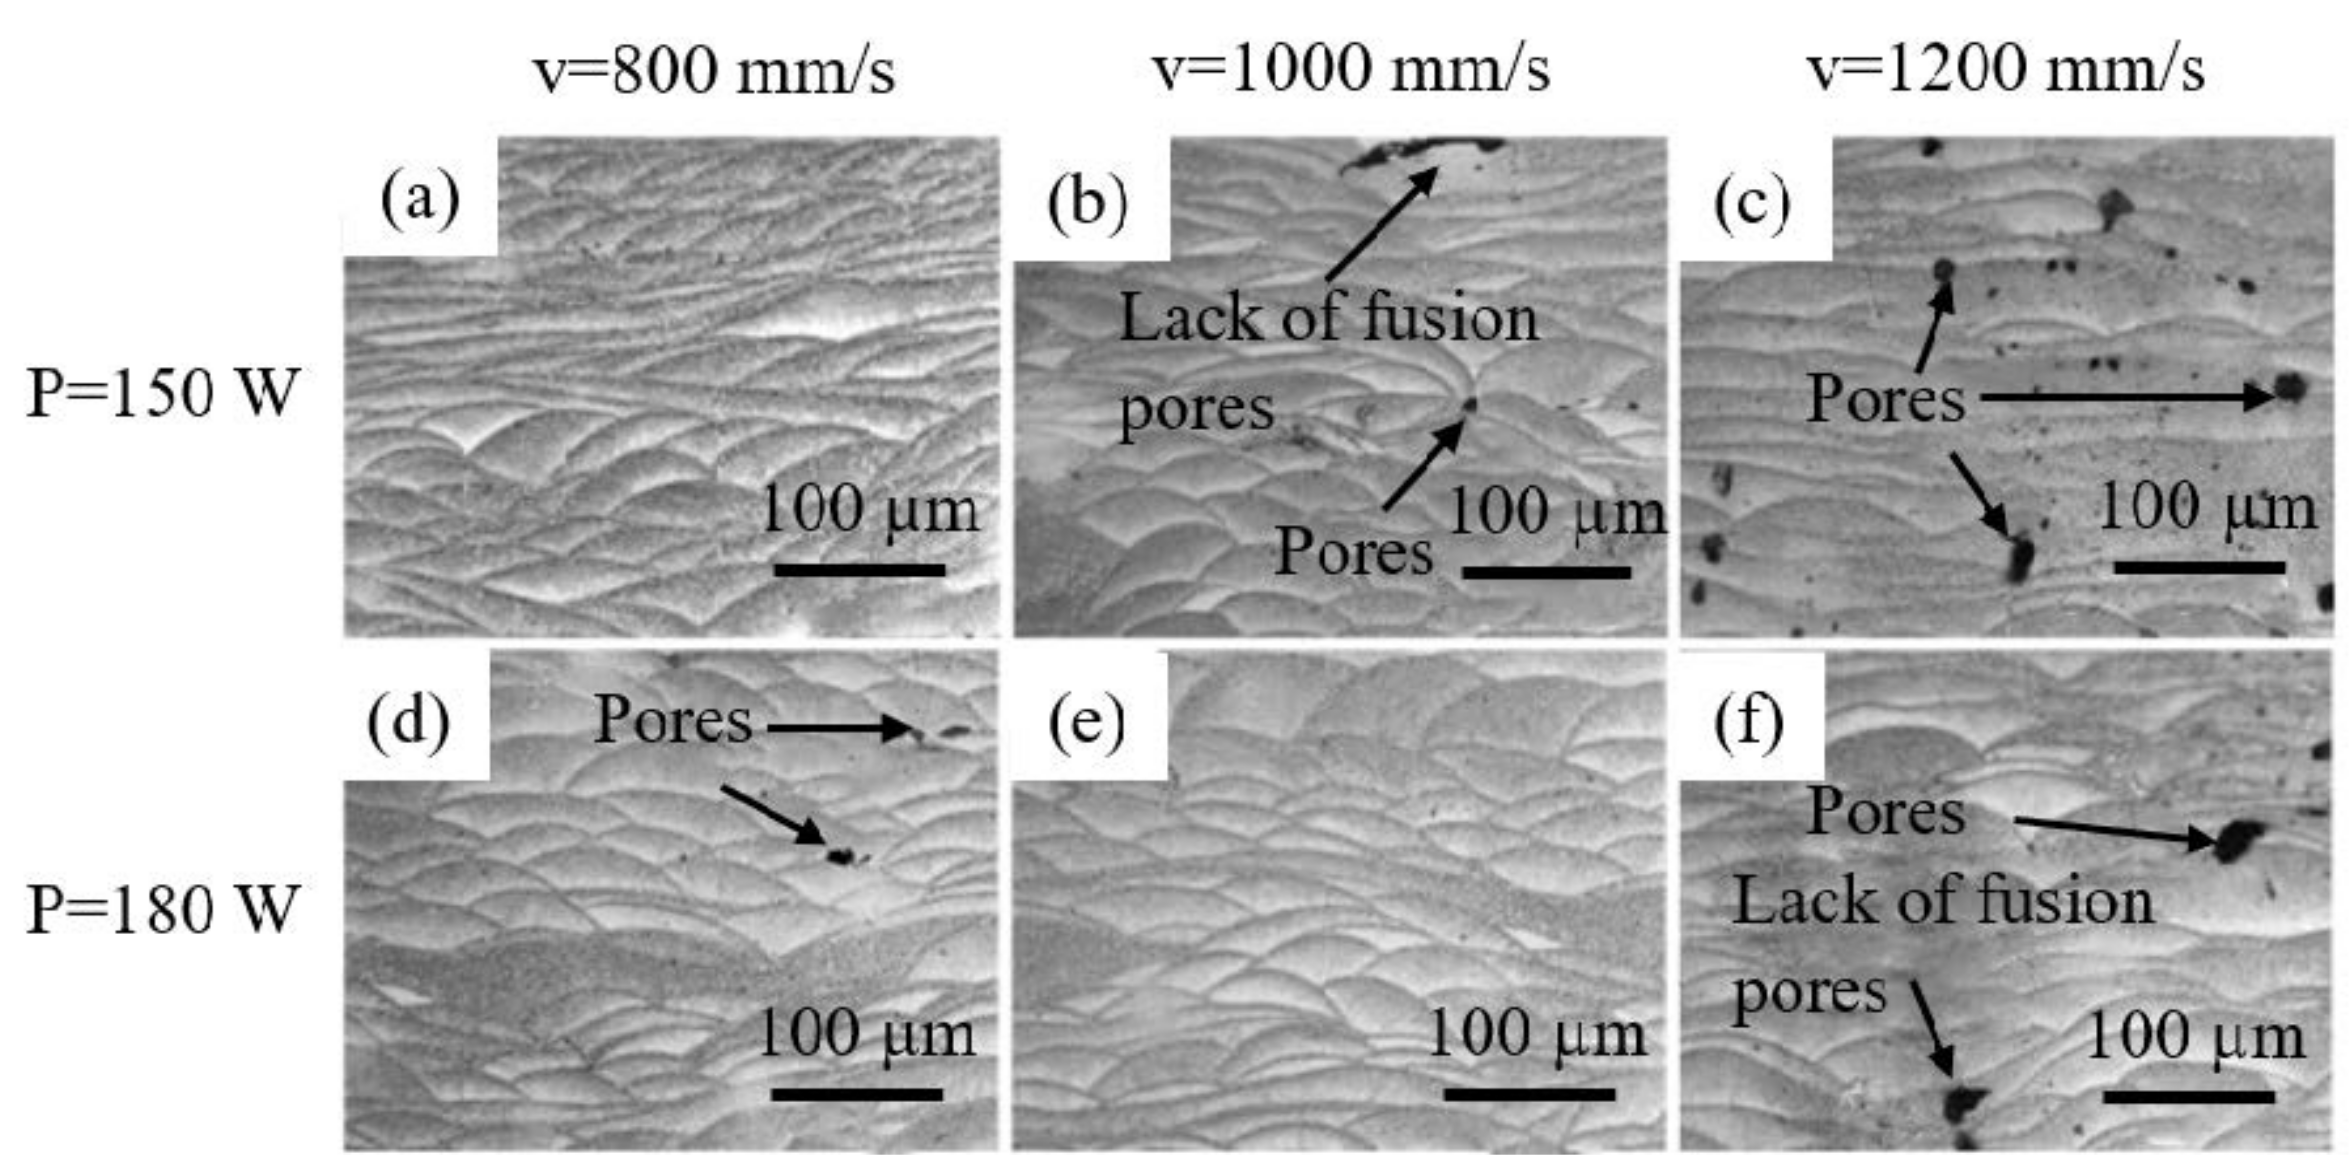
4.2. Effect of Porosity
4.3. Effect of Printing Parameters and Build Direction
4.4. Effect of Heat Treatment and Surface Treatment

| Literature | Heat Treatment | Printing Parameters | Fatigue Strength at 106 Cycles | |||||
|---|---|---|---|---|---|---|---|---|
| Type | Spot Size | Power | Scan Speed | Layer Thickness | Build Direction | |||
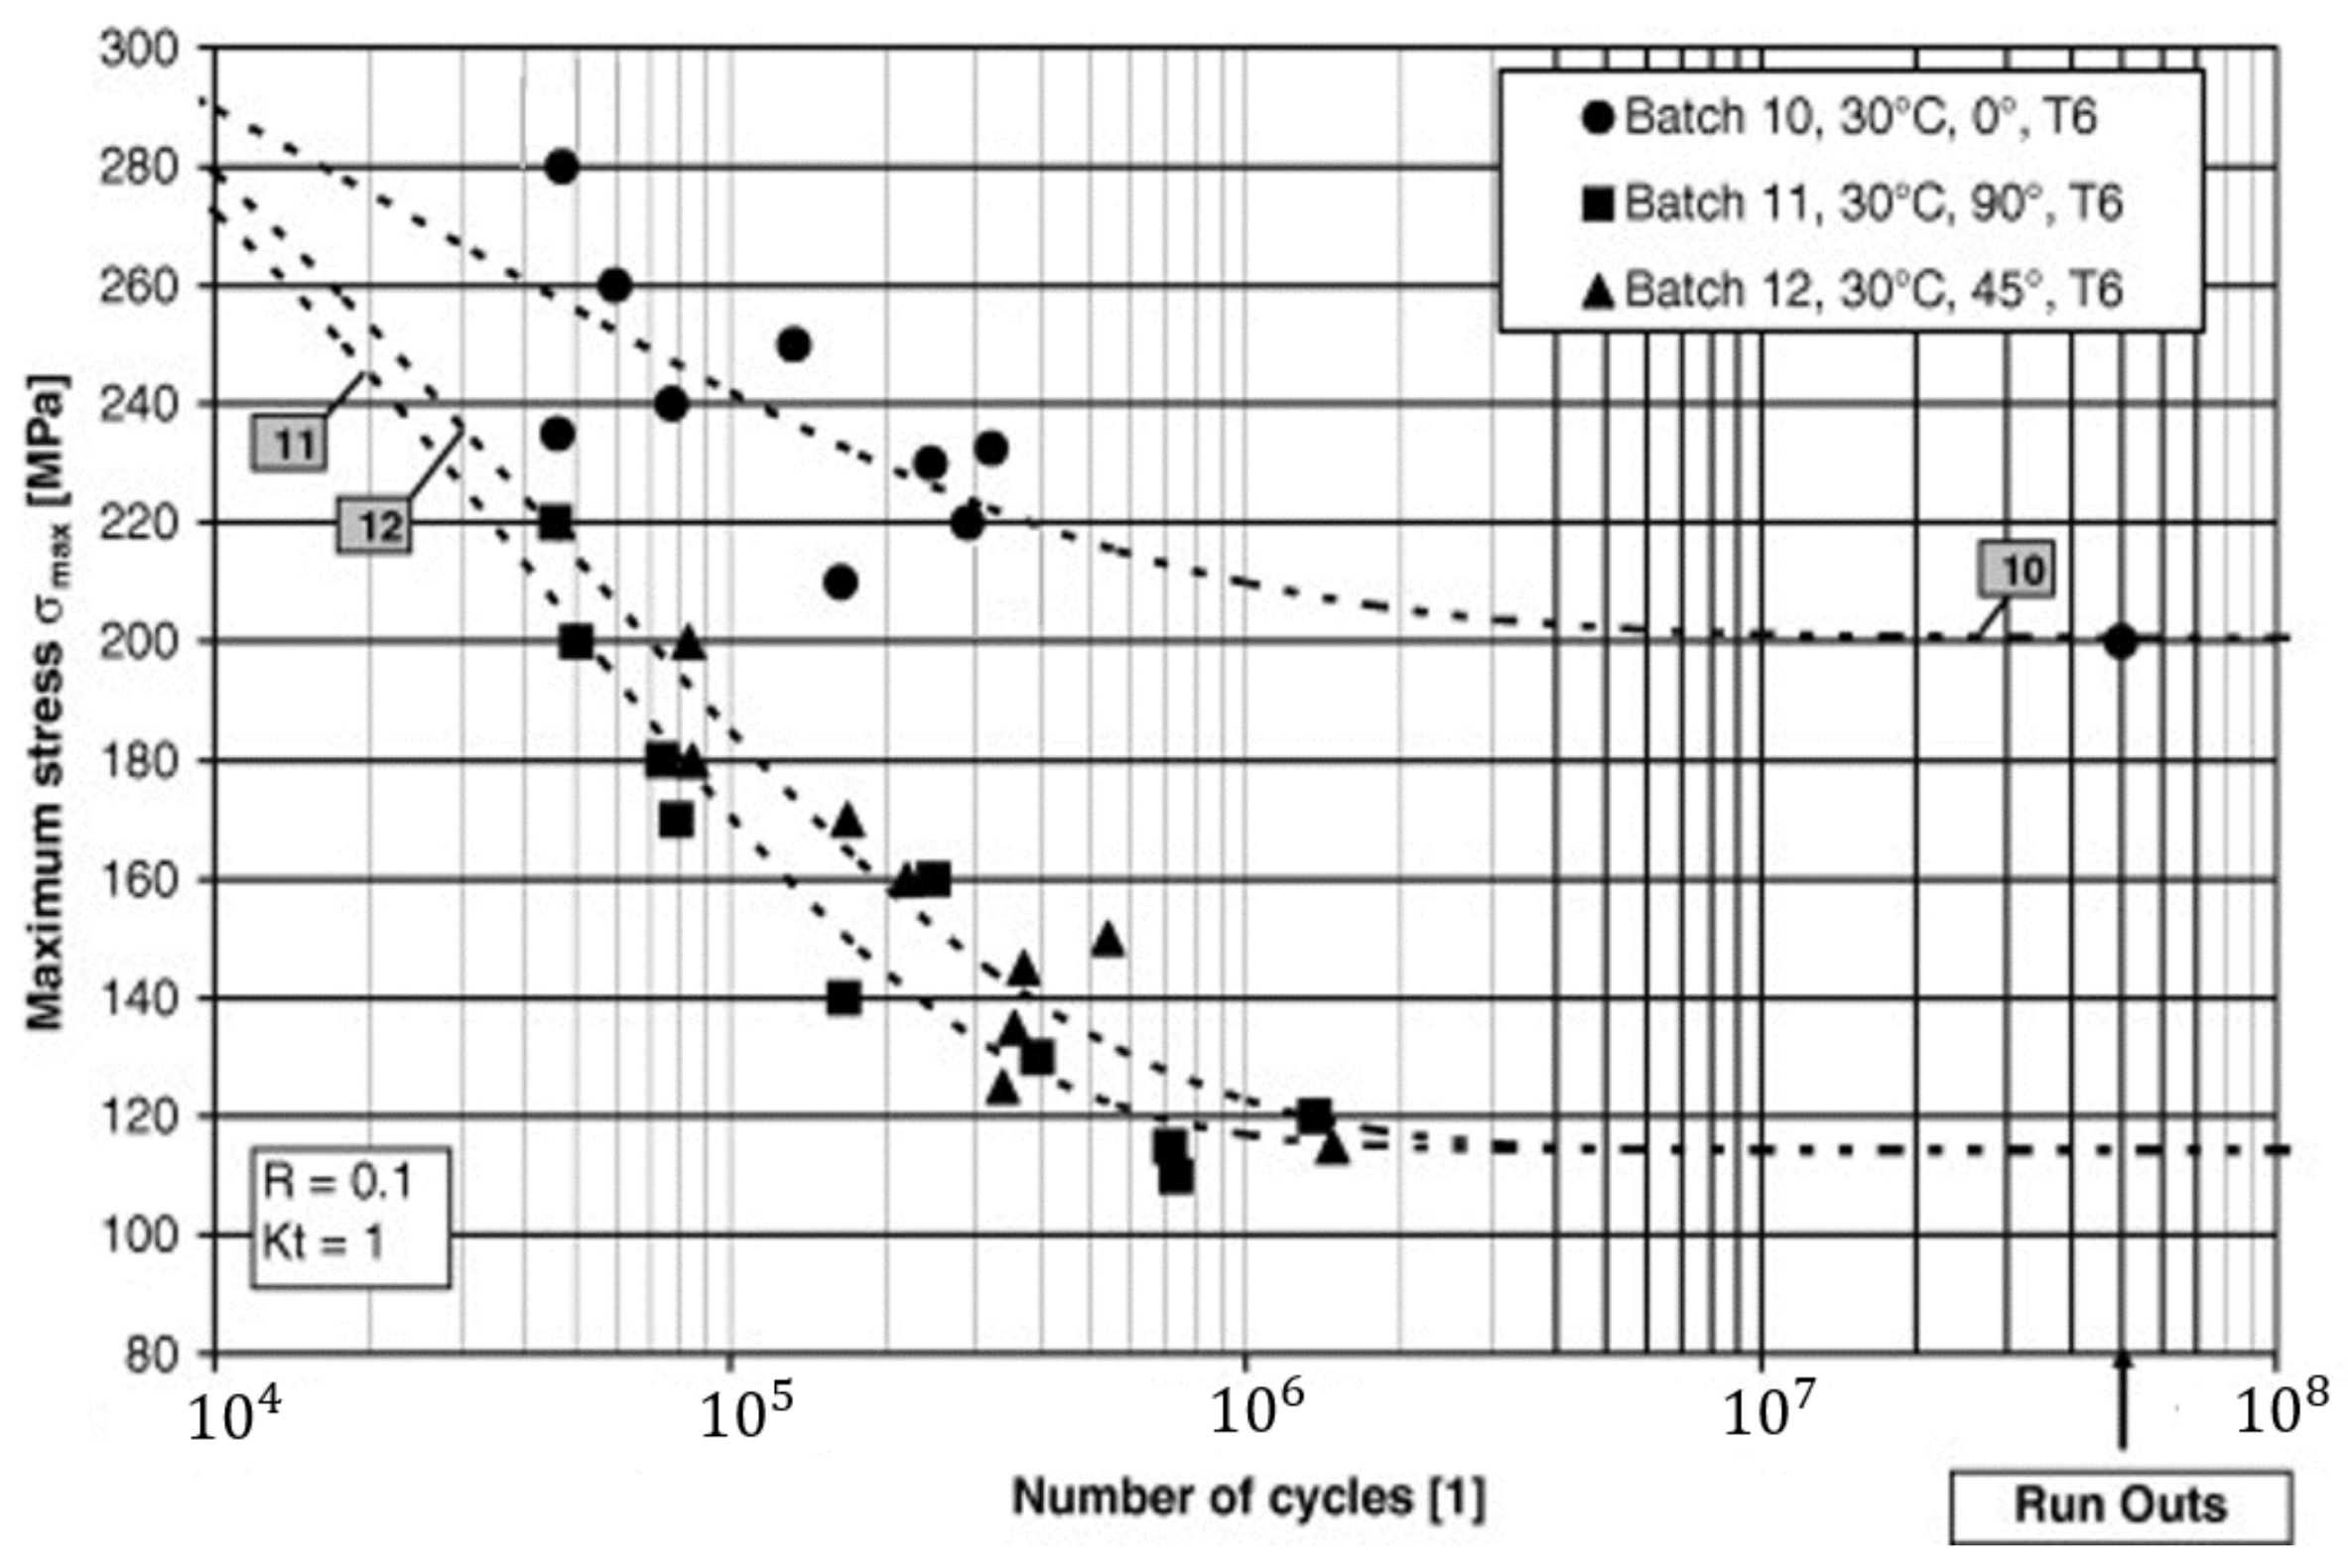
| Brandl et al. [15] | No | Nd:YAG laser, Trumpf TrumaForm LF130 powder-bed | 0.2 mm | 250 W | 500 mm/s | 50 µm | 0° (Platform temp. 300 °C) | 100–120 MPa |
| 45° (Platform temp. 300 °C) | 100 MPa | |||||||
| 90° (Platform temp. 300 °C) | 100 MPa | |||||||
| Yes | 0° (Platform temp. 30 °C) | 210 MPa | ||||||
| 45° (Platform temp. 30 °C) | 120 MPa | |||||||
| 90° (Platform temp. 30 °C) | 120 MPa | |||||||
| 0° (Platform temp. 300 °C) | 160 MPa | |||||||
| 45° (Platform temp. 300 °C) | 160 MPa | |||||||
| 90° (Platform temp. 300 °C) | 160 MPa | |||||||
| Maskery et al. [97] | No | Renishaw AM250 machine | 68 µm | 200 W | 571 mm/s | 25 µm | 90° | 85 MPa |
| Yes | 134 MPa | |||||||
| Aboulkhair et al. [32] | No | Renishaw AM250 machine | 68 µm | 200 W | 571 mm/s | 25 µm | 90° | 65 MPa |
| Yes | 130 MPa | |||||||
| Bagherifard et al. [33] | No | Renishaw AM250 machine | 78 µm | 350 W | 1150 mm/s | 78 µm | 90° | 50 MPa |
| Yes | 75 MPa | |||||||
| Re et al. [67] | Yes | EOSINT M280 system | 100 µm | 400 W | - | - | 0° | 188 MPa |
| 45° | 177 MPa | |||||||
| 90° | 177 MPa | |||||||
| 0° (3 times reused powder) | 172 MPa | |||||||
| 0° (8 times reused powder) | 188 MPa | |||||||
4.5. Impact of Loading Conditions
4.6. Impact of Notch
5. In-Situ Fatigue Testing
6. Computation Modeling to Predict Fatigue Failure Characteristics
7. Conclusions and Future Research Opportunities
Author Contributions
Funding
Data Availability Statement
Conflicts of Interest
Abbreviations
| AE | Aeration Energy |
| ASTM | American Society for Testing and Materials |
| AM | Additive Manufacturing |
| BFE | Basic Flow Energy |
| BJ | Binder Jetting |
| CBD | Conditioned Bulked Density |
| CFE | Consolidation Flow Energy |
| CI | Compressibility Index |
| CPFEM | Crystal Plasticity Finite Element Modeling |
| CS | Cohesion Stress |
| CT | Computed Tomography |
| DED | Directed Energy Deposition |
| EB-PBF | Electron Beam Powder Bed Fusion |
| EDS, EDX | Energy Dispersive X-ray Spectroscopy |
| FESEM | Field Emission Scanning Electron Microscope |
| HP | High Pressure |
| HIP | Hot Isostatic Pressing |
| HCF | High Cycle Fatigue |
| HT | Heat Treated |
| LCF | Low cycle Fatigue |
| L-DED | Laser Directed Energy Deposition |
| L-PBF | Laser Powder Bed Fusion |
| OM | Optical Microscopy |
| PBF | Powder Bed Fusion |
| SEM | Scanning Electron Microscopy |
| SE | Specific Energy |
| SP | Shot Peening |
| XRD | X-Ray Diffraction |
References
- Raus, A.A.; Wahab, M.S.; Ibrahim, M.; Kamarudin, K.; Ahmed, A.; Shamsudin, S. Mechanical and physical properties of AlSi10Mg processed through selective laser melting. AIP Conf. Proc. 2017, 1831, 020027. [Google Scholar] [CrossRef]
- Heraeus Additive Manufacturing GmbH. Metal Powder AlSi10Mg; Heraeus Additive Manufacturing GmbH: Hanau, Hessen, Germany, 2019; pp. 1–2. [Google Scholar]
- EOS Aluminium AlSi10Mg Material Data Sheet EOS Aluminium AlSi10Mg Good Strength & Dynamic Load Bearing Capacity. Available online: https://www.eos.info/03_system-related-assets/material-related-contents/metal-materials-and-examples/metal-material-datasheet/aluminium/material_datasheet_eos_aluminium-alsi10mg_en_web.pdf (accessed on 18 January 2022).
- Zyguła, K.; Nosek, B.; Pasiowiec, H.; Szysiak, N. Mechanical properties and microstructure of AlSi10Mg alloy obtained by casting and SLM technique. World Sci. News 2018, 104, 456–466. [Google Scholar]
- ISO. Standard Terminology for Additive Manufacturing—General Principles—Terminology; International Organization for Standardization: Geneva, Switzerland, 2015. [Google Scholar]
- Frazier, W.E. Metal additive manufacturing: A review. J. Mater. Eng. Perform. 2014, 23, 1917–1928. [Google Scholar] [CrossRef]
- Gibson, I.; Rosen, D.; Stucker, B. Directed Energy Deposition Processes. In Additive Manufacturing Technologies; Springer: New York, NY, USA, 2015; pp. 1–509. [Google Scholar]
- Sun, S.; Brandt, M.; Easton, M. Powder Bed Fusion Processes: An Overview; Elsevier Ltd.: Amsterdam, The Netherlands, 2017; pp. 55–77. [Google Scholar] [CrossRef]
- Poncelet, O.; Marteleur, M.; van der Rest, C.; Rigo, O.; Adrien, J.; Dancette, S.; Jacques, P.J.; Simar, A. Critical assessment of the impact of process parameters on vertical roughness and hardness of thin walls of AlSi10Mg processed by laser powder bed fusion. Addit. Manuf. 2021, 38, 101801. [Google Scholar] [CrossRef]
- Gouveia, R.M.; Silva, F.J.G.; Atzeni, E.; Sormaz, D.; Alves, J.L.; Pereira, A.B. Effect of Scan Strategies and Use of Support Structures on Surface Quality and Hardness of L-PBF AlSi10Mg Parts. Materials 2020, 13, 2248. [Google Scholar] [CrossRef]
- Rafieazad, M.; Fathi, P.; Mohammadi, M.; Nasiri, A. Effects of Laser-Powder Bed Fusion Process Parameters on the Microstructure and Corrosion Properties of AlSi10Mg Alloy. J. Electrochem. Soc. 2021, 168, 021505. [Google Scholar] [CrossRef]
- Zavala-Arredondo, M.; London, T.; Allen, M.; Maccio, T.; Ward, S.; Griffiths, D.; Allison, A.; Goodwin, P.; Hauser, C. Use of power factor and specific point energy as design parameters in laser powder-bed-fusion (L-PBF) of AlSi10Mg alloy. Mater. Des. 2019, 182, 108018. [Google Scholar] [CrossRef]
- Salmi, A.; Atzeni, E. Residual stress analysis of thin AlSi10Mg parts produced by Laser Powder Bed Fusion. Virtual Phys. Prototyp. 2020, 15, 49–61. [Google Scholar] [CrossRef]
- Salmi, A.; Piscopo, G.; Atzeni, E.; Minetola, P.; Iuliano, L. On the Effect of Part Orientation on Stress Distribution in AlSi10Mg Specimens Fabricated by Laser Powder Bed Fusion (L-PBF). Procedia CIRP 2018, 67, 191–196. [Google Scholar] [CrossRef]
- Brandl, E.; Heckenberger, U.; Holzinger, V.; Buchbinder, D. Additive manufactured AlSi10Mg samples using Selective Laser Melting (SLM): Microstructure, high cycle fatigue, and fracture behavior. Mater. Des. 2012, 34, 159–169. [Google Scholar] [CrossRef]
- Wang, T.; Wang, Y.; Chen, C.; Zhu, H. Relationships between the characteristics of porosity, melt pool and process parameters in laser powder bed fusion AlZn alloy. J. Manuf. Process. 2021, 68, 1236–1244. [Google Scholar] [CrossRef]
- Giovagnoli, M.; Silvi, G.; Merlin, M.; Di Giovanni, M.T. Optimisation of process parameters for an additively manufactured AlSi10Mg alloy: Limitations of the energy density-based approach on porosity and mechanical properties estimation. Mater. Sci. Eng. A 2021, 802, 140613. [Google Scholar] [CrossRef]
- Maurya, N.K.; Srivastava, A.K.; Saxena, A.; Dwivedi, S.P.; Ashraf Ali, M.; Mustafa, J. Experimental investigation on the effect of laser powder bed fusion process variables on dimensional accuracy, surface roughness and cylindricity of the AlSi10Mg alloy component. Proc. Inst. Mech. Eng. Part J. Process Mech. Eng. 2021, 09544089211039046. [Google Scholar] [CrossRef]
- Calignano, F. Investigation of the accuracy and roughness in the laser powder bed fusion process. Virtual Phys. Prototyp. 2018, 13, 97–104. [Google Scholar] [CrossRef]
- Hadadzadeh, A.; Amirkhiz, B.S.; Langelier, B.; Li, J.; Mohammadi, M. Microstructural consistency in the additive manufactured metallic materials: A study on the laser powder bed fusion of AlSi10Mg. Addit. Manuf. 2021, 46, 102166. [Google Scholar] [CrossRef]
- Albu, M.; Krisper, R.; Lammer, J.; Kothleitner, G.; Fiocchi, J.; Bassani, P. Microstructure evolution during in-situ heating of AlSi10Mg alloy powders and additive manufactured parts. Addit. Manuf. 2020, 36, 101605. [Google Scholar] [CrossRef]
- Torino, P. Influence of the Laser Beam Focus on the Mechanical Properties and Microstructure of AlSi10Mg Processed by L-PBF. 2021. Available online: https://webthesis.biblio.polito.it/20200/1/tesi.pdf (accessed on 18 January 2022).
- Silvestri, A.T.; Astarita, A.; Hassanin, A.E.; Manzo, A.; Iannuzzo, U.; Iannuzzo, G.; de Rosa, V.; Acerra, F.; Squillace, A. Assessment of the mechanical properties of AlSi10Mg parts produced through selective laser melting under different conditions. Procedia Manuf. 2020, 47, 1058–1064. [Google Scholar] [CrossRef]
- Park, T.H.; Baek, M.S.; Hyer, H.; Sohn, Y.; Lee, K.A. Effect of direct aging on the microstructure and tensile properties of AlSi10Mg alloy manufactured by selective laser melting process. Mater. Charact. 2021, 176, 111113. [Google Scholar] [CrossRef]
- Ponticelli, G.S.; Giannini, O.; Guarino, S.; Horn, M. An optimal fuzzy decision-making approach for laser powder bed fusion of AlSi10Mg alloy. J. Manuf. Process. 2020, 58, 712–723. [Google Scholar] [CrossRef]
- Kusoglu, I.M.; Gökce, B.; Barcikowski, S. Research trends in laser powder bed fusion of Al alloys within the last decade. Addit. Manuf. 2020, 36, 101489. [Google Scholar] [CrossRef]
- Balbaa, M.A.; Ghasemi, A.; Fereiduni, E.; Elbestawi, M.A.; Jadhav, S.D.; Kruth, J.P. Role of powder particle size on laser powder bed fusion processability of AlSi10mg alloy. Addit. Manuf. 2021, 37, 101630. [Google Scholar] [CrossRef]
- Kumar, M.S.; Javidrad, H.R.; Shanmugam, R.; Ramoni, M.; Adediran, A.A.; Pruncu, C.I. Impact of Print Orientation on Morphological and Mechanical Properties of L-PBF Based AlSi7Mg Parts for Aerospace Applications. Silicon 2021. [Google Scholar] [CrossRef]
- Rafieazad, M.; Mohammadi, M.; Gerlich, A.; Nasiri, A. Enhancing the corrosion properties of additively manufactured AlSi10Mg using friction stir processing. Corros. Sci. 2021, 178, 109073. [Google Scholar] [CrossRef]
- Ghasemi, A.; Fereiduni, E.; Balbaa, M.; Jadhav, S.D.; Elbestawi, M.; Habibi, S. Influence of alloying elements on laser powder bed fusion processability of aluminum: A new insight into the oxidation tendency. Addit. Manuf. 2021, 46, 102145. [Google Scholar] [CrossRef]
- Tang, M. Inclusions, Porosity, and Fatigue of AlSi10Mg Parts Produced by Selective Laser Melting. Ph.D. Dissertation, Carnegie Mellon University, Pittsburgh, PA, USA, 2017; p. 184. [Google Scholar]
- Aboulkhair, N.T.; Maskery, I.; Tuck, C.; Ashcroft, I.; Everitt, N.M. The microstructure and mechanical properties of selectively laser melted AlSi10Mg: The effect of a conventional T6-like heat treatment. Mater. Sci. Eng. A 2016, 667, 139–146. [Google Scholar] [CrossRef]
- Bagherifard, S.; Beretta, N.; Monti, S.; Riccio, M.; Bandini, M.; Guagliano, M. On the fatigue strength enhancement of additive manufactured AlSi10Mg parts by mechanical and thermal post-processing. Mater. Des. 2018, 145, 28–41. [Google Scholar] [CrossRef]
- Hadadzadeh, A.; Baxter, C.; Amirkhiz, B.S.; Mohammadi, M. Strengthening mechanisms in direct metal laser sintered AlSi10Mg: Comparison between virgin and recycled powders. Addit. Manuf. 2018, 23, 108–120. [Google Scholar] [CrossRef]
- Beretta, S.; Gargourimotlagh, M.; Foletti, S.; du Plessis, A.; Riccio, M. Fatigue strength assessment of “as built” AlSi10Mg manufactured by SLM with different build orientations. Int. J. Fatigue 2020, 139, 105737. [Google Scholar] [CrossRef]
- Moghimian, P.; Poirié, T.; Habibnejad-Korayem, M.; Zavala, J.A.; Kroeger, J.; Marion, F.; Larouche, F. Metal powders in additive manufacturing: A review on reusability and recyclability of common titanium, nickel and aluminum alloys. Addit. Manuf. 2021, 43, 102017. [Google Scholar] [CrossRef]
- Brika, S.E.; Letenneur, M.; Dion, C.A.; Brailovski, V. Influence of particle morphology and size distribution on the powder flowability and laser powder bed fusion manufacturability of Ti-6Al-4V alloy. Addit. Manuf. 2020, 31, 100929. [Google Scholar] [CrossRef]
- Zhao, Y.; Cui, Y.; Hasebe, Y.; Bian, H.; Yamanaka, K.; Aoyagi, K.; Hagisawa, T.; Chiba, A. Controlling factors determining flowability of powders for additive manufacturing: A combined experimental and simulation study. Powder Technol. 2021, 393, 482–493. [Google Scholar] [CrossRef]
- Gao, C.F.; Xiao, Z.Y.; Zou, H.P.; Liu, Z.Q.; Jin, C.; Li, S.K.; Zhang, D.T. Characterization of spherical AlSi10Mg powder produced by double-nozzle gas atomization using different parameters. Trans. Nonferrous Met. Soc. China 2019, 29, 374–384. [Google Scholar] [CrossRef]
- Achelis, L.; Uhlenwinkel, V. Characterisation of metal powders generated by a pressure-gas-atomiser. Mater. Sci. Eng. A 2008, 477, 15–20. [Google Scholar] [CrossRef]
- Metz, R.; Machado, C.; Houabes, M.; Pansiot, J.; Elkhatib, M.; Puyanē, R.; Hassanzadeh, M. Nitrogen spray atomization of molten tin metal: Powder morphology characteristics. J. Mater. Process. Technol. 2007, 189, 132–137. [Google Scholar] [CrossRef]
- Aksoy, A.; Ünal, R. Effects of gas pressure and protrusion length of melt delivery tube on powder size and powder morphology of nitrogen gas atomised tin powders. Powder Metall. 2006, 49, 349–354. [Google Scholar] [CrossRef]
- Gang Li, X.; Zhu, Q.; Shu, S.; Zhong Fan, J.; Ming Zhang, S.-m. Fine spherical powder production during gas atomization of pressurized melts through melt nozzles with a small inner diameter. Powder Technol. 2019, 356, 759–768. [Google Scholar] [CrossRef]
- Material Data Sheet SLM Solutions Group Ag. Available online: https://www.slm-solutions.com/fileadmin/Content/Powder/MDS/MDS_Al-Alloy_AlSi10Mg_0221.pdf (accessed on 18 January 2022).
- Riener, K.; Albrecht, N.; Ziegelmeier, S.; Ramakrishnan, R.; Haferkamp, L.; Spierings, A.B.; Leichtfried, G.J. Influence of particle size distribution and morphology on the properties of the powder feedstock as well as of AlSi10Mg parts produced by laser powder bed fusion (LPBF). Addit. Manuf. 2020, 34, 101286. [Google Scholar] [CrossRef]
- Hausner, H.H. Friction Conditions in a Mass of Metal Powder; Technical Report; Polytechnic Institute of Brooklyn, University of California: Los Angeles, CA, USA, 1967. [Google Scholar]
- Chu, F.; Zhang, K.; Shen, H.; Liu, M.; Huang, W.; Zhang, X.; Liang, E.; Zhou, Z.; Lei, L.; Hou, J.; et al. Influence of satellite and agglomeration of powder on the processability of AlSi10Mg powder in Laser Powder Bed Fusion. J. Mater. Res. Technol. 2021, 11, 2059–2073. [Google Scholar] [CrossRef]
- Freeman, R. Measuring the flow properties of consolidated, conditioned and aerated powders—A comparative study using a powder rheometer and a rotational shear cell. Powder Technol. 2007, 174, 25–33. [Google Scholar] [CrossRef]
- Freeman, R.; Fu, X. Characterisation of power bulk, dynamic flow and shear properties in relation to die filling. Powder Metall. 2008, 51, 196–201. [Google Scholar] [CrossRef]
- Forte, G.; Clark, P.J.; Yan, Z.; Stitt, E.H.; Marigo, M. Using a Freeman FT4 rheometer and Electrical Capacitance Tomography to assess powder blending. Powder Technol. 2018, 337, 25–35. [Google Scholar] [CrossRef]
- Weiss, C.; Munk, J.; Haefner, C.L. Investigation Towards AlSi10Mg Powder Recycling Behavior in the LPBF Process and Its Influences on Mechanical Properties. In Solid Freeform Fabrication 2016: Proceedings of the 26th Annual International Solid Freeform Fabrication Symposium—An Additive Manufacturing Conference Reviewed Paper; University of Texas at Austin: Austin, TX, USA, 2016; pp. 2271–2281. [Google Scholar]
- Tradowsky, U.; White, J.; Ward, R.M.; Read, N.; Reimers, W.; Attallah, M.M. Selective laser melting of AlSi10Mg: Influence of post-processing on the microstructural and tensile properties development. Mater. Des. 2016, 105, 212–222. [Google Scholar] [CrossRef]
- Wei, P.; Wei, Z.; Chen, Z.; Du, J.; He, Y.; Li, J.; Zhou, Y. The AlSi10Mg samples produced by selective laser melting: Single track, densification, microstructure and mechanical behavior. Appl. Surf. Sci. 2017, 408, 38–50. [Google Scholar] [CrossRef]
- Dai, D.; Gu, D. Effect of metal vaporization behavior on keyhole-mode surface morphology of selective laser melted composites using different protective atmospheres. Appl. Surf. Sci. 2015, 355, 310–319. [Google Scholar] [CrossRef]
- Yadroitsev, I.; Gusarov, A.; Yadroitsava, I.; Smurov, I. Single track formation in selective laser melting of metal powders. J. Mater. Process. Technol. 2010, 210, 1624–1631. [Google Scholar] [CrossRef]
- Kang, N.; Coddet, P.; Liao, H.; Coddet, C. Macrosegregation mechanism of primary silicon phase in selective laser melting hypereutectic Al - High Si alloy. J. Alloys Compd. 2016, 662, 259–262. [Google Scholar] [CrossRef]
- Kang, N.; Coddet, P.; Dembinski, L.; Liao, H.; Coddet, C. Microstructure and strength analysis of eutectic Al-Si alloy in-situ manufactured using selective laser melting from elemental powder mixture. J. Alloys Compd. 2017, 691, 316–322. [Google Scholar] [CrossRef]
- Zhou, L.; Mehta, A.; Schulz, E.; McWilliams, B.; Cho, K.; Sohn, Y. Microstructure, precipitates and hardness of selectively laser melted AlSi10Mg alloy before and after heat treatment. Mater. Charact. 2018, 143, 5–17. [Google Scholar] [CrossRef]
- Fite, J.; Eswarappa Prameela, S.; Slotwinski, J.A.; Weihs, T.P. Evolution of the microstructure and mechanical properties of additively manufactured AlSi10Mg during room temperature holds and low temperature aging. Addit. Manuf. 2020, 36, 101429. [Google Scholar] [CrossRef]
- Takata, N.; Kodaira, H.; Sekizawa, K.; Suzuki, A.; Kobashi, M. Change in microstructure of selectively laser melted AlSi10Mg alloy with heat treatments. Mater. Sci. Eng. A 2017, 704, 218–228. [Google Scholar] [CrossRef]
- Herzog, D.; Seyda, V.; Wycisk, E.; Emmelmann, C. Additive manufacturing of metals. Acta Mater. 2016, 117, 371–392. [Google Scholar] [CrossRef]
- Thijs, L.; Kempen, K.; Kruth, J.P.; Van Humbeeck, J. Fine-structured aluminium products with controllable texture by selective laser melting of pre-alloyed AlSi10Mg powder. Acta Mater. 2013, 61, 1809–1819. [Google Scholar] [CrossRef]
- Holesinger, T.G.; Carpenter, J.S.; Lienert, T.J.; Patterson, B.M.; Papin, P.A.; Swenson, H.; Cordes, N.L. Characterization of an Aluminum Alloy Hemispherical Shell Fabricated via Direct Metal Laser Melting. JOM 2016, 68, 1000–1011. [Google Scholar] [CrossRef]
- Tocci, M.; Pola, A.; Gelfi, M.; La Vecchia, G.M. Effect of a New High-Pressure Heat Treatment on Additively Manufactured AlSi10Mg Alloy. Metall. Mater. Trans. A Phys. Metall. Mater. Sci. 2020, 51, 4799–4811. [Google Scholar] [CrossRef]
- Simpson, T.W. Why Does My 3D-Printed Part Cost So Much? 2018. Available online: https://www.additivemanufacturing.media/articles/why-does-my-3d-printed-part-cost-so-much (accessed on 18 January 2022).
- Recycled Powder Use Is Cost-Effective for Additive Manufacturing. 2018. Available online: https://www.laserfocusworld.com/industrial-laser-solutions/article/14220902/recycled-powder-use-is-costeffective-for-additive-manufacturing (accessed on 18 January 2022).
- Del Re, F.; Contaldi, V.; Astarita, A.; Palumbo, B.; Squillace, A.; Corrado, P.; Di Petta, P. Statistical approach for assessing the effect of powder reuse on the final quality of AlSi10Mg parts produced by laser powder bed fusion additive manufacturing. Int. J. Adv. Manuf. Technol. 2018, 97, 2231–2240. [Google Scholar] [CrossRef]
- Skallerud, B.; Iveland, T.; Härkegård, G. Fatigue life assessment of aluminum alloys with casting defects. Eng. Fract. Mech. 1993, 44, 857–874. [Google Scholar] [CrossRef]
- Hu, Y.N.; Wu, S.C.; Withers, P.J.; Zhang, J.; Bao, H.Y.; Fu, Y.N.; Kang, G.Z. The effect of manufacturing defects on the fatigue life of selective laser melted Ti-6Al-4V structures. Mater. Des. 2020, 192. [Google Scholar] [CrossRef]
- Sonsino, C.M.; Ziese, J. Fatigue strength and applications of cast aluminium alloys with different degrees of porosity. Int. J. Fatigue 1993, 15, 75–84. [Google Scholar] [CrossRef]
- Ferro, P.; Fabrizi, A.; Berto, F.; Savio, G.; Meneghello, R.; Rosso, S. Defects as a root cause of fatigue weakening of additively manufactured AlSi10Mg components. Theor. Appl. Fract. Mech. 2020, 108, 102611. [Google Scholar] [CrossRef]
- Laursen, C.M.; DeJong, S.A.; Dickens, S.M.; Exil, A.N.; Susan, D.F.; Carroll, J.D. Relationship between ductility and the porosity of additively manufactured AlSi10Mg. Mater. Sci. Eng. A 2020, 795, 139922. [Google Scholar] [CrossRef]
- Susan, D.; Crenshaw, T.; Gearhart, J. The effects of casting porosity on the tensile behavior of investment cast 17-4PH stainless steel. J. Mater. Eng. Perform. 2015, 24, 2917–2924. [Google Scholar] [CrossRef]
- Caceres, C.; Selling, B. Casting defects and the tensile properties of an AlSiMg alloy. Mater. Sci. Eng. A 1996, 220, 109–116. [Google Scholar] [CrossRef]
- Narasimharaju, S.R.; Zeng, W.; See, T.L.; Zhu, Z.; Scott, P.; Jiang, X.; Lou, S. A comprehensive review on laser powder bed fusion of steels: Processing, microstructure, defects and control methods, mechanical properties, current challenges and future trends. J. Manuf. Process. 2022, 75, 375–414. [Google Scholar] [CrossRef]
- Simchi, A. Direct laser sintering of metal powders: Mechanism, kinetics and microstructural features. Mater. Sci. Eng. A 2006, 428, 148–158. [Google Scholar] [CrossRef]
- Calignano, F.; Manfredi, D.; Ambrosio, E.P.; Iuliano, L.; Fino, P. Influence of process parameters on surface roughness of aluminum parts produced by DMLS. Int. J. Adv. Manuf. Technol. 2013, 67, 2743–2751. [Google Scholar] [CrossRef]
- Olakanmi, E.O. Selective laser sintering/melting (SLS/SLM) of pure Al, Al-Mg, and Al-Si powders: Effect of processing conditions and powder properties. J. Mater. Process. Technol. 2013, 213, 1387–1405. [Google Scholar] [CrossRef]
- Brandão, A.D.; Gumpinger, J.; Gschweitl, M.; Seyfert, C.; Hofbauer, P.; Ghidini, T. Fatigue Properties of Additively Manufactured AlSi10Mg-Surface Treatment Effect. Procedia Struct. Integr. 2017, 7, 58–66. [Google Scholar] [CrossRef]
- Tang, M.; Pistorius, P.C. Anisotropic Mechanical Behavior of AlSi10Mg Parts Produced by Selective Laser Melting. JOM 2017, 69, 516–522. [Google Scholar] [CrossRef]
- Zimmermann, M.; Müller, D.; Kirsch, B.; Greco, S.; Aurich, J.C. Analysis of the machinability when milling AlSi10Mg additively manufactured via laser-based powder bed fusion. Int. J. Adv. Manuf. Technol. 2021, 112, 989–1005. [Google Scholar] [CrossRef]
- Beevers, E.; Brandão, A.D.; Gumpinger, J.; Gschweitl, M.; Seyfert, C.; Hofbauer, P.; Rohr, T.; Ghidini, T. Fatigue properties and material characteristics of additively manufactured AlSi10Mg—Effect of the contour parameter on the microstructure, density, residual stress, roughness and mechanical properties. Int. J. Fatigue 2018, 117, 148–162. [Google Scholar] [CrossRef]
- Sujakhu, S.; Castagne, S.; Sakaguchi, M.; Kasvayee, K.A.; Ghassemali, E.; Jarfors, A.E.; Wang, W. On the fatigue damage micromechanisms in Si-solution–strengthened spheroidal graphite cast iron. Fatigue Fract. Eng. Mater. Struct. 2018, 41, 625–641. [Google Scholar] [CrossRef]
- Del Re, F.; Scherillo, F.; Contaldi, V.; Palumbo, B.; Squillace, A.; Corrado, P.; Di Petta, P. Mechanical properties characterisation of AlSi10Mg parts produced by laser powder bed fusion additive manufacturing. Int. J. Mater. Res. 2019, 110, 436–446. [Google Scholar] [CrossRef]
- Rosenthal, I.; Stern, A.; Frage, N. Microstructure and Mechanical Properties of AlSi10Mg Parts Produced by the Laser Beam Additive Manufacturing (AM) Technology. Metallogr. Microstruct. Anal. 2014, 3, 448–453. [Google Scholar] [CrossRef]
- Kempen, K.; Thijs, L.; Van Humbeeck, J.; Kruth, J.P. Mechanical Properties of AlSi10Mg Produced by Selective Laser Melting. Phys. Procedia 2012, 39, 439–446. [Google Scholar] [CrossRef]
- Aboulkhair, N.T.; Maskery, I.; Tuck, C.; Ashcroft, I.; Everitt, N.M. Improving the fatigue behaviour of a selectively laser melted aluminium alloy: Influence of heat treatment and surface quality. Mater. Des. 2016, 104, 174–182. [Google Scholar] [CrossRef]
- Aboulkhair, N.T.; Tuck, C.; Ashcroft, I.; Maskery, I.; Everitt, N.M. On the precipitation hardening of selective laser melted AlSi10Mg. Metall. Mater. Trans. A 2015, 46, 3337–3341. [Google Scholar] [CrossRef]
- Kempf, A.; Hilgenberg, K. Influence of heat treatments on AlSi10Mg specimens manufactured with different laser powder bed fusion machines. Mater. Sci. Eng. A 2021, 818, 141371. [Google Scholar] [CrossRef]
- Kan, W.H.; Nadot, Y.; Foley, M.; Ridosz, L.; Proust, G.; Cairney, J.M. Factors that affect the properties of additively-manufactured AlSi10Mg: Porosity versus microstructure. Addit. Manuf. 2019, 29, 100805. [Google Scholar] [CrossRef]
- Girelli, L.; Tocci, M.; Gelfi, M.; Pola, A. Study of heat treatment parameters for additively manufactured AlSi10Mg in comparison with corresponding cast alloy. Mater. Sci. Eng. A 2019, 739, 317–328. [Google Scholar] [CrossRef]
- Maamoun, A.H.; Elbestawi, M.; Dosbaeva, G.K.; Veldhuis, S.C. Thermal post-processing of AlSi10Mg parts produced by Selective Laser Melting using recycled powder. Addit. Manuf. 2018, 21, 234–247. [Google Scholar] [CrossRef]
- Tammas-Williams, S.; Withers, P.J.; Todd, I.; Prangnell, P.B. Porosity regrowth during heat treatment of hot isostatically pressed additively manufactured titanium components. Scr. Mater. 2016, 122, 72–76. [Google Scholar] [CrossRef]
- Eisaabadi B., G.; Yeom, G.Y.; Tiryakioğlu, M.; Netto, N.; Beygi, R.; Mehrizi, M.Z.; Kim, S.K. The effect of solution treatment time on the microstructure and ductility of naturally-aged A383 alloy die castings. Mater. Sci. Eng. A 2018, 722, 1–7. [Google Scholar] [CrossRef]
- Uzan, N.E.; Shneck, R.; Yeheskel, O.; Frage, N. Fatigue of AlSi10Mg specimens fabricated by additive manufacturing selective laser melting (AM-SLM). Mater. Sci. Eng. A 2017, 704, 229–237. [Google Scholar] [CrossRef]
- Schneller, W.; Leitner, M.; Springer, S.; Grün, F.; Taschauer, M. Effect of hip treatment on microstructure and fatigue strength of selectively laser melted AlSi10Mg. J. Manuf. Mater. Process. 2019, 3, 16. [Google Scholar] [CrossRef]
- Maskery, I.; Aboulkhair, N.T.; Tuck, C.; Wildman, R.D.; Ashcroft, I.A.; Everitt, N.M.; Hague, R.J. Fatigue performance enhancement of selectively laser melted aluminium alloy by heat treatment. In Proceedings of the 26th Annual International Solid Freeform Fabrication Symposium—An Additive Manufacturing Conference, Austin, TX, USA, 10–12 August 2015; pp. 1017–1025. [Google Scholar]
- Majzoobi, G.H.; Azizi, R.; Alavi Nia, A. A three-dimensional simulation of shot peening process using multiple shot impacts. J. Mater. Process. Technol. 2005, 164–165, 1226–1234. [Google Scholar] [CrossRef]
- Maamoun, A.H.; Elbestawi, M.A.; Veldhuis, S.C. Influence of shot peening on alsi10mg parts fabricated by additive manufacturing. J. Manuf. Mater. Process. 2018, 2, 40. [Google Scholar] [CrossRef]
- Maleki, E.; Bagherifard, S.; Razavi, S.M.J.; Riccio, M.; Bandini, M.; du Plessis, A.; Berto, F.; Guagliano, M. Fatigue behaviour of notched laser powder bed fusion AlSi10Mg after thermal and mechanical surface post-processing. Mater. Sci. Eng. A 2022, 829, 142145. [Google Scholar] [CrossRef]
- Leon, A.; Aghion, E. Effect of surface roughness on corrosion fatigue performance of AlSi10Mg alloy produced by Selective Laser Melting (SLM). Mater. Charact. 2017, 131, 188–194. [Google Scholar] [CrossRef]
- Maleki, E.; Bagherifard, S.; Unal, O.; Bandini, M.; Guagliano, M. On the effects of laser shock peening on fatigue behavior of V-notched AlSi10Mg manufactured by laser powder bed fusion. Int. J. Fatigue 2022, 163, 107035. [Google Scholar] [CrossRef]
- Awd, M.; Siddique, S.; Johannsen, J.; Emmelmann, C.; Walther, F. Very high-cycle fatigue properties and microstructural damage mechanisms of selective laser melted AlSi10Mg alloy. Int. J. Fatigue 2019, 124, 55–69. [Google Scholar] [CrossRef]
- Romano, S.; Patriarca, L.; Foletti, S.; Beretta, S. LCF behaviour and a comprehensive life prediction model for AlSi10Mg obtained by SLM. Int. J. Fatigue 2018, 117, 47–62. [Google Scholar] [CrossRef]
- Romano, S.; Brückner-Foit, A.; Brandão, A.; Gumpinger, J.; Ghidini, T.; Beretta, S. Fatigue properties of AlSi10Mg obtained by additive manufacturing: Defect-based modelling and prediction of fatigue strength. Eng. Fract. Mech. 2018, 187, 165–189. [Google Scholar] [CrossRef]
- Shamsaei, N.; Yadollahi, A.; Bian, L.; Thompson, S.M. An overview of Direct Laser Deposition for additive manufacturing; Part II: Mechanical behavior, process parameter optimization and control. Addit. Manuf. 2015, 8, 12–35. [Google Scholar] [CrossRef]
- Buffière, J.Y.; Savelli, S.; Jouneau, P.H.; Maire, E.; Fougères, R. Experimental study of porosity and its relation to fatigue mechanisms of model Al-Si7-MgO.3 cast Al alloys. Mater. Sci. Eng. A 2001, 316, 115–126. [Google Scholar] [CrossRef]
- Zhang, J.; Li, J.; Wu, S.; Zhang, W.; Sun, J.; Qian, G. High-cycle and very-high-cycle fatigue lifetime prediction of additively manufactured AlSi10Mg via crystal plasticity finite element method. Int. J. Fatigue 2022, 155, 106577. [Google Scholar] [CrossRef]
- Qian, G.; Jian, Z.; Qian, Y.; Pan, X.; Ma, X.; Hong, Y. Very-high-cycle fatigue behavior of AlSi10Mg manufactured by selective laser melting: Effect of build orientation and mean stress. Int. J. Fatigue 2020, 138, 105696. [Google Scholar] [CrossRef]
- Tridello, A.; Biffi, C.A.; Fiocchi, J.; Bassani, P.; Chiandussi, G.; Rossetto, M.; Tuissi, A.; Paolino, D.S. VHCF response of as-built SLM AlSi10Mg specimens with large loaded volume. Fatigue Fract. Eng. Mater. Struct. 2018, 41, 1918–1928. [Google Scholar] [CrossRef]
- Nicoletto, G. Influence of rough as-built surfaces on smooth and notched fatigue behavior of L-PBF AlSi10Mg. Addit. Manuf. 2020, 34, 101251. [Google Scholar] [CrossRef]
- Qian, W.; Wu, S.; Wu, Z.; Ahmed, S.; Zhang, W.; Qian, G.; Withers, P.J. In situ X-ray imaging of fatigue crack growth from multiple defects in additively manufactured AlSi10Mg alloy. Int. J. Fatigue 2022, 155, 106616. [Google Scholar] [CrossRef]
- Bao, J.; Wu, S.; Withers, P.J.; Wu, Z.; Li, F.; Fu, Y.; Sun, W. Defect evolution during high temperature tension-tension fatigue of SLM AISi10Mg alloy by synchrotron tomography. Mater. Sci. Eng. A 2020, 792, 139809. [Google Scholar] [CrossRef]
- Rhein, R.K.; Shi, Q.; Tekalur, S.A.; Jones, J.W.; Carroll, J.W. Short-Crack Growth Behavior in Additively Manufactured AlSi10Mg Alloy. J. Mater. Eng. Perform. 2021, 30, 5392–5398. [Google Scholar] [CrossRef]
- Wang, Z.; Wu, W.; Qian, G.; Sun, L.; Li, X.; Correia, J.A. In-situ SEM investigation on fatigue behaviors of additive manufactured Al-Si10-Mg alloy at elevated temperature. Eng. Fract. Mech. 2019, 214, 149–163. [Google Scholar] [CrossRef]
- Zhang, C.; Zhu, H.; Liao, H.; Cheng, Y.; Hu, Z.; Zeng, X. Effect of heat treatments on fatigue property of selective laser melting AlSi10Mg. Int. J. Fatigue 2018, 116, 513–522. [Google Scholar] [CrossRef]
- Nadot, Y.; Nadot-Martin, C.; Kan, W.H.; Boufadene, S.; Foley, M.; Cairney, J.; Proust, G.; Ridosz, L. Predicting the fatigue life of an AlSi10Mg alloy manufactured via laser powder bed fusion by using data from computed tomography. Addit. Manuf. 2020, 32, 100899. [Google Scholar] [CrossRef]
- Billaudeau, T.; Nadot, Y.; Bezine, G. Multiaxial fatigue limit for defective materials: Mechanisms and experiments. Acta Mater. 2004, 52, 3911–3920. [Google Scholar] [CrossRef]
- Nadot, Y.; Billaudeau, T. Multiaxial fatigue limit criterion for defective materials. Eng. Fract. Mech. 2006, 73, 112–133. [Google Scholar] [CrossRef]
- Gadouini, H.; Nadot, Y.; Rebours, C. Influence of mean stress on the multiaxial fatigue behaviour of defective materials. Int. J. Fatigue 2008, 30, 1623–1633. [Google Scholar] [CrossRef]
- Rotella, A.; Nadot, Y.; Augustin, R.; Piellard, M.; L’Heritier, S. Defect size map for cast A357-T6 component under multiaxial fatigue loading using the Defect Stress Gradient (DSG) criterion. Eng. Fract. Mech. 2017, 174, 227–242. [Google Scholar] [CrossRef]
- Mura, T. Mechanics of elastic and inelastic solids. In Micromechanics of Defects in Solids; Martinus Nijhoff Publishers: Dordrecht, The Netherlands, 1987. [Google Scholar]
- Eshelby, J. Elastic inclusions and inhomogeneities. Prog. Solid Mech. 1961, 2, 89–140. [Google Scholar]
- Kitagawa, H. Applicability of fracture mechanics to very small cracks or the cracks in the early stage. In Proceedings of the 2nd ICM, Cleveland, OH, USA, 16–24 August 1976; Volume 1976, pp. 627–631. [Google Scholar]
- Gumpinger, J.; Brandão, A.D.; Beevers, E.; Rohr, T.; Ghidini, T.; Beretta, S.; Romano, S. Expression of Additive Manufacturing Surface Irregularities through a Flaw-Based Assessment; ASTM Special Technical Publication; STP 1620; ASTM International: West Conshohocken, PA, USA, 2020; pp. 234–249. [Google Scholar] [CrossRef]
- Yadollahi, A.; Shamsaei, N. Additive manufacturing of fatigue resistant materials: Challenges and opportunities. Int. J. Fatigue 2017, 98, 14–31. [Google Scholar] [CrossRef]
- Beretta, S.; Romano, S. A comparison of fatigue strength sensitivity to defects for materials manufactured by AM or traditional processes. Int. J. Fatigue 2017, 94, 178–191. [Google Scholar] [CrossRef]
- Leuders, S.; Thöne, M.; Riemer, A.; Niendorf, T.; Tröster, T.; Richard, H.A.; Maier, H.J. On the mechanical behaviour of titanium alloy TiAl6V4 manufactured by selective laser melting: Fatigue resistance and crack growth performance. Int. J. Fatigue 2013, 48, 300–307. [Google Scholar] [CrossRef]
- Murakami, Y. Metal Fatigue: Effects of Small Defects and Nonmetallic Inclusions; Academic Press: Cambridge, MA, USA, 2019. [Google Scholar]
- Beretta, S.; Carboni, M.; Madia, M. Modelling of fatigue thresholds for small cracks in a mild steel by “Strip-Yield” model. Eng. Fract. Mech. 2009, 76, 1548–1561. [Google Scholar] [CrossRef]
- El Haddad, M.; Topper, T.; Smith, K. Prediction of non propagating cracks. Eng. Fract. Mech. 1979, 11, 573–584. [Google Scholar] [CrossRef]
- Murakami, Y.; Endo, M. Effects of hardness and crack geometries on delta k sub th of small cracks emanating from small defects. In The Behaviour of Short Fatigue Cracks; Mechanical Engineering Publications: Suffolk, UK, 1986; pp. 275–293. [Google Scholar]
- Forman, R.; Shivakumar, V. Growth behavior of surface cracks in the circumferential plane of solid and hollow cylinders. In Fracture Mechanics: Seventeenth Volume; ASTM International: West Conshohocken, PA, USA, 1986. [Google Scholar]
- Zhang, W.; Hu, Y.; Ma, X.; Qian, G.; Zhang, J.; Yang, Z.; Berto, F. Very-high-cycle fatigue behavior of AlSi10Mg manufactured by selected laser melting: Crystal plasticity modeling. Int. J. Fatigue 2021, 145, 106109. [Google Scholar] [CrossRef]
- Proudhon, H.; Li, J.; Wang, F.; Roos, A.; Chiaruttini, V.; Forest, S. 3D simulation of short fatigue crack propagation by finite element crystal plasticity and remeshing. Int. J. Fatigue 2016, 82, 238–246. [Google Scholar] [CrossRef]
- Kiani, P.; Dupuy, A.D.; Ma, K.; Schoenung, J.M. Directed energy deposition of AlSi10Mg: Single track nonscalability and bulk properties. Mater. Des. 2020, 194, 108847. [Google Scholar] [CrossRef]
- Sun, S.H.; Hagihara, K.; Ishimoto, T.; Suganuma, R.; Xue, Y.F.; Nakano, T. Comparison of microstructure, crystallographic texture, and mechanical properties in Ti–15Mo–5Zr–3Al alloys fabricated via electron and laser beam powder bed fusion technologies. Addit. Manuf. 2021, 47, 102329. [Google Scholar] [CrossRef]
- Chen, N.; Wan, Z.; Wang, H.P.; Li, J.; Yang, B.; Solomon, J.; Carlson, B. Effect of ambient pressure on laser welding of AlSi10Mg fabricated by selected laser melting. Mater. Des. 2022, 215, 110427. [Google Scholar] [CrossRef]
- Wu, H.; Li, J.; Wei, Z.; Wei, P. Effect of processing parameters on forming defects during selective laser melting of AlSi10Mg powder. Rapid Prototyp. J. 2020, 26, 871–879. [Google Scholar] [CrossRef]
- Dharmadhikari, S.; Basak, A. Evaluation of Early Fatigue Damage Detection in Additively Manufactured AlSi10Mg. In Proceedings of the 2021 International Solid Freeform Fabrication Symposium, Virtual, 5–27 July 2021; University of Texas at Austin: Austin, TX, USA, 2021. [Google Scholar]


| Manufacturer | Particle Size (µm) | Mass Density (g/cm3) | Thermal Conductivity (W/(m.K) |
|---|---|---|---|
| SLM solutions group Ag [44] | 20–63 | 2.67 | 130–150 |
| EOS GmbH [3] | 25–70 | 2.67 | 100–110 |
| Al | Si | Mg | Fe | N | O | Ti | Zn | Mn | Ni | Cu | Pb | Sn |
|---|---|---|---|---|---|---|---|---|---|---|---|---|
| Balance | 9–11 | 0.25–0.45 | <0.25 | <0.2 | <0.2 | <0.15 | <0.1 | <0.1 | <0.05 | <0.05 | <0.02 | <0.02 |
| Specimen Type | Fatigue Strength (MPa) |
|---|---|
| Notched As-Built | 6 |
| Notched Heat-Treated | 45 |
| Notched As-Built + SP with steel | 92 |
| Notched As-Built + SP with ceramic | 100 |
| Notched Heat-Treated + SP with steel | 95 |
| Notched Heat-Treated + SP with ceramic | 110 |
| Smooth As-Built | 50 |
| Smooth Heat-Treated | 75 |
| Smooth As-Built+SP with steel | 185 |
| Smooth Heat-Treated + SP with steel | 102 |
Publisher’s Note: MDPI stays neutral with regard to jurisdictional claims in published maps and institutional affiliations. |
© 2022 by the authors. Licensee MDPI, Basel, Switzerland. This article is an open access article distributed under the terms and conditions of the Creative Commons Attribution (CC BY) license (https://creativecommons.org/licenses/by/4.0/).
Share and Cite
Pal, R.; Basak, A. Linking Powder Properties, Printing Parameters, Post-Processing Methods, and Fatigue Properties in Additive Manufacturing of AlSi10Mg. Alloys 2022, 1, 149-179. https://doi.org/10.3390/alloys1020010
Pal R, Basak A. Linking Powder Properties, Printing Parameters, Post-Processing Methods, and Fatigue Properties in Additive Manufacturing of AlSi10Mg. Alloys. 2022; 1(2):149-179. https://doi.org/10.3390/alloys1020010
Chicago/Turabian StylePal, Ritam, and Amrita Basak. 2022. "Linking Powder Properties, Printing Parameters, Post-Processing Methods, and Fatigue Properties in Additive Manufacturing of AlSi10Mg" Alloys 1, no. 2: 149-179. https://doi.org/10.3390/alloys1020010