Article

Interaction of Carbon, Titanium, and Boron in Micro-Alloy Steels and Its Effect on Hot Ductility

Swerim AB, Department of Material Development, SE-164 40 Kista, Sweden
*
Author to whom correspondence should be addressed.
Alloys 2022, 1(2), 133-148; https://doi.org/10.3390/alloys1020009
Submission received: 4 May 2022 / Revised: 22 June 2022 / Accepted: 28 June 2022 / Published: 6 July 2022

Abstract

:
Varying contents of carbon, titanium and boron were used in the base steel composition of 0.30 wt% Si, 2.0 wt% Mn, 0.006 wt% S, 0.03 wt% Nb, and 30–35 ppm N. Hot ductility tests were performed with Gleeble-3800, after the steel sample was in-situ melted, solidified, and cooled to the test temperature. Investigation was completed with thermodynamic and kinetic simulations. The best results were obtained for steels containing 58–100 ppm B and 35 ppm Ti. They showed very good hot ductility of 80–50% RA within the temperature range between 1250 °C and 800 °C. It was shown that titanium and boron were effective in improving the hot ductility. Titanium protected boron from binding into BN and was low enough to prevent excessive (Ti,Nb) carbonitride precipitation, which both could decrease hot ductility. Boron that precipitated along austenite grain boundaries as iron boride Fe2B was very beneficial for the hot ductility of steel.

1. Introduction

Microalloying steels with boron has a potential to improve hot ductility, which is a complex effect of the boron activity in the solid solution and of the interaction with alloy elements during solidification and cooling. Boron can significantly enhance the hot ductility of steels, mainly due to the segregation of boron atoms at the austenite grain boundary that delays the austenite/ferrite transformation and retards the formation of pro-eutectoid ferrite films. Boron atoms also increase grain boundary cohesion and can increase the resistance against grain boundary slip, improving the hot ductility [1,2,3]. Due to its strong affinity to nitrogen, boron easily precipitates in boron nitrides (BN), hence the advantage of keeping boron in solid solution may be lost. Boron nitrides are generally described as decreasing hot ductility of steel by promoting cavities and crack propagation along the austenite grain boundary [4,5,6]. The addition of 26 ppm B to the low carbon steel without Ti and Nb (0.04 wt% C, 0.6 wt% Si, 0.5 wt% Mn, 0.012 wt% S, 0.026 wt% Al, 11–49 ppm N) reduced the hot ductility, which was caused by the precipitation of boron nitrides [6]. The investigation showed that the improvement of hot ductility in B-bearing steel could be achieved by decreasing the N content, i.e., by increasing B:N ratio, and by avoiding an abrupt temperature drop during the cooling stage of the slab after solidification [6]. A similar effect with a similar steel composition was presented in [7]. In this case, the proposed mechanism of the hot ductility improvement by increasing B:N ratio was that the boron nitride played a positive role. The boron removed nitrogen from the solution, thus reducing the strain-induced precipitation of harmful AlN. It was also stated that the BN co-precipitated with sulphides, preventing precipitation of fine MnS, CuS and FeS, and formed large, complex precipitates that did not affect the hot ductility [7].
The formation of boron nitrides is usually prevented by the addition of titanium which in comparison to boron, has a stronger affinity to nitrogen. Usually, Ti is added in the quantities above the stochiometric value (Ti > 3.42 × N) to fully fix the nitrogen. However, in this case, coarse Ti carbonitrides will be formed, which may deteriorate the hot ductility [8,9].
Ti and Nb microalloyed steels with boron additions are generally reported as being difficult to continuously cast. The problems are often related to the surface- and internal cracking of continuously cast semis caused by the precipitation of nitrides and carbonitrides [9,10]. It was shown that the addition 20–105 ppm of boron improved the hot ductility of Nb-alloyed steels [10], of TRIP-steel with high phosphorus [11] and of boron added steels with no Ti or Nb [1]. There was no explanation given of the mechanism of hot ductility improvement by adding 22 ppm B to the TRIP steel containing 140 ppm Ti and 720 ppm P, and a further investigation was recommended [11]. In the case of Nb–alloyed steels and of the steels with no Ti or Nb, the improvement of the hot ductility was explained by the segregation of boron atoms at the austenite grain boundaries that enhanced boundary cohesion and allowed for easier flow in the austenite lattice [1,10]. In the extreme case of high boron contents of 168 ppm and 450 ppm in the iron–boron binary alloys, the thermodynamic studies of the Fe-B system predicted a metatectic reaction, δ → Liquid + γ, to occur on the iron-rich side of the diagram [12]. This would result in a solid material remelting as the temperature is decreased, which could be the source of casting defects [9].
In microalloyed steels without boron, relatively small amounts of Ti and Nb are added to achieve the required microstructure and mechanical properties of the material during casting and hot working. This eliminates the necessity of an additional heat treatment with corresponding energy and cost savings in the total production process. The same elements influence the hot ductility where for example titanium plays a positive role by binding N and preventing AlN precipitation. Ti also activates Nb precipitation on the TiN particles at higher temperatures, leaving less niobium available for precipitating during deformation in the temperature range 800 °C–1000 °C [13]. On the other hand, titanium additions were generally found to impair ductility due to the formation of fine TiN precipitates [14]. Depending on the nitrogen content in the steel, the addition of Ti to Nb-bearing steels can have two kinds of effect on the precipitation and on the hot ductility. For the 0.1% C–0.03% Nb–0.005% N steel (Case 1), the additions of 0.015–0.04% Ti led to a worsening in ductility. Contrary to this, an addition of 0.02% Ti to the 0.1% C–0.023 Nb–0.008% N steel (Case 2) resulted in a small improvement in the hot ductility [15]. In the former case, large volume fractions of fine strain-induced precipitates were available because with a small, or no excess of nitrogen, the titanium could precipitate together with niobium. In Case 2, however, the total volume fraction of precipitates was restricted at high levels of nitrogen with low levels of titanium, and most of them precipitated at higher temperatures in a coarse form, mainly as (TiNb)N. This left less solutes for subsequent fine strain-induced precipitation and finally favored the ductility [15]. As stated in [16], when small titanium additions are made to low nitrogen C–Mn–Al steels (0.12 wt% C, 1.0 wt% Mn, <0.04 wt% Al, 0·005 wt% N), the best ductility is likely to be given by a high Ti/N ratio of 4–5:1. The excess titanium in solution encourages growth of bigger TiN particles. For high nitrogen steels (0.01% N), a low titanium level (<0.01% ) is recommended to limit the volume fraction of TiN particles. By forming stable nitrides and carbonitrides during hot working in the austenite region, Ti and Nb increase the strength of steel due to grain refinement and precipitation strengthening by dispersive particles of carbides and carbonitrides (MX-type phases: TiN, NbC + TiN, TiC + NbC + TiN) [17,18,19,20].
The present study describes the influence of carbon, titanium and boron on the hot ductility of microalloyed steels containing 0.03 wt% niobium. The investigation was performed within the European Research project PMAPIA [9].

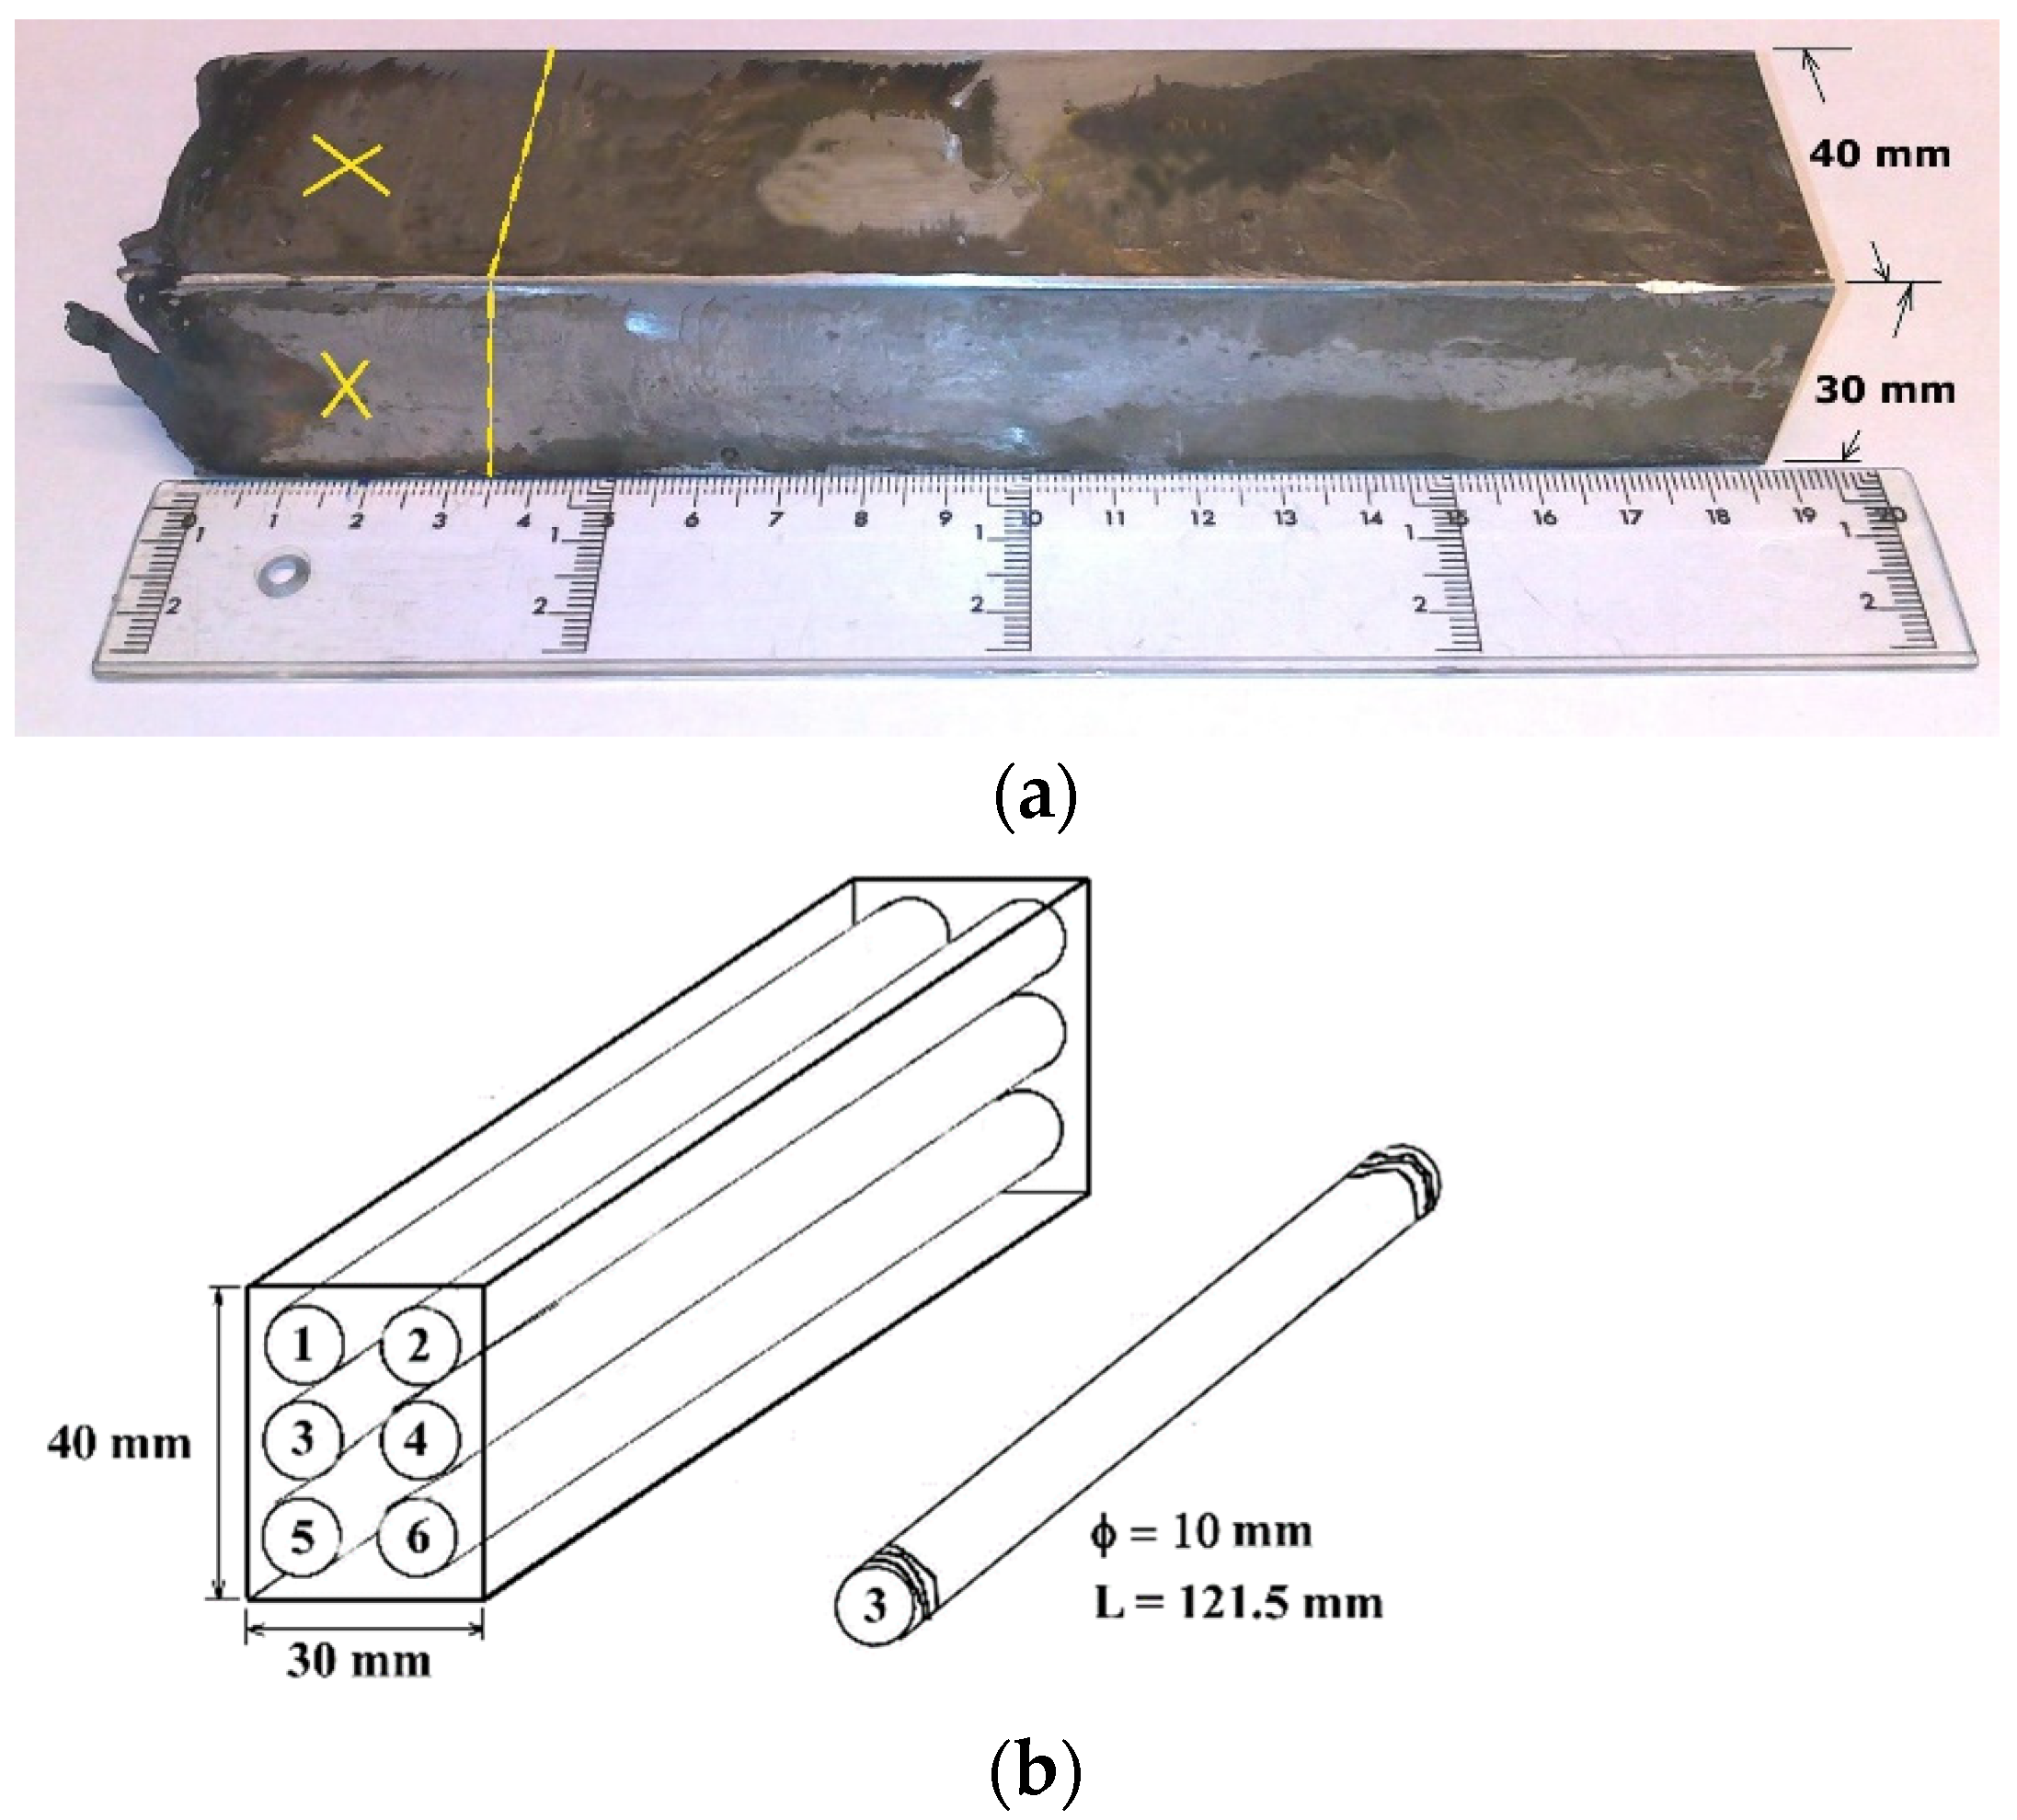
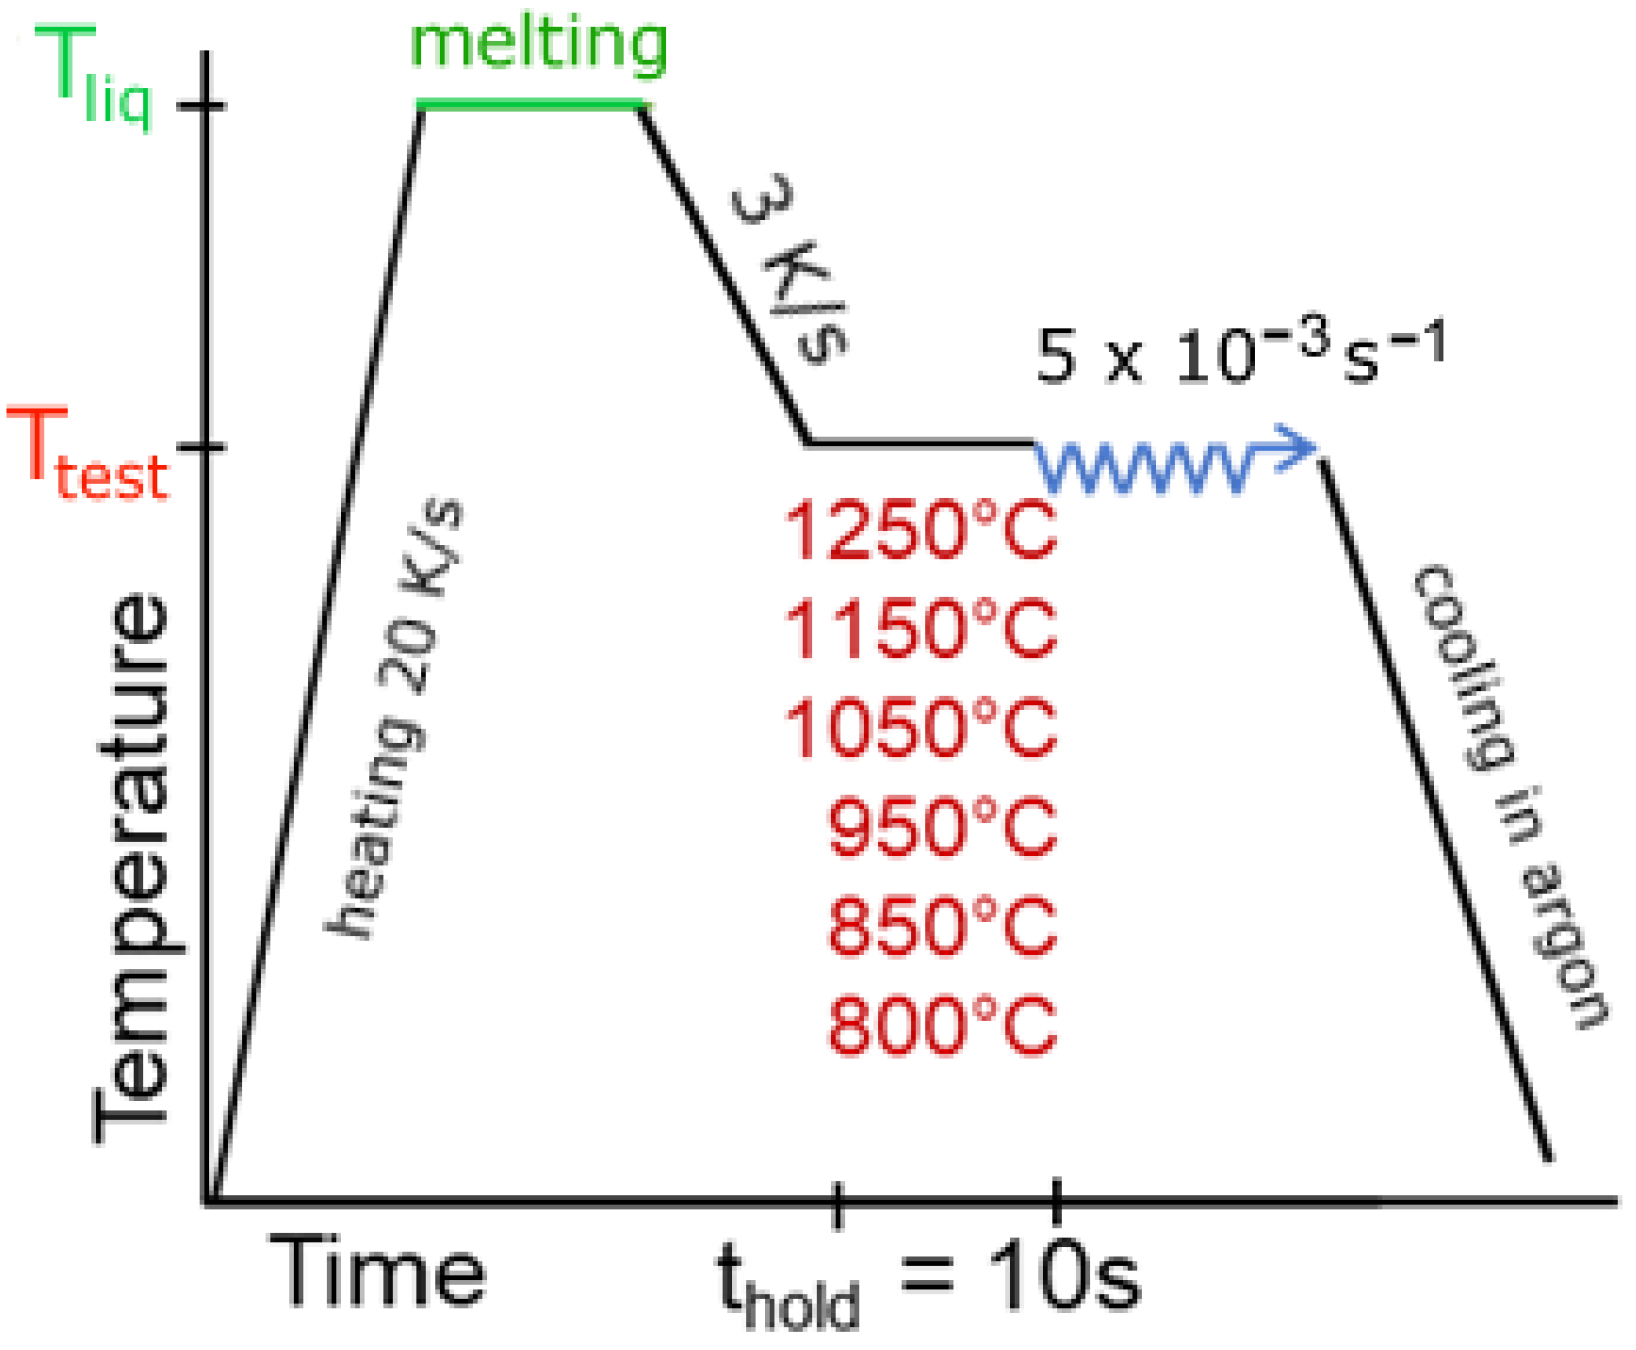
2. Experimental Procedure

The steels were prepared in the Swerim AB laboratory by induction melting in a vacuum using a Leybold furnace with a 2 kg melt capacity. High purity ARMCO iron and ferro-alloys were used to obtain the desired steel compositions. The steels were cast into a vertical copper mold with a 40 mm × 30 mm cross section. The height of the obtained mini-ingot was 185 mm, as it is shown in Figure 1a. After the upper part with a shrinkage cavity (marked by a yellow X) was cut out, the remaining length of 150 mm was used for the machining of hot ductility specimens (Figure 1b). Two mini-ingots were cast for each steel chemistry, providing twelve specimens/steel for the hot ductility testing.
The steel chemical composition was controlled after solidification, using the combustion analysis with LECO system (analysis of C, S, N, O), the Glow Discharge Optical Emission Spectroscopy (analysis of P, Al, B), and the X-ray spectrometry for Si, Mn, Ti, and Nb. The chemical compositions of the eight steels examined in this study are shown in Table 1.
Cylindrical hot tensile specimens of 10 mm in diameter and 121.5 mm in length with threaded ends were machined from the as-cast mini-ingots. The hot ductility tests were performed with Gleeble 3800—the physical simulation system for studying material processing at temperatures up to 1700 °C. Horizontally installed specimens were heated by electric resistance, in-situ melted in their middle part, solidified, and deformed in tension, and finally cooled in an inert gas atmosphere. For the in-situ melting, the middle part of the specimen is supported by a quartz crucible which is 30.5 mm long and has a 10 mm inner diameter. An example specimen with the quartz crucible is shown in Figure 2. The specimens were heated at 20 K/s in a shielding argon gas until the melting temperature was reached at approximately 1460 °C–1500 °C. The in-situ melting zone was located within the quartz crucible length and the melting status was visually controlled by manually adjusting the maximum temperature. After the melting process was accomplished, the melted part of the specimen started to solidify and when the steel was still in a mushy state, a gentle compression of around 0.5 mm was applied to seal any solidification cavities that might have appeared at this stage. Cooling proceeded at 3 K/s until the tensile test temperature was reached. A 10 s holding time was then applied before the specimen was tensile tested to failure using a strain rate of 5 × 10⁻³ s−1. After fracture, the specimen was slowly cooled in argon. Figure 3 shows the thermal cycle diagram for the hot tensile tests. The applied test temperatures were 1250 °C, 1150 °C, 1050 °C, 950 °C, 850 °C, and 800 °C.
Hot ductility was determined by using the Reduction of Area (RA) parameter. This is defined as the difference between the original cross-sectional area of a specimen (A0) and the area of its smallest cross section at a fracture after testing, (Af). It is expressed as a percentage decrease in original cross section area, and it is shown in the Equation (1). Usually, the cross-section diameter is measured before and after deformation, and the RA parameter is calculated according to the Equation (2). The measurements of the diameters are performed using a light optical microscope with a micrometer stage.
RA   [ % ] = A 0 A f A 0 × 100
RA   [ % ] = ( 1 d f 2 d 0 2 ) × 100
where
RA—Reduction of area
A0—cross sectional area of specimen before deformation
Af—cross sectional area of specimen at fracture after deformation
d0—cross sectional diameter of specimen before deformation
df—cross sectional diameter of specimen at fracture after deformation
Along with the Gleeble tests, the calculations were performed to simulate processes that take place in the steel structure during cooling. The Thermo-Calc software package Version 2020b with TCFE9 thermo-dynamic database, and the mobility database for kinetic simulations MOBFE4, were used. The kinetic calculations were performed using DICTRA, i.e., the Diffusion Module in the Thermo-Calc software package to simulate diffusion-controlled transformations in the steel, treated as multicomponent system. Precipitation processes were simulated using PRISMA of the Thermo-Calc package. The nucleation, growth and coarsening of precipitates were simulated under selected heat treatment conditions.

3. Results

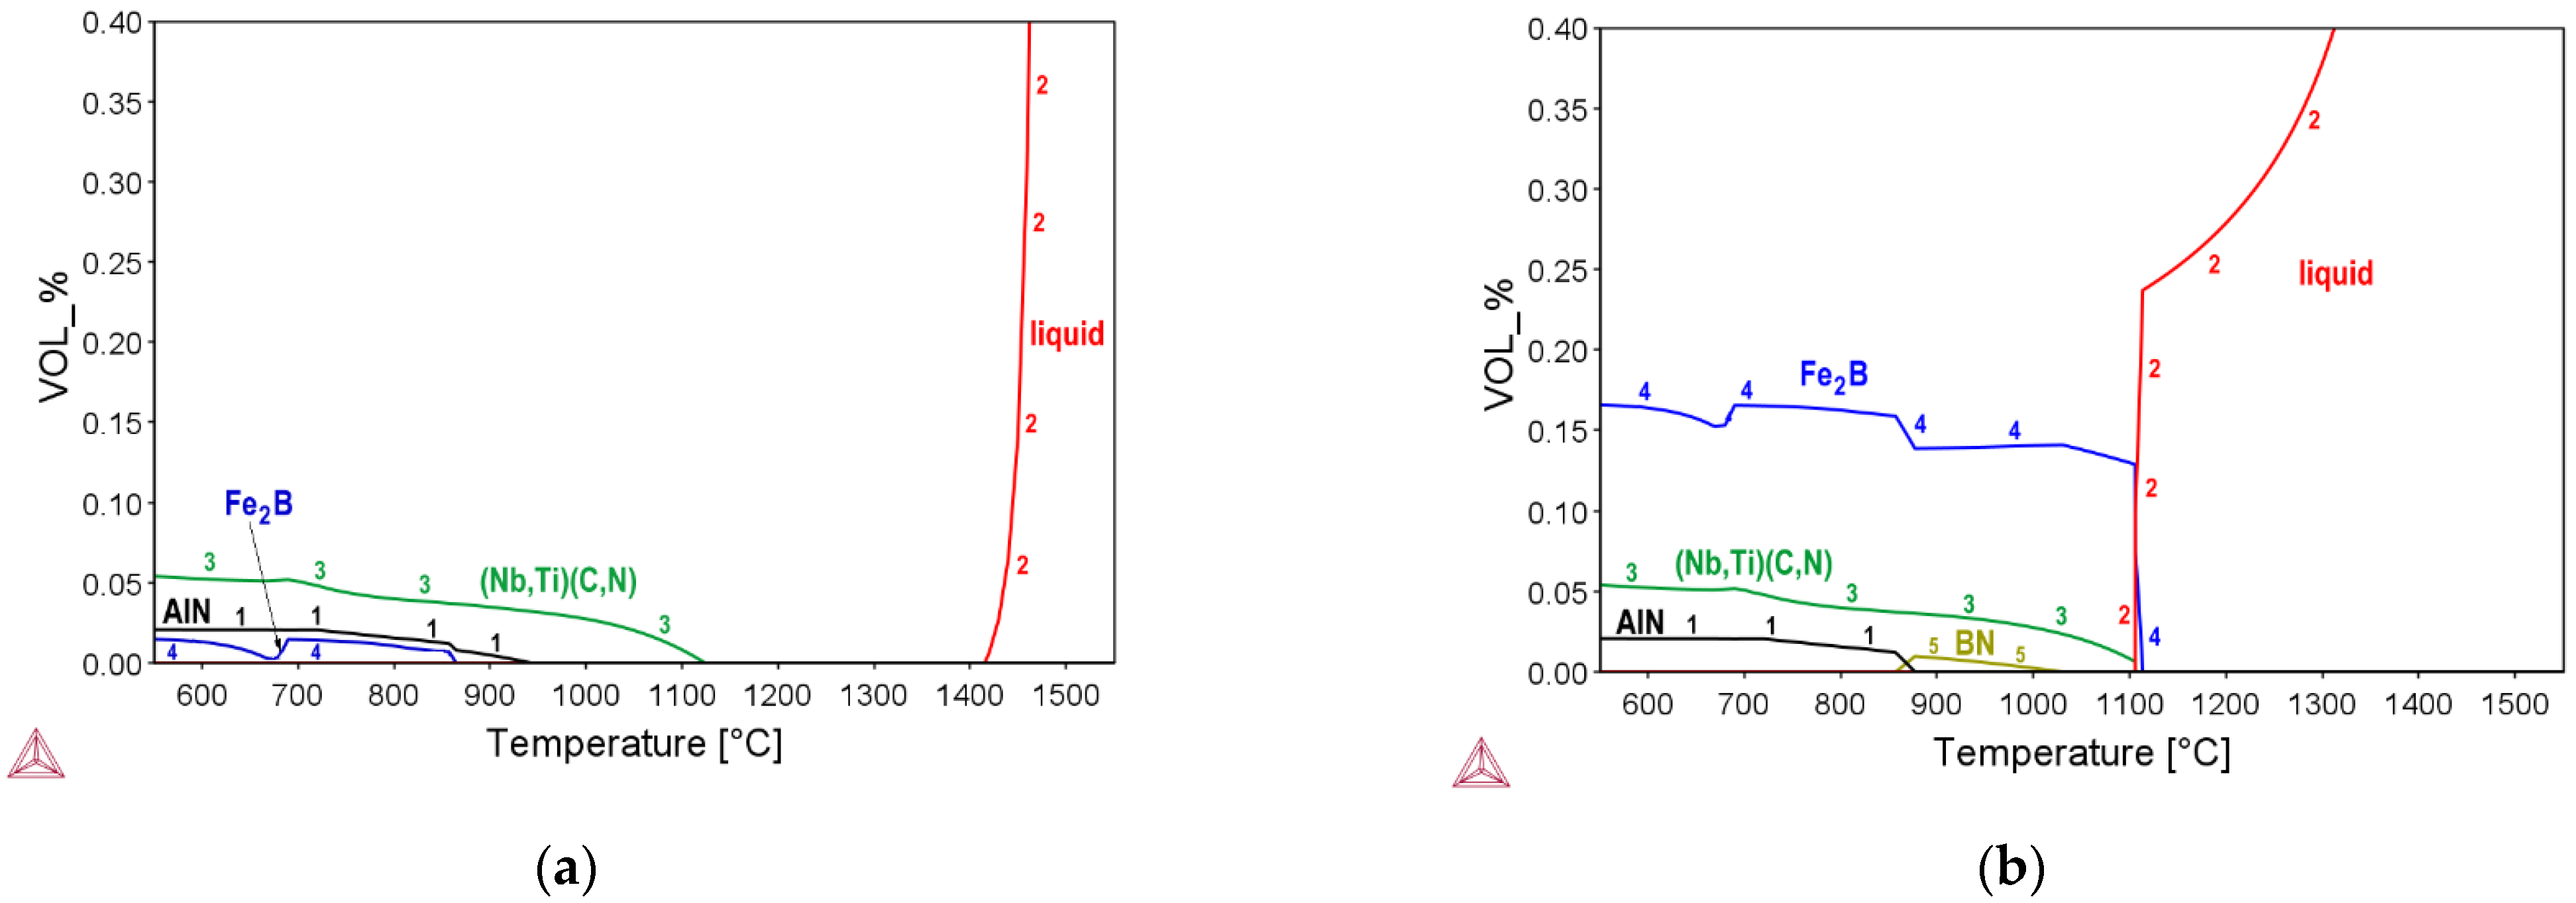
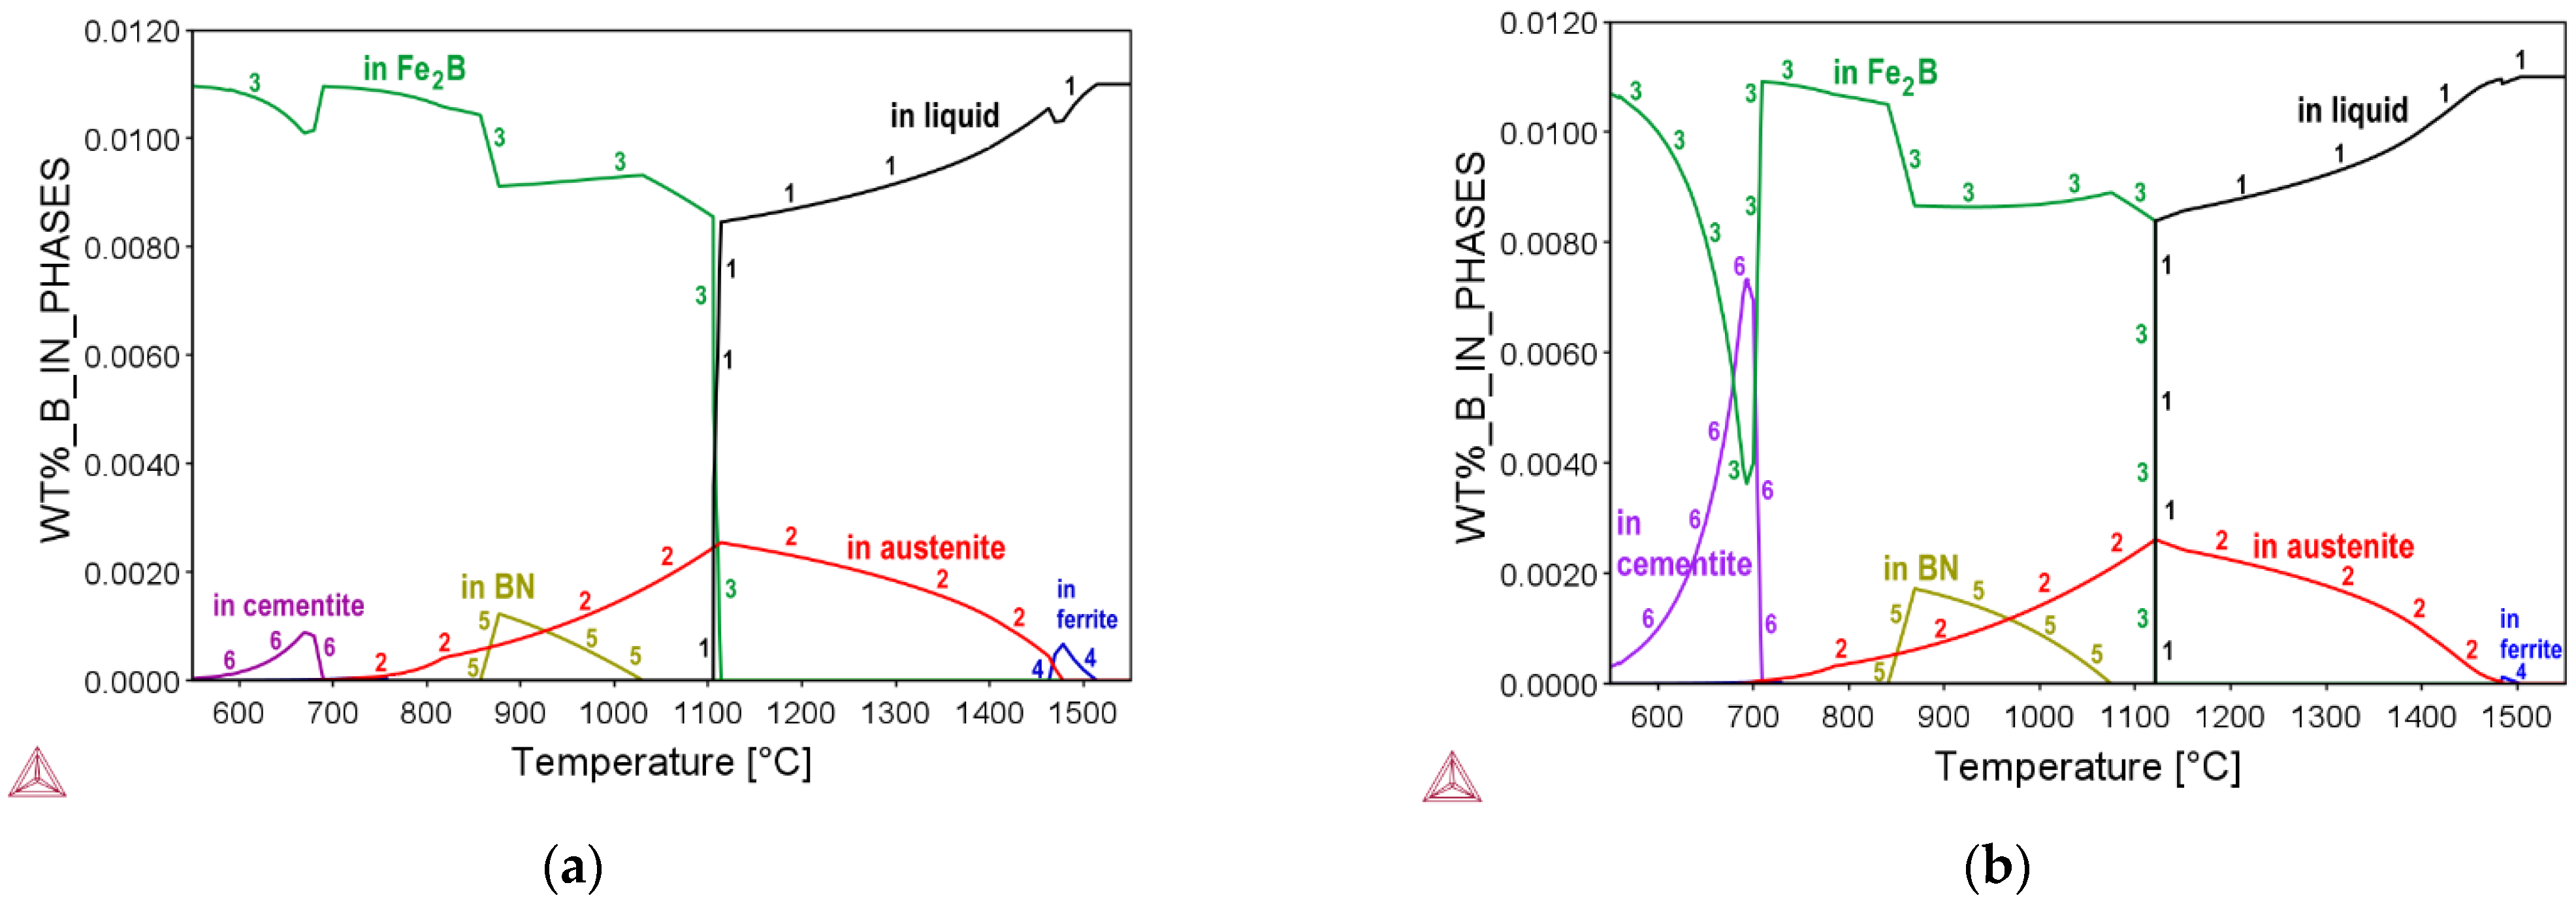
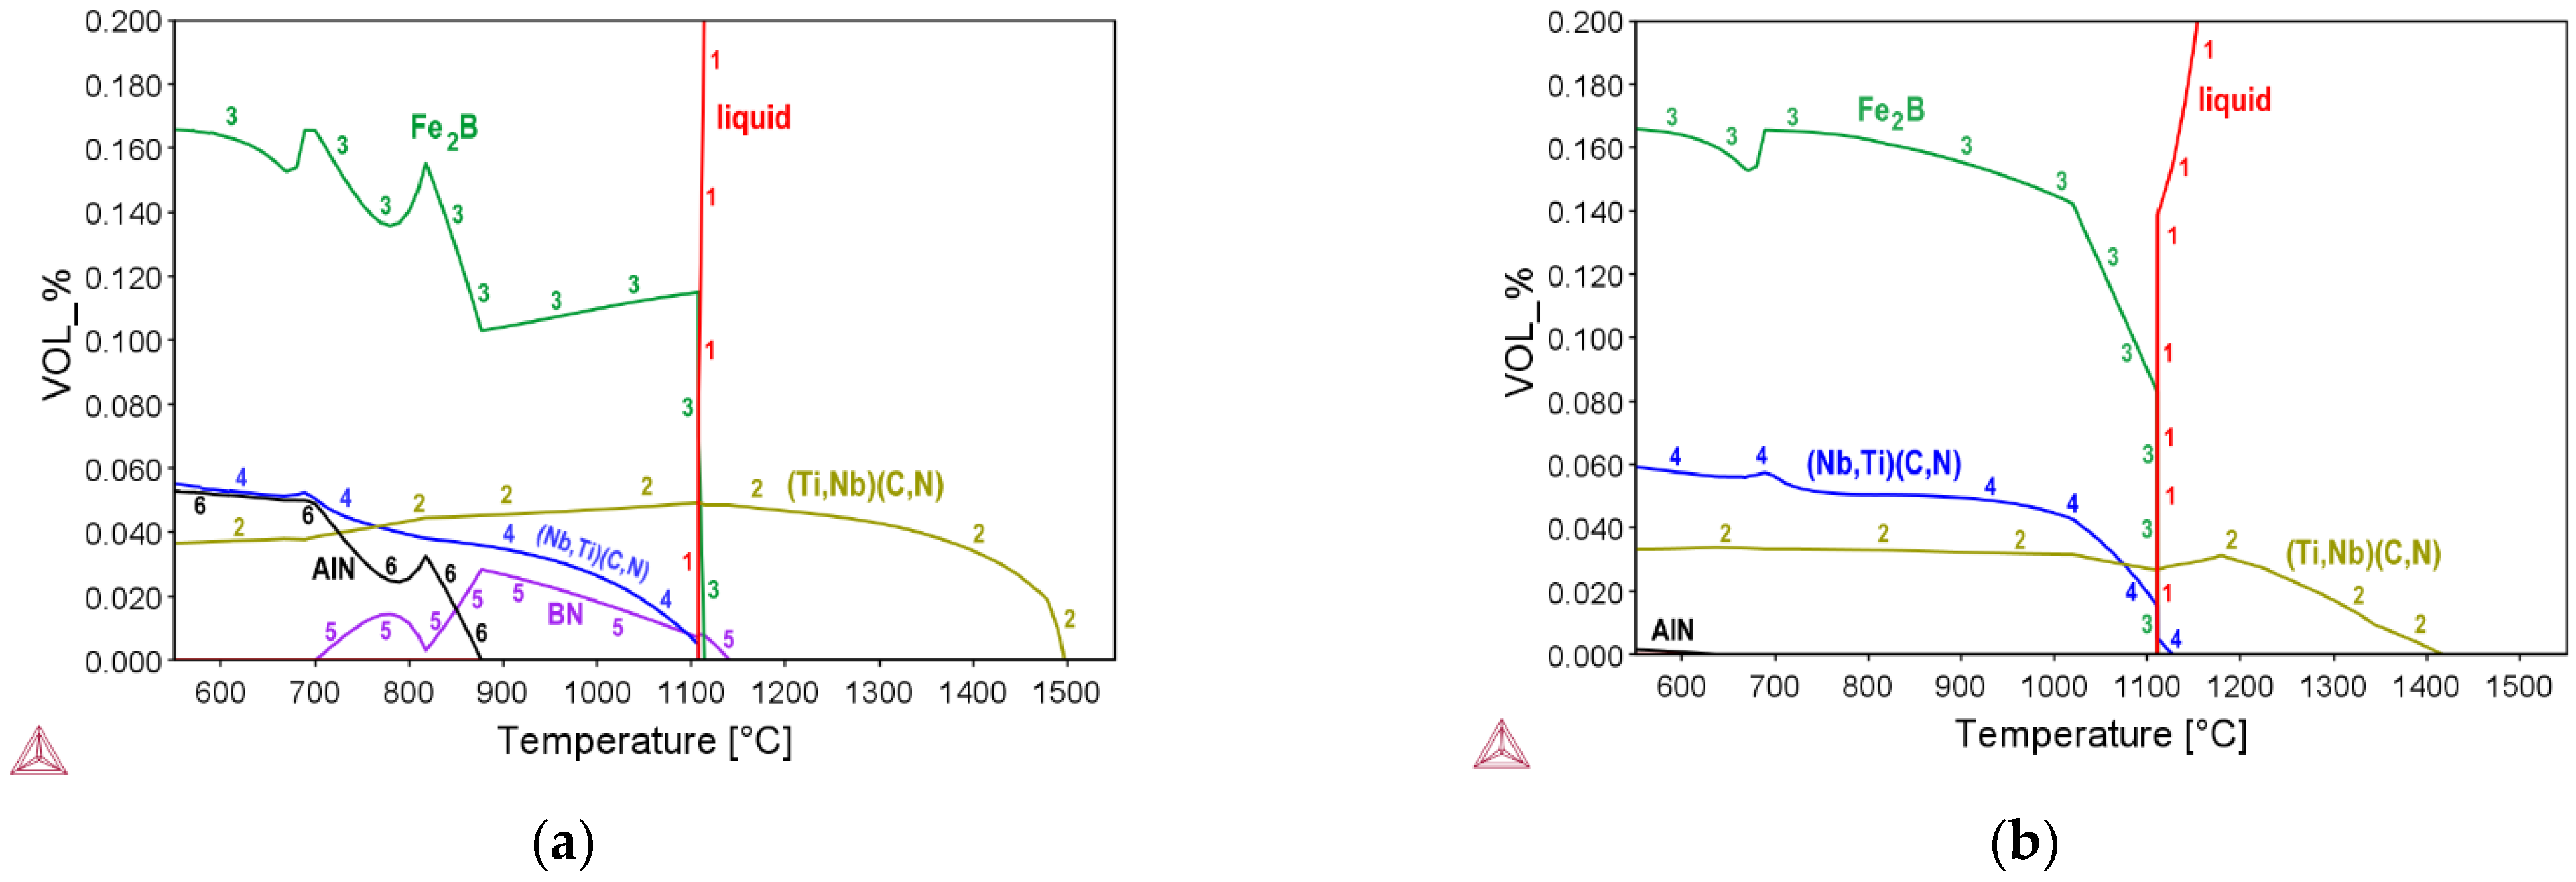
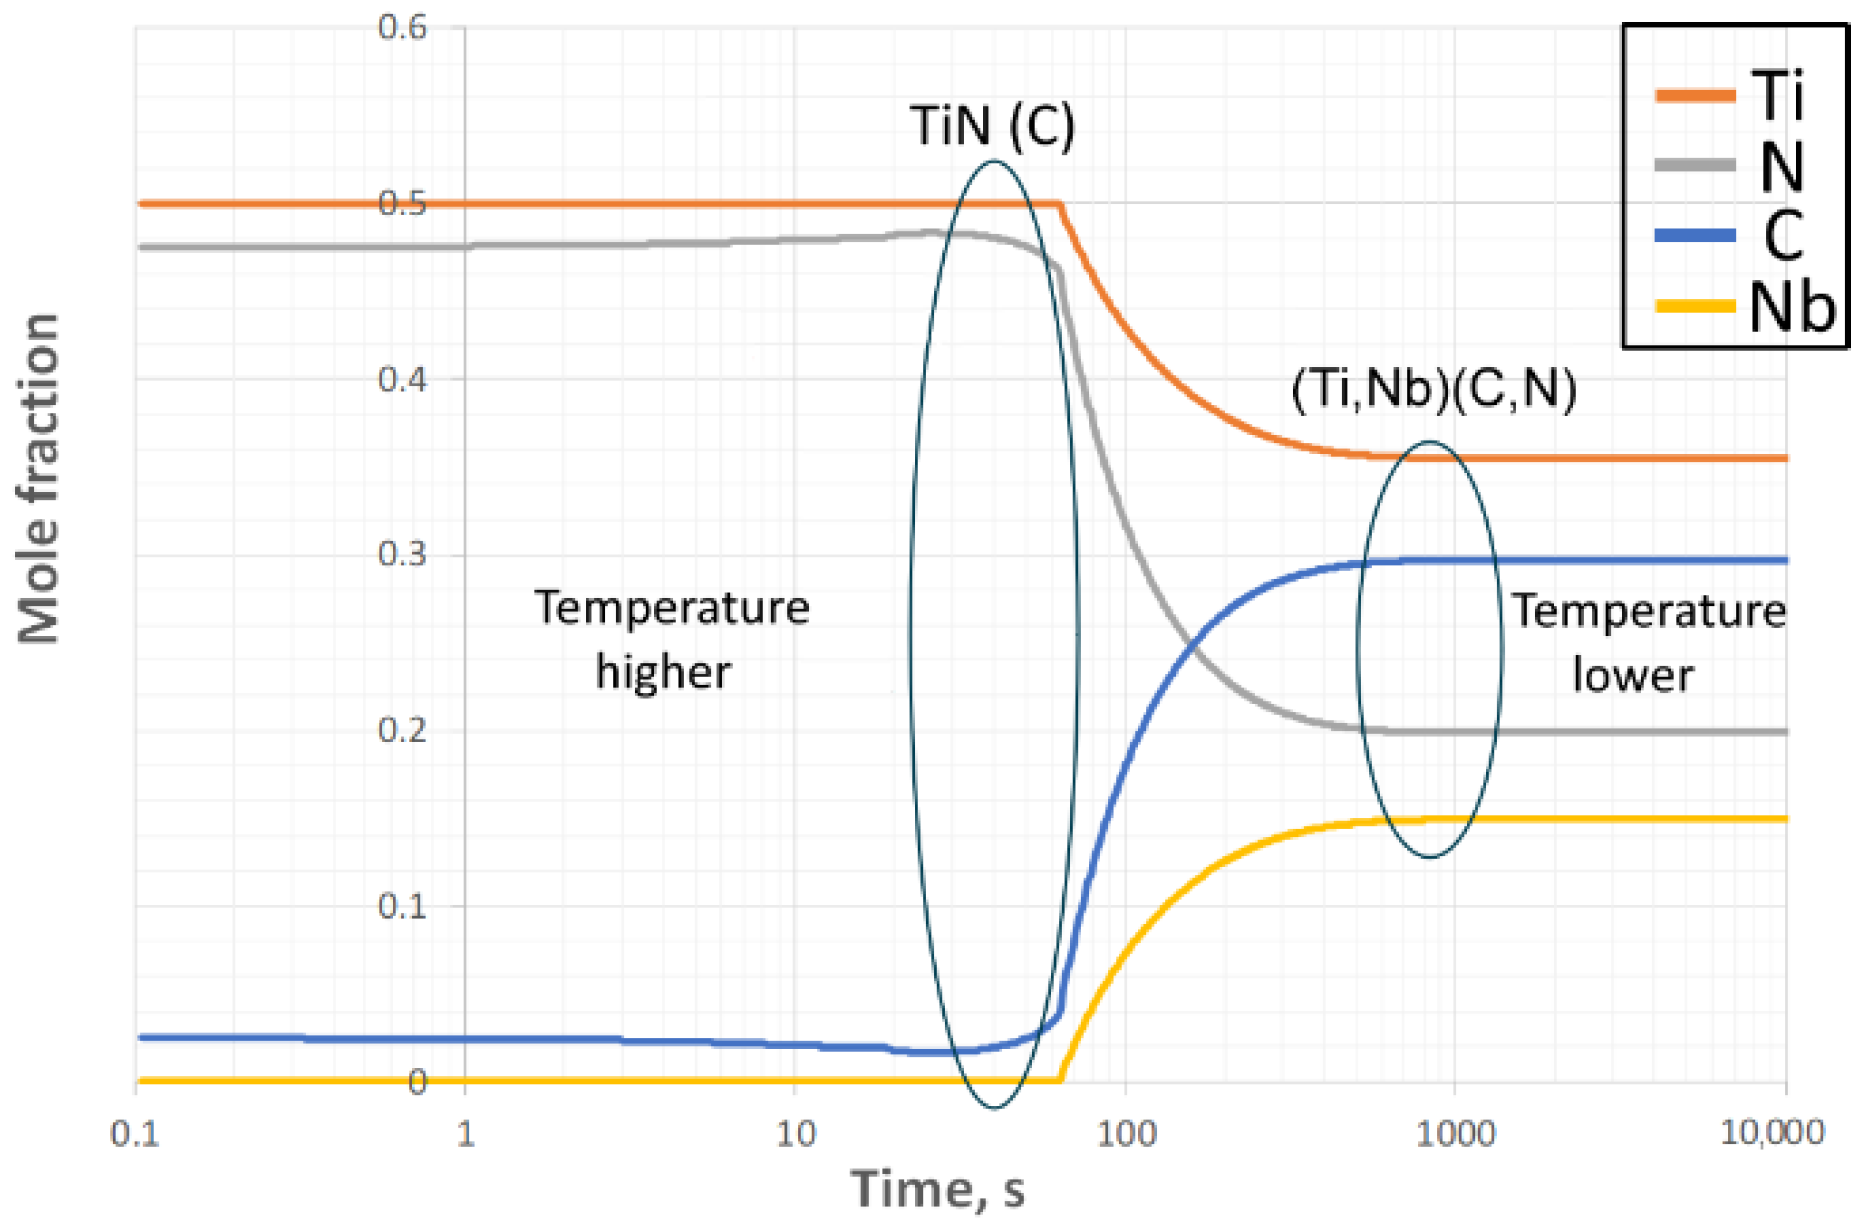
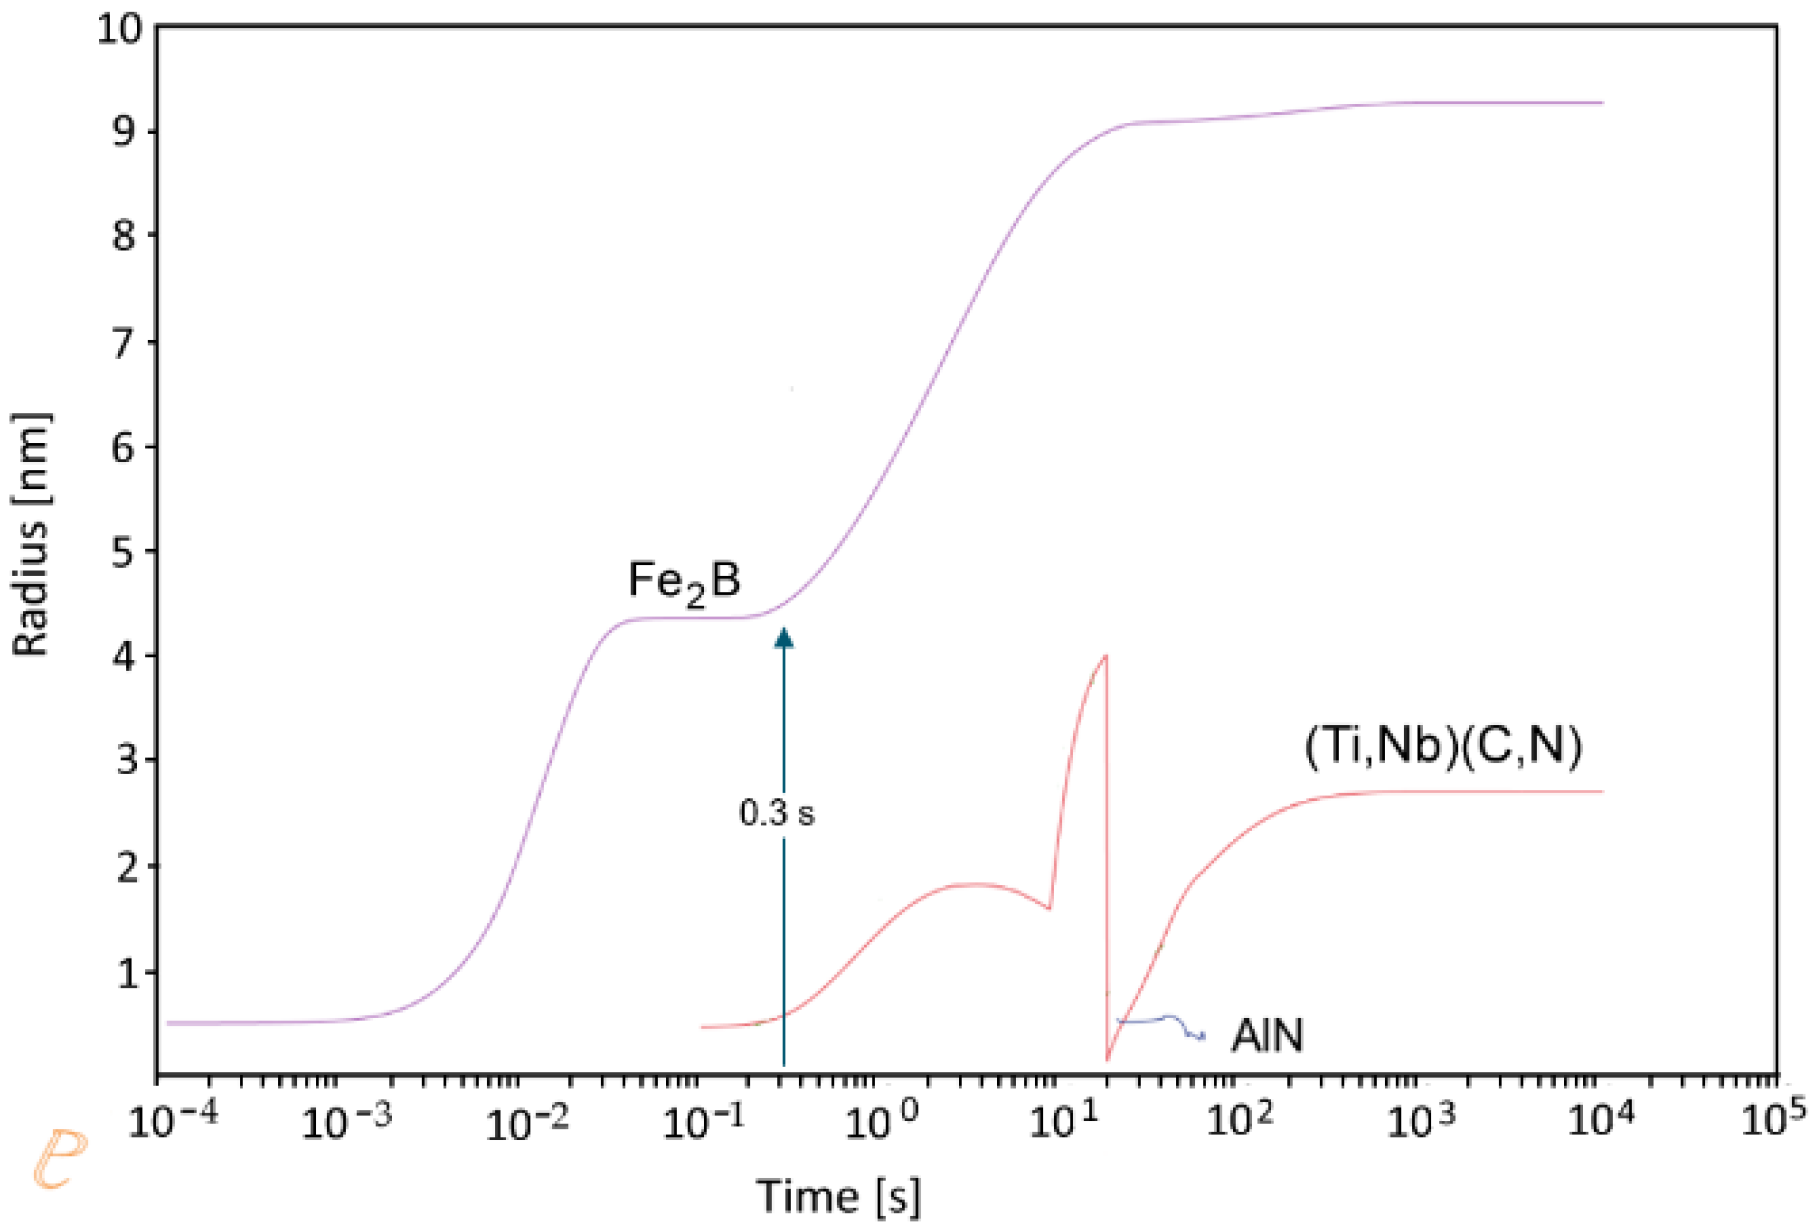
3.1. Thermo-Dynamic and Kinetic Simulations

Thermo-dynamic equilibrium simulations were performed using varying amounts of C, Ti, B and N. The contents of other elements were kept constant: 2.0 wt% Mn, 0.30 wt% Si, 0.031 wt% Nb, 50 ppm S, 300 ppm Al, 50 ppm P, 20 ppm O. The simulations showed that the presence of boron in the steel composition strongly affects the solidus temperature, which is illustrated in Figure 4. The solidus temperature of steel containing 10 ppm boron is 1415 °C, whereas increasing boron content to 110 ppm decreases the solidus temperature to 1105 °C. At 1150 °C there is still around 0.25 vol.% (0.0025 volume fraction) of liquid phase present. The diagrams shown in Figure 4, Figure 5 and Figure 6 also include important information about the precipitation form of boron, which is iron boride, Fe2B. Thermo-Calc suggests that boron precipitates as two stable phases: M2B (iron boride Fe2B) and boron nitride BN.
Depending on the amount of carbon, nitrogen and boron in the steel, some amount of boron can be also bound to cementite, Fe3(B,C). The effect of increasing carbon content on the distribution of boron between phases is shown in Figure 5. Increasing carbon from 0.10 wt% to 0.24 wt%, whereas 50 ppm Ti, 110 ppm B and 30 ppm N remain unchanged, caused decreased precipitation of Fe2B due to increased binding of boron into cementite. Fe2B starts to precipitate at 1100 °C and the majority of B is bound into it. Much smaller fractions of B can be bound into Fe3(B,C) in the later process, below 700 °C.
Titanium plays a very important role in protecting boron from binding into BN. By binding nitrogen into (Ti,Nb)(C,N), and (Nb,Ti)(C,N), Ti increases precipitation of Fe2B and strongly reduces precipitation of BN and AlN. Figure 6 illustrates the effect of Ti on precipitation of nitrides and carbo-nitrides. Depending on the dominating content of Ti or Nb element in the precipitate, Thermo-Calc distinguishes between the (Ti,Nb)(C,N), and (Nb,Ti)(C,N) which is shown in Figure 6. The amount of 250 ppm Ti in 0.10 wt% C steel containing 110 ppm N strongly reduced BN content whereas the same amount of Ti in steel with 30 ppm N, eliminated precipitation of BN.
The precipitation process of (Ti,Nb)(C,N) depends on the content of titanium and nitrogen. An example shows DICTRA simulation which was performed using steel composition containing 0.10 wt% C, 0.031 wt% Nb, 250 ppm Ti and 30 ppm N. Figure 7 presents the result of the simulation with the cooling rate 0.6 K/s, illustrating the time-dependent two-steps precipitation process. The TiNI precipitates first, and then it is joined by niobium, finally becoming a (Ti,Nb)(C,N) particle.
Figure 8 shows the results of a PRISMA simulation of the precipitation nucleation and growth of Fe2B, (Ti,Nb)(C,N) and AlN particles. The simulation was performed using a steel composition containing 0.10 wt% C, 0.031 wt% Nb, 250 ppm Ti and 30 ppm N and applying a cooling rate of 0.6 K/s. The nucleation and growth of Fe2B takes only 0.3 s and is followed by particle coarsening. The nucleation and growth of the (Ti,Nb)(C,N) precipitate proceeds in two steps, which is also marked in Figure 8. Precipitation of AlN is dependent on the amount of nitrogen, and very little nitrogen was available for the AlN.

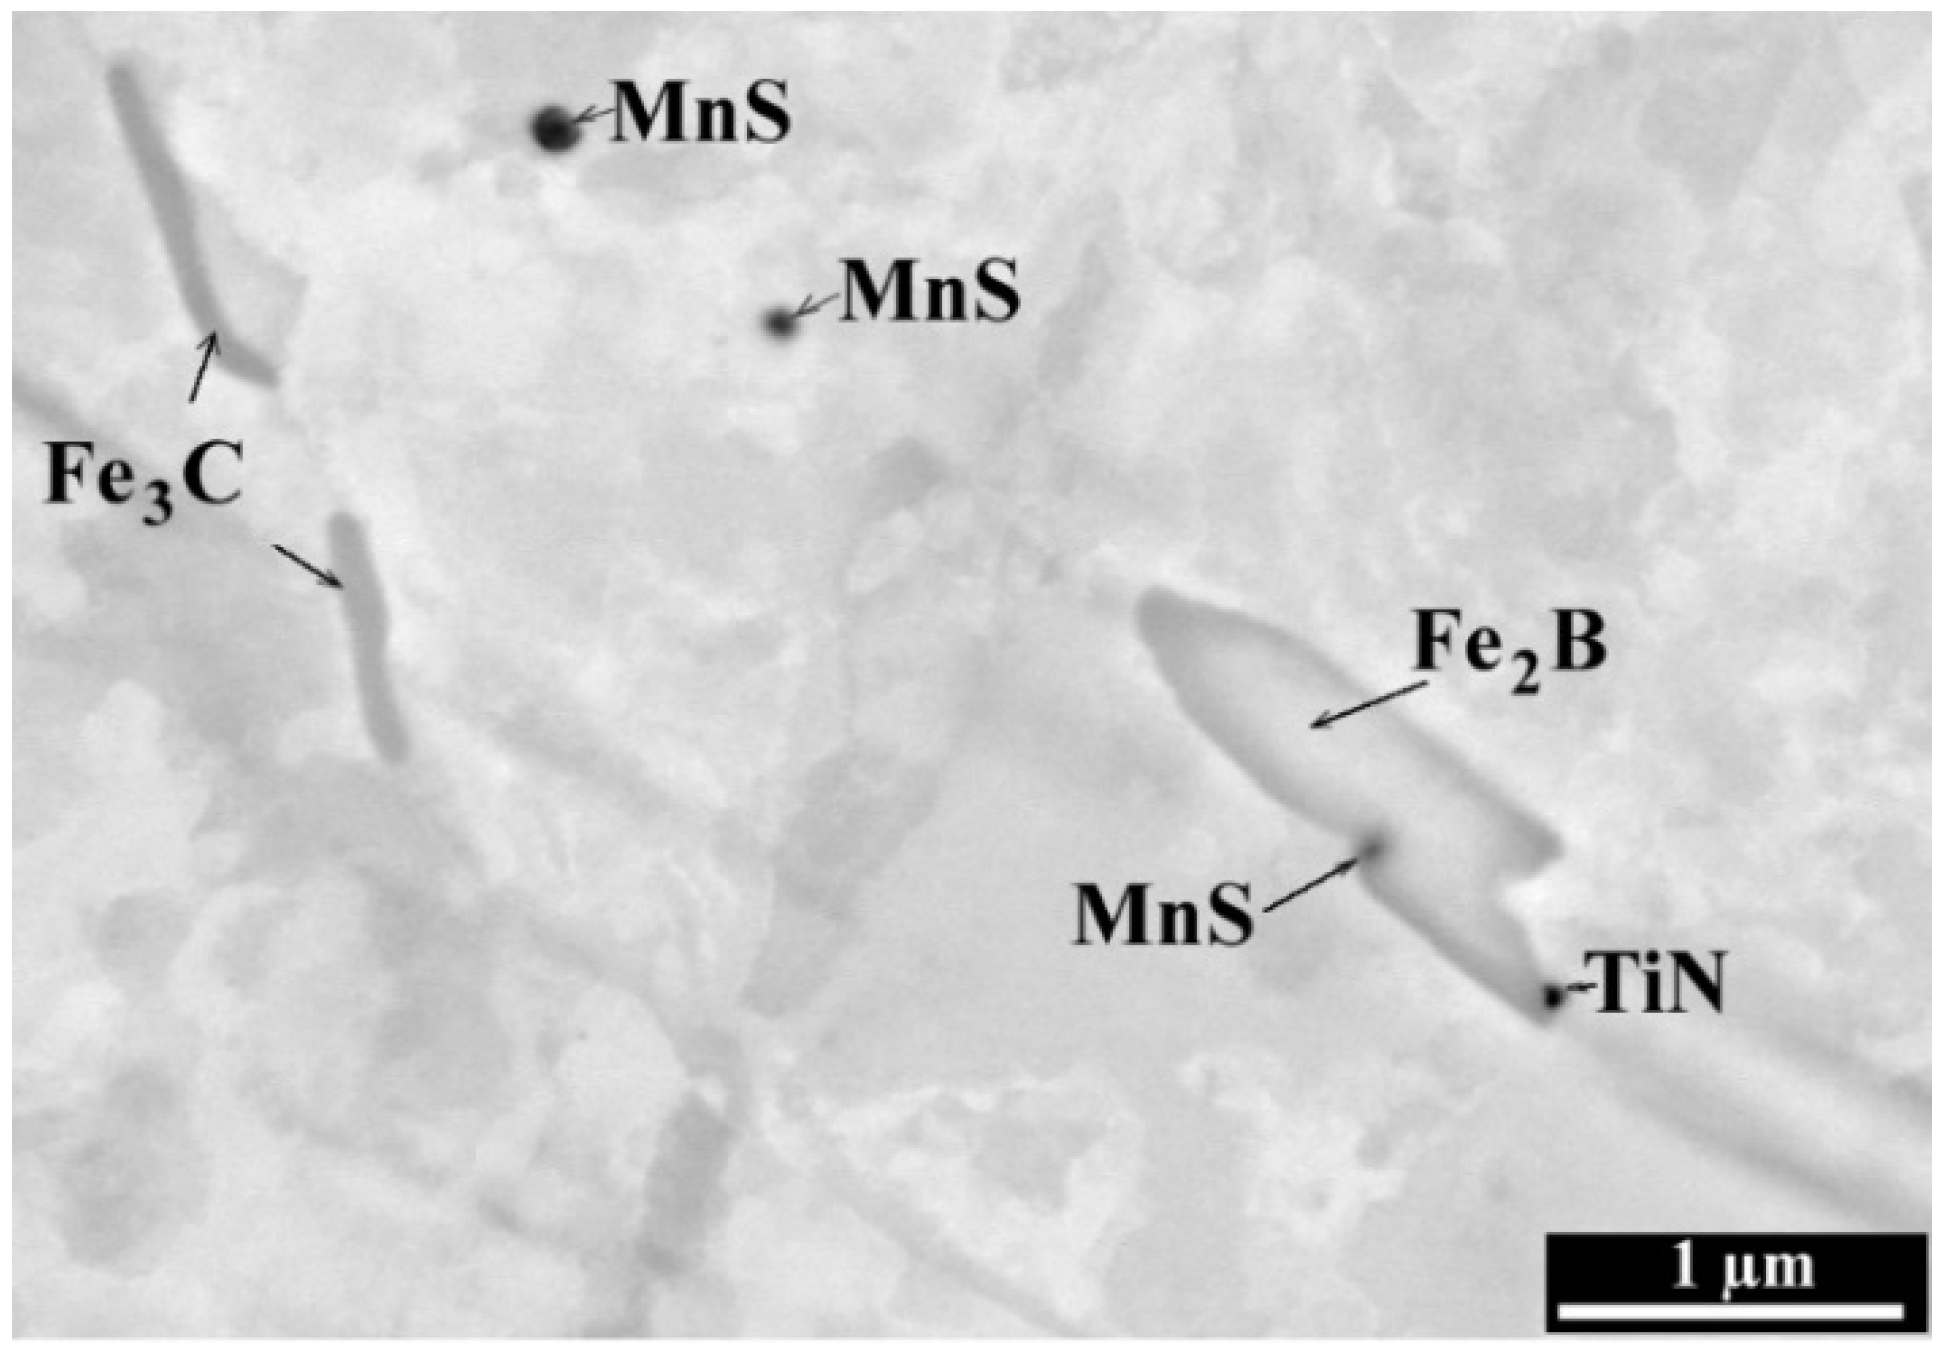
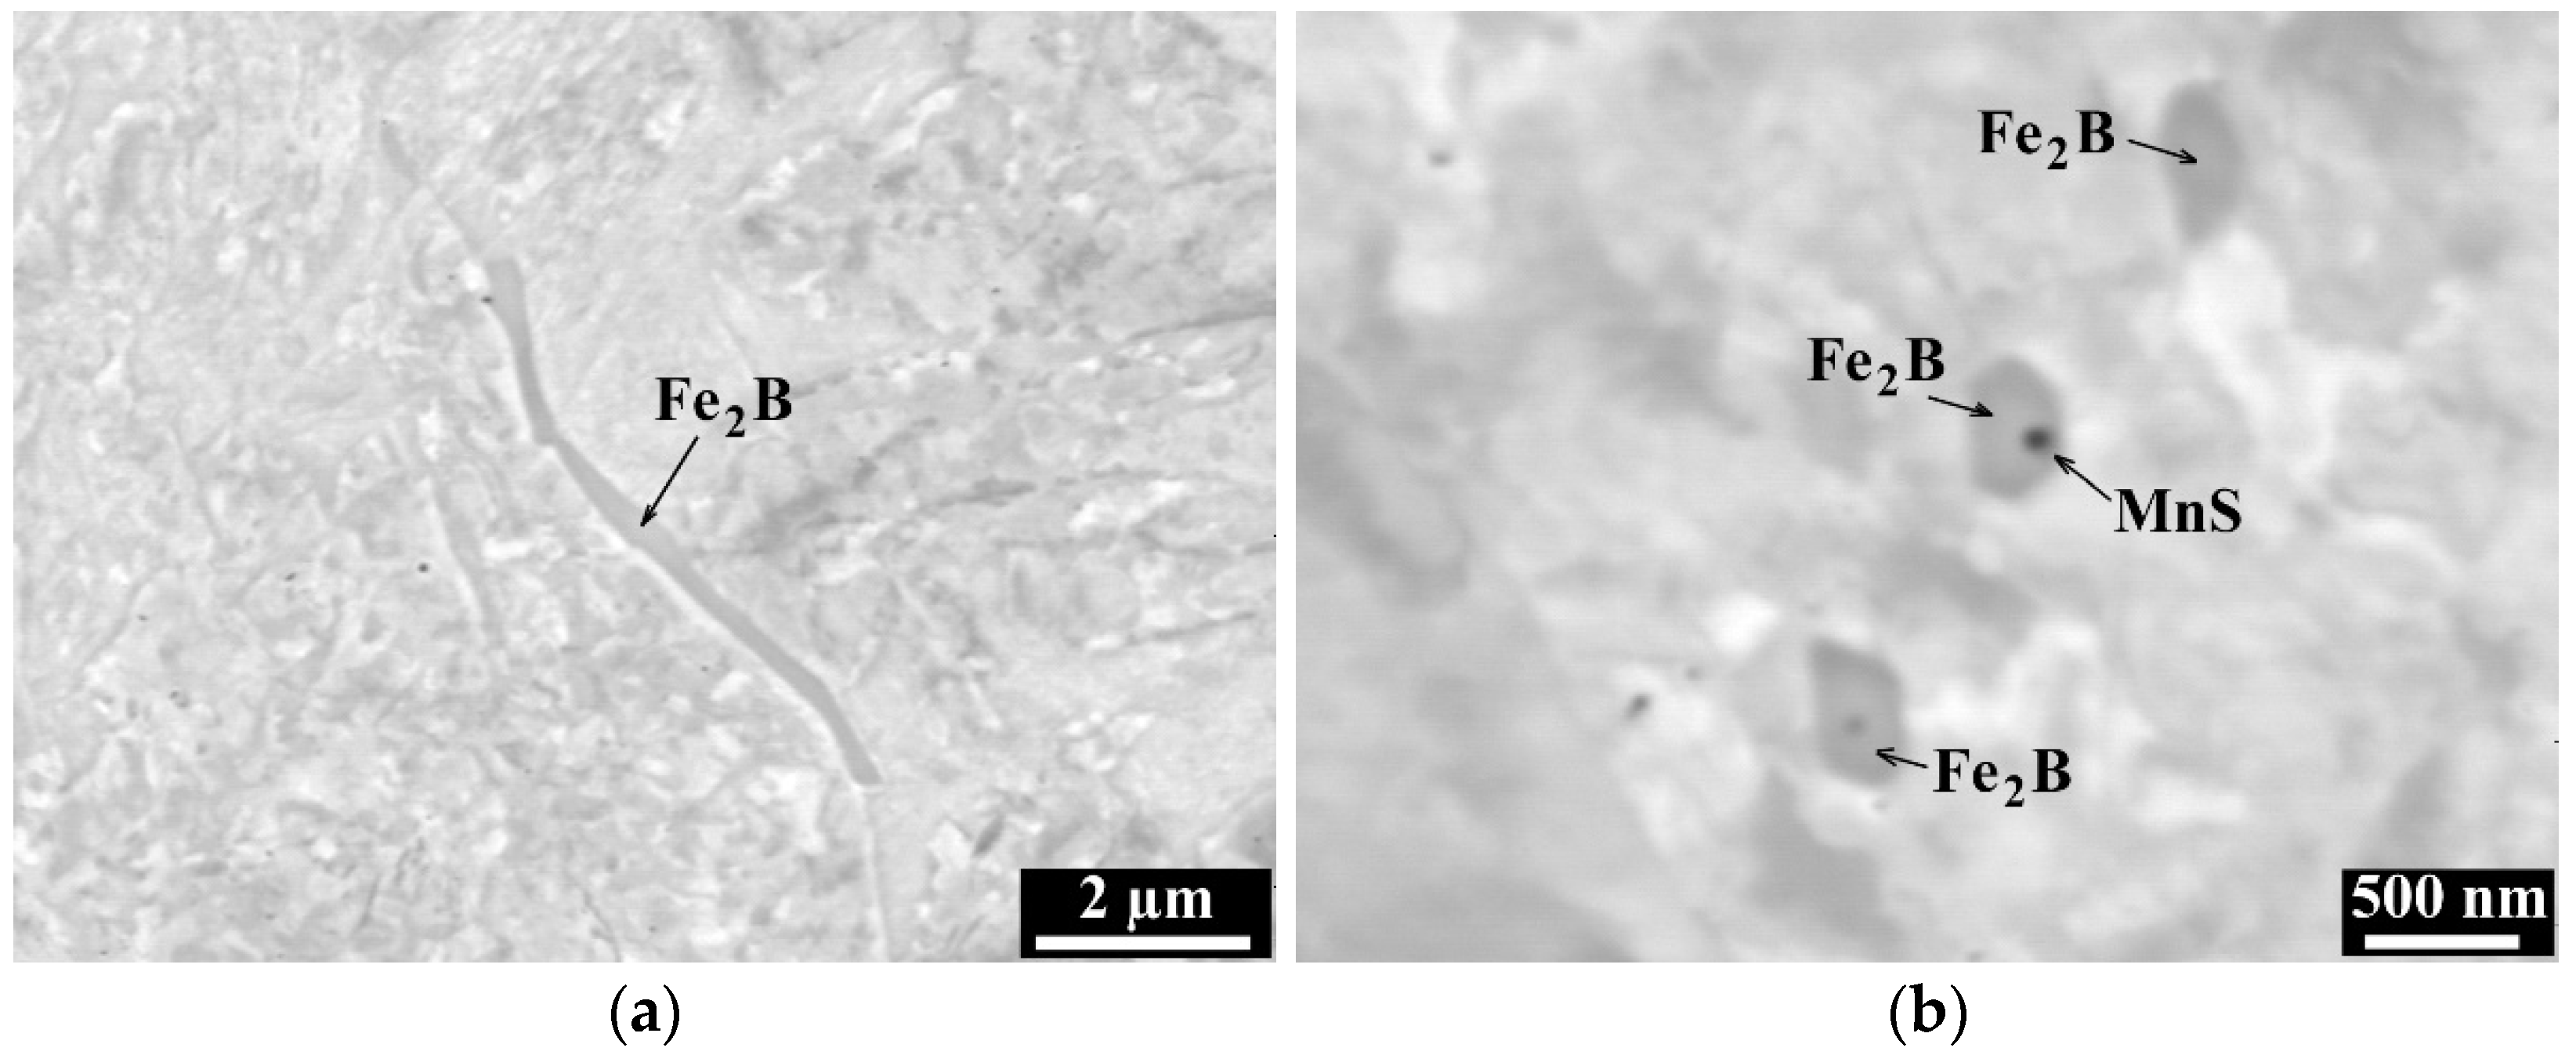
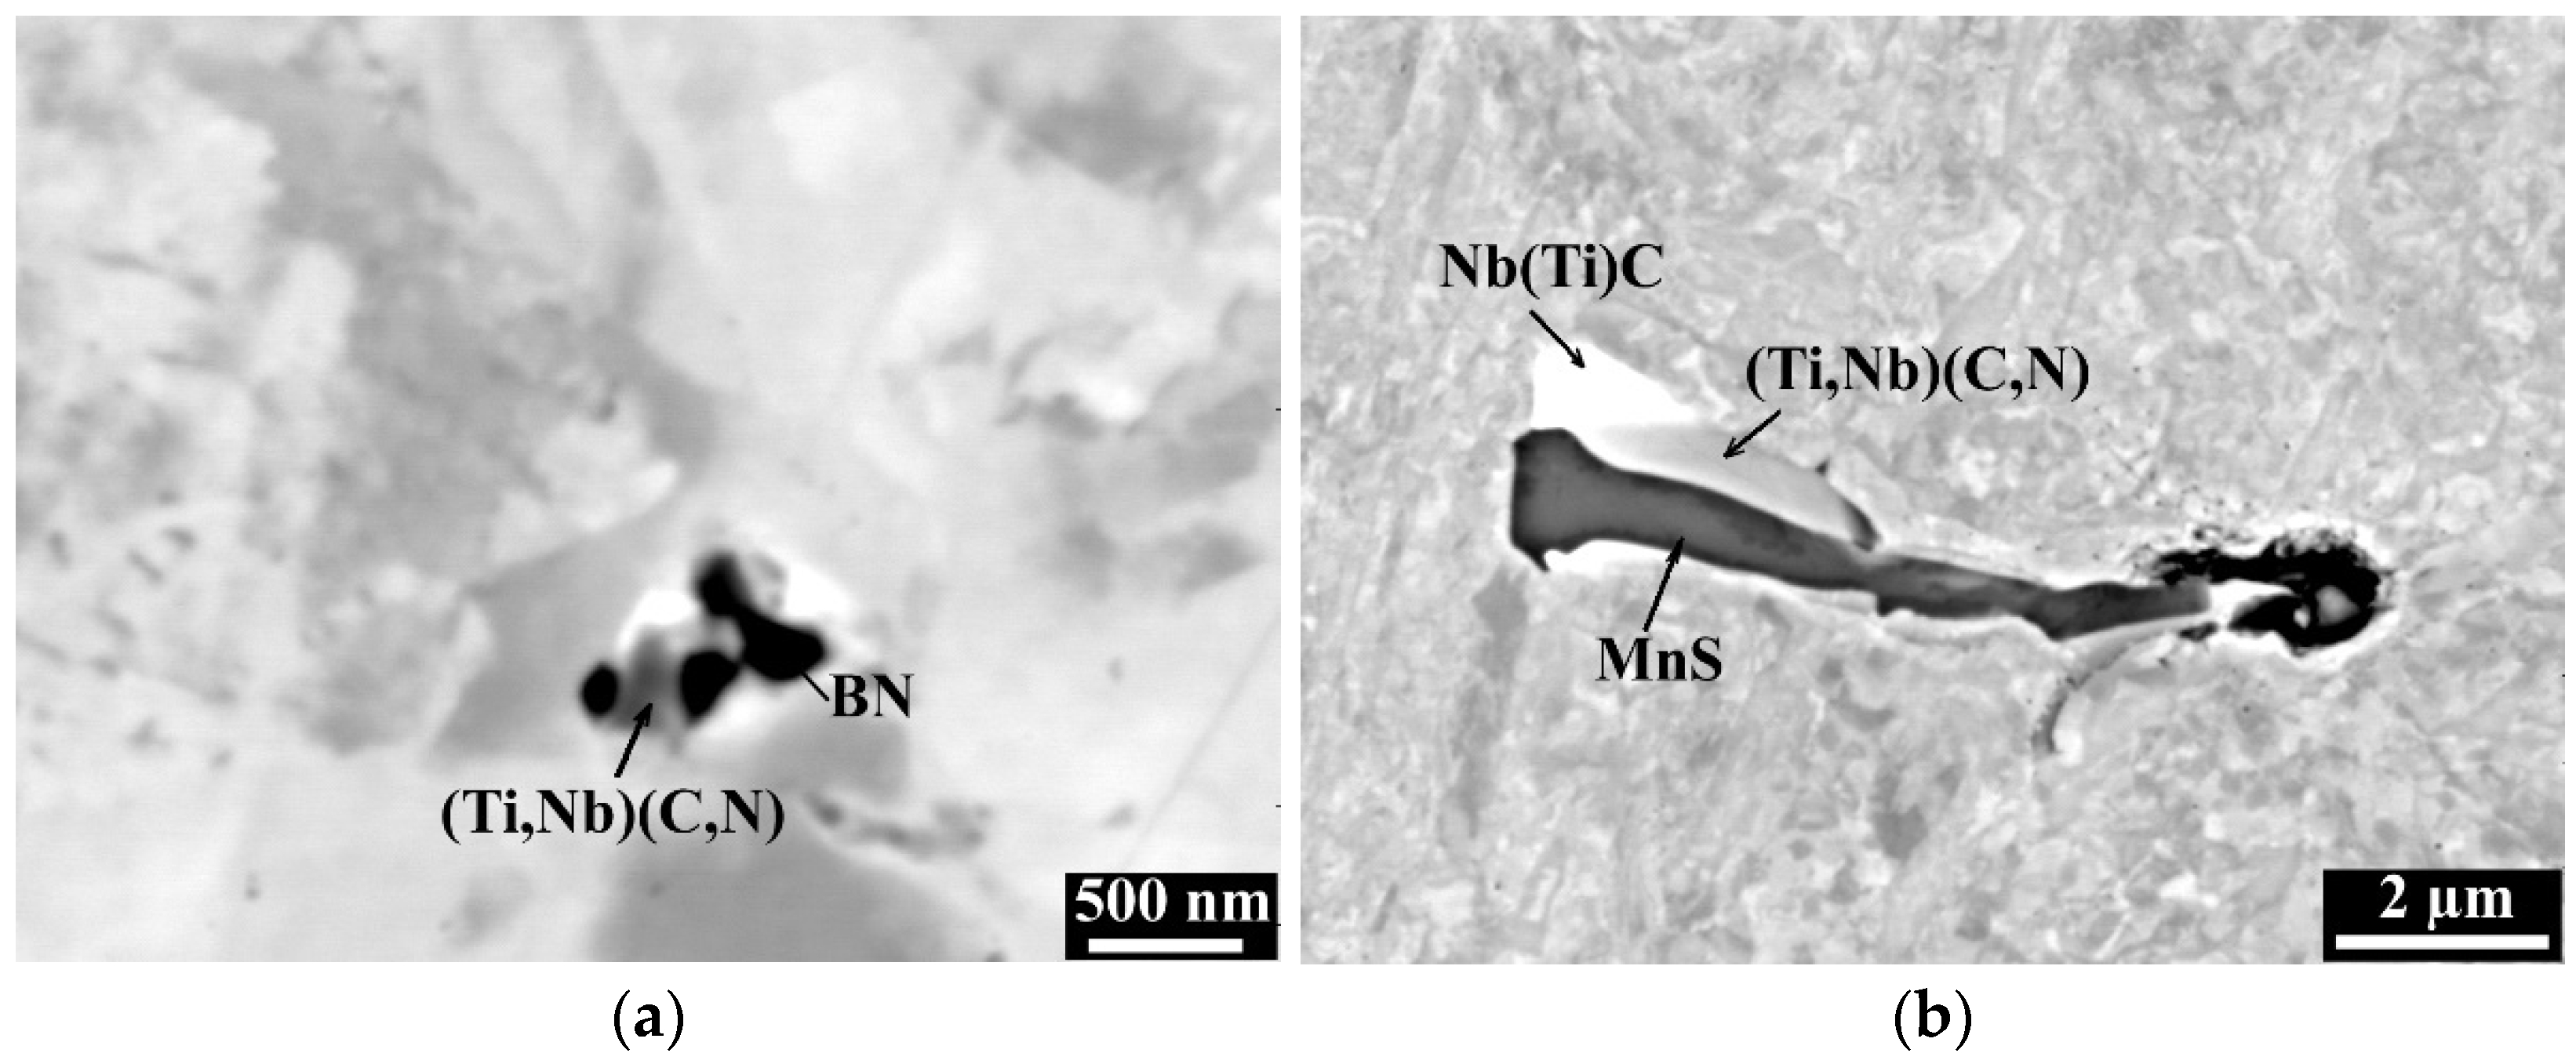
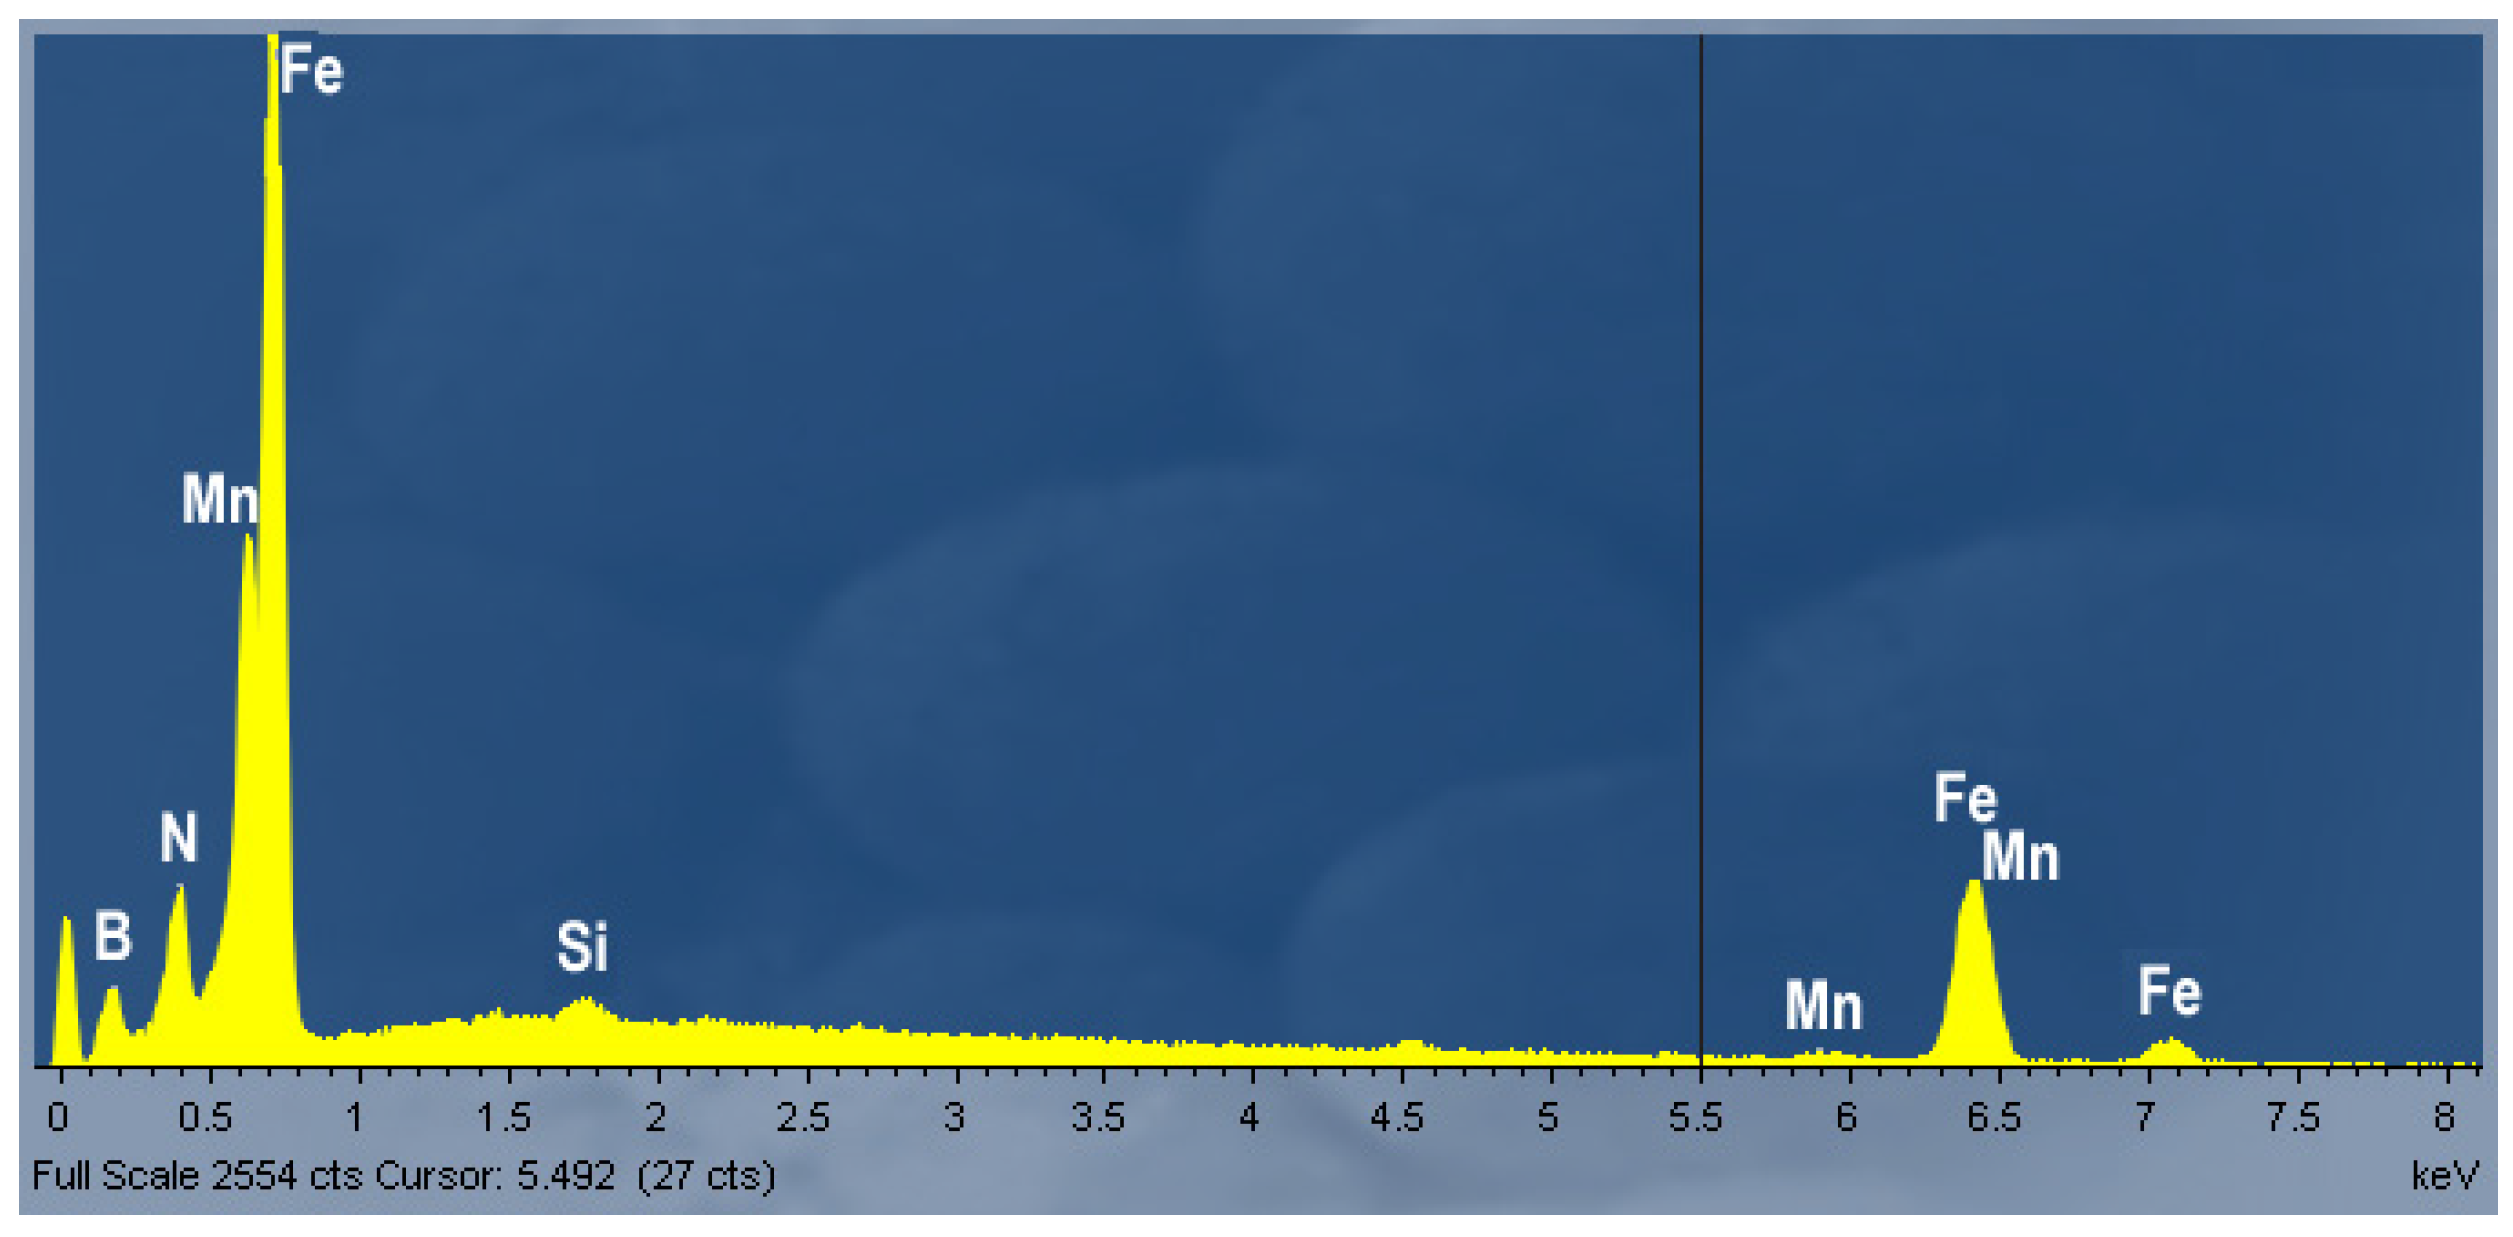
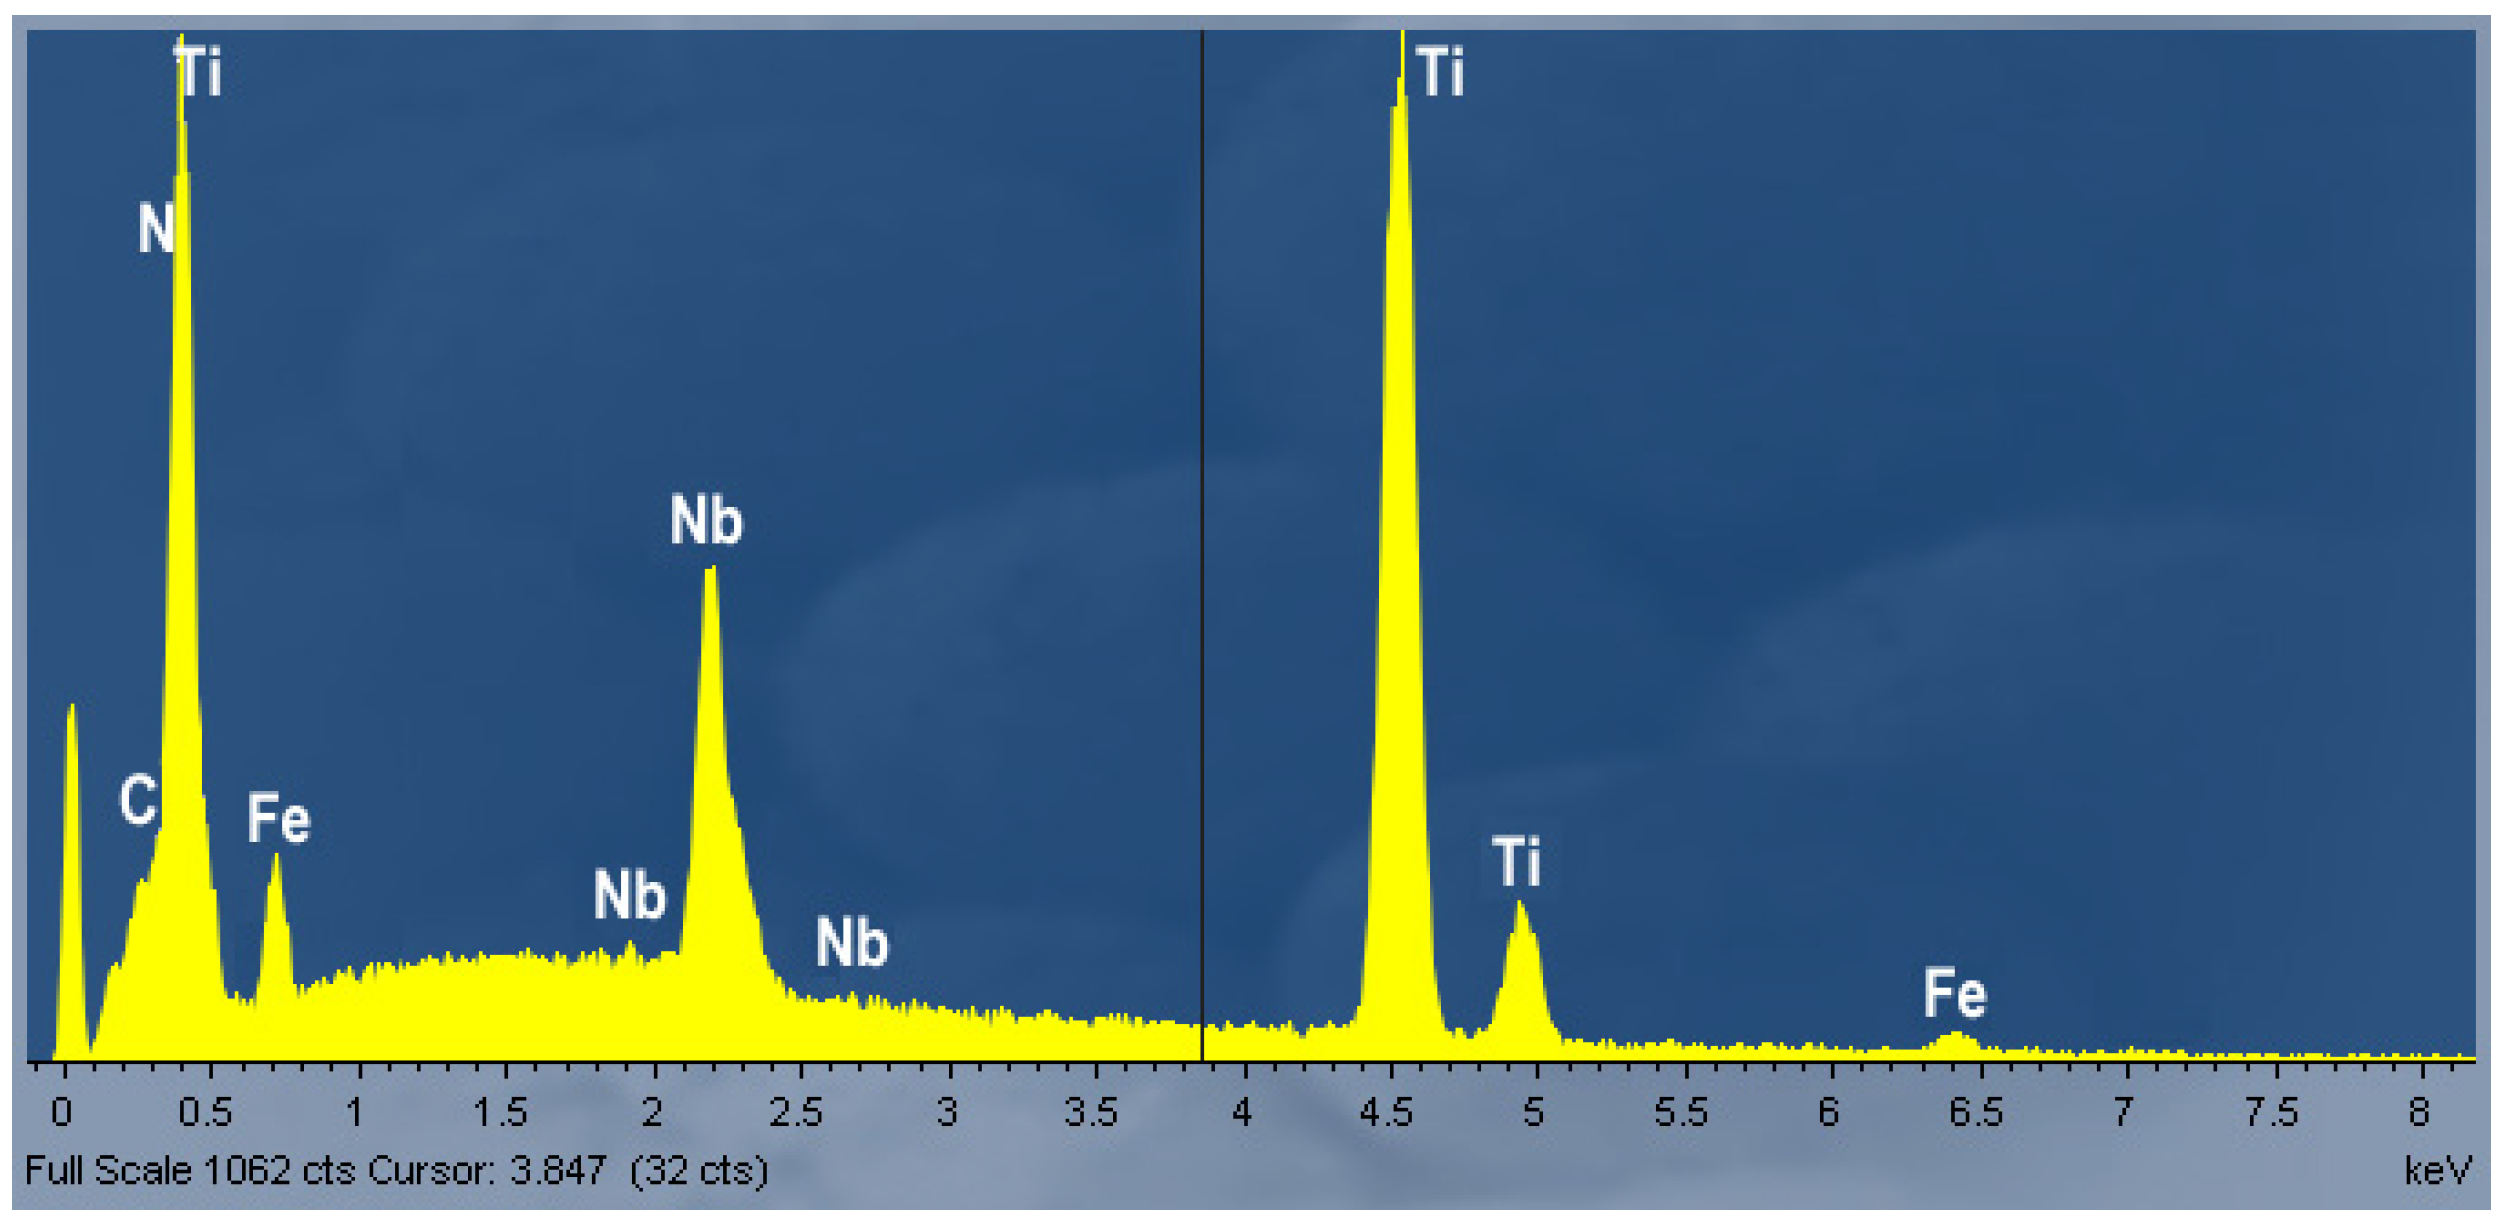
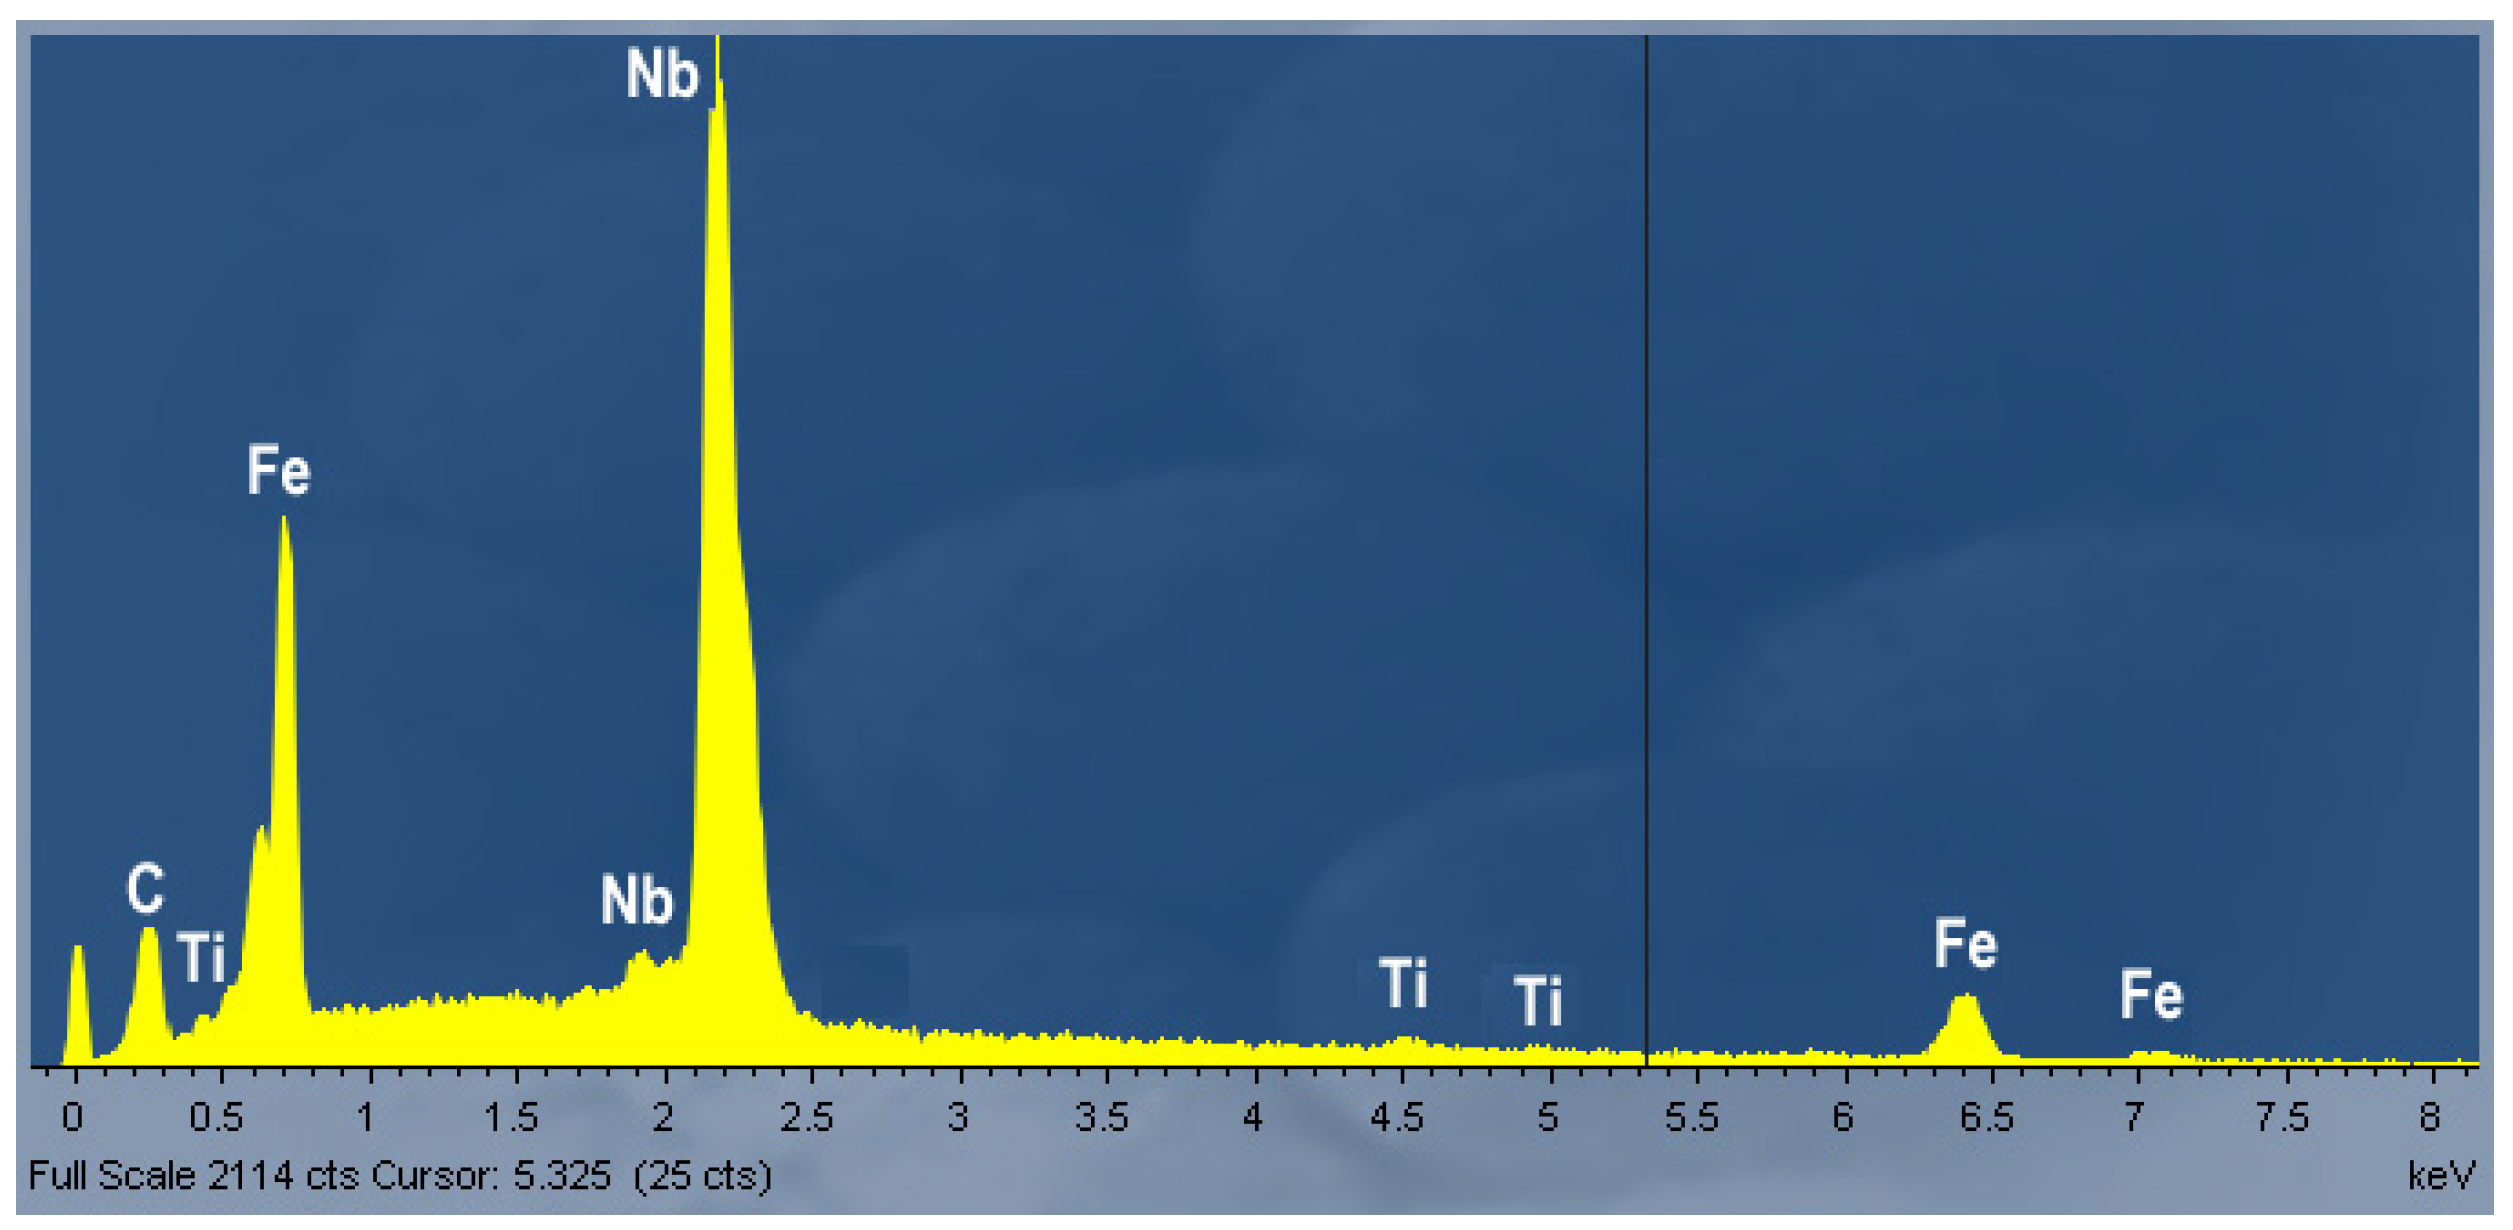
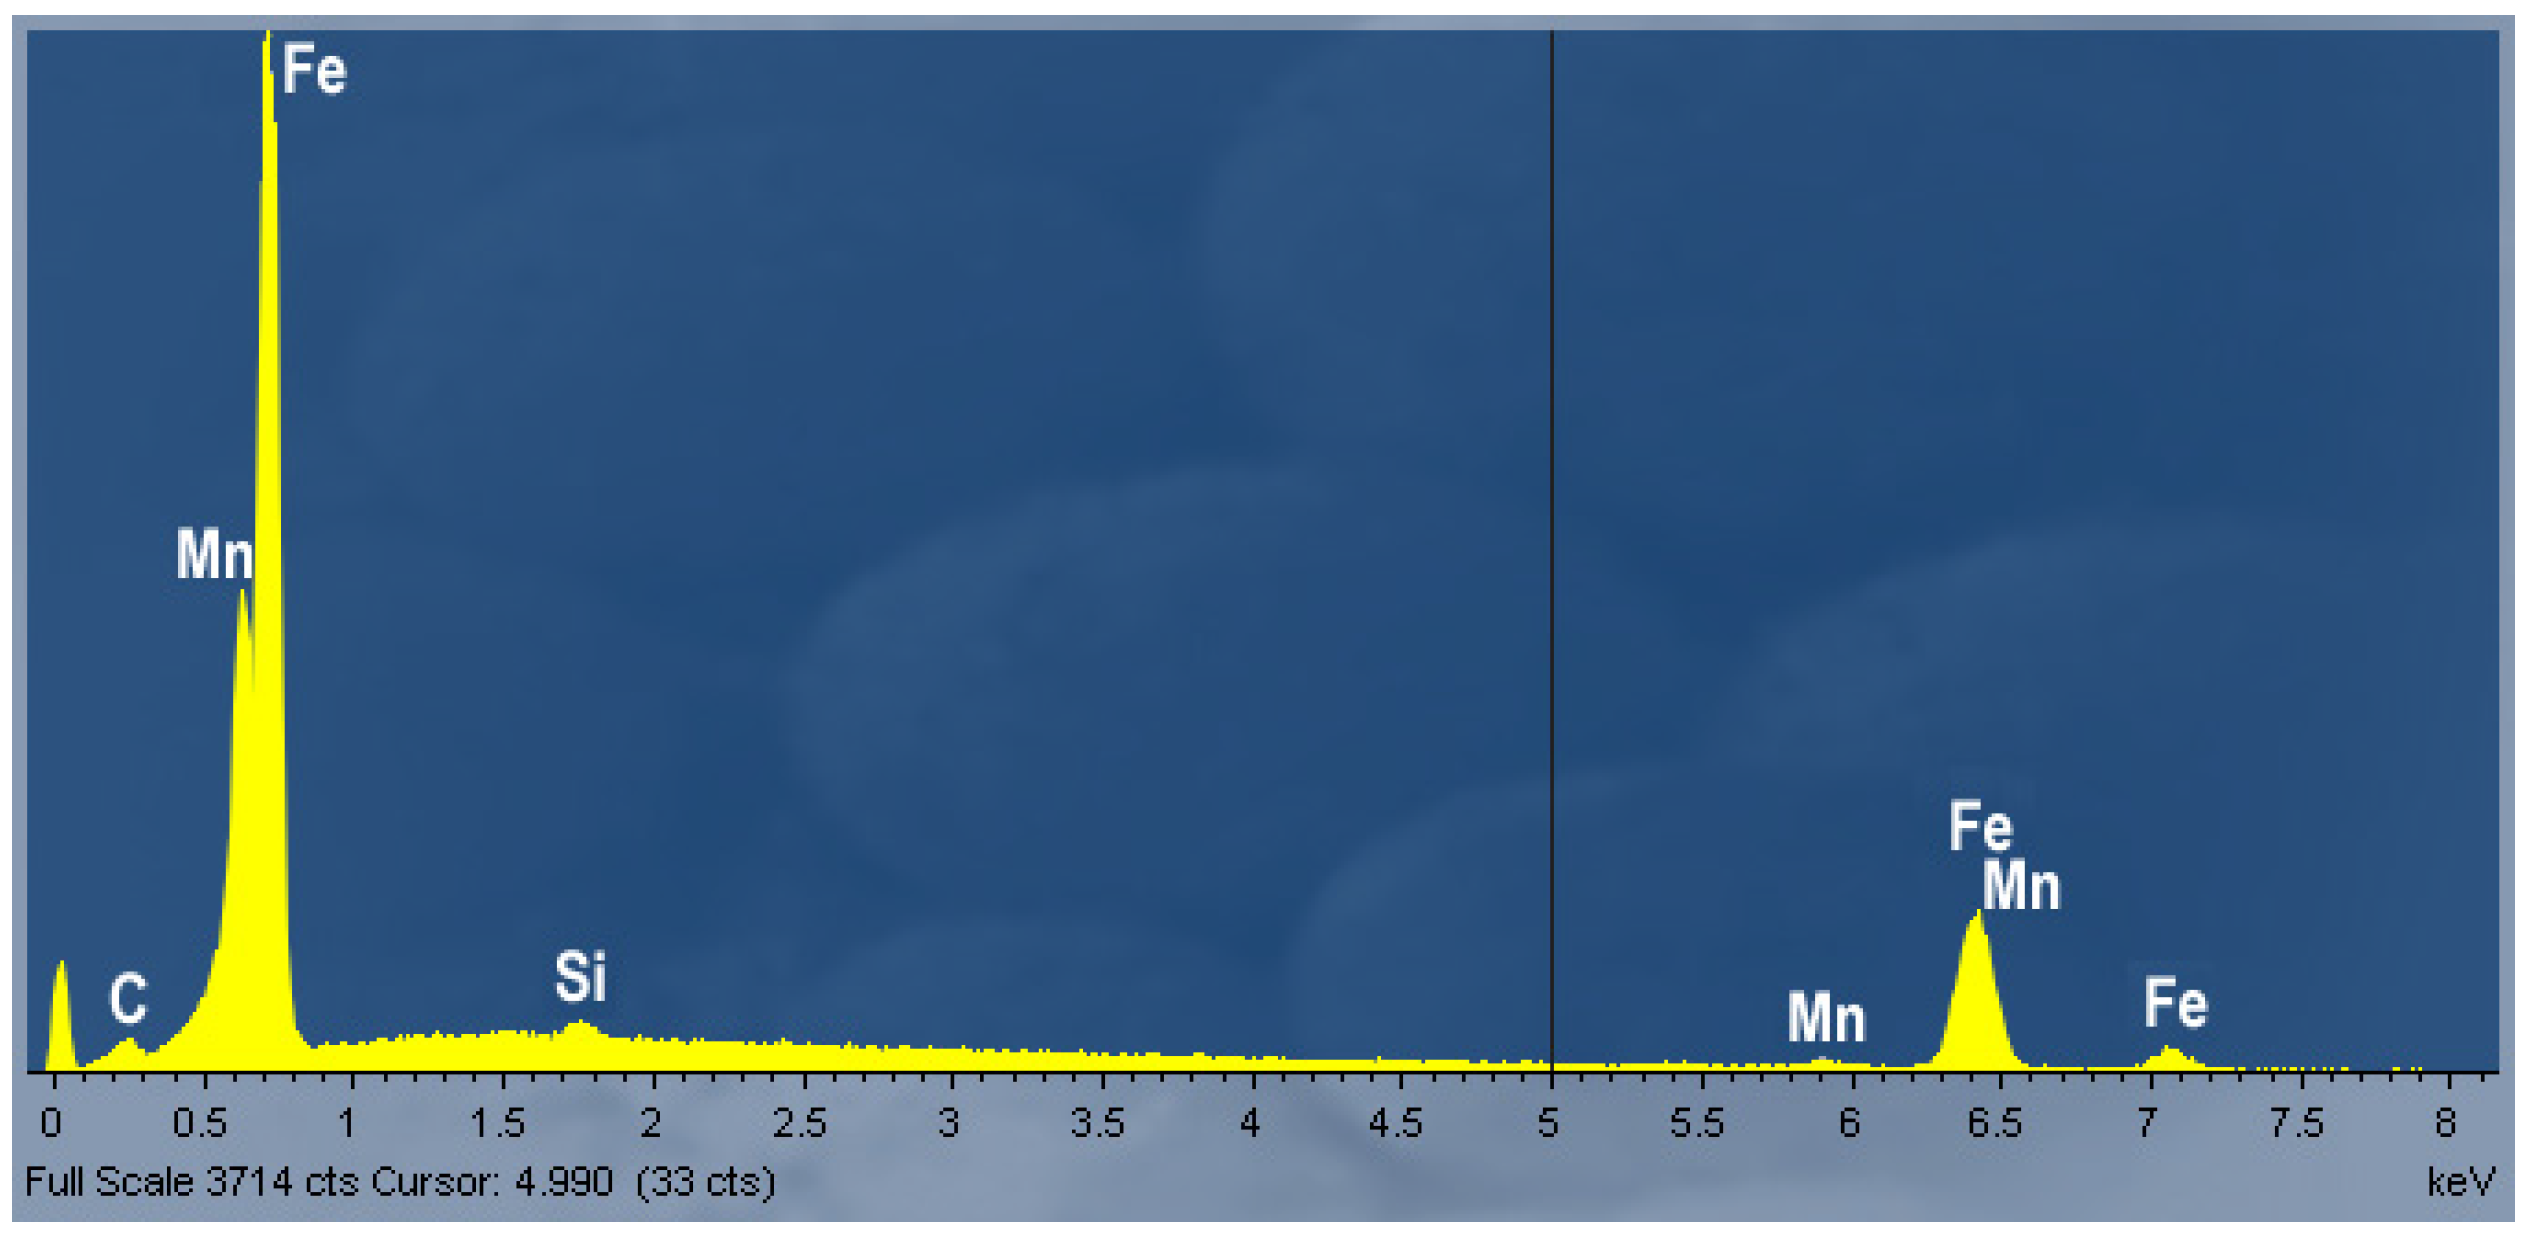
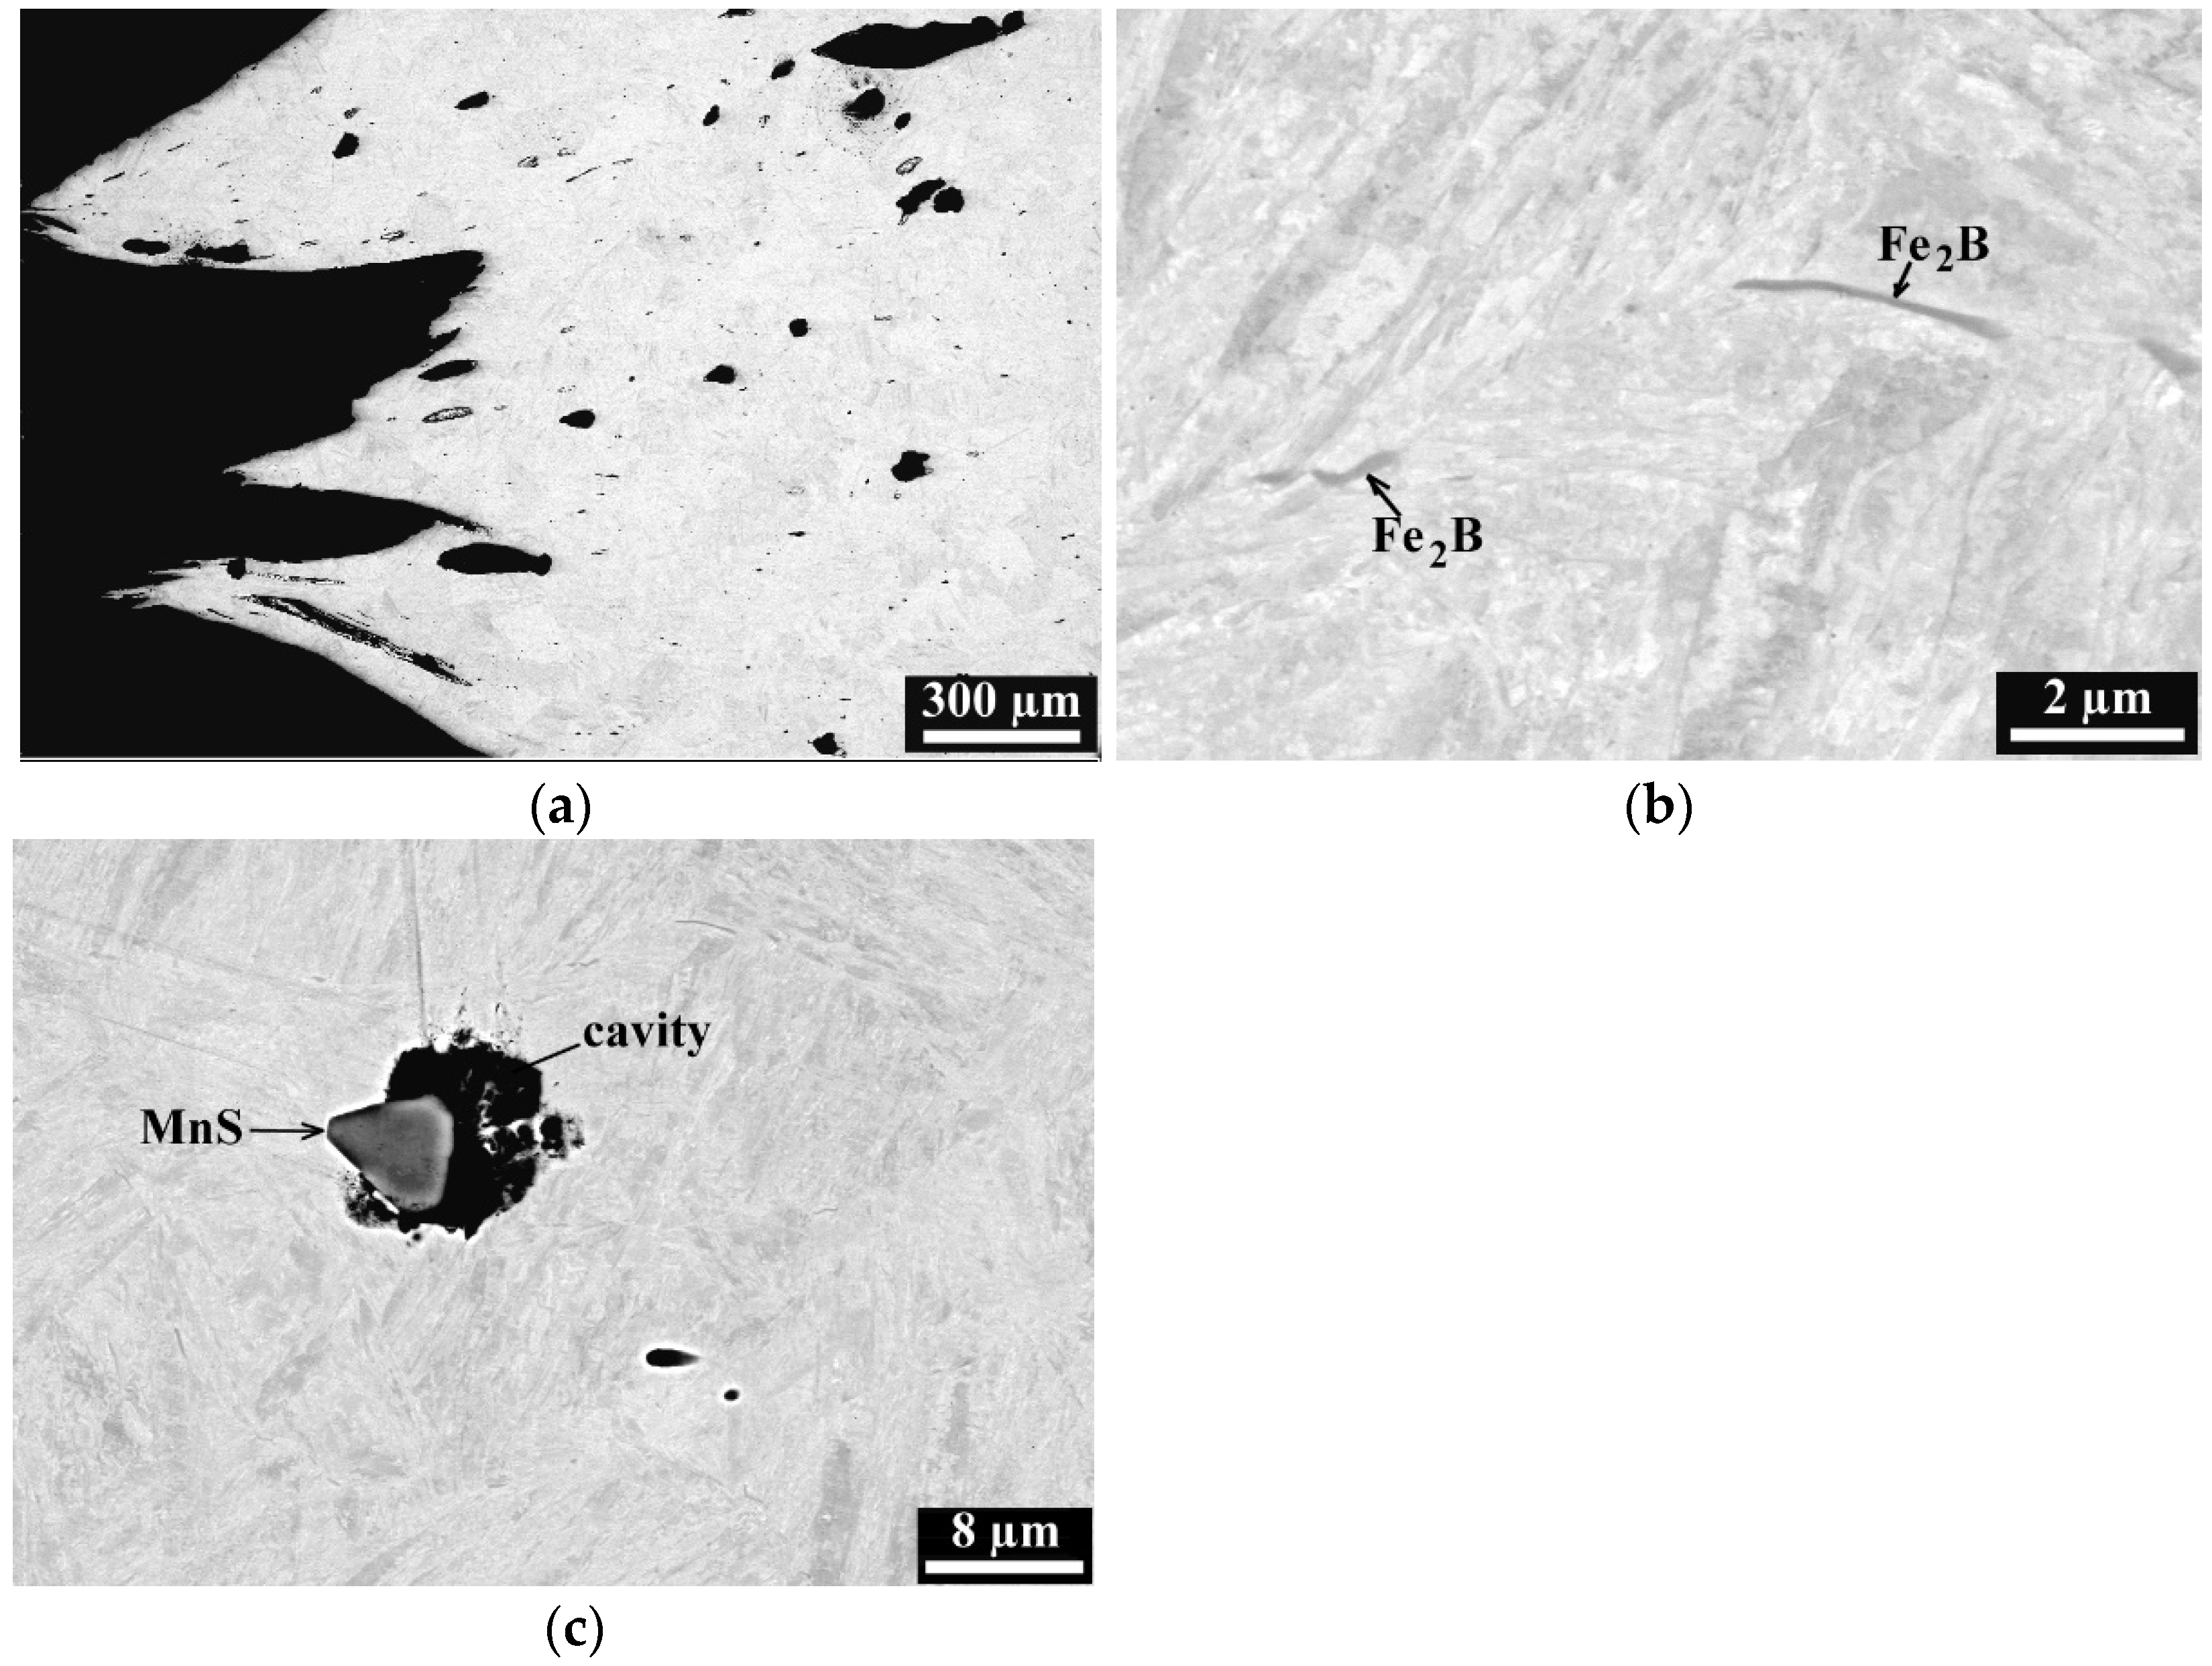
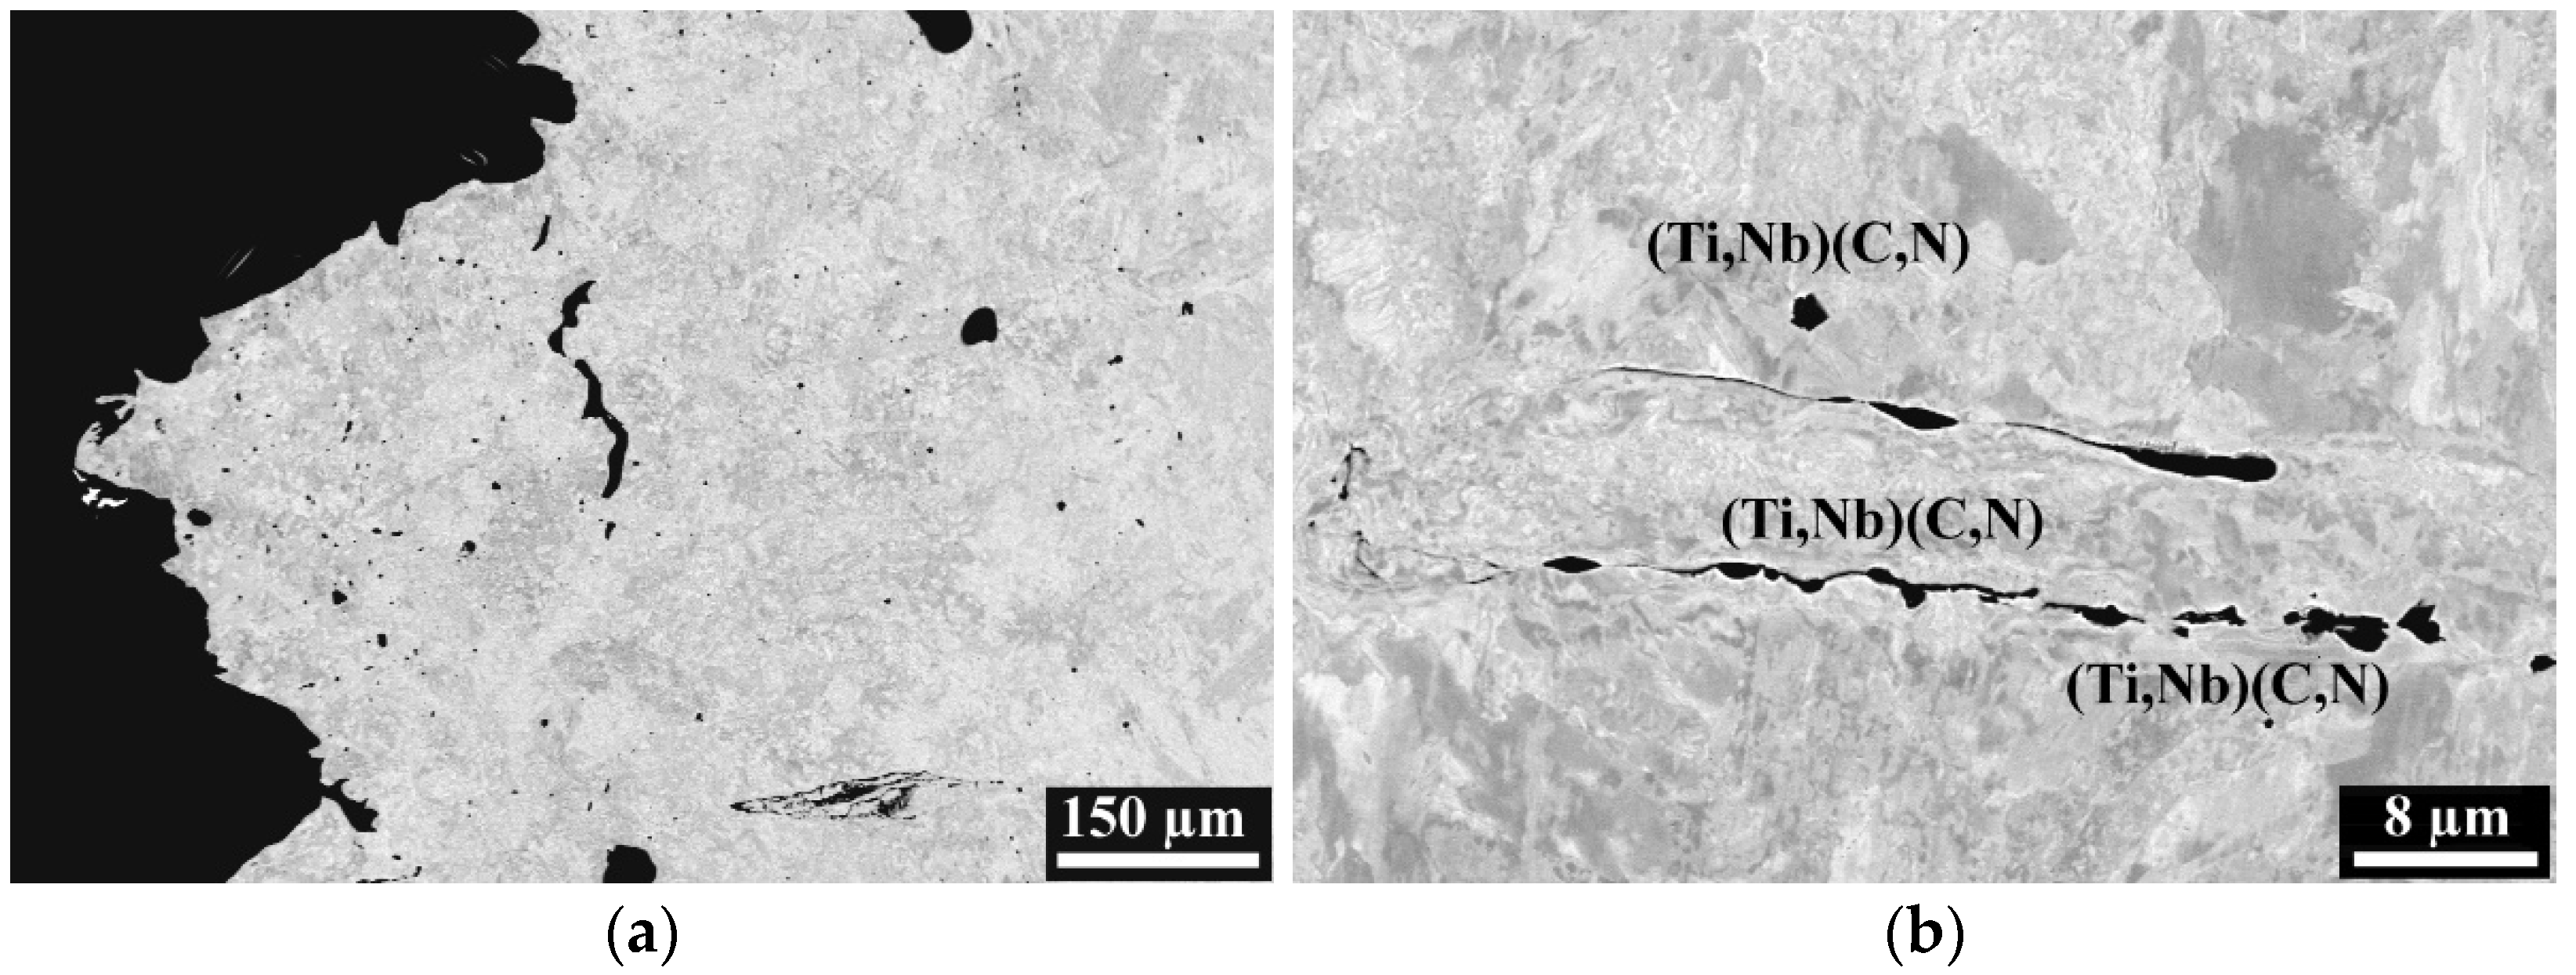
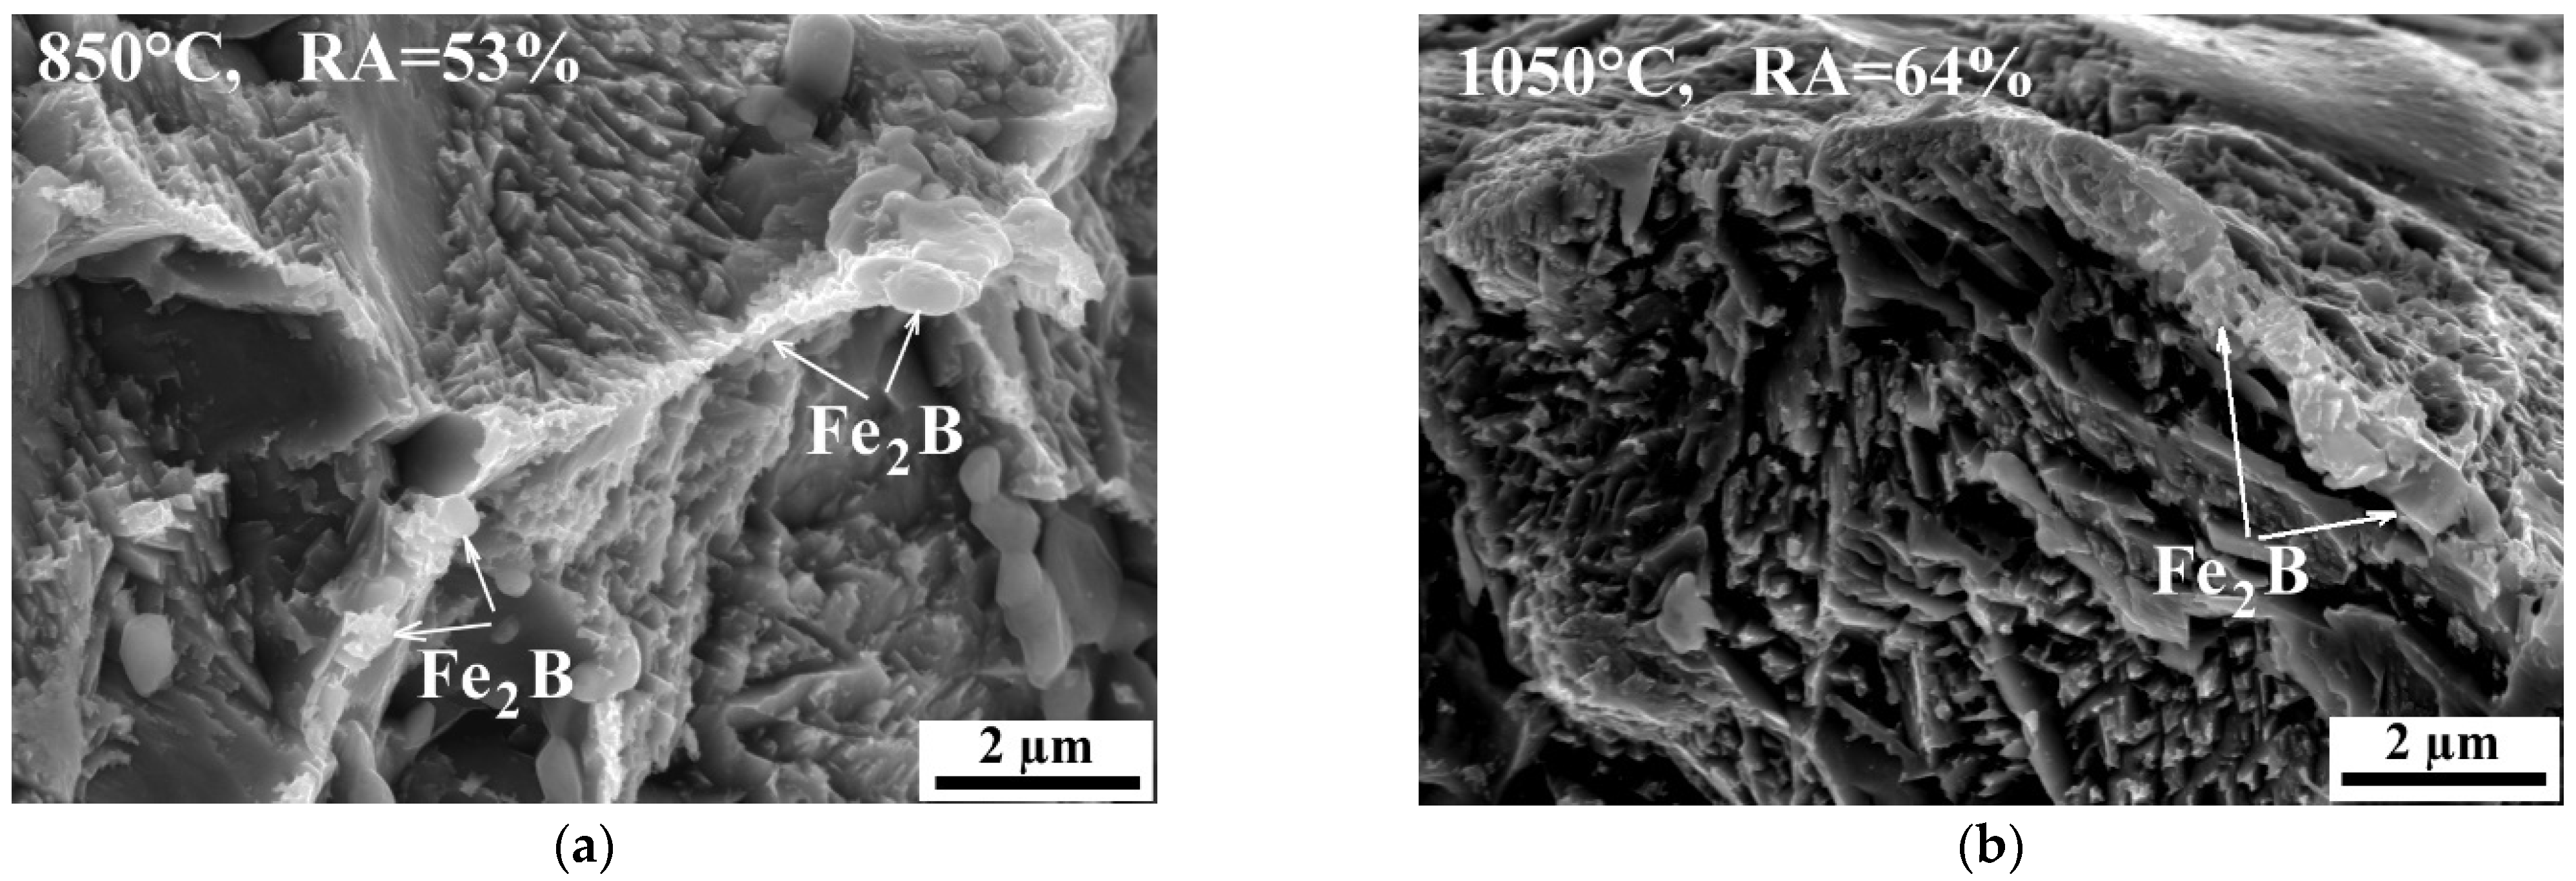
3.2. Metallographic Investigation

Steel specimens were investigated using Field Emission Gun SEM (FEG SEM). To minimize the X-ray signal from the matrix when analyzing small particles using the energy dispersive X-ray spectrometer (EDX), a 10 kV accelerating voltage was applied. The micrographs presented in the following Figure 9, Figure 10, Figure 11, Figure 12, Figure 13, Figure 14, Figure 15, Figure 16, Figure 17 and Figure 18 were taken in a back-scattered electron (BSE) mode and show microstructure details in the atomic number contrast. This means that the gray levels are related to the object average atomic weight. The lighter the atomic weight, the darker the object is on the iron-dominated background (matrix) in the micrograph (ref. black boron nitride in Figure 12a). The opposite is also valid, i.e., the heavier the atomic weight, the brighter the object is in the image. This is shown by the white niobium carbide in Figure 12b. Since the specimens were very fine mechanically polished, the BSE mode also reveals the channeling contrast in the image, where the gray levels are also dependent on the local variation in the crystallographic orientation—this is shown in the matrix with more diffusive gray levels distributions.
Figure 9 shows the electron micrograph in back-scattered electron (BSE) mode where the elements in the precipitates were identified using EDX spectrometer. The microstructure belongs to the S4 steel specimen in the as-cast condition before it was hot tensile tested. X-ray energy spectra of Fe2B, Fe3C and of the surrounding matrix are shown in Figure 10. Cementite particles Fe3C that did not include boron were found separated from the Fe2B. It is shown that small, 25 nm precipitates of TiN and MnS can be the nucleation sites for Fe2B particles. The identification of the particle types was supported by the Thermo-Calc simulation results.
Scanning electron micrographs (BSE mode) shown in Figure 11 and Figure 12 present different types and morphologies of precipitate particles found in the steels before they were hot ductility tested. Fe2B is beneficial for the hot ductility and often precipitates along the prior austenite grain boundaries. It can be found either in an elongated or in a round/elliptic shape.
The precipitation of boron nitride, BN, is detrimental for the hot ductility of steel. MnS and Nb-carbides/carbo-nitrides can also affect hot ductility, depending on their amount and size.
EDX spectra presented in Figure 13, Figure 14 and Figure 15 were obtained from the particles that are shown in Figure 12a,b. The particle size together with the relatively low accelerating voltage of 10 kV, allowed for a minimizing of the matrix signal containing iron, manganese and silicon in every spectrum. The EDX spectrum of the matrix is shown in Figure 16.
Figure 17 and Figure 18 illustrate the behavior of Fe2B and (Ti,Nb)(C,N) precipitate particles in the hot tensile tested steel specimens. On the contrary to the MnS particle that contributed to the void formation, Fe2B precipitation was coherent with the matrix and followed the matrix deformation during hot tensile test of S7 steel (Figure 17). The addition of higher Ti (270 ppm) in S8 steel caused an intensified precipitation of (Ti,Nb)(C,N) (Figure 18) which increased steel susceptibility to cracking and lowered the hot ductility. No boron nitride particles were observed in any of the S7 or S8 steels.

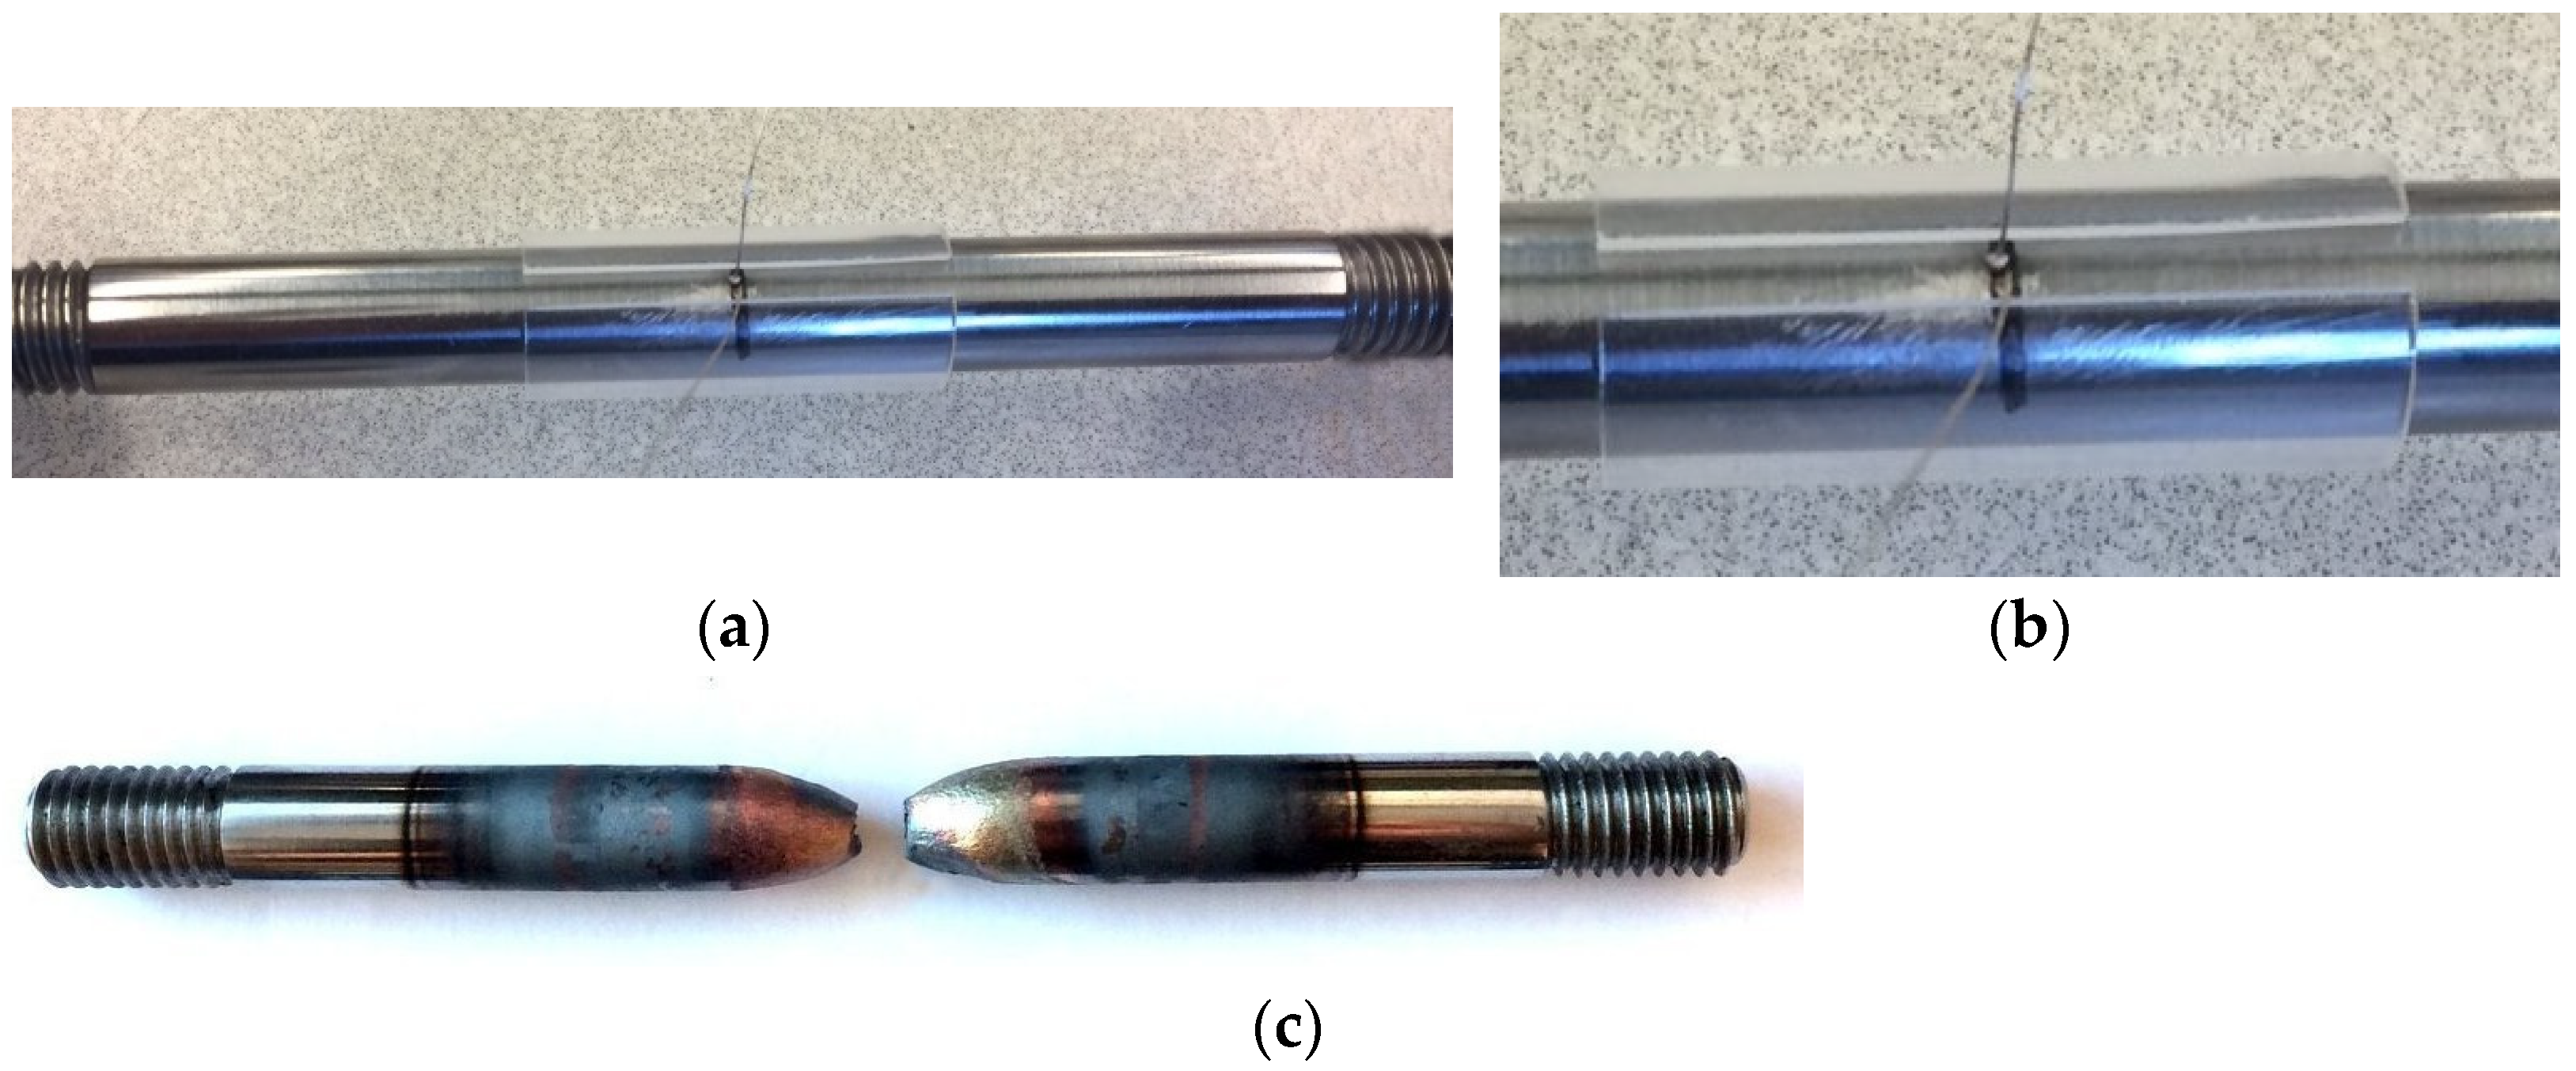
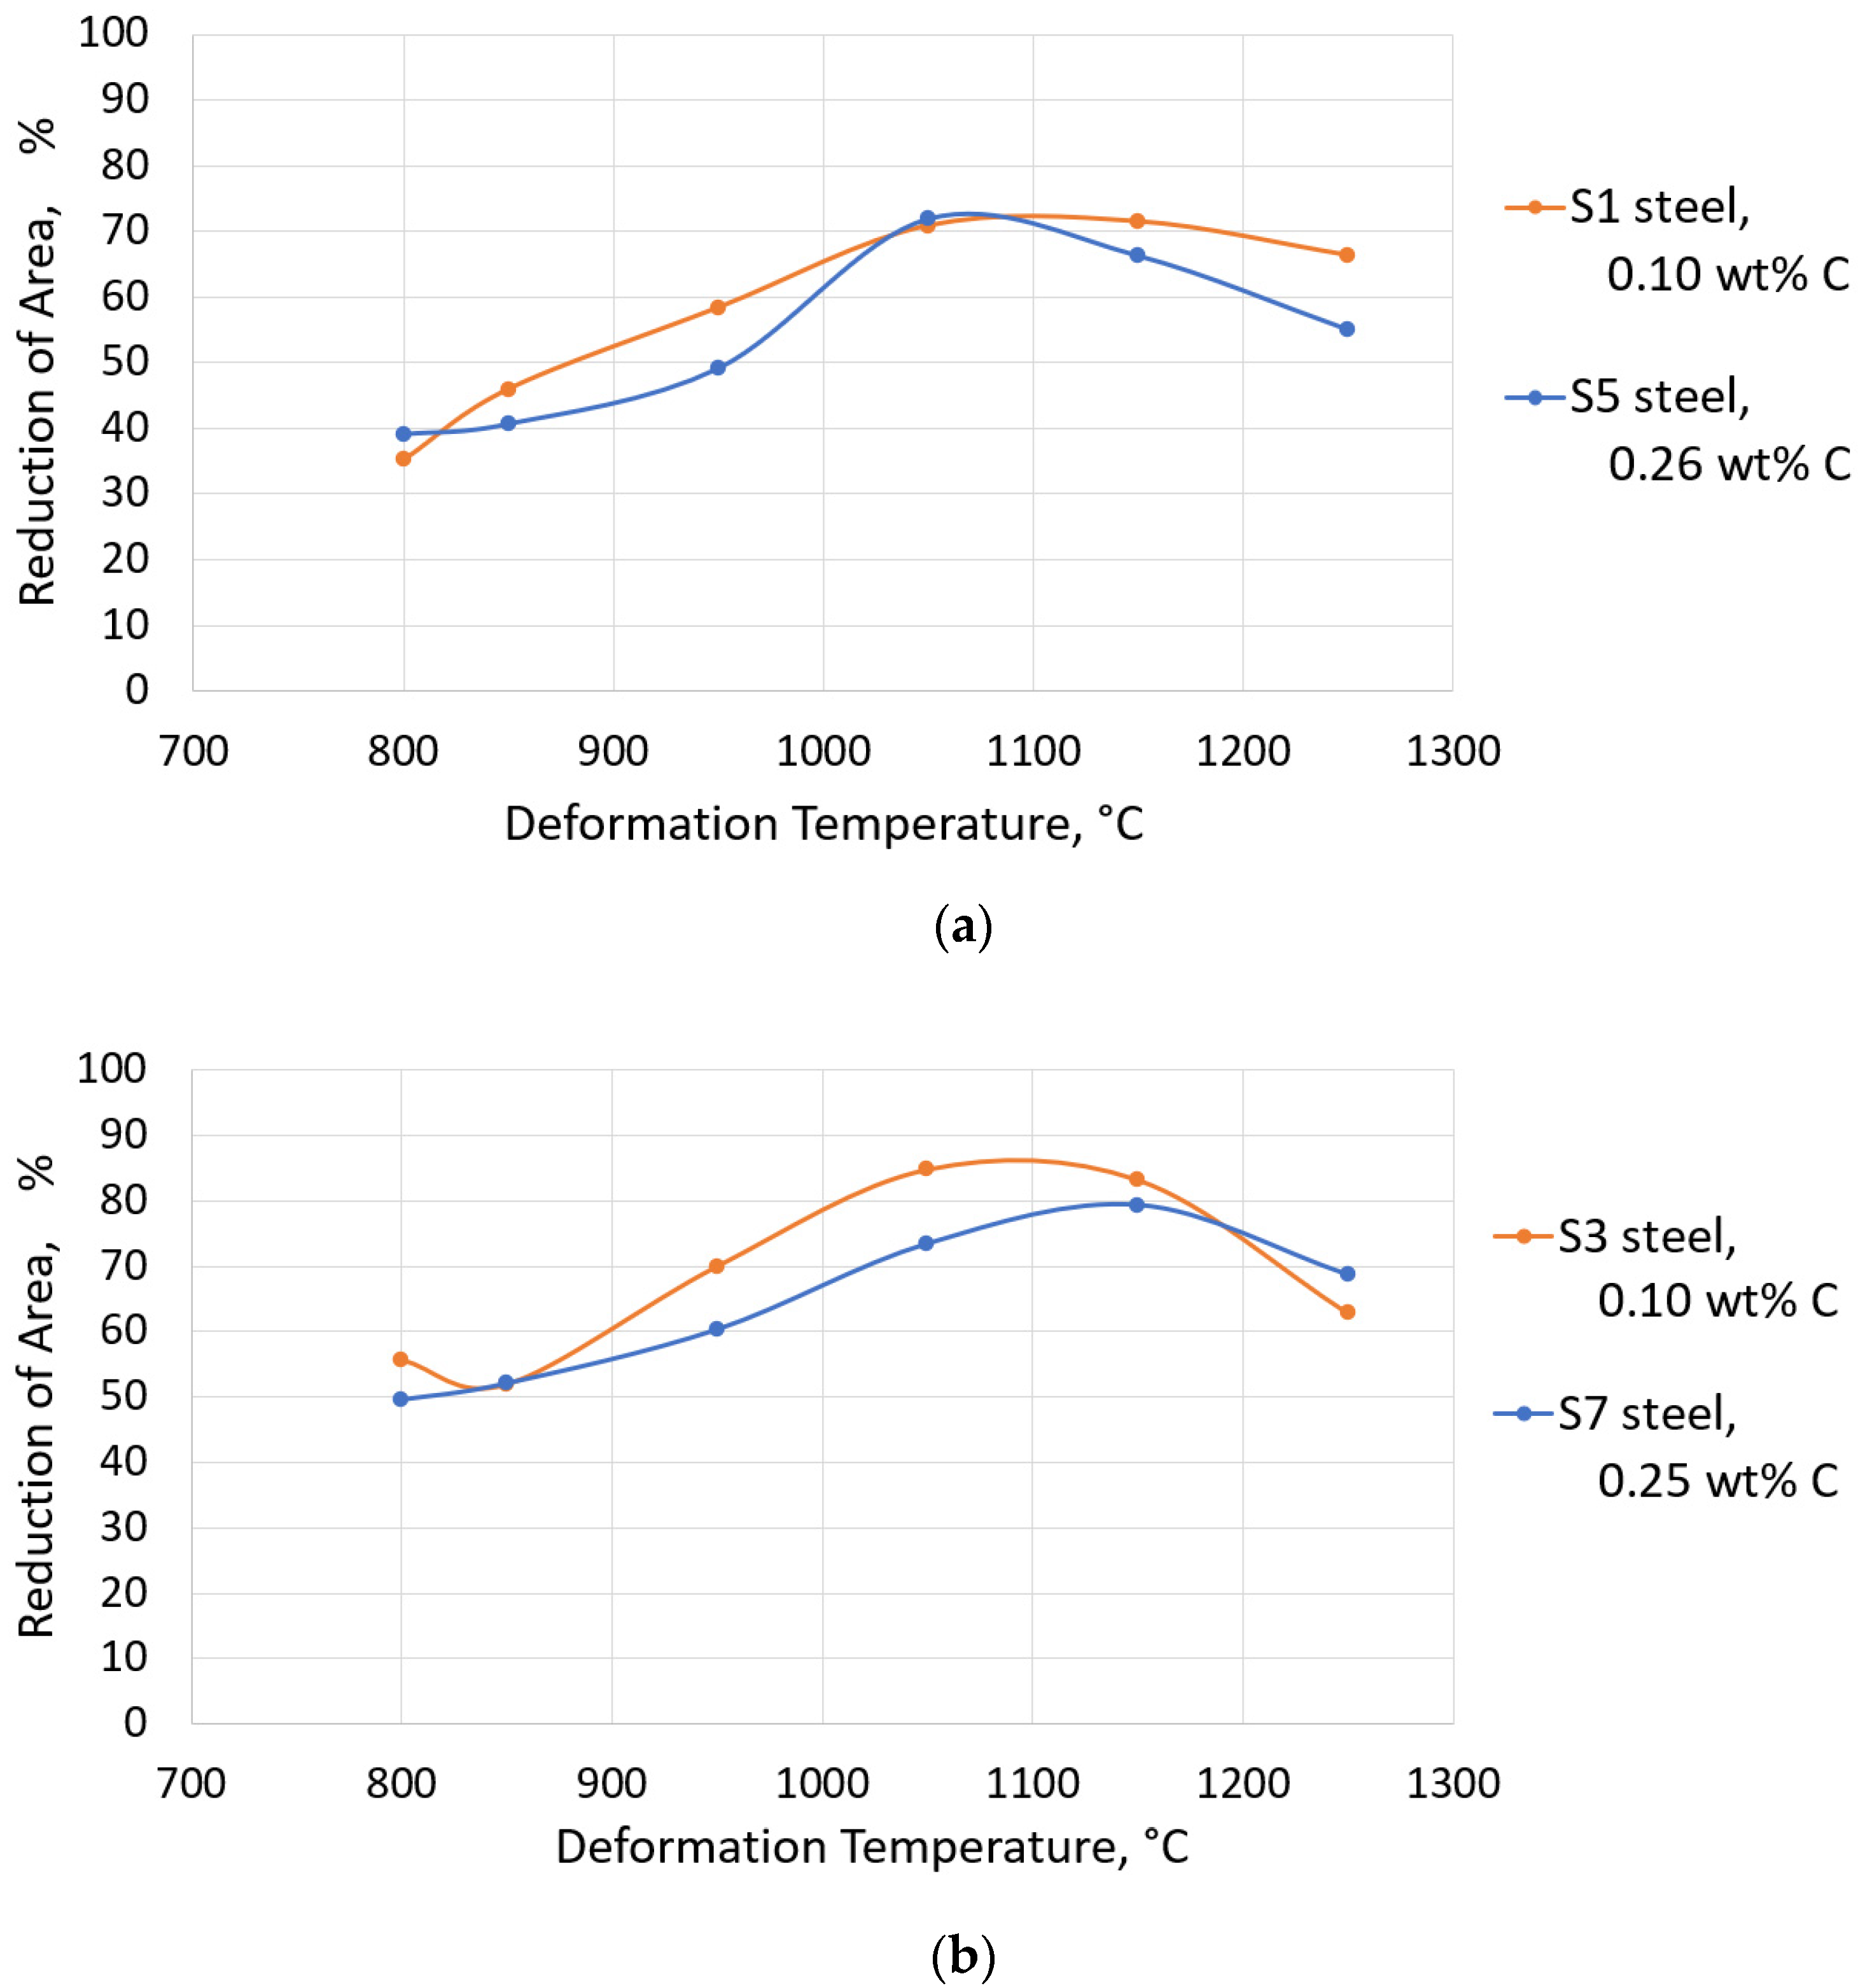
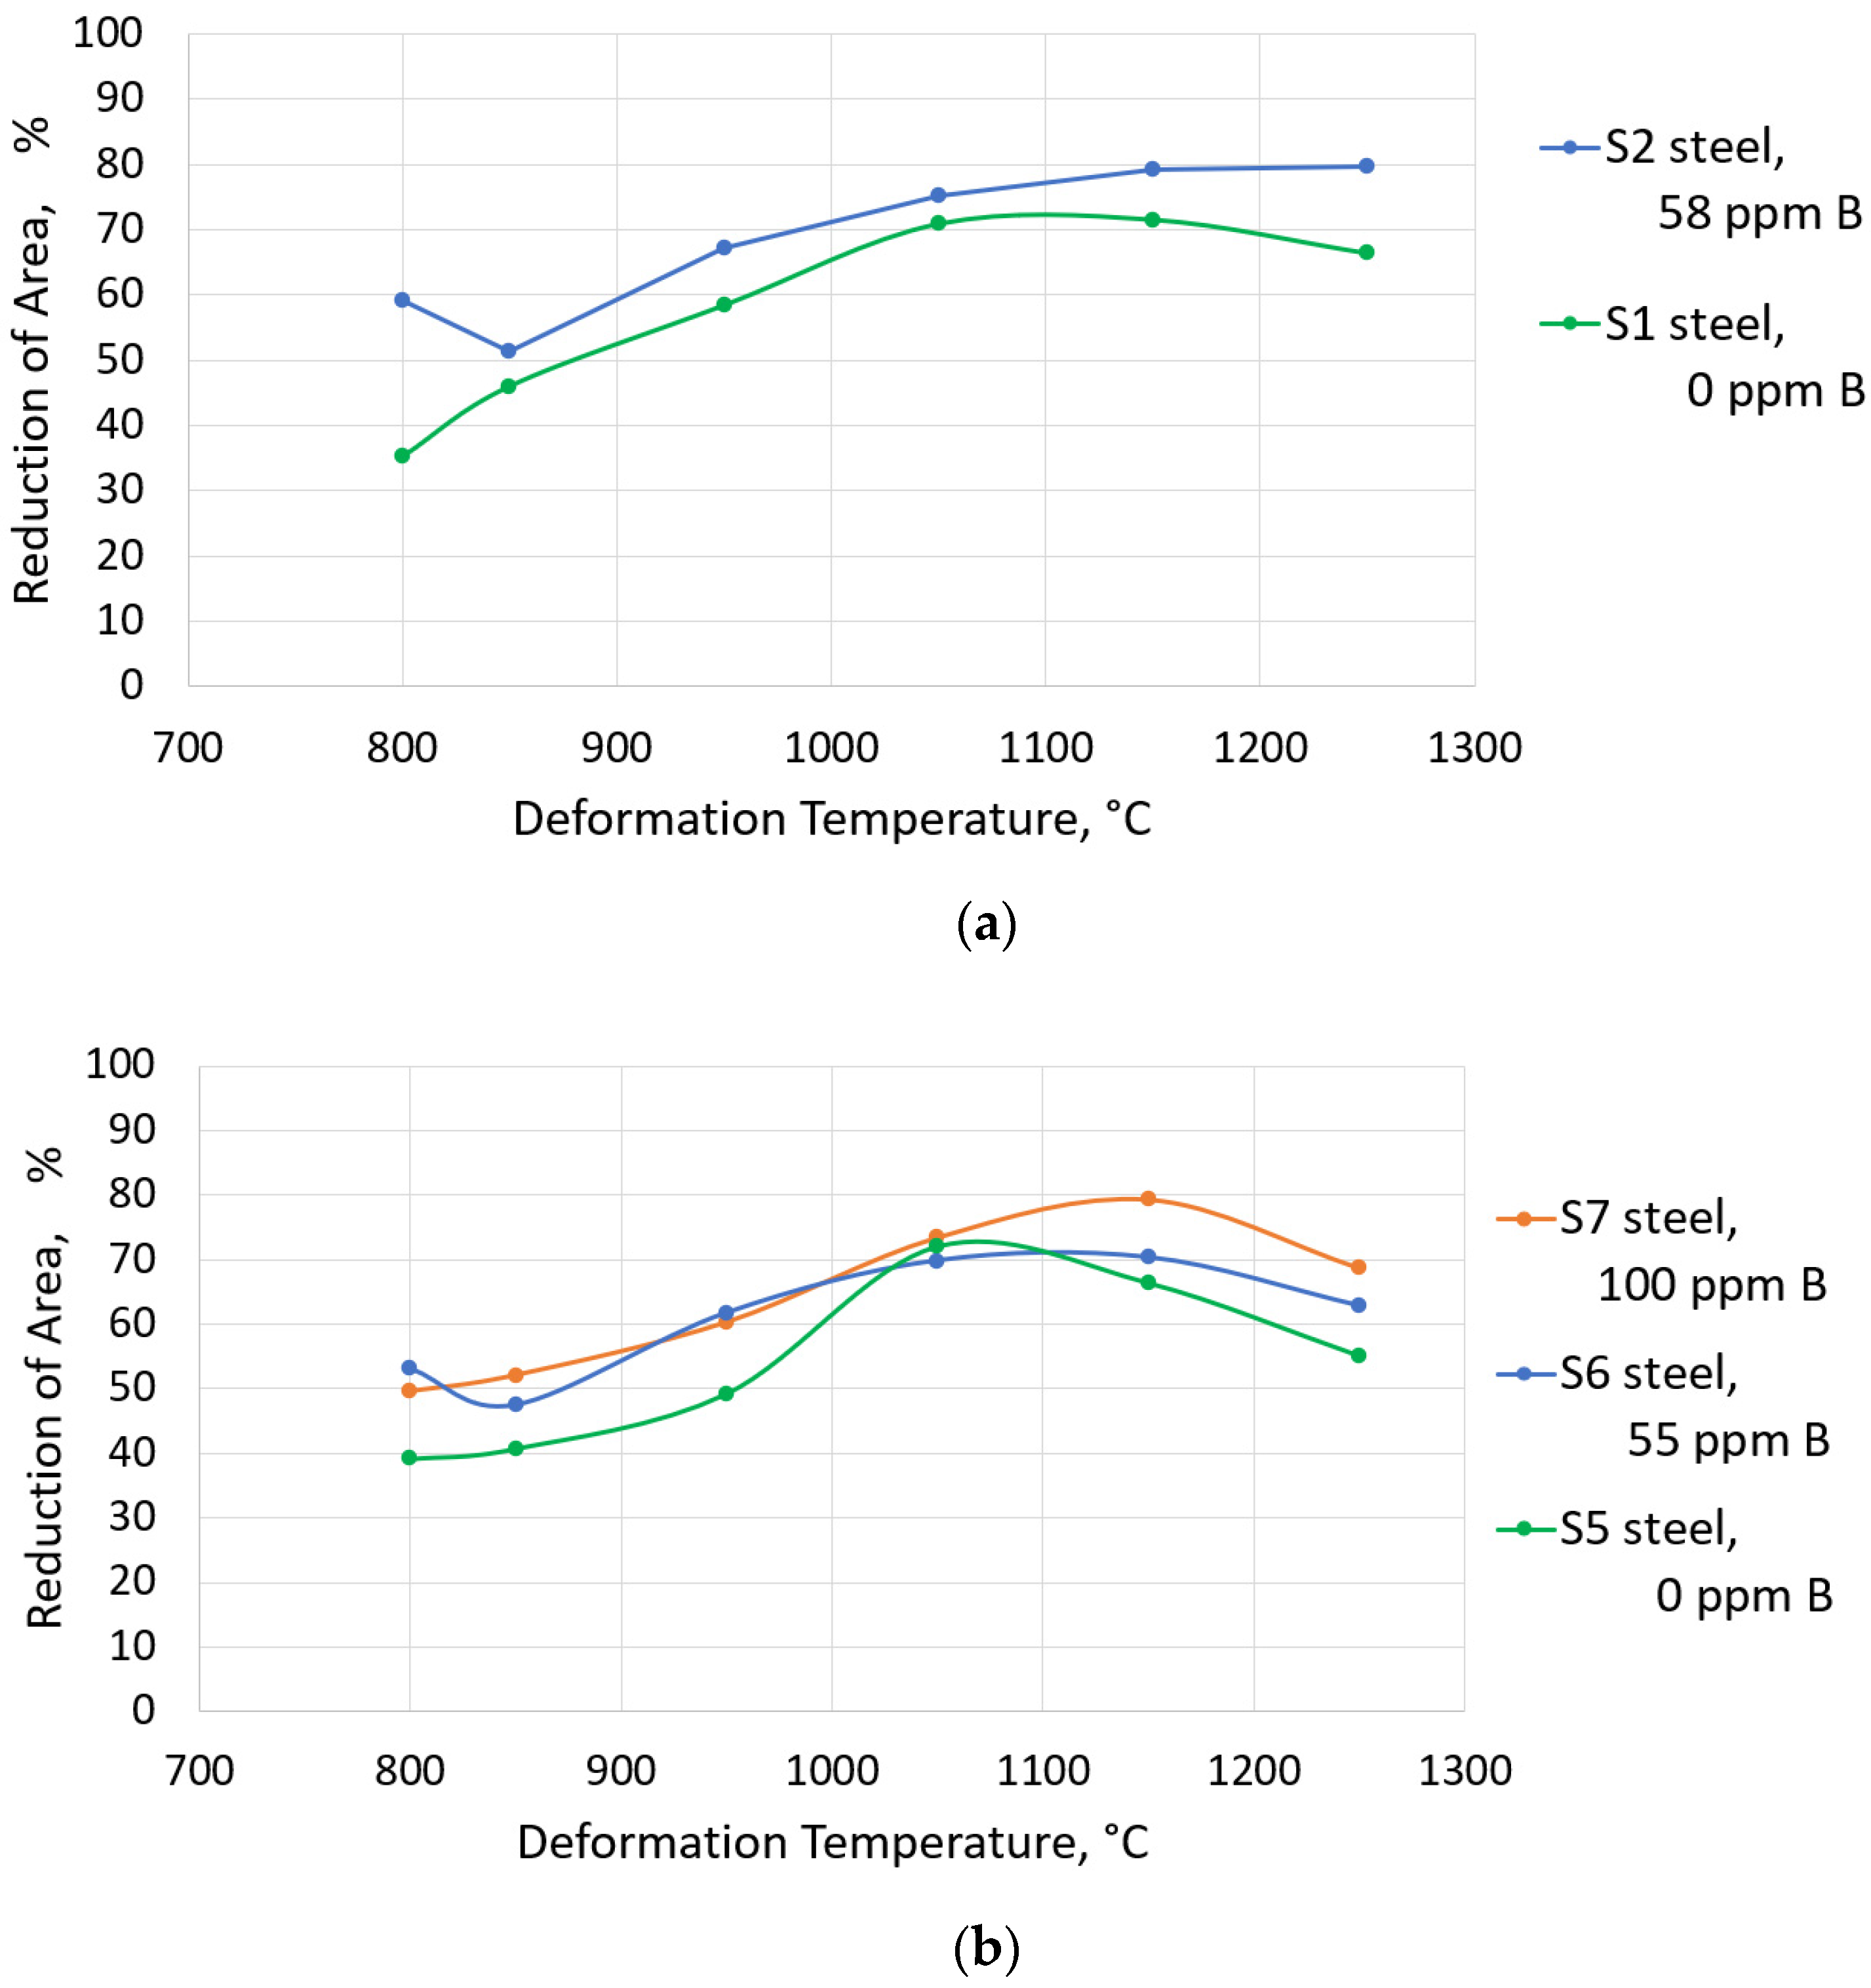
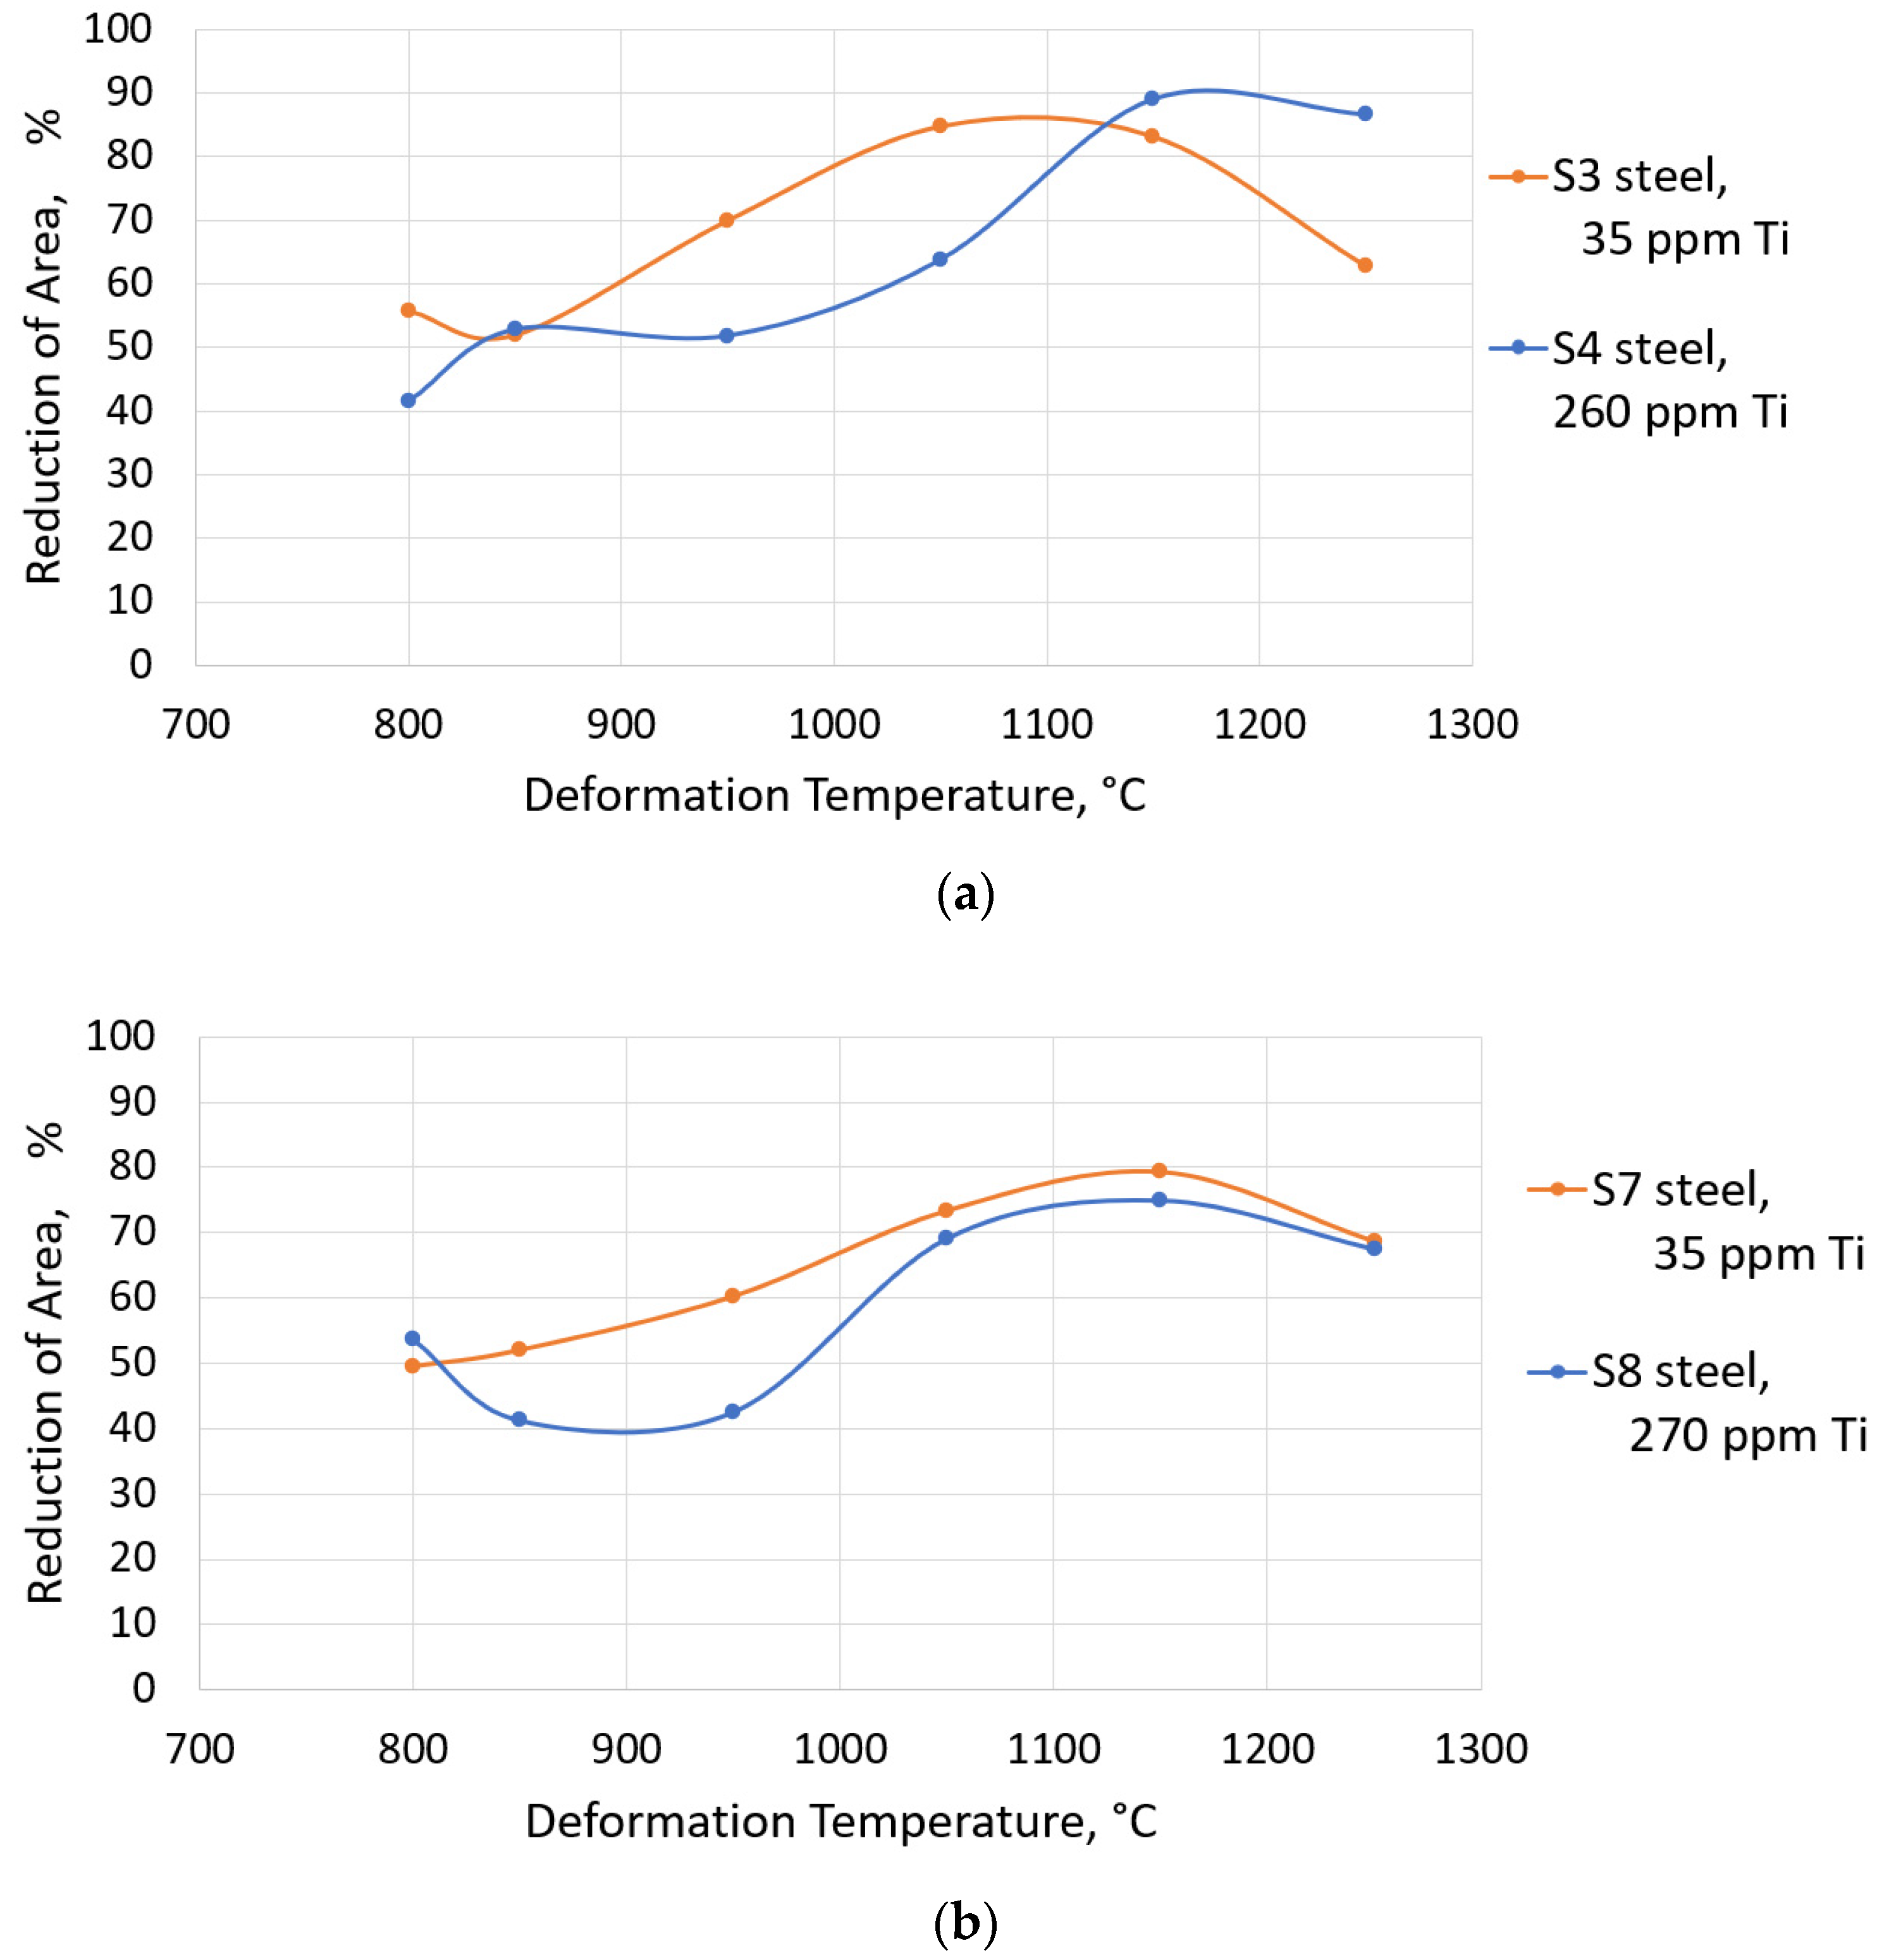
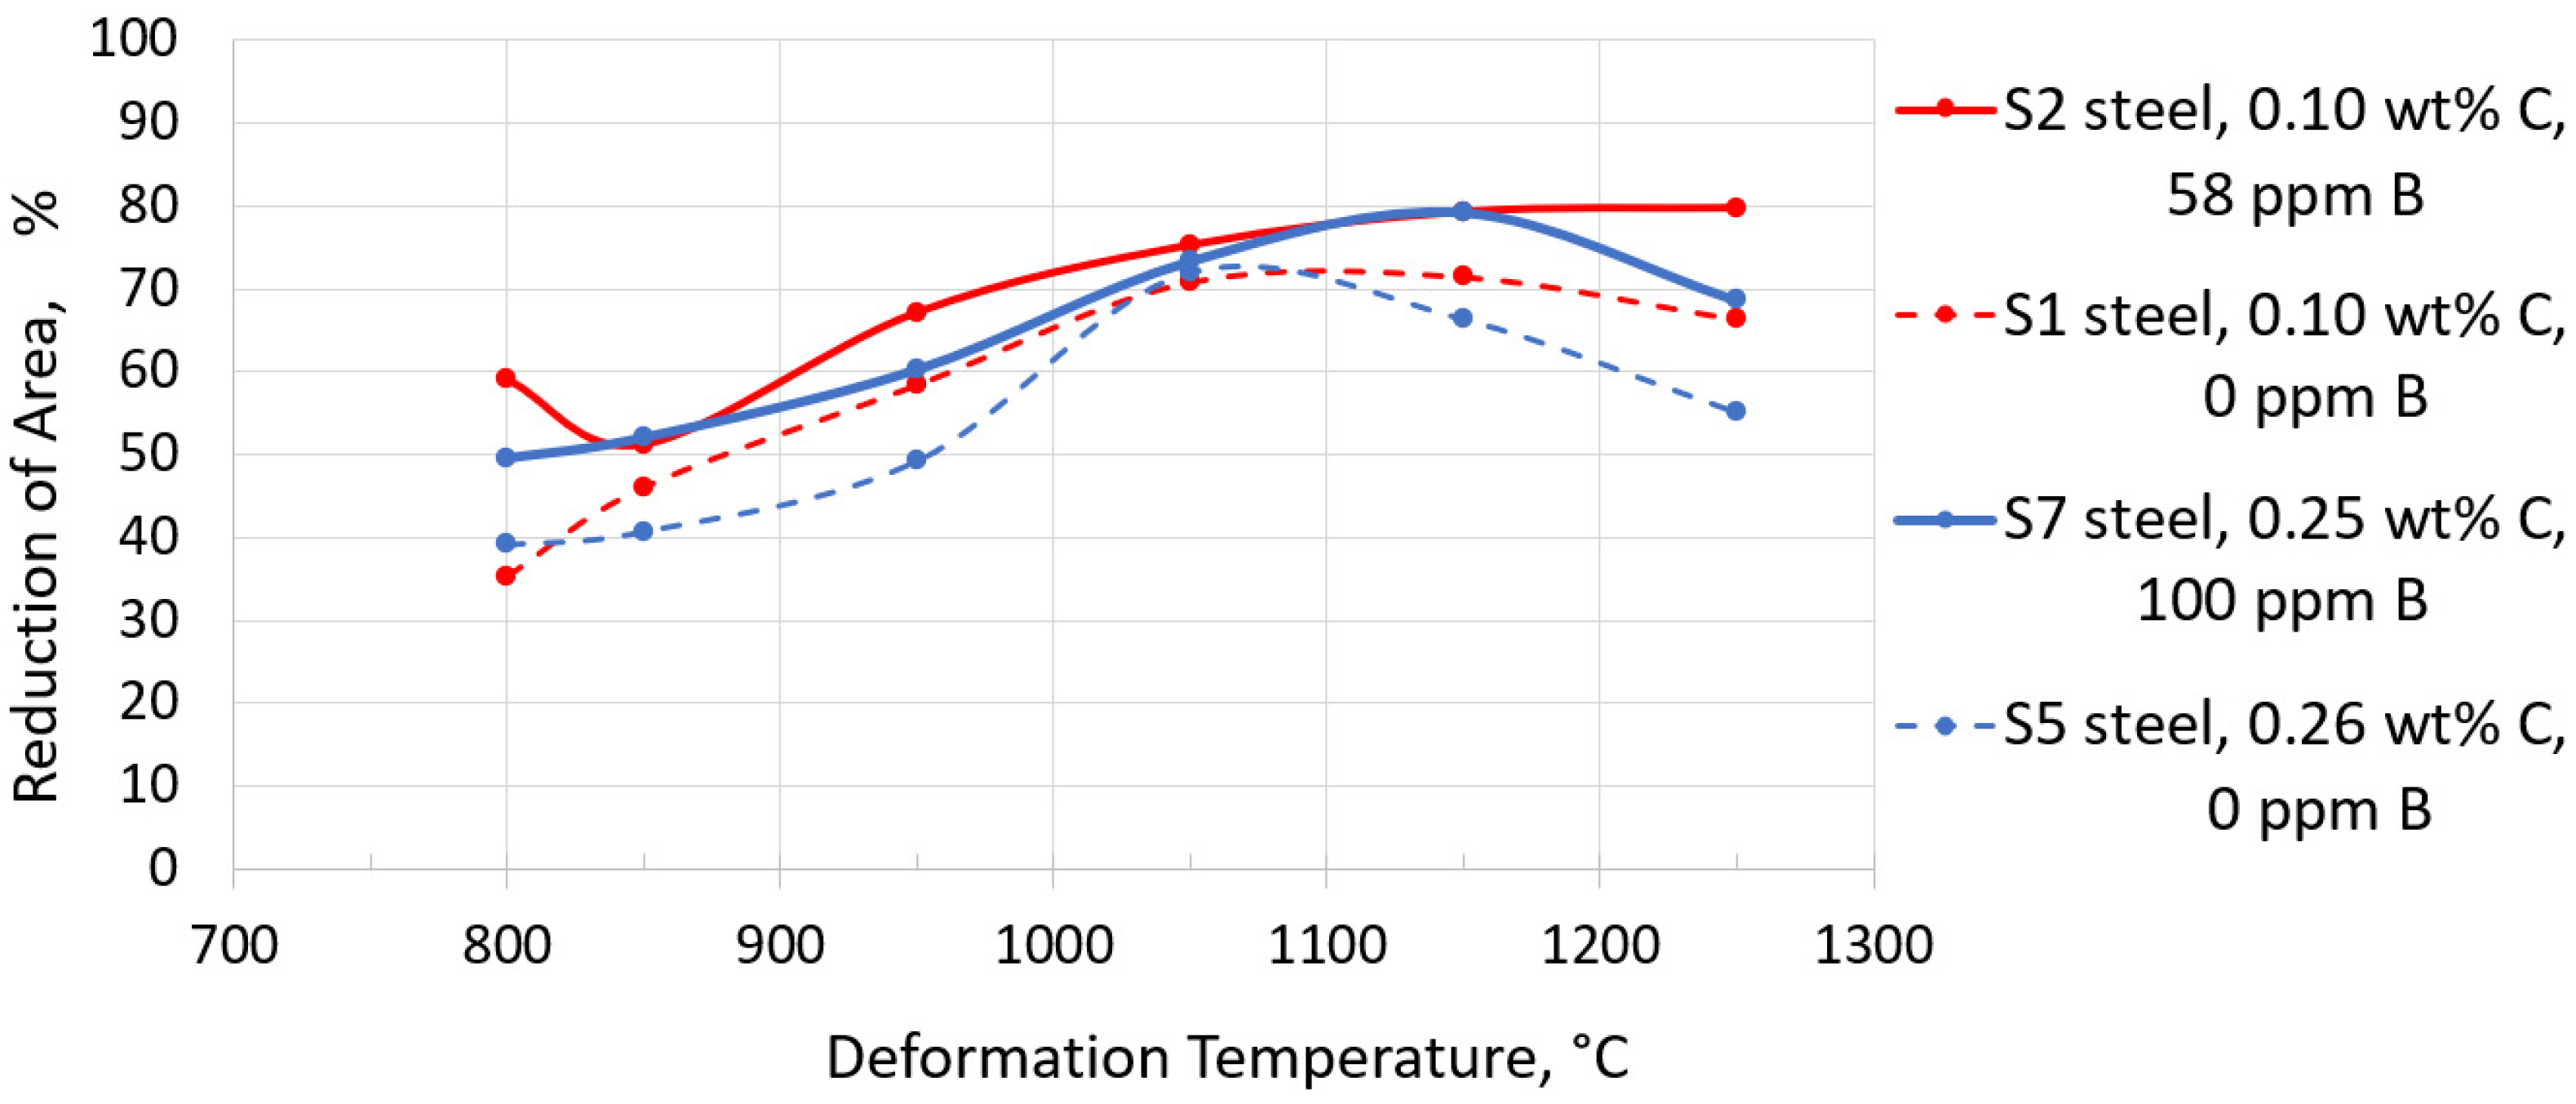
3.3. Hot Ductility Tests

A systematic investigation of the effect of alloy elements on hot ductility has been conducted and the results of Gleeble tests are presented in the following diagrams. Figure 19 illustrates the effect of carbon on the hot ductility of steels S1, S3, S5 and S7, containing 35 ppm Ti and 30–35 ppm N as it is shown in Table 1. The content of boron was 0 ppm and 100 ppm. In both cases, increasing carbon content from 0.10 wt% to 0.26 wt% caused only a 10% drop of the RA value. The temperature range when this change appeared, depended on the boron content in steel. For steels S3 and S7 with 100 ppm B the RA was decreased by 10% between 1150 °C and 950 °C. For steels S1 and S5 with 0 ppm B, the RA was decreased in the temperature ranges between 1150 °C and 1250 °C, and between 850 °C and 950 °C.
Figure 20 presents the effect of boron on the hot ductility of steels S1, S2, S5, S6 and S7 containing 35 ppm Ti and 30–35 ppm N. S1 and S5 steels contained no boron, whereas steels S2, S6 and S7 contained 55–100 ppm B. The effect of boron addition depends on the carbon content in the steel. An addition of 58 ppm boron to 0.10 wt% C steel S2 with low Ti and low N content improves hot ductility in the whole temperature range 800 °C–1250 °C. In case of steels S5, S6 and S7 with 0.25 wt% C, a similar effect of increasing boron content from 0 to 100 ppm was obtained, i.e., it improved the hot ductility in the whole 800 °C–1250 °C temperature range.
Figure 21 shows the effect of titanium on the hot ductility of steels S3, S4, S7 and S8, containing 30 ppm N and 100 ppm B. Increasing Ti from 35 ppm to 260 ppm in S4 steel containing 0.10 wt% C, moved the ductility trough from 1050 °C to 1150 °C and it increased the RA at 1250 °C from 60% to 88%. Steel S4 had a high Ti:N ratio of 8.66 (Table 1), which contributed to the precipitation of (Ti,Nb)-carbonitrides (as presented in Figure 12). This decreased the RA by 20% (still above 50% RA) in the temperature range between 1050 °C and 950 °C, which is shown in Figure 21a. The possible explanation for the continued good hot ductility of the S4 steel could be the presence of iron boride precipitates at prior austenite grain boundaries, which is shown in Figure 22. The figure presents two scanning electron micrographs of the fracture surfaces obtained from the S4 steel samples after hot tensile testing at 850 °C and at 1050 °C. The micrographs show ductile fractures with iron boride, Fe2B, precipitates in the edges of dimples, indicating the beneficial role of Fe2B for the hot ductility of steel. These edges are likely to be at the prior austenite grain boundaries.
Increasing the Ti content from 35 ppm to 270 ppm in steel S8 containing 0.25 wt% C (with a Ti:N ratio = 9.0), caused a deterioration of the RA in the temperature range between 850 °C and 950 °C, as shown in Figure 21b. The (Ti,Nb)-carbonitrides were found in the crack paths of the hot tensile tested S8 specimen, which is shown in Figure 18. In both cases of steels S4 and S8, an increased Ti addition contributed to the intensified precipitation of (Ti,Nb)-carbonitrides, whereas the presence of 100 ppm boron in these steels helped to maintain the RA parameter values above the 40%.
The best combined effect of Ti and B addition on hot ductility improvement is shown in Figure 23, represented by the red solid line for S2 steel with 0.10 wt% C, 35 ppm Ti, 58 ppm B and 35 ppm N. Very good hot ductility (with 80–50% Reduction of Area) was maintained within the entire temperature range between 1250 °C and 800 °C.
The next best hot ductility results are shown by the solid blue curve in Figure 23, and they were obtained for the S7 steel containing 0.25 wt% C, 35 ppm Ti, 100 ppm B, and 35 ppm N.

4. Conclusions

These investigation results indicate that the hot ductility improvement can be related to the following factors:
  • Boron precipitation as iron boride Fe2B, is very beneficial for the hot ductility of steel. This type of precipitate is mostly located along the austenite grain boundaries and as being coherent with the matrix, effectively increases the hot ductility.
  • Low nitrogen content (30–35 ppm) in all steels investigated, limited the precipitation of nitrides and carbonitrides.
  • Titanium is a very important alloy element protecting boron from binding with nitrogen into BN and the right combination of Ti and B content may give a very good hot ductility.
  • Higher Ti contents increased hot ductility in a low ductility zone (1150 °C–1250 °C). However, increasing Ti from 35 ppm to 270 ppm in steel with 0.25 wt% C and 100 ppm B, caused a deterioration in the RA in the entire temperature range. It can be related to the intensified precipitation of (Ti,Nb) carbides/carbonitrides.
  • The efficiency of using Ti and B to improve the hot ductility of steel depends on the carbon content. Since the lower carbon content decreases the negative effect of carbides/carbonitrides on the hot ductility, steels with 0.10 wt% C often show better RA than steels with 0.25 wt% C. The addition of Ti to a 0.10 wt% C steel resulted in a higher RA than was possible with an addition of Ti to a 0.25 wt% C steel.
It is important to note that the steels investigated contained almost constant levels of manganese (2.0 wt%) and of sulphur (50–80 ppm), and a low nitrogen (30–35 ppm). This allowed the investigation to focus on the hot ductility effect of carbon, titanium and boron. Changing the content of Mn, S and/or N in a broader range, would affect the hot ductility of steel, which was not the subject of this investigation.

Author Contributions

Conceptualization, J.K.; methodology, J.K., J.L. and C.L.; software, J.K. and C.L.; formal analysis, J.K. and J.L.; investigation, J.K., C.L. and J.L.; writing—original draft preparation, J.K.; writing—review and editing, J.K., C.L. and J.L.; visualization, J.K. and C.L.; supervision, J.K.; project administration, J.K.; funding acquisition, J.K. All authors have read and agreed to the published version of the manuscript.

Funding

This research was funded by the Research Fund for Coal and Steel: GA 800644-PMAPIA RFCS 2017.

Institutional Review Board Statement

Not applicable.

Informed Consent Statement

Not applicable.

Data Availability Statement

Not applicable.

Acknowledgments

Christer Eggertson (Swerim AB) is thanked for help with manufacturing mini-ingots of the experimental steels.

Conflicts of Interest

The authors declare no conflict of interest.

References

  1. López-Chipres, E.; Mejía, I.; Maldonado, C.; Bedolla-Jacuinde, A.; Cabrera, J. Hot ductility behavior of boron microalloyed steels. Mater. Sci. Eng. A 2007, 460–461, 464–470. [Google Scholar] [CrossRef]
  2. Hannerz, N.E. Critical Hot Plasticity and Transverse Slab Casting with Particular Reference Cracking in Continuous to Composition. Trans. ISIJ 1985, 25, 149–158. [Google Scholar] [CrossRef]
  3. Song, S.-H.; Guo, A.-M.; Shen, D.-D.; Yuan, Z.-X.; Liu, J.; Xu, T.-D. Effect of boron on the hot ductility of 2.25Cr1Mo steel. Mater. Sci. Eng. A 2003, 360, 96–100. [Google Scholar] [CrossRef]
  4. Mejía, I.; Salas-Reyes, A.; Calvo, J.; Cabrera, J.M. Effect of Ti and B microadditions on the hot ductility behavior of a High-Mn austenitic Fe–23Mn–1.5Al–1.3Si–0.5C TWIP steel. Mater. Sci. Eng. A 2015, 648, 311–329. [Google Scholar] [CrossRef] [Green Version]
  5. Komenda, J.; Martin, D.; Lönnqvist, J. The Effect of Boron Addition on Precipitation and Hot Ductility of 1.5Mn-0.1Nb-Ti Carbon Steels in As-Cast Condition. Mater. Sci. Forum 2016, 879, 990–995. [Google Scholar] [CrossRef]
  6. Cho, K.C.; Mun, D.J.; Kang, M.H.; Lee, J.S.; Kil Park, J.; Koo, Y.M. Effect of Thermal Cycle and Nitrogen Content on the Hot Ductility of Boron-bearing Steel. ISIJ Int. 2010, 50, 839–846. [Google Scholar] [CrossRef] [Green Version]
  7. Chown, L.; Cornish, L. Investigation of hot ductility in Al-killed boron steels. Mater. Sci. Eng. A 2008, 494, 263–275. [Google Scholar] [CrossRef]
  8. Hulka, K.; Kern, A.; Schriever, U. Application of Niobium in Quenched and Tempered High-Strength Steels. Mater. Sci. Forum 2005, 500–501, 519–526. [Google Scholar] [CrossRef]
  9. PMAPIA. Precipitation of Micro Alloy Particles in B and Mn Alloyed Steel Grades and Their InterAction between Elements, Segregation, and Defects during Continuous Casting; RFCS Grant Agreement GA 800644-PMAPIA RFCS 2017; Final Report in Preparation during 2022. Publication Office of the EU. Available online: https://op.europa.eu/en/search-results (accessed on 1 January 2022).
  10. Zarandi, F.; Yue, S. The Effect of Boron on Hot Ductility of Nb-microalloyed Steels. ISIJ Int. 2006, 46, 591–598. [Google Scholar] [CrossRef] [Green Version]
  11. Mintz, B.; Tuling, A.; Delgado, A. Influence of silicon, aluminium, phosphorus and boron on hot ductility of TRansformation Induced Plasticity assisted steels. Mater. Sci. Technol. 2003, 19, 1721–1726. [Google Scholar] [CrossRef]
  12. Luitjohan, K.E.; Krane, M.J.M.; Ortalan, V.; Johnson, D.R. Investigation of the metatectic reaction in iron-boron binary alloys. J. Alloy. Compd. 2018, 732, 498–505. [Google Scholar] [CrossRef]
  13. Abushosha, R.; Vipond, R.; Mintz, B. Influence of titanium on hot ductility of as cast steels. Mater. Sci. Technol. 1991, 7, 613–621. [Google Scholar] [CrossRef]
  14. Abushosha, R.; Comineli, O.; Mintz, B. Influence of Ti on hot ductility of C–Mn–Al steels. Mater. Sci. Technol. 1999, 15, 278–286. [Google Scholar] [CrossRef]
  15. Luo, H.; Karjalainen, P.; Porter, D.A.; Liimatainen, H.-M.; Zhang, Y. The Influence of Ti on the Hot Ductility of Nb-bearing Steels in Simulated Continuous Casting Process. ISIJ Int. 2002, 42, 273–282. [Google Scholar] [CrossRef] [Green Version]
  16. Mintz, B. Influence of nitrogen on hot ductility of steels and its relationship to problem of transverse cracking. Ironmak. Steelmak. 2000, 27, 343–347. [Google Scholar] [CrossRef]
  17. Jung, J.; Lee, S.-J.; Kim, S.; De Cooman, B.C. Effect of Ti Additions on Micro-Alloyed Nb TRIP Steel. Steel Res. Int. 2011, 82, 857–865. [Google Scholar] [CrossRef]
  18. Yuan, J.; Xiao, Y.; Min, N.; Li, W.; Zhao, S. The Influence of Precipitate Morphology on the Growth of Austenite Grain in Nb-Ti-Al Microalloyed Steels. Materials 2022, 15, 3176. [Google Scholar] [CrossRef] [PubMed]
  19. Kvackaj, T.; Bidulská, J.; Bidulský, R. Overview of HSS Steel Grades Development and Study of Reheating Condition Effects on Austenite Grain Size Changes. Materials 2021, 14, 1988. [Google Scholar] [CrossRef] [PubMed]
  20. Zou, Y.; Han, Y.; Liu, H.-S.; Teng, H.-X.; Qiu, M.-S.; Yang, F. Microstructure evolution and enhanced mechanical properties of a novel Nb-Ti micro-alloyed medium-Mn steel. Mater. Charact. 2022, 187, 111828. [Google Scholar] [CrossRef]
Figure 1. As-cast steel in the form of 2 kg mini-ingot. (a) mini-ingot dimensions, (b) hot ductility specimens machined of the mini-ingot.
Alloys 01 00009 g001
Figure 2. (a) Gleeble specimen with a quartz crucible in the middle, for in-situ melting. (b) The zoomed middle part of the specimen with a crucible and two wires of the thermocouple point-welded to the specimen surface; (c) specimen after hot ductility test.
Alloys 01 00009 g002
Figure 3. Schematic diagram showing the thermal cycles applied in the study.
Alloys 01 00009 g003
Figure 4. Amount (vol%) obtained from Thermo-Calc of phases and precipitates, in the equilibrium diagrams depending on the boron content. (a) for 0.10 wt% C, 50 ppm Ti, 10 ppm B, 30 ppm N, (b) for 0.10 wt% C, 50 ppm Ti, 110 ppm B, 30 ppm N. 1: AlN; 2: liquid; 3: (Nb,Ti)(C,N); 4: Fe2B; 5: BN.
Alloys 01 00009 g004
Figure 5. Distribution obtained from Thermo-Calc of boron in phases and precipitates, depending on the carbon content. (a) for 0.10 wt% C, 50 ppm Ti, 30 ppm N, 110 ppm B, (b) for 0.24 wt% C, 50 ppm Ti, 30 ppm N, 110 ppm B. 1: in liquid; 2: in austenite; 3: in Fe2B; 4: in ferrite; 5: in BN; 6: in cementite.
Alloys 01 00009 g005
Figure 6. Volume% obtained from Thermo-Calc of precipitates, depending on the Ti and N contents. (a) for 0.10 wt% C, 250 ppm Ti, 110 ppm N, 110 ppm B, (b) for 0.10 wt% C, 250 ppm Ti, 30 ppm N, 110 ppm B. 1: liquid; 2: (Ti,Nb)(C,N); 3: Fe2B; 4: (Nb,Ti)(C,N); 5: BN; 6: AlN.
Alloys 01 00009 g006
Figure 7. (Ti,Nb)(C,N) precipitate in DICTRA simulation for the composition with 0.10 wt% C, 0.031 wt% Nb, 250 ppm Ti and 30 ppm N. (Ti,Nb)(C,N) nucleates and precipitates in 2 steps: TiNI→(Ti,Nb)(C,N). Applied cooling rate: 0.6 K/s.
Alloys 01 00009 g007
Figure 8. PRISMA simulation of Fe2B, (Ti,Nb)(C,N) and AlN precipitation radius in steel with 0.10 wt% C, 0.031 wt% Nb, 250 ppm Ti and 30 ppm N. Applied cooling rate: 0.6 K/s.
Alloys 01 00009 g008
Figure 9. BSE scanning electron micrograph showing precipitation particles in S4 steel with 0.10 wt% C, 260 ppm Ti, 100 ppm B and 30 ppm N. Steel status: as-cast, before hot testing.
Alloys 01 00009 g009
Figure 10. EDX spectra representing Fe2B (yellow), Fe3C (blue) precipitates and the surrounding matrix (orange) from Figure 9. (a) Fe2B vs. matrix, (b) Fe2B vs. Fe3C.
Alloys 01 00009 g010
Figure 11. BSE scanning electron micrographs showing: (a) elongated Fe2B precipitate in S6 steel; (b) round shaped Fe2B precipitates in S4 steel. Steel status: before hot testing.
Alloys 01 00009 g011
Figure 12. BSE scanning electron micrographs showing nitrides, carbides and carbonitride precipitates in S4 steel before hot testing. (a) BN and (Ti,Nb)(C,N) precipitates; (b) Nb(Ti)C, (Ti,Nb)(C,N) and MnS.
Alloys 01 00009 g012
Figure 13. EDX spectrum of BN particle from Figure 12a.
Alloys 01 00009 g013
Figure 14. EDX spectrum of (Ti,Nb)(C,N) particle from Figure 12b.
Alloys 01 00009 g014
Figure 15. EDX spectrum of Nb(Ti)C particle from Figure 12b.
Alloys 01 00009 g015
Figure 16. Reference EDX spectrum representing steel matrix from Figure 12.
Alloys 01 00009 g016
Figure 17. BSE scanning electron micrographs showing Fe2B and MnS particles in the hot tensile specimen of S7 steel tested at 950 °C (RA = 60%). (a) longitudinal section of the part of the fracture; (b) Fe2B coherent with the matrix; (c) MnS in the void caused by hot tensile testing.
Alloys 01 00009 g017
Figure 18. BSE scanning electron micrographs showing (Ti,Nb)(C,N) precipitates in the hot tensile specimen of S8 steel tested at 950 °C (RA = 42%). (a) longitudinal section of the part of the fracture; (b) (Ti,Nb)(C,N) in the crack paths caused by hot tensile testing.
Alloys 01 00009 g018
Figure 19. The effect of carbon on hot ductility of steels with 35 ppm Ti and 30–35 ppm N. (a) S1 and S5 steels, with no boron addition, (b) S3 and S7 steels, with 100 ppm B.
Alloys 01 00009 g019
Figure 20. The effect of B on hot ductility of steels with 35 ppm Ti and 30–35 ppm N. (a) S1 and S2 steels with 0.10 wt% C, (b) S5, S6 and S7 steels with 0.25 wt% C.
Alloys 01 00009 g020
Figure 21. The effect of Ti on hot ductility of steels with 100 ppm B, 30 ppm N. (a) S3 and S4 steels with 0.10 wt% C, (b) S7 and S8 steels with 0.25 wt% C.
Alloys 01 00009 g021
Figure 22. Ductile fracture surfaces with iron boride precipitates at the edges of dimples. Hot tensile test was performed on S4 steel samples. (a) test at 850 °C showed RA = 53%, (b) test at 1050 °C showed RA = 64%.
Alloys 01 00009 g022
Figure 23. Summary of the best combined Ti and B effect on improvement of hot ductility of steels with 30–35 ppm N and with 0.10–0.26 wt% C. The dashed lines correspond to steel with no B addition.
Alloys 01 00009 g023
Table 1. Chemical composition of the examined microalloyed steels.
SteelCSiMnPSAlNbTi BNOTi:N
wt%wt%wt%wt%wt%wt%wt%ppmppmppmppmRatio
S10.100.301.960.0050.0050.0250.03135-35201.0
S20.100.321.990.0050.0060.0230.031355835201.0
S30.100.291.990.0050.0050.0300.0313510030201.16
S40.100.302.010.0050.0060.0300.03226010030208.66
S50.260.312.030.0050.0070.0360.03235-30201.16
S60.260.312.010.0050.0080.0370.033355530201.16
S70.250.312.010.0050.0060.0270.0303510030201.16
S80.250.312.000.0050.0070.0310.03127010030209.0
Publisher’s Note: MDPI stays neutral with regard to jurisdictional claims in published maps and institutional affiliations.

