Article

Exploring the Effects of Cramped-Impact-Type Mechanical Action on Active Pharmaceutical Ingredient (Levofloxacin)—Prospects for Pharmaceutical Applications

1
Department of Pharmaceutical and Toxicological Chemistry, Medical Institute, RUDN University, 8 Miklukho-Maklaya Street, 117198 Moscow, Russia
2
National Research Center for Epidemiology and Microbiology Named after the Honorary Academician N. F. Gamaleya, 18 Gamaleya St., 123098 Moscow, Russia
*
Author to whom correspondence should be addressed.
Powders 2023, 2(2), 464-483; https://doi.org/10.3390/powders2020028
Submission received: 21 March 2023 / Revised: 15 May 2023 / Accepted: 6 June 2023 / Published: 9 June 2023
(This article belongs to the Special Issue Particle Technologies)

Abstract

:
Mechanochemistry is one of the ten great discoveries of green chemistry methods for synthesizing new substances. A drug substance from the fluoroquinolone group was exposed to high-intensity mechanical impacts using a laboratory knife mill for 21 min and constantly monitored by analyzing samples extracted every 3 min with DLS, SLS, LALLS, 2D-LS, optical and digital microscopy, FTIR, and Spirotox methods. A dispersity phenomenon was detected in an area where catastrophic dislocations formed and multiplied via laser methods. The positive correlation between the temperature of deformation and stress was demonstrated, similar to a typical stress–strain curve of a Bochvar–Oding curve and Young’s modulus: the angular coefficient of the straight section to OX was tgα = 10 min−1. Z-Average, ζ-potential, and polydispersity index dependences were represented as discontinuous periodic oscillations analogous to the defect and impurity transitions near the dislocation core. Deformation r from the high-intensity mechanical impact resulted in covalent bonds showing hyper- and hypochromic effects under FTIR spectra, a bathochromic shift of the maximum, and an oscillation emission at 3240 cm−1. A 2D-LS fingerprint diagram obtained via the topological convolution of the light scattering matrix made it possible to distinguish the off-loading samples from the native substance. The investigation of the dissolution kinetics in water via laser diffraction led to conclusions about the limiting diffusion stage and the acceleration of the mechanoactivation of the solid body’s dissolution under both linear and plastic deformation. The acceleration of obsEa of the cell death process in the temperature range from 296 to 302 K indicated a significant (2.5-fold) decrease in the toxicity of the aqueous 9 mM (1:3) sample solution at 21 min compared to that of the native levofloxacin. Adherence to the mechanochemistry laws provides an opportunity for drug repositioning to change their brand status by identifying new physicochemical and biological properties.

1. Introduction

Mechanochemistry (MCh) and mechanoactivation (MAct) are of great interest in materials science, as they apply the law of conservation of energy (light and heat less frequently) by converting impact energy into a controlled mechanical response proportional to the applied stress [1,2]. The produced effect caused by the deformation of solids leads to non-thermal chemical reaction processes, i.e., in the solid phase without dissolution or the melting of substances. However, it is precisely this fact that allows MCh and MAct to be classified as successful soft and green chemistry technologies [3].
In fact, the potential of mechanochemistry in various domains of research, industry, and in commercial entities has been recently recognized by the IUPAC after the inclusion of mechanochemistry among the ten chemical innovations that will change our world [4].
MCh treatment methods, as an example of inexpensive and environmentally friendly methods, have been used successfully in the chemical and pharmaceutical industries to decompose and degrade xenobiotic wastes entering surface and groundwater. The authors of [5] successfully demonstrated the influence of a planetary ball mill operating parameters (milling time, rotational speed, ratio of grinding ball to material, and grinding ball type) on the effective reductions in the initial content and toxicity of fluoroquinolone ciprofloxacin in the studied wastewater samples. The choice of MCh conditions can influence different variables, including the directed synthesis of pure enantiomers and the distribution of stereoisomers in the solid-phase synthesis of novel bioactive compounds [6]. Conformational changes in proteins are an example of a unique natural strategy that takes place during mechanotransduction processes: the conversion of mechanical signals into chemical reactions (Figure 1) [7].
The conversion process of elastic energy, from the mechanical impact on a solid body (SB), into heat is accompanied by metastable structures with energy reserves, characterized by shifting of atoms from equilibrium stable positions in the lattice nodes, changes in length and bond angles, and the excitation of electronic subsystems [8,9]. Despite the apparent macroscopic simplicity, the transfer of mechanical energy to a solid body is very complex and occurs via multistage dissipation channels. The energy input is proportional to the volume of SB to be collapsed—work A1 or the area of the new surface formed—A2 (Figure 2).
One theory suggests that friction and high-intensity displacement impacts lead to quasi-adiabatic local energy accumulation in sub-microscopic zones with the formation of matter in a high-energy state, similar to plasma—“triboplasm” (Greek: τριβοσ—rub, grind) [10]. The resulting metastable structures release some of the stored energy to move to a more stable thermodynamic state. According to this approach, a multistep process of energy dissipation takes place. From the macro-peak point of view, energy relaxation occurs according to mechanisms of heat release, plastic deformation, and the breaking of chemical bonds [11]. During this period, tribochemical (TrbCh)-phase transformations take place [12]. The properties and decay rate of the intermediate non-equilibrium state—the black box—determine the nature of the resulting products, MCh, MAct, or TrbCh, as well as the rate constant of the process [13]. The effects of stress on the k rate constant of the MCh, MAct, or TrbCh of elastically deformed bond breaking reactions is described by the Eyring–Kozman equation [14].
k = A 0   exp E a σ V a R T ,
Here, A0 is the pre-exponential factor, Ea is the energy of thermal decomposition activation, σVa—the work of elastic stresses, R is the universal gas constant, and T is the temperature (K). It is implied that the action of stresses facilitates energy barrier passage but does not influence its height.
The introduction of new drugs for clinical use is a very complex, lengthy, time-consuming, and costly process, so drug repositioning—changing brand status by identifying new physico-chemical properties and biological activities—is becoming increasingly important. Based on the above and as applied to drug chemistry, the laws of MCh, MAct, or TrbCh provide an opportunity to explore the effects of repositioning to address the issue of new drug discovery [15]. The emergence of bacterial resistance has motivated researchers to discover new antibacterial agents. Nowadays, fluoroquinolones keep their status as one of the essential classes of antibacterial agents [16].
The aim of the study is to investigate the mechanisms of solid-body tribochemistry due to the mechanical impact and the dynamics of the physicochemical and biological properties of a fluoroquinolone group drug substance for a new perspective on its pharmaceutical applications.

2. Materials and Methods

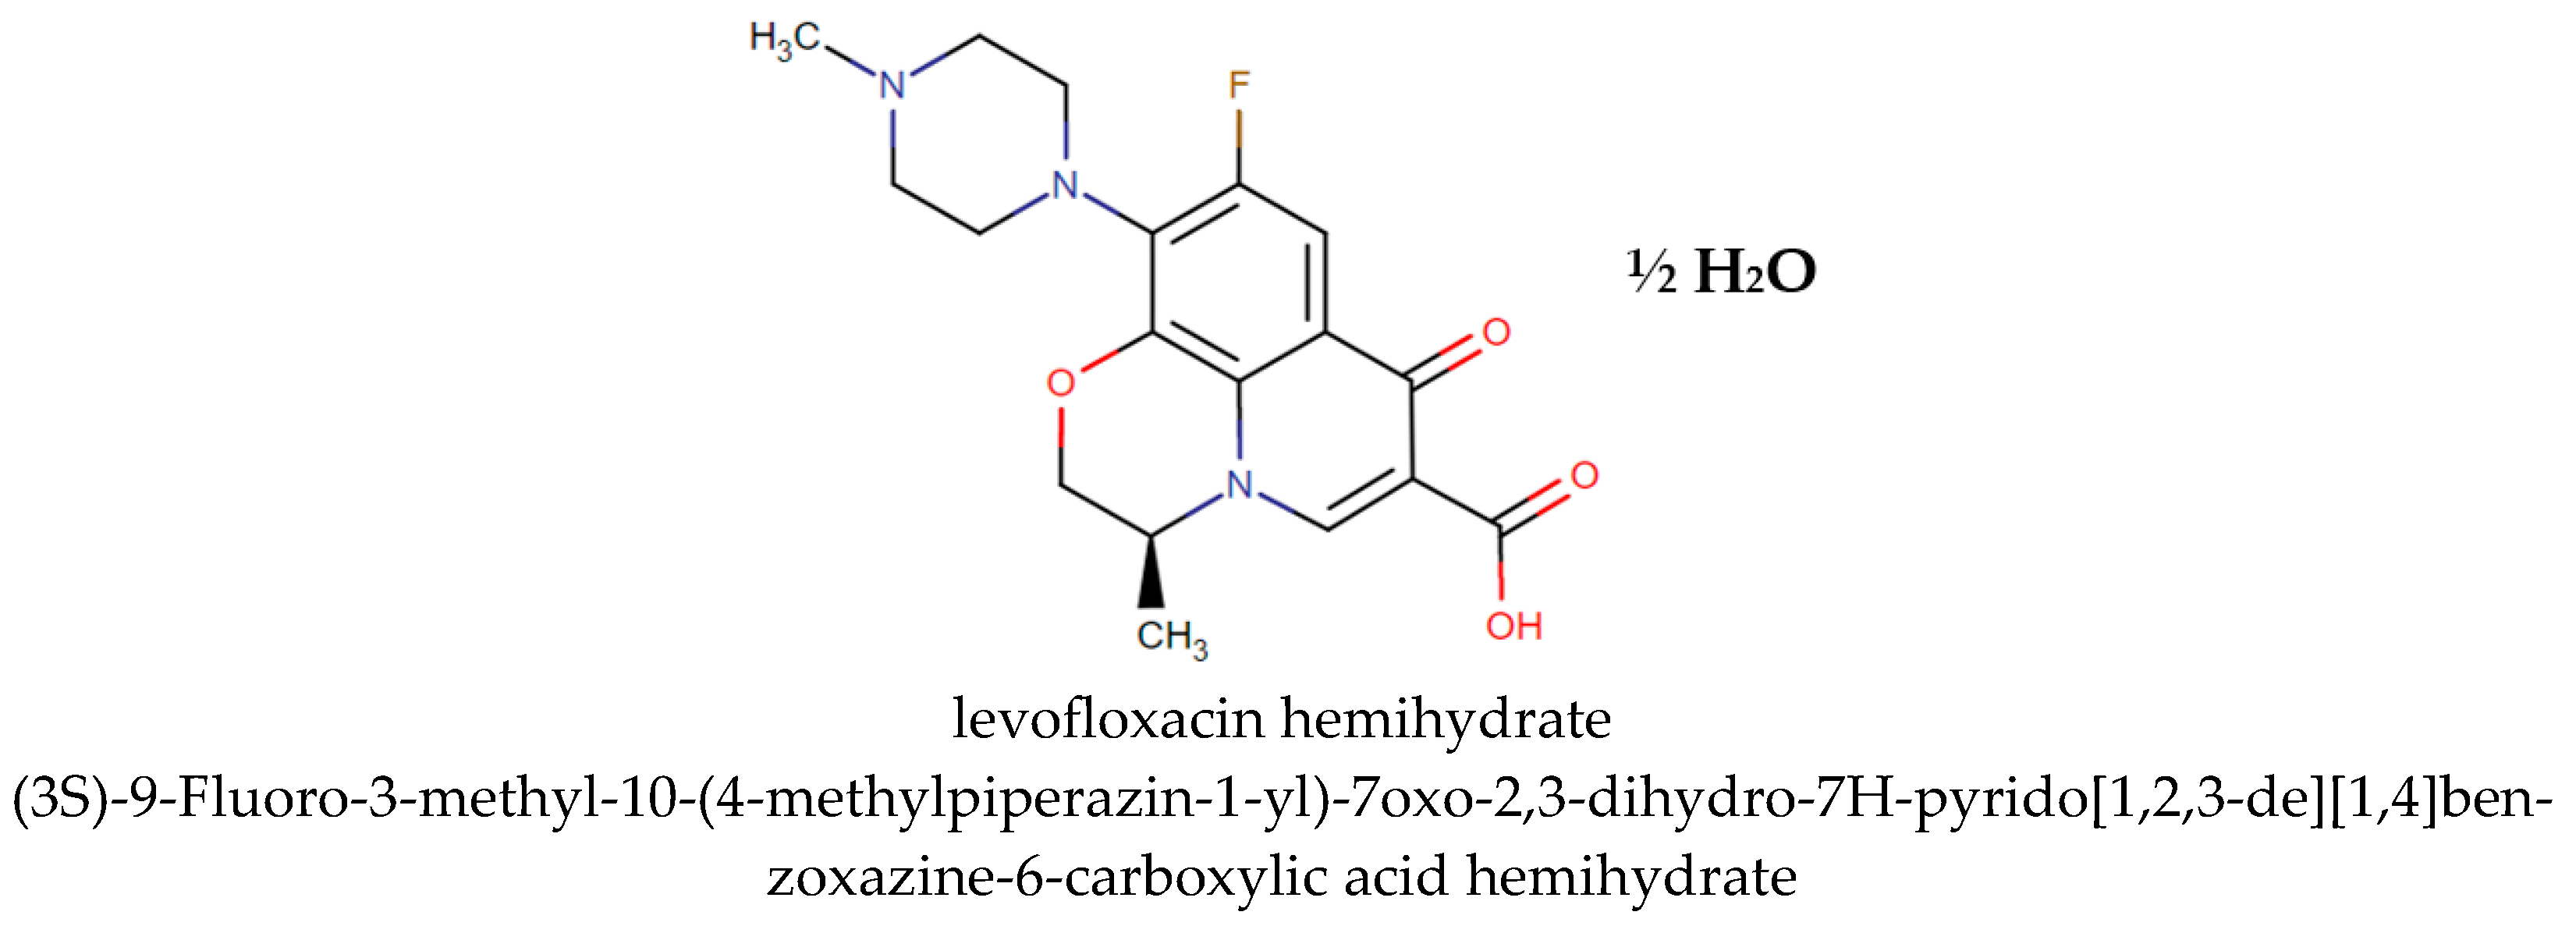
2.1. Fluoroquinolone Sample Substance

The object of the study in this work is the 99.9% high-purity levofloxacin hemihydrate (Lvf·Hh) pharmaceutical raw material of a fluoroquinolones (FQs) group (Jiangsu Aimi Tech Co., Ltd., Suzhou, Jiangsu, China (Mainland); 519963/1 batch ID and expiry date: 8 February 2025. Appearance: light yellowish-white crystalline powder, sparingly soluble in water, and practically insoluble in n-hexan (Figure 3).

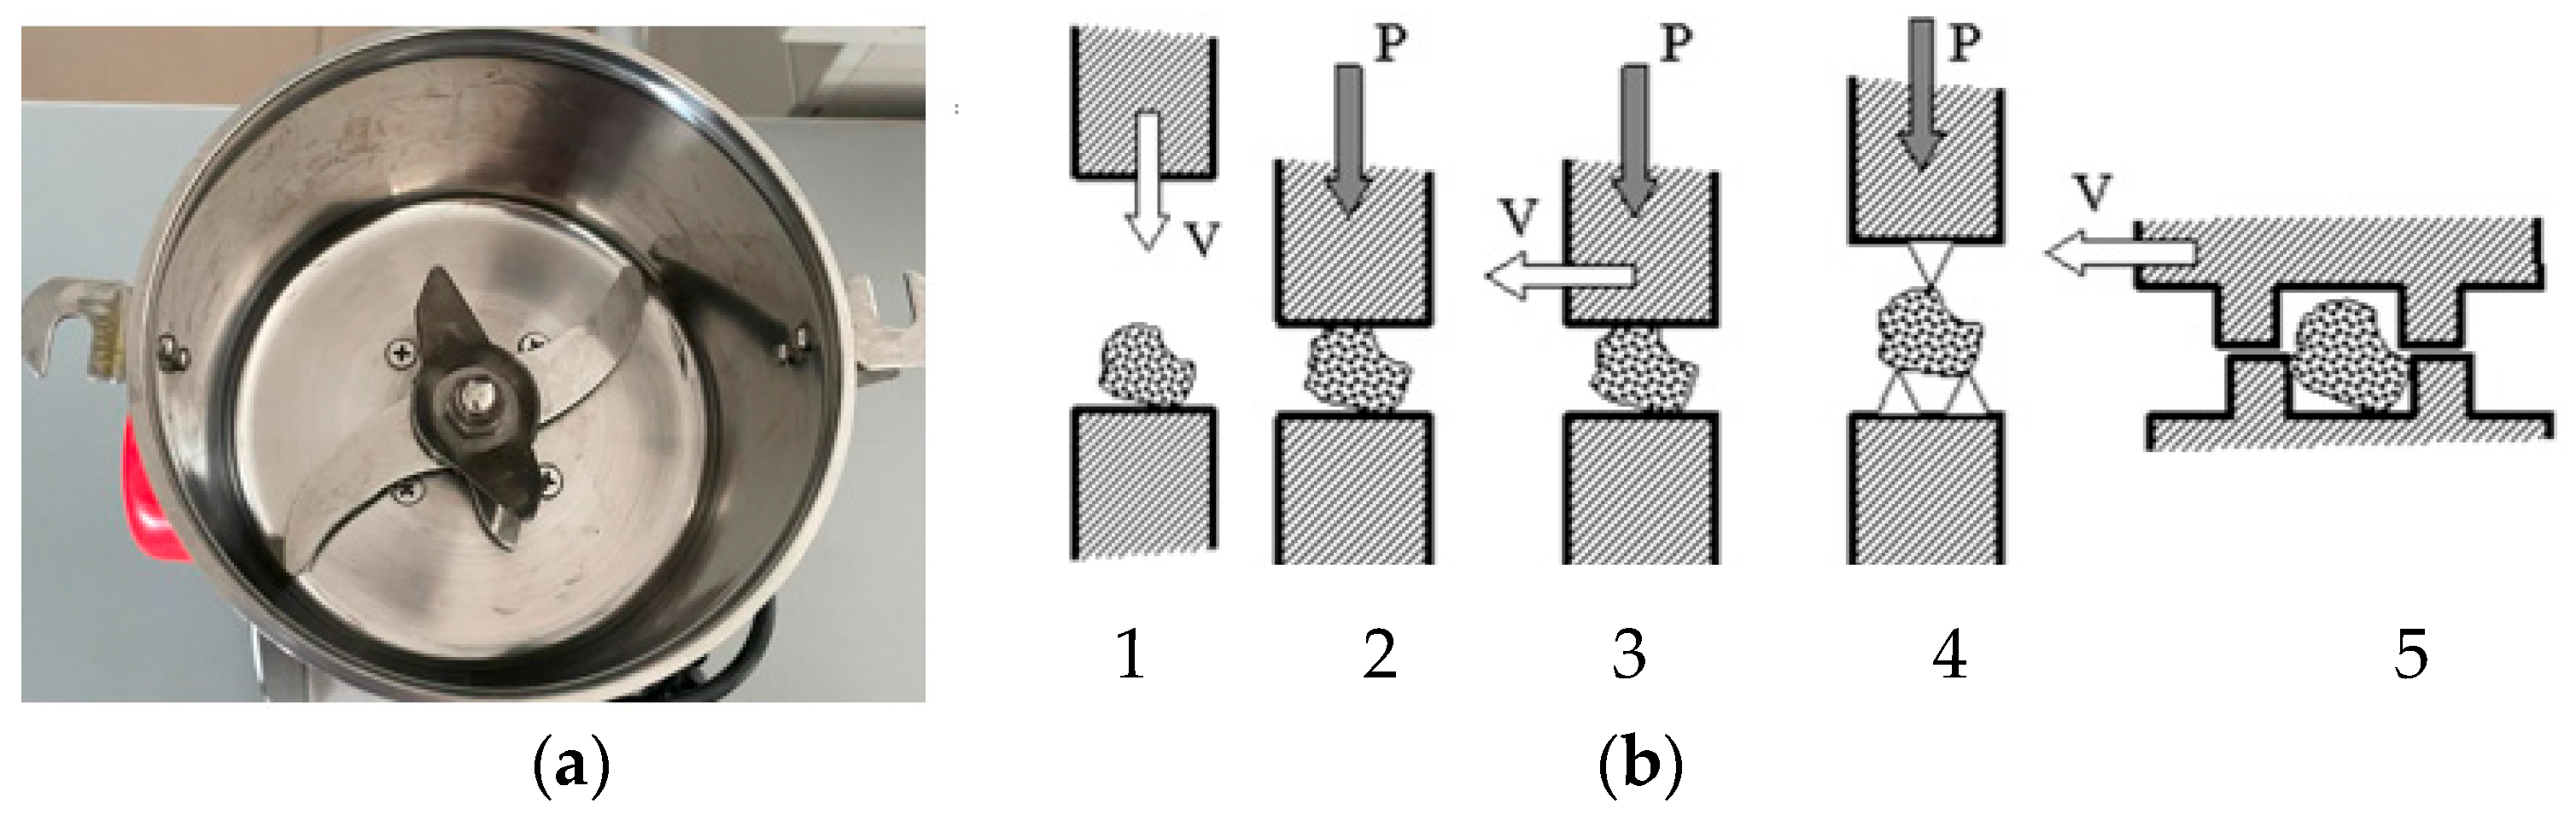
2.2. Tribochemical Equipment

To study the effect of cramped-impact-type mechanical action on the Lvf·Hh pharmaceutical substance, we used a Stegler LM-250 high-speed laboratory mill with a brush motor (Shenzhen Bestman Instrument Co., Ltd., Suzhou, Jiangsu, China (Mainland), with speed of 28,000 rpm and power of 13 kV (Figure 4).
The powders to be ground inside the grinding chamber of the mill are subjected to an intensive impact, cutting, splitting, and abrasion loading due to the special system of all-metal cutting blades and “trailing point” blades of different sizes (with the point bent upwards).

Study Design

The stages of the investigation of the drug substance MA using a high-speed laboratory mill were as follows: the loading of the substance weight in the initial state (native) was carried out, not exceeding ½ the volume of the milling bowl with the following engine start. The unloading of substance samples was carried out every 3 min of continuous mechanical impact (MI) followed by a comprehensive study of the dispersion, spectral, biological properties, and dissolution rate and colloidal stability; the weights of the substances unloaded were recorded, and the temperature in the milling chamber of the knife mill was measured using a non-contact infrared thermometer AMF008A (Amtast USA Inc., Suzhou, Jiangsu, China (Mainland). The number of uploads was n = 7.

2.3. Determination of Disperse-Phase Particle Size and Particle Size Distribution

To determine the particle size samples of levofloxacin hemihydrate (Lvf·Hh) samples after mechanoactivation (MAct), the methods of optic microscopy, static and dynamic light scattering were used.

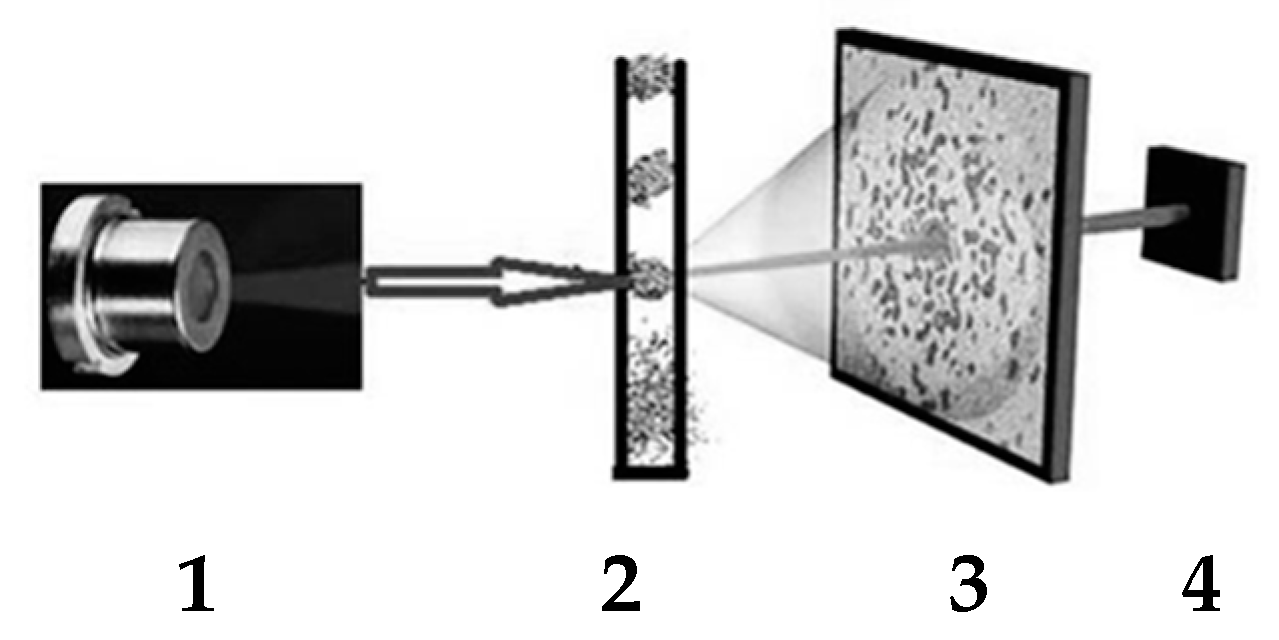
2.3.1. Static Light Scattering (SLS)

The Mact via static laser scattering (SLS) method was used to characterize particle size distribution before and after they were dispersed in n-hexan (1:200). In the particle size analysis, the size spectra (volumetric distribution on an ensemble of particles by size) was recorded using a MasterSizer 3600 Ec low-angle laser meter (Malvern, UK) [17]. The optical module of the equipment used made it possible to determine the size of the dispersed-phase particles in the range from 1 μm to 180 μm based on the measurement of the angular dependence of the intensity of the scattered laser light passing through the dispersed sample [18]. The SLS method also made it possible to determine the integral dispersion characteristics of the particles examined: laser obscuration (LO), volume concentration (VC, %), and specific surface area (ssa, m2/cm3). To obtain dimensional spectra, the distribution of the fraction of heterogeneous-phase particles was determine and then organized into dimensional groups, and this was used as a background as well as a medium to prepare the heterogeneous solution.

2.3.2. Dynamic Light Scattering (DLS)

Dynamic light scattering, also known as photon correlation spectroscopy or quasi-elastic light scattering [19], characterized by the Brownian motion of particles, is a simple technique to investigate the hydrodynamic size (HS) from 0.1 nm to 10,000 nm, zeta potential (ZP), and polydispersity index (PDI) of nanoparticles (NPs).

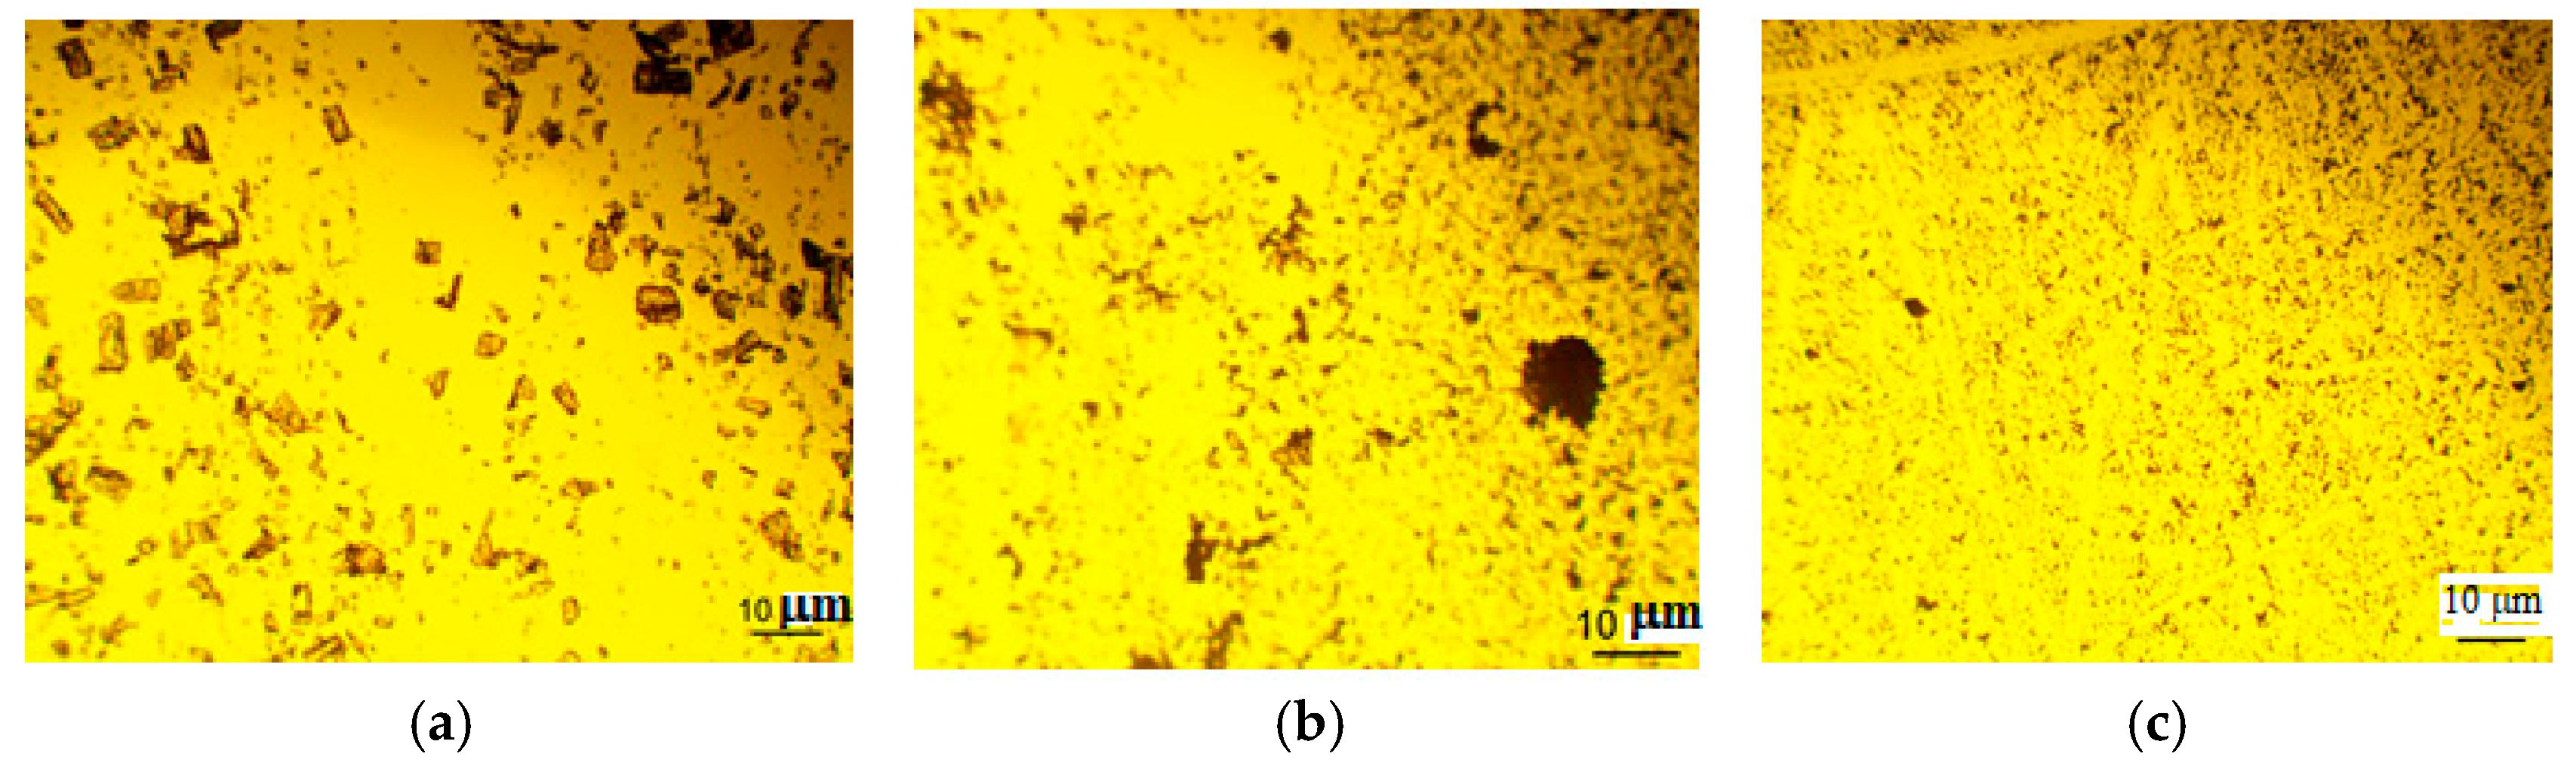
2.3.3. Optical and Digital Microscopy (OM and DM)

The determination of the size, shape, and granulometric composition of Lvf·Hh samples before and after Mact was carried out using a microscope with a special binocular attachment (Altami BIO 2, St. Petersburg, Russia) with magnification 10× (linear field of view 20 mm). To do this, a sample of dry matter was distributed on a glass slide without the adhesion of particles. The preliminary calibration was carried out using a micrometer object with a scale of 1DIV = 0.01 mm. The particles were observed in separate fields of view. The length was measured on microscopic images, and the shape of the particles was determined using the Altami Studio 3.3 software system.
The surface structure of Lvf·Hh samples was investigated by using a portable USB digital microscope LX200 (Levenhuk DTX 50, 124th Ave. Ste D, Tampa, FL 33612, USA) to determine the size of objects from 1 to 50 μm [20]. This microscope is equipped with a built-in digital 1.3 megapixel camera connected to a computer. The advantage of a digital microscope is that it can be used to express diagnostics of large sample areas without sample preparation. The analysis of the structure, relief, and defects of the layers adjacent to the surface allowed us to identify the objects under study.

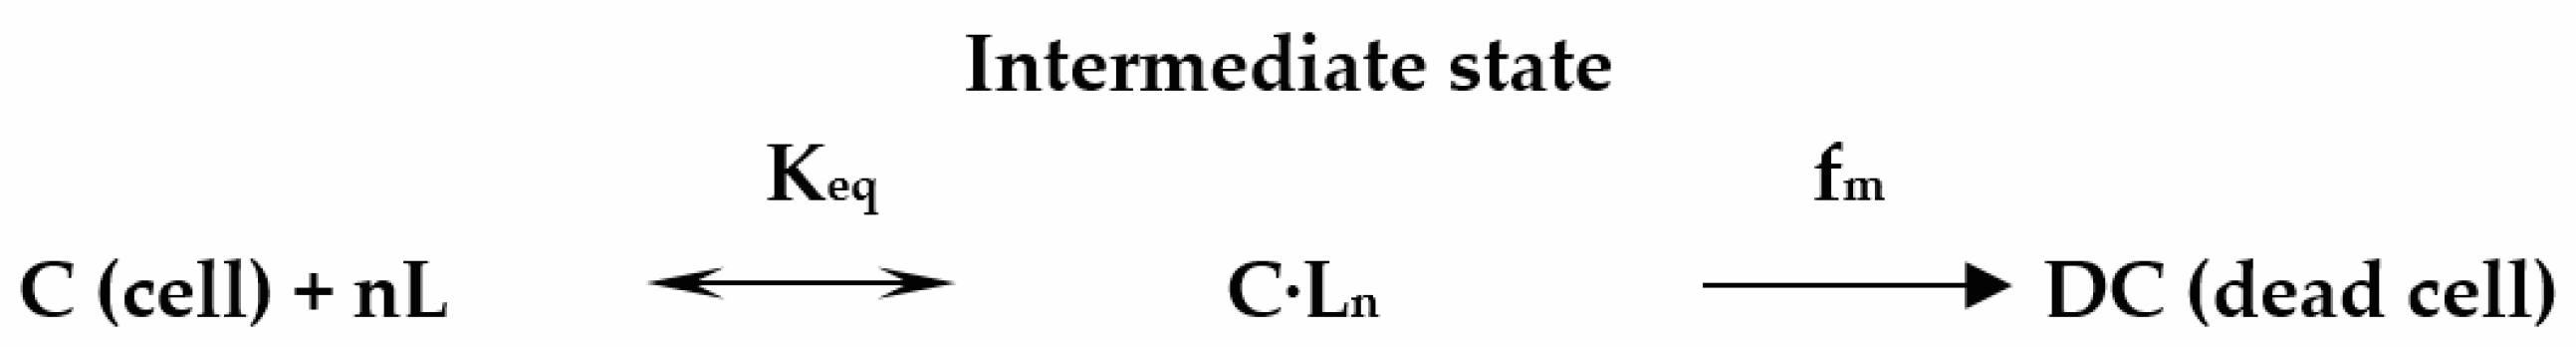
2.4. LALLS Study of Dissolution Rate Kinetics Design

The dissolution rate kinetics of Lvf·Hh samples before and after Mact were researched in water solvents: ultrapure water (UPW) (>18 MΩ·cm−1 at 25 °C, TOC ≤ 5 ppb, Merck Millipore). The intensity of laser light scattering over time was determined using a low-angle laser particle dispersion meter Particle Sizer (Malvern Instruments, Malvern, UK) with a scanning wavelength λ = 632 nm and capacitive cell (V = 3 mL) equipped with a mechanical stirrer (Figure 5) [21].
The measurement of Laser Obscuration time (LO) was achieved by adding a sample of the substance to the cell every 10 s until the complete dissolution of the substance, and the laser obscuration parameter was recorded during this entire process.

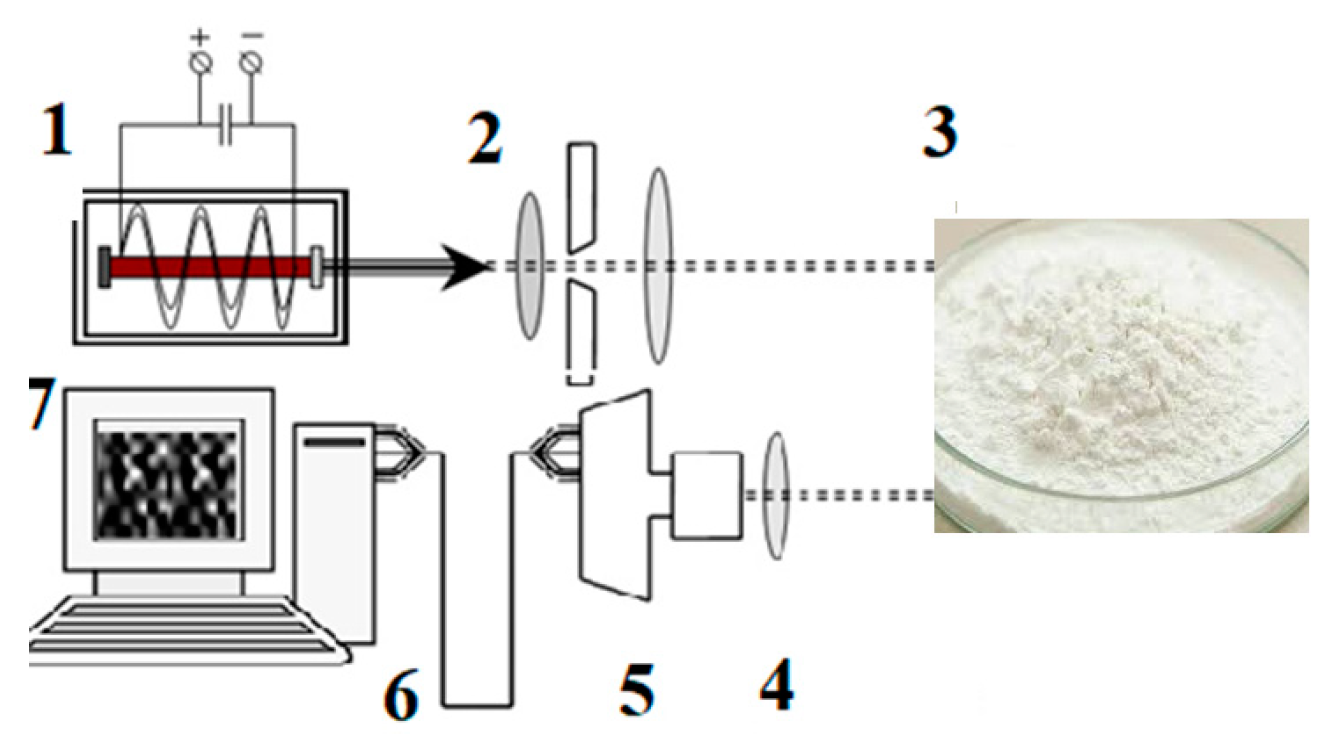
2.5. 2D Light Scattering (2D-LS) Method

The equipment, based on a backscatter detection solution, consists of a small-sized radiator with integrated high-spectral-density LEDs and a video camera. New-generation LEDs were used to probe the sample surface, providing a power density of up to 50 mVt/cm2 in the 360–410 nm range and a spectral line width of up to 2–4 nm (model AA3528LVBS/D, type C503B-BCN-CV0Z0461, CreeLED, Inc., Zhuhai, China) (Figure 6) [22].
The resulting light scattering patterns were processed using ten topological descriptors similar to the Wiener (W) and Balaban (J) QSAR descriptors, modified by Trinajstic (l) (Table 1).
The family of descriptors d1,d2,d3 also includes the triads: standard deviation sd1, sd2, sd3; r1, r2, r3 (ri = di/sdi); and R = i R i / i R i . Each descriptor is a topological convolution of the light scattering matrix obtained by the element-by-element subtraction of the background. Therefore, a descriptor reflects not only spatial irregularities on the surface or color, but also the dynamic variability in light reflection. A combination of ten descriptors characterizes each of the surfaces under study and reflects the degree of difference in the resulting interference patterns.

2.6. Fourier-Transform IR Spectroscopy

To obtain and analyze the vibrational spectra of the Lvf·Hh samples before and after MAct in the spectral range from 4000 to 500 cm1, a Fourier-transform infrared spectroscope (FTIR) (Agilent Cary 630, Santa Clara, CA 95051, USA) with a transmission attachment was used [23].

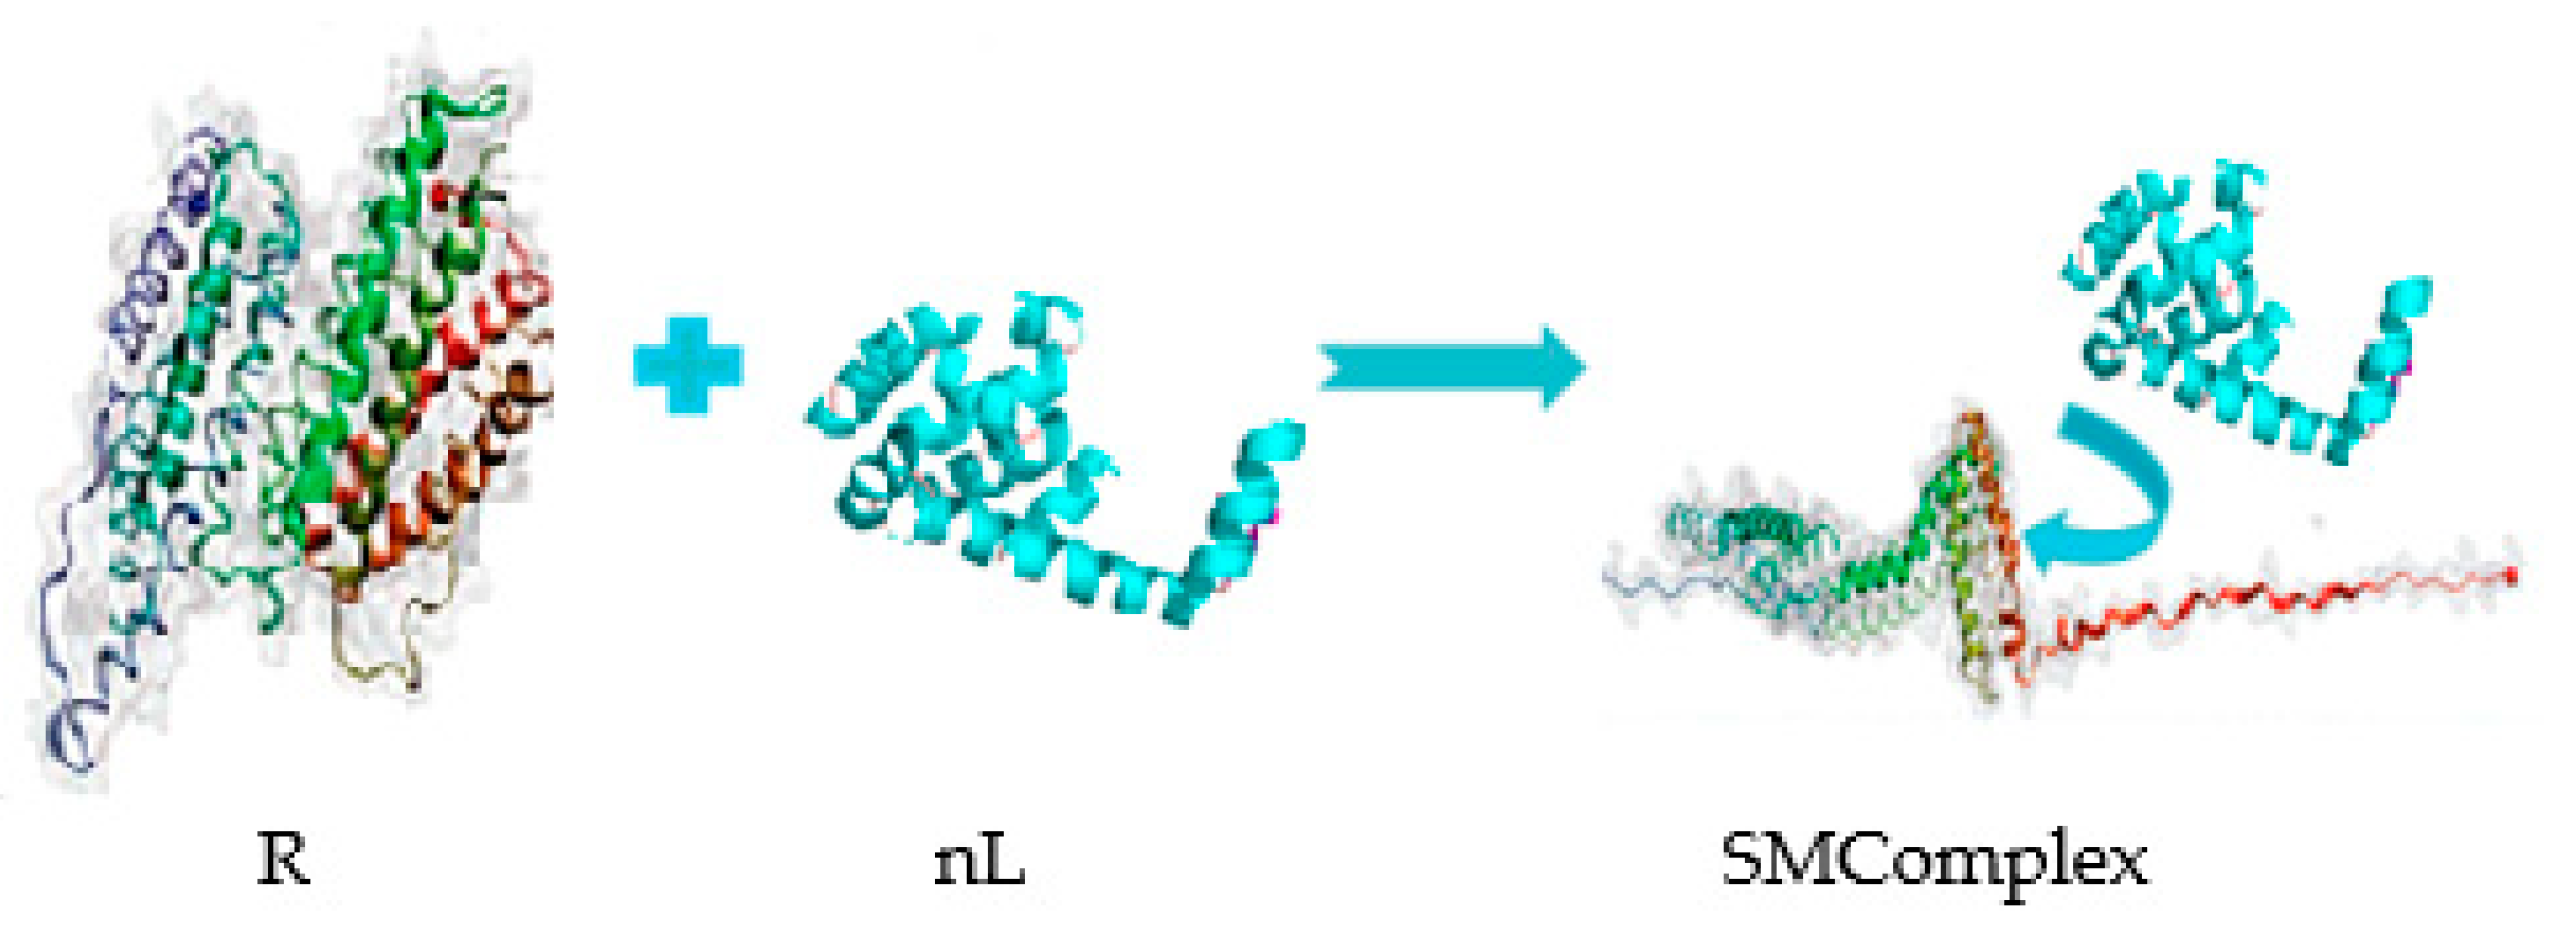
2.7. Molecular Docking Studies

For molecular computer modeling, the Lvf·Hh structure was generated with HyperChem 8.0.8 and docked to the crystallographic structure of DNA-Gyrase II (PBD: 6RKV) using the BIO-HPC Achilles Blind Docking Server online service [24]. The identified interactions between the low-molecular-weight ligand and the DNA-Gyrase II structure were visualized using PyMol and the Achilles Blind Docking Server [25].

2.8. Spirotox Method

The aqueous protozoan Spirostomum ambiguum was used as a cellular model to evaluate the biological activity/toxicity of the tested substance samples. The survival of the ciliated protozoan Sp. ambiguum incubated in aqueous solutions of the test samples was investigated using different MI times at T, C = const and Arrhenius kinetics (T = 296–302 K) of cell death with corresponding obsevedEa calculations. The mechanism of ligand–receptor interactions involves the cell–ligand interaction stage, the formation of the C·Ln intermediate state, the decay of the intermediate complex due to conformational changes, and the death of ciliated protozoan (Figure 7).

Spirotox Study Design

Relationship between the survival of Sp. ambiguum test culture and the nature of the samples: at an incubation thermostated chamber (T = 24 °C) filled with 200 μL of Mili-Q water, the 100 µL of 9 mM test substance aqueous solution were added and the protozoa have been immediately placed. The time of cell death was recorded and confirmed through consecutive biological signs: the convulsion–twisting–cessation of motor activity. The Arrhenius time dependence of ciliated protozoan Sp. ambiguum cell death was investigated between 296 and 302 K in an environment containing a 9 mM aqueous solution of the test substance diluted 1:3 with Mili-Q water.

2.9. Statistical Data Processing

All statistical processing of the data was performed under repeatable experimental conditions using Origin Pro 2023b (v10.05) software. Differences were considered statistically significant at p < 0.05.

3. Results

3.1. Disperse-Phase Particle Size and Particle Size Distribution

3.1.1. Static Laser Scattering Data

Tribochemical transformations may be accompanied by a reduction in particle size (fine grinding) or a change in their agglomerated state [26].
A high-intensive mechanical impact on the Lvf·Hh powder for 21 min with a maximum load of 40 g resulted in an observable dispersity phenomenon (DPh) of the test sample unloading from the milling bowl every 3 min, as measured using SLS (Figure 8).
The Lvf·Hh native sample size spectra as a size distribution is presented as a fraction of particles occupying a certain volume in the micron dispersal system, and it is represented by two max peaks: size groups at d1 = 20 μm and d2 = 115 μm, where the larger fraction of 20 μm particles indicates the native sample is a non-uniform, bimodal substance. The sample unloading with MI duration at t = 3 min demonstrates a redistribution of size groups (d1 = 33 μm and d2 = 86 μm) with a tendency to increase dispersity—a decrease in particle size in the larger micron fraction. This is also confirmed by results of particle morphology analyses in OM: the grain size and shape of the disperse phase after fine grinding during the first and second powder discharges (t = 3 min, t = 6 min) are indistinguishable and appear in a highly dispersed state, which is close to amorphous (Figure 9).
However, continued high-intensity MI at t ≥ 6 min on Lvf·Hh powder led to the dispersity phenomenon (DPh) of discharge samples, consisting of an increase in the diameter (d, μm) and volume fraction (%) of the particle size groups (Figure 8a). We propose that while the initial state of Lvf·Hh is a low defective crystalline substance, the instabilities of the plastic zone accumulate from MI as a result of the formation of catastrophic dislocation and their multiplication, which is due to dislocation interactions in high-dislocation-density regions [27]. The analysis of the integral dispersion characteristics confirms the SLS results for the observed DPh (Figure 8b. The nature of the structures formed by the continuing MI has a significant effect on the dispersion in the disperse medium, represented in the form of an oscillatory motion: a successive decrease in the value of the specific surface area (ssa, m2/cm3) of disperse-phase particles up to t = 9 min. Other observable effects include an increase in the light scattering properties (LO) and volume concentration (VC, %) of the disperse system. At MI t > 9 min, identified by a high amplitude of forced oscillations, the dependence of the system’s response to MI on the Lvf·Hh powder substance is described as a gradual shortening of the vibration lifetime—the vibration amplitude decreases e times according to the τ = 1/γ law.

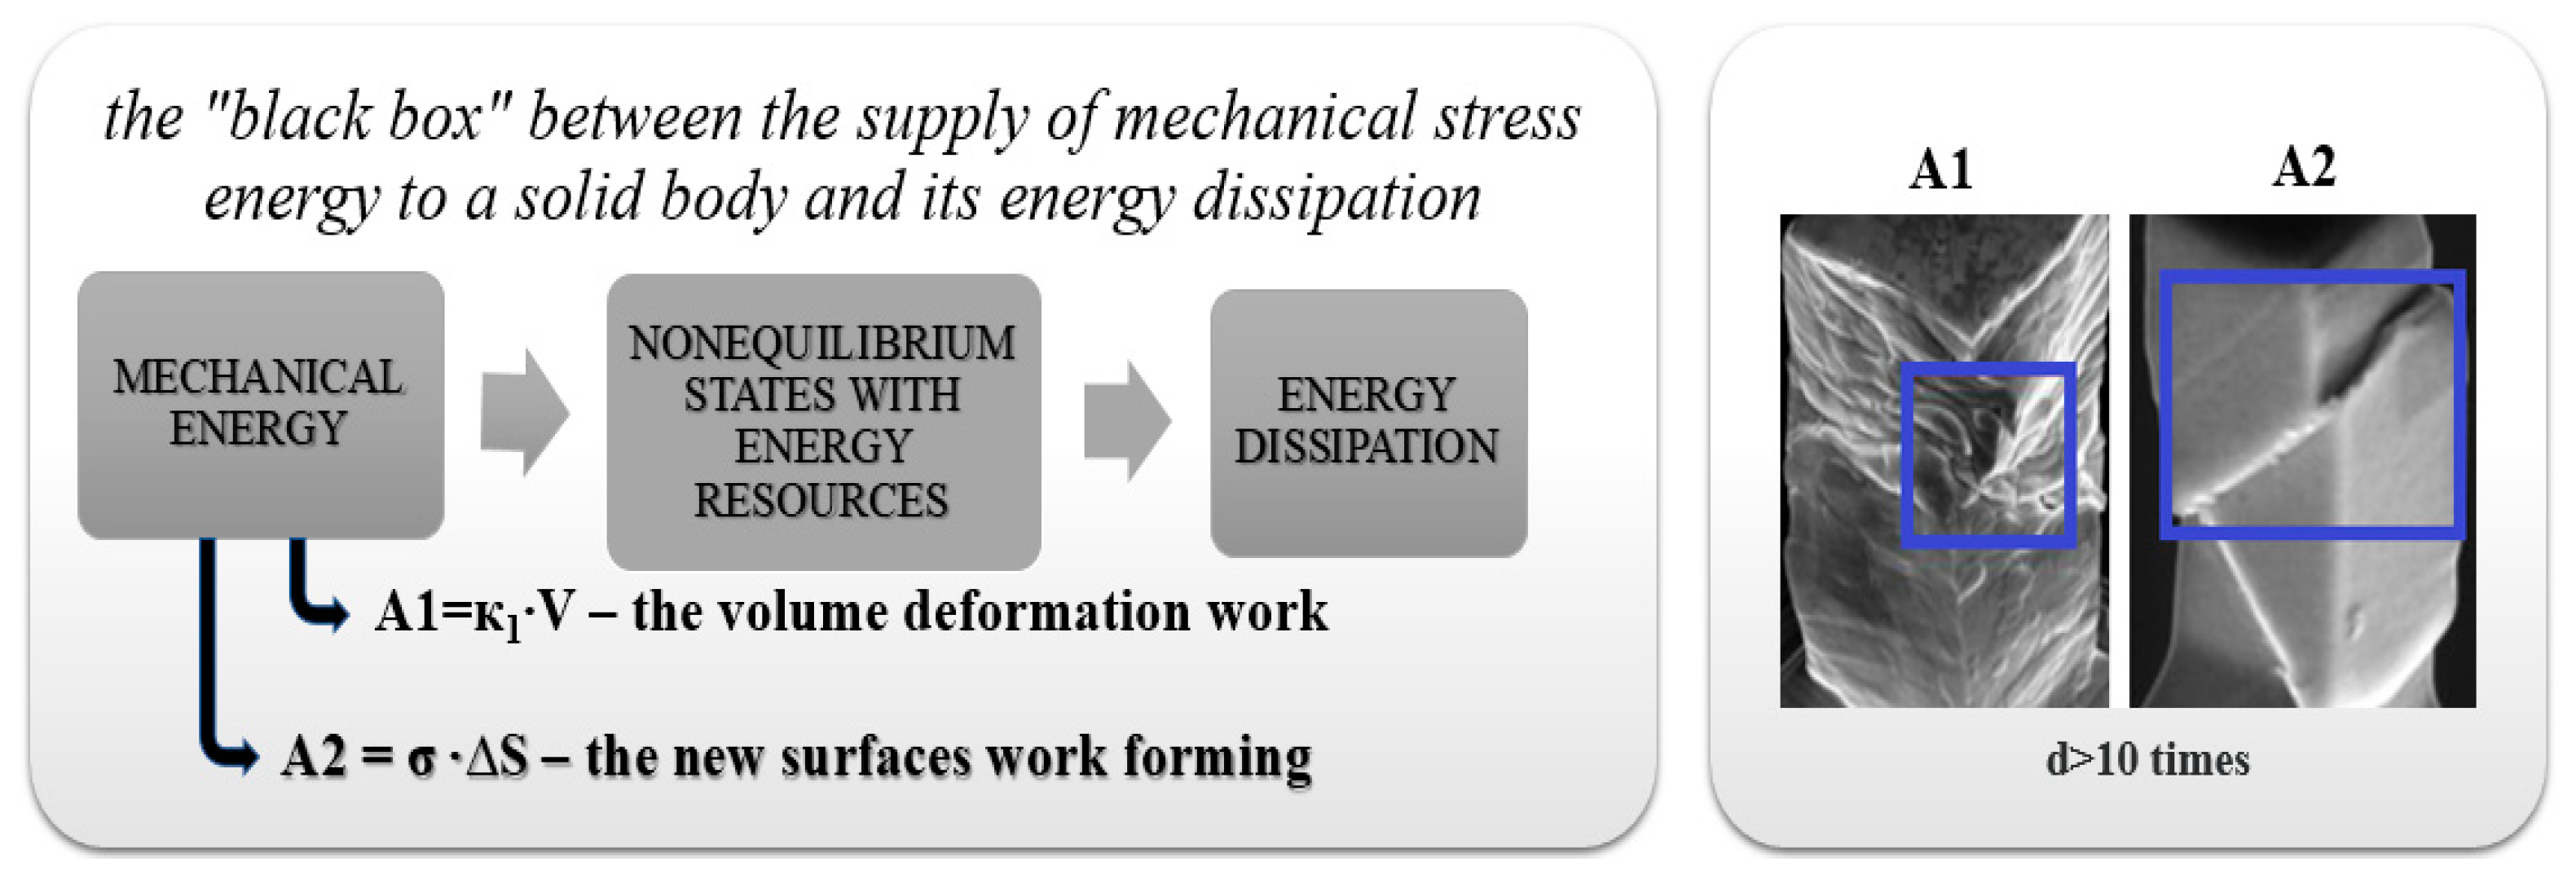
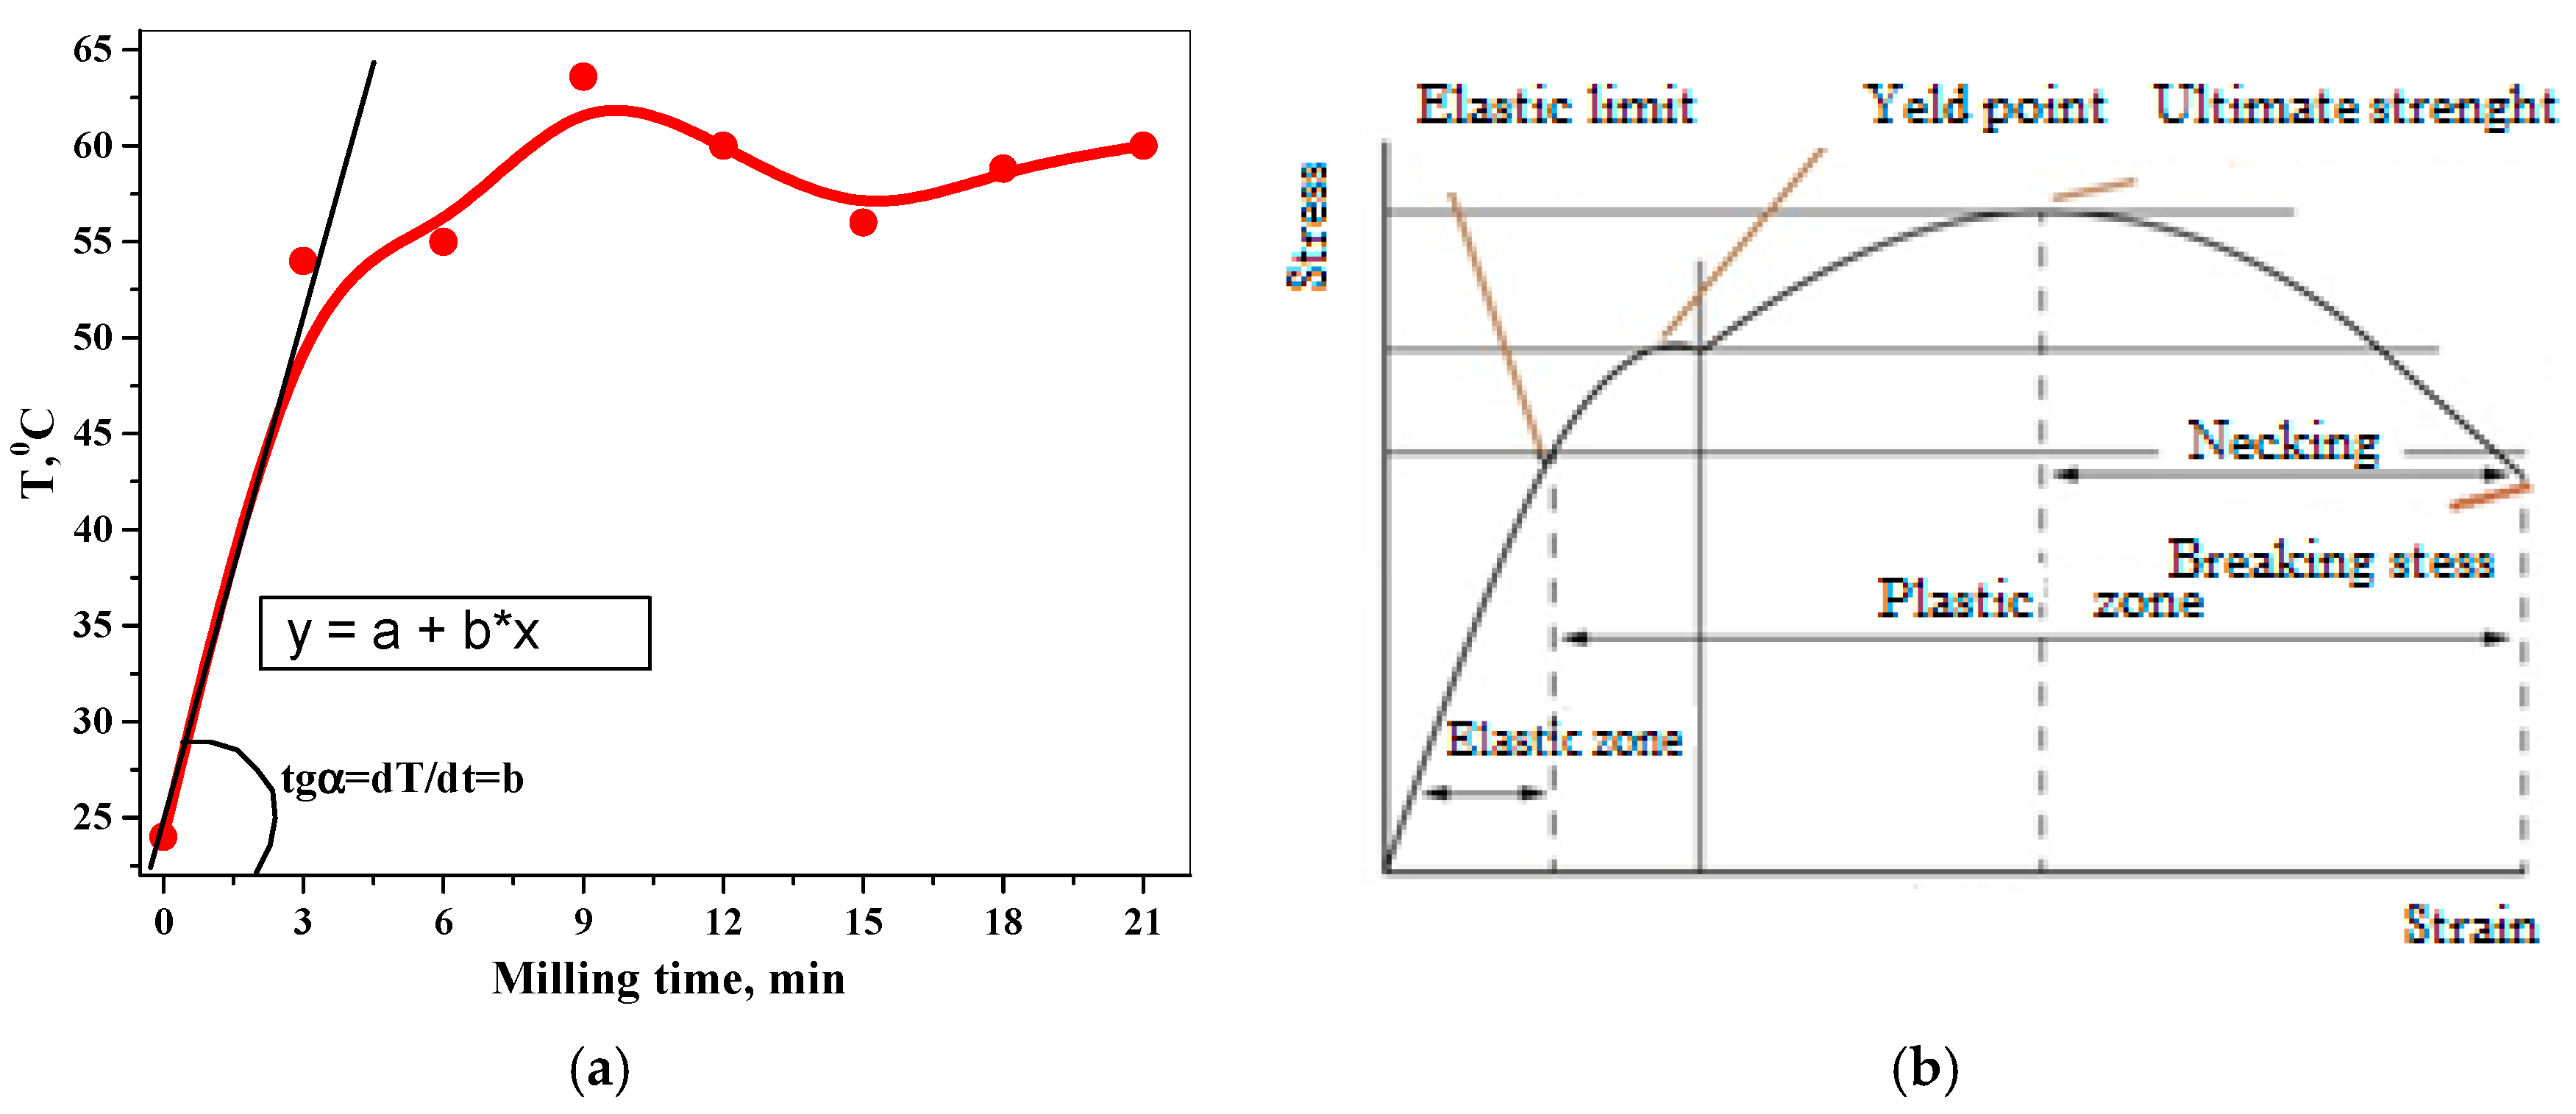
3.1.2. Stress–Strain Relationships

It is interesting to compare the dynamic change in the amplitude values of forced oscillations (see Figure 8b, red curve) with the change in resistance to the SB deformation (strength) caused by Bochvar–Oding dislocations: the maximum SB strength will decrease with the increase in dislocation density until it reaches a critical value, at which, dislocations will start to hinder and inhibit their own movement in the defective SB structure [28,29].
The results also show that the gradual application of the MI load to the SB results in an increase in temperature inside the grinding bowl containing the Lvf·Hh substance, where the sample undergoes deformation. This suggests that deformation stress has a positive temperature dependence. As the temperature inside the milling bowl rises, the number of vacancies and the dislocation density in SB will increase. If we consider the temperature change inside the TrbCh reactor as the dispersal system’s response to the MI stress, accompanied by an increase in SB deformation, it is similar to the typical stress–strain curve form (Figure 10) [30].
The resulting temperature curve, “milling bowl heating–duration of the MI applied”, greatly resembles the “stress–strain curve” and allows us to predict dynamic changes in SB properties such as the ultimate strength at MI and the angle ratio of the straight line to the axis OX: k = tgα = 10 min−1, similar to the Young’s modulus calculation.
It can be seen that the critical points (see Figure 10a) are the sections of the curve corresponding to the applied MI at t = 6 min—the elastic zone; t = 9 min—the yield point; and t > 9 min—the plastic deformation zone. This shows a trend of the tensile strength due to MI increasing and the hardening of SB increasing.
A further observed correlation between the increasing stress of dislocation currents and dimensional anomalies and temperature is demonstrated in the molecular systems of the investigated samples.

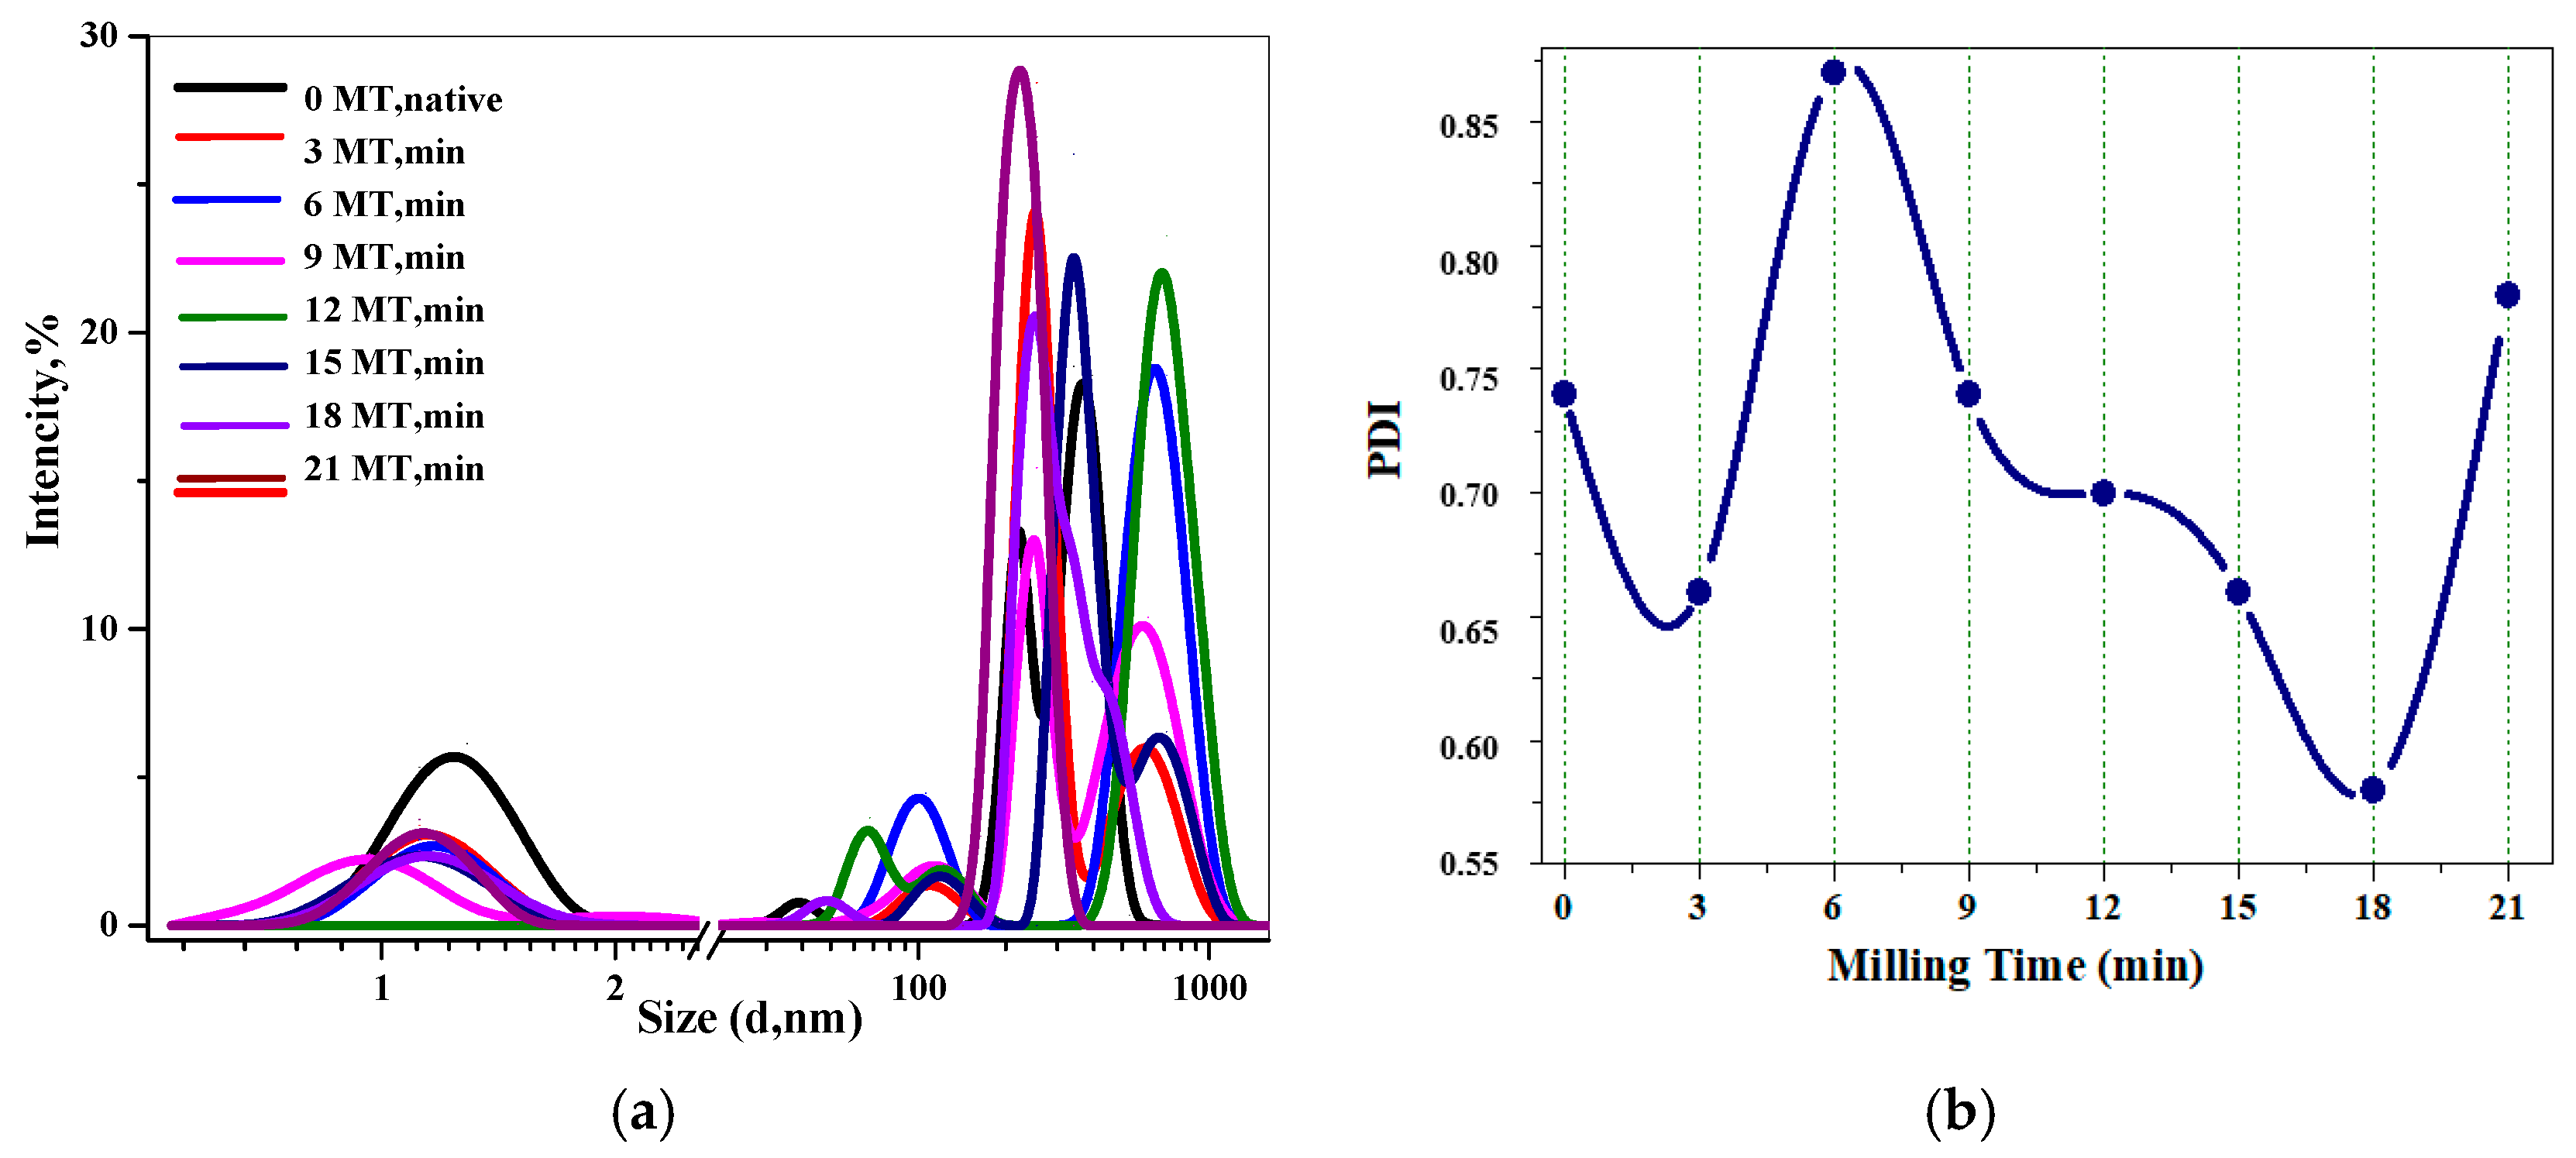
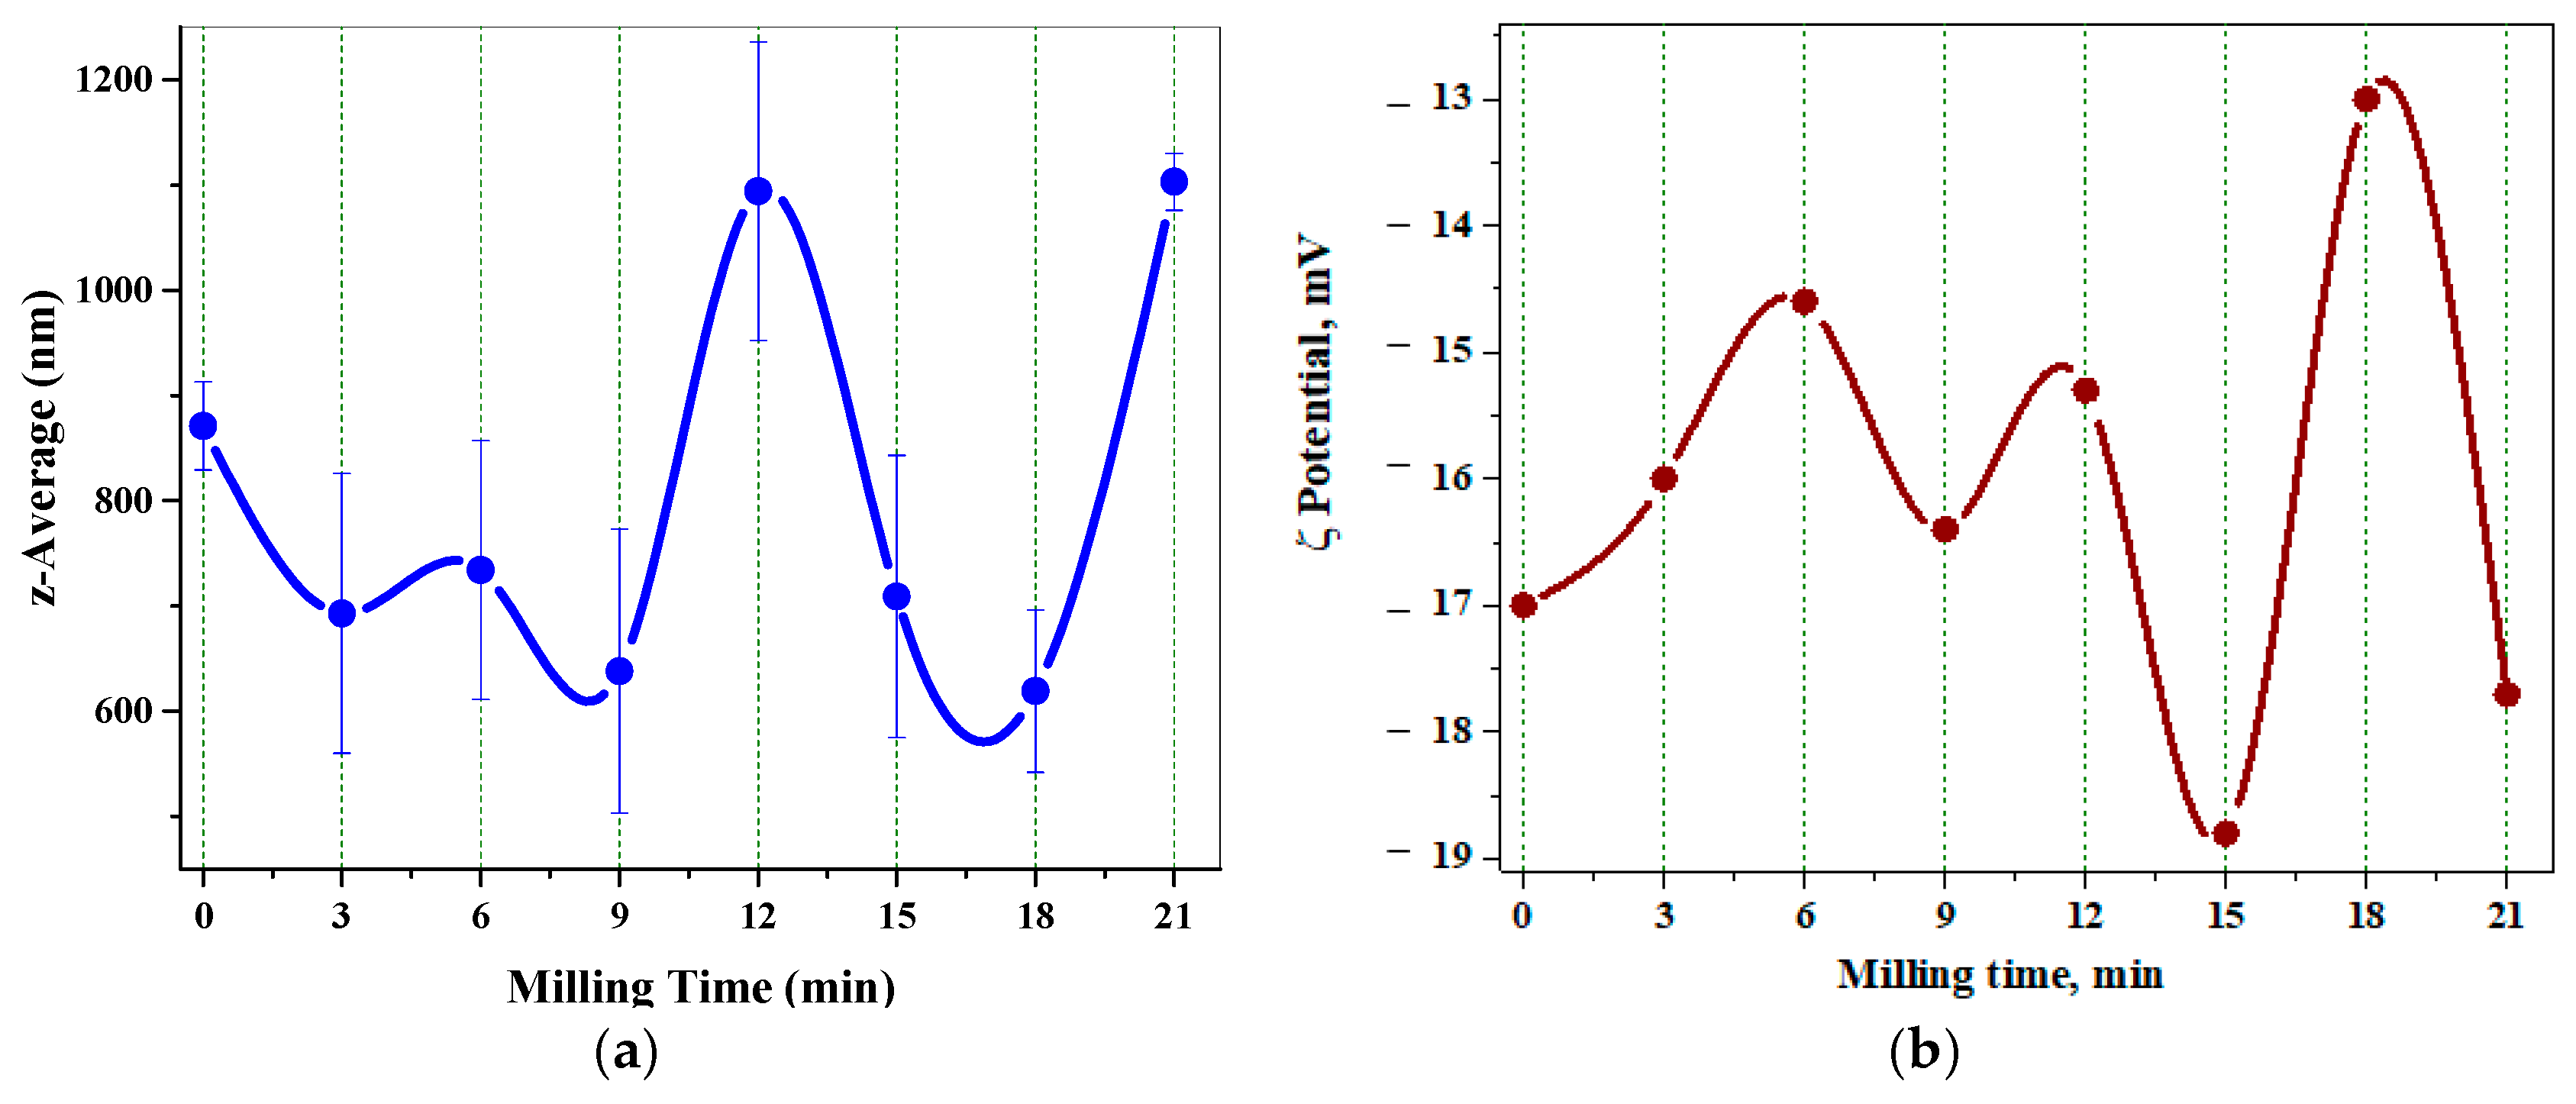
3.1.3. Dynamic Laser Scattering Data

The effect of non-thermal mechanical influence on the drug powder (in the range from 0 to 21 min at a load value of 40 g) was evaluated via the DLS method based on the analysis of the autocorrelation function determined by the time-varying intensity of scattered light (Photon Correlation Spectroscopy in aqueous solutions of the test samples with different MI times (Figure 11).
Figure 11a shows the micelle size in aqueous solutions of Lvf·Hh as well as changes in aggregate size before and after MI: all substance samples are characterized as being non-homogeneous, being polymodal with low scattering capacity in the nano-region: d1~1 nm and d2~100 nm, and having high scattering capacity in the submicron region: d3 = 300–700 nm. A more informative illustration of the MI effect on the structure and properties of the Lvf·Hh molecular systems is the polydispersity index dynamics (PDI) of the samples showing free damping oscillations of the measured quantity with a PDI maximum approaching 1 at t = 6 min of MI.
The Z-Average—the intensity-weighted mean hydrodynamic size of the ensemble collection of particles and colloidal stability expressed in terms of zeta potential values—shows a jump-like, periodic, and antibate relationship. The particle aggregation in Lvf·Hh molecular systems during the MI promotes a reduction in the absolute value of ζ-potential with agglomeration probability. A sharp rise in the Z-Average amplitude is observed at t > 9 min with a peak at t = 12 min, produced by MI, which corresponds to the region of plastic deformation (see Figure 10) and SB hardening under TRbCh action (Figure 12).
Under conditions of high-intensity MI, the mass-produced defects and impurity atoms displaced from lattice junctions via the diffusion of intrinsic inter-node atoms to dislocations form “enriched” regions that determine the changes in SB properties—«dynamic strain aging» (DSA). It is shown [31] that the energy diagram representing the migration “relief” of defects and impurities also has a discontinuous periodic relationship with time “τ” shift per lattice period, with maxima and minima. The minima in the diagram corresponds to a decrease in the activation energy of the thermally activated jump to the dislocation nucleus, which is what allows the material to undergo DSA.

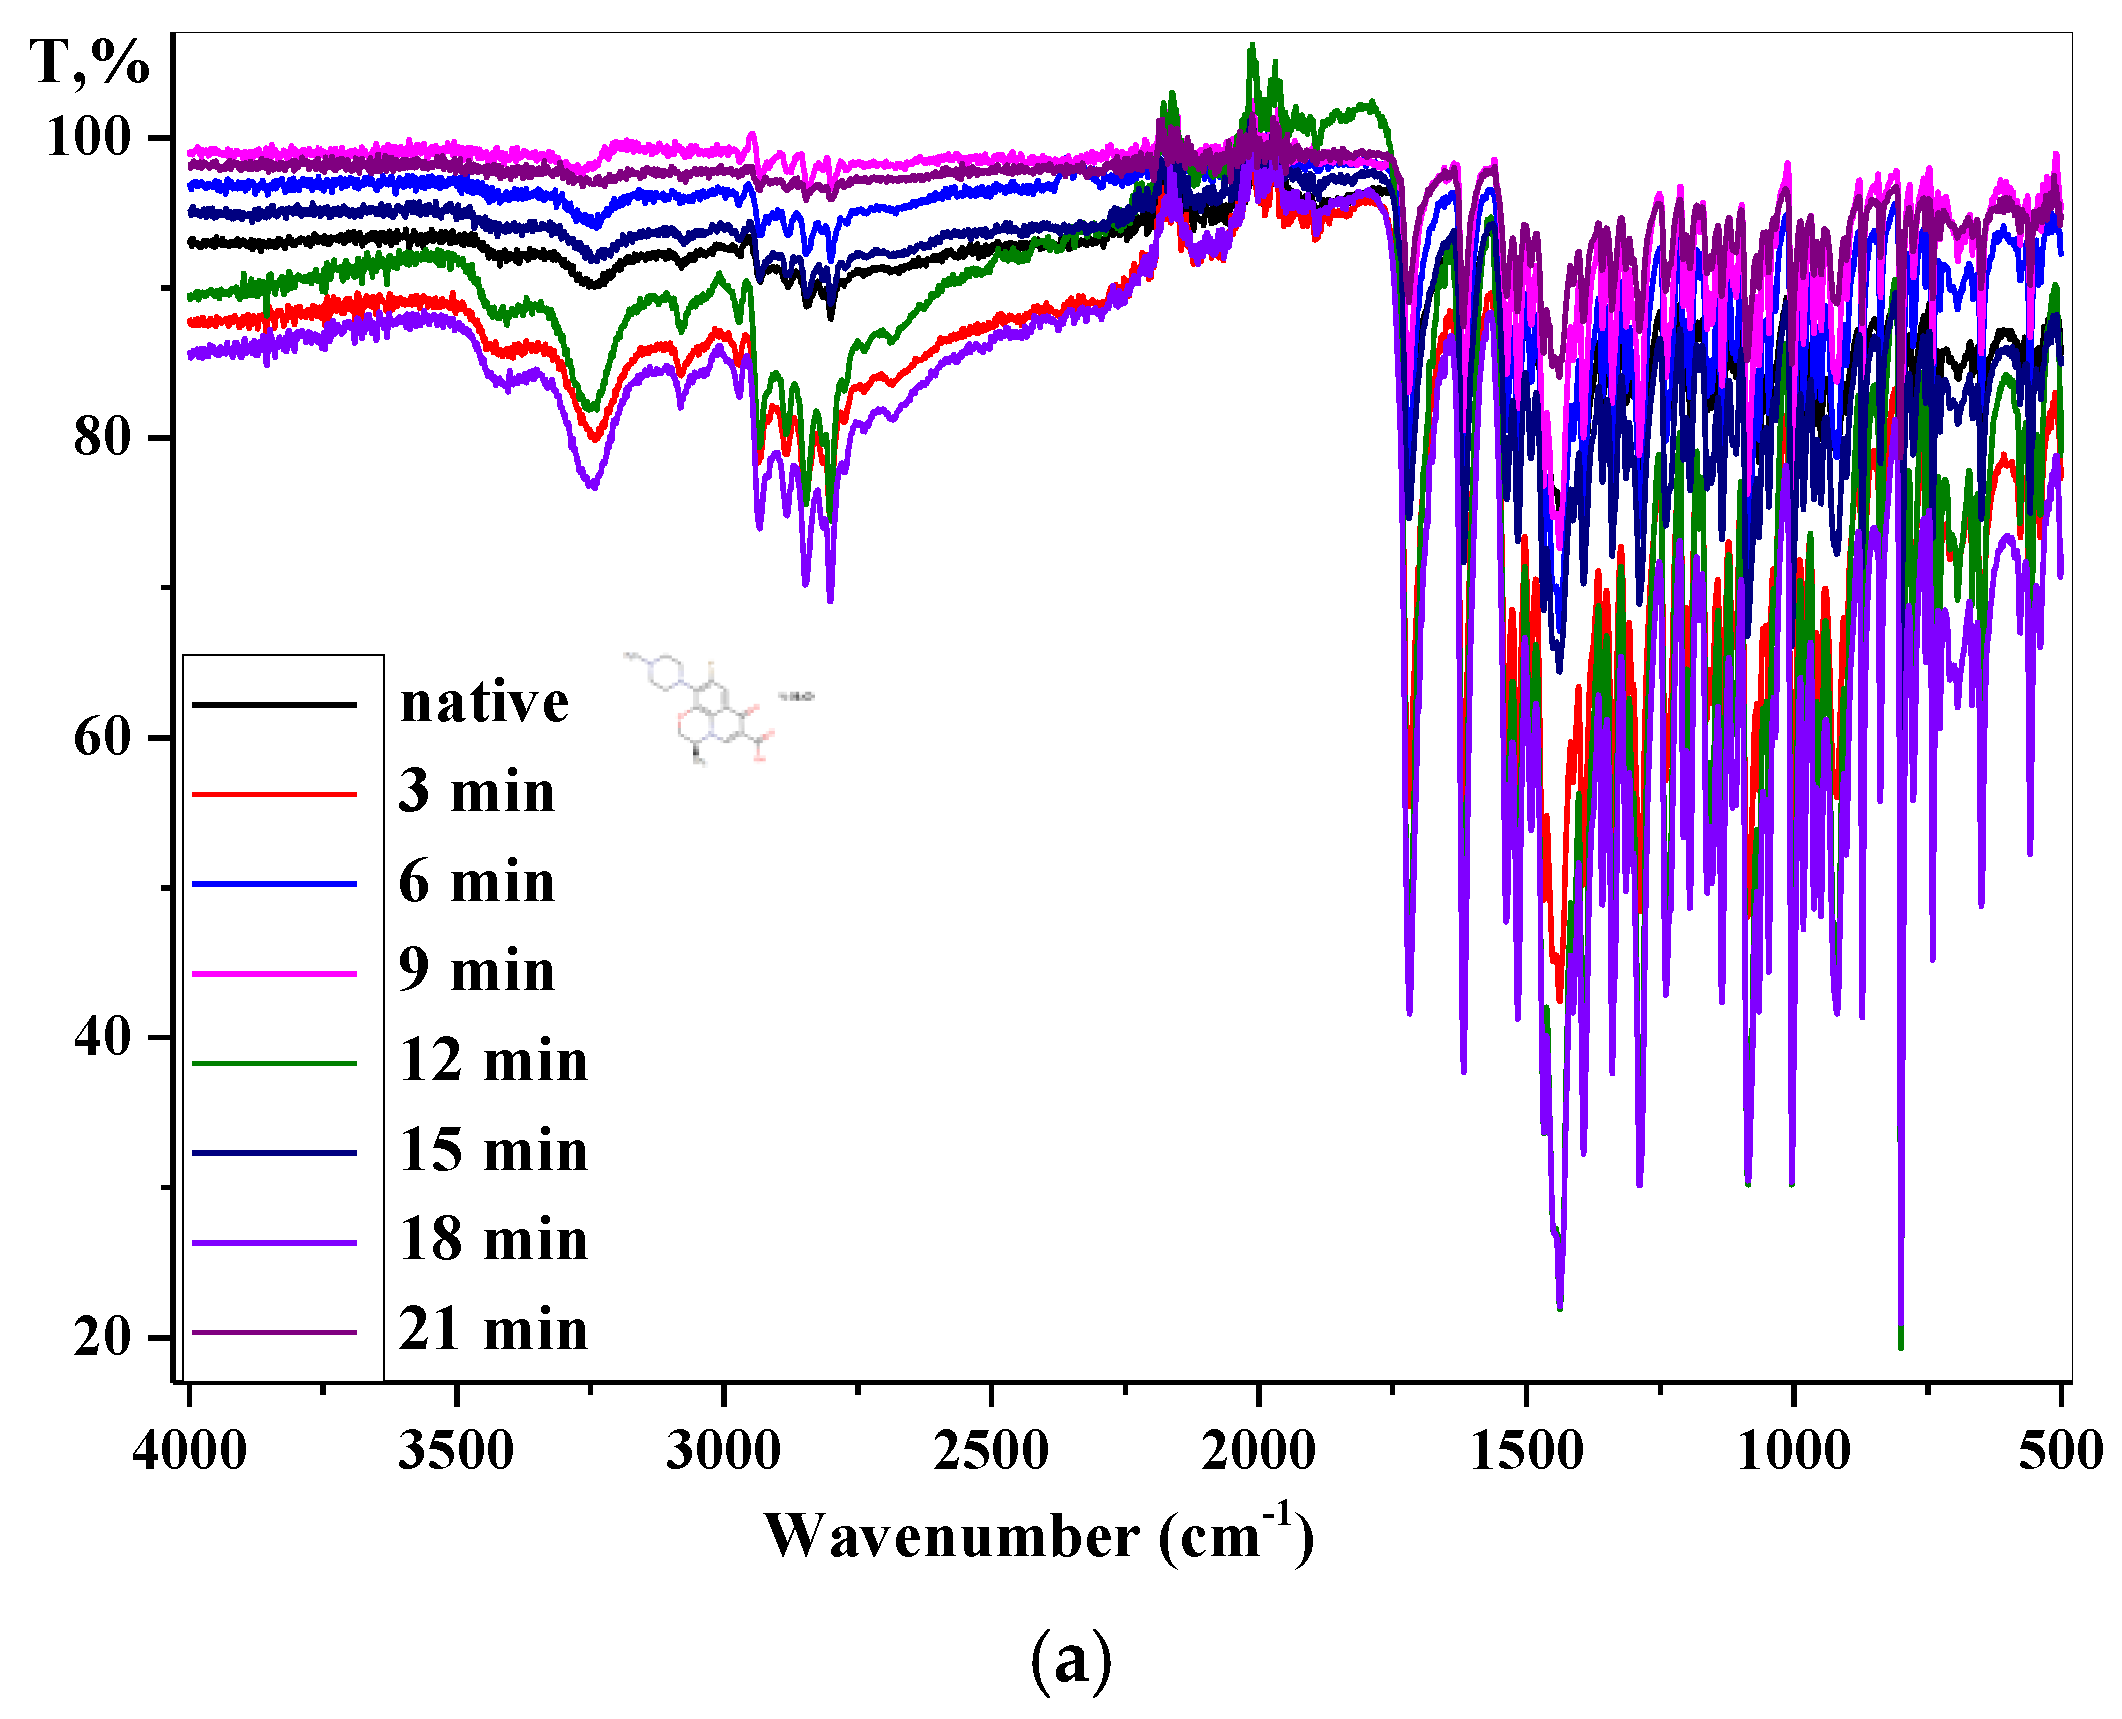
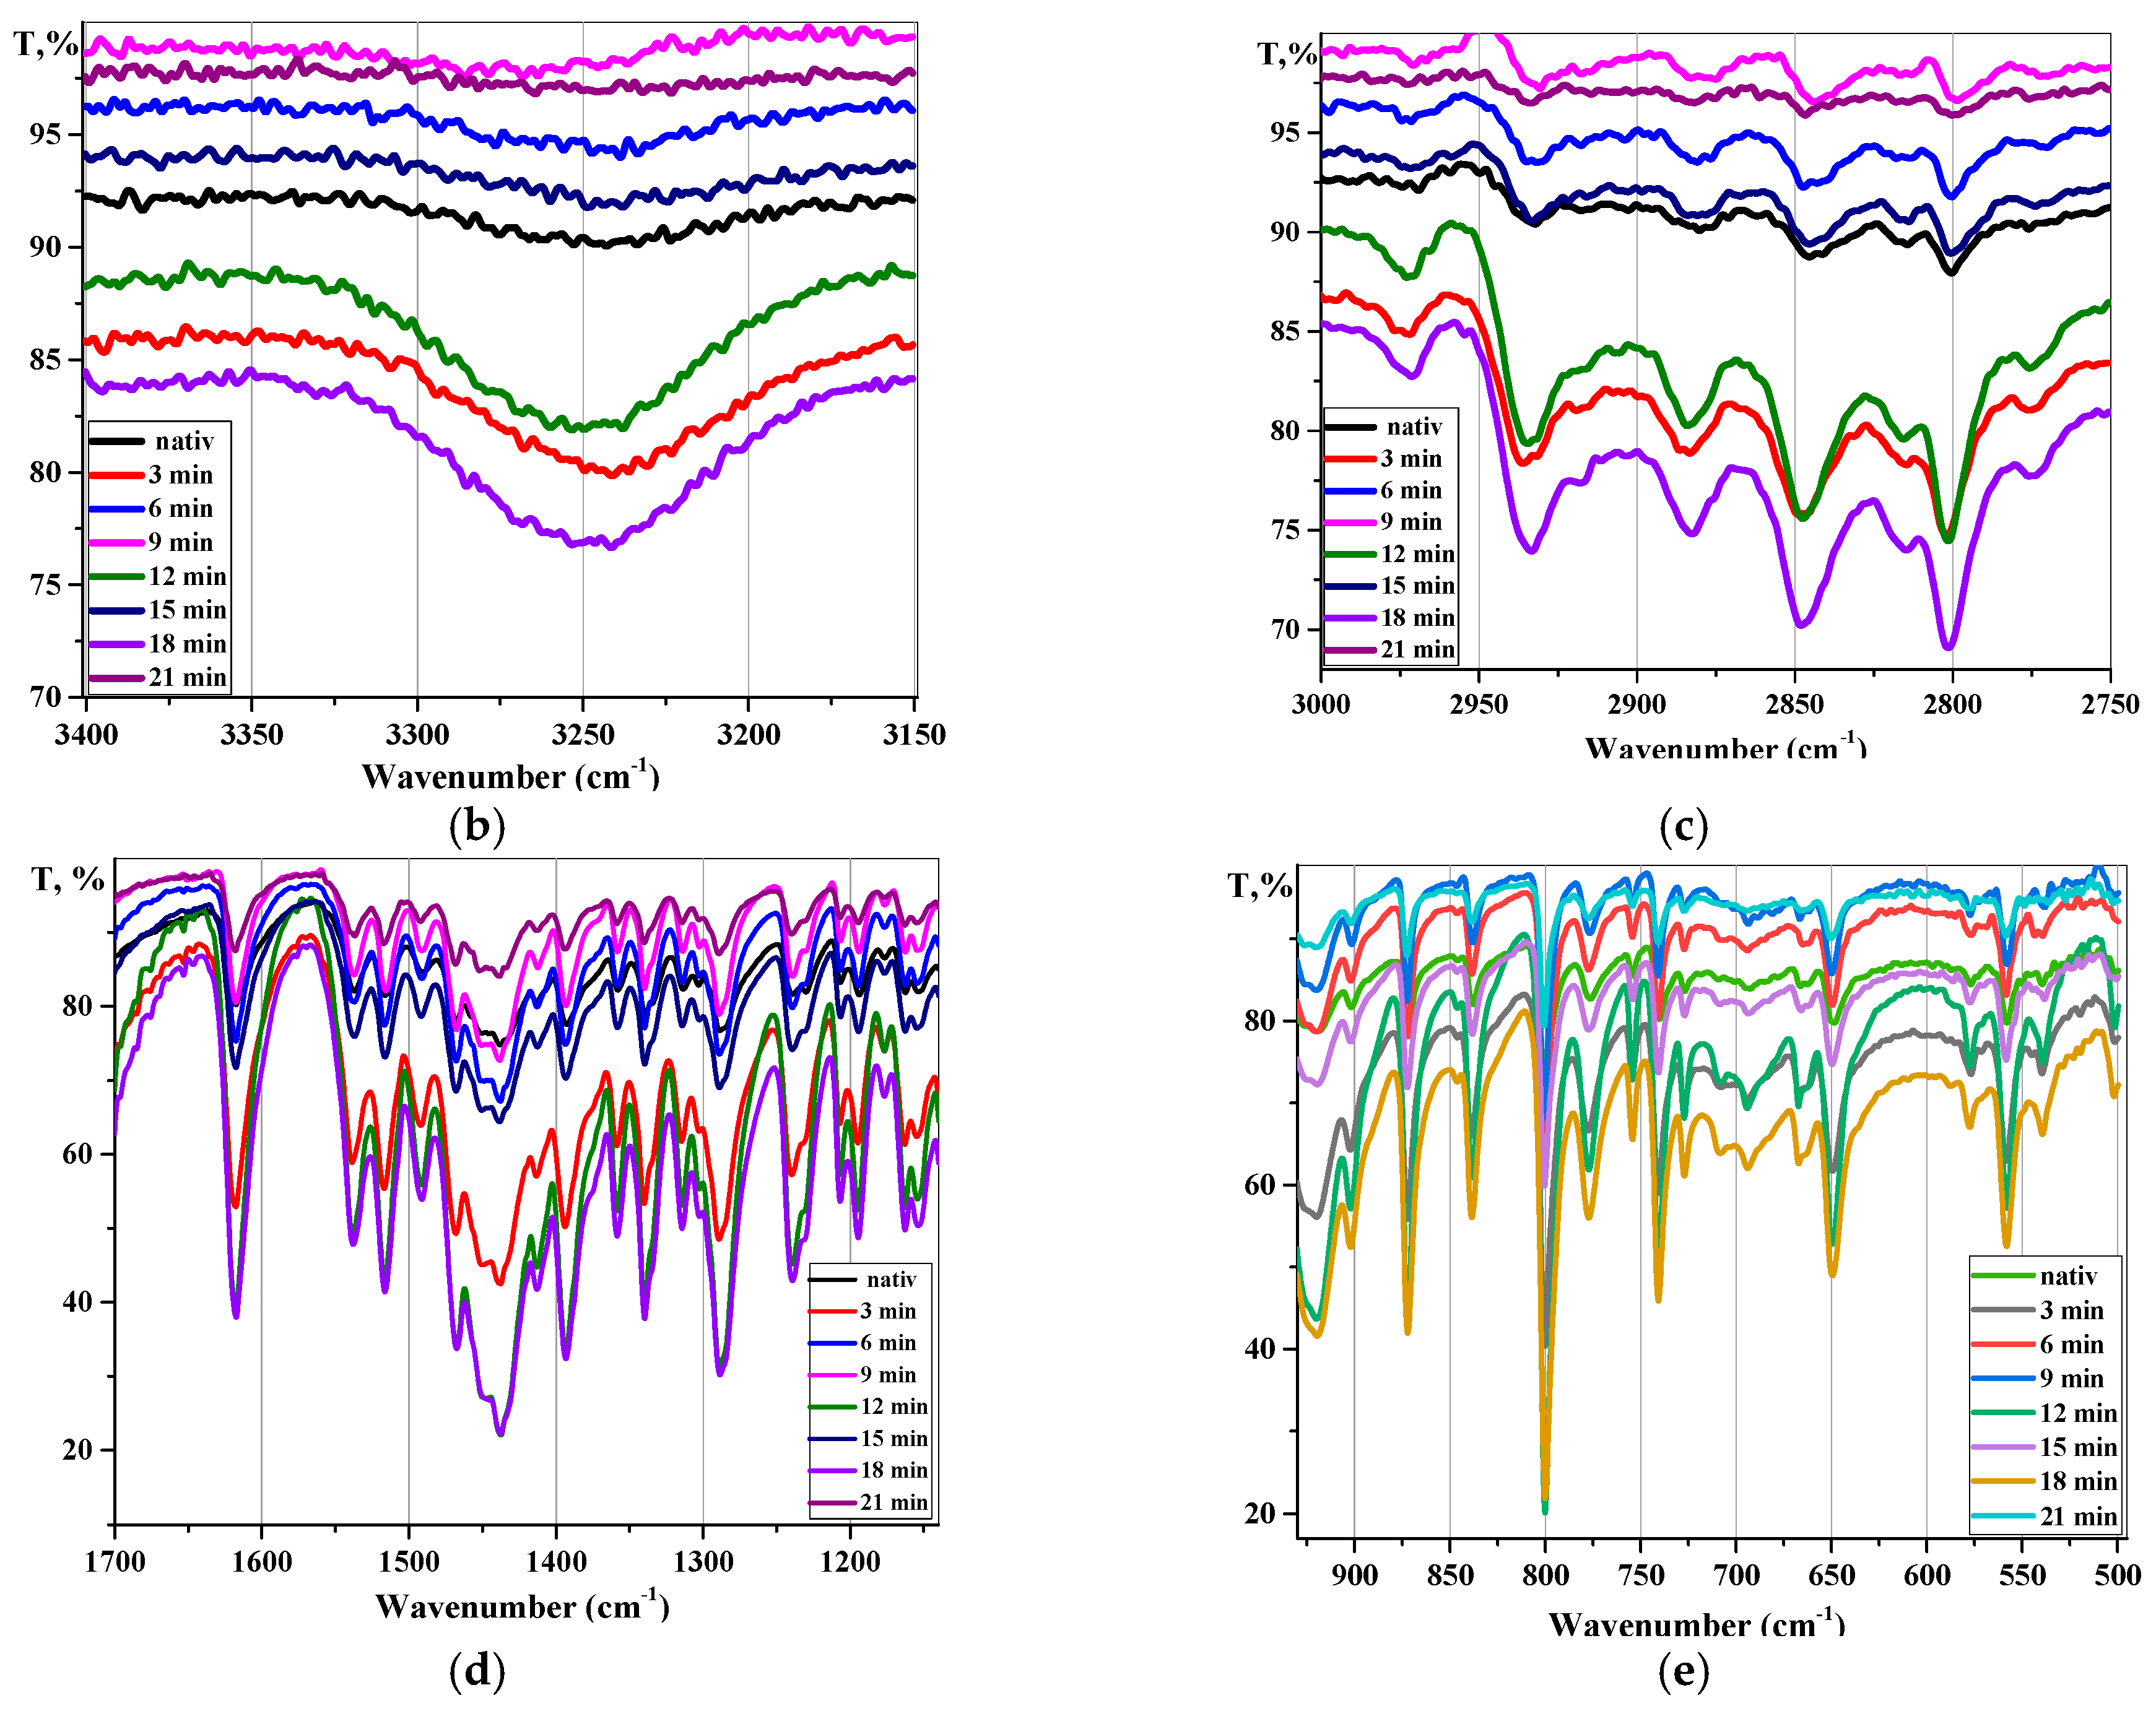
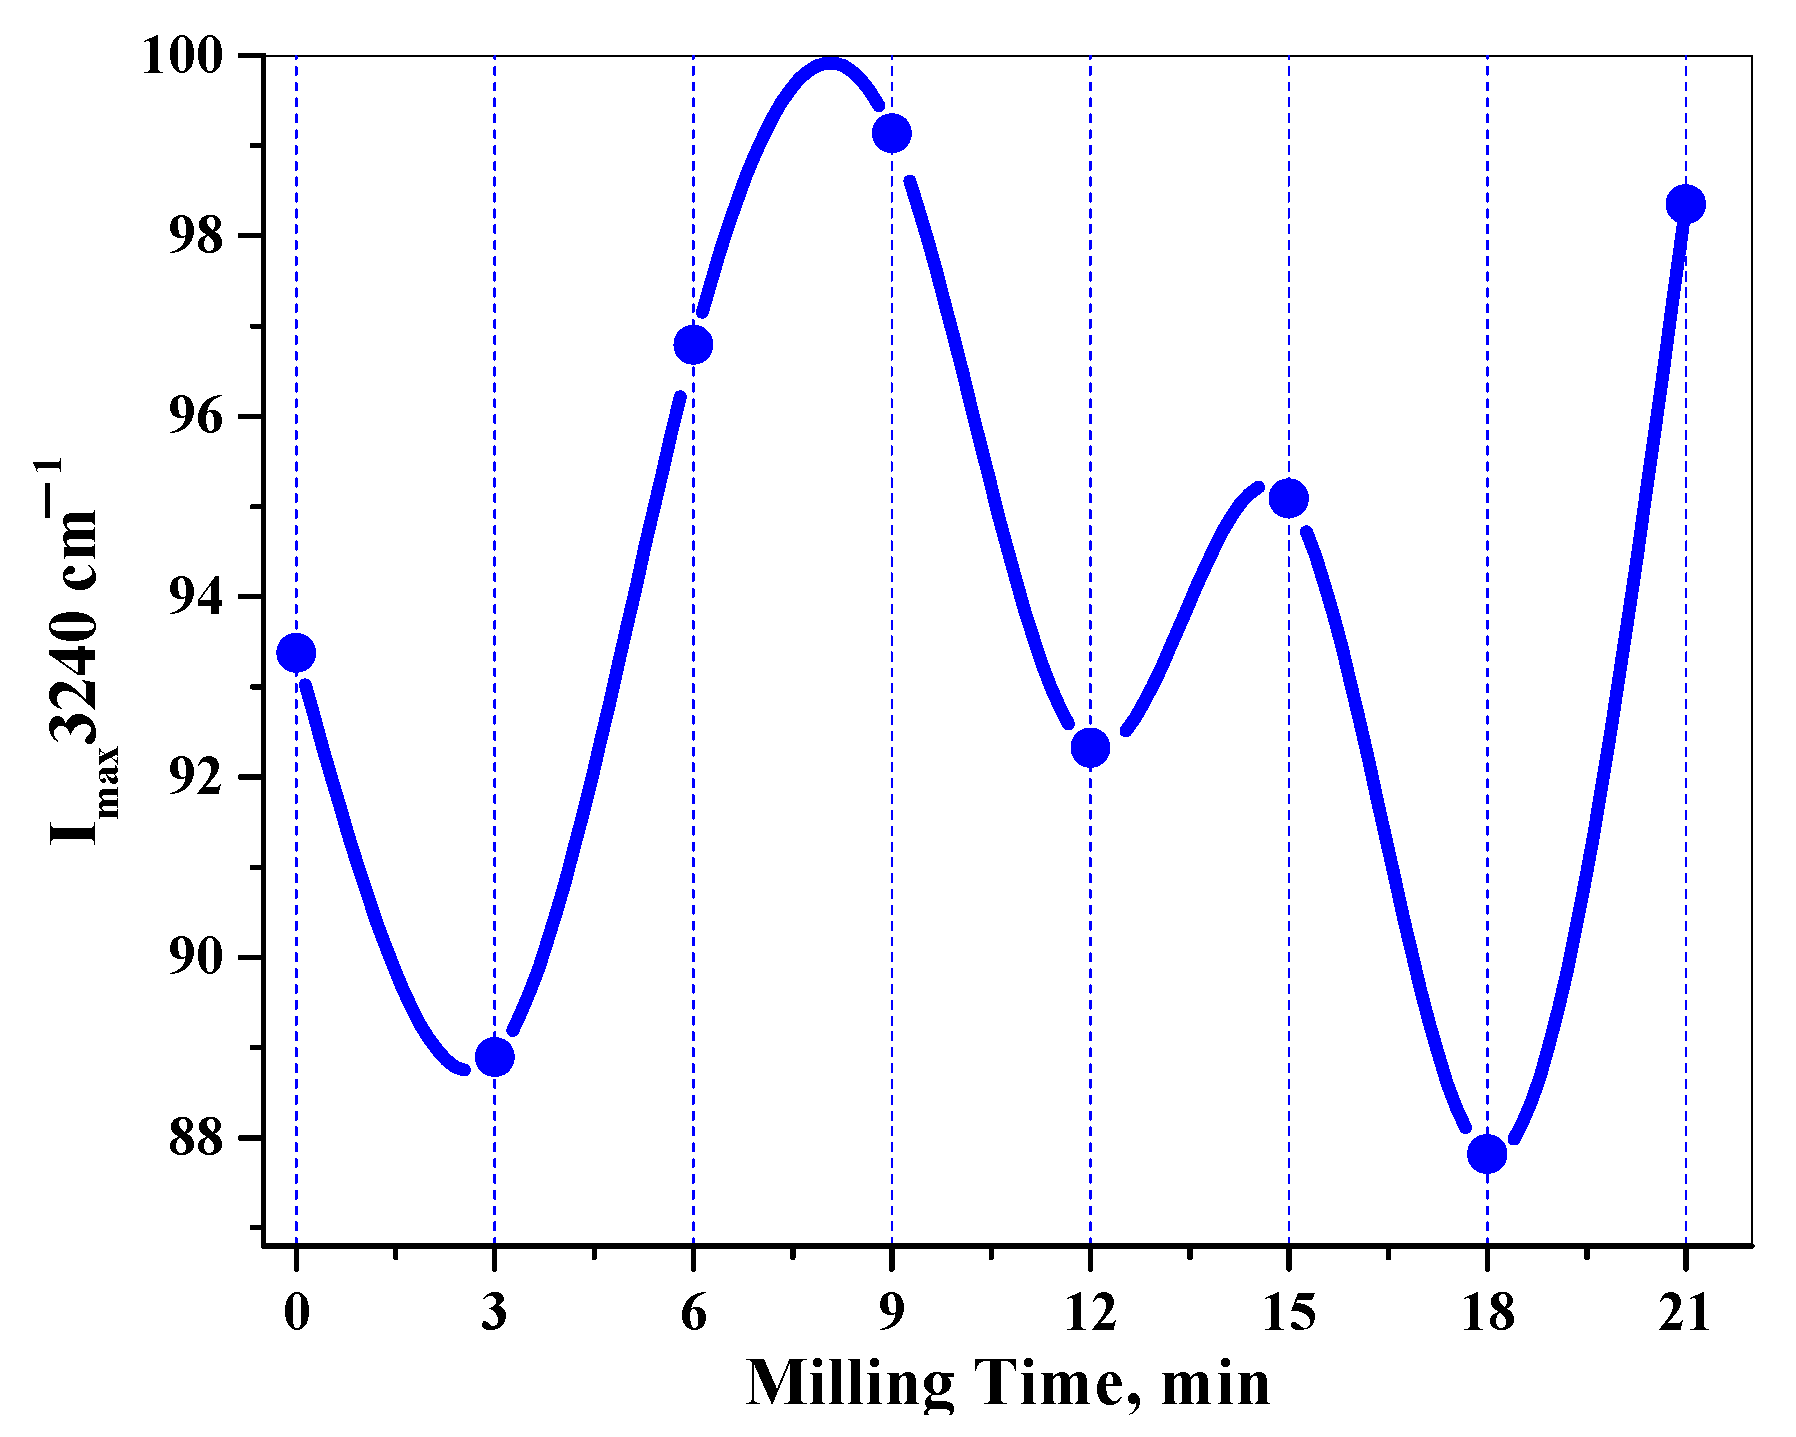
3.2. Fourier-Transform Infrared Spectroscopy Analysis

In this research, the capability of attenuated total reflectance Fourier-transform infrared spectroscopy (ATR-FTIR) combined with pattern recognition methods based on a mathematical model of the convolution of a two-dimensional scattering pattern into a descriptor (2D-LS) was evaluated to identify the unloading of Lvf·Hh substance samples with different MI times in the range from 0 to 21 min.
Figure 13 shows the vibrational spectra of Lvf·Hh samples before and after the performed MI in the complete and fragmented regions from 4000 to 500 cm−1 wavenumbers, reflecting the features of the ongoing changes in the levofloxacin structure from the perspective of quantum-mechanical concepts. The FT-IR spectra of the original sample Lvf·Hh (black curve) show quantum transitions corresponding to the excitation of the vibrational motion of the molecule in the anharmonic oscillator model [32].
The characteristics of the original Lvf·Hh sample are the high-frequency valence vibrations of O-H (in H2O and R-COOH); oscillations of N-R and C-H (in aromatic and aliphatic carbon groups); the group oscillations of C=O, C=C, C-N in the midrange from 1800 дo 1300 cm−1, as well as an intense narrow band of scissor bending O-H oscillations in H2O. In the fingerprint region, the frequencies at which the bands appear are characteristic of C-F, C-O-C (the ester group) and C-N (the piperazine cycle) (Table 2).
Covalent bonds deformed via high-intensity MI exhibit hyper- or hypochromic effects (increase/decrease in absorption intensity), a bathochromic shift of the maximum, and the degeneration of the vibrations, which is expressed as a complete band loss at a given frequency [33]. The start of the MI impact extends to the tensile bonds in the linear elastic region (see Figure 10), which is accompanied by an increase in absorption and band intensity across the frequency range. The dynamic observation of the O-H oscillation band at 3240 cm−1 for Lvf·Hh before and after the MI produced shows spiking, periodic fluctuations in the maximum intensity (Figure 14), similar to the results of dispersive analysis via SLS and DLS (see Figure 8b and Figure 11b).
When MI is heavily stressed, transitions between the vibrational levels of the ground electronic state of the molecule are disrupted and excessively deformed, creating highly reactive bonds.

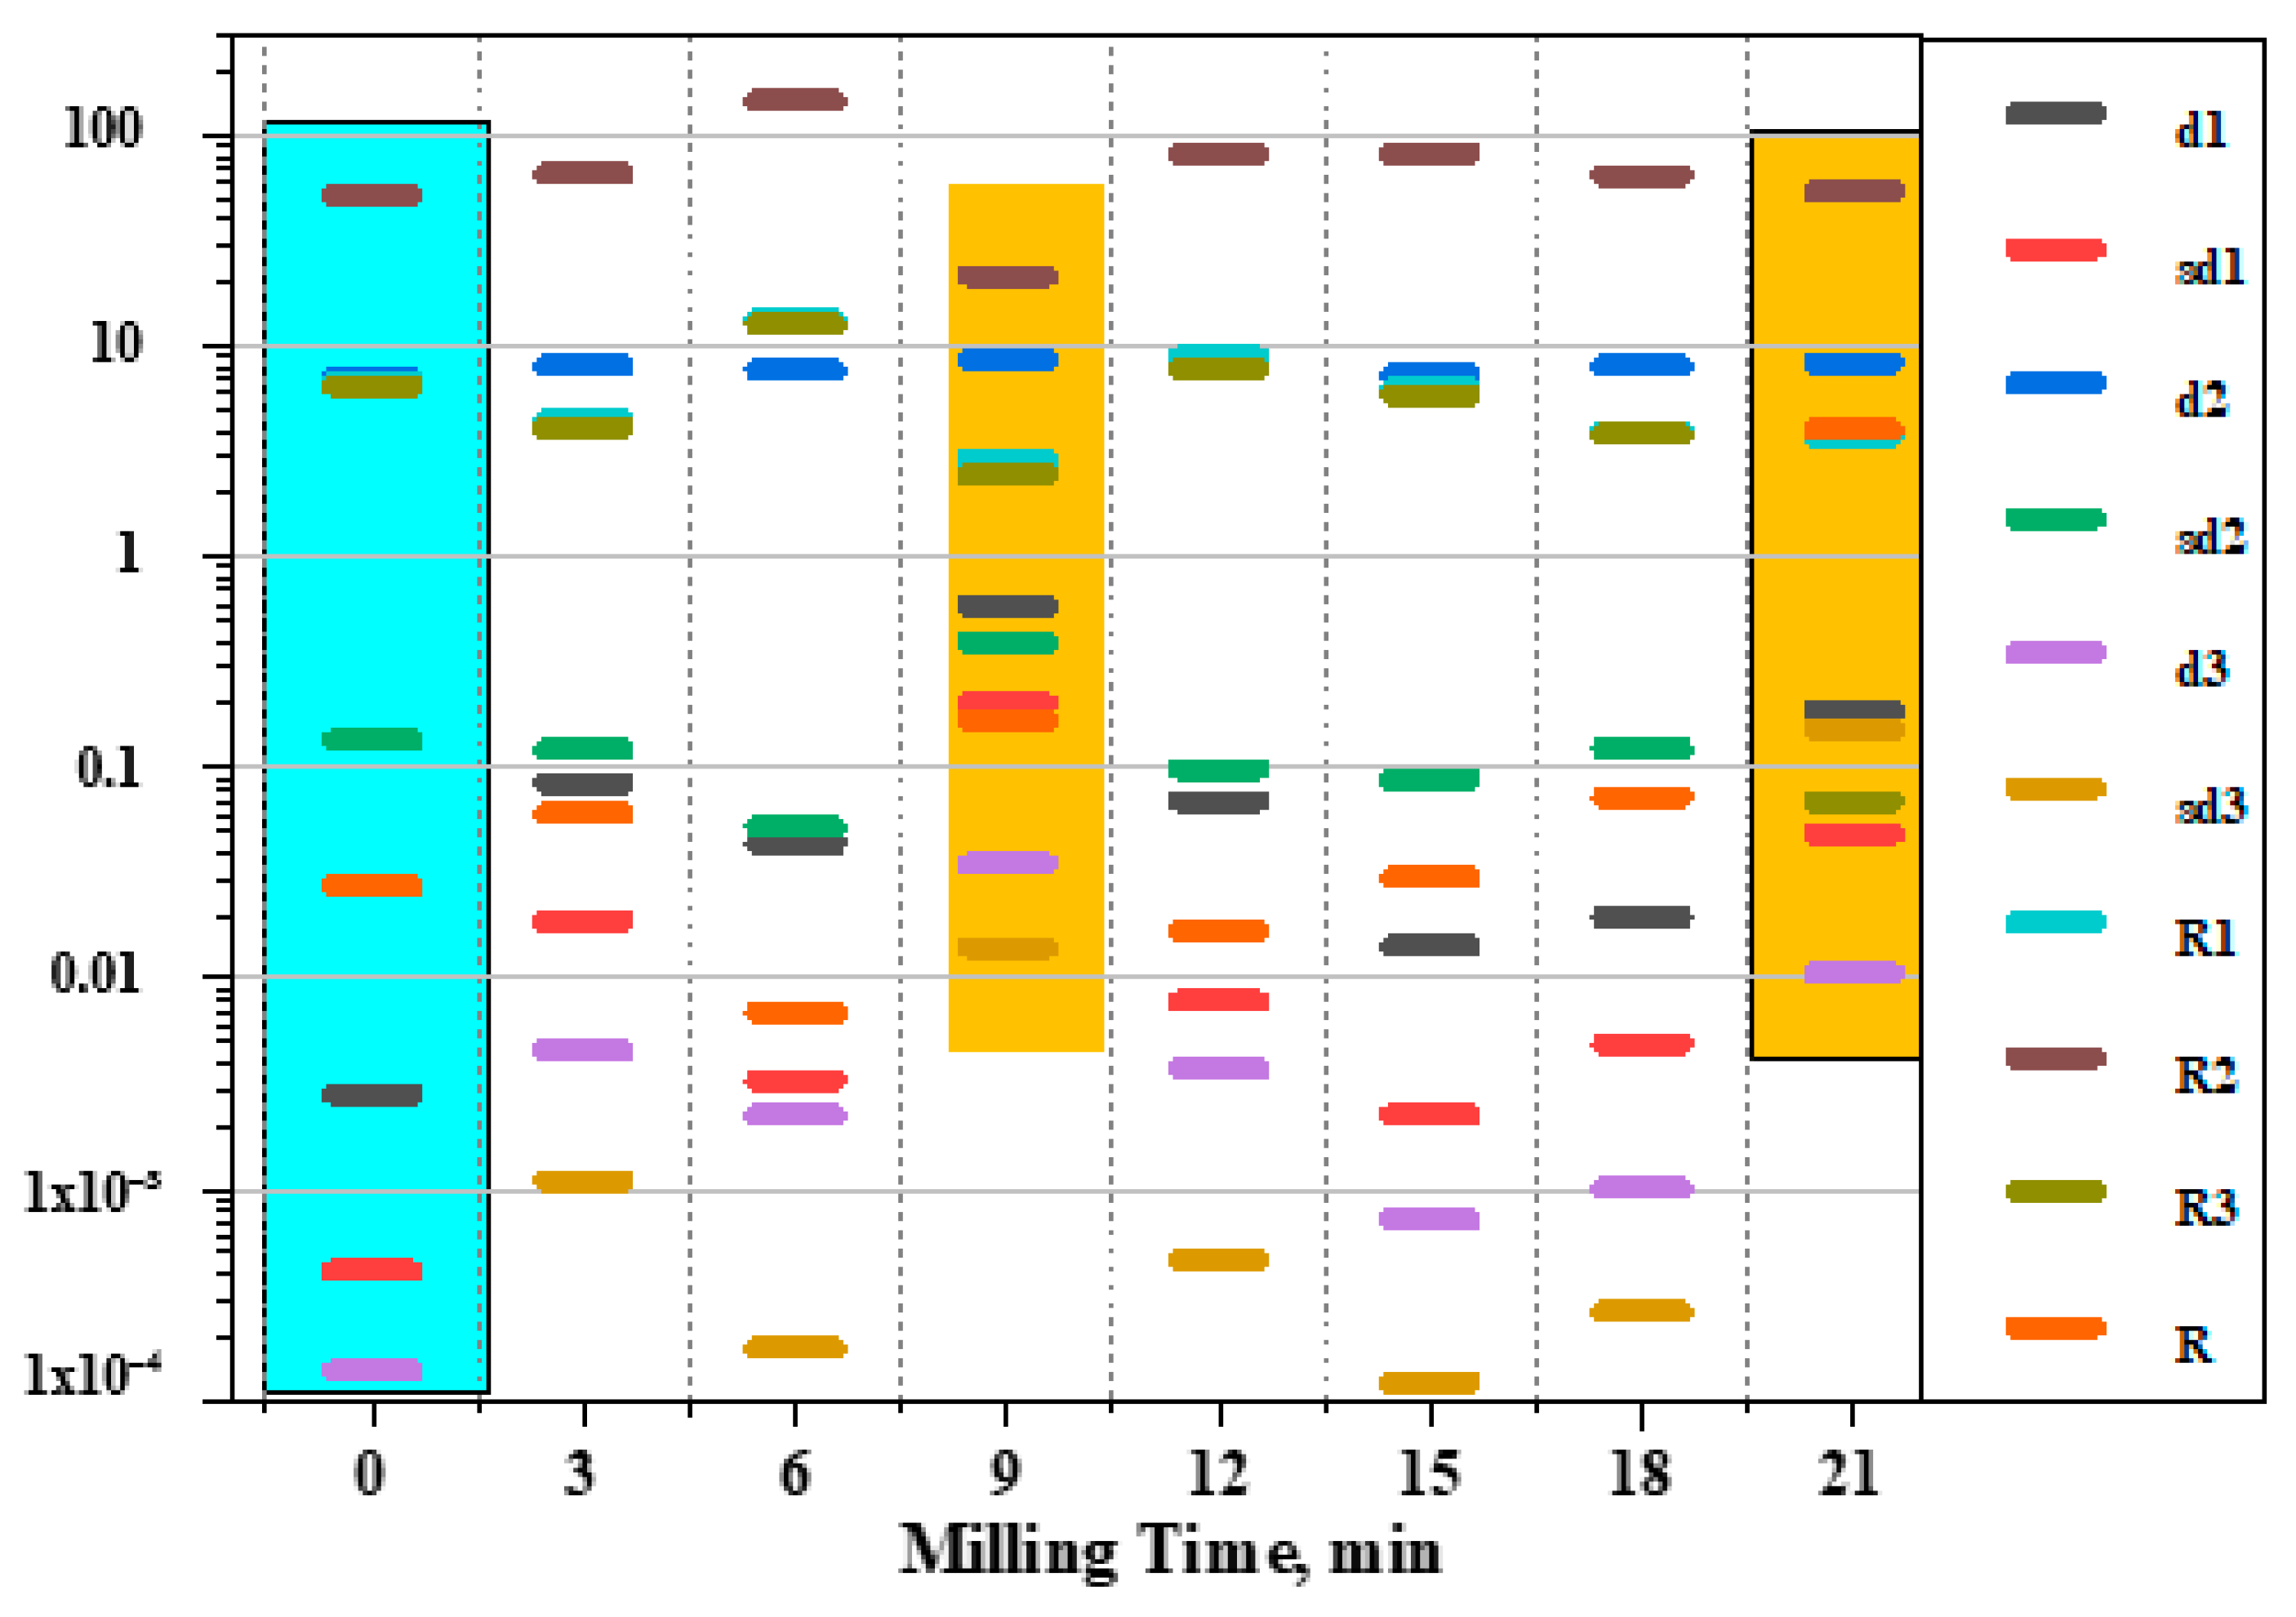
3.3. 2D Light Scattering Method

The macro- and microstructure of a powdered substance depends on both the physico-chemical nature of the SB and the way it is exposed—the sample preparation. The speckle structure visualized as a result of the mutual interference of coherent waves of dynamic backscattering is characterized by a set of analytical signal intensities depending on the microrelief of the surface and near-surface layers, the object shape and the distribution of scatterers inside the material [34]. The 2D-LS measurements were carried out for 60 s in 1 s increments with a number of N = 20 repetitions. The results of the measurements revealed differences in the nature of the samples under investigation. The results of the correlation method in the form of 2D multisample diagrams (similar to the “fingerprint” in molecular biology) clearly illustrate the topology of 2D-LS for the unloading of Lvf·Hh substance samples with different MI times, as presented in Figure 15.
The multi-descriptor set is unique for each sample. The blue highlighted area of the diagram represents the “fingerprint” of the native substance of Lvf·Hh (MI at t = 0 min), demonstrating an efficient separation of the chemometric descriptors and acting as a “chemometric reference sample” (ChRS). When comparing experimental samples with ChRS, a diagnostic rule is used: a sample is considered authentic if two conditions are fulfilled: at least 6 descriptors out of 10 differ from ChRS; the difference is no more than 15%.
The analysis of the “fingerprint” diagram did not reveal any samples identical to the original substance, the biggest difference being for the unloading of the Lvf·Hh substance sample with MI at t = 9 min and 21 min. During the fine grinding of the substance, reaching the limit of dispersion, tribochemical transformations occur, which result in the formation of intermediate non-equilibrium states, the deformation of SB, and changes in light scattering properties, which all plateau at an upper limit of MI.
The results are in good agreement with IR-Fourier spectroscopy—IR curves corresponding to light transmission for samples at MI t = 9 min and 21 min have a maximum upper position approaching T = 100% throughout the high-frequency wavenumber region.

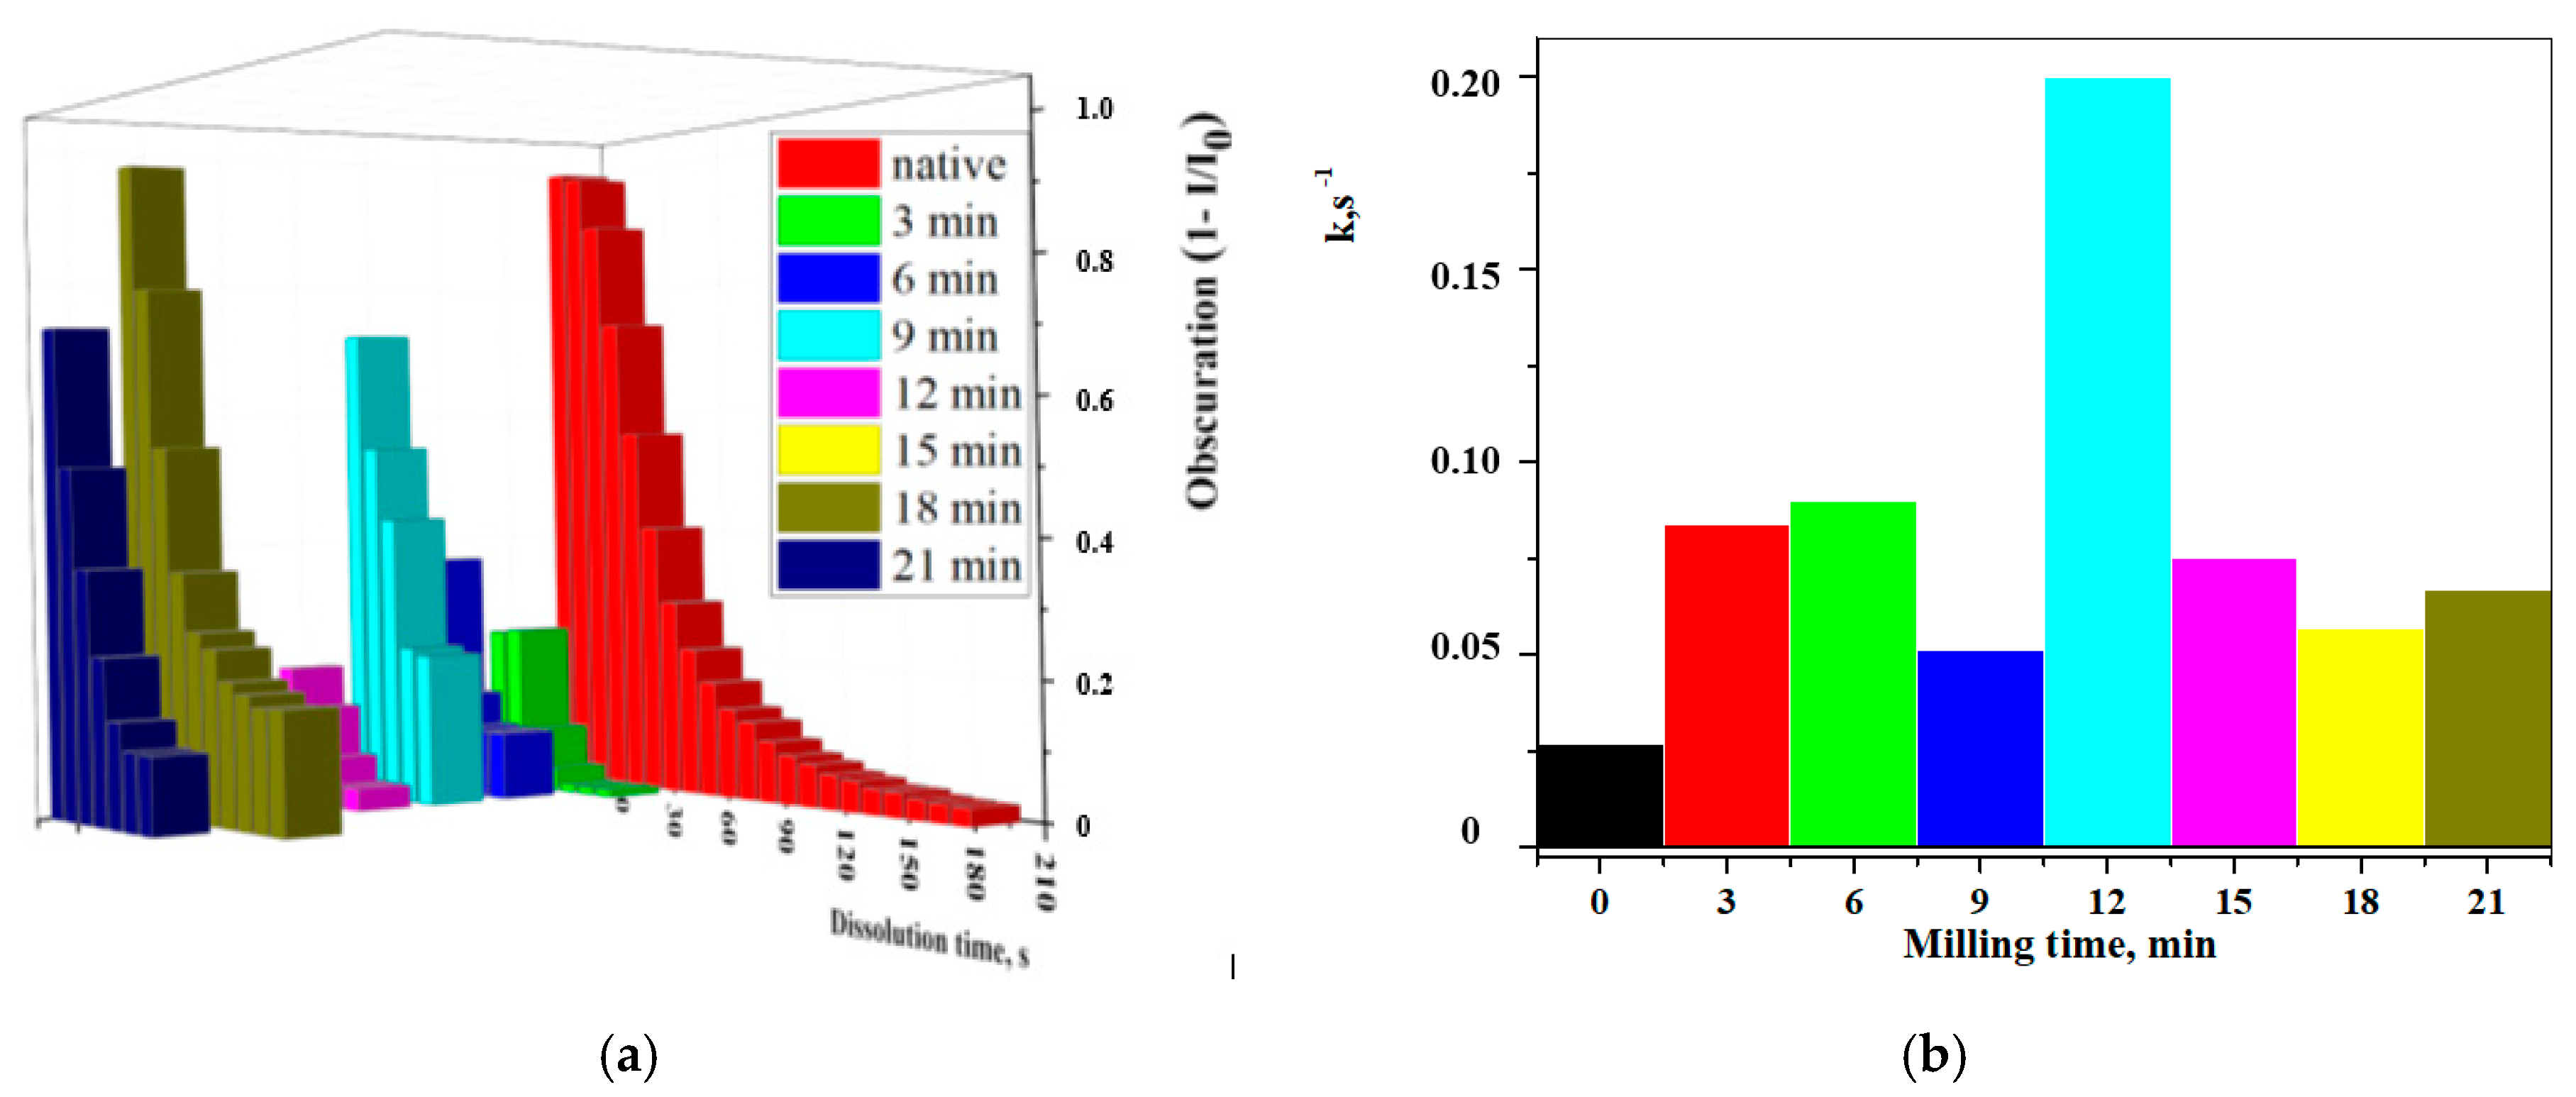
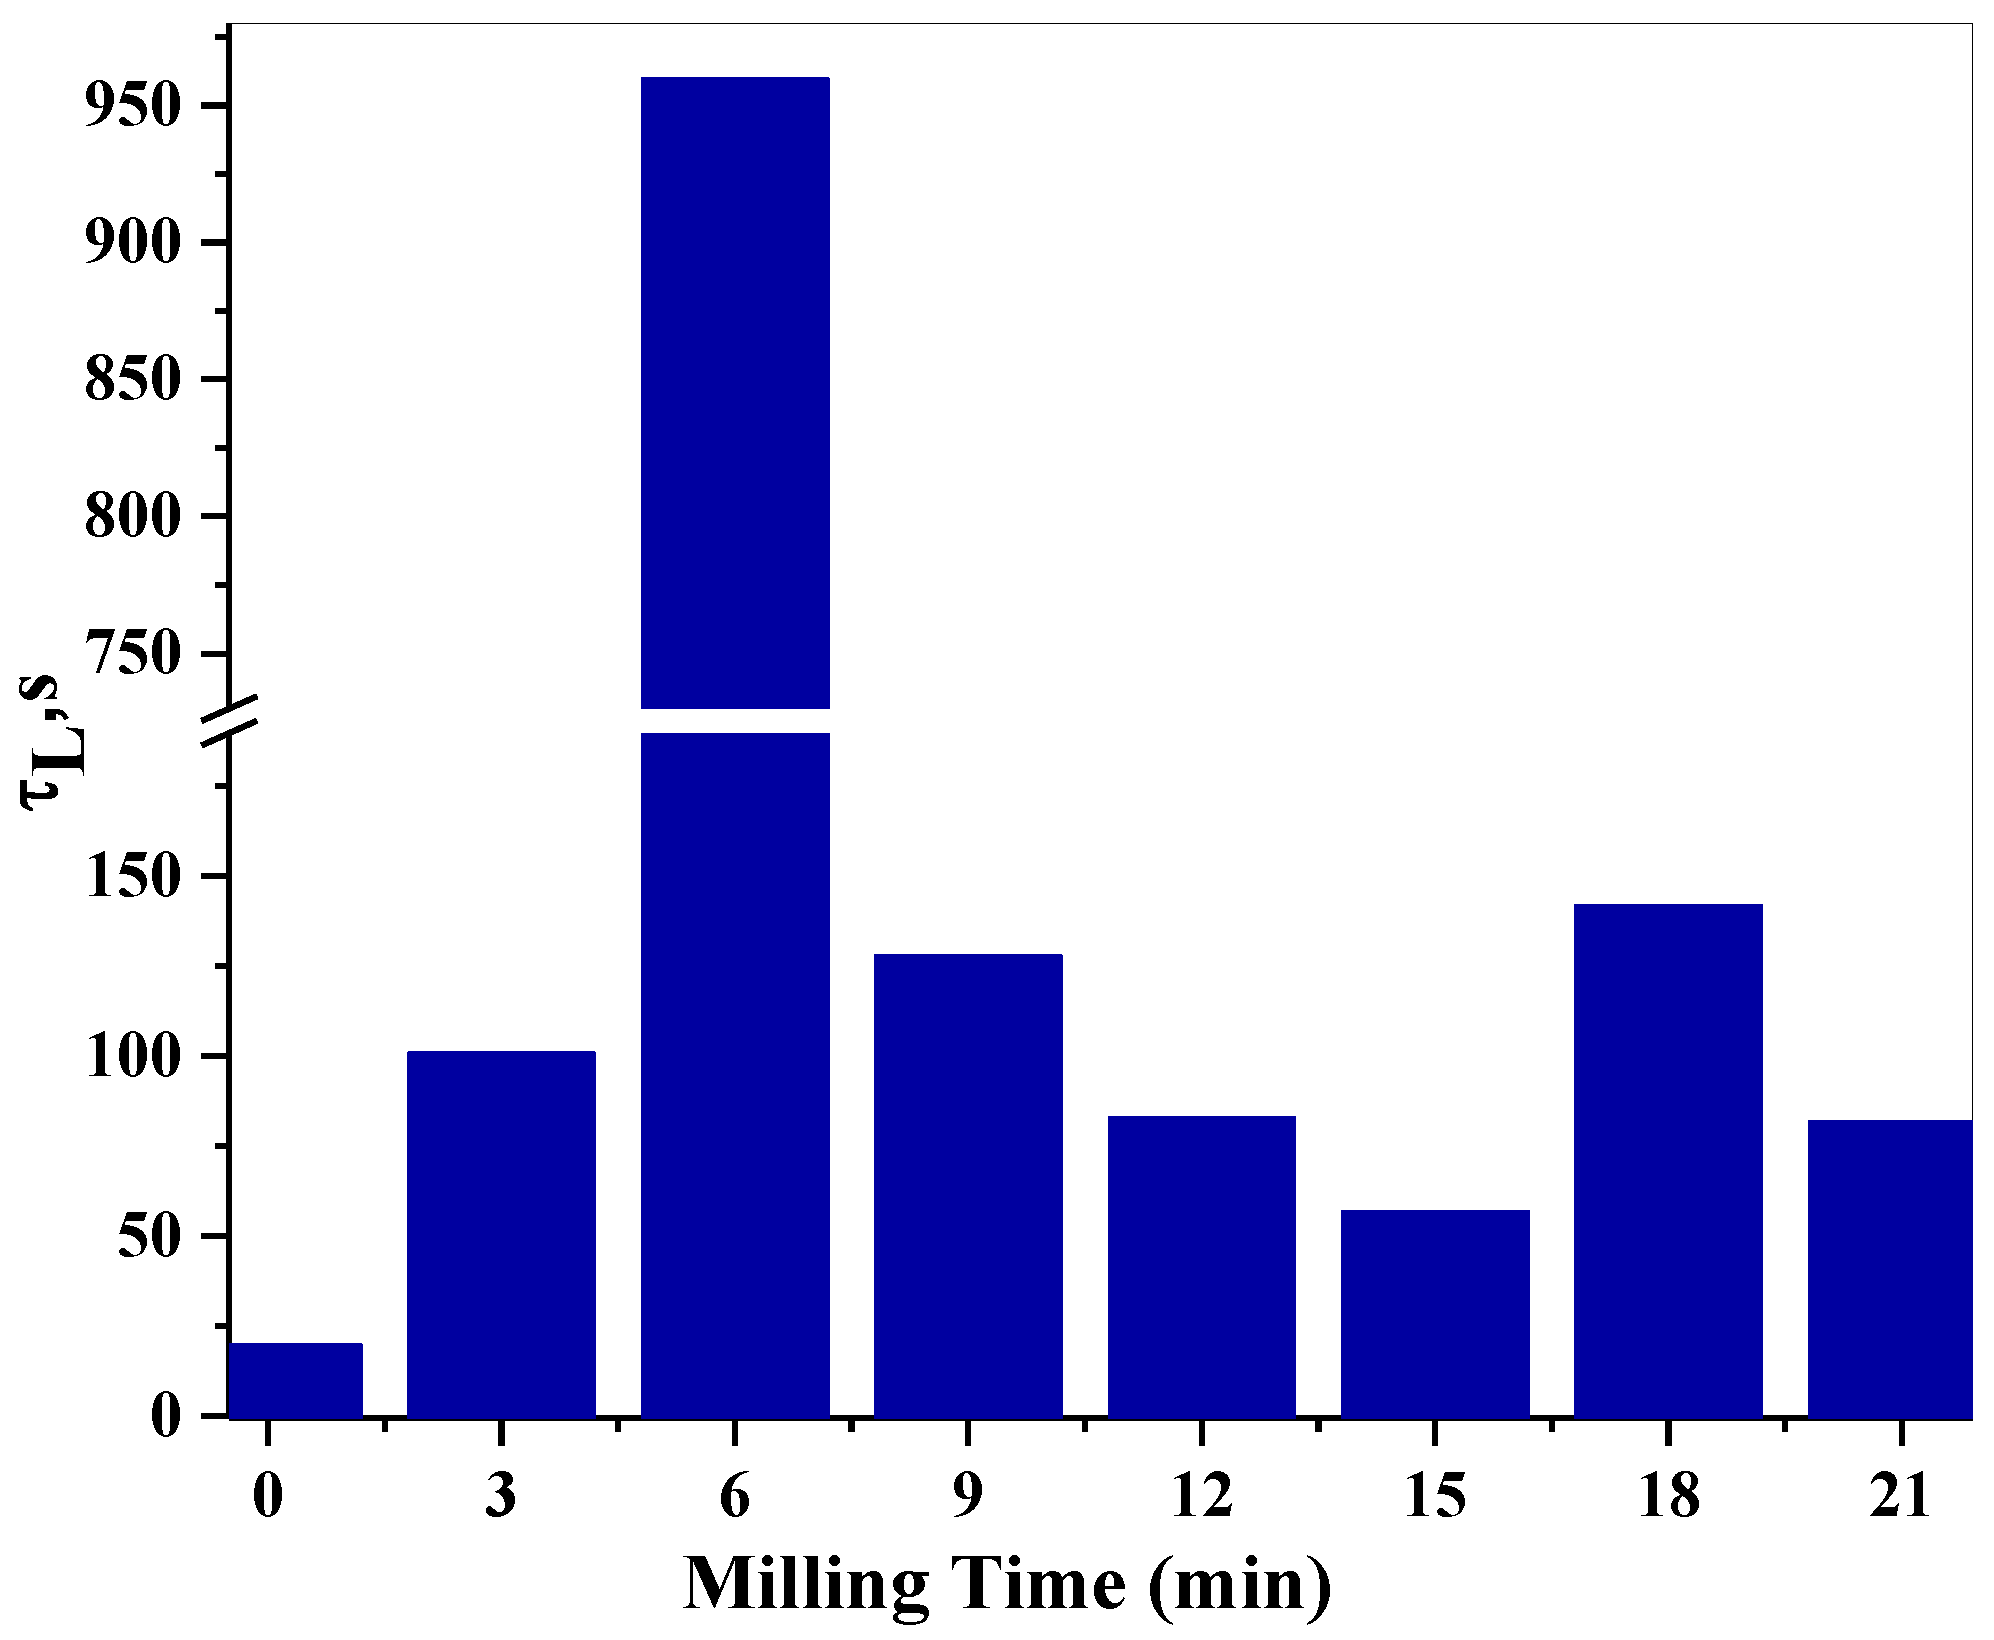
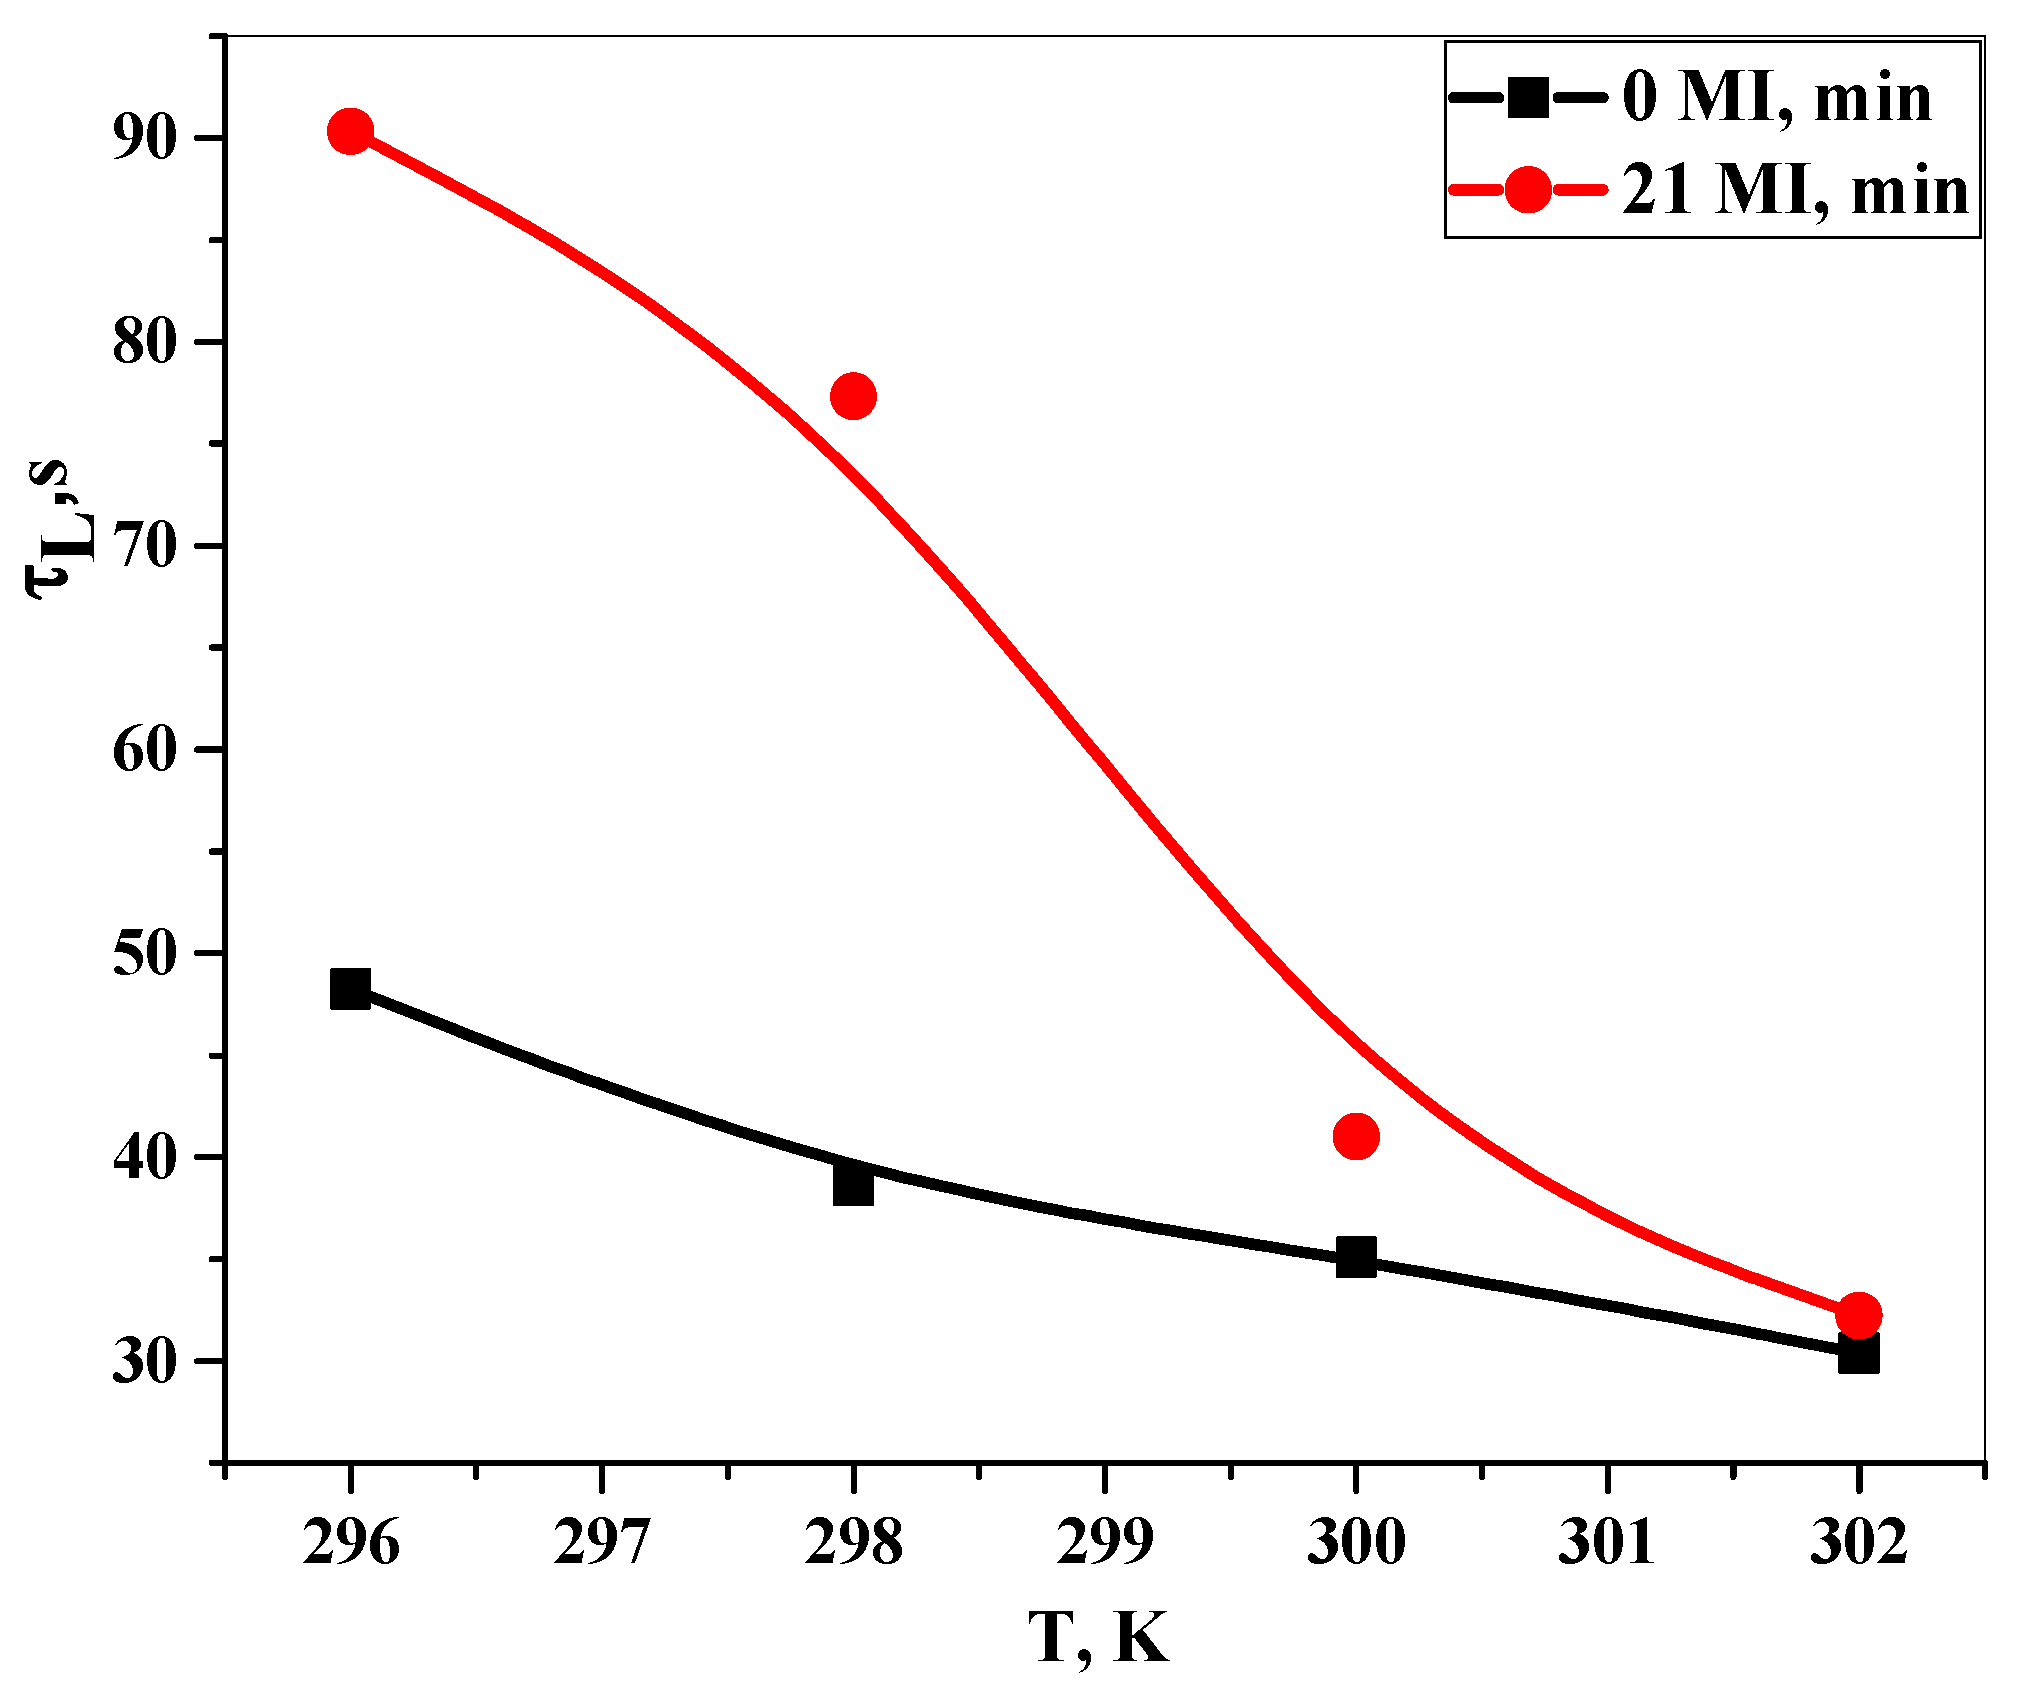
3.4. Study of Dissolution Kinetics in Water by the LALLS Method

According to Fick’s law and the Nernst–Schukarev dissolution equation, the heterogeneous SB dissolution process is limited by diffusion, adsorption, and desorption:
dC/dt = kS (Csaturated − Ct),
k = DS/δV
Here, dC/dt is the dissolution rate; k—rate constant; S —surface SB; D—diffusion coefficient; Csaturated и Ct—concentration of saturated solution and solution at the time of dissolution t; δ—diffusion layer thickness; V—solution volume.
As the values of D, S, δ, and V are constant, the dissolution rate k is a constant too. However, the constant, S, can be violated by changes in solubility, dissolution rate, temperature (effect on the diffusion coefficient), and by changes in dispersibility affecting the SB surface area. The diffusion layer thickness δ remains constant if the stirring rate of the solution remains unchanged. To describe the differentiation of samples’ properties and estimate the “response effect” on the MI produced (in the range from 0 to 21 min) with respect to Lvf·Hh samples, the studies were carried out using an original approach based on the determination of the SB dissolution rate via low-angle laser light scattering (LALLS) using the time-varying particle laser light scattering indicatrix in heterogeneous solutions (Figure 16).
Figure 16a shows an exponential decrease over time in laser obscuration, a dependent variable (LO = 1 − I/I0 100%). However, the dissolution rate of Lvf·Hh substances treated with MI in the range from 3 to 21 min are several times faster than those of native Lvf·Hh substances (red curve). The observed phenomena can be explained by using Equations (2) and (3) of Nernst–Schukarev: a long-term intensive mechanical action on a substance powder leads to a variation in the SB surface area (S) and the heating of the powder occurs with a definite time of temperature relaxation, hence leading to a change in D and, consequently, to changes in the dissolution rate constants of substance loading.
The dissolution rate (k∙102, s−1) was estimated from the b coefficient of the straight line equation y = a + bx. Figure 16b shows significant differences in the values of the dissolution rate constants of the substance substrate from the native substance (Table 3).
To determine the limiting stage and the dissolution area—diffusion or kinetic—the activation energy of the dissolution process is calculated for each stage of unloading a sample of the substance from the milling vessel, accompanied by a change in temperature (see Figure 10).
k = A 0   exp E a R T ,
Here, A0 is the pre-exponential factor; Ea is the activation energy; R is the universal gas constant; T is the temperature (K).
Turning to decimal logarithms, we obtain the equation for different temperatures:
logk i = E a 2303   R T 1 T i + l g A 0 ,
Here, ki is the rate constant of the dissolution process at the temperature Ti.
Subtracting the two equations at different temperatures, we obtain:
E a = 2303   R T 1 T 2 T 2 T 1 · l g k 2 k 1 ,
The calculated values of Ea as well as the increase in the dissolution rate at MI t > 3 min indicate, presumably, a diffusion reaction region: under conditions of an increasing reaction rate between a solvent and dissolving substance (see Figure 16a, Table 3), the solvent diffusion rate to the SB surface is the limiting stage [35].

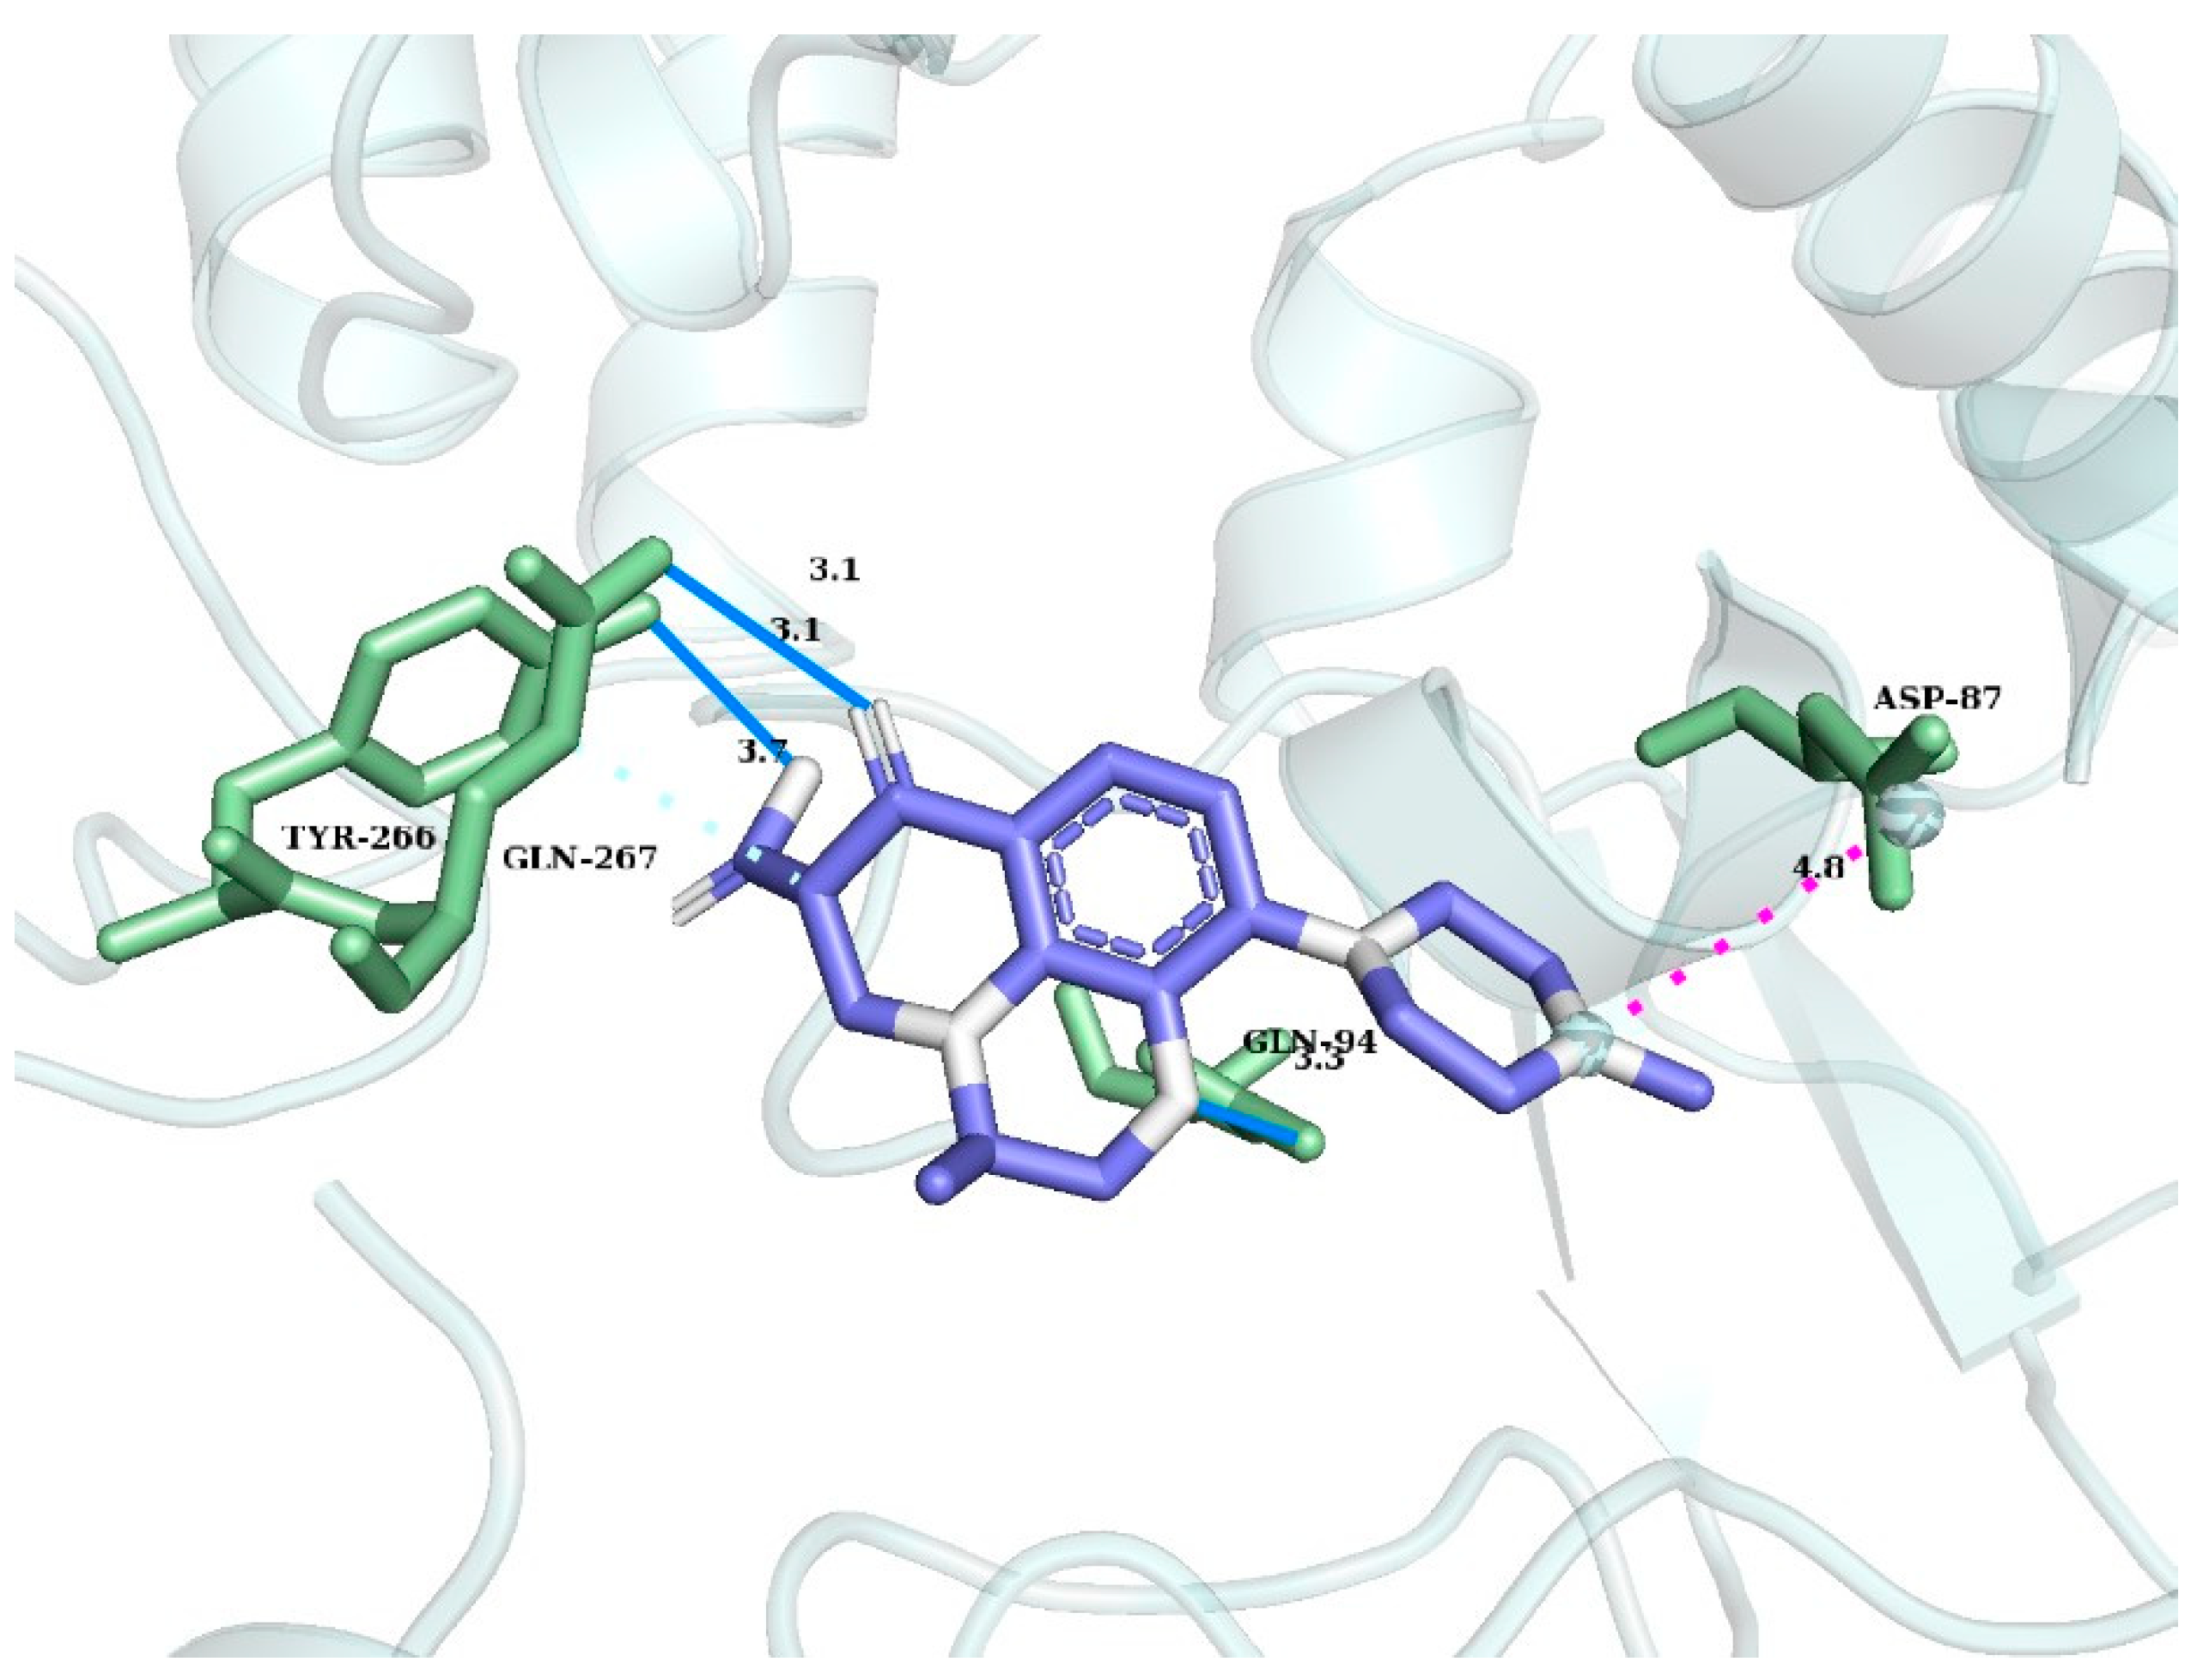
3.5. Biological Activity Studies Using the Spirotox as Well as Molecular Computer Docking Methods

Figure 17 shows the survival rate of the cell biosensor—ciliated protozoan Sp. ambiguum in aqueous solutions of Lvf·Hh substances treated with different MI times in the range from 0 to 21 min.
The lowest lifetime corresponds to the native substance solution—cell death is detected in the first 20 s of incubation and is accompanied by motor convulsions. The jump-like appearance of the τ,L-milling time dependence with periodic maxima and minima of the cell survival time is noteworthy. The longest lifetime corresponds to the sample with t = 6 min MI, which corresponds to the “stress–strain curve” deviating from the straight line, i.e., the transition from the elastic to plastic deformation of the substance (see Figure 10). However, the survival rate of batch samples subjected to high-intensity mechanical action is several times higher than that of the native substance solution. This fact may indicate a decrease in the toxicity of mechanoactivated substance powders, which is consistent with the literature data on the loss of the pharmaceutical activity and toxicity of drug molecules due to the loss of important functional groups, such as decarboxylation [36].
The application of the molecular modeling of protein and ligand surface coupling on the model of DNA-Gyrase II resulted in a positive solution, namely, the detection of an Lvf compound in the empirically confirmed binding site of levoloxacin, a fluoroquinolone group with an antibacterial effect, with the active site of DNA-Gyrase II.
The performed structural calculations for the determination of the “pose”, i.e., the subsequent “docking” of a drug molecule with the surface of topoisomerase, allowed for the detection of those amino acid residues in the active site of the enzyme, which form intermolecular bonds with levofloxacin. Thus, interaction between an aspartic acid residue in position 87 and a fragment of levofloxacin methyl piperazine was detected (Figure 18).
A mutation in the asparginic acid site has a significant effect on the affinity of fluoroquinolones to DNA-gyrase II [37]. In the future, this fact will make it possible to predict the binding sites of target proteins to the molecules of drug compounds that have undergone certain reactions in solutions or solid-phase transformations.
The dependence of cell biosensor lifetime on temperature is presented in Figure 19 for samples of “extreme” points—solutions prepared from native and mechanoactivated powders at t = 21 min. From the kinetic point of view, the low-molecular-weight ligand actually catalyzes cell death, accelerating it up to the laboratory-determined time [38].
The existence of an intermediate state in the ligand–receptor interaction means that cell death must take place when this stage is activated and energy is expended (see Figure 7). From this, it can be assumed that the value of Ea, estimated using the height of the barrier at the transition to the product—dead cell stage—represents a quantitative criterion for the toxicity of the ligand. Linearization in Arrhenius coordinates ln(1/tL) = f (1/T) (see Equation (4)) made it possible to calculate the values Ea (Table 4).
The Arrhenius kinetic study results regarding cell death in a toxicant medium using the Spirotox method under McAct conditions show a 2.5-fold decrease in the toxicity of the sample solution with t = 21 MI compared to the native substance (not subjected to MI). The reason for the decrease in the MI toxicity of the Lvf·Hh sample solution at 21 min may lie in structure modification and hence the properties of this sample consisting in the disappearance of the transmission band at 3250 cm−1 in the FTIR spectra of the test sample (see Figure 13). This may indicate the absence of -OH-group absorption in the mechanoactivated powder molecules due to decarboxylation.

4. Discussion

The studies and observations of changes in the physico-chemical and biological properties of the powdered drug substance of the fluoroquinolone group as a result of MI and non-thermal processes have demonstrated intriguing “response effects”. Changes in the solid that underwent high-intensity MI were accompanied by a sequential transformation of linear deformation (elastic energy) into a plastic one and local energy accumulation in submicroscopic areas with the formation of a “triboplasm” followed by its dissipation into the SB volume. Everything stated above is accompanied by dislocation dynamics anomalies within the deformational aging SB. The anomalies observed in the dynamic change in the properties of the analyzed disperse systems, such as particle size; bulk concentration in the micron, submicron, and nano range; the polydispersity and electrokinetic stability index; specific surface area; variability in the vibration spectrum and two-dimensional scattering from the SB surface as well as the cell biosensor survival take on a stable jump-change with damping. The phenomena of discontinuous changes in the dynamic properties of the system under study—mechanoactivated levofloxacin powder—are argued for using the adopted model of the dynamic impurity subsystem (DIS) with anomalous behavior of the SB plastic zone [39]. It turns out that the energy pattern of the simplest one-dimensional impurity migration pattern near the dislocation core with periodic transitions between the nuclear states and the crystal volume, with the resulting energy minimum as the most energy-efficient location of the impurity relative to the dislocation, is similar to our observed results in the evolution of SB properties using the example of the levofloxacin powder substance.
The results obtained are interesting not only from the point of view of studying the non-thermal transformation MA mechanism, but also from the point of view of practical application. A drug substance, having undergone high-intensity MI and changed its properties up to refinement, can open new horizons in its application, and in particular, in the repositioning of its pharmacokinetic and pharmacodynamic properties [40].

Author Contributions

Conceptualization, E.U., A.S. (Anton Syroeshkin) and T.P.; methodology, E.U.; investigation, E.U., A.S. (Anastasia Simutina), E.K. (Ekaterina Kuzmina) and V.S.; validation, E.U.; data curation, T.G., E.K. (Ekaterina Kolyabina), A.K. and G.P.; formal analysis, E.U.; writing—original draft preparation, E.U.; writing—review and editing, A.S. (Anton Syroeshkin), E.K. (Ekaterina Kuzmina), V.S., A.S. (Anastasia Simutina) and T.P. All the authors discussed the results and commented on the manuscript. All authors have read and agreed to the published version of the manuscript.

Funding

This paper was supported by the RUDN University Strategic Academic Leadership program.

Institutional Review Board Statement

Not applicable.

Informed Consent Statement

Not applicable.

Conflicts of Interest

The authors declare no conflict of interest.

Abbreviations

MChmechanochemistry
MActmechanoactivation
IUPACinternational union of pure and applied chemistry
SMComplexsupramolecular complex
DLSdynamic light scattering
SBsolid body
obsEaobserved activation energy
TrbChtribochemical
Lvf·Hhlevofloxacin hemihydrate
FQsfluoroquinolones
SLSstatic light scattering
VCvolumetric concentration
HShydrodynamic size
ZP zeta potential
PdIpolydispersity index
NPs nanoparticles
QSARquantitative structure activity relationship
FTIRFourier-transform IR spectroscopy
MImechanic impact
DPhdispersion phenomenon
LALLSlow-angle laser light scattering
OMoptical microscopy
IRinfra-red
DSAdynamic strain aging
2D-LStwo-dimensional dynamic backscattering
ChRSchemometric reference sample
DISdynamic impurity subsystem selectivity index
SLSstatic light scattering
Spirotox testSpirostomum ambiguum acute toxicity test

References

  1. Lyakhov, N.; Grigoreva, T.; Talako, T.; Udalova, T.; Vosmerikov, S.; Devyatkina, E. A Carbon-Free Way for Obtaining Nanoscale Silicon. Powders 2022, 1, 18–32. [Google Scholar] [CrossRef]
  2. Bose, A.; Mal, P. Mechanochemistry of supramolecules. Beilstein J. Org. Chem. 2019, 15, 881–900. [Google Scholar] [CrossRef] [Green Version]
  3. Hernández, J.G. Mechanochemistry. Beilstein J. Org. Chem. 2017, 13, 2372–2373. [Google Scholar] [CrossRef]
  4. Gomollón-Bel, F. Ten Chemical Innovations that will change our world: IUPAC identifies emerging technologies in chemistry with potential to make our planet more sustainable. Chem. Int. 2019, 41, 12–17. [Google Scholar] [CrossRef]
  5. Feng, X.; Dong, C.; Wang, X.; Wang, J. Mechanochemical treatment for degradation of ciprofloxacin (CIP) in solutions. Water Sci. Technol. 2022, 86, 1958–1968. [Google Scholar] [CrossRef] [PubMed]
  6. Friščić, T.; Mottillo, C.; Titi, H.M. Mechanochemistry for Synthesis. Angew. Chem. Int. Ed. 2020, 59, 1018–1029. [Google Scholar] [CrossRef]
  7. Lavalle, P.; Boulmedais, F.; Schaaf, P.; Jierry, L. Soft-mechanochemistry: Mechanochemistry inspired by nature. Langmuir 2016, 32, 7265–7276. [Google Scholar] [CrossRef] [Green Version]
  8. Castro, J. Elastic potentials as yield surfaces for isotropic materials. PLoS ONE 2022, 17, e0275968. [Google Scholar] [CrossRef]
  9. Kiener, D.; Fritz, R.; Alfreider, M.; Leitner, A.; Pippan, R.; Maier-Kiener, V. Rate limiting deformation mechanisms of BCC metals in confined volumes. Acta Mater. 2019, 166, 687–701. [Google Scholar] [CrossRef]
  10. Michalchuk, A.A.; Boldyreva, E.V.; Belenguer, A.M.; Emmerling, F.; Boldyrev, V.V. Tribochemistry, mechanical alloying, mechanochemistry: What is in a name? Front. Chem. 2021, 9, 685789. [Google Scholar] [CrossRef] [PubMed]
  11. Alex, T.C.; Kailath, A.J.; Kumar, R. Al-monohydrate (boehmite) to al-trihydrate (bayerite/gibbsite) transformation during high-energy milling. Metall. Mater. Trans. B 2020, 51, 443–451. [Google Scholar] [CrossRef]
  12. Thammajaruk, P.; Blatz, M.B.; Buranadham, S.; Guazzato, M.; Wang, Y. Shear bond strength of composite cement to alumina-coated versus tribochemical silica-treated zirconia. J. Mech. Behav. Biomed. Mater. 2020, 105, 103710. [Google Scholar] [CrossRef] [PubMed]
  13. Thiessen, K.P. Tribochemistry versus Nano-Tribology I. Theoretical Considerations on Making a Tandem Nanoscope. Eur. Chem. Bull 2016, 5, 420–422. [Google Scholar]
  14. Knyazeva, A.G.; Evstigneev, N.K. Interrelations between heat and mechanical processes during solid phase chemical conversion under loading. Procedia Comput. Sci. 2010, 1, 2619–2628. [Google Scholar] [CrossRef] [Green Version]
  15. Kloskowski, T.; Szeliski, K.; Fekner, Z.; Rasmus, M.; Dąbrowski, P.; Wolska, A.; Siedlecka, N.; Adamowicz, J.; Drewa, T.; Pokrywczyńska, M. Ciprofloxacin and levofloxacin as potential drugs in genitourinary cancer treatment—The effect of dose–response on 2D and 3D cell cultures. Int. J. Mol. Sci. 2021, 22, 11970. [Google Scholar] [CrossRef] [PubMed]
  16. Lungu, I.-A.; Moldovan, O.-L.; Biriș, V.; Rusu, A. Fluoroquinolones hybrid molecules as promising antibacterial agents in the fight against antibacterial resistance. Pharmaceutics 2022, 14, 1749. [Google Scholar] [CrossRef]
  17. Mühlenweg, H.; Hirleman, E.D. Laser diffraction spectroscopy: Influence of particle shape and a shape adaptation technique. Part. Part. Syst. Charact. 1998, 15, 163–169. [Google Scholar] [CrossRef]
  18. De Boer, A.H.; Gjaltema, D.; Hagedoorn, P.; Schaller, M.; Witt, W.; Frijlink, H.W. Design and application of a new modular adapter for laser diffraction characterization of inhalation aerosols. Int. J. Pharm. 2002, 5, 233–245. [Google Scholar] [CrossRef]
  19. Sourav Bhattacharjee, S. DLS and Zeta potential—What they are and what they are not? J. Control. Release 2016, 235, 337–351. [Google Scholar] [CrossRef]
  20. Mondal, S.; Mondal, H.; Saha, K.; Roul, B. Development of a low-cost smartphone-connected Digital Microscope. J. Microsc. Ultrastruct. 2020, 8, 51. [Google Scholar] [CrossRef]
  21. Uspenskaya, E.V.; Pleteneva, T.V.; Syroeshkin, A.V.; Kazimova, I.V.; Elizarova, T.E.; Odnovorov, A.I. Role of stable hydrogen isotope variations in water for drug dissolution managing. Curr. Issues Pharm. Med. Sci. 2020, 33, 94–101. [Google Scholar] [CrossRef]
  22. Vladimirovich, S.A.; Valerievna, L.O.; Vadimovna, P.T.; Valerievna, U.E.; Antonovna, T.-L.M.; Vladimirovna, T.I. The new two-dimensional light scattering method for recognition of pharmaceutical enantiomers. J. Appl. Pharm. Sci. 2020, 10, 029–034. [Google Scholar] [CrossRef]
  23. Ludwig, B.; Burke, T.T. Infrared Spectroscopy Studies of Aluminum Oxide and Metallic Aluminum Powders, Part I: Thermal Dehydration and Decomposition. Powders 2022, 1, 47–61. [Google Scholar] [CrossRef]
  24. Mourin, M.; Bhattacharjee, A.; Wai, A.; Hausner, G.; O’Neil, J.; Dibrov, P. Pharmacophore based screening & modification of amiloride analogs for targeting the NHAP-type cation-proton antiporter in vibrio cholerae. Can. J. Microbiol. 2021, 67, 835–849. [Google Scholar]
  25. Janson, G.; Zhang, C.; Prado, M.G.; Paiardini, A. PyMod 2.0: Improvements in protein sequence-structure analysis and homology modeling within pymol. Bioinformatics 2016, 33, 444–446. [Google Scholar] [CrossRef] [Green Version]
  26. Cravotto, G.; Gaudino, E.C.; Cintas, P. On the mechanochemical activation by ultrasound. Chem. Soc. Rev. 2013, 42, 7521. [Google Scholar] [CrossRef] [Green Version]
  27. Malygin, G.A. Mechanism of plastic collapse of nanosized crystals with BCC lattice under uniaxial compression. Phys. Solid State 2018, 60, 1244–1249. [Google Scholar] [CrossRef]
  28. Semenova, O.; Sosunov, A.; Prokhorov, N.; Ponomarev, R. Temperature dependence of LINBO3 dislocation density in the near-surface layer. Chin. Opt. Lett. 2022, 20, 061601. [Google Scholar] [CrossRef]
  29. Odnobokova, M.; Belyakov, A.; Kaibyshev, R. Development of Nanocrystalline 304L Stainless Steel by Large Strain Cold Working. Metals 2015, 5, 656–668. [Google Scholar] [CrossRef] [Green Version]
  30. Jitendra, P.; Swadesh, V. 3-Raw materials for terry fabrics. Woven Terry Fabr. Manuf. Qual. Manag. 2017, 19–28. [Google Scholar]
  31. Petukhov, B.V. The mechanism of the anomalous behavior of the plastic flow of materials with high crystal relief caused by the dynamic impurity subsystem. Fizika Tverdogo Tela 2021, 64, 2126–2133. [Google Scholar]
  32. Mayerhöfer, T.G.; Popp, J. Quantitative Evaluation of Infrared Absorbance Spectra-Lorentz Profile versus Lorentz Oscillator. Chemphyschem 2019, 20, 31–36. [Google Scholar] [CrossRef] [PubMed]
  33. Butyagin, P.Y. Problems in mechanochemistry and prospects for its development. Russ. Chem. Rev. 1994, 63, 965–976. [Google Scholar] [CrossRef]
  34. Suganandha, J.B.; Mani, M.R. Correlation Study of 3D Surface Roughness of Milled Surfaces with Laser Speckle Pattern. Sensors 2022, 22, 2842. [Google Scholar]
  35. Guntram, J.; Werner, R. Dissolution rates and activation energy for dissolution of brucite (001): A new method based on the microtopography of crystal surfaces. Geochim. Et Cosmochim. Acta 1996, 60, 5055–5062. [Google Scholar]
  36. Andini, S.; Bolognese, A.; Formisano, D.; Manfra, M.; Montagnaro, F.; Santoro, L. Mechanochemistry of ibuprofen pharmaceutica. Chemosphere 2012, 88, 548–553. [Google Scholar] [CrossRef]
  37. Stanzione, F.; Giangreco, I.; Cole, J.C. Use of molecular docking computational tools in drug discovery. Prog. Med. Chem. 2021, 60, 273–343. [Google Scholar]
  38. Xu, L.X.; Bhamla, M.S. Biophysical mechanism of ultrafast helical twisting contraction in the giant unicellular ciliate Spirostomum ambiguum. bioRxiv 2019, 854836. [Google Scholar] [CrossRef] [Green Version]
  39. Petukhov, B.V. Kinetics of plastic deformation of impurity covalent crystals. Phys. Solid State 2015, 57, 2264–2270. [Google Scholar] [CrossRef]
  40. Carlton, H.; Huitink, D.; Liang, H. Tribochemistry as an Alternative Synthesis Pathway. Lubricants 2020, 8, 87. [Google Scholar] [CrossRef]
Figure 1. Example of a uniaxial method of mechanically unwinding a receptor protein (R) with hidden adhesion sites which become available for the ligand (nL) recognition process to form a supramolecular complex (SMComplex).
Powders 02 00028 g001
Figure 2. Dissipation of mechanical energy.
Powders 02 00028 g002
Figure 3. The chemical structure and pharmacopoeia name of the substance in question.
Powders 02 00028 g003
Figure 4. The operation principle of laboratory knife mill: (a) view of the grinding bowl inside the knife mill. (b) Techniques for applying mechanical stress to the solid body surface: 1—constrained impact, 2—crushing, 3—abrasion, 4—splitting, 5—cutting, where P is mechanical force; V is shear direction.
Powders 02 00028 g004
Figure 5. The optical set-up of dissolution rate kinetics design: 1—632.8 nm He-Ne laser; 2—capacity cell with examined disperse system; 3—diffraction pattern; 4—detector.
Powders 02 00028 g005
Figure 6. Experimental scheme of a 2D-LS setup: 1—compact emitter, 2—laser processing module, 3—test sample, 4—collecting lens, 5—charge-coupled device (CCD), 6—USB cable, 7—personal computer.
Powders 02 00028 g006
Figure 7. Kinetic scheme of ligand–receptor interaction of Sp. ambiguum with toxicant: C—cell, L—ligand, n—stoichiometric coefficient, C·Ln—intermediate state (cell after interaction with the ligand), Keq—equilibrium constant fast stage, fm—rate constant of the cell transition to the dead state, DC—dead cell.
Powders 02 00028 g007
Figure 8. Dispersity dynamics of heterogeneous Lvf·Hh samples with mechanical impact (MI): (a) dimensional SLS spectra (n-hexane medium); (b) variation in the integral dispersity characteristics of the unloading of substance samples as a function of time MI.
Powders 02 00028 g008
Figure 9. Morphology of Lvf·Hh substance unloading samples with different MI times: (a) t = 0 min (native sample); (b) t = 3 min; (c) t = 6 min.
Powders 02 00028 g009
Figure 10. Temperature curve duration of the applied MI: (a) the heating inside the milling bowl; (b) the typical of SB stress–strain curve.
Powders 02 00028 g010
Figure 11. Dynamics of the Lvf·Hh molecular aqueous solution’s dispersive properties under mechanical impact (MI) on the substance powder: (a) intensity of DLS scattering by size groups in the nano- and submicron range; (b) changes in the polydispersity index value (PDI) in aqueous-solution unloading of substance samples as a function of MI time.
Powders 02 00028 g011
Figure 12. Changes in the aqueous Lvf·Hh solution’s properties when the substance is exposed to mechanical impact (MI) according to the DLS method: (a) Z-Average (nm); (b) ζ-Potential (mV).
Powders 02 00028 g012
Figure 13. FT-IR spectrum of unloading of Lvf·Hh substance samples with milling times from 0 to 21 min and different wavenumber range (cm−1): (a) full range; (b) 3400–3150; (c) 3000–2750; (d) 1700–1220; (e) 900–500.
Powders 02 00028 g013aPowders 02 00028 g013b
Figure 14. Variability in the height of the maximum transmittance characteristic of the O-H band at 3240 cm−1.
Powders 02 00028 g014
Figure 15. “Fingerprint” diagram for ten chemometrics descriptors of unloading of Lvf·h substance samples with different MI times in the range from 0 to 21 min.
Powders 02 00028 g015
Figure 16. The dissolution of Lvf·Hh substance samples with different MI: (a) laser obscuration values’ dependence on dissolution time; (b) dissolution rate constants of unloading of different Lvf·Hh substance samples.
Powders 02 00028 g016
Figure 17. The dependency of Sp. ambiguum on the Lvf·Hh sample’s nature as a result of being subjected to high-intensity mechanical impact.
Powders 02 00028 g017
Figure 18. Three-dimensional model of Lvf molecule intermolecular contacts with the DNA-gyrase active center.
Powders 02 00028 g018
Figure 19. Relationship of Sp. ambiguum lifetime as a function of temperature for the Lvf·Hh samples with MI times 0 (before McAct) and 21 min (after McAct).
Powders 02 00028 g019
Table 1. Representation of chemometric 2D-LS descriptors.
DescriptorMathematical RepresentationDescription
d1 d 1 = i S i > S b i t · 100 %
it is the total number of elements.
∆Si is the value of differences in the signal level of the elements of two interference patterns.
Sb is the threshold level of the signal.
The number of different elements, regardless of the degree of difference.
d2 d 2 = S i > S b S i i t · S ¯ · 100 %
∆Si>Sb ∆Si is the average value of the signal level of all the elements of the original interference pattern.
The degree of difference for each discrete element based on the original interference
pattern and the total intensity of the level of its signal.
d3 d 3 = S i > S b S i i t · S m a x · 100 %
∆Smax is the sum of max possible differences in terms of the signal level of all the relevant elements of the interference patterns of absolute black and absolute white.
The max value of possible differences between the interference patterns of absolute black and absolute white.
Table 2. The main transmittance bands in the FT-IR spectrum of unloading of Lvf·Hh substance samples with different MI times in the range from 0 to 21 min.
Frequency Range, cm−1GroupCompound ClassAppearance/Comments
3400–3450O-H stretchingH2O medium
~3250O-H stretchingcarboxylic acidstrong, intramolecular H-bonded
3000–2800N-R stretchingaminemedium
3000–2840C-H stretchingalkanemedium
1720–1706C=O stretchingcarboxylic acidstrong
1685–1666C=O stretchingconjugated ketonestrong
1650–1580N-H bendingaminemedium
~1650O-H bendingH2Ostrong
1606–1550C=C stretchingquinolonestrong
1465–1450C-H bendingmethylmedium
1342–1266C-N stretchingaromatic aminestrong
1045–1000C-F stretchingfluoro compoundstrong
1275–1200C-O stretchingalkyl aryl etherstrong
~1000C-N stretchingpiperazinestrong
880 ± 20C-H bendingalkane substitutedstrong
Table 3. Tribochemical, Arrhenius, and water dissolution parameters of unloading of Lvf·Hh substance samples with different MI times.
Milling Time, minT, K
(Reaction Mill Bowl)
Dissolution Time, sK·102, s−1Ea, kJ·mol−1
02972002.7-
3327508.430
6328309.032
9336405.114
123334020.046
15329307.526
18332905.717
21333606.710
Table 4. The calculated obsEa values of ligand-induced Sp. ambiguum death process in water solutions of unloading of Lvf·Hh substance samples with different MI times (n = 3).
Milling Time, minobsEa ± SD, kJ·mol−1
056 ± 5
21138 ± 23
Disclaimer/Publisher’s Note: The statements, opinions and data contained in all publications are solely those of the individual author(s) and contributor(s) and not of MDPI and/or the editor(s). MDPI and/or the editor(s) disclaim responsibility for any injury to people or property resulting from any ideas, methods, instructions or products referred to in the content.

