
Mixtures of Modified Starch and Rice and Pea Protein Concentrate as Wall Material in the Microencapsulation of Flaxseed Oil

 ,
,
Abstract
:1. Introduction
2. Materials and Methods
2.1. Fatty Acids Profile
2.2. Emulsions Production and Characterization
2.3. Freeze-Drying and Encapsulation Efficiency
2.4. Powders Characterization
2.5. Oxidative Stability
2.6. Statistical Analysis
3. Results and Discussion
3.1. Fatty Acids Profile
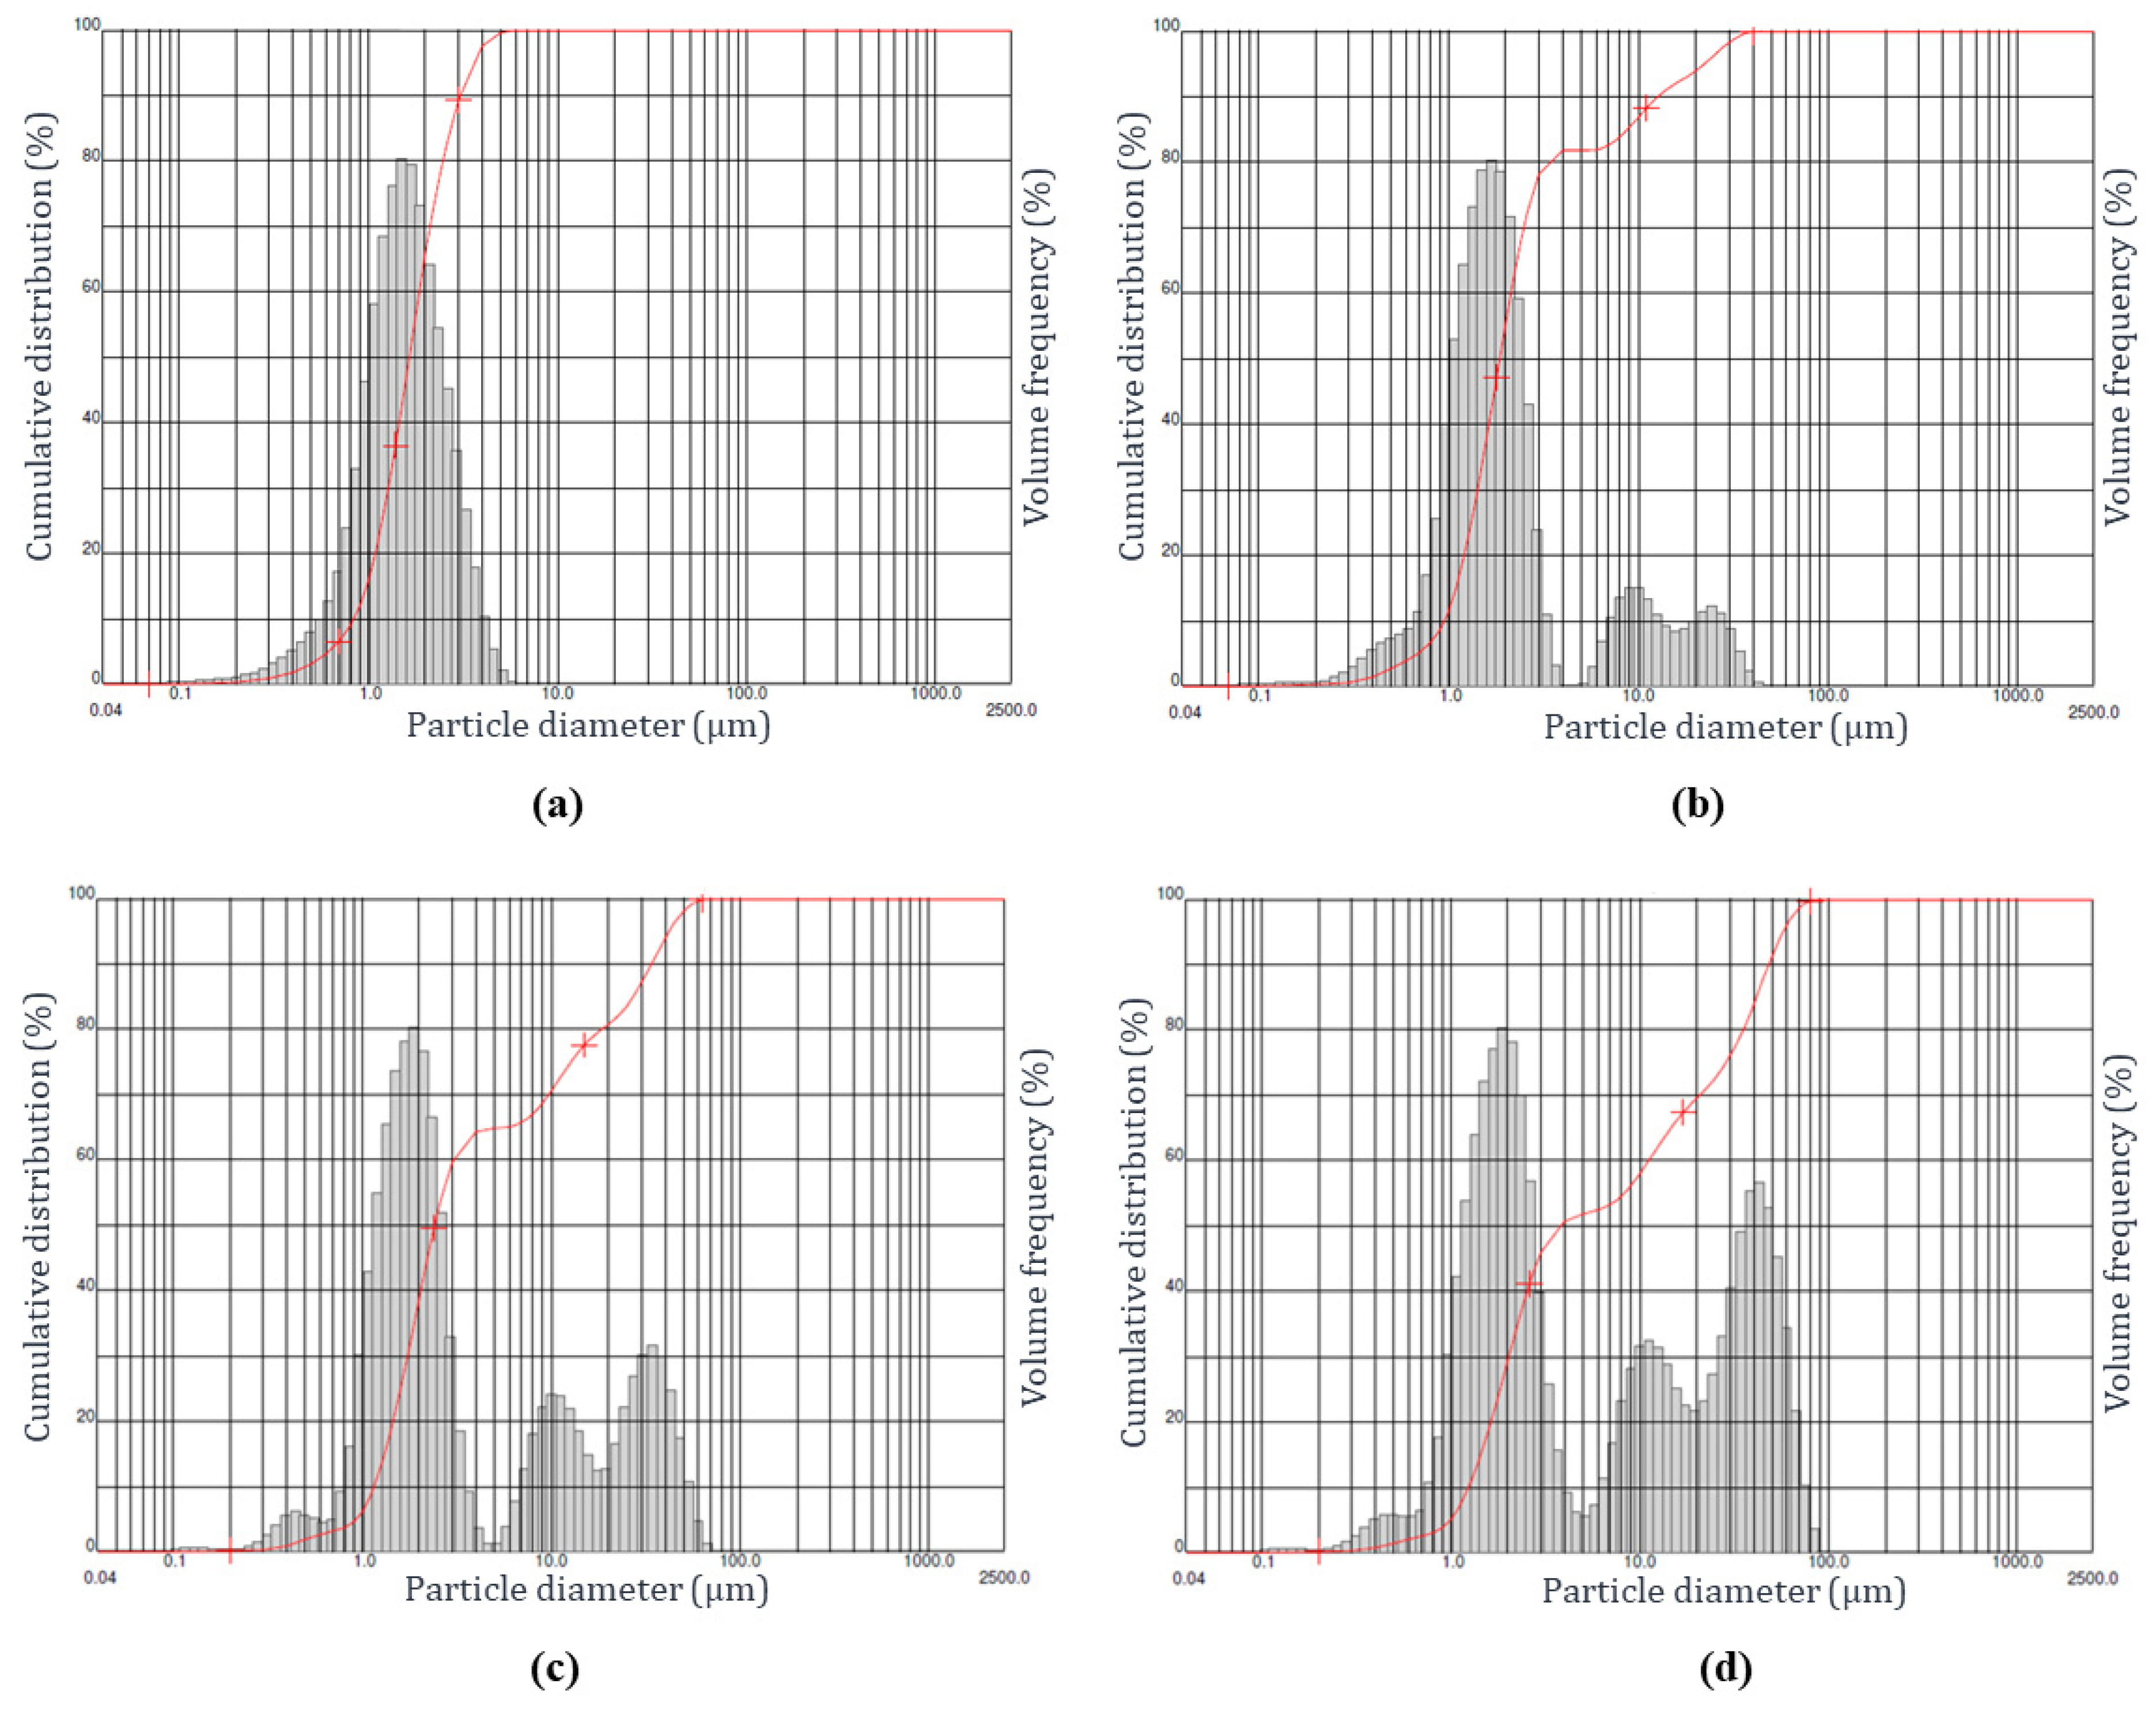
3.2. Emulsions Characterization
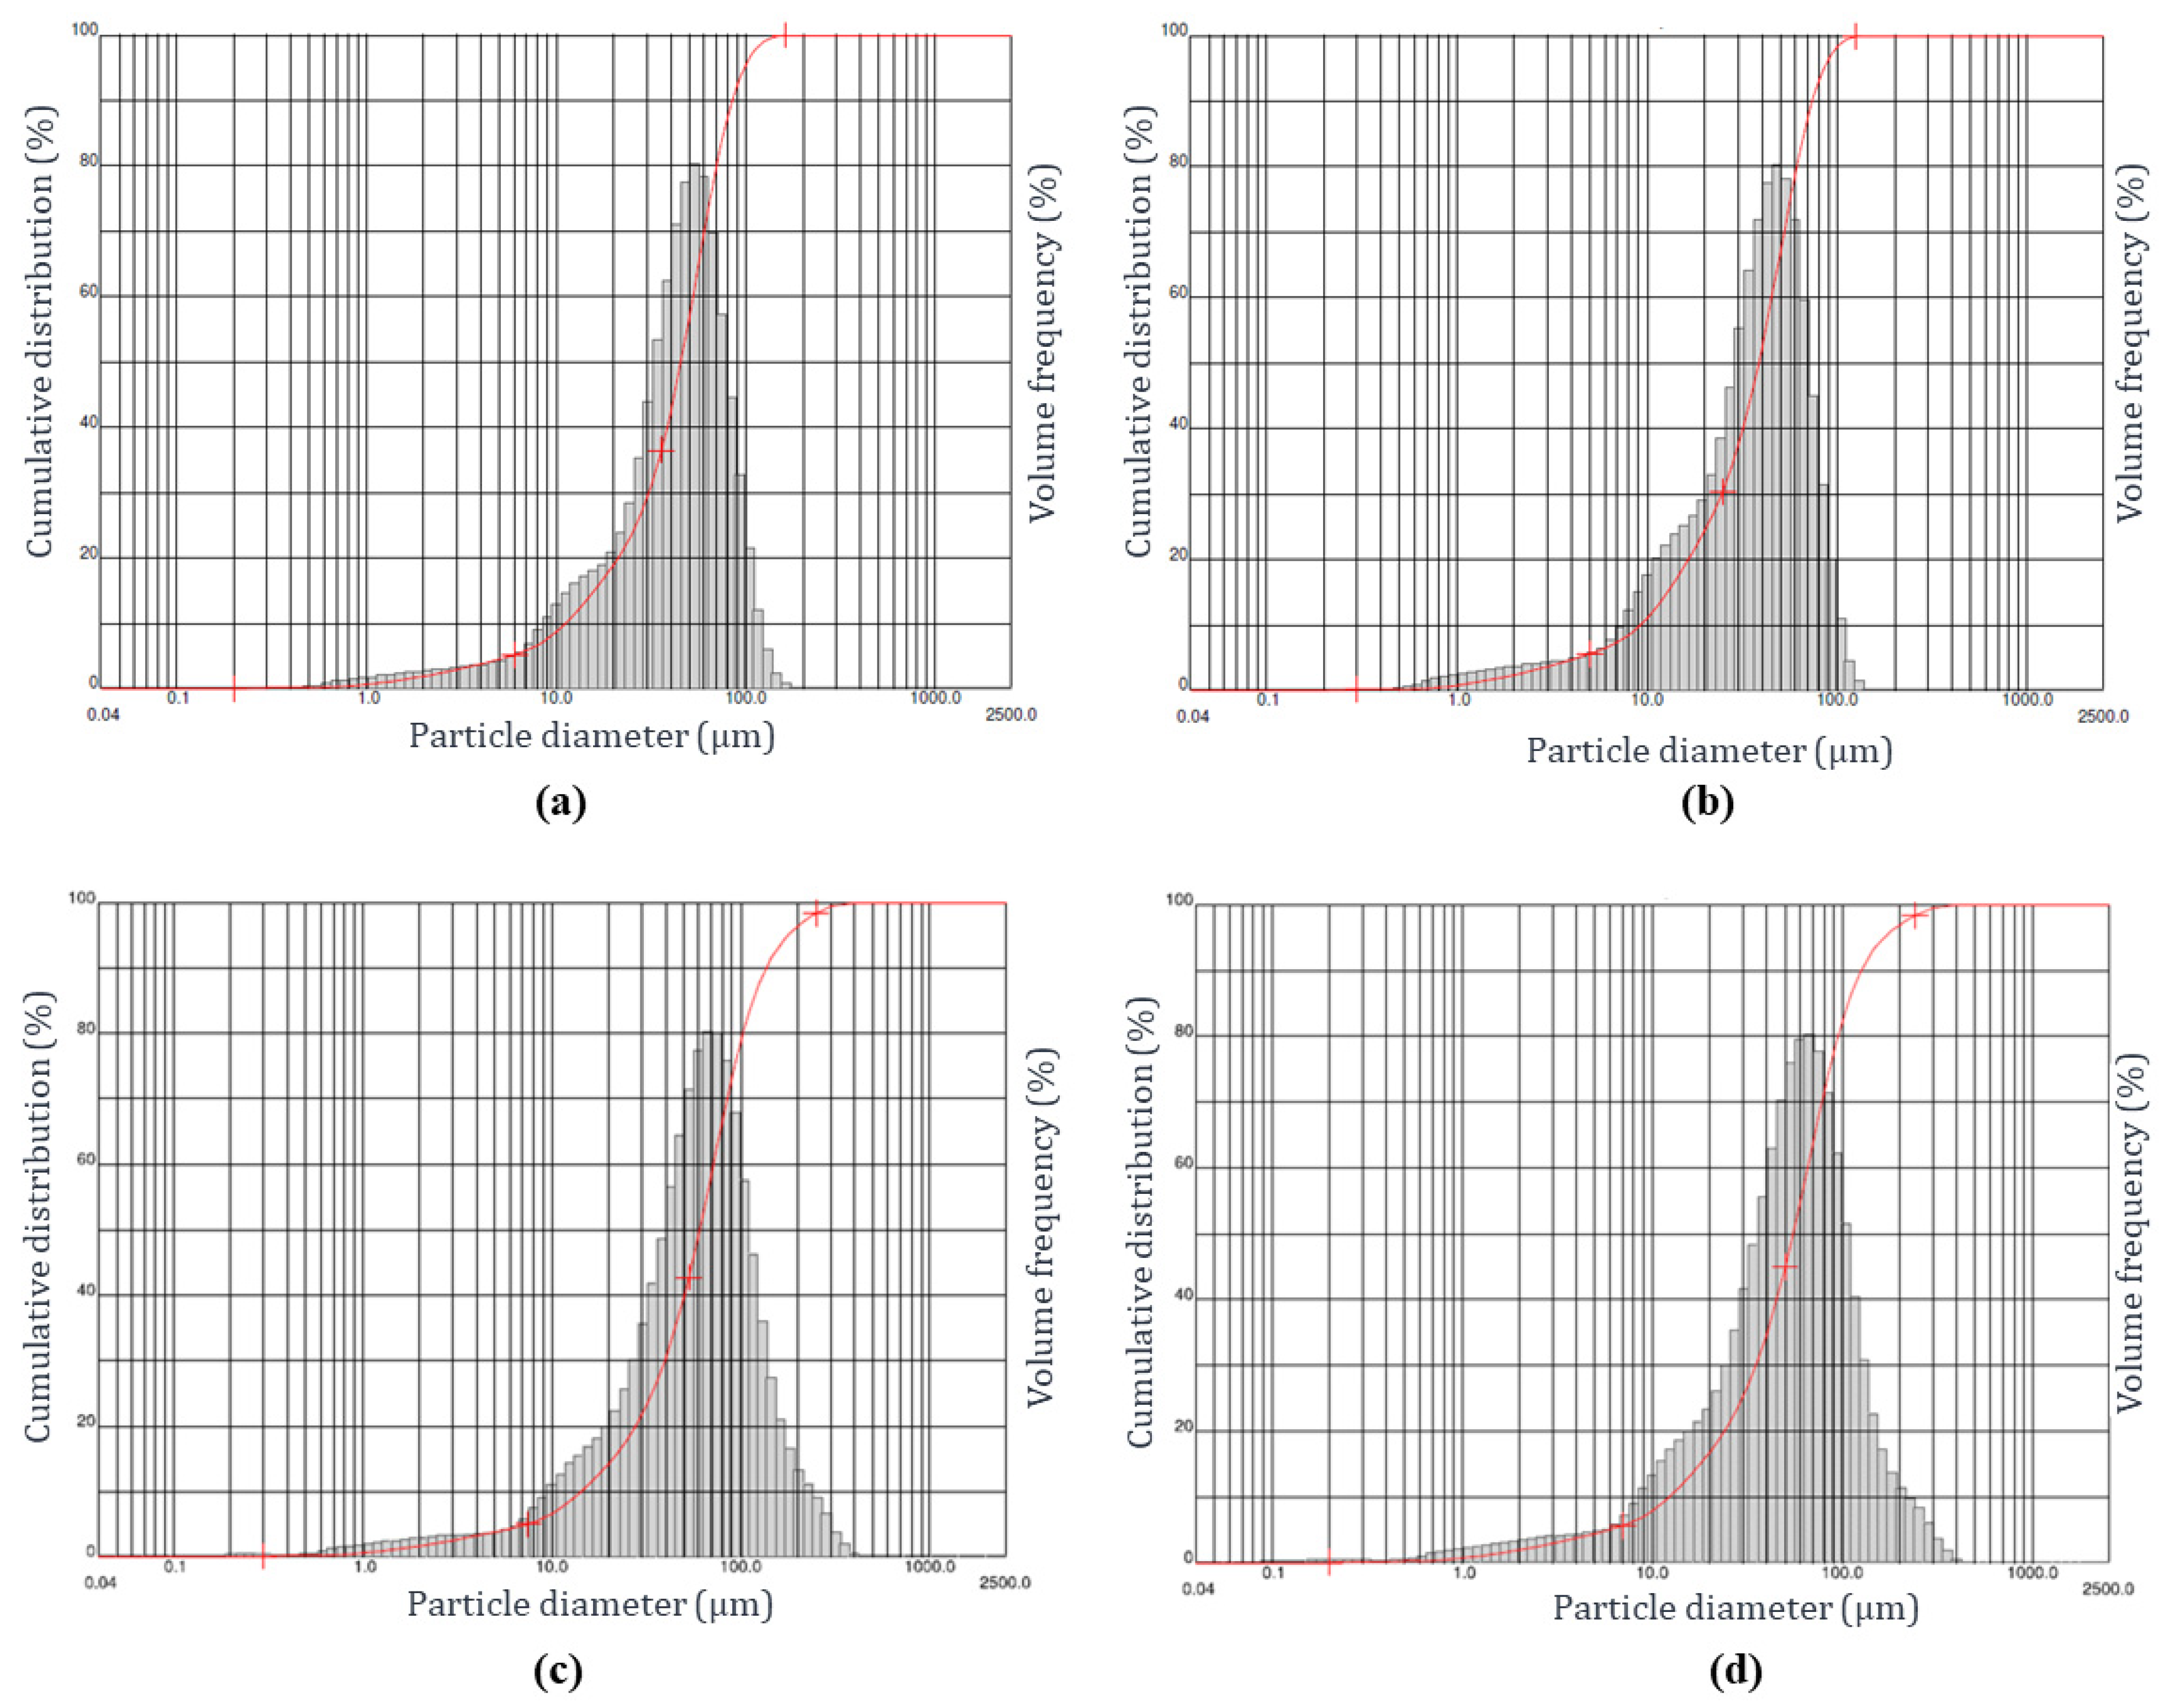
3.3. Encapsulation Efficiency and Powder Characterization
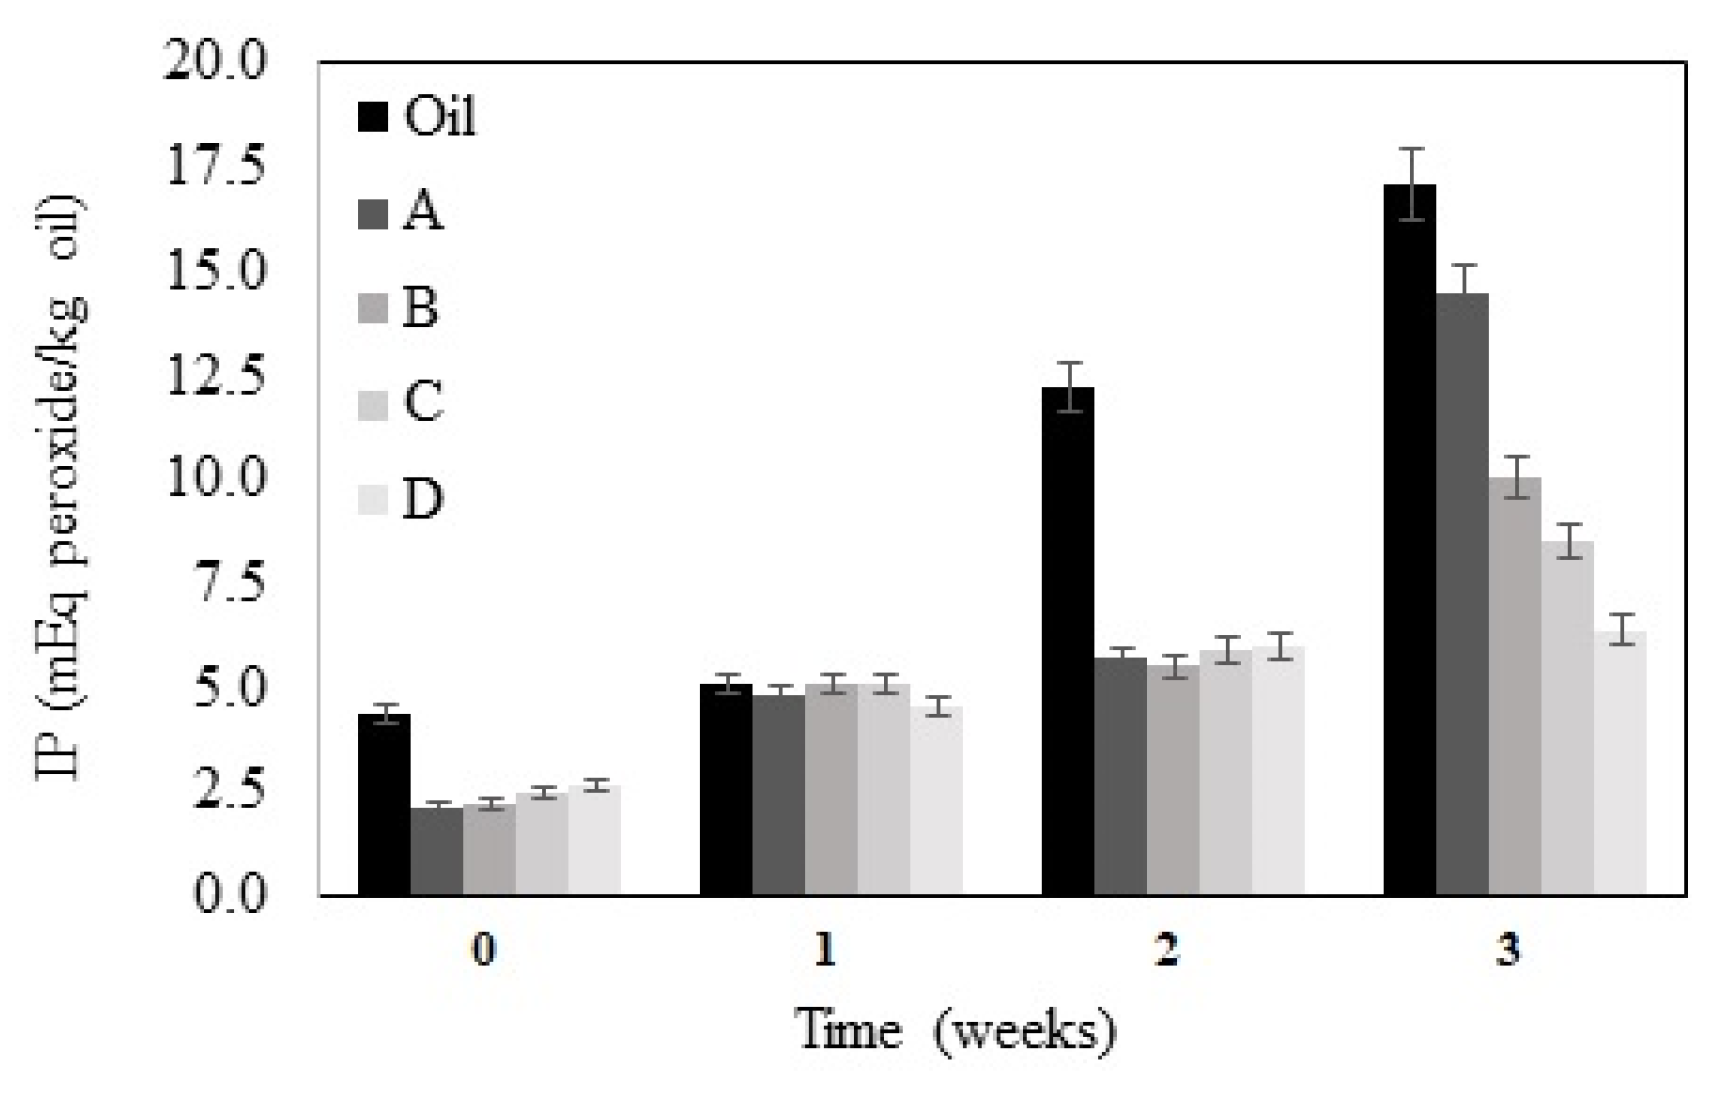
3.4. Oxidative Stability
4. Conclusions
Author Contributions
Funding
Institutional Review Board Statement
Informed Consent Statement
Data Availability Statement
Conflicts of Interest
References
- Shahid, M.Z.; Imran, M.; Khan, M.K.; Ahmad, M.H.; Nadeem, M.; Muhammad, N.; Yasmin, A. OMEGA-3 Fatty Acids Retention, Oxidative Quality, and Sensoric Acceptability of Spray-Dried Flaxseed Oil. J. Food Qual. 2020, 2020, 7286034. [Google Scholar] [CrossRef]
- Carneiro, H.C.F.; Tonon, R.V.; Grosso, C.R.F.; Hubinger, M.D. Encapsulation efficiency and oxidative stability of flaxseed oil microencapsulated by spray drying using different combinations of wall materials. J. Food Eng. 2013, 115, 443–451. [Google Scholar] [CrossRef] [Green Version]
- Collins, T.F.X.; Sprando, R.L.; Black, T.N.; Olejnik, N.; Wiesenfeld, P.W.; Babu, U.S.; Bryant, M.; Flynn, T.J.; Ruggles, D.I. Effects of flaxseed and defatted flaxseed meal on reproduction and development in rats. Food Chem. Toxicol. 2003, 41, 819–834. [Google Scholar] [CrossRef] [PubMed]
- Chen, Y.-C.; Nguyen, J.; Semmens, K.; Beamer, S.; Jaczynski, J. Effects of dietary alpha-tocopheryl acetate on lipid oxidation and alpha-tocopherol content of novel omega-3-enhanced farmed rainbow trout (Oncorhynchus mykiss) fillets. LWT Food Sci. Technol. 2008, 41, 244–253. [Google Scholar] [CrossRef]
- Perrechil, F.; Louzi, V.C.; Alves da Silva Paiva, L.; Valentin Natal, G.S.; Braga, M.B. Evaluation of modified starch and rice protein concentrate as wall materials on the microencapsulation of flaxseed oil by freeze-drying. LWT 2021, 140, 110760. [Google Scholar] [CrossRef]
- Fioramonti, S.A.; Stepanic, E.M.; Tibaldo, A.M.; Pavón, Y.L.; Santiago, L.G. Spray dried flaxseed oil powdered microcapsules obtained using milk whey proteins-alginate double layer emulsions. Food Res. Int. 2019, 119, 931–940. [Google Scholar] [CrossRef]
- Ghosh, M.; Srivastava, S.; Raigar, R.K.; Mishra, H.N. Multilayer perceptron neural networking for prediction of quality attributes of spray-dried vegetable oil powder. Soft Comput. 2020, 24, 9821–9833. [Google Scholar] [CrossRef]
- Kaasgaard, T.; Keller, D. Chitosan Coating Improves Retention and Redispersibility of Freeze-Dried Flavor Oil Emulsions. J. Agric. Food Chem. 2010, 58, 2446–2454. [Google Scholar] [CrossRef]
- Holgado, F.; Márquez-Ruiz, G.; Ruiz-Méndez, M.V.; Velasco, J. Effects of the drying method on the oxidative stability of the free and encapsulated fractions of microencapsulated sunflower oil. Int. J. Food Sci. Technol. 2019, 54, 2520–2528. [Google Scholar] [CrossRef]
- Santana, R.C.; Perrechil, F.A.; Cunha, R.L. High- and Low-Energy Emulsifications for Food Applications: A Focus on Process Parameters. Food Eng. Rev. 2013, 5, 107–122. [Google Scholar] [CrossRef]
- Timilsena, Y.P.; Wang, B.; Adhikari, R.; Adhikari, B. Advances in microencapsulation of polyunsaturated fatty acids (PUFAs)-rich plant oils using complex coacervation: A review. Food Hydrocoll. 2017, 69, 369–381. [Google Scholar] [CrossRef]
- Ratti, C. Hot air and freeze-drying of high-value foods: A review. J. Food Eng. 2001, 49, 311–319. [Google Scholar] [CrossRef]
- Turchiuli, C.; Fuchs, M.; Bohin, M.; Cuvelier, M.E.; Ordonnaud, C.; Peyrat-Maillard, M.N.; Dumoulin, E. Oil encapsulation by spray drying and fluidised bed agglomeration. Innov. Food Sci. Emerg. Technol. 2005, 6, 29–35. [Google Scholar] [CrossRef]
- Gharsallaoui, A.; Roudaut, G.; Chambin, O.; Voilley, A.; Saurel, R. Applications of spray-drying in microencapsulation of food ingredients: An overview. Food Res. Int. 2007, 40, 1107–1121. [Google Scholar] [CrossRef]
- Andreola, K.; Silva, C.A.M.; Taranto, O.P. Agglomeration process of rice protein concentrate using glucomannan as binder: In-line monitoring of particle size. Chem. Eng. Res. Des. 2018, 135, 37–51. [Google Scholar] [CrossRef]
- Boye, J.; Zare, F.; Pletch, A. Pulse proteins: Processing, characterization, functional properties and applications in food and feed. Food Res. Int. 2010, 43, 414–431. [Google Scholar] [CrossRef]
- Herreman, L.; Nommensen, P.; Pennings, B.; Laus, M.C. Comprehensive overview of the quality of plant- And animal-sourced proteins based on the digestible indispensable amino acid score. Food Sci. Nutr. 2020, 8, 5379–5391. [Google Scholar] [CrossRef]
- Pietrysiak, E.; Smith, D.M.; Smith, B.M.; Ganjyal, G.M. Enhanced functionality of pea-rice protein isolate blends through direct steam injection processing. Food Chem. 2018, 243, 338–344. [Google Scholar] [CrossRef]
- Hermansson, A.-M.; Svegmark, K. Developments in the understanding of starch functionality. Trends Food Sci. Technol. 1996, 7, 345–353. [Google Scholar] [CrossRef]
- Liu, H.; Eskin, N.A.M.; Cui, S.W. Interaction of wheat and rice starches with yellow mustard mucilage. Food Hydrocoll. 2003, 17, 863–869. [Google Scholar] [CrossRef]
- Mujica-Álvarez, J.; Gil-Castell, O.; Barra, P.A.; Ribes-Greus, A.; Bustos, R.; Faccini, M.; Matiacevich, S. Encapsulation of Vitamins A and E as Spray-Dried Additives for the Feed Industry. Molecules 2020, 25, 1357. [Google Scholar] [CrossRef] [PubMed] [Green Version]
- Comunian, T.A.; Grassmann Roschel, G.; da Silva Anthero, A.G.; de Castro, I.A.; Dupas Hubinger, M. Influence of heated, unheated whey protein isolate and its combination with modified starch on improvement of encapsulated pomegranate seed oil oxidative stability. Food Chem. 2020, 326, 126995. [Google Scholar] [CrossRef] [PubMed]
- da Silva Bastos, D.; de Lima Araújo, K.G.; da Rocha Leão, M.H.M. Ascorbic acid retaining using a new calcium alginate-Capsul based edible film. J. Microencapsul. 2009, 26, 97–103. [Google Scholar] [CrossRef] [PubMed]
- Kaushik, P.; Dowling, K.; McKnight, S.; Barrow, C.J.; Adhikari, B. Microencapsulation of flaxseed oil in flaxseed protein and flaxseed gum complex coacervates. Food Res. Int. 2016, 86, 1–8. [Google Scholar] [CrossRef]
- Noguera, N.H.; Lima, D.C.; Klier Monteiro Filho, J.C.; Rodrigues, R.A.F. Production of rice bran oil (Oryza sativa L.) microparticles by spray drying taking advantage of the technological properties of cereal co-products. J. Microencapsul. 2022, 39, 314–326. [Google Scholar] [CrossRef]
- Gomes, M.H.G.; Kurozawa, L.E. Improvement of the functional and antioxidant properties of rice protein by enzymatic hydrolysis for the microencapsulation of linseed oil. J. Food Eng. 2020, 267, 109761. [Google Scholar] [CrossRef]
- Hartman, L.; Lago, R.C. Rapid preparation of fatty acid methyl esters from lipids. Lab. Pract. 1973, 22, 475–6 passim. [Google Scholar]
- American Oil Chemists Society—AOCS. Official Methods and Recommended Practices of the American Oil Chemists’ Society, 6th ed.; AOCS: Chicago, IL, USA, 2009. [Google Scholar]
- Bae, E.K.; Lee, S.J. Microencapsulation of avocado oil by spray drying using whey protein and maltodextrin. J. Microencapsul. 2008, 25, 549–560. [Google Scholar] [CrossRef]
- Tonon, R.V.; Brabet, C.; Hubinger, M.D. Anthocyanin stability and antioxidant activity of spray-dried açai (Euterpe oleracea Mart.) juice produced with different carrier agents. Food Res. Int. 2010, 43, 907–914. [Google Scholar] [CrossRef]
- Chen, J.Y.; Piva, M.; Labuza, T.P. Evaluation of Water Binding Capacity (WBC) of Food Fiber Sources. J. Food Sci. 1984, 49, 59–63. [Google Scholar] [CrossRef]
- Partanen, R.; Raula, J.; Seppänen, R.; Buchert, J.; Kauppinen, E.; Forssell, P. Effect of Relative Humidity on Oxidation of Flaxseed Oil in Spray Dried Whey Protein Emulsions. J. Agric. Food Chem. 2008, 56, 5717–5722. [Google Scholar] [CrossRef] [PubMed]
- Shantha, N.C.; Decker, E.A. Rapid, Sensitive, Iron-Based Spectrophotometric Methods for Determination of Peroxide Values of Food Lipids. J. AOAC Int. 1994, 77, 421–424. [Google Scholar] [CrossRef] [PubMed]
- Kouamé, K.J.E.-P.; Bora, A.F.M.; Li, X.; Sun, Y.; Liu, L. Novel trends and opportunities for microencapsulation of flaxseed oil in foods: A review. J. Funct. Foods 2021, 87, 104812. [Google Scholar] [CrossRef]
- Mikołajczak, N.; Tańska, M. Effect of initial quality and bioactive compounds content in cold-pressed flaxseed oils on oxidative stability and oxidation products formation during one-month storage with light exposure. NFS J. 2022, 26, 10–21. [Google Scholar] [CrossRef]
- Dou, X.; Zhang, L.; Chen, Z.; Wang, X.; Ma, F.; Yu, L.; Mao, J.; Li, P. Establishment and evaluation of multiple adulteration detection of camellia oil by mixture design. Food Chem. 2023, 406, 135050. [Google Scholar] [CrossRef] [PubMed]
- Sun-Waterhouse, D.; Waterhouse, G.I.N. Spray-Drying of Green or Gold Kiwifruit Juice–Milk Mixtures; Novel Formulations and Processes to Retain Natural Fruit Colour and Antioxidants. Food Bioprocess Technol. 2015, 8, 191–207. [Google Scholar] [CrossRef]
- Braga, M.B.; Dos Santos Rocha, S.C.; Hubinger, M.D. Spray-Drying of Milk–Blackberry Pulp Mixture: Effect of Carrier Agent on the Physical Properties of Powder, Water Sorption, and Glass Transition Temperature. J. Food Sci. 2018, 83, 1650–1659. [Google Scholar] [CrossRef]
- Bhosale, R.; Singhal, R. Process optimization for the synthesis of octenyl succinyl derivative of waxy corn and amaranth starches. Carbohydr. Polym. 2006, 66, 521–527. [Google Scholar] [CrossRef]
- Pimenta Inada, K.O.; Nunes, S.; Martínez-Blázquez, J.A.; Tomás-Barberán, F.A.; Perrone, D.; Monteiro, M. Effect of high hydrostatic pressure and drying methods on phenolic compounds profile of jabuticaba (Myrciaria jaboticaba) peel and seed. Food Chem. 2020, 309, 125794. [Google Scholar] [CrossRef]
- Wu, G.; Hui, X.; Liang, J.; Liu, H.; Chen, H.; Gong, X.; Brennan, M.A.; Zeng, X.-A.; Guo, X.; Brennan, C.S. Combination of rehydrated whey protein isolate aqueous solution with blackcurrant concentrate and the formation of encapsulates via spray-drying and freeze-drying: Alterations to the functional properties of protein and their anticancer properties. Food Chem. 2021, 355, 129620. [Google Scholar] [CrossRef]
- United States Pharmacopeial Convention. The United States Pharmacopeia: USP 29; United States Pharmacopeial Convention Incorporated: Rockville, ML, USA, 2006; ISBN 9781889788418. [Google Scholar]
- Pedro, M.A.M.; Telis-Romero, J.; Telis, V.R.N. Effect of drying method on the adsorption isotherms and isosteric heat of passion fruit pulp powder. Food Sci. Technol. 2010, 30, 993–1000. [Google Scholar] [CrossRef] [Green Version]
- Elik, A.; Koçak Yanık, D.; Göğüş, F. A comparative study of encapsulation of carotenoid enriched-flaxseed oil and flaxseed oil by spray freeze-drying and spray drying techniques. LWT 2021, 143, 111153. [Google Scholar] [CrossRef]


| Formulation | Water (g) | Oil (g) | RPC + PPC (g) | Capsul® (g) |
|---|---|---|---|---|
| A | 60 | 10 | 0 | 30 |
| B | 60 | 10 | 3 | 27 |
| C | 60 | 10 | 6 | 24 |
| D | 60 | 10 | 9 | 21 |
| Fatty Acid | % (w/w) | |
|---|---|---|
| C12:0 | Lauric | 0.02 |
| C14:0 | Myristic | 0.08 |
| C15:0 | Pentadecylic | 0.01 |
| C16:0 | Palmitic | 9.49 |
| C16:1 | Palmitoleic | 0.09 |
| C17:0 | Margaric | 0.10 |
| C18:0 | Stearic | 4.99 |
| C18:1 | Oleic | 23.26 |
| C18:2 | *t-Linoleic | 0.09 |
| C18:2 | Linoleic | 39.87 |
| C18:3 | *t-Linolenic | 0.24 |
| C18:3 | Linolenic | 20.48 |
| C20:0 | Arachidic | 0.37 |
| C20:1 | Gondoic | 0.25 |
| C22:0 | Behenic | 0.40 |
| C22:1 | Erucic | 0.09 |
| C24:0 | Lignoceric | 0.12 |
| Analyse | Formulation A | Formulation B | Formulation C | Formulation D |
|---|---|---|---|---|
| pH | 2.82 a ± 0.01 | 4.09 b ± 0.01 | 4.64 c ± 0.02 | 5.08 d ± 0.01 |
| Cs (kg/kg) | 0.3787 a ± 0.0003 | 0.3636 a ± 0.0099 | 0.3818 a ± 0.0017 | 0.3786 a ± 0.0003 |
| ICr (%) | 0.0 b | 2.7 a ± 0.9 | 0.0 b | 0.0 b |
| dp (μm) 10% | 0.91 b ± 0.07 | 0.87 b ± 0.06 | 1.11 a ± 0.04 | 1.12 a ± 0.03 |
| dp (μm) 50% | 1.64 b ± 0.01 | 1.64 b ± 0.16 | 2.19 b ± 0.18 | 3.13 a ± 0.42 |
| dp (μm) 90% | 2.84 b ± 0.16 | 5.89 b ± 4.55 | 23.16 a,b ± 10.61 | 43.24 a ± 3.39 |
| (μm) | 1.78 b ± 0.04 | 2.57 b ± 1.29 | 6.84 b ± 2.68 | 13.89 a ± 1.57 |
| k (Pa·sn) | 0.1708 a ± 0.0035 | 0.1693 a ± 0.0059 | 0.1035 b ± 0.0127 | 0.1251 b ± 0.0041 |
| n | 0.894 b ± 0.003 | 0.904 a,b ± 0.013 | 0.941 a ± 0.009 | 0.927 a,b ± 0.005 |
| μ100s−1 (mPa·s) | 104.09 a ± 0.38 | 108.97 a ± 2.38 | 78.88 b ± 6.27 | 89.82 a,b ± 0.86 |
| Analyse | Powder A | Powder B | Powder C | Powder D |
|---|---|---|---|---|
| EE (%) | 93.40 | 71.45 | 58.47 | 18.26 |
| U (kg/kg) | 0.0313 a ± 0.0009 | 0.0265 b ± 0.0008 | 0.0094 c ± 0.0009 | 0.0102 c ± 0.0010 |
| ρbulk (g/cm3) | 0.2568 a ± 0.0060 | 0.2622 a ± 0.0036 | 0.2440 b ± 0.0041 | 0.2208 c ± 0.3578 |
| (g/cm3) | 0.4321 a ± 0.0067 | 0.3915 b ± 0.0094 | 0.3678 c ± 0.0025 | 0.3578 c ± 0.0063 |
| CI | 40.56 | 33.03 | 33.64 | 38.31 |
| dp (μm) 10% | 11.19 a ± 0.02 | 9.22 b ± 0.02 | 12.66 a ± 1.11 | 11.87 a ± 0.12 |
| dp (μm) 50% | 43.01 b ± 1.65 | 37.22 b ± 0.94 | 54.73 a ± 3.95 | 52.32 a ± 1.79 |
| dp (μm) 90% | 76.81 a,b ± 5.49 | 68.46 b ± 3.66 | 110.06 a ± 17.44 | 109.14 a ± 11.31 |
| D[4,3] (μm) | 44.04 a,b ± 2.33 | 38.26 b ± 1.51 | 59.15 a ± 8.09 | 58.20 a ± 5.01 |
| Model | Parameters | A | B |
|---|---|---|---|
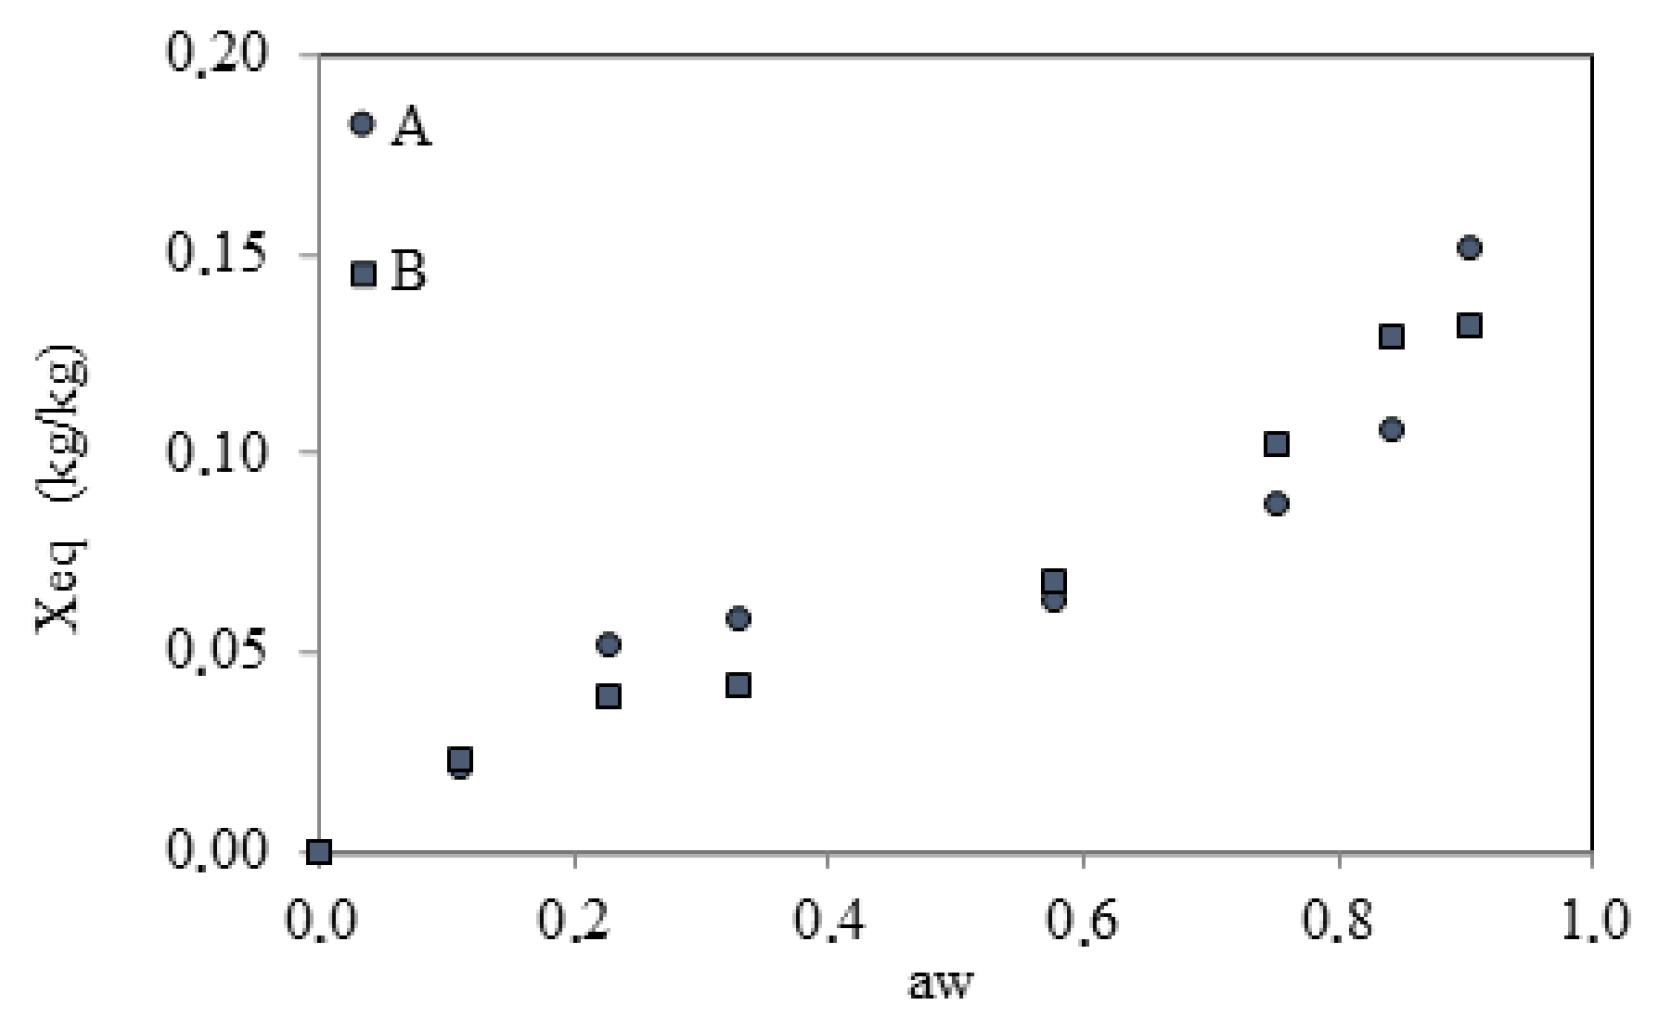
| GAB | Xm | 0.0345 | 0.0337 |
| CGAB | 52.15 | 16,110,367.11 | |
| KGAB | 0.8410 | 0.8464 | |
| R2 | 0.9364 | 0.9585 | |
| AD (%) | 17.88 | 15.32 | |
| BET | Xm | 0.0273 | 0.0350 |
| CBET | 38.66 | 30.44 | |
| N | 1.23 | 0.39 | |
| R2 | 0.9195 | 0.9973 | |
| AD (%) | 18.22 | 4.13 |
Disclaimer/Publisher’s Note: The statements, opinions and data contained in all publications are solely those of the individual author(s) and contributor(s) and not of MDPI and/or the editor(s). MDPI and/or the editor(s) disclaim responsibility for any injury to people or property resulting from any ideas, methods, instructions or products referred to in the content. |
© 2023 by the authors. Licensee MDPI, Basel, Switzerland. This article is an open access article distributed under the terms and conditions of the Creative Commons Attribution (CC BY) license (https://creativecommons.org/licenses/by/4.0/).
Share and Cite
Perrechil, F.; Natal, G.S.V.; Paiva, L.A.d.S.; Braga, M.B. Mixtures of Modified Starch and Rice and Pea Protein Concentrate as Wall Material in the Microencapsulation of Flaxseed Oil. Powders 2023, 2, 323-337. https://doi.org/10.3390/powders2020019
Perrechil F, Natal GSV, Paiva LAdS, Braga MB. Mixtures of Modified Starch and Rice and Pea Protein Concentrate as Wall Material in the Microencapsulation of Flaxseed Oil. Powders. 2023; 2(2):323-337. https://doi.org/10.3390/powders2020019
Chicago/Turabian StylePerrechil, Fabiana, Gabriela Santos Valentin Natal, Lidia Alves da Silva Paiva, and Matheus Boeira Braga. 2023. "Mixtures of Modified Starch and Rice and Pea Protein Concentrate as Wall Material in the Microencapsulation of Flaxseed Oil" Powders 2, no. 2: 323-337. https://doi.org/10.3390/powders2020019