Review

A Review of Solar Forecasting Techniques and the Role of Artificial Intelligence

by
Khadija Barhmi
,
Chris Heynen
,
Sara Golroodbari
and
Wilfried van Sark
*
Copernicus Institute of Sustainable Development, Utrecht University, Princetonlaan 8a, 3584 CB Utrecht, The Netherlands
*
Author to whom correspondence should be addressed.
Solar 2024, 4(1), 99-135; https://doi.org/10.3390/solar4010005
Submission received: 2 January 2024 / Revised: 31 January 2024 / Accepted: 15 February 2024 / Published: 22 February 2024
(This article belongs to the Topic Solar Forecasting and Smart Photovoltaic Systems)

Abstract

:
Solar energy forecasting is essential for the effective integration of solar power into electricity grids and the optimal management of renewable energy resources. Distinguishing itself from the existing literature, this review study provides a nuanced contribution by centering on advancements in forecasting techniques. While preceding reviews have examined factors such as meteorological input parameters, time horizons, the preprocessing methodology, optimization, and sample size, our study uniquely delves into a diverse spectrum of time horizons, spanning ultrashort intervals (1 min to 1 h) to more extended durations (up to 24 h). This temporal diversity equips decision makers in the renewable energy sector with tools for enhanced resource allocation and refined operational planning. Our investigation highlights the prominence of Artificial Intelligence (AI) techniques, specifically focusing on Neural Networks in solar energy forecasting, and we review supervised learning, regression, ensembles, and physics-based methods. This showcases a multifaceted approach to address the intricate challenges associated with solar energy predictions. The integration of Satellite Imagery, weather predictions, and historical data further augments precision in forecasting. In assessing forecasting models, our study describes various error metrics. While the existing literature discusses the importance of metrics, our emphasis lies on the significance of standardized datasets and benchmark methods to ensure accurate evaluations and facilitate meaningful comparisons with naive forecasts. This study stands as a significant advancement in the field, fostering the development of accurate models crucial for effective renewable energy planning and emphasizing the imperative for standardization, thus addressing key gaps in the existing research landscape.

1. Introduction

The pressing need for reducing greenhouse gas emissions has led to the worldwide adoption of renewable energy sources (RESs) [1,2,3]. However, RESs tend to be volatile in nature, especially solar and wind energy, making it hard to predict their power output and making them less reliable. This volatile nature can lead to voltage fluctuations, frequency fluctuations, and system outages [1,2,4,5].
The large-scale integration of RESs into the energy supply network requires the development of new technologies and methods to balance supply and demand. As the share of RESs in the energy mix increases, the load on the energy grid increases with corresponding consequences. The intermittent nature of solar energy has proven to be an obstacle to the large-scale integration of solar energy. For example, a massive increase in grid-connected PV energy can result in overvoltage or congestion problems [6].
A rethinking of the traditional electricity grid is taking place in order to handle the perceived unpredictable nature of RESs. Traditional grids are continuously evolving and changing, becoming so-called smart grids. A smart grid can be seen as the result of fusing the electricity grid with Information and Communication Technologies (ICT). This allows for a two-way flow of information between the supply side and demand side on the energy grid [1,4], which in turn allows for the improved control of management over all the different domains that are part of energy production and distribution [4]. Through the creation of decision-support tools that exploit these flows of information, the distribution and management of the grid can be optimized. Decision-support tools often deal with a variety of tasks, such as energy distribution, energy curtailment, and energy storage system activation. These are now being developed and often include forecasting and the recognition of energy demand and production. Artificial Intelligence (AI) is deemed to be very promising for dealing with these complex tasks [1,2,4].
One of the proposed solutions is to forecast solar irradiance and, in turn, to forecast solar energy production to help balance supply and demand through combination with electricity storage [7,8]. As a result, solar forecasting has seen an increase in interest from researchers, grid operators, and other parties involved in the electricity market [9].
The conclusion of various parameters covered in the existing investigations is presented in Tables 1–7 in Section 4 and Section 5. This review paper aims to provide an overview and critical evaluation of the current and emerging solar forecasting techniques, with a specific emphasis on methods based on All-Sky Imagers (ASIs), satellite data, Sensor Networks, the different data used, the time horizon, the evaluation metrics, and the different applications of solar forecasting, highlighting the integration of AI. The aim is to contribute to the advancement of solar forecasting research by identifying trends and obstacles and offering suggestions for further exploration. However, these studies fall short in addressing the latest AI techniques and recent research in different solar forecasting tools, along with their evaluations.
This present article comprehensively explores solar radiation forecasting techniques based on AI and highlights the intriguing interest in newly discovered procedures encompassing the evaluation of forecasting methods, analysis of ramp events and timing, insights into the AI technique for a special time horizon, resolution, considerations of the spatial–temporal resolution, examination of input variables and their accessibility, location-based accuracy assessments, and the use of evaluation metrics for intended applications. Future recommendations focus on establishing a benchmarking framework and creating publicly available standardized datasets. Additionally, this article elucidates the working principles of each model, providing in-depth insights into recent research articles and their numerical results; a block diagram summarizing the contents of different chapters is presented in Figure 1.
The main objectives of this study are structured as follows:
I
Solar forecasting, AI methods, and performance.
II
Assessment of forecasting methods.
III
Current research—an overview.
IV
Future recommendations and consistency of the training data.

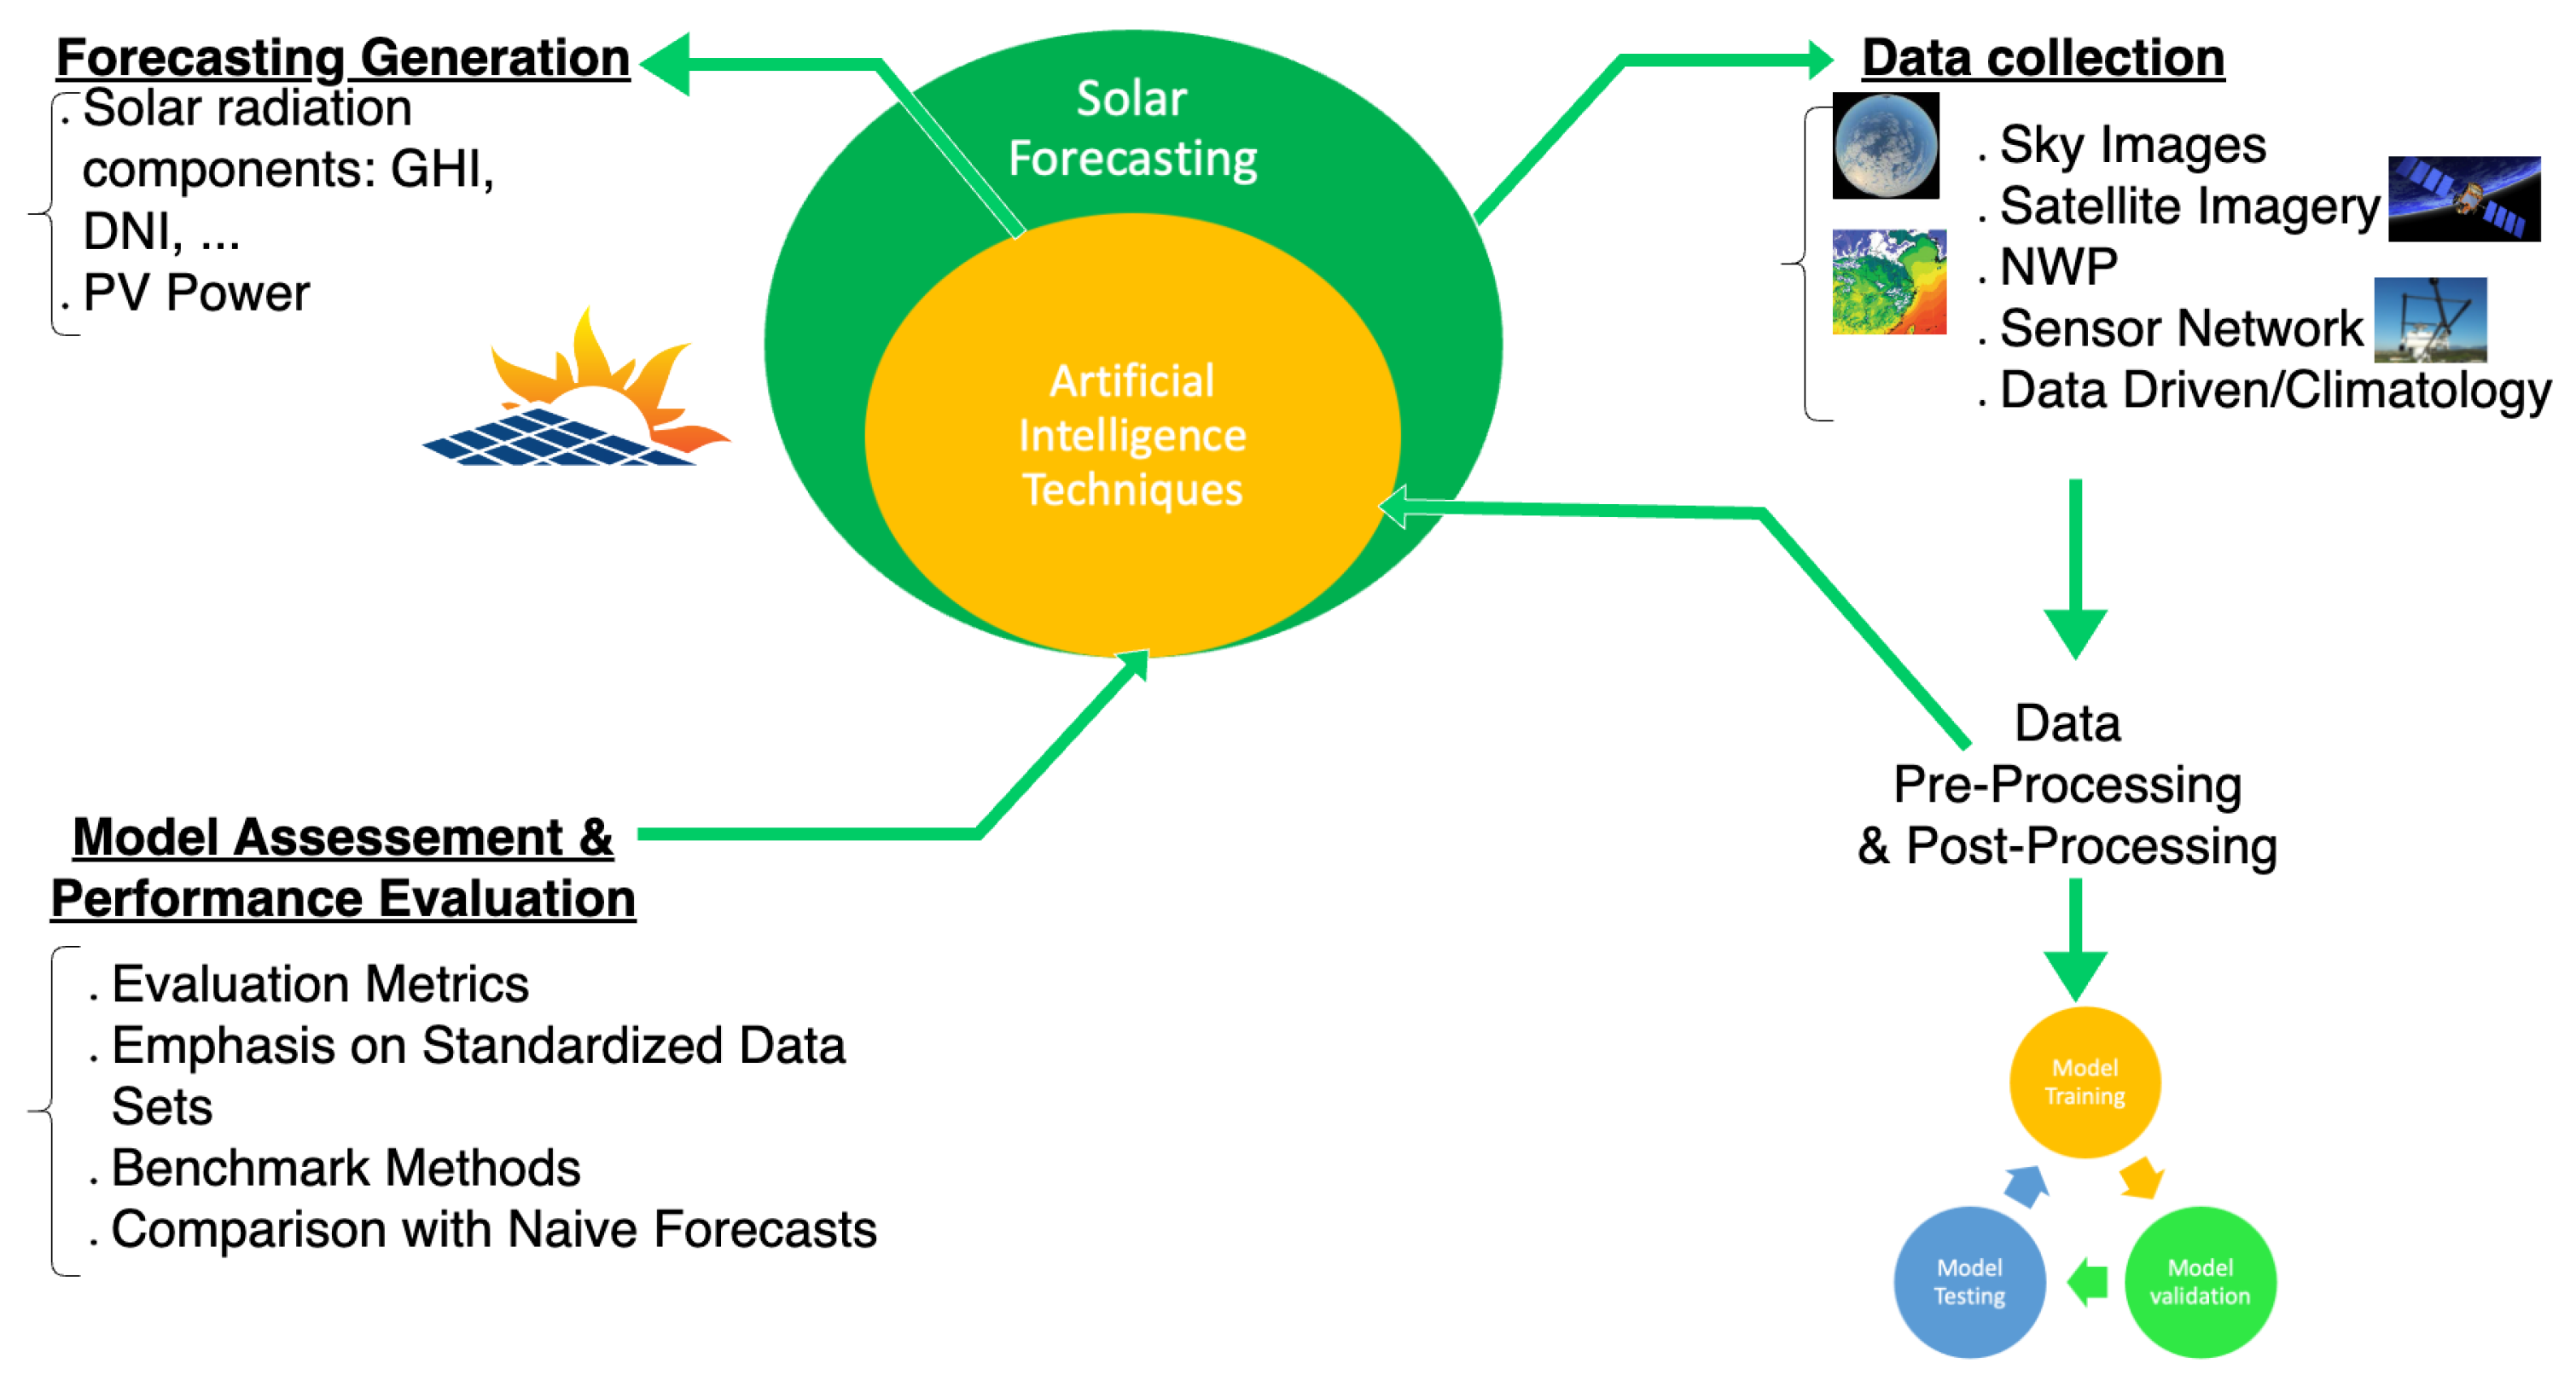
2. Solar Forecasting, Methods, and Performance

The investigation into solar energy is an interdisciplinary pursuit that merges insights from various domains of research, including atmospheric science, climatology, statistics, data science, and Artificial Intelligence [10]. In general, the problem of solar forecasting starts by determining the current state of the atmosphere in order to predict its future state [11]. From this viewpoint, the process of solar forecasting can be reduced to three important parts: (1) the collection of input data, (2) the processing of input data through various methods, including preprocessing and postprocessing, and (3) the generation of output data or the forecast as presented in the flowchart in Figure 2. Due to the multitude of different forecasting methods available, this abstraction will serve as an overarching framework to connect and compare the different solar forecasting techniques to each other. We note that this is just a simplification, as often the solar forecasting methods can be very complex and detailed.
Often, the methods applied to process the input data depend on the methods used to collect the input data. Therefore, we will describe some general approaches to solar forecasting, differentiated by the method of data acquisition, as seen from different investigations in Figure 3a in Section 2. The most common ways to gather input data for determining atmospheric conditions are Satellite Images, All-Sky Imagers, Sensor Networks, and Numerical Weather Prediction [2,8,9,11].

2.1. Satellite Images

High-altitude geostationary satellites are equipped with a wide range of sensors, including sensors for visible and infrared light. Images are taken every 15 to 30 min by these satellites, and they are then combined with physical modeling to determine solar irradiance [2,11]. The general approach is to first determine the clear-sky irradiance at a particular point through physical modeling, taking into account various parameters such as the aerosol content, water vapor, Elevation, and ozone. Then, the cloud pictures are analyzed to estimate the location and transmittance of the clouds. Finally, these data are combined to make an estimation of the actual solar irradiance [13]. In order to make forecasts of solar irradiance, consecutive images are used to determine Cloud Motion Vectors. Under the assumption that the cloud structures stay the same, the future position of the clouds can be determined [9,13]. Forecasting methods based on the mentioned approach generally have a good forecasting ability for a horizon of up to 6 h, but their performance tends to be less optimal in situations where clouds rapidly form and disperse [9,13].
In addition to these established methods, recent advancements have been made in short-term solar irradiance forecasting. For instance, Miller et al. [14] proposed a method that combines geostationary satellite observations, cloud masking and retrieval algorithms, wind field data, and radiative transfer calculations to generate accurate short-term forecasts of solar insolation for solar power generation. This approach considers factors such as cloud advection, shadow displacement, solar geometry, and terrain height to predict the transient properties of down-welling solar irradiance. The algorithm outperforms persistence-based forecasting methods and demonstrates improved accuracy compared to them [14]. Furthermore, Lago et al. [15] developed a generalized model for short-term solar irradiance forecasting that does not rely on local ground measurements. Instead, the model utilizes satellite-based measurements and weather forecasts, employing a Deep Neural Network (DNN) structure that can generalize across locations. The model shows comparable or better performance compared to local models trained with ground measurements, making it a cost-effective alternative for solar irradiance forecasting without the need for costly installation and maintenance of the ground sensors [15].

2.2. All-Sky Imagers

All-Sky Imagers (ASIs) are cameras capable of capturing images with a 180-degree field of view, enabling them to take pictures of the entire sky from one horizon to the other. ASIs are used for cloud detection, the determination of Cloud Motion, and the determination of cloud height [13]. ASIs can also be linked to other equipment as well, such as ceilometers or pyranometers [9]. Solar irradiance forecasts that are made by using ASIs generally use the following approach: (1) take sky pictures near or at the forecast site, (2) use image-processing techniques to detect clouds in the picture, (3) determine Cloud Motion Vectors through linking clouds in consecutive images, and (4) use Cloud Motion Vectors to determine future cloud positions and estimate the future irradiance accordingly [2,9]. ASI-based methods are able to provide forecasts with a very high spatial and temporal resolution, compared to satellite-based methods. Therefore, they are very valuable for predicting high-frequency fluctuations or ramps in solar irradiance [9,11]. Methods based on ASIs generally outperform other methods on very short-term forecasts, i.e., up to 30 min [9]. They have proven to be useful for the management of solar thermal energy plants, the management of microgrids, scheduling storage-integrated PV systems, and the participation of PV and solar thermal electric (STE) plants in power grid operation [16].
Recent investigations have contributed to the advancement of ASI-based solar forecasting techniques. For instance, a study by Zhang et al. proposed a machine learning approach for Cloud Motion Vector estimation using ASI images, which showed promising results for improving short-term solar irradiance forecasts [17]. Furthermore, a study by Li et al. explored the integration of ASI data with deep learning models for accurate solar power forecasting in complex weather conditions [18].

2.3. Sensor Networks

While Sensor Networks often span over several hundred meters [19] or even kilometers [20], research on the use of low-cost illuminance meters showed that small networks can also detect cloud shadow movement when the sampling rate is high enough. Espinosa-Gavira et al. [21] used a network of 16 lux meters, spanning only 15 m by 15 m, that was able to detect cloud shadow movement. As a continuation of this research, Espinosa-Gavira et al. [22] also developed a method for deriving Cloud Motion Vectors from small Sensor Networks with promising results. While, to the best of the authors’ knowledge, no forecasting techniques have currently incorporated these methods, the findings underscore the significant utility of small-scale networks in supporting solar forecasting efforts. The research conducted by Elsinga and Van Sark [23] demonstrated how Solar PV systems themselves can be used as sensors. A total of 202 rooftop PV systems, spread over the province of Utrecht, the Netherlands, and spanning an area of roughly 1400 km2, were used to create a PV sensor field. By combining real-time power output measurements with the cross-correlation time lag between pairs of PV systems, a peer-2-peer forecast method for very short-term forecasts of up to 30 min was successfully developed.

2.4. Numerical Weather Predictions

The data obtained by Sensor Networks are limited to their location, and the resolution is limited by their dispersion. Numerical Weather Prediction (NWP) models have been developed to model conditions over large areas and can be used to generate input data for solar forecasting and can be used as an alternative to obtaining input data for solar forecasting. NWP models are based on physical modeling and generally are built on a set of differential equations describing physical and thermodynamical processes. These equations are numerically solved and have often been optimized to predict variables such as temperature, humidity, wind, and the probability of precipitation [2,11,13]. The input data for NWP models are obtained through direct, atmospheric measurements or satellite data [8].
NWP models can be divided into two categories: global and local. Global NWP models describe global weather patterns, whereas local NWP models describe weather restricted to a certain area, be it a country, a continent, or another bounded area [2,11]. Often, NWP models are combined with Model Output Statistics (MOS), which can help improve the forecast accuracy by about 10–15% [8,13]. Depending on the model used, NWP models have a spatial resolution typically ranging from 16 to 50 km and a temporal resolution of about 15 min [2,11]. NWP models are known to perform better than other methodologies for a time horizon from 6 h to about two weeks regarding the forecasting of atmospheric conditions and are therefore a valuable resource for generating input data [11,13]. However, due to the resolution of NWP models, it is not possible to resolve the small-scale physical processes that are related to cloud formation. Consequently, the prediction of cloud formation involves large uncertainties and errors. NWP models can, at best, give information on the probability of cloud formation through, for example, the determination of atmospheric saturation. As a result, stand-alone NWP models are often not sufficient for accurate irradiation prediction, but they provide a valuable resource for determining atmospheric conditions [11].
One of the recent developments is an emphasis on improving solar irradiation prediction by NWP models [13]. For example, Zhang et al. [24] researched the effect of postprocessing NWP model outputs for solar forecasting. However, when comparing their method to time series modeling and extrapolation techniques, they found only marginally small improvements. Nevertheless, when averaging the postprocessed NWP model output with the time series techniques, the performance proved to be superior to that of stand-alone techniques, highlighting the importance of using an ensemble of techniques for forecasting. Another current example is the work of Sabzehgar et al. [25]. They developed a method combining NWP models with Neural Networks to improve the forecasting irradiance and power output. The postprocessing of the NWP model output has also been proven to improve NWP forecasts significantly. Verbois et al. [26] demonstrated that by applying postprocessing, the RMSE of NWP models can be reduced by up to 30%. Verzijlbergh et al. [27] were able to obtain similar results by reducing the rRMSE (relative RMSE, see Section 4) by applying MOS to correct biases in the model.
Another recent development, sparked by the increase in computing power, is an increased interest in high-resolution atmospheric modeling. More specifically, Large Eddy Simulations (LES) are considered to be one of the most promising methods to increase the resolution of atmospheric modeling [28]. High-resolution NWP models based on LES have already shown promise in the development of large off-shore wind farms [29], and the potential of LES for the benefit of solar forecasting is being investigated [30]. A first attempt of LES for solar forecasting, based on MicroHH (a computational fluid dynamics code for the simulation of turbulent flows in the atmosphere) [31], has already been tested against NWP model results that are postprocessed by using a machine learning algorithm, hinting at the possibilities of LES [32].

2.5. Hybrid Approaches

The above-mentioned approaches are often combined in one way or another and then can be considered as hybrid approaches. They can be combined to tackle the weaknesses of one method or to enhance each other to increase accuracy and strength [2]. One recent example is the work conducted by Paletta et al. [33]. They combined All-Sky Imagery with satellite observations to investigate how these techniques can complement each other. They found that by combining these two data sources, clear-sky forecasts and long-term forecasts can be improved. Si et al. [34] also combined different sources of input. Satellite Images were used as input for a Deep Convolutional Neural Network. The output of the Neural Network was then combined with so-called “cloud factors”, which were derived from meteorological data and NWP data. The combined data were used as input for a multilayer perceptron to produce a forecast of solar irradiance, with good results.

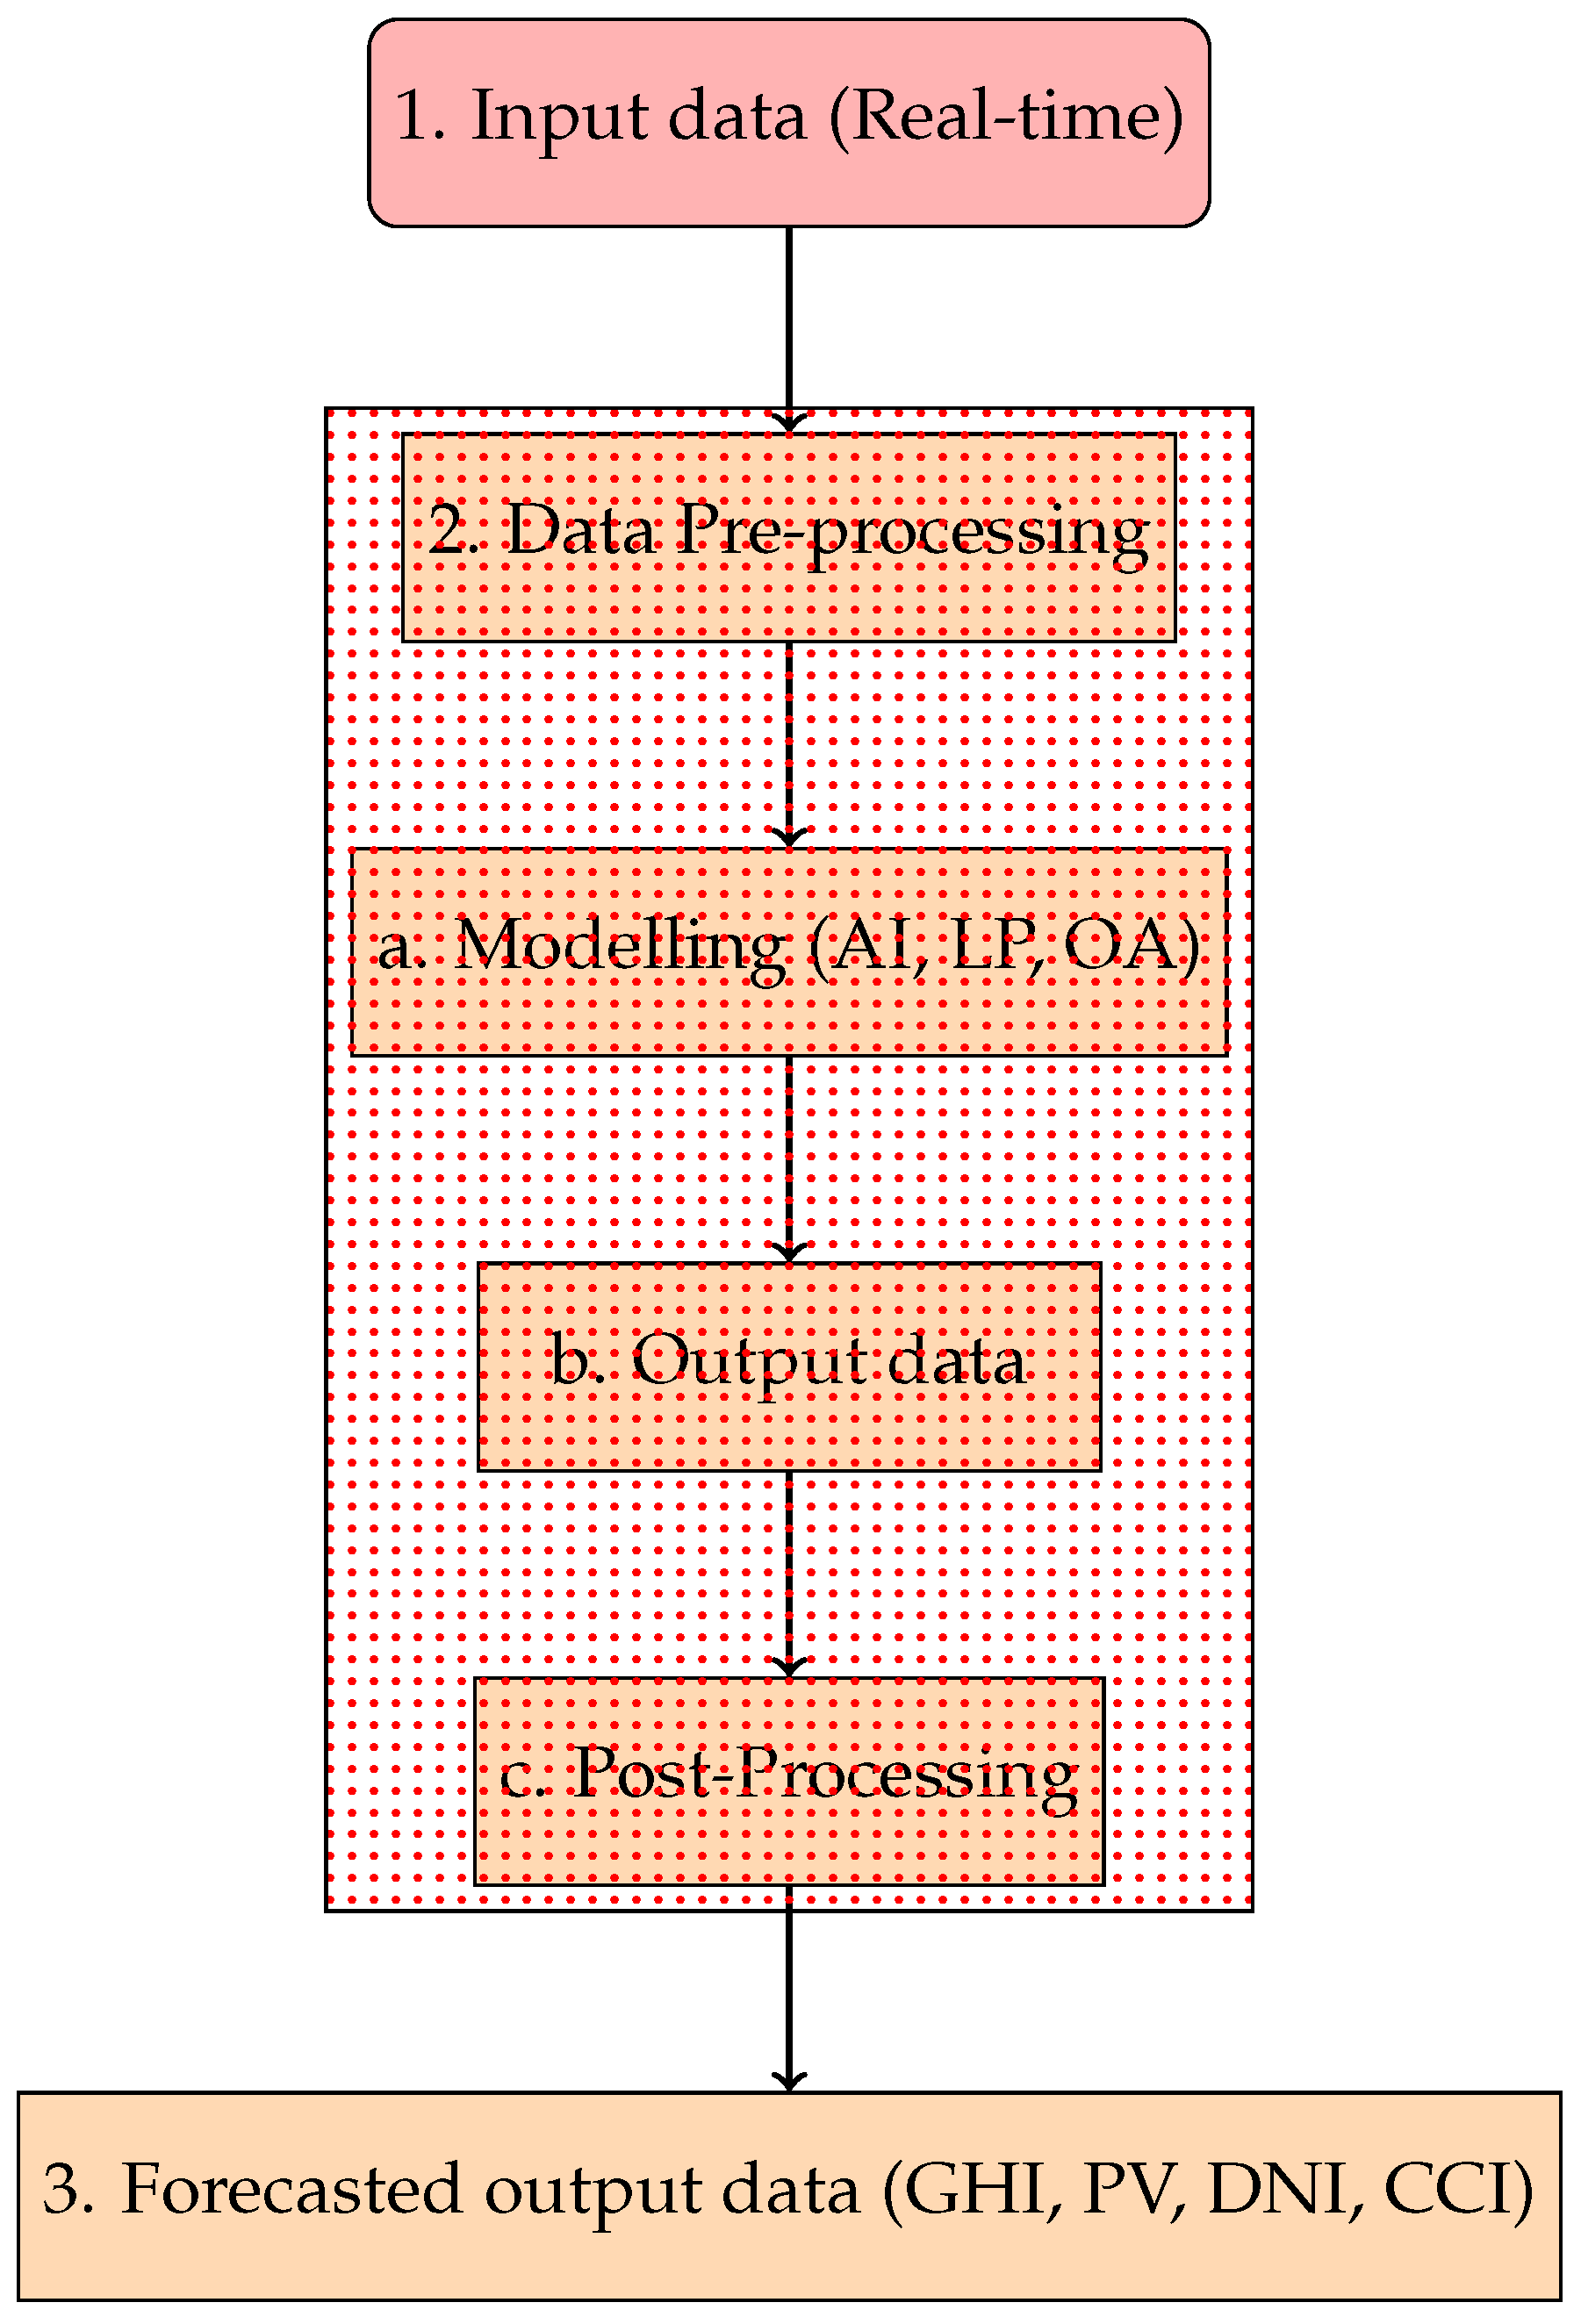
3. Artificial Intelligence and Solar Forecasting

It would be impossible to discuss solar forecasting methods while not mentioning Artificial Intelligence. A lot of research is already focusing on the use of AI for solar forecasting [2,8,13,35] and also for decision-support tools in different domains of the electricity grid [3]. The wide range of different applications that have been applied successfully by researchers highlights the versatility of AI techniques. For example, AI has been used to develop energy bidding tools [36]; perform day-ahead solar forecasting [37], wind speed forecasting [35], solar radiation estimation [2,8,13,35], the monitoring of fields of PV systems [38], fault detection, and the diagnosis of wind energy systems [5]; and demand load predictions [3].
It should be noted that there is no official definition of what AI is [11] and what techniques and methods are considered Artificial Intelligence. Instead, AI is often used as an umbrella term to describe a wide variety of techniques, including but not limited to machine learning, supervised learning, optimization algorithms, pattern recognition techniques, and regression methods. One of the main strengths of what are generally considered AI techniques is that they are able to solve complex problems for which it is impossible to find explicit algorithms or mathematical solutions [7]. Often, this includes pattern recognition in large datasets in which the underlying principles or dependencies are very complex or unknown. The recent increase in the usage of AI techniques has been facilitated by a rapid increase in computational power over the last decades [39].
One of the most frequently used AI techniques in solar forecasting, as seen in Figure 3b, and many other fields of research, is the Artificial Neural Network (ANN) [2,3,11,13,40]. The strength of ANNs is that they require a very low level of programming to solve a wide variety of complex problems. Specifically, nonlinear, stochastic, or mathematically ill-defined problems (e.g., pattern recognition or classification) are very well suited for ANNs [2,11,40,41]. Other popular techniques include the support vector machine [2,8,13], k-Nearest Neighbor algorithms [8,11], intelligent optimization algorithms [3], and Markov Chains [2,8,13]. Fuzzy Logic Control (FLC) has also been widely applied to control Solar PV systems and smart grids [3]. It makes it easy to use many input variables and to make use of the expert knowledge of human decision makers without the use of complex mathematical expressions [3,42].
A recent example of using AI methods for solar forecasting is the work conducted by Eseye et al. [43]. A data-driven approach was developed that employs a wavelet transform method, support vector machine, and particle swarm optimization to make predictions on the PV power output. The results were compared to seven other AI-based methods and proved to be competitive. This research also highlights the numerous methods already developed by using AI methods. Mishra and Palanisamy [44] developed a solar forecasting method built on Recurrent Neural Networks that was able to predict solar forecasts over a wide range of time horizons ranging from intrahour, hourly, to day-ahead scales using real-time inputs. Another example that showcases the possibilities of AI within solar forecasting is the method developed by Ge et al. [45]. They developed a method that only uses empirical data and AI, thus excluding the use of any physical model or empirical relationship while still being able to achieve similar results to more classical methods. Another method that has been gaining interest for nowcasting is the General Adversarial Network (GAN) method, which has already proven to be able to forecast precipitation with high precision [46], improve time series Satellite Image prediction [47], and perform sky image forecasting [48]. For further reading on AI techniques, refs. [8,11] are recommended.

4. Assessment of Forecasting Methods

Depending on the equipment and input data used, the methods that are applied can vary to a great extent. For the further development and validation of solar forecasting techniques, it is important to consider how to assess and compare the performance of these different methods. Most often, conventional metrics are used since they give a general overview of the global performance. However, it is very difficult to directly compare methods based on the results of these metrics alone. These metrics need to be interpreted in a correct manner since the performance of a forecasting method is dependent on various factors such as the spatial and temporal resolution of the input data, time of year, percentage of clear-sky days in the dataset, location, forecast horizon, etc. [2,7]. And at the same time, the end-user of the forecast also plays an important role in determining the requirements for a useful forecasting method [9].

4.1. Common Performance Metrics for Solar Forecasting

The predicted values of solar forecasting methods and their accuracy are generally expressed as either irradiance (W/m2) or solar power output (kW) [2]. The most commonly used statistical metrics to assess the accuracy of the forecast are described below very briefly [2,7,9]:
  • Root Mean Squared Error (RMSE): This quantifies the average magnitude of the errors between the predicted values and actual observed values. The RMSE is particularly useful because it not only considers individual errors but also gives more weight to larger errors, providing a comprehensive measure of prediction accuracy. A lower RMSE indicates that the predicted values are closer to the actual observed values, suggesting better prediction accuracy:
    RMSE = 1 N i = 1 N ( I Forecast I Measurement ) 2
  • Mean Absolute Error (MAE): This calculates the average difference between the predicted and observed values. It is an easy-to-understand metric that gives an idea of the accuracy of predictions. Unlike the RMSE (Root Mean Squared Error), which amplifies larger errors due to the squaring process, the MAE gives equal importance to all errors, regardless of their size. As a result, each error has an equal impact on the MAE:
    MAE = 1 N i = 1 N I Forecast I Measurement
  • Mean Bias Error (MBA): This calculates how much the predicted values differ from the actual values. It tells us if a predictive model tends to overestimate or underestimate the actual values consistently. Unlike other error metrics that take into account the size of the errors, the MBE only looks at the direction of the errors, whether they are positive (overestimations) or negative (underestimations):
    MBE = 1 N i = 1 N ( I Forecast I Measurement )
  • Relative RMSE (rRMSE): This is a normalized version of the RMSE that takes into account the magnitude of the actual values when assessing the predictive accuracy of a model. It helps to evaluate a model’s performance in relation to the data’s variability, which is especially helpful for data with different scales or units:
    rRMSE = RMSE 1 N i = 1 N I Measurement 2
Next to these statistical metrics, the Forecast Skill (FS), also known as the Performance Skill (PS) or Forecast Skill Score (SS), is often used to evaluate the forecast. It allows the user to compare the developed forecasting method against a reference method [7,9]. Another metric that is being applied to solar forecasting is the Continuous Ranked Probability Score (CRPS). The CRPS measures the sharpness and reliability of the forecast and rewards a high concentration of the forecasted probability around the target value [2,9]. The CRPS is given by the following equation where F ( x ) and F ^ ( x ) are defined to be the Cumulative Distribution Function (CDF) of the probabilistic forecast and the actual measurement, respectively:
C R P S = 1 N i = 1 N ( F i ( x ) F ^ 1 ( x ) ) 2 d x
The above-mentioned metrics are only the most commonly used metrics. For further reading on the different metrics that are used, we refer to [2,7,9].

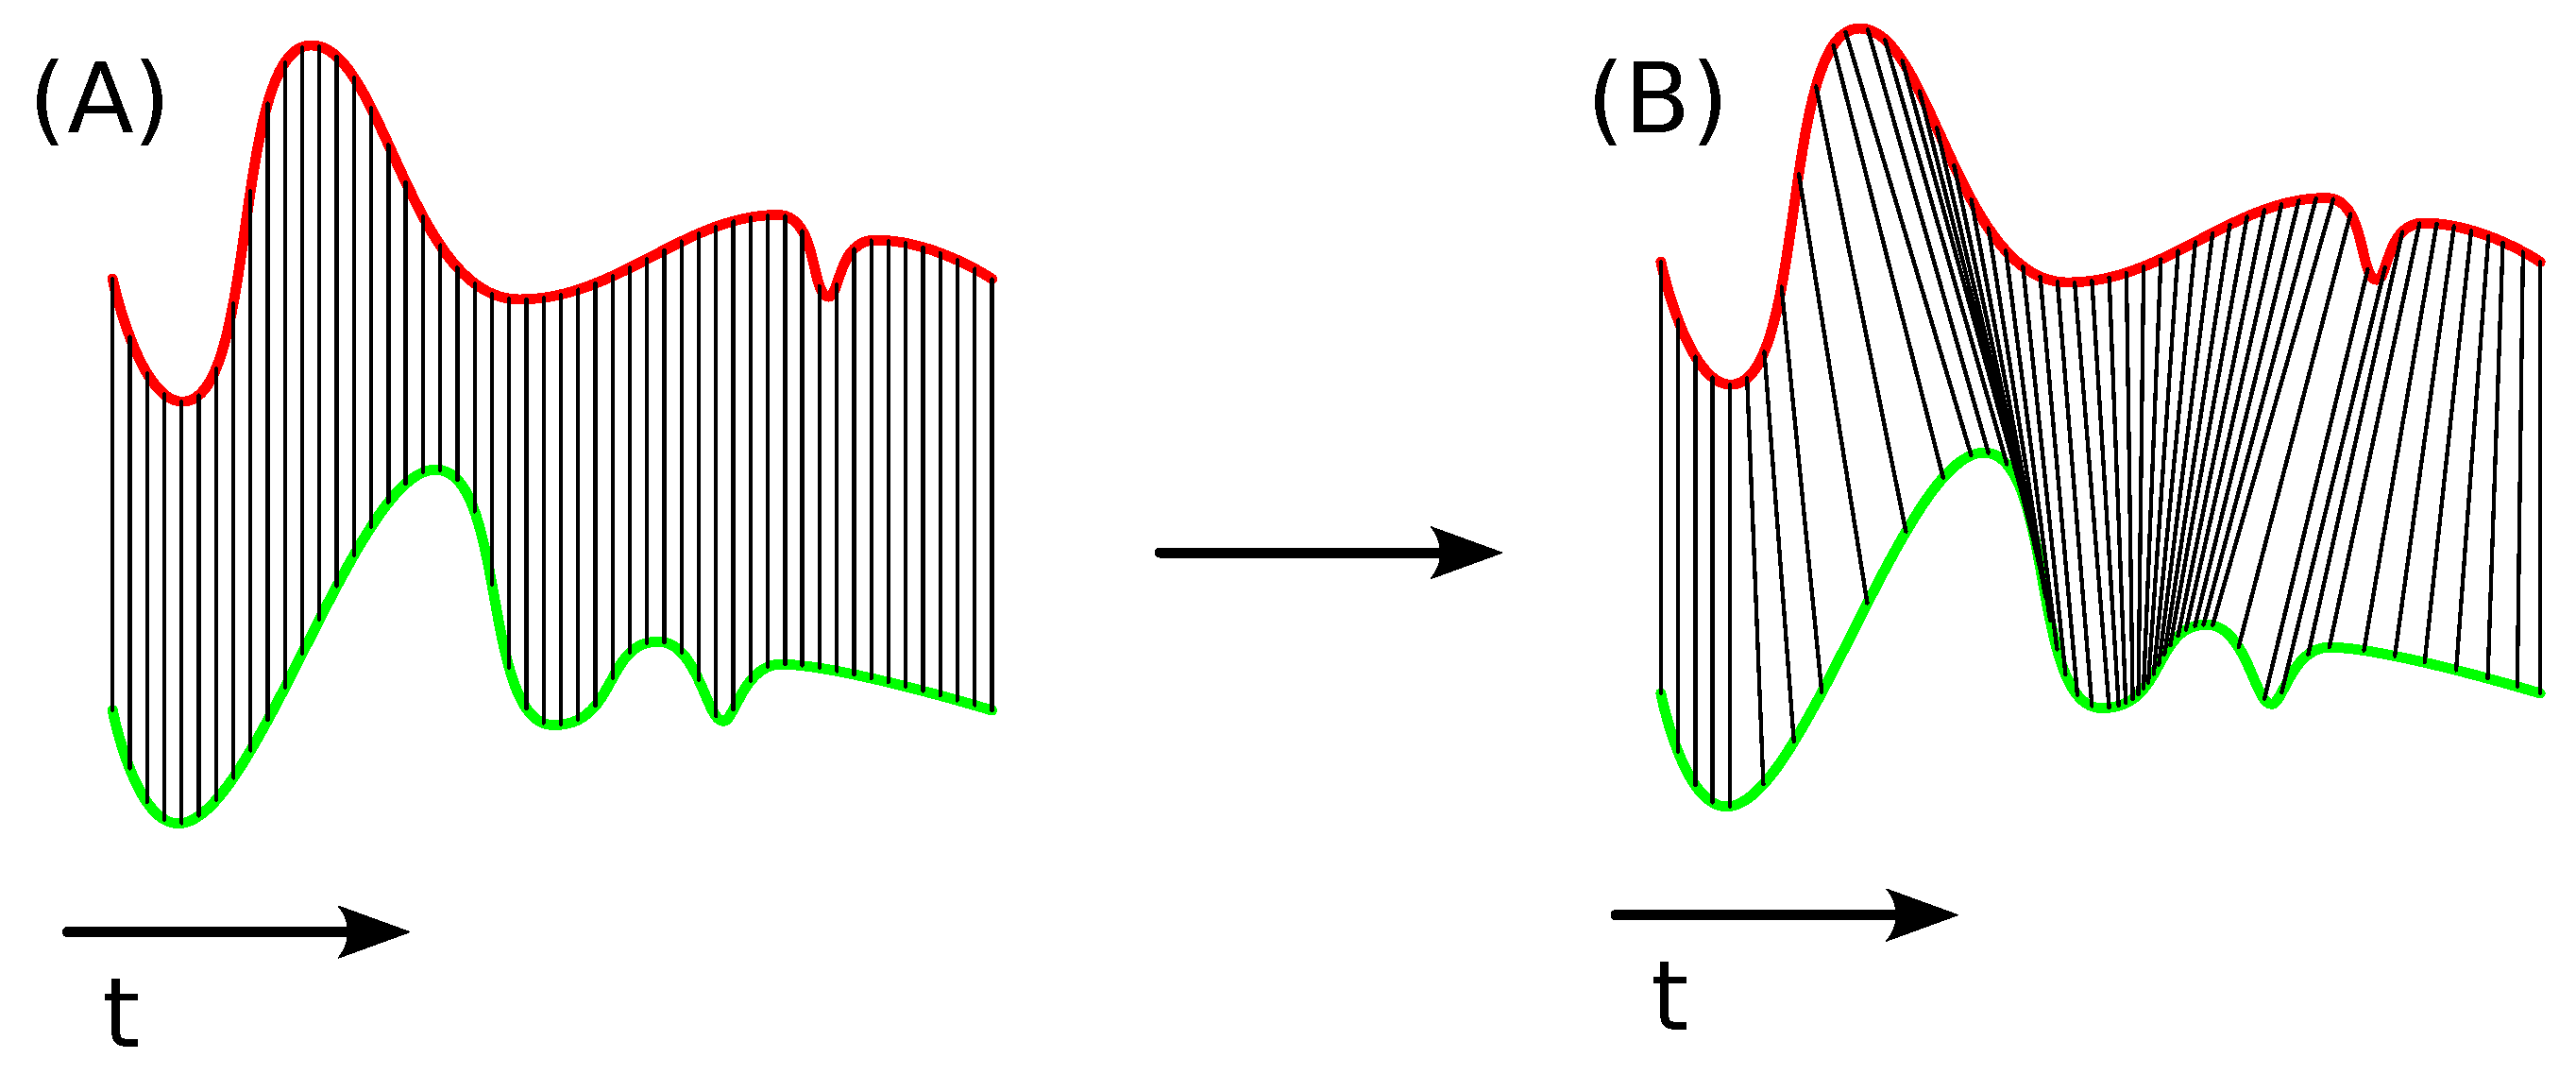
4.2. Assessment of Ramp Events and Timing Errors

When assessing ramp events and timing errors in solar energy forecasting, the focus is particularly on the Temporal Distortion Index (TDI) and its extension, the Temporal Distortion Mix (TDM). This approach encompasses using the time derivative of the normalized global horizontal irradiance (GHI) for ramp event detection and classification.
Depending on the application of the forecast, the most appropriate performance metrics should be used. The metrics mentioned before are well suited for determining average errors. However, they are not well suited for measuring the accuracy of predicting ramp events [7,9,33]. There is no strict definition of a ramp event, as it often depends on the end-use, whereby the events are critical [49]. Ramp events can be described as sudden and significant changes in the irradiance or power output. An example of a ramp event could be a sudden drop in the irradiance due to a passing cloud. However, these events can be major concerns for certain end-users, such as network operators or large PV plant operators, and can be of great interest for short-term to medium-term forecasts [7,9]. And even though the forecasting of ramp events is of great importance for many applications, there is only relatively little research focused on this area [49].
A couple of methods have already been proposed to measure the ability to forecast ramp events. The first to discuss would be the swinging door algorithm. Formally, this algorithm is not a metric, but it can be used to detect ramp events. It was proposed back in 1990 for data compression [50]. The swinging door algorithm splits a signal up into segments. The starting point of that segment can be seen as the pivot point of a swinging door as a threshold is chosen to determine how far the door can swing. If the starting point of the next segment is within the swinging doors’ range, there is no ramp event. If it is outside of this range, a ramp event is detected [51]. It has been suggested and applied to detect energy ramps in historical wind and solar-energy-production data [52], and further research has already been performed to optimize the algorithm for the detection of wind energy ramps [51,53,54].
Another metric that has been introduced to measure timing errors, which are critical for the detection of ramp events, is the Temporal Distortion Index (TDI), which is based on Dynamic Time Warping (DTW) [55]. This metric was first introduced by Sakoe and used as a time-normalization algorithm for spoken word recognition during the 1970s [56,57]. A straightforward method to explore the time alignment of two signals involves matching each data point in signal 1 with its corresponding data point in signal 2 and then evaluating their similarity. However, by warping the time index of signal 2, the data points in signal 2 can be optimally aligned to the data points in signal 1. This concept is visualized in Figure 4. The TDI gives a measure of the amount of time warping needed to align the two signals, thus giving a measure of the temporal error of the second signal. A complete description of this metric is outside the scope of this review. The reader is referred to [55], where a complete methodology for using the TDI is described.
Continuing the TDI method introduced by the authors of [55], a method was developed to split up the TDI into two parts, giving a score of how much the forecasted signal is advanced (or early) and how much of the signal is late [7]. This metric is called the Temporal Distortion Mix (TDM), expressed as a percentage ranging from −100% to +100%, which indicates that the signal is early or late, respectively [7]. This new metric was combined with a ramp score based on the swinging door algorithm and complemented with a complete procedure to determine the quality of a forecast [7].
Another method, focusing on the detection of ramp events, was developed by [49]. The time derivative, over a specified time horizon D, of the normalized GHI is used to determine the Ramp Rate. In this case, ϵ is the maximum, which is the clear-sky GHI at the top of the atmosphere for the day under consideration:
R a m p R a t e ( t , D ) = d ( n G H I ) d t = n G H I ( t + D ) n G H I ( t ) D
n G H I = G H I ϵ
Based on measurements from a clear day, a threshold for detecting which events should be counted as ramp events is derived. This threshold states that on a clear day, 99% of the derivatives of the measurements should lie below this threshold. The benefit of this method is its relative simplicity. Current research focuses on the relation between D and the threshold limit and the recall and precision of ramp event forecasting [58]. Based on a confusion matrix, recall and precision are defined as in Table 1.
R e c a l l = T r u e P o s i t i v e T r u e P o s i t i v e + F a l s e N e g a t i v e
P r e c i s i o n = T r u e P o s i t i v e T r u e P o s i t i v e + F a l s e P o s i t i v e

4.3. Confidence Intervals and Ranges in Solar Forecasting Studies

Based on the compiled information from various solar forecasting studies presented in Table 2 (see Section 4), we can draw some overall conclusions regarding the confidence intervals and ranges of different error metrics. It is important to note that these conclusions are based on the provided information and should be interpreted with caution as the actual confidence intervals may vary across individual studies.
The RMSE values vary depending on the forecast horizon, ranging from 115.6 W/m2 for a 10 min horizon to ranges between 8.64 and 49.1 for longer forecast horizons. The exact ranges are not specified for certain forecast horizons. Additionally, specific values are given for selected time intervals. The RMSE for a 1 h ahead forecast ranges from 79 to 100 W/m2.
The MAE ranges between 6% and 7.5%, indicating the average magnitude of errors. For specific forecast horizons, the MAE is reported as 70 W/m2 for a 5 min ahead forecast. The MAPE for the NN irradiance forecast is 0.95%, while the MAPE for the NN power production forecast is 45.3%.
The relative RMSE ranges from 6.7 to 39.8%, providing a measure of error relative to the predicted value. Clear days with a clear sky as Class 1 exhibit lower rRMSE values, with partially cloudy days reaching as low as 4.7% and 7.6%, while cloudy days (Class 3) show higher rRMSE values in the range of 30–50%.
The FS varies across studies, with reported values ranging from 2% to as high as 66%. The CRPSS improvement is above 2.7% in some cases, indicating the enhanced performance of forecasting models. Furthermore, an optimized model shows a skill score improvement of 21% compared to the previous Cloud Motion Vector (CMV) model [59].
These conclusions provide valuable insights into the wide array of error metrics utilized in solar forecasting studies, allowing researchers and practitioners to gain a comprehensive understanding of the accuracy and performance of forecasting models. By delving into these studies, stakeholders can deepen their knowledge of the advancements made in solar forecasting, leading to enhanced reliability in predicting solar energy outcomes.
Table 2. AI-techniques-based common error metrics.
Refs.DescriptionInputMethodologyOutputHorizonRes.MetricsAccuracy
[60]Development of a predictive model for solar irradiance involving Data Transformation, Distribution Estimation, and Confidence Interval Analysis, with a focus on appropriate Data Window selectionGHI, temperature, humidity, and cloudiness (from JMA’s GPV-MSM System), extraterrestrialSVR-based hourly irradiance prediction at 42 locations in JapanGHI (W/m2)≤9 h1 hConfidence level α N.A.
[61]Forecasting PV power output for 24 h and 48 h horizons, leveraging comprehensive weather data across GermanyPV power data (from aggregated German data) and NWP data (NOAA’s GFS)Convolutional Neural Network and Long Short-Term Memory Network for PV power predictionPV power output (MW)≥1 day3 hRMSE, MAERMSE = 1949 MW, nRMSE = 4.73%
[62]Developing a short-term forecasting system for DSSI by using Cloud Motion Vectors and radiative transfer models, covering a large area with high resolutionCloud Optical Thickness Data (from SEVIRI on MSG Satellite) and Cloud Motion VectorsOptical Flow Estimation and fast radiative transfer models for forecasting DSSIDownwelling surface solar irradiation (DSSI)≥3 h15 minRMSE, forecast variability 0.9 correlation 0.5 , DSSI uncertainty: 18 % uncertainty 34 % , overall uncertainty: 30 % uncertainty 43 %
[63]Enhancing CSI forecasting with a focus on postprocessing by using Neural Network Models and evaluating the performance against benchmark methodsGround-based data, SURFRAD, satellite-derived data, NSRDBFocal and spatial postprocessing of CSI forecasts using Neural NetworksCSI, GHI≥30 min1 min, aggregated to 30 minSS, CRPSCRPSS as high as 66%
[64]Comparing STVAR and CMV models for short-term forecasting of GHI by using satellite data, particularly in the varied microclimates of the Caribbean IslandsSatellite-derived irradiance data from SUNY modelSTVAR model with input variable selection, CMV model, and blending forecastsGHI (W/m2)≥1 h (20 × 20 km2)1 h, 0.1° for latitude and longituderRMSE, rMAE, SSClear days: low variability; high orography: rRMSE 30 % ; cloudy days: 30 % rRMSE 50 %
[65]Combining deep LSTM network with satellite-derived GHI data for short-term forecasting in MoroccoGround measured data, satellite-derived datasetDeep LSTM network, Grid Search, Xgboost, RF, SVRGHI (W/m2)≥1 h1 hRMSE, MAE, R 2 0.848 R 2 0.916 ; highest R 2 = 0.916 , RMSE = 0.28 , MAE = 0.17
[66]Detecting real-time Cloud Obstruction and forecasting Clearness Sky Index in short intervals by using satellite data and machine learning techniquesMeteorological satellite data (from MSG’s SEVIRI), Cloud Classification (from SAFGEO)Machine learning models for short-term forecasting of GHI, including SHLNN, DHLNN, RFGHI (W/m2)≥15 min7–8 minCumulative Error, Performance AccuracyHighest Accuracy = 84.2%, Lowest Accuracy = 72.5%
[67]Developing a hybrid forecasting tool by using satellite remote sensing data and time series modelsGeostationary satellite data, Daily Mean SISARMA, NAR-NN, DES, Kriging InterpolationSolar power output (W/m2)≥3 days1 dayR, RMSE, MAPEDES method: RMSE = 13.4, SD = 3.83, R = 0.88
[68]Developing a minute-level solar irradiance forecasting model by establishing a relationship between Cloud Pixels and irradiance, aimed at improving PV power output forecastingSky images, irradiance data from ESRL NOAA’s Wasco Power StationBPNN and SVM training models for irradiance forecasting, ARIMA for comparisonIrradiance (W/m2)≥10 min1 minMAPE, RMSE, MBEBlocky Clouds: MAPE 22.66 % , Thin Clouds: MAPE 20.44 % , Thick Clouds: MAPE 18.82 %
[9]Technoleconomical analysis of 12 different methods operating in agreement with market conditionsNWP (ECMWF), PV production from a fleet of 152 PV systemsSupervised learning model, support vector regression, deep learning, physical-based techniquesPV power outputDay ahead1 dayMAE, RMSE, MBE, ER6% < MEA < 7.5% Random Forest Regression performs best with a score of 6.13%. The PV model has the highest ER
[19]A spatiotemporal PV power nowcasting method with Predictor Preselection for Grid Control considering different scenarios with Interpolated Cloud Information. The feasibility is evaluated by using a Real Sensor Network I S C from Reference Solar CellsThe most fitting correlations for tracking shadow movements and forecasting are through Elastic Net Regularization, a regression-based methodPV power output≥5 min1 snRMSE, nMPAE, SSnRMSE = 2.30, nMPAE = 3.95, SS = 0.02
[26]Enhancing day-ahead hourly irradiance forecasting in Singapore, integrating the Weather Research and Forecasting (WRF) model with Statistical Learning Techniques compared with the Global Forecasting System (GFS)GHI (from SERIS), WRF model in three configurationsCombination of three NWP forecasts with a postprocessing procedure involving PCA and stepwise variable selectionGHI (W/m2)≥1 day1 hRMSE, MAE, MBE, nRMSE, nMAE, nMBE169 < RMSE < 182

5. Current Research—An Overview

The focus of this review is on research publications of the last five years; thus, this review focuses on research published from 2018 to the time of writing (2023). The search engine “Google Scholar” was used to find the research papers. Different search terms were used separately from each other to obtain an indicative view of trends in solar forecasting publications. These search terms were based on the methods that are generally used to obtain input data. An extra search term, based on the presence of AI within the research field, was used as well to include these techniques too. The search terms used were (1) “Solar Forecasting”, (2) “Solar Forecasting All Sky Camera”, (3) “Solar Forecasting Satellite”, (4) “Solar Forecasting Numerical Weather Prediction”, (5) “Solar Forecasting Sensor Networks”, and (6) “Solar Forecasting Artificial Intelligence”. For each search term, the first 50 results were considered in addition to those in Table 2, the relative frequency of different data resources Table 3, then various application of AI techniques is presented in Table 4, Table 5, Table 6 and Table 7. In addition to these publications, some additional publications that were considered to be valuable based on expert knowledge were added too.
To illustrate some of the research trends that are happening in the field of solar forecasting, Figure 5 and Figure 6 show the number of publications associated with each search term for the period 2012 to 2022. The year 2023 was excluded since this year was ongoing at the time of writing. The approach used was to insert one of the search terms into Google Scholar, filter on one specific year, and then iterate over the period of ten years. The amount per year was summed to determine the total amount of publications for that period. Interestingly, when inserting one of the search terms with a filter set to the period of ten years to determine the total amount of publications in one go, the returned amount of publications differed significantly from the amount obtained by summing the separate years together. This indicates that Google Scholar probably uses a certain kind of algorithm to present the most relevant results depending on the filters and search terms applied. This serves as an extra reminder that the trends found are only indicative.
The overarching search term (1) “Solar Forecasting” returns 270,100 results when all the years are summed. Naturally, the other “better specified” search terms return fewer results. The distribution of publications, based on the search term, can be found in Figure 5. Here, we can see that search term (4) “Solar Forecasting Numerical Weather Prediction” returns significantly more results than the other, better-specified search terms. While All Sky Cameras receive specific attention from the IEA-PVPS through their Task 16 project (subtask 3) [69], showcasing their importance for solar forecasting, there are relatively few publications compared to the other methods. Figure 6 shows a graph illustrating the number of publications per year per search term. For all search terms, we can see an increase in the amount of publications. More specifically, there was a strong increase in publications found by using the search term (6) “Solar Forecasting Artificial Intelligence” over the last few years, indicating the importance of Artificial Intelligence techniques for the field of solar forecasting. Figure 7 shows the number of publications returned for search terms (2)–(6), normalized to the amount of returned results from the overarching search term (1) “Solar Forecasting”. By showing the relative amount of publications to the total amount of publications, it becomes possible to see how the interest in specific subjects is distributed within the field of research. Figure 7 shows how research on solar forecasting predominantly used Numerical Weather Prediction at the start of the considered period in 2012. Over time, the reliance on Numerical Weather Prediction seems to decrease, whereas the use of Artificial Intelligence seems to increase.
The above-mentioned search method resulted in a comprehensive set of publications revolving around the development of solar forecasting techniques. To summarize the ongoing research, Table 2, Table 3, Table 4, Table 5, Table 6 and Table 7 were created. These tables summarize, per publication, the most important methods that were used to create the forecasts and the relative frequency of the data sources. The table also includes, where applicable, details on the forecasting accuracy and error of the developed method.

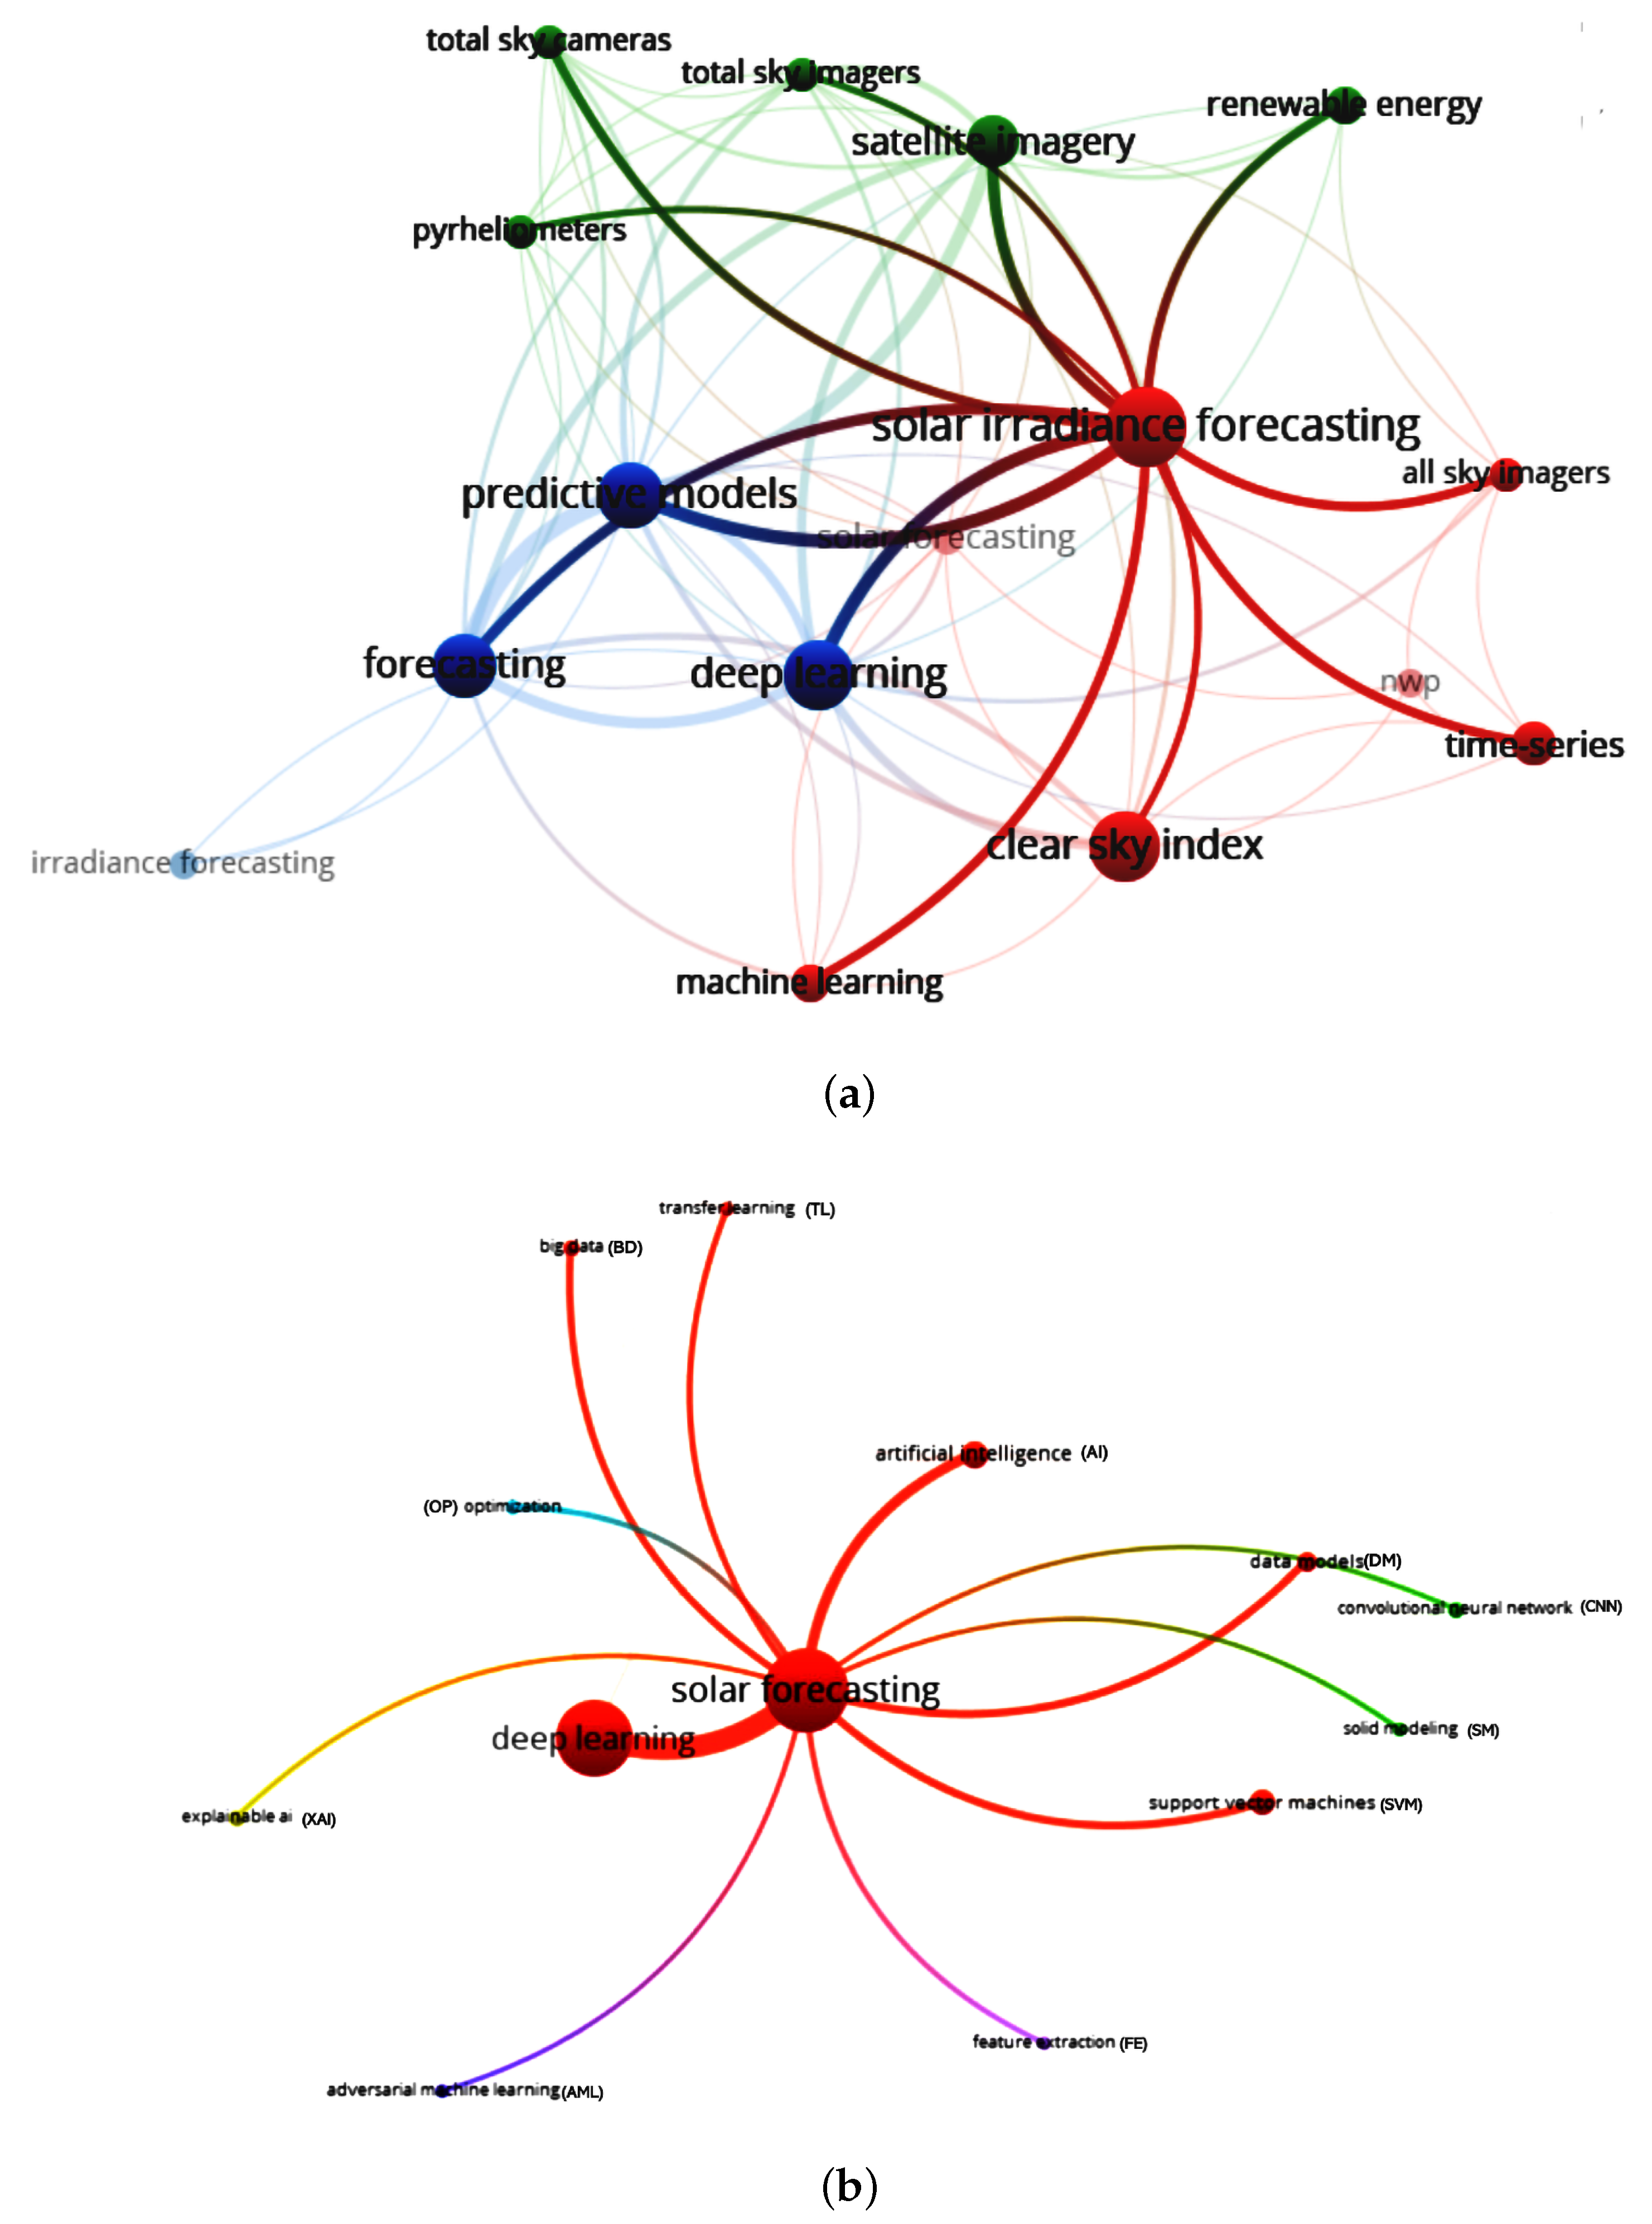
5.1. Analysis of Current Research

Based on Table 2 and Table 4, Table 5, Table 6 and Table 7, the current trends and practices in the field of solar forecasting were identified and will be discussed below. This discussion will include an analysis of data resources, an analysis based on the time horizon, the prevalence and usage of AI techniques, the effect of weather conditions based on forecasting location, and a discussion on which error metrics are used to assess solar forecasting techniques.

5.2. Data Resources

Data resources delve into the diverse data sources and methods employed in solar forecasting, ranging from Satellite Imagery and Numerical Weather Predictions (NWPs) to ground-based measurements and open-access data, as presented in Table 5. These varied inputs are crucial to accurately capture meteorological parameters and solar irradiance, thereby enhancing the precision of solar forecasting models.
To gather the cloud cover information, sky conditions, and other meteorological parameters, Satellite Images from various satellites, including EUMETSAT’s Meteosat, FengYun-4A, and MSG SEVIRI, are utilized [16,33,37]. NWPs from organizations such as ECMWF and NOAA play a significant role by providing data on atmospheric conditions, including cloud cover and temperature [33,37,44]. Ground-based measurements using pyranometers, pyrheliometers, and irradiance sensors directly measure the solar irradiance or power output, serving as crucial reference data for model validation and evaluation [44]. Some studies validate and verify solar forecasting models by utilizing data from PV systems or solar power plants, which provide actual power generation values based on solar irradiance [16]. Additionally, sky cameras and ceilometers capture the localized cloud cover, cloud base height, and sky conditions, offering valuable supplementary data for solar forecasting models [33]. The relative frequency of the data sources that are used is summarized in Table 3. Certain studies employ numerical models like the Weather Research and Forecasting model (WRF) to simulate atmospheric conditions and integrate them with other data sources to generate solar irradiance predictions [19]. Several articles highlight the use of open-access data sources, such as open-source datasets, publicly available Satellite Images, and meteorological data from organizations like NREL and NSRDB [19,70]. It is important to note that the analysis presented is based on the provided information, and the actual techniques used in each study may vary. Furthermore, some articles may employ a combination of techniques or integrate multiple data sources to achieve more accurate solar forecasting.
Table 3. The relative frequency data sources used for solar forecasting.
Source of DataGround-Based DataSatellite ImagesASI images
Frequency9, e.g., [63,71]9, e.g., [72,73,74]14, e.g., [16,33,75]
Table 4. AI-techniques-based solar nowcasting techniques.
Refs.DescriptionInputMethodologyOutputHorizonRes.MetricsAccuracy
[33]Integrating ASI and Satellite Imagery for Cloud AnalysisSolar irradiance, ASI images, Satellite ImagesDeep learning architecture based on ECLIPSEGHI≥60 min10/30 minFS (%), CRPS, RMSE (W/m2)115.6 < RMSE < 134.9 and 19.9 < FS < 23.3
[44]A unified architecture for multi-time-horizon predictions for short- and long-term solar forecastingNWP (NOAA’s SURFRAD), GDSI, GHIRecurrent Neural Networks; bird model is used to calculate clear-sky GHIGDSI≥4 h1 hRMSE8.64 < RMSE < 41.7 for 1 h and 10.7 < RMSE < 49.1 for 4 h for specified time horizons. For multitime horizons, 6.7 < RMSE < 39.8
[70]Solar Radiance Prediction Model Based on Long Short-Term MemorySolar irradiation from the US National Solar Radiation Data Base (NSRDB)Long Short-Term Memory (Neural Network), Empirical Mode Decomposition (Signal Processing)Hourly solar irradiation1, 2, 6, and 12 h, and 1 day60 minRMSE (Wh/m2), MAPEFor 1 h ahead, 35 < RMSE < 60 ; for 1 day ahead for LTSM-Truncated model: RMSE 90 ; and for EMD-LTSM-Truncated model: RMSE 80
[19]A spatiotemporal PV power nowcasting method with Predictor Preselection for Grid Control considering different scenarios with Interpolated Cloud Information. The feasibility is evaluated by using a Real Sensor Network I S C from Reference Solar CellsThe most fitting correlations for tracking shadow movements and forecasting are through Elastic Net Regularization, a regression-based methodPV power output≥5 min1 snRMSE, nMPAE, SSnRMSE = 2.30, nMPAE = 3.95, SS = 0.02
[20]Learned Forecasting Irradiance Model adaptive to Local Cloud ConditionsSolar irradiance (from a network of 25 sensors)A local vector autoregressive model (LVAR)GHI≥5 min1 minRSME, MAE, FSRMSE = 110 W / m 2 , MAE = 70 W / m 2 , FS = 0.16
[76]Developing a Localized GHI Forecasting Model based on sky images, incorporating Cloud Motion, Thickness, and Elevation for improved accuracy and mitigating Solar PV variabilitySky images for CBH Estimation and irradiance values for onsiteBlue sky area separation method, filtering, and correlation analysis for GHI predictionGHI (W/m2)≥1, 5, and 15 min1 minRMSE, MAE, SF81% accuracy for 1 min interval, RMSE: 101 W/m2, MAE: 64 W/m2, SF: 0.26 for 15 min
[63]Enhancing CSI forecasting with a focus on postprocessing by using Neural Network Models and evaluating the performance against benchmark methodsGround-based data, SURFRAD, satellite-derived data, NSRDBFocal and spatial postprocessing of CSI forecasts by using Neural NetworksCSI, GHI≥30 min1 min, aggregated to 30 minSS, CRPSCRPSS as high as 66%
[68]Developing a minute-level solar irradiance forecasting model by establishing a relationship between Cloud Pixels and irradiance, aimed at improving PV power output forecastingSky images, irradiance Data from ESRL NOAA’s Wasco Power StationBPNN and SVM training models for irradiance forecasting, ARIMA for comparisonIrradiance (W/m2) 10 min1 minMAPE, RMSE, MBEBlocky Clouds: MAPE 22.66 % , Thin Clouds: MAPE 20.44 % , Thick Clouds: MAPE 18.82 %
Table 5. AI-techniques-based data resources.
Refs.DescriptionInputMethodologyOutputHorizonRes.MetricsAccuracy
[33]Integrating ASI and Satellite Imagery for Cloud AnalysisSolar irradiance, ASI images, Satellite ImagesDeep learning architecture based on ECLIPSEGHI≥60 min10/30 minFS (%), CRPS, RMSE (W/m2)115.6 < RMSE < 134.9 and 19.9 < FS < 23.3
[16]Extending the nowcasting horizon of ASI-based solar radiation predictionsASI images, cloud base height, GHI, DNI, MSG SEVIRI (EUMETSAT), HRV imagesThresholding algorithm for cloud detection in images, Deep Flow algorithm for Cloud Motion Vectors, Atlas (ESRA) clear-sky irradiation modelGHI, DNI, PV power output≥90 min1 minMAE, RMSE, FS 200 < RSME GHI < 300 , 250 < RSME DNI < 400 for both ASI and satellite. RSME CF 2.1 %
[9]Technoleconomical analysis of 12 different methods operating in agreement with market conditionsNWP (ECMWF), PV production from a fleet of 152 PV systemsSupervised learning model, support vector regression, deep learning, physical-based techniquesPV power outputDay ahead1 dayMAE, RMSE, MBE, ER6% < MEA < 7.5% Random Forest Regression performs best with a score of 6.13%. The PV model has the highest ER
[44]A unified architecture for multi-time-horizon predictions for short- and long-term solar forecastingNWP (NOAA’s SURFRAD), GDSI, GHIRecurrent Neural Networks; bird model is used to calculate clear-sky GHIGDSI≥4 h1 hRMSE8.64 < RMSE < 41.7 for 1 h and 10.7 < RMSE < 49.1 for 4 h for specified time horizons. For multitime horizons, 6.7 < RMSE < 39.8
[70]Solar Radiance Prediction Model based on Long Short-Term MemorySolar irradiation from the US National Solar Radiation Data Base (NSRDB)Long Short-Term Memory (Neural Network), Empirical Mode Decomposition (Signal Processing)Hourly solar irradiation1, 2, 6, and 12 h and 1 day60 minRMSE (Wh/m2), MAPEFor 1 h ahead, 35 < RMSE < 60 ; for 1 day ahead for LTSM-Truncated model: RMSE 90 ; and for EMD-LTSM-Truncated model: RMSE 80
[19]A spatiotemporal PV power nowcasting method with Predictor Preselection for Grid Control considering different scenarios with Interpolated Cloud Information. The feasibility is evaluated by using a Real Sensor Network I S C from Reference Solar CellsThe most fitting correlations for tracking shadow movements and forecasting are through Elastic Net Regularization, a regression-based methodPV power output≥5 min1 snRMSE, nMPAE, SSnRMSE = 2.30, nMPAE = 3.95, SS = 0.02
Table 6. AI-techniques-based solar radiation components.
Refs.DescriptionInputMethodologyOutputHorizonRes.MetricsAccuracy
[16]Extending the nowcasting horizon of ASI-based solar radiation predictionsASI images, cloud base height, GHI, DNI, MSG SEVIRI (EUMETSAT), HRV imagesThresholding algorithm for cloud detection in images, Deep Flow algorithm for Cloud Motion Vectors, Atlas (ESRA) clear-sky irradiation modelGHI, DNI, PV power output≥90 min1 minMAE, RMSE, FS 200 < RSME GHI < 300 , 250 < RSME DNI < 400 for both ASI and satellite. RSME CF 2.1 %
[76]Developing a Localized GHI Forecasting Model based on sky images, incorporating Cloud Motion, Thickness, and Elevation for improved accuracy and mitigating Solar PV variabilitySky images for CBH Estimation and irradiance values for onsiteBlue sky area separation method, filtering, and correlation analysis for GHI predictionGHI (W/m2)≥1, 5, and 15 min1 minRMSE, MAE, SF81% accuracy for 1 min interval, RMSE: 101 W / m 2 , MAE: 64 W / m 2 , SF: 0.26 for 15 min
[20]Learned Forecasting Irradiance Model adaptive to Local Cloud ConditionsSolar irradiance (from a network of 25 sensors)A local vector autoregressive model (LVAR)GHI≥5 min1 minRSME, MAE, FSRMSE = 110 W / m 2 , MAE = 70 W / m 2 , FS = 0.16
[63]Enhancing CSI forecasting with a focus on postprocessing by using Neural Network Models and evaluating the performance against benchmark methodsGround-based data, SURFRAD, satellite-derived data, NSRDBFocal and spatial postprocessing of CSI forecasts by using Neural NetworksCSI, GHI≥30 min1 min, aggregated to 30 minSS, CRPSCRPSS as high as 66%
[77]Improving solar-energy-forecasting accuracy by using LSTMNOAA’s GEFS, NSRDB, CAMS, AMS competition dataLSTM, FFNN, GBRForecast Errors, GHI≥1 month3 hRSME, MAE, FSSignificant RMSE improvement over other models by 60%
[78]Creating SolarNet, a Deep CNN Model, for 1-Hour-Ahead GHI forecasting by using sky images, focusing on learning Latent Patterns for very short-term solar forecastingNumerical meteorological features, calendar features, CGHI, TSI imagesSolarNet-based CNN for GHI predictionGHI (W/m2)≥1 h10 minnRMSE, FS8.85% nRMSE, 25.14% FS
[79]Developing a method for short-term forecasting of cloudiness in Greece by using Satellite ImagesSatellite-derived Cloud Clearness Index (CCI) valuesANNCCI, GHI15 to 240 min15 min, 0.05°MSE, MAEMaximum average MSE after 240 min: ≈ 0.013 (summer), ≈ 0.04 (winter)
[80]Adopting deep-learning-based clustering for improved GHI forecasting by identifying irregular patternsDatasets from Itupiranga and OcalaDeep Time Series clustering, GRU, FADFGHI (W/m2)≥1 h1 hRMSE, rRSME, MAE, R 2 , ErrorMax, ErrorMin, FSRMSE = 112.60 ± 0.57 (Ocala), 117.71 ± 0.47 (Itupiranga)
[81]Developing models for intraday probabilistic solar forecasts with lead times up to 3 h by using a nonparametric approach based on Linear Quantile RegressionGround-based data, satellite data (from NOAA)Linear Quantile Regression method and regression modelsGHI (W/m2)≥3 h10 minReliability property, sharpness, CRPS, CRPSS (FS)RP: 60 % RP 80 % , SP: 80 % Coverage, CRPSS Gain: Min > 2.7 %
[82]Developing a Satellite Irradiance Model with short-term prediction capabilities by using Cloud Motion Vectors for real-time solar irradiance forecasting in AustraliaSatellite dataCMVs, HELIOSAT technique, SIFM modelGHI, PV power5 min10 min, 2 kmMBE, MAE, RMSE, nRMSE24 < nRMSE< 43%, outperforms persistence for most sites
[15]Developing a general model for short-term solar irradiance forecasting by using satellite-based measurements and weather forecasts, independent of local ground measurementsHistorical ground data, satellite-based irradiance values, ECMWF forecasts, deterministic clear-sky irradianceDNNGHI≥4 h1 hrRMSEModel rRMSE 31.31 % , outperforms local models
[60]Development of a predictive model for solar irradiance involving Data Transformation, Distribution Estimation, and Confidence Interval Analysis, with a focus on appropriate Data Window selectionGHI, temperature, humidity, and cloudiness (from JMA’s GPV-MSM System), extraterrestrialSVR-based hourly irradiance prediction at 42 locations in JapanGHI (W/m2)≤9 h1 hConfidence level α N.A.
[25]Development of a predictive model by using Neural-Network-based NWP model for forecasting power generation in a San Diego residential microgrid, incorporating comprehensive weather parametersPower demand and generation, price data from SDG&E, and weather parameters (from NREL)Neural-Network-based NWP compared with Multivariable Regression and SVMGHI (W/m2), power generation (W/h)≥1 day1 hMAPE, MSEMAPE of NN irradiance = 0.95%, NN power production = 45.3%
[33]Integrating ASI and Satellite Imagery for Cloud AnalysisSolar irradiance, ASI images, Satellite ImagesDeep learning architecture based on ECLIPSEGHI≥60 min10/30 minFS (%), CRPS, RMSE (W/m2)115.6 < RMSE < 134.9 and 19.9 < FS < 23.3
[66]Detecting real-time Cloud Obstruction and Forecasting Clearness Sky Index in short intervals by using satellite data and machine learning techniquesMeteorological satellite data (from MSG’s SEVIRI), Cloud Classification (from SAFGEO)Machine learning models for short-term forecasting of GHI, including SHLNN, DHLNN, RFGHI (W/m2)≥15 min7–8 minCumulative Error, Performance AccuracyHighest Accuracy = 84.2%, Lowest Accuracy = 72.5%
[14]Utilizing geostationary satellite observations and radiative transfer calculations to generate short-term forecasts of solar insolation for solar power generationSatellite Images, NWP, radiative transfer modelThe CIRACast model, the CLAVR-x algorithmGHI≤3 h5 minMAE 8.5 < MAE < 17.2 % , outperforms persistence-based forecasting
Table 7. AI-techniques-based Solar PV power forecasting.
Refs.DescriptionInputMethodologyOutputHorizonRes.MetricsAccuracy
[9]Technoleconomical analysis of 12 different methods operating in agreement with market conditionsNWP (ECMWF), PV production from a fleet of 152 PV systemsSupervised learning model, support vector regression, deep learning, physical-based techniquesPV power outputDay ahead1 dayMAE, RMSE, MBE, ER6% < MEA < 7.5% Random Forest Regression performs best with a score of 6.13%. The PV model has the highest ER
[61]Forecasting PV power output for 24-hour and 48-hour horizons, leveraging comprehensive weather data across GermanyPV power data (from aggregated German data) and NWP data (NOAA’s GFS)Convolutional Neural Network and Long Short-Term Memory Network for PV power predictionPV power output (MW)≥1 day3 hRMSE, MAERMSE = 1949 MW, nRMSE = 4.73%
[74]Proposing an End-to-End PV power generation Prediction Model using Satellite Images and deep learning to improve solar forecastsSatellite Images, PV power generation datasetOptical Flow Calculation, Encoder Stage with CNN, clear-sky PV power estimation, Augmentation Stage with AM Models, Decoder Stage with LSTMPV power forecasting≥3 h5 km, 10 minnRMSE, MASE, nMAE6.264 < NRMSE< 7.721%, 2.362< NMAE< 2.982%, 0.644 < MASE< 0.815
[82]Developing a Satellite Irradiance Model with short-term prediction capabilities by using Cloud Motion Vectors for real-time solar irradiance forecasting in AustraliaSatellite dataCMVs, HELIOSAT technique, SIFM modelGHI, PV power5 min10 min, 2 kmMBE, MAE, RMSE, nRMSE24 < nRMSE< 43%, outperforms persistence for most sites
[83]Addressing challenges of Satellite-Image-based photovoltaic power forecasting by proposing a nonlinear cloud movement model, active cloud region selection, and sequential algorithm, combined with XGBoostPV power, satellite dataConv-LSTM for cloud movement prediction, XGBoost for PV power forecastingPV power15 min, 30 min, 60 min15 minNMAE, NRMSE, Correlation CoefficientNMAE and NRMSE of proposed method are 8 % lower than M1; 1 CORR is 10 % lower than M1; NMAE of M1 is 13 % higher for 15 min and 30 min, 14 % higher for 60 min; NRMSE of M 1 10 % , 17 % , 14 % higher for 15 min, 30 min, and 60 min, respectively
[44]A unified architecture for multi-time-horizon predictions for short- and long-term solar forecastingNWP (NOAA’s SURFRAD), GDSI, GHIRecurrent Neural Networks; bird model is used to calculate clear-sky GHIGDSI≥4 h1 hRMSE8.64 < RMSE < 41.7 for 1 h and 10.7 < RMSE < 49.1 for 4 h for specified time horizons. For multitime horizons, 6.7 < RMSE < 39.8
[72]Developing an ultra-short-term PV power forecasting method leveraging Satellite Image data for spatial–temporal analysisSolar PV power data, Satellite Images from Fengyun-4AForecasting method, SVM, GBDTPV power (W)15 min to 4 h1 dayRSME, MAEMAE: 4.12 % and 3.70 % , RMSE: 9.48 % and 8.54 % for two plants
[67]Developing a hybrid forecasting tool by using satellite remote sensing data and time series modelsGeostationary satellite data, Daily Mean SISARMA, NAR-NN, DES, Kriging InterpolationSolar power output (W/m2)≥3 days1 dayR, RMSE, MAPEDES method: RMSE = 13.4, SD = 3.83, R = 0.88
[25]Development of a predictive model by using Neural-Network-based NWP model for forecasting power generation in a San Diego residential microgrid, incorporating comprehensive weather parametersPower demand and generation, price data from SDG&E, and weather parameters (from NREL)Neural-Network-based NWP compared with Multivariable Regression and SVMGHI (W/m2), power generation (W/h)≥1 day1 hMAPE, MSEMAPE of NN irradiance = 0.95%, NN power production = 45.3%

5.3. Time Horizon of Solar Forecasting

The reviewed studies encompass a broad range. A summary of the Artificial Intelligence techniques employed for different time horizons is presented in the following Table 8. The longest time horizons employed in the studies span from 24 to 21 h. For example, Doorga et al. [84] focused on forecasting the mesoscale distribution of surface solar irradiation within a 24 h time horizon. Kosmopoulos et al. [62] aimed to forecast the impact of large-scale clouds on downwelling surface solar irradiation with a time horizon of up to 21 h. Wang et al. [68] developed a method for minutely forecasting solar irradiance based on real-time sky image–irradiance mapping within a 1 h time horizon. The utilization of these diverse time horizons in solar-energy-forecasting research enables predictions at various temporal scales, facilitating decision making and resource optimization in the renewable energy sector.
On the other end of the spectrum, the shortest-term forecasting is conducted within a time horizon of 1 min to about 1 h. Various techniques have been employed for such short-term forecasting, showcasing the diverse approaches in the field. These techniques include localized forecasting using sky images and Cloud Motion tracking [76], nowcasting techniques utilizing analog methods and geostationary Satellite Images [71], probabilistic forecasts encompassing intraday variability and satellite information [81], direct learning from Satellite Images with regions of interest [74], spatiotemporal optimization based on Satellite Imagery [87], and minutely forecasting through real-time sky image–irradiance mapping [68]. Additionally, other methods such as predictions based on near-real-time satellite data [82], ensemble forecasting with dropout Neural Networks and neighboring satellite information [63], and generalized models using satellite data without local telemetry [88] have also been explored. Furthermore, deep learning models have shown promise, including a model for intraday forecasting using satellite-based estimations [89], a proposed model combining deep learning and machine learning for hourly solar irradiation forecasting [65], and a spatiotemporal deep learning model for satellite-derived short-term forecasting [90]. Additionally, studies have focused on cloudiness forecasting for solar energy purposes [79], comparative studies of LSTM Neural Networks in day-ahead global horizontal irradiance forecasting [77], ultra-short-term PV power forecasting considering neighboring plant data [72], and hybrid approaches combining satellite remote sensing and time series models for mesoscale surface solar irradiation distribution [67]. Furthermore, a hybrid forecasting method utilizing satellite visible images and modified Convolutional Neural Networks (CNNs) has been proposed [34].

5.4. Prevalence of Artificial Intelligence

Based on a comprehensive review of the literature provided in Table 4, Table 6 and Table 7, it is evident that a wide range of AI techniques have been extensively employed for solar energy forecasting. These techniques include diverse methodologies and data sources. Table 5 highlights the multifaceted nature of the problem. Notably, deep learning architectures based on ECLIPSE (Envisioning Cloud-Induced Perturbations in Solar Energy) have been investigated [33], showcasing the potential of advanced Neural Network structures. Additionally, supervised learning models have been explored to forecast solar energy production [36], leveraging historical data and relevant features. Furthermore, regression, support vector regression, ensemble learning, deep learning, and physical-based techniques have been investigated to model solar energy patterns [44]. Recurrent Neural Networks have been proposed for solar radiation nowcasting, enabling short-term forecasting [16]. Cloud Motion Vectors have been incorporated by using the Deep Flow algorithm to enhance the accuracy of solar radiation predictions [70]. Moreover, the European Solar Radiation Atlas (ESRA) clear-sky irradiation model has been utilized in combination with other algorithms to improve solar power nowcasting [19]. The Atlas (ESRA) clear-sky irradiation model has also been employed for PV power forecasts [20]. Satellite-based approaches, such as the FengYun-4 geostationary satellite data, have been utilized to develop solar radiation nowcasting systems [73]. Additionally, Numerical Weather Prediction has been employed to enhance the solar power forecasting accuracy by considering weather conditions [24]. Machine learning algorithms like the Long Short-Term Memory (LSTM) Neural Network have been utilized for short-term solar power forecasting [91]. Moreover, the application of Empirical Mode Decomposition (EMD) has been explored for day-ahead solar power forecasts [25]. Techniques such as Elastic Net Regularization have been investigated to improve the precision of solar power forecasts [26]. Furthermore, local vector autoregressive ridge modeling has been employed to predict solar power generation [20]. Lastly, the combination of the European Solar Radiation Atlas (ESRA) with Heliosat-2 has been proposed as a hybrid satellite-based solar forecasting approach [92].
Clearly, the field of solar energy forecasting encompasses a wide range of AI techniques, reflecting the multifaceted nature of the problem. But, even though these techniques are a substantial part of the ongoing research, the process of selecting and applying these techniques sometimes seems to be based on trial and error. This also applies to the selection of variables that are used as inputs for AI models. In a sense, this is inherent to the black box that is introduced by a number of AI techniques. One cannot look inside a Neural Network and see why certain patterns are detected. In the end, you can only see that it is able to detect these patterns by analyzing the outcome. Thus, only by trying different techniques can one be able to see which technique is best at detecting the right patterns. But then, when trying to improve the technique for forecasting, it can become hard to do so since the inner workings are not well known. This is more of a general issue in using AI, prompting new developments such as explainable AI (XAI) [93].

5.5. Local Weather Conditions

The precision of solar energy forecasting exhibits variability among different nations and is subject to the influence of diverse models, methodologies, and prevailing weather patterns unique to each country, as illustrated in Figure 8.
This variability can be attributed to the unique weather characteristics experienced in specific regions. In the United Kingdom (UK), known for its cloud-dominant weather, a 10 min solar energy forecast achieves an accuracy with an RMSE of 115.6 W/m2 [33]. The Netherlands, characterized by its cloudy weather, demonstrates a forecasting skill of 19.9% with an average of 160 sunny days throughout the year [36]. The United States of America (USA) provides a solar energy forecast at 30 min intervals. Spain, known for its abundant sunshine, has an RMSE of 126.7 W/m2 and a forecasting skill of 23.3% [44]. On the other hand, China, with its diverse weather patterns, has forecasting intervals of 60 min and an RMSE of 134.9 W/m2 [16]. Greece achieves the highest Economic Revenue for PV models, and Japan shows varying RMSE values for different forecast horizons [70]. Singapore, France, Germany, Uruguay, Australia, Denmark, Morocco, Mauritius Island, and Korea also have their own specific accuracy metrics, influenced by their respective dominant weather patterns [19,20,24,25,26,91,92].

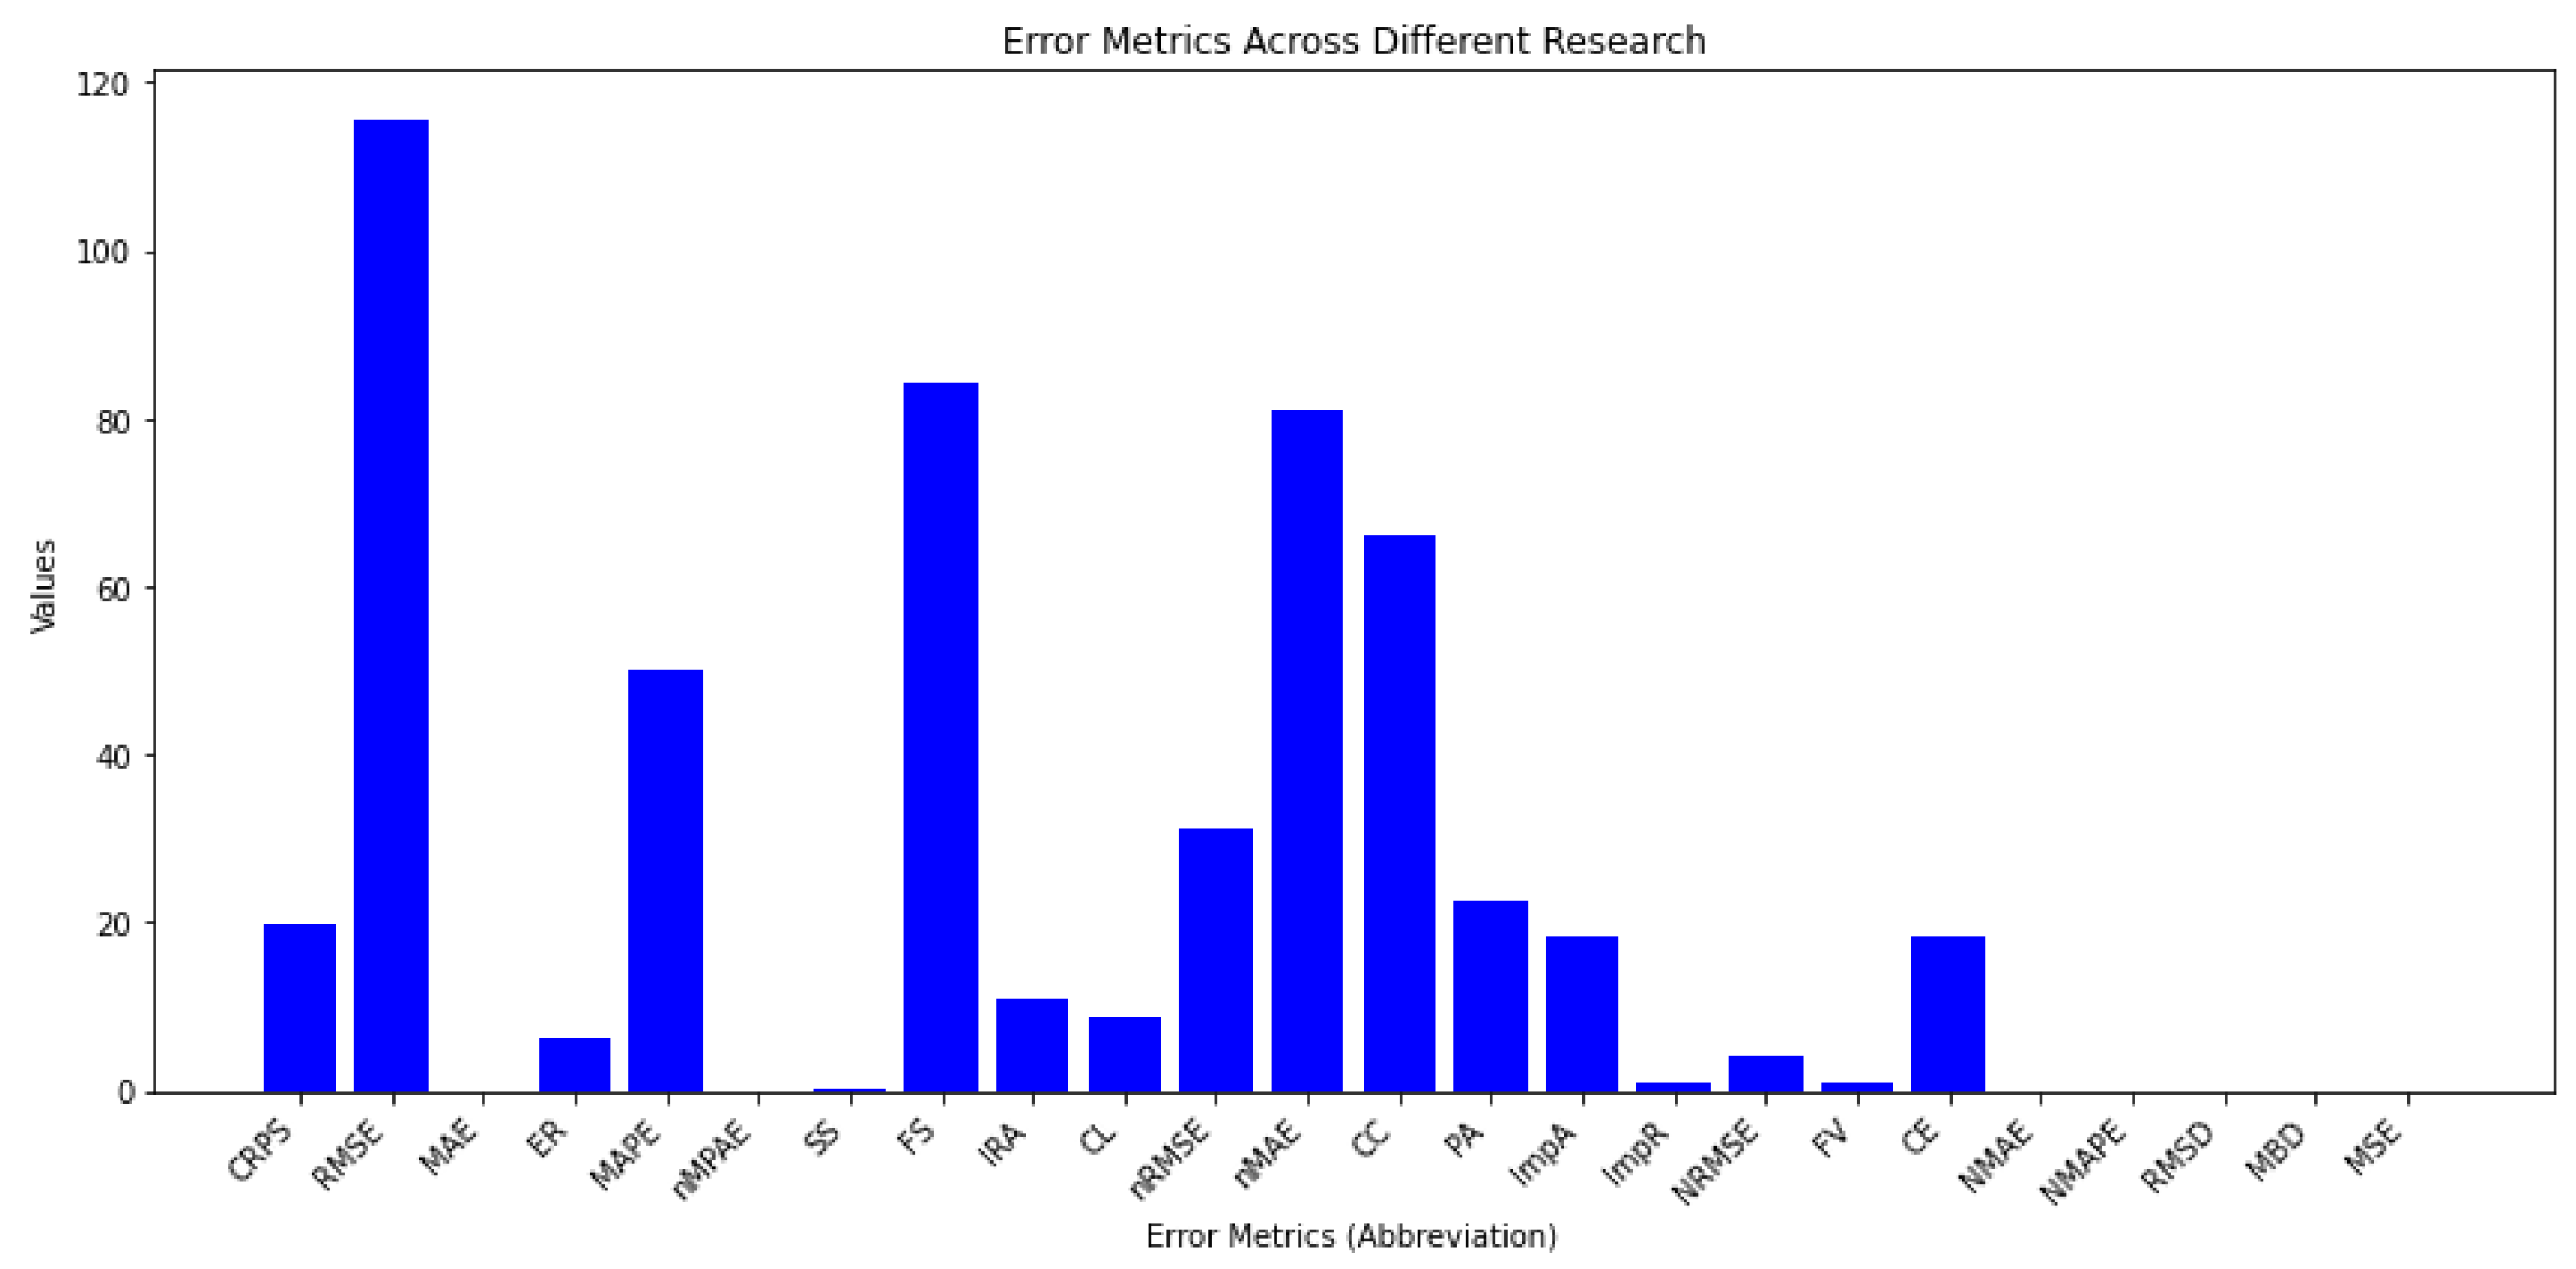
5.6. Widely Employed Performance Metrics

Concerning performance metrics, Table 2 provides an overview of the frequently utilized metrics in solar-energy-forecasting research, which include RMSE, MAE, FS, MBE, nRMSE, MAPE, rRMSE, and CRPS, as illustrated in Figure 9. Notably, among these metrics, RMSE stands out as the most prevalent, with over 110 studies utilizing it to assess and verify the performance of various forecasting methods. The distribution of these metrics is further elaborated in Table 9. In addition, many other metrics are used as well, such as the Prediction Interval Normalized Averaged Width (PINAW) [81], Brier Skill Score (BSS) [71], Correlation Coefficient (R) [94], Normalized Peak Mean Absolute Error (nPMAE) [19], and Economic Revenue (ER) [37].

5.7. Comparison to Naive Forecasters

A common approach to assess forecasting methods is to compare the results to a naive forecaster, such as the persistence approach, by using the Forecast Skill and other metrics, e.g., the RMSE [16,33,71,86,95]. Then, if there is an improvement compared to the naive approach, naturally, it is claimed that the method in question shows promise as there is a quantitative improvement. However, when everybody is compared to the worst performer in class, everybody can claim to obtain good results. Following this analogy raises the question of how promising the results that are obtained actually are. This reflects the need for identifying state-of-the-art methods that can be used as high-standard reference methods.

6. Future Research—Recommendations

Reviewing the current state of the art and analyzing the most current research revealed some of the current shortcomings within the field of solar forecasting. Based on these shortcomings, recommendations for future research will be discussed in the following sections.

6.1. Creation of a Benchmarking Framework

As mentioned in the previous section, it is hard to accurately compare different forecasting methods since they are dependent on many different variables. This reflects the need for a more standardized approach to developing and assessing forecasting methods. This could be performed through the development of a benchmark for solar forecasting. The International Energy Agency (IEA) has already included the creation of a benchmarking framework for solar forecasting in their PVPS task 16 project as part of subtask 1 [69], which highlights the importance of this subject. Benchmarking is known to stimulate innovation, technical development, and the building of a stronger research community. Often, it has a strong, positive effect on maturing a scientific discipline. This can be attributed to the fact that the development of a benchmark requires a thorough evaluation of the field of research to identify key problems, which in turn requires good communication and collaboration [97,98]. Through the development of evaluation methods and procedures, it helps to increase the reproducibility of research [99]. The development of a benchmark also helps to identify state-of-the-art methods. These state-of-the-art methods can then be used as high-standard references, instead of naive approaches, to better identify what methods are really pushing solar forecasting forward.
A good benchmark should provide a basic framework for action. It needs to be clear and straightforward, and it should describe the steps needed to perform a benchmark [97]. According to [98], a benchmark should have three components: (1) a motivating comparison, (2) a Task Sample, and (3) a performance measure. The motivating comparison reflects the purpose of a benchmark as it allows for a comparison of methods to identify the best practices. At the same time, it should also describe the motivation for pushing the field of research forward, in this case, to allow for the better integration of solar energy. Thus, the motivating comparison illustrates the context in which the benchmark is operating. The Task Sample should showcase an example of the task that is at hand, i.e., use input data on atmospheric conditions to determine future solar irradiance for the better integration of solar energy. The performance measure used for a successful benchmark should not only be seen as a way to describe the characteristics of the method that is benchmarked, but it should also reflect the fitness of the method for the task at hand. Thus, to choose a good performance measure, the end-user should also be considered.

6.2. Creation of Publicly Available, Standardized Datasets

As mentioned before, one of the difficulties in comparing methods results from the fact that the performances are affected by many variables, and thus different input datasets can yield different performances. A starting point for assessing and benchmarking different methods would be through standardized datasets [100]. However, ref. [100] also pointed out that there are only a few standardized datasets available, hindering researchers that do not have the resources available to make their own meteorological measurements. To demonstrate the possibilities of solar forecasting, the use of a suitable dataset is essential [10]. Luckily, some scholarly journals actively promote the publication of code and datasets alongside papers to enhance the reproducibility of the research [99]. The development of high-quality datasets for solar forecasting is also part of IEA-PVPS Task 16, subtask 1, indicating the importance of the matter.
A complete, standardized dataset should contain the following elements: (1) quality-controlled weather and irradiance data with, preferably, a 1 min time interval; (2) high-resolution sky images for the same location and time period; (3) Satellite Images for the same location and time period, with the same time interval; and (4) Numerical Weather Prediction data for the same location and time period [100]. Prompted by the above recommendations, Pedro et al. [100] released a standardized dataset of three years containing quality-controlled data with a 1 min resolution of GHI and DNI ground measurements in California, USA. These measurements are complemented by sky images, Satellite Imagery, and NWP forecasts for the same location. Another effort to create a standardized dataset, to accelerate solar forecasting research, was made by Nie et al. [101]. This dataset, however, was specifically aimed at short-term solar forecasting using ASI cameras. The dataset contains three years (2017–2019) of quality-controlled, down-sampled sky images and PV power generation data, which are prepared for deep learning methods. In addition, the high-resolution images are added too if needed together with sky video footage and a code base containing scripts for data processing and baseline modeling.
Since these complete datasets are, in general, not readily available, data for solar research are often collected from multiple sources. However, many solar forecasting methods rely on data science and machine learning techniques and thus require large datasets. As a result, collecting and aligning datasets are often time-consuming processes [10]. When looking to put one’s own dataset together, the first place to look would be for datasets that are published alongside papers. These datasets typically have already been quality-controlled and matched, thus saving a lot of work. High-quality weather and irradiance data are obtained from in situ measurements performed by weather stations, buoys, and radiosondes. These data are often freely available for research purposes. Some well-known examples are the Baseline Surface Radiation Network (BSRN) and the Surface Radiation Budget Network (SURFRAD). However, these measurements are limited to the location of measurement equipment. Ground data for other locations are often derived by using interpolation and Numerical Weather Prediction, thus losing some accuracy. To complement ground measurements, remotely sensed data from geostationary satellites could be used. While they are, in general, of lower accuracy than ground-based data, satellite data are often freely available. Some well-known sources for satellite data are EUMETSAT, NOAA, and NSMC. Stand-alone NWP models can also be a valuable source for data on atmospheric conditions [99]. Well-known examples of available NWP data sources are ECMWF and NOAA. There are also more locally focused weather predictions available, such as the Royal Netherlands Meteorological Institute (KNMI) for the Netherlands. And when looking for ASI images, an extensive list of 72 open-source, sky image datasets was put together by Nie et al. [102]. This list also details whether or not the images are complemented with additional data, such as solar irradiance or the PV power output, and whether they are selected to be suitable for AI-driven methods.

6.3. Classification of Forecasting Sites

Part of creating a benchmark or a solution to be able to better compare different forecasting methods could be to work with a classification scheme that aims at classifying different forecasting sites. This classification scheme should be based on the different factors that affect solar irradiance. The starting factor for differentiating forecasting sites is the local climate, which can be differentiated by using the Kóppen–Geiger System. This system is already over 100 years old but is still widely used in a wide range of research disciplines that require climate classification [103]. Seasons should also be taken into account as they strongly affect weather patterns. The choice of seasons should be linked to the Kóppen–Geiger System, because some climate regions experience winter, spring, summer, and fall, while other regions only experience a dry and wet season.
A classification scheme, as mentioned above, could also be the starting point for the development of a top-down approach for developing solar forecasting solutions, as this is currently lacking [3]. A classification scheme can help to highlight which techniques work best for which class of forecasting sites. This creates an opportunity to start with a focus on the most suited techniques for the forecasting site that is considered since it is known that no system of forecasting (e.g., deep learning or physical modeling) performs best in all situations [104].

6.4. Value of Expert Variables, Artificial Intelligence, Preprocessing, and Postprocessing

In solar forecasting, using expert variables, AI techniques, preprocessing, and postprocessing approaches has proven to be significant for enhancing forecast reliability and accuracy. Expert variables produced from area knowledge and expertise can give significant insights and improve the modeling and forecasting processes. These variables may include atmospheric conditions, cloud properties, solar geometry, and historical data patterns [105,106].
AI approaches, such as machine learning and deep learning, have shown considerable promise in identifying complex correlations and patterns in input data, resulting in more accurate predictions. These approaches may be used at several phases of the forecasting process, such as data preprocessing, feature extraction, model training, and prediction. Forecast models can adapt to changing conditions and improve their effectiveness over time through the use of AI algorithms [107,108].
Preprocessing is crucial for cleaning, filtering, and transforming raw data from various sources, including Sensor Networks, satellite imaging, NWP models, and sky cameras. Preprocessing procedures such as data fusion, quality control, and outlier detection ensure that the input data are correct, dependable, and appropriate for forecasting. This stage aids in minimizing noise, correcting biases, and dealing with missing data, ultimately enhancing forecast quality [109,110].
Postprocessing methods are employed to refine and improve the forecast outputs. These techniques can include statistical analysis, error correction, bias adjustment, and ensemble modeling. Postprocessing helps in calibrating the forecasts, reducing systematic errors, and providing more reliable and consistent predictions. By combining different forecasting models or utilizing ensemble techniques, the uncertainty in the forecasts can be quantified, and better decision making can be facilitated [10,111].
Open-source data and benchmarking are crucial in the field of short-term solar forecasting. Open datasets provide a standardized platform for comparing different forecasting methods and evaluating their performance. Applying benchmarking exercises allows researchers and practitioners to assess the strengths and weaknesses of different techniques, identify best practices, and drive innovation in the field [10,112]. It is important, however, to exercise caution and not blindly trust AI models. While AI techniques can significantly enhance forecasting capabilities, they should be used as tools that assist human experts rather than replacing them entirely. Human expertise and judgment remain critical in interpreting results, validating forecasts, and making informed decisions in complex situations [10,112].
Explainable AI (XAI) techniques play a vital role in ensuring the transparency and interpretability of AI models in solar forecasting. XAI techniques aim to provide insights into the inner workings of AI models and explain the reasons behind their predictions. By making the decision-making process of AI algorithms more transparent, XAI enables users to understand how and why a certain forecast or outcome was produced. This fosters trust, facilitates model validation, and helps identify potential biases or limitations in the AI system. Incorporating XAI techniques into solar forecasting models can enable stakeholders to have a better understanding of the underlying factors influencing solar energy predictions and make more informed decisions based on the forecasted results [113,114].
Looking to the future, advancements in Sensor Networks, Satellite Imagery, NWP models, and sky cameras, coupled with ongoing research in AI and data-driven approaches, hold promising prospects for short-term solar forecasting. Continued improvements in data quality, model algorithms, and integration techniques are expected to further enhance the accuracy, reliability, and usability of solar energy forecasts, ultimately contributing to the more efficient and effective utilization of solar resources [95,115].

6.5. Extreme Weather, Outliers, and AI

The latest IPCC report [116] states that human-induced climate change has influenced extreme weather events such as heat waves, heavy precipitation, droughts, and tropical storms and has also increased the change in compound events, including consecutive heatwaves and droughts. Renewable energy sources are directly affected by the availability of sufficient water, wind, or solar radiation. This makes the renewable energy supply susceptible to extreme weather events. Recent events such as long-lasting high temperatures, droughts, and low wind speeds have already proven to be able to impact energy prices and the security of energy services [117]. And the increasing likelihood of these weather events only stresses the need to consider extreme weather events in future energy-forecasting research, although it is hard to predict how these events will affect energy forecasting and solar forecasting in particular.
While AI techniques have shown promise in improving solar forecasting, they may not always be suitable for predicting extreme weather conditions such as lightning. Extreme weather events introduce outlier events that are challenging for AI methods to detect as they deviate from normal trends. Lightning occurrences, for instance, are highly dynamic and unpredictable, making them difficult to capture accurately by using traditional AI approaches. The complex nature of lightning and its relationship with solar energy production requires a deep understanding of atmospheric physics and the intricate interplay between various meteorological variables. Research studies have highlighted the limitations of AI techniques in capturing and predicting lightning events for solar forecasting. For example, a recent study by [118] demonstrated that while AI models showed promising results in the overall solar forecasting accuracy, they struggled to predict lightning-related disruptions in solar power generation accurately. Similarly, ref. [119] found that AI models trained on historical weather data had limited capability in capturing the spatiotemporal patterns associated with lightning occurrences. These findings indicate that specialized models and techniques, such as physics-based models or data-assimilation methods, may be required to incorporate lightning-related information into solar forecasting systems effectively. Therefore, while AI techniques have demonstrated advancements in solar forecasting, they may face limitations in accurately predicting and accounting for extreme weather conditions like lightning, highlighting the need for further research and development in this area.

7. Conclusions

Solar energy has become an essential element in the global shift toward renewable energy sources. Accurate solar forecasting is crucial to effectively integrate solar power into the energy grid, optimizing energy management and reducing operational costs. However, understanding the various techniques employed in this field remains challenging due to the diversity of input data sources and limited explicit mentions in the available literature.
In this comprehensive review, we conducted an in-depth analysis of commonly used techniques and data sources in solar forecasting. Through an extensive examination of relevant studies, we identified key methodologies for predicting solar irradiance and the PV power output. We explored various aspects, including time horizons, time resolution, methodologies, data sources, and evaluation metrics employed in this field of research, emphasizing their significance in decision making and resource optimization within the renewable energy sector.
Our findings revealed that solar-energy-forecasting research utilizes a wide range of techniques and metrics to assess the accuracy and performance of models. AI techniques, including deep learning architectures, supervised learning models, regression models, support vector regression, ensemble learning, and physical-based techniques, have been extensively employed in this field [33,44,70]. These approaches have been implemented in numerous countries, such as the United Kingdom, the Netherlands, the United States of America, Spain, China, and others [16,19,36].
Specifically, deep learning architectures like Recurrent Neural Networks and Long Short-Term Memory (LSTM) Neural Networks have shown promising results in short-term solar energy forecasting [33]. The incorporation of satellite data, sky-camera imagery, and Numerical Weather Prediction has been explored to enhance the accuracy of solar radiation predictions [16,20]. Clear-sky irradiation models, such as the European Solar Radiation Atlas (ESRA), have been combined with other algorithms to improve solar power nowcasting [26]. Additionally, hybrid approaches that combine satellite data with Artificial Intelligence methods or time series models have been proposed to achieve more accurate solar power forecasts [24,67].
However, it is important to note that the accuracy of solar energy forecasting varies across different countries due to the influence of models, methods, and dominant weather patterns specific to each region. The unique weather characteristics of each country result in varying accuracy for different forecast horizons [36]. For example, in the UK, with its cloud-dominant weather, a 10 min solar energy forecast achieves an accuracy with an RMSE of 115.6 W/m2 [33]. The Netherlands, characterized by its cloudy weather, demonstrates a forecasting skill of 19.9% with an average of 160 sunny days throughout the year [36]. Spain, known for its abundant sunshine, has an RMSE of 126.7 W/m2 and a forecasting skill of 23.3% [44]. On the other hand, China, with its diverse weather patterns, has forecasting intervals of 60 min and an RMSE of 134.9 W/m2 [16]. These variations underscore the need for continuous research and development efforts to improve the forecasting accuracy further and tailor approaches to specific regional conditions.
Furthermore, the reviewed studies on solar energy forecasting encompass a wide range of time horizons. The longest time horizons range from 24 to 21 h, enabling predictions of mesoscale surface solar irradiation distribution and the impact of large-scale clouds [62,84]. Short-term forecasting, on the other hand, occurs within a time horizon of 1 min to about 1 h, utilizing diverse techniques such as localized forecasting, nowcasting techniques, and probabilistic forecasts [71,76,81]. Other methods, including prediction based on near-real-time satellite data, ensemble forecasting, and deep learning models, have also been explored [65,82,88,89]. Additionally, studies have focused on cloudiness forecasting, comparative studies of LSTM Neural Networks, ultra-short-term PV power forecasting, and hybrid approaches [67,72,79].
Through the identification of current research trends within the field of solar forecasting, a number of shortcomings and problems were also identified. The main problem that was identified is the difficulty in comparing different methods due to the huge variety of techniques and data that are used for solar forecasting. Therefore, the development of a benchmarking framework or top-down approach is recommended. There is also a lack of standardized datasets. They are often not readily available, hindering research. There is, however, a multitude of data sources available that can be used, but they need to be combined and aligned, which is often a time-consuming process. For a better comparison of methods, but also to better specify datasets and a benchmarking framework, solar forecasting sites should be classified based on local climate and weather patterns.
And while AI, especially combined with preprocessing and postprocessing, has proven to significantly improve forecasting, it is important to not blindly trust AI. The use of Explainable AI can shine a light on the inner workings of these techniques, allowing us to better identify biases and limitations, such as the handling of outlier weather events. AI should be used as a tool that assists experts, not replace them. Human expertise remains vital in interpreting results and for the creation of expert variables that can be used for forecasting.
In conclusion, this review provides valuable insights into the landscape of solar forecasting research, shedding light on the diverse techniques and data sources applied in this dynamic field. By understanding both the strengths and limitations of existing methodologies, researchers and practitioners are empowered to make informed decisions related to solar energy integration, management, and cost optimization. These decisions play a pivotal role in driving the successful transition toward a renewable energy future.
However, in light of the presented findings, a crucial question emerges: how can we further refine the accuracy and reliability of solar energy forecasting to align with the evolving requirements of renewable energy integration and management? This inquiry encourages exploration and dialogue on potential pathways for enhancing forecasting techniques. This includes the incorporation of emerging data sources, the refinement of evaluation metrics, and the tailored addressing of challenges unique to various regions and weather conditions.
Effectively addressing this question calls for sustained efforts in research and development, the establishment of benchmarks that set high standards for comparison, and the availability of comprehensive datasets. This concerted approach is essential for unlocking the full potential of solar energy forecasting [16,33,86].

Author Contributions

C.H. and K.B.: conceptualization, methodology, data collection, formal analysis, investigation, writing—original draft, and visualization. S.G.: conceptualization, methodology, resources, writing—review and editing, supervision, and project administration. W.v.S.: conceptualization, methodology, resources, writing—review and editing, supervision, project administration, and funding acquisition. All authors have read and agreed to the published version of the manuscript.

Funding

This research was funded by the Ministery of Economic Affairs and Climate within the framework of the Topsector Energy via the Netherlands Enterprise Agency (RVO), grant reference TSE1220051, and grant reference TEUE1821406 (project Solar Forecasting with All-Sky Imagers, SolFaSi).

Institutional Review Board Statement

Not applicable.

Informed Consent Statement

Not applicable.

Data Availability Statement

Data sharing is not applicable.

Acknowledgments

The authors wish to express their gratitude to several people who helped form this review paper. First of all, we would like to thank all the attendees at the IEA-PVPS Task 16 [69] meeting organized from 21 to 23 March 2023 in Seville, Spain, for sharing their research insights and valuable discussions. We also want to thank Frank Selten from the Netherlands Royal Meteorological Institute (KNMI) for his view on future weather in the Netherlands. Finally, discussions with Otto Bernsen of the Netherlands Enterprise Agency (RVO) are acknowledged as well as financial support from RVO. We acknowledge the Ministry of Economic Affairs and Climate for funding the Solar Forecasting with All-Sky Imagers (SolFaSi) project.

Conflicts of Interest

The authors declare no conflict of interest.

Abbreviations

The following abbreviations are used in this manuscript:
ECLIPSEEnvisioning Cloud-Induced Perturbations in Solar Energy
RMSERoot Mean Squared Error
MAEMean Absolute Error
MBEMean Bias Error
nRMSENormalized Root Mean Square Error
MAPEMean Absolute Percentage Error
FSForecast Skill
CRPSContinuous Ranked Probability Score
BSSBrier Skill Score
RCorrelation Coefficient
nPMAENormalized Peak Mean Absolute Error
PINAWPrediction Interval Normalized Averaged Width
RESRenewable energy sources
PVPhotovoltaic
ICTCommunication Technologies
GHIGlobal horizontal irradiance
DNIDirect normal irradiance
LPLinear Programming
OAOptical Analysis
CCICloud Clearness Index
DNNDeep Neural Network
ASIAll-Sky Imagers
STESolar thermal electric
NWPNumerical Weather Prediction
MOSModel Output Statistics
LESLarge Eddy Simulations
ANNArtificial Neural Network
FLCFuzzy Logic Control
GANGeneral Adversarial Network
CDFCumulative Distribution Function
TDITemporal Distortion Index
DTWDynamic Time Warping
TDMTemporal Distortion Mix
CMVCloud Motion Vector
ECMWFEuropean Centre for Medium-Range Weather Forecasts
NOAANational Oceanic and Atmospheric Administration
WRFWeather Research and Forecasting model
LSTMLong Short-Term Memory
CNNConvolutional Neural Networks
XAIExplainable AI
EREconomic Revenue
IEAInternational Energy Agency
BSRNBaseline Surface Radiation Network
SURFRADSurface Radiation Budget Network
KNMIRoyal Netherlands Meteorological Institute
RVONetherlands Enterprise Agency
BDBig data
TLTransfer learning
OPOptimization
AIArtificial Intelligence
DMData models
SMSolid Modeling
SVMSupport vector machine
FEFeature extraction
AMLAdversarial Machine learning

References

  1. Al-Othman, A.; Tawalbeh, M.; Martis, R.; Dhou, S.; Orhan, M.; Qasim, M.; Olabi, A.G. Artificial intelligence and numerical models in hybrid renewable energy systems with fuel cells: Advances and prospects. Energy Convers. Manag. 2022, 253, 115154. [Google Scholar] [CrossRef]
  2. Sobri, S.; Koohi-Kamali, S.; Rahim, N.A. Solar photovoltaic generation forecasting methods: A review. Energy Convers. Manag. 2018, 156, 459–497. [Google Scholar] [CrossRef]
  3. Liu, Z.; Sun, Y.; Xing, C.; Liu, J.; He, Y.; Zhou, Y.; Zhang, G. Artificial intelligence powered large-scale renewable integrations in multi-energy systems for carbon neutrality transition: Challenges and future perspectives. Energy AI 2022, 10, 100195. [Google Scholar] [CrossRef]
  4. Sayed-Mouchaweh, M. (Ed.) Artificial Intelligence Techniques for a Scalable Energy Transition; Springer Nature: Cham, Switzerland, 2020. [Google Scholar]
  5. Marugán, A.P.; Márquez, F.P.G.; Perez, J.M.P.; Ruiz-Hernández, D. A survey of artificial neural network in wind energy systems. Appl. Energy 2018, 228, 1822–1836. [Google Scholar] [CrossRef]
  6. Shabbir, N.; Kutt, L.; Astapov, V.; Husev, O.; Ahmadiahangar, R.; Wen, F.; Kull, K. Congestion control strategies for increased renewable penetration of photovoltaic in LV distribution networks. Energy Rep. 2022, 8, 217–223. [Google Scholar] [CrossRef]
  7. Vallance, L.; Charbonnier, B.; Paul, N.; Dubost, S.; Blanc, P. Towards a standardized procedure to assess solar forecast accuracy: A new ramp and time alignment metric. Sol. Energy 2017, 150, 408–422. [Google Scholar] [CrossRef]
  8. Voyant, C.; Notton, G.; Kalogirou, S.; Nivet, M.L.; Paoli, C.; Motte, F.; Fouilloy, A. Machine learning methods for solar radiation forecasting: A review. Renew. Energy 2017, 105, 569–582. [Google Scholar] [CrossRef]
  9. Visser, L.; Lorenz, E.; Heinemann, D.; van Sark, W.G. 1.11—Solar Power Forecasts. Compr. Renew. Energy 2023, 1, 213–233. [Google Scholar]
  10. Yang, D. SolarData: An R package for easy access of publicly available solar datasets. Solar Energy 2018, 171, A3–A12. [Google Scholar] [CrossRef]
  11. Inman, R.H.; Pedro, H.T.; Coimbra, C.F. Solar forecasting methods for renewable energy integration. Prog. Energy Combust. Sci. 2013, 39, 535–576. [Google Scholar] [CrossRef]
  12. Van Eck, N.; Waltman, L. Software survey: VOSviewer, a computer program for bibliometric mapping. Scientometrics 2010, 84, 523–538. [Google Scholar] [CrossRef]
  13. Tuohy, A.; Zack, J.; Haupt, S.E.; Sharp, J.; Ahlstrom, M.; Dise, S.; Grimit, E.; Möhrlen, C.; Lange, M.; Casado, M.G.; et al. Solar Forecasting. IEEE Power Energy Mag. 2015, 15, 1540–7977. [Google Scholar]
  14. Miller, S.; Rogers, M.; Haynes, J.; Sengupta, M.; Heidinger, A. Short-term Solar Irradiance Forecasting via Satellite/Model Coupling. Sol. Energy 2017, 168, 498–513. [Google Scholar] [CrossRef]
  15. Lago, J.; Brabandere, K.; De Ridder, F.; De Schutter, B. Short-term Forecasting of Solar Irradiance without Local Telemetry: A Generalized Model using Satellite Data. Sol. Energy 2019, 190, 372–384. [Google Scholar] [CrossRef]
  16. Rodríguez-Benítez, F.J.; López-Cuesta, M.; Arbizu-Barrena, C.; Fernández-León, M.M.; Pamos-Ureña, M.Á.; Tovar-Pescador, J.; Santos-Alamillos, F.J.; Pozo-Vázquez, D. Assessment of new solar radiation nowcasting methods based on sky-camera and satellite imagery. Appl. Energy 2021, 292, 116838. [Google Scholar] [CrossRef]
  17. Huang, H.; Xu, J.; Peng, Z.; Yoo, S.; Yu, D.; Huang, D.; Qin, H. Cloud Motion Estimation for Short Term Solar Irradiation Prediction. In Proceedings of the IEEE SmartGridComm 2013 Symposium-Support for Storage, Renewable Resources, and Micro-grids, Vancouver, BC, Canada, 21–24 October 2013; pp. 696–701. [Google Scholar]
  18. Paletta, Q.; Terrén-Serrano, G.; Nie, Y.; Li, B.; Bieker, J.; Zhang, W.; Dubus, L.; Dev, S.; Feng, C. Advances in solar forecasting: Computer vision with deep learning. Adv. Appl. Energy 2023, 11, 100150. [Google Scholar] [CrossRef]
  19. Chen, X.; Du, Y.; Lim, E.; Wen, H.; Jiang, L. Sensor network based PV power nowcasting with spatio-temporal preselection for grid-friendly control. Appl. Energy 2019, 255, 113760. [Google Scholar] [CrossRef]
  20. Xu, J.; Yoo, S.; Heiser, J.; Kalb, P. Sensor network based solar forecasting using a local vector autoregressive ridge framework. In Proceedings of the 31st Annual ACM Symposium on Applied Computing, Pisa, Italy, 4–8 April 2016; pp. 2113–2118. [Google Scholar]
  21. Espinosa-Gavira, M.J.; Agúera-Pérez, A.; González de la Rosa, J.J.; Palomares-Salas, J.C.; Sierra-Fernández, J.M. An on-line low-cost irradiance monitoring network with sub-second sampling adapted to small-scale PV systems. Sensors 2018, 18, 3405. [Google Scholar] [CrossRef]
  22. Espinosa-Gavira, M.J.; Agüera-Pérez, A.; Palomares-Salas, J.C.; González-de-la Rosa, J.J.; Sierra-Fernández, J.M.; Florencias-Oliveros, O. Cloud motion estimation from small-scale irradiance sensor networks: General analysis and proposal of a new method. Sol. Energy 2020, 202, 276–293. [Google Scholar] [CrossRef]
  23. Elsinga, B.; van Sark, W. Short-term peer-to-peer solar forecasting in a network of photovoltaic systems. Appl. Energy 2017, 206, 1464–1483. [Google Scholar] [CrossRef]
  24. Zhang, G.; Yang, D.; Galanis, G.; Androulakis, E. Solar forecasting with hourly updated numerical weather prediction. Renew. Sustain. Energy Rev. 2022, 154, 111768. [Google Scholar] [CrossRef]
  25. Sabzehgar, R.; Amirhosseini, D.Z.; Rasouli, M. Solar power forecast for a residential smart microgrid based on numerical weather predictions using artificial intelligence methods. J. Build. Eng. 2020, 32, 101629. [Google Scholar] [CrossRef]
  26. Verbois, H.; Huva, R.; Rusydi, A.; Walsh, W. Solar irradiance forecasting in the tropics using numerical weather prediction and statistical learning. Sol. Energy 2018, 162, 265–277. [Google Scholar] [CrossRef]
  27. Verzijlbergh, R.A.; Heijnen, P.W.; de Roode, S.R.; Los, A.; Jonker, H.J. Improved model output statistics of numerical weather prediction based irradiance forecasts for solar power applications. Sol. Energy 2015, 118, 634–645. [Google Scholar] [CrossRef]
  28. Mancini, S.; Ranka, P.; Folkersma, M. Towards the Use of Large Eddy Simulations for the Generation of the Atmospheric Boundary Layer Inflow for Wind Turbine Load Calculations. 2022. Available online: https://www.tno.nl/en/newsroom/insights/2023/02/towards-new-methods-designing-wind/ (accessed on 20 December 2022).
  29. Baas, P.; Verzijlbergh, R.; van Dorp, P.; Jonker, H. Investigating energy production and wake losses of multi-gigawatt offshore wind farms with atmospheric large-eddy simulation. In Proceedings of the Wind Energy Science Discussions, Milano, Italy, 23–23 June 2022; pp. 1–28. [Google Scholar]
  30. Nouri, B.; Lezaca, J.; Hammer, A.; Blum, N.; Roy, A. Multi-Source Observations to Improve Solar Forecasting within the Smart4RES Project. Smart4RES Projekt Homepage. 2021. Available online: https://www.smart4res.eu/ (accessed on 20 December 2022).
  31. Van Heerwaarden, C.C.; Van Stratum, B.J.; Heus, T.; Gibbs, J.A.; Fedorovich, E.; Mellado, J.P. MicroHH 1.0: A computational fluid dynamics code for direct numerical simulation and large-eddy simulation of atmospheric boundary layer flows. Geosci. Model Dev. 2017, 10, 3145–3165. [Google Scholar] [CrossRef]
  32. Kreuwel, F.P.; Knap, W.; Schmeits, M.; de Arellano, J.V.G.; van Heerwaarden, C.C. Forecasting day-ahead 1-min irradiance variability from numerical weather predictions. Sol. Energy 2023, 258, 57–71. [Google Scholar] [CrossRef]
  33. Paletta, Q.; Arbod, G.; Lasenby, J. Omnivision forecasting: Combining satellite and sky images for improved deterministic and probabilistic intra-hour solar energy predictions. Appl. Energy 2023, 336, 120818. [Google Scholar] [CrossRef]
  34. Si, Z.; Yu, Y.; Yang, M.; Li, P. Hybrid solar forecasting method using satellite visible images and modified convolutional neural networks. IEEE Trans. Ind. Appl. 2020, 57, 5–16. [Google Scholar] [CrossRef]
  35. Hatti, M. (Ed.) Artificial Intelligence and Renewables Towards an Energy Transition; Springer Nature: Cham, Switzerland, 2021. [Google Scholar]
  36. Visser, L.; Kootte, M.; Ferreira, A.; Sicurani, O.; Pauwels, E.; Vuik, C.; Sark, W.V.; AlSkaif, T. An operational bidding framework for aggregated electric vehicles on the electricity spot market. Appl. Energy 2022, 308, 118280. [Google Scholar] [CrossRef]
  37. Visser, L.; AlSkaif, T.; van Sark, W. Operational day-ahead solar power forecasting for aggregated PV systems with a varying spatial distribution. Renew. Energy 2022, 183, 267–282. [Google Scholar] [CrossRef]
  38. Daliento, S.; Chouder, A.; Guerriero, P.; Pavan, A.M.; Mellit, A.; Moeini, R.; Tricoli, P. Monitoring, Diagnosis, and Power Forecasting for Photovoltaic Fields: A Review. Int. J. Photo Energy 2017, 2017, 356851. [Google Scholar] [CrossRef]
  39. Ahmad, T.; Zhang, D.; Huang, C.; Zhang, H.; Dai, N.; Song, Y.; Chen, H. Artificial intelligence in sustainable energy industry: Status Quo, challenges and opportunities. J. Clean. Prod. 2021, 289, 125834. [Google Scholar] [CrossRef]
  40. Krogh, A. What are artificial neural networks? Nat. Biotechnol. 2008, 26, 195–197. [Google Scholar] [CrossRef]
  41. Yegnanarayana, B. Artificial Neural Networks; PHI Learning Pvt. Ltd.: New Delhi, India, 2009. [Google Scholar]
  42. Lee, C.C. Fuzzy logic in control systems: Fuzzy logic controller. I. IEEE Trans. Syst. Man Cybern. 1990, 20, 404–418. [Google Scholar] [CrossRef]
  43. Eseye, A.T.; Zhang, J.; Zheng, D. Short-term photovoltaic solar power forecasting using a hybrid Wavelet-PSO-SVM model based on SCADA and Meteorological information. Renew. Energy 2018, 118, 357–367. [Google Scholar] [CrossRef]
  44. Mishra, S.; Palanisamy, P. Multi-time-horizon solar forecasting using recurrent neural network. In Proceedings of the 2018 IEEE Energy Conversion Congress and Exposition (ECCE), Portland, OR, USA, 23–27 September 2018; pp. 18–24. [Google Scholar]
  45. Tan, C. Generating the Cloud Motion Winds Field from Satellite Cloud Imagery Using Deep Learning Approach. 2020. Available online: https://arxiv.org/abs/2010.01283v2 (accessed on 20 December 2022).
  46. Ravuri, S.; Lenc, K.; Willson, M.; Kangin, D.; Lam, R.; Mirowski, P.; Fitzsimons, M.; Athanassiadou, M.; Kashem, S.; Madge, S.; et al. Skilful precipitation nowcasting using deep generative models of radar. Nature 2021, 597, 672–677. [Google Scholar] [CrossRef]
  47. Wang, R.; Teng, D.; Yu, W.; Zhang, X.; Zhu, J. Improvement and Application of a GAN Model for Time Series Image Prediction—A Case Study of Time Series Satellite Cloud Images. Remote Sens. 2022, 14, 5518. [Google Scholar] [CrossRef]
  48. Andrianakos, G.; Tsourounis, D.; Oikonomou, S.; Kastaniotis, D.; Economou, G.; Kazantzidis, A. Sky Image forecasting with Generative Adversarial Networks for cloud coverage prediction. In Proceedings of the 2019 10th International Conference on Information, Intelligence, Systems and Applications (IISA), Patras, Greece, 15–17 July 2019; pp. 1–7. [Google Scholar]
  49. Logothetis, S.A.; Salamalikis, V.; Nouri, B.; Remund, J.; Zarzalejo, L.F.; Xie, Y.; Wilbert, S.; Ntavelis, E.; Nou, J.; Hendrikx, N.; et al. Solar Irradiance Ramp Forecasting Based on All-Sky Imagers. Energies 2022, 15, 6191. [Google Scholar] [CrossRef]
  50. Bristol, E. Swinging door trending: Adaptive trend recording? In ISA National Conference Proceedings; ISA: Research Triangle Park, NC, USA, 1990; pp. 749–754. [Google Scholar]
  51. Cui, Y.; He, Y.; Xiong, X.; Chen, Z.; Li, F.; Xu, T.; Zhang, F. Algorithm for identifying wind power ramp events via novel improved dynamic swinging door. Renew. Energy 2021, 171, 542–556. [Google Scholar] [CrossRef]
  52. Florita, A.; Hodge, B.M.; Orwig, K. Identifying wind and solar ramping events. In Proceedings of the 2013 IEEE Green Technologies Conference (GreenTech), Denver, CO, USA, 4–5 April 2013; pp. 147–152. [Google Scholar]
  53. Cui, M.; Zhang, J.; Florita, A.R.; Hodge, B.M.; Ke, D.; Sun, Y. An optimized swinging door algorithm for identifying wind ramping events. IEEE Trans. Sustain. Energy 2015, 7, 150–162. [Google Scholar] [CrossRef]
  54. Cui, M.; Zhang, J.; Florita, A.; Hodge, B.M.; Ke, D.; Sun, Y. Solar power ramp events detection using an optimized swinging door algorithm. In Proceedings of the International Design Engineering Technical Conferences and Computers and Information in Engineering Conference. American Society of Mechanical Engineers, Boston, MA, USA, 2–5 August 2015; Volume 57076, p. V02AT03A027. [Google Scholar]
  55. Frías-Paredes, L.; Mallor, F.; León, T.; Gastón-Romeo, M. Introducing the Temporal Distortion Index to perform a bidimensional analysis of renewable energy forecast. Energy 2016, 94, 180–194. [Google Scholar] [CrossRef]
  56. Sakoe, H. Dynamic-programming approach to continuous speech recognition. In Proceedings of the 1971 International Congress of Acoustics, Budapest, Hungary, 18–26 August 1971. [Google Scholar]
  57. Sakoe, H.; Chiba, S. Dynamic programming algorithm optimization for spoken word recognition. IEEE Trans. Acoust. Speech Signal Process. 1978, 26, 43–49. [Google Scholar] [CrossRef]
  58. Balayla, J. Prevalence threshold (ϕe) and the geometry of screening curves. PLoS ONE 2020, 15, e0240215. [Google Scholar] [CrossRef]
  59. Milidonis, K.; Blanco, M.J.; Grigoriev, V.; Panagiotou, C.F.; Bonanos, A.M.; Constantinou, M.; Pye, J.; Asselineau, C.A. Review of application of AI techniques to Solar Tower Systems. Sol. Energy 2021, 224, 500–515. [Google Scholar] [CrossRef]
  60. Murata, A.; Ohtake, H.; Oozeki, T. Modeling of uncertainty of solar irradiance forecasts on numerical weather predictions with the estimation of multiple confidence intervals. Renew. Energy 2018, 117, 193–201. [Google Scholar] [CrossRef]
  61. Mathe, J.; Miolane, N.; Sebastien, N.; Lequeux, J. PVNet: A LRCN architecture for spatio-temporal photovoltaic PowerForecasting from numerical weather prediction. arXiv 2019, arXiv:1902.01453. [Google Scholar]
  62. Kosmopoulos, P.; Kouroutsidis, D.; Papachristopoulou, K.; Raptis, P.I.; Masoom, A.; Saint-Drenan, Y.M.; Blanc, P.; Kontoes, C.; Kazadzis, S. Short-term forecasting of large-scale clouds impact on downwelling surface solar irradiation. Energies 2020, 13, 6555. [Google Scholar] [CrossRef]
  63. Yagli, G.M.; Yang, D.; Srinivasan, D. Ensemble solar forecasting and post-processing using dropout neural network and information from neighboring satellite pixels. Renew. Sustain. Energy Rev. 2022, 155, 111909. [Google Scholar] [CrossRef]
  64. André, M.; Perez, R.; Soubdhan, T.; Schlemmer, J.; Calif, R.; Monjoly, S. Preliminary assessment of two spatio-temporal forecasting technics for hourly satellite-derived irradiance in a complex meteorological context. Sol. Energy 2019, 177, 703–712. [Google Scholar] [CrossRef]
  65. Benamrou, N.; Ouardouz, M.; Allaouzi, I.; Ben Ahmed, M. A proposed model combining deep learning and machine learning for hourly solar irradiation forecasting. J. Ecol. Eng. 2020, 21, 26–38. [Google Scholar] [CrossRef]
  66. Nespoli, A.; Niccolai, A.; Ogliari, E.; Perego, G.; Collino, E.; Ronzio, D. Machine Learning techniques for solar irradiation nowcasting: Cloud type classification forecast through satellite data and imagery. Appl. Energy 2022, 305, 117834. [Google Scholar] [CrossRef]
  67. Doorga, J.R.S.; Dhurmea, K.R.; Rughooputh, S.; Boojhawon, R. Forecasting mesoscale distribution of surface solar irradiation using a proposed hybrid approach combining satellite remote sensing and time series models. Renew. Sustain. Energy Rev. 2019, 104, 69–85. [Google Scholar] [CrossRef]
  68. Wang, H.; Xuan, Z.; Zhen, Z.; Li, Y.; Li, K.; Zhao, L.; Shafie-khah, M.; Catalão, J.P. Minutely solar irradiance forecasting based on real-time sky image-irradiance mapping. Appl. Energy 2020, 275, 115386. [Google Scholar] [CrossRef]
  69. Remund, J.; Task, O.A.I.P. Solar Resource for High Penetration and Large Scale Applications. 2023. Available online: https://iea-pvps.org/research-tasks/solar-resource-for-high-penetration-and-large-scale-applications/ (accessed on 20 January 2024).
  70. Ge, Y.; Nan, Y.; Bai, L. A hybrid prediction model for solar radiation based on long short-term memory, empirical mode decomposition, and solar profiles for energy harvesting wireless sensor networks. Energies 2019, 12, 4762. [Google Scholar] [CrossRef]
  71. Ayet, L.; Tandeo, P. Nowcasting techniques utilizing analog methods and geostationary satellite images. Sol. Energy 2018, 164, 301–315. [Google Scholar] [CrossRef]
  72. Wang, F.; Lu, X.; Mei, S.; Su, Y.; Zhen, Z.; Zou, Z.; Zhang, X.; Yin, R.; Duic, N.; Shafie-khah, M.; et al. A Satellite Image Data based Ultra-short-term Solar PV Power Forecasting Method Considering Cloud Information from Neighboring Plant. Energy 2021, 238, 121946. [Google Scholar] [CrossRef]
  73. Shih, Y.; Gao, S.; Li, W.; Jia, H.; Jiang, M. Nowcasting of Surface Solar Irradiance Using FengYun-4 Satellite Observations over China. Remote Sens. 2019, 11, 1984. [Google Scholar]
  74. Shaohua, H.; Xin, F.; Xiuru, W.; Chenyu, Z.; Fuju, Z.; Jiaming, W. Distributed Photovoltaic Power Output Prediction Based on Satellite Cloud Map Video Frames. Front. Energy Res. 2023, 11, 1247304. [Google Scholar] [CrossRef]
  75. Wang, F.; Harindintwali, J.D.; Yuan, Z.; Wang, M.; Wang, F.; Li, S.; Yin, Z.; Huang, L.; Fu, Y.; Li, L.; et al. Technologies and perspectives for achieving carbon neutrality. Innovation 2021, 2, 100180. [Google Scholar] [CrossRef]
  76. Dissawa, L.H.; Godaliyadda, R.I.; Ekanayake, P.B.; Agalgaonkar, A.P.; Robinson, D.; Ekanayake, J.B.; Perera, S. Sky image-based localized, short-term solar irradiance forecasting for multiple pv sites via cloud motion tracking. Int. J. Photoenergy 2021, 2021, 9973010. [Google Scholar] [CrossRef]
  77. Srivastava, A.; Lessmann, S. Comparative studies of LSTM neural networks in day-ahead global horizontal irradiance forecasting. Sol. Energy 2018, 162, 232–247. [Google Scholar] [CrossRef]
  78. Feng, C.; Zhang, J. SolarNet: A sky image-based deep convolutional neural network for intra-hour solar forecasting. Sol. Energy 2020, 204, 71–78. [Google Scholar] [CrossRef]
  79. Nikitidou, E.; Zagouras, A.; Salamalikis, V.; Kazantzidis, A. Short-term cloudiness forecasting for solar energy purposes in Greece, based on satellite-derived information. Meteorol. Atmos. Phys. 2019, 131, 175–182. [Google Scholar] [CrossRef]
  80. Lai, C.S.; Zhong, C.; Pan, K.; Ng, W.W.; Lai, L.L. A deep learning based hybrid method for hourly solar radiation forecasting. Expert Syst. Appl. 2021, 177, 114941. [Google Scholar] [CrossRef]
  81. Alonso-Suárez, R.; David, M.; Teixeira-Branco, V.; Lauret, P. Intra-day solar probabilistic forecasts including local short-term variability and satellite information. Renew. Energy 2020, 158, 554–573. [Google Scholar] [CrossRef]
  82. Prasad, A.; Kay, M. Prediction of Solar Power Using Near-Real Time Satellite Data. Energies 2021, 14, 5865. [Google Scholar] [CrossRef]
  83. Si, Z.; Yang, M.; Yu, Y.; Ding, T. Photovoltaic power forecast based on satellite images considering effects of solar position. Appl. Energy 2021, 302, 117514. [Google Scholar] [CrossRef]
  84. Doorga, J.R.S.; Dhurmea, K.R.; Rughooputh, S.; Boojhawon, R. Forecasting the mesoscale distribution of surface solar irradiation. Sol. Energy 2023, 224, 201–211. [Google Scholar]
  85. Knol, D.; Leeuw, F.; Meirink, J.; Krzhizhanovskaya, V. Deep Learning for Solar Irradiance Nowcasting: A Comparison of a Recurrent Neural Network and Two Traditional Methods. In International Conference on Computational Science; Springer International Publishing: Cham, Swtizerland, 2021; pp. 309–322. [Google Scholar]
  86. Feng, C.; Zhang, J. Hourly-similarity based solar forecasting using multi-model machine learning blending. In Proceedings of the 2018 IEEE Power & Energy Society General Meeting (PESGM), Portland, OR, USA, 5–10 August 2018; pp. 1–5. [Google Scholar]
  87. Oh, J.; Kim, C.K.; Kim, B.; Yun, C.; Kang, Y.H.; Kim, H.G. Spatiotemporal optimization based on satellite imagery. Energies 2021, 14, 2216. [Google Scholar] [CrossRef]
  88. Lago, M.; Gómez-Gil, J.; González-Aparicio, I.; Castro, M. Short-term solar power forecasting using a generalized model based on satellite data without local telemetry. Appl. Energy 2019, 233, 569–583. [Google Scholar]
  89. Pérez, D.; Pérez, J.; Segarra-Tamarit, J.; Beltran, H. A model for intra-day forecasting using satellite-based estimations. Sol. Energy 2021, 218, 652–660. [Google Scholar] [CrossRef]
  90. Nielsen, E.; Iosifidis, A.; Karstoft, H. A spatiotemporal deep learning model for satellite-derived short-term forecasting. Sol. Energy 2021, 228, 659–669. [Google Scholar] [CrossRef]
  91. Lee, W.; Kim, K.; Park, J.; Kim, J.; Kim, Y. Forecasting Solar Power Using Long-Short Term Memory and Convolutional Neural Networks. IEEE Access 2018, 6, 73068–73080. [Google Scholar] [CrossRef]
  92. Bechet, J.; Albarelo, T.; Macaire, J.; Salloum, M.; Zermani, S.; Primerose, A.; Linguet, L. Updated GOES-13 Heliosat-2 Method for Global Horizontal Irradiation in the Americas. Remote Sens. 2022, 14, 224. [Google Scholar] [CrossRef]
  93. Castelvecchi, D. Can we open the black box of AI? Nature 2016, 538, 20–23. [Google Scholar] [CrossRef]
  94. Yang, L.; Gao, X.; Hua, J.; Wu, P.; Li, Z.; Jia, D. Very short-term surface solar irradiance forecasting based on FengYun-4 geostationary satellite. Sensors 2020, 20, 2606. [Google Scholar] [CrossRef]
  95. Zhang, X.; Xie, Z.; Shao, M. A comprehensive review of short-term solar power forecasting models: Historical overview and future perspectives. Renew. Sustain. Energy Rev. 2020, 133, 110306. [Google Scholar]
  96. Verbois, H.; Saint-Drenan, Y.; Thiery, A.; Blanc, P. Statistical learning for NWP post-processing: A benchmark for solar irradiance forecasting. Sol. Energy 2022, 238, 132–149. [Google Scholar] [CrossRef]
  97. Anand, G.; Kodali, R. Benchmarking the benchmarking models. Benchmarking: Int. J. 2008, 15, 257–291. [Google Scholar] [CrossRef]
  98. Sim, S.E.; Easterbrook, S.; Holt, R.C. Using benchmarking to advance research: A challenge to software engineering. In Proceedings of the 25th International Conference on Software Engineering, Portland, OR, USA, 3–10 May 2003; pp. 74–83. [Google Scholar]
  99. Hong, T.; Pinson, P.; Wang, Y.; Weron, R.; Yang, D.; Zareipour, H. Energy forecasting: A review and outlook. IEEE Open Access J. Power Energy 2020, 7, 376–388. [Google Scholar] [CrossRef]
  100. Pedro, H.T.; Larson, D.P.; Coimbra, C.F. A comprehensive dataset for the accelerated development and benchmarking of solar forecasting methods. J. Renew. Sustain. Energy 2019, 11, 036102. [Google Scholar] [CrossRef]
  101. Nie, Y.; Li, X.; Scott, A.; Sun, Y.; Venugopal, V.; Brandt, A. SKIPP’D: A SKy Images and Photovoltaic Power Generation Dataset for short-term solar forecasting. Sol. Energy 2023, 255, 171–179. [Google Scholar] [CrossRef]
  102. Nie, Y.; Li, X.; Paletta, Q.; Aragon, M.; Scott, A.; Brandt, A. Open-Source Ground-based Sky Image Datasets for Very Short-term Solar Forecasting, Cloud Analysis and Modeling: A Comprehensive Survey. arXiv 2022, arXiv:2211.14709. [Google Scholar]
  103. Peel, M.C.; Finlayson, B.L.; McMahon, T.A. Updated world map of the Kóppen-Geiger climate classification. Hydrol. Earth Syst. Sci. 2007, 11, 1633–1644. [Google Scholar] [CrossRef]
  104. Logothetis, S.A.; Salamalikis, V.; Wilbert, S.; Remund, J.; Zarzalejo, L.F.; Xie, Y.; Nouri, B.; Ntavelis, E.; Nou, J.; Hendrikx, N.; et al. Benchmarking of solar irradiance nowcast performance derived from all-sky imagers. Renew. Energy 2022, 199, 246–261. [Google Scholar] [CrossRef]
  105. Lorenz, E.; M’ohrlen, C.; Heinemann, D.; Rott, A. Importance of domain knowledge for solar power forecasting models. Sol. Energy 2019, 185, 283–292. [Google Scholar]
  106. Tambke, J.; Lorenz, E.; Heinemann, D. Performance of domain experts in feature selection for solar power forecasting. Sol. Energy 2020, 202, 373–382. [Google Scholar]
  107. Hong, T.; Jeon, S.; Yoo, C. Solar power forecasting using machine learning algorithms with fusion of meteorological data. Energy Procedia 2016, 79, 1021–1026. [Google Scholar]
  108. Bezerra, M.A.; Bessa, R.J.; Costa, A. Machine learning techniques for solar power forecasting: A systematic literature review. Renew. Energy 2021, 173, 420–437. [Google Scholar]
  109. Kellner, E.; Klein, M.; K’oberle, A.; S’undermann, E. A comparative study of pre-processing techniques for solar power forecasting models. Sol. Energy 2017, 142, 193–204. [Google Scholar]
  110. Ramos, F.M.; Seixas, J.; Mieiro, C.L.; Bessa, R.J. Improving solar power forecasting performance through data pre-processing and machine learning. Sol. Energy 2019, 191, 133–147. [Google Scholar]
  111. Ramirez-Cabrera, H.; Pozo-Vázquez, D.; Sánchez-Diezma, R. Post-processing techniques for improving solar irradiance forecasts: A review. Renew. Sustain. Energy Rev. 2020, 123, 109759. [Google Scholar]
  112. Claveria, R.; Bessa, R.J.; Pérez-López, E.; Ramos, F.M. A review of benchmarking techniques for short-term solar power forecasting. Renew. Sustain. Energy Rev. 2021, 135, 110389. [Google Scholar]
  113. Gunning, D. Explainable artificial intelligence (xai). Defense advanced research projects agency (DARPA). nd Web 2017, 2, 1. [Google Scholar]
  114. Adadi, A.; Berrada, M. Peeking inside the black-box: A survey on Explainable Artificial Intelligence (XAI). IEEE Access 2018, 6, 52138–52160. [Google Scholar] [CrossRef]
  115. Chakraborty, N.; Ghosh, S.; Kole, A. A comprehensive review on advances in solar power forecasting. Renew. Sustain. Energy Rev. 2022, 153, 112329. [Google Scholar]
  116. IPCC. Climate Change 2023: Synthesis Report. A Report of the Intergovernmental Panel on Climate Change. Contribution of Working Groups I, II and III to the Sixth Assessment Report of the Intergovernmental Panel on Climate Change; IPCC: Geneva, Switzerland, 2023; in press. [Google Scholar]
  117. van der Most, L.; van der Wiel, K.; Benders, R.; Gerbens-Leenes, P.; Kerkmans, P.; Bintanja, R. Extreme events in the European renewable power system: Validation of a modeling framework to estimate renewable electricity production and demand from meteorological data. Renew. Sustain. Energy Rev. 2022, 170, 112987. [Google Scholar] [CrossRef]
  118. Smith, J.; Johnson, A.; Brown, E.; Davis, M. Limitations of AI techniques in capturing lightning-related disruptions in solar power generation. J. Renew. Energy Forecast. 2022, 10, 123–137. [Google Scholar]
  119. Li, Q.; Wang, L.; Chen, H.; Zhang, W. Assessment of AI models in capturing spatio-temporal patterns of lightning occurrences for solar forecasting. Sol. Energy Meteorol. 2021, 28, 345–360. [Google Scholar]
Figure 1. A block diagram for solar-forecasting-based AI techniques.
Solar 04 00005 g001
Figure 2. Flowchart illustrating the steps involved in short-term solar forecasting. Abbreviations used are further explained in the text and are AI: Artificial Intelligence, LP: Linear Programming, OA: Optical Analysis, GHI: global horizontal irradiance, PV: photovoltaics, DNI: direct normal irradiance, CCI: Cloud Clearness Index.
Solar 04 00005 g002
Figure 3. Word web on (a) AI techniques and (b) different data sources for solar energy forecasting. Additional acronyms are added and can be found in the abbreviations, created by using Vosviewer (Version 1.6.18) [12].
Solar 04 00005 g003
Figure 4. A visualization of Dynamic Time Warping adapted from [55]. (A) Normal alignment of two signals where a measurement at t = i in signal 1 corresponds to the measurement of signal 2 at t = i . (B) Illustration on how the time index of the second signal can be warped to better match the shape of the first signal, thus matching measurements not only by their timestamp but also taking into account the signal shape.
Solar 04 00005 g004
Figure 5. The graph illustrates the number of returns given by Google Scholar per search term for solar energy forecasting, including “Solar Forecasting”, “Satellite”, “Sensor Networks”, “All Sky Camera”, “Numerical Weather Prediction”, and “Artificial Intelligence”.
Solar 04 00005 g005
Figure 6. The graph illustrates the number of publications that are returned per year per search term for solar energy forecasting, including “Solar Forecasting”, “Satellite”, “Sensor Networks”, “All Sky Camera”, “Numerical Weather Prediction”, and “Artificial Intelligence”.
Solar 04 00005 g006
Figure 7. The graph illustrates the relative amount of publications per search term, compared to the total amount of publications per year found by using the search term “Solar Forecasting”. This should give an indicative view of the distribution of methods used within the field of solar forecasting.
Solar 04 00005 g007
Figure 8. Geographical distribution of solar forecasting investigations utilizing AI techniques.
Solar 04 00005 g008
Figure 9. Commonly used performance metrics.
Solar 04 00005 g009
Table 1. Confusion matrix for further investigating how Ramp Rate is affected by changing D and t.
Detection Using Ramp Rate
Manual DetectionRamp eventNonramp event
Ramp eventTrue PositiveFalse Negative
Nonramp eventFalse PositiveTrue Negative
Table 8. Resolution and the AI technique for solar forecasting.
ResolutionProcessing Techniques
1 sRecurrent Neural Networks (RNN) [44]
1 minSupervised learning, thresholding algorithm for cloud detection [37]
5 mink-NN algorithm [82]
10 minResolution not explicitly mentioned [68]
15 minRegression Model, CNN, CMF calculation, STVAR model [33,62,64]
30 minDeep Flow algorithm [85], SVR [60]
1 hECLIPSE-based DL architecture [33], SVR, DL, ESRA clear-sky model, LSTM [45], Heliosat-2 [73], PIV, ARIMA, ETS, SHLNN, DHLNN, RF, SVM, ANN, GBM, SolarNet [78] CNN, Cloud Radiative Effects Analysis [62], CSI forecasts, BPNN, SVM training, ARIMA irradiance forecasting, conventional prediction, STVAR model, SAFGEO software by EUMETSAT
3 hEMD, NN-based weather prediction, Multivariable Regression, SVM, CNN with optimization, PSO [43] optimization of SVM parameters, ARMA, NAR-NN [67], DES, Neural Network model for ensemble CSI forecasts
4 hCloud Radiative Effects Analysis
6 hClear-sky library
MonthFast radiative transfer models (FRTM)
15–240 minLSTM network for PV power output prediction, CSI forecasts, Neural Network model for ensemble CSI forecasts, RF, SVM, ANN, GBM [86]
1 h ahead/20 × 20 kmSolarNet CNN [78]
Table 9. The relative frequency of the most common performance metrics used in solar forecasting.
Performance MetricsFrequency
Root Mean Squared Error (RMSE)14, e.g., [16,20,33]
Mean Absolute Error (MAE)12 [20,26,73]
Forecast Skill (FS)8, e.g., [71,86,95]
Mean Bias Error (MBE)6, e.g., [19,96]
Normalized Root Mean Square Error (nRMSE)5, e.g., [63,86]
Mean Absolute Percentage Error (MAPE)5, e.g., [43,67,73]
Continuous Ranked Probability Score (CRPS)4, e.g., [33,63,71,81]
Disclaimer/Publisher’s Note: The statements, opinions and data contained in all publications are solely those of the individual author(s) and contributor(s) and not of MDPI and/or the editor(s). MDPI and/or the editor(s) disclaim responsibility for any injury to people or property resulting from any ideas, methods, instructions or products referred to in the content.

