
Automating Quality Control of Irradiance Data with a Comprehensive Analysis for Southern Africa

Abstract
:1. Introduction
2. Background
3. Methodology
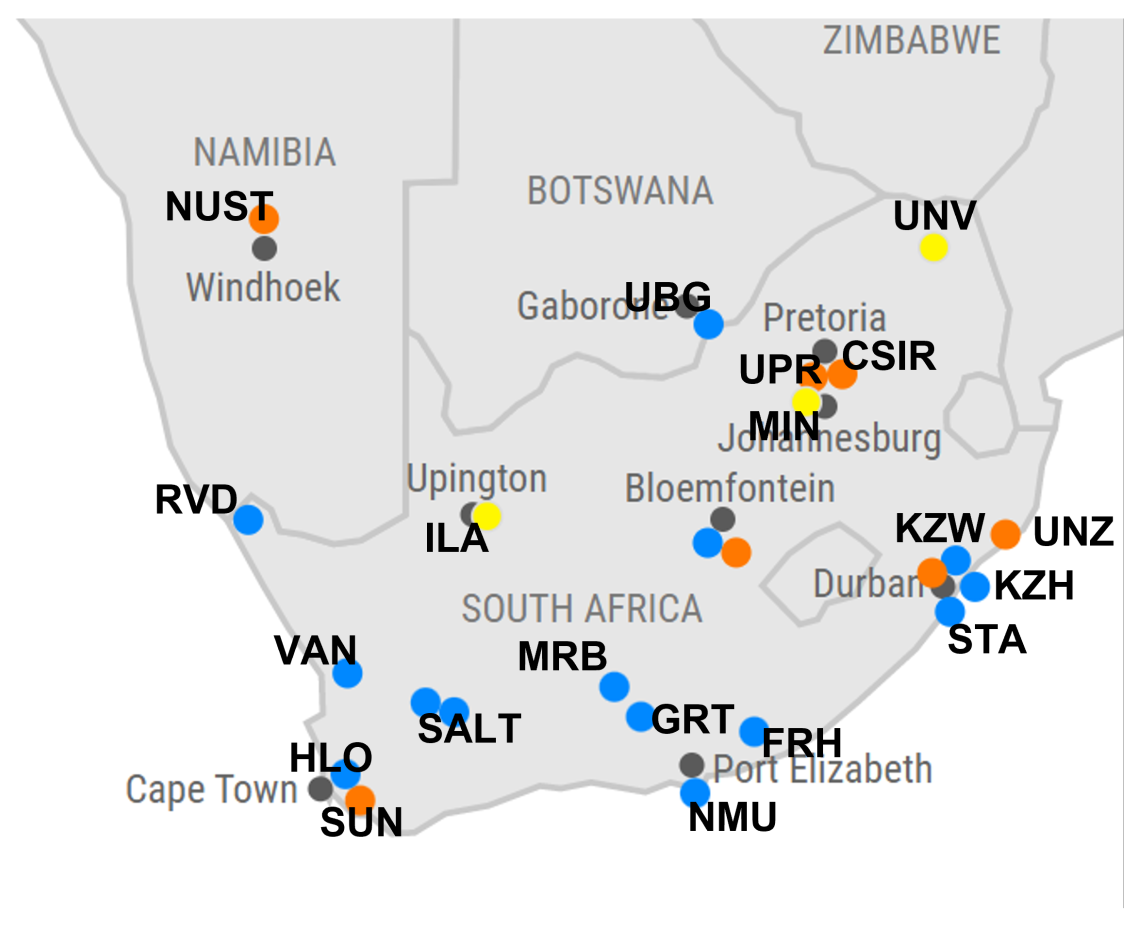
3.1. SAURAN Station Summary
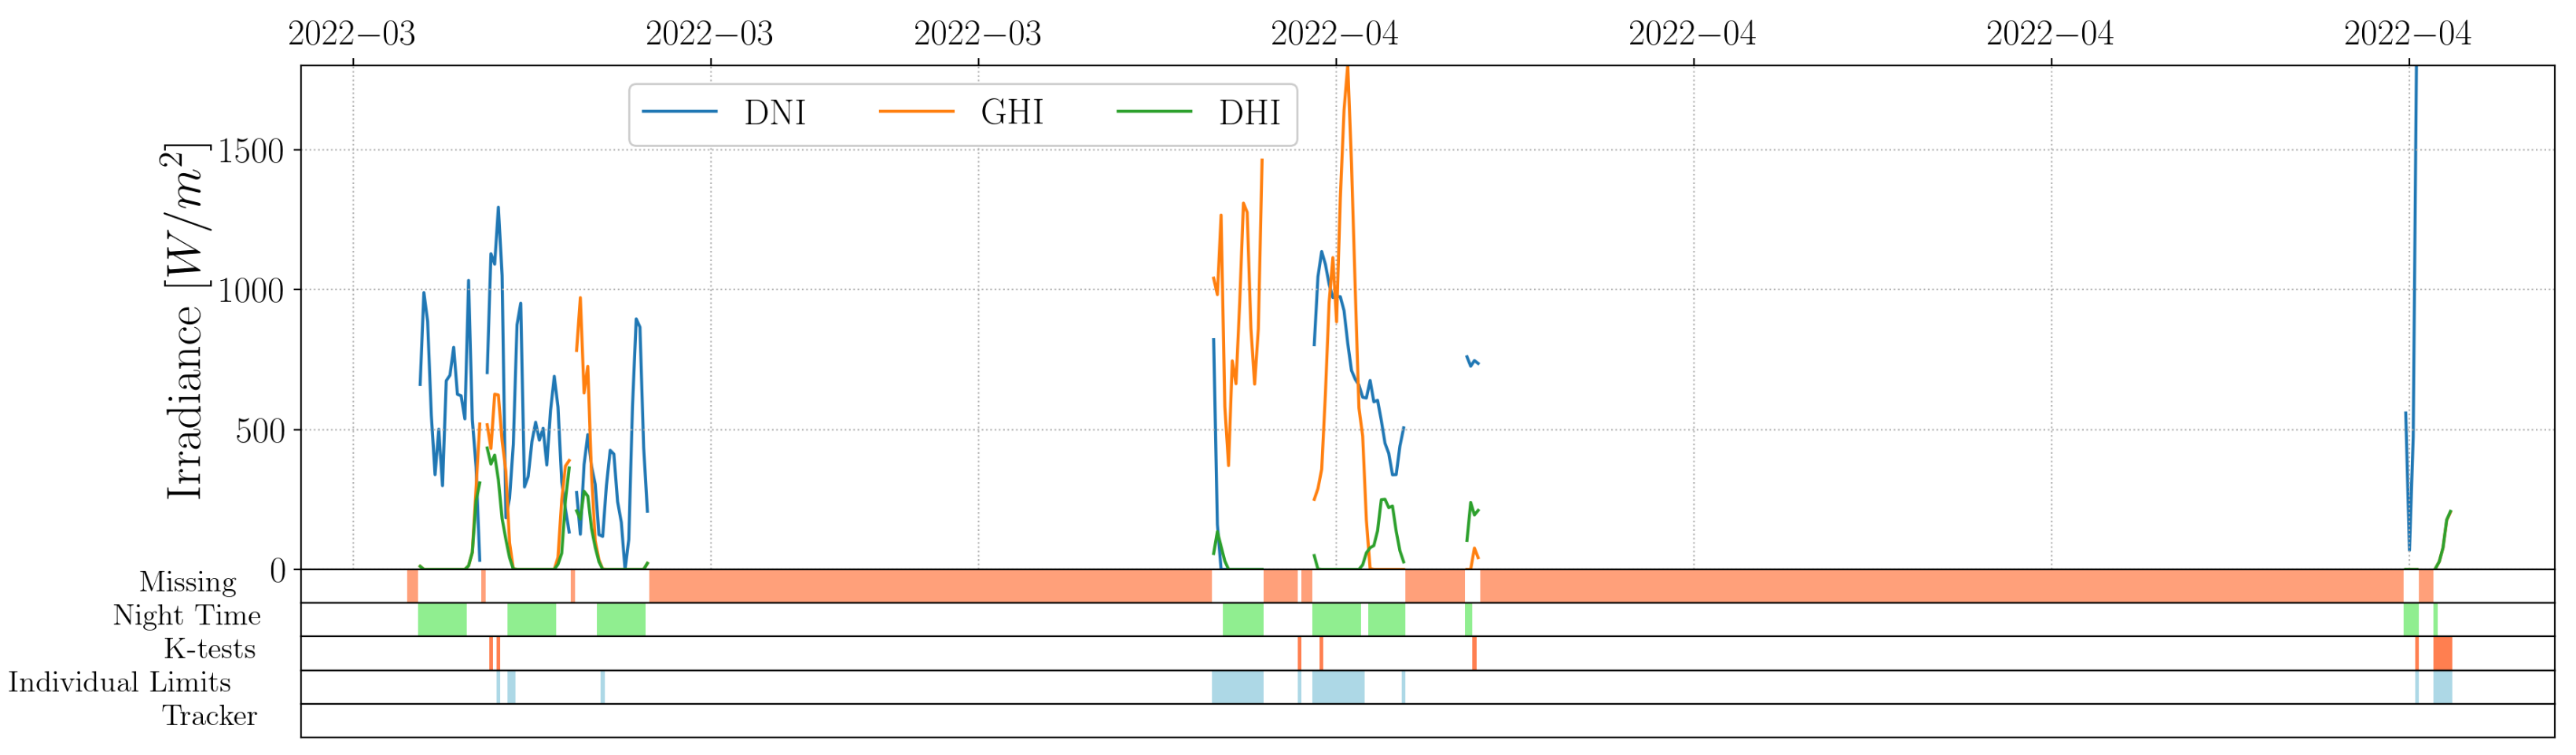
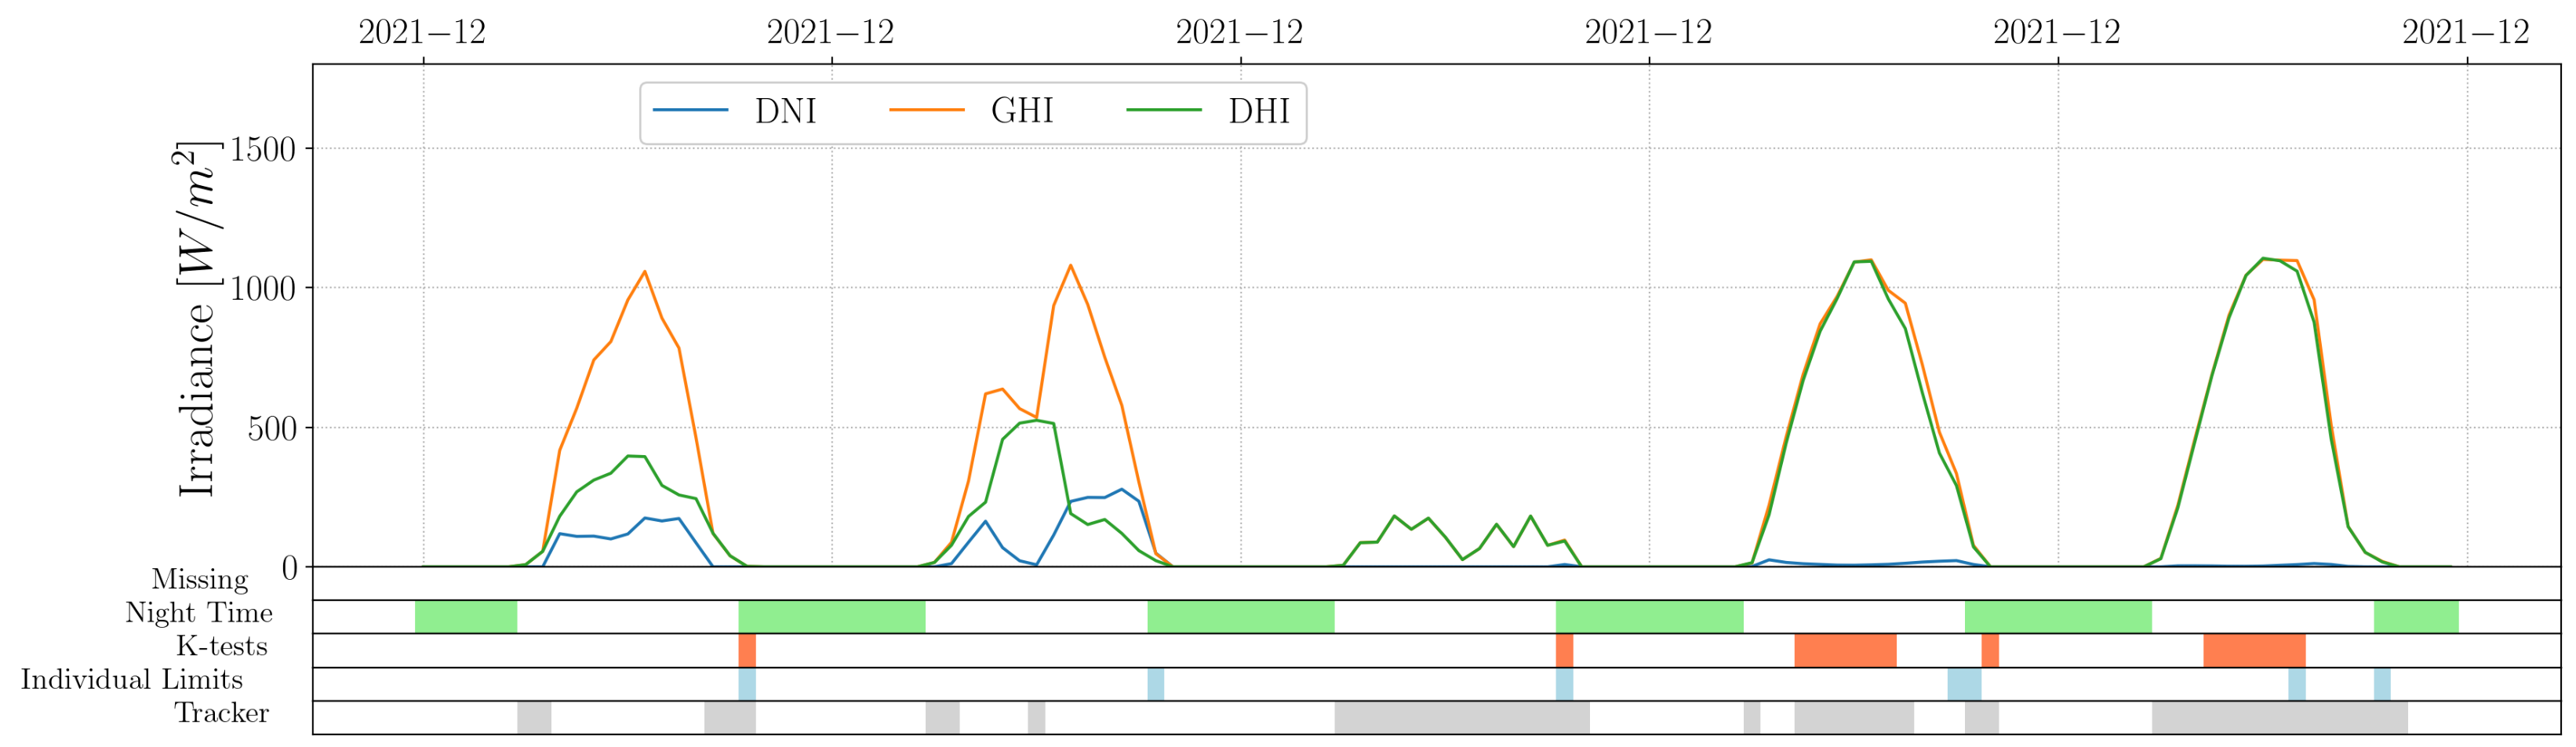
3.2. Automated Quality Control
3.2.1. Night-Time Values
3.2.2. K-Tests
3.2.3. Individual Limits
3.2.4. Tracking Error
3.3. Correlation Assessment
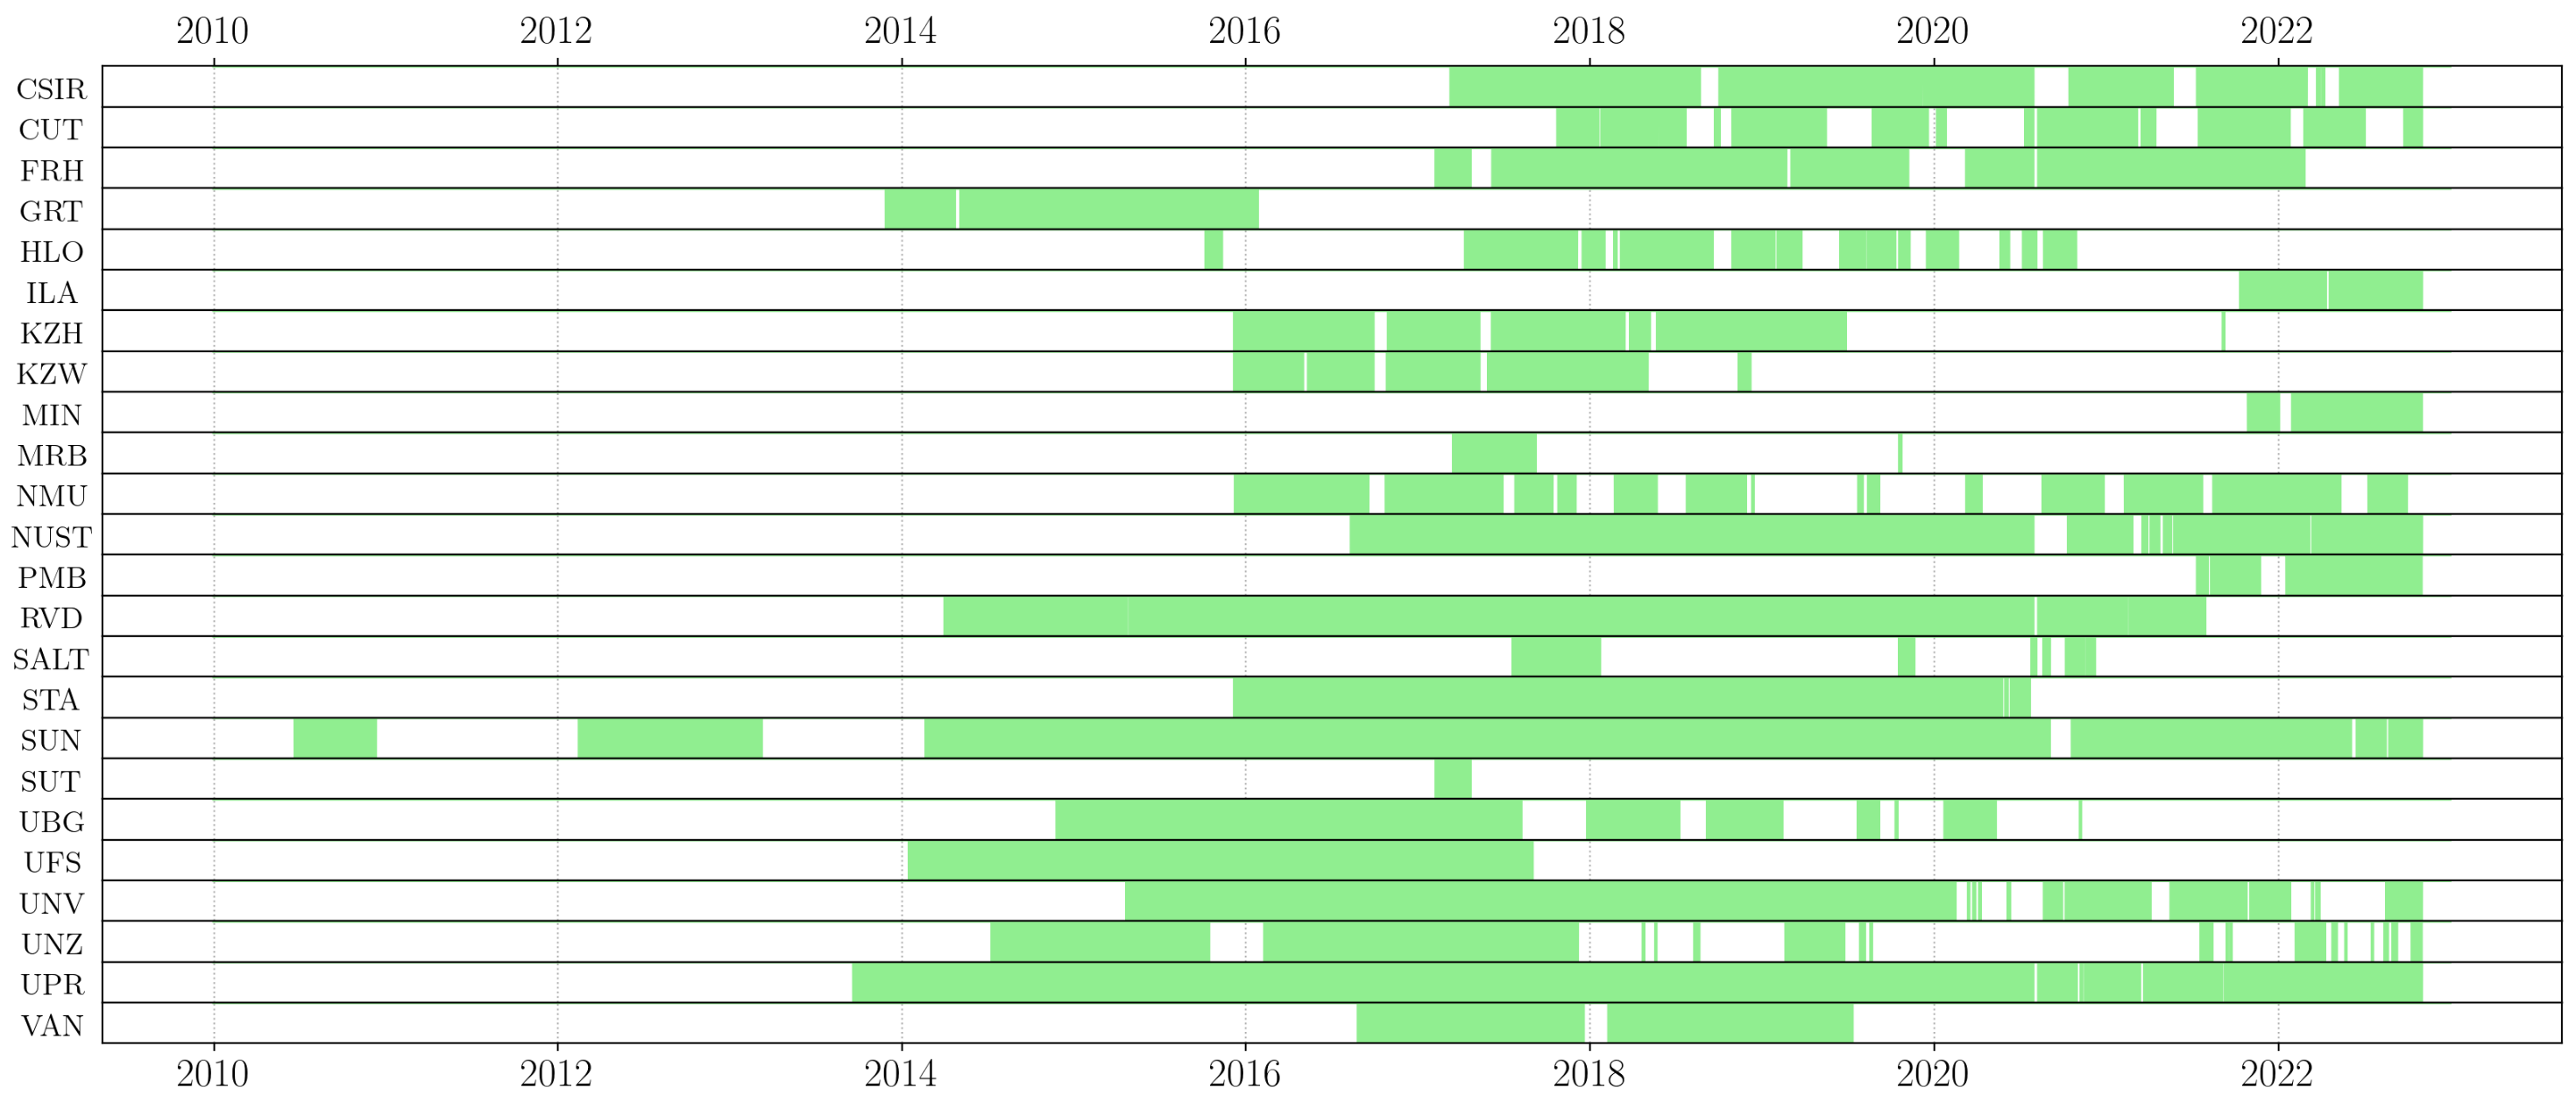
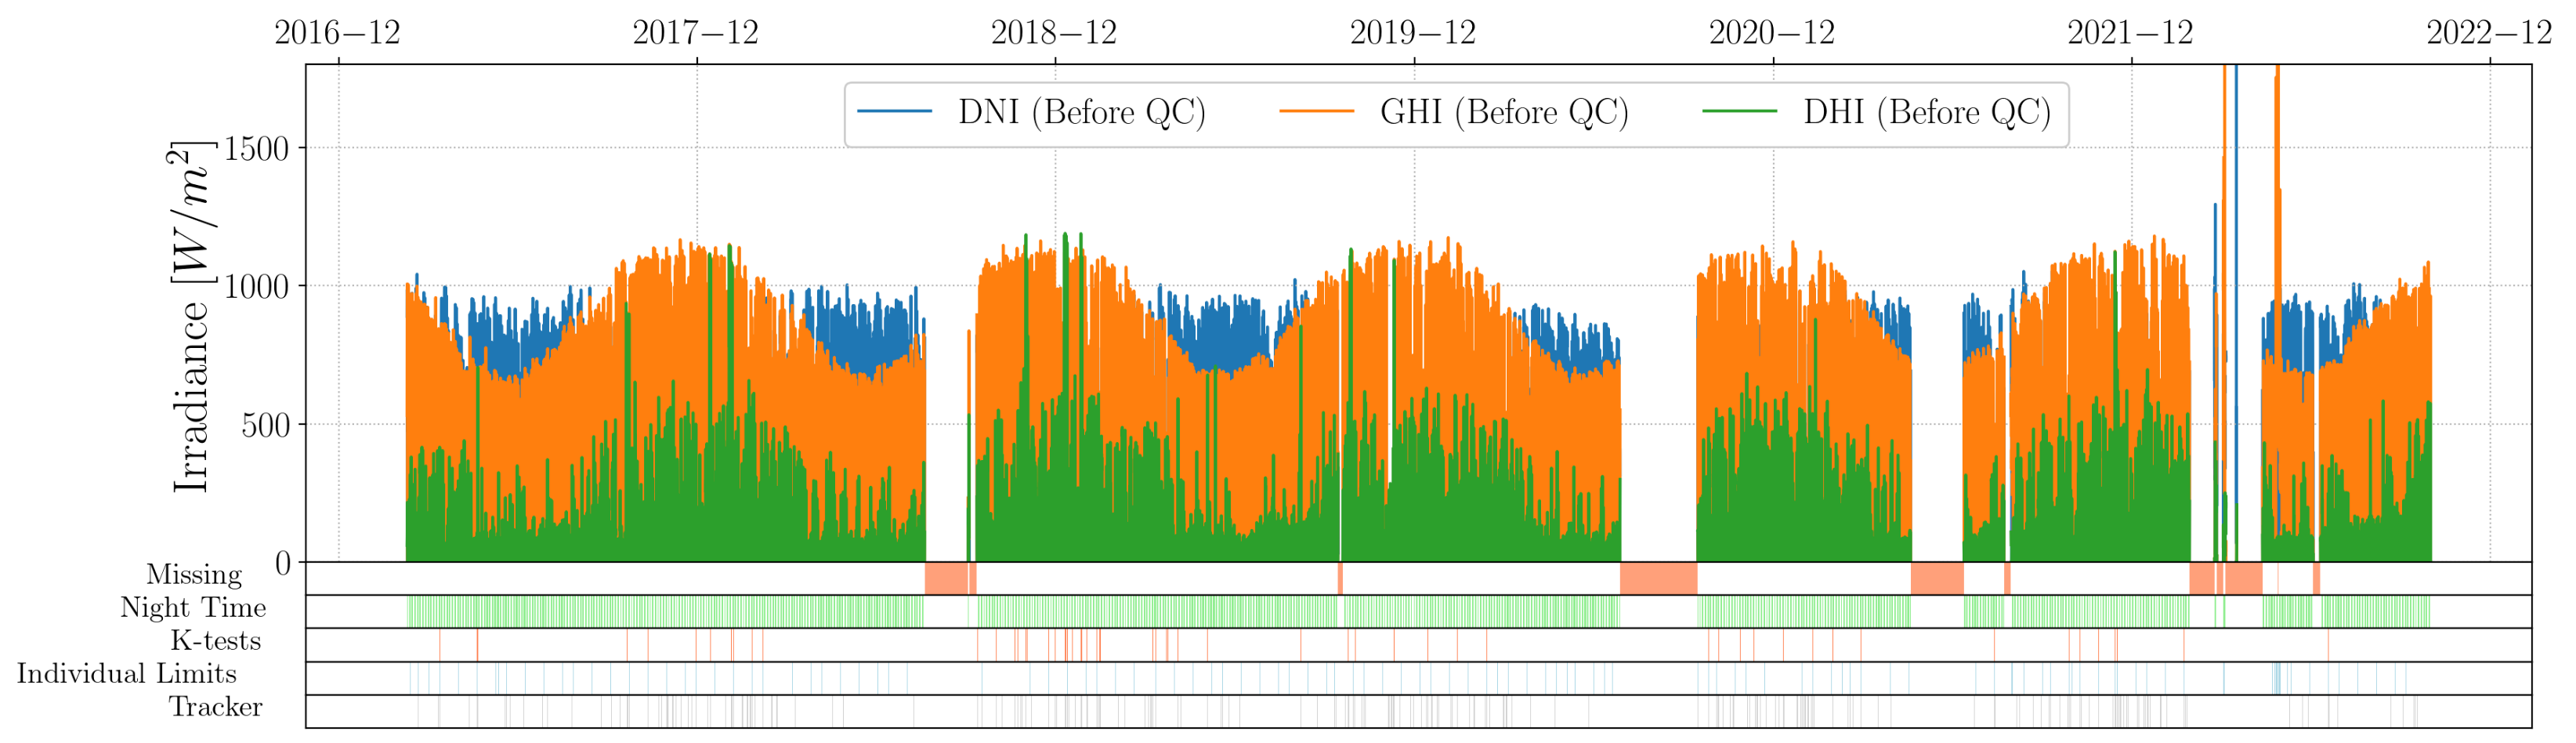
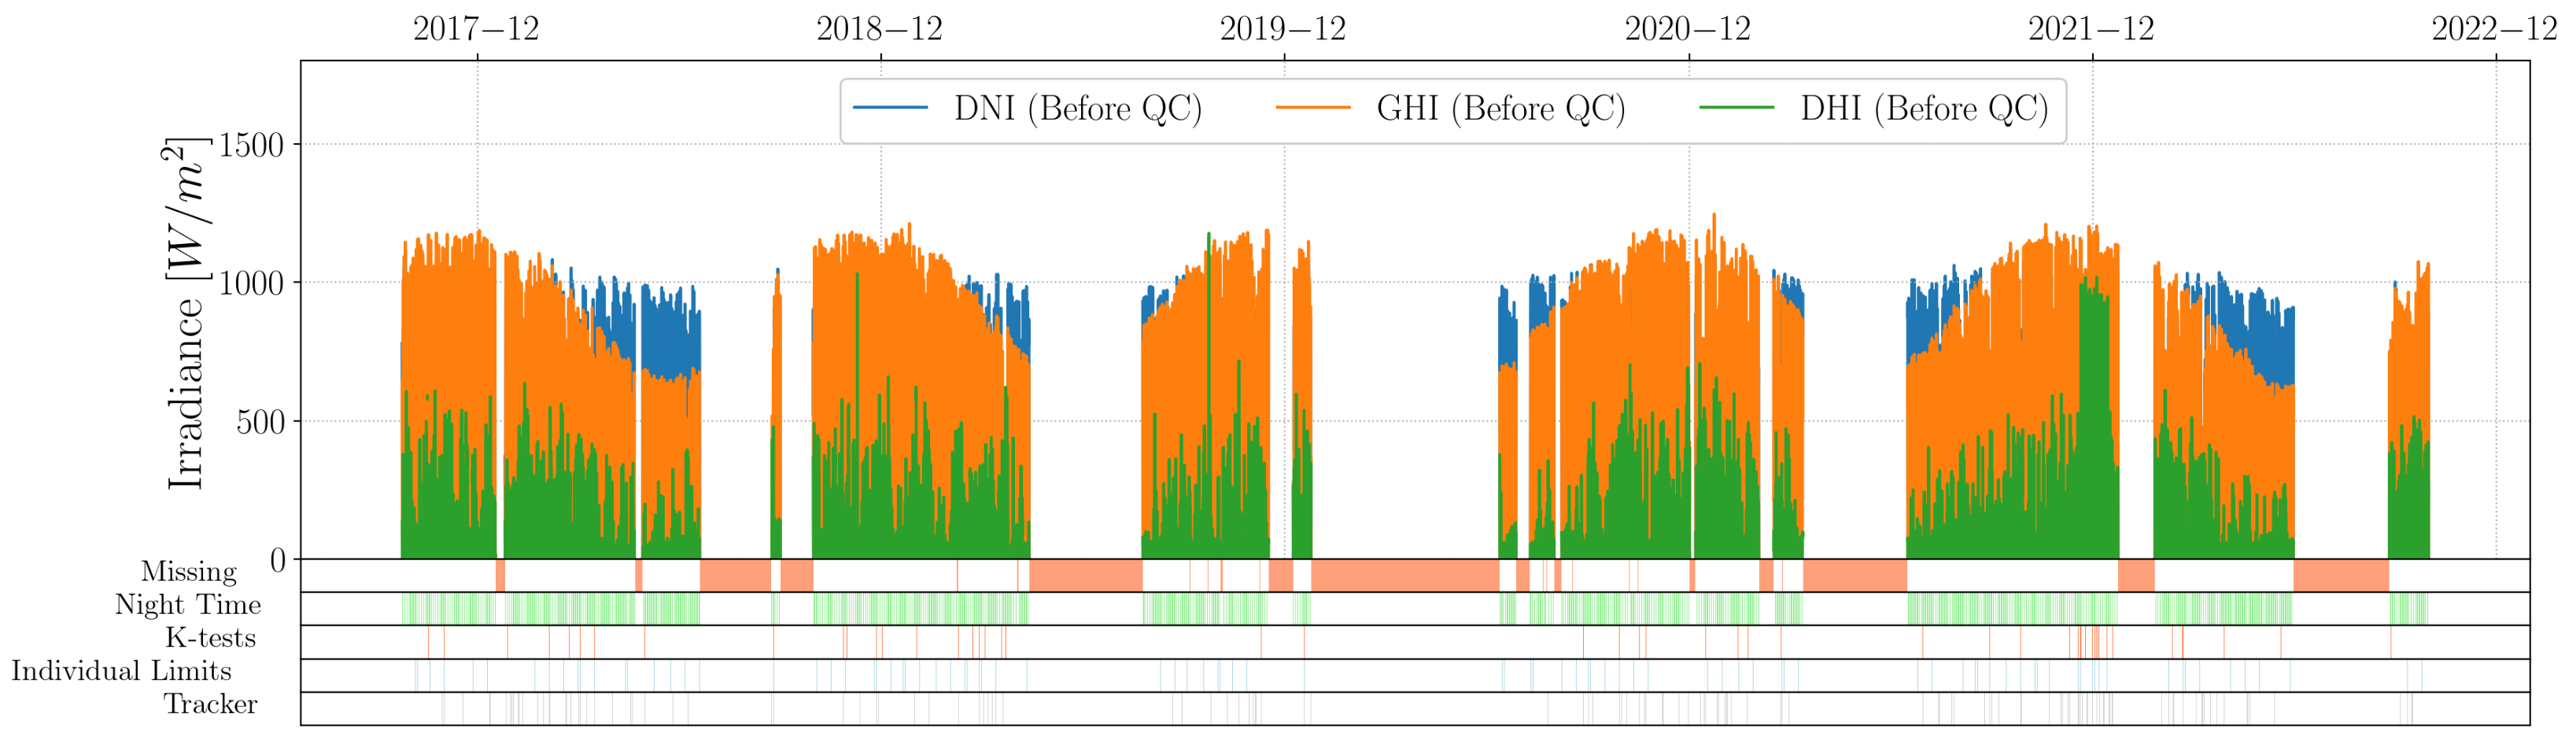
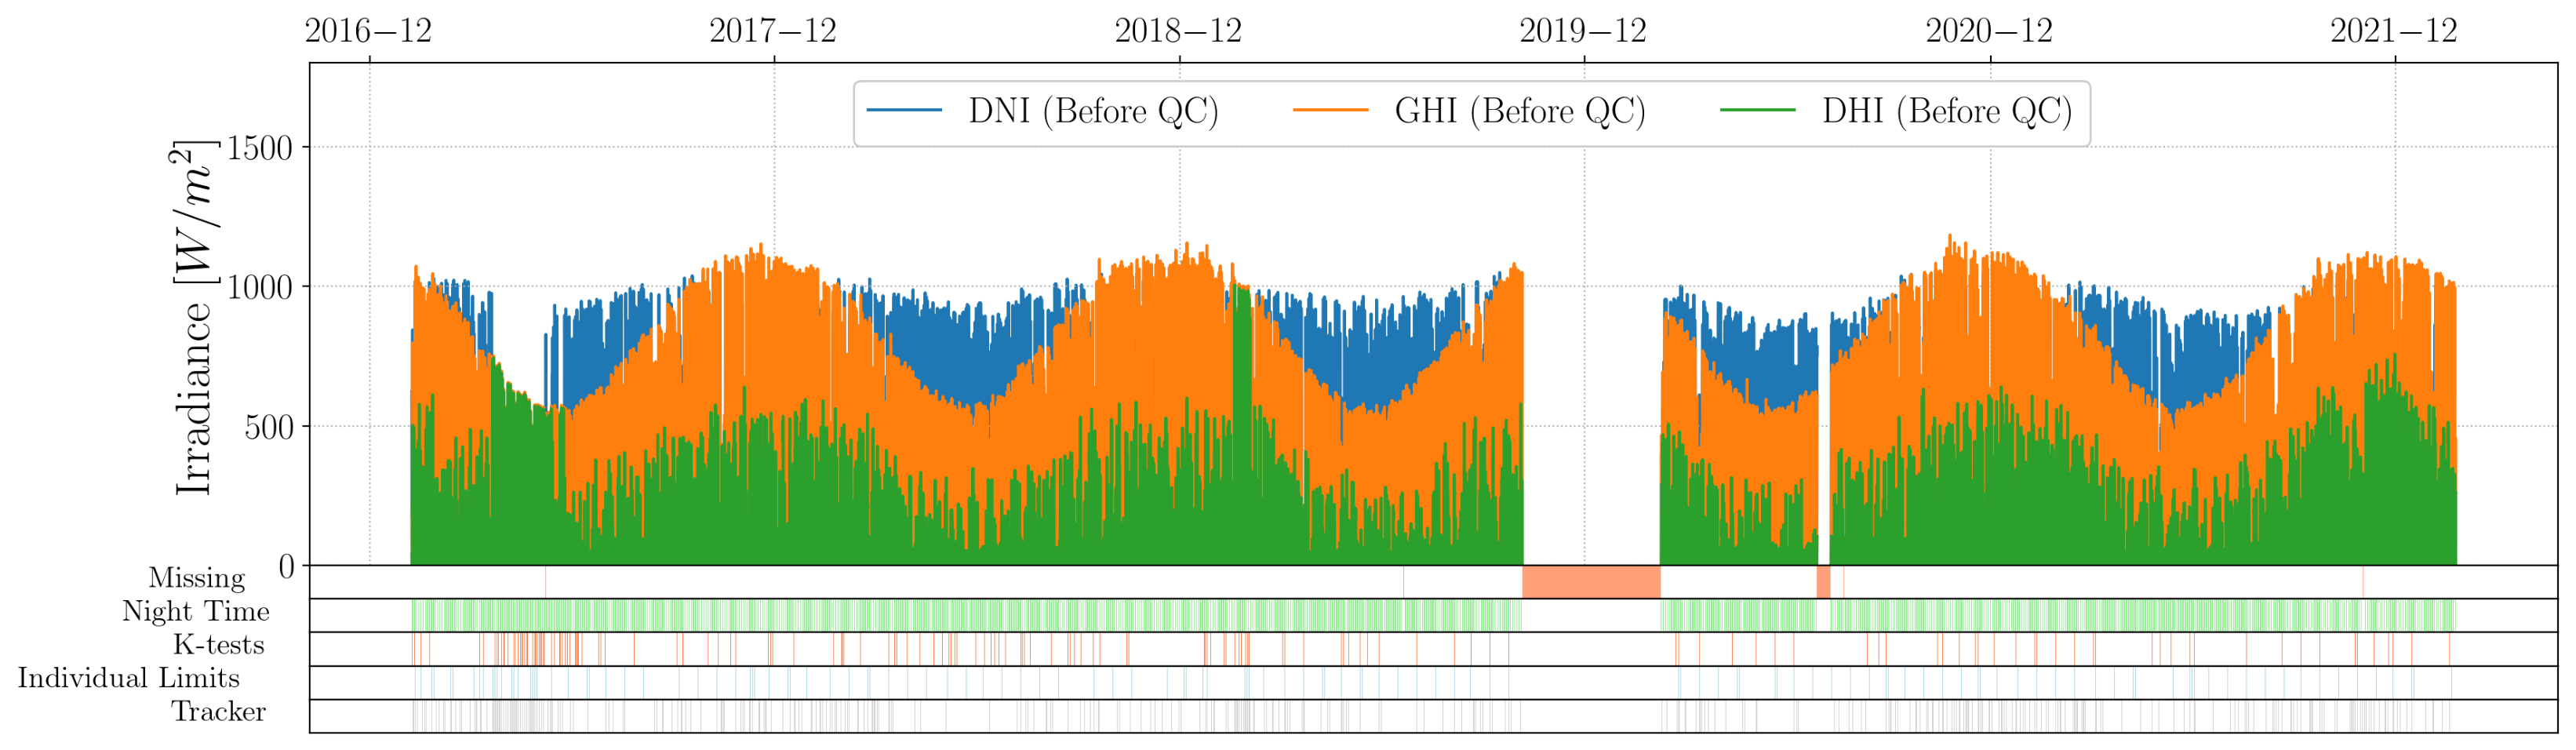
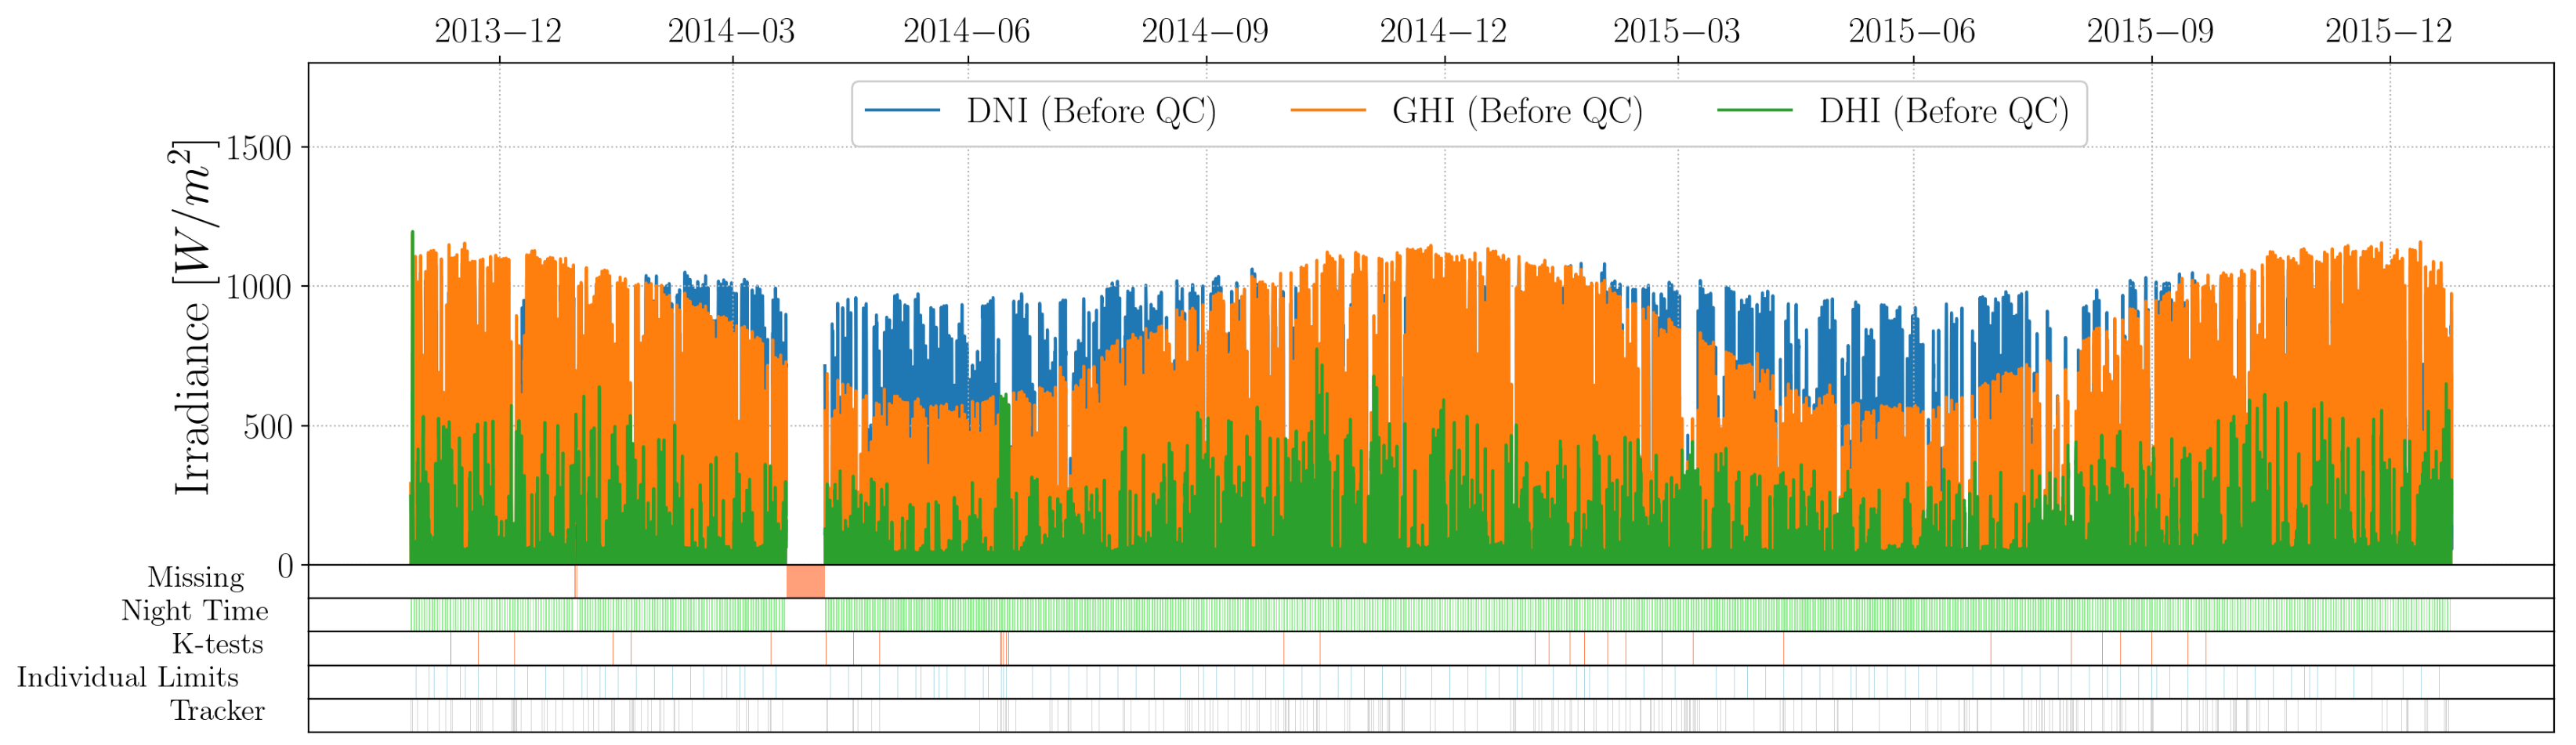
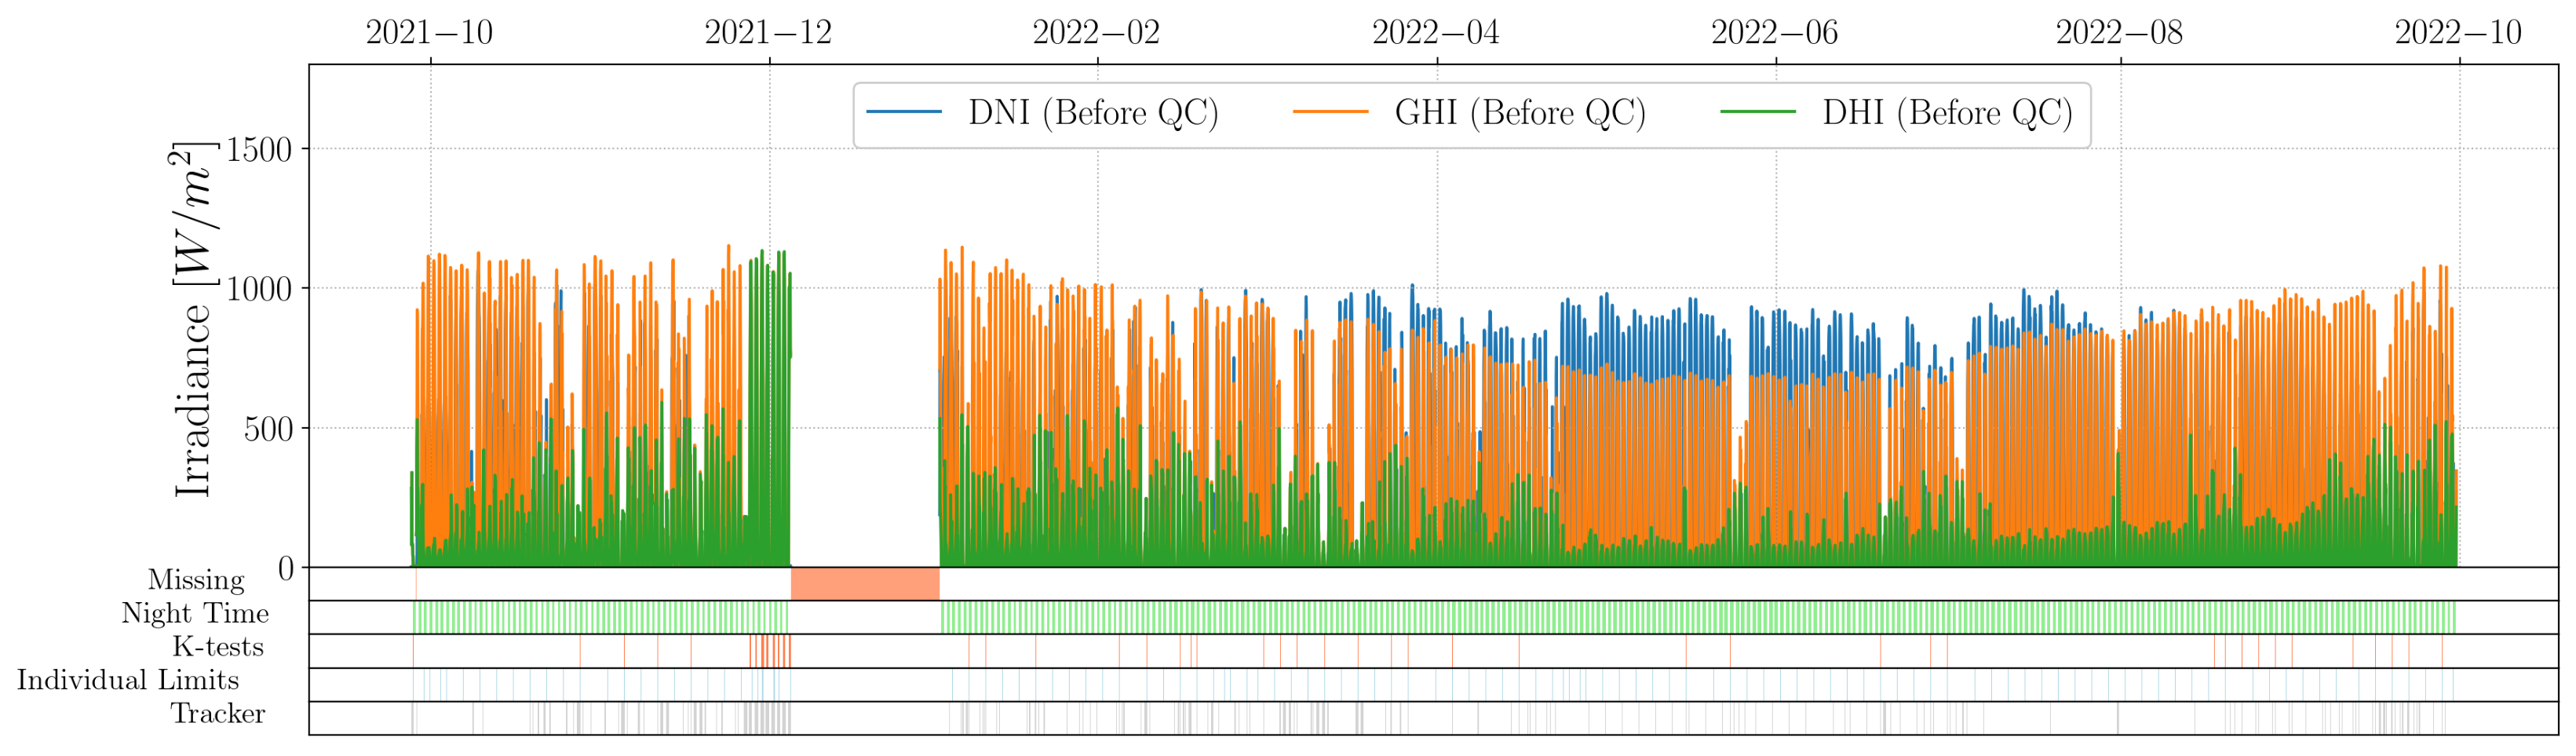
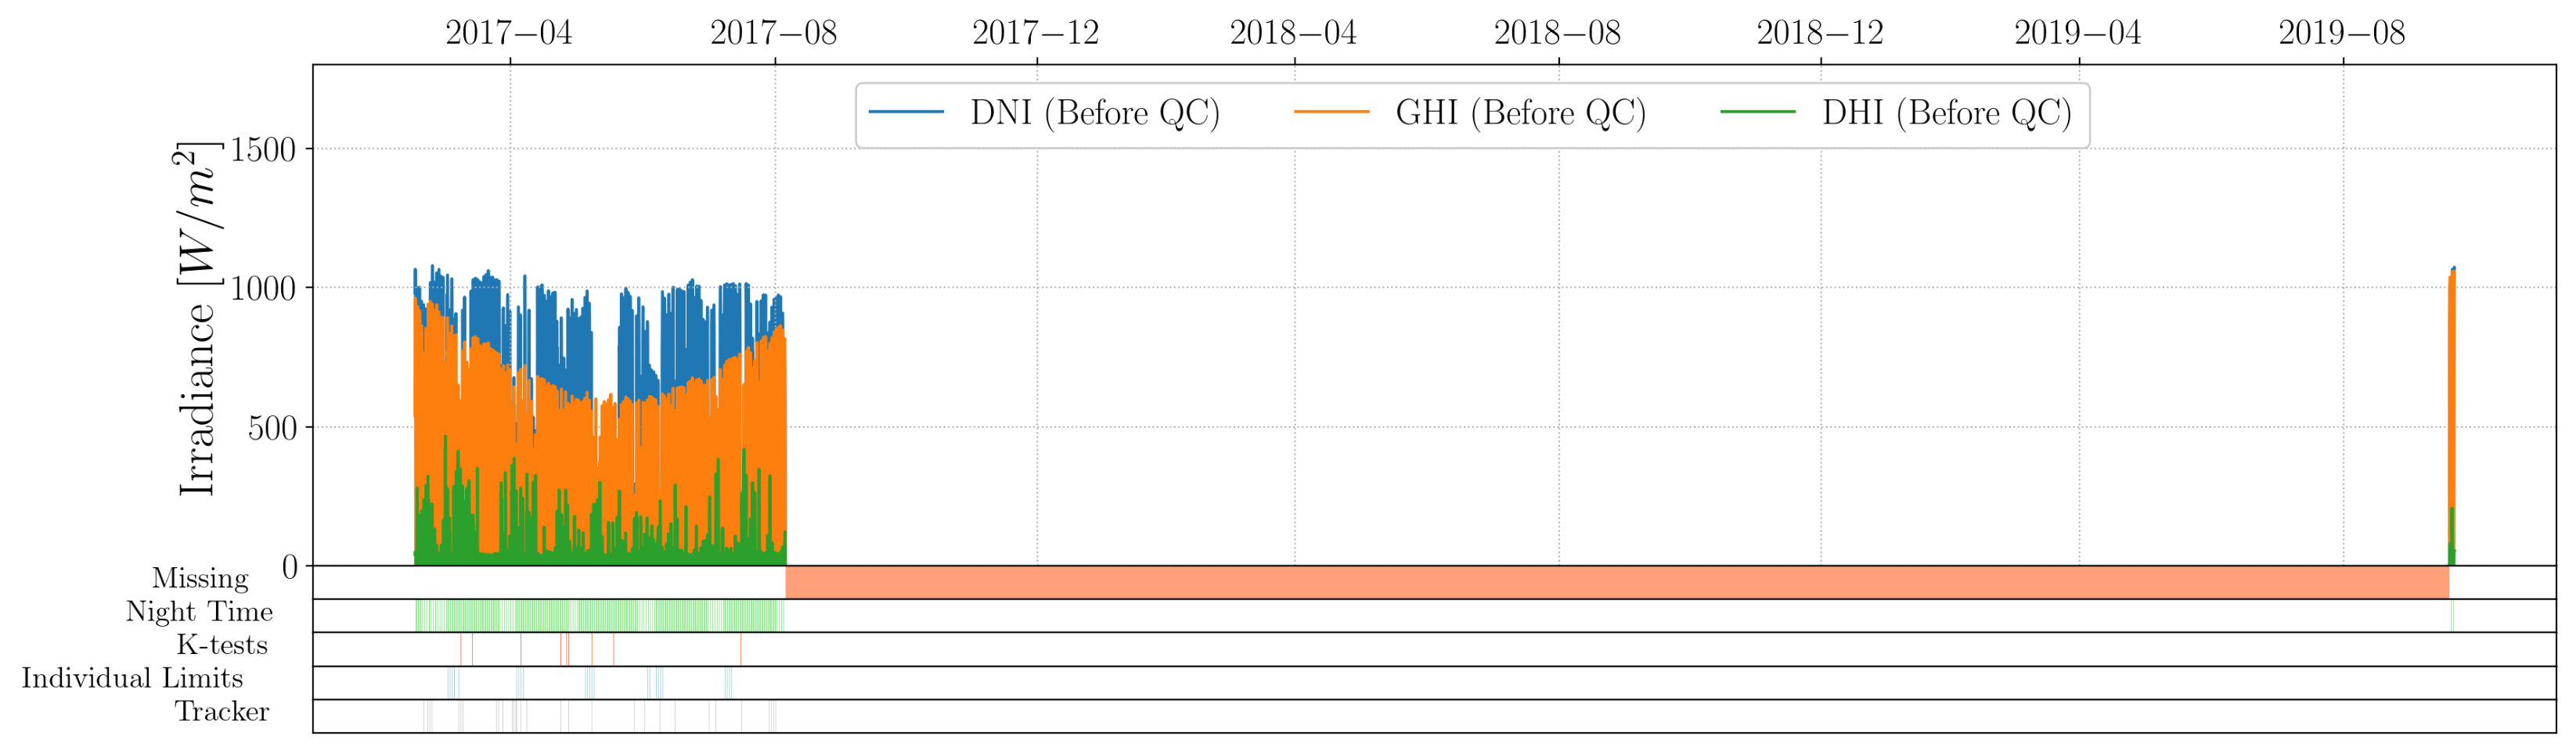
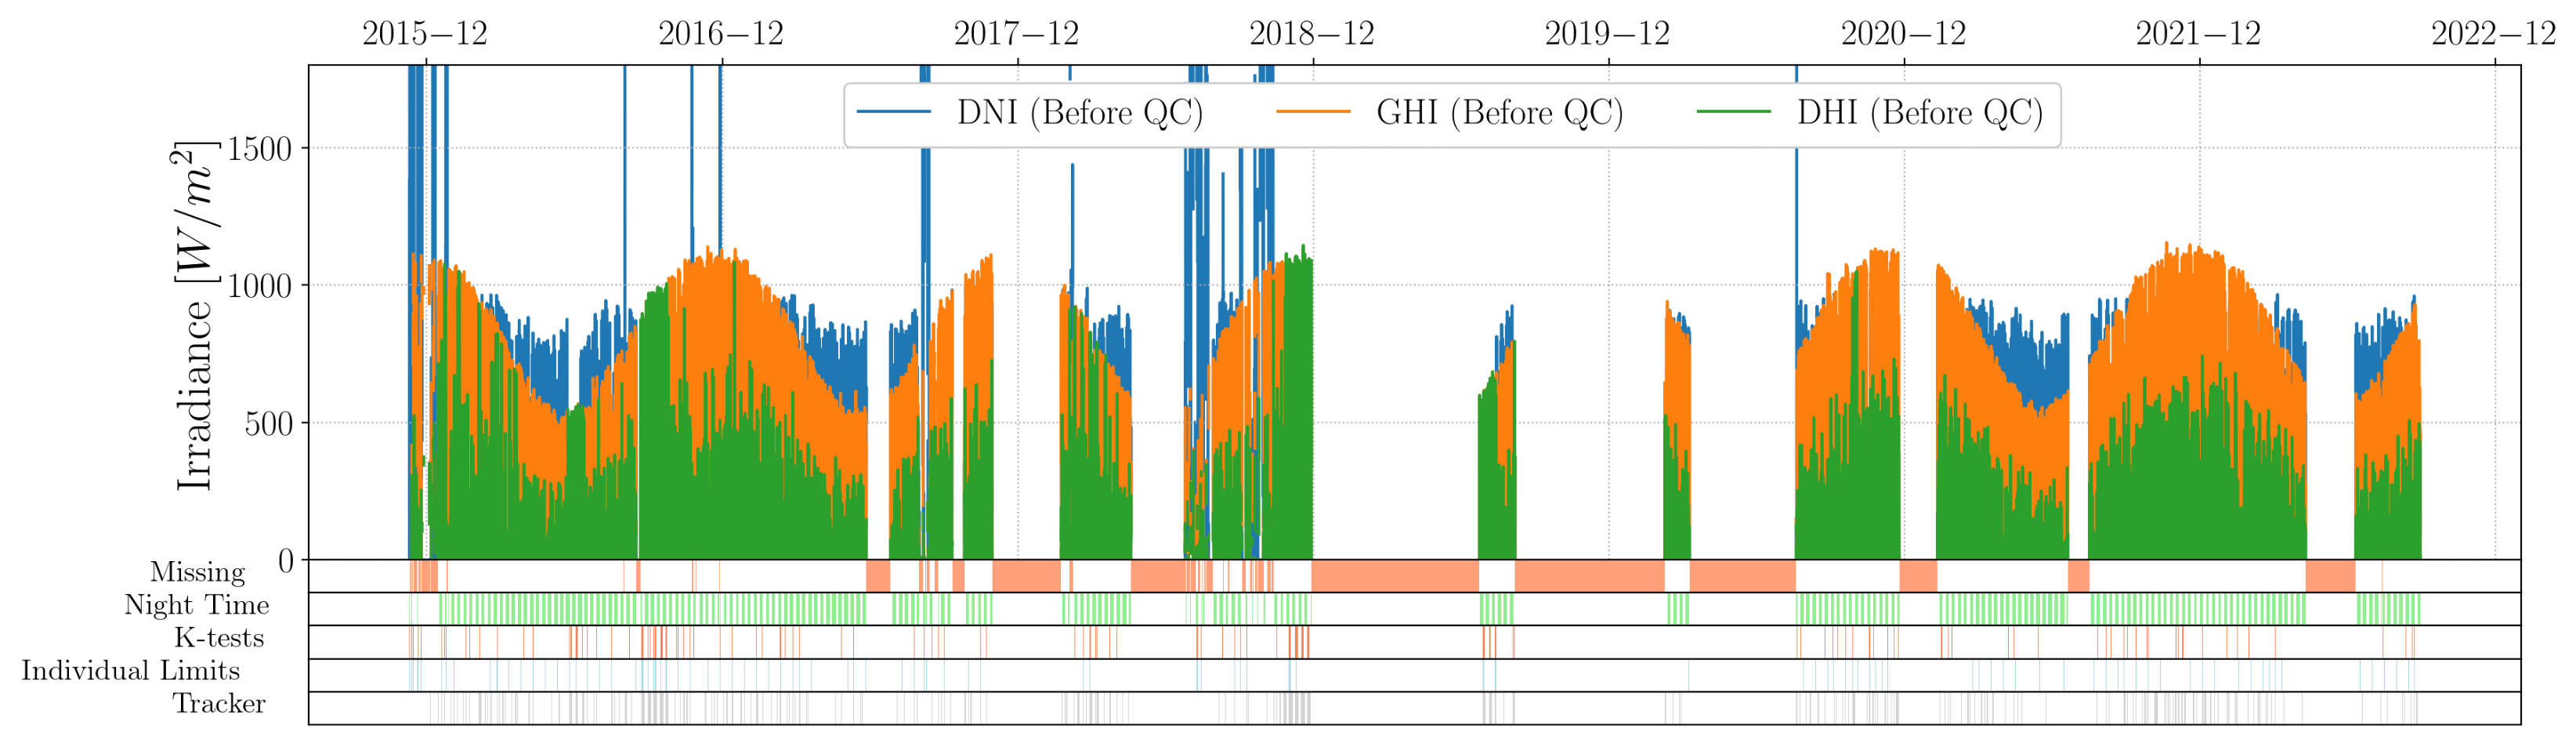
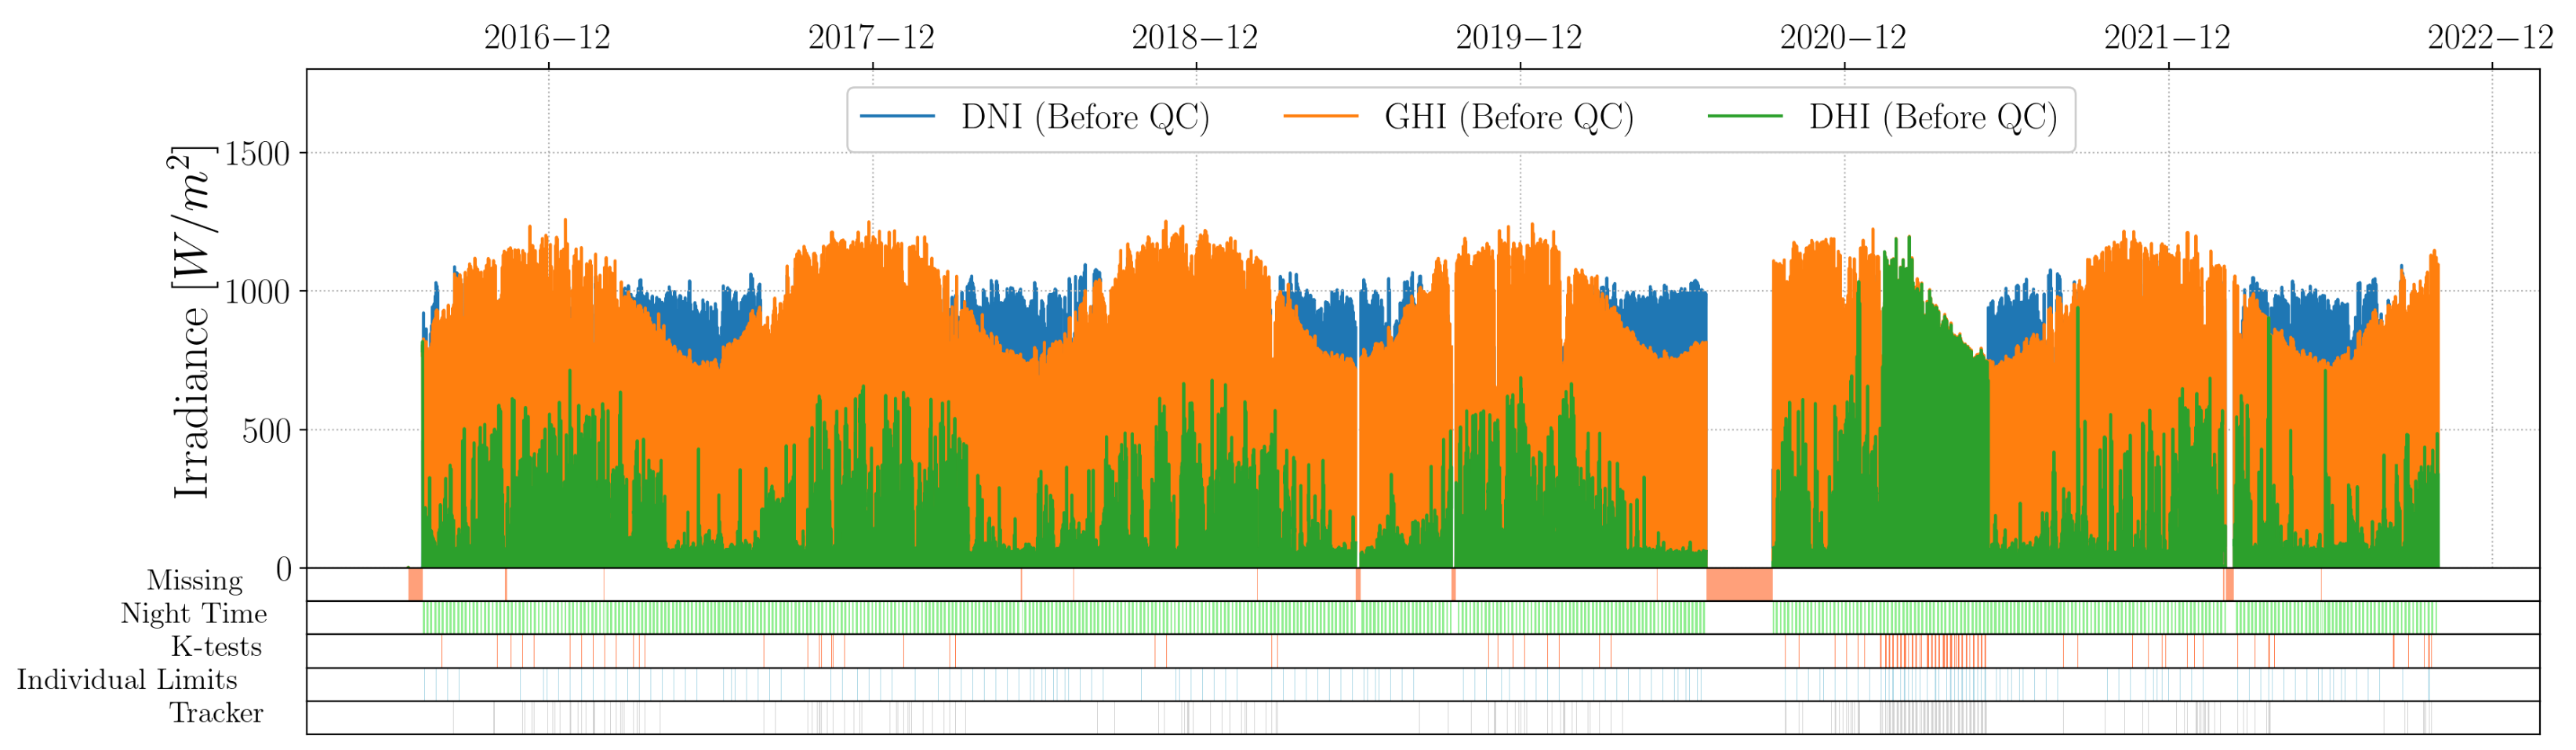
4. SAURAN Database Review
- missing data;
- night-time values;
- and K-tests, individual limits and tracking error.
4.1. Quality Control of SAURAN Stations
4.1.1. CSIR
4.1.2. CUT
4.1.3. FRH
4.1.4. GRT
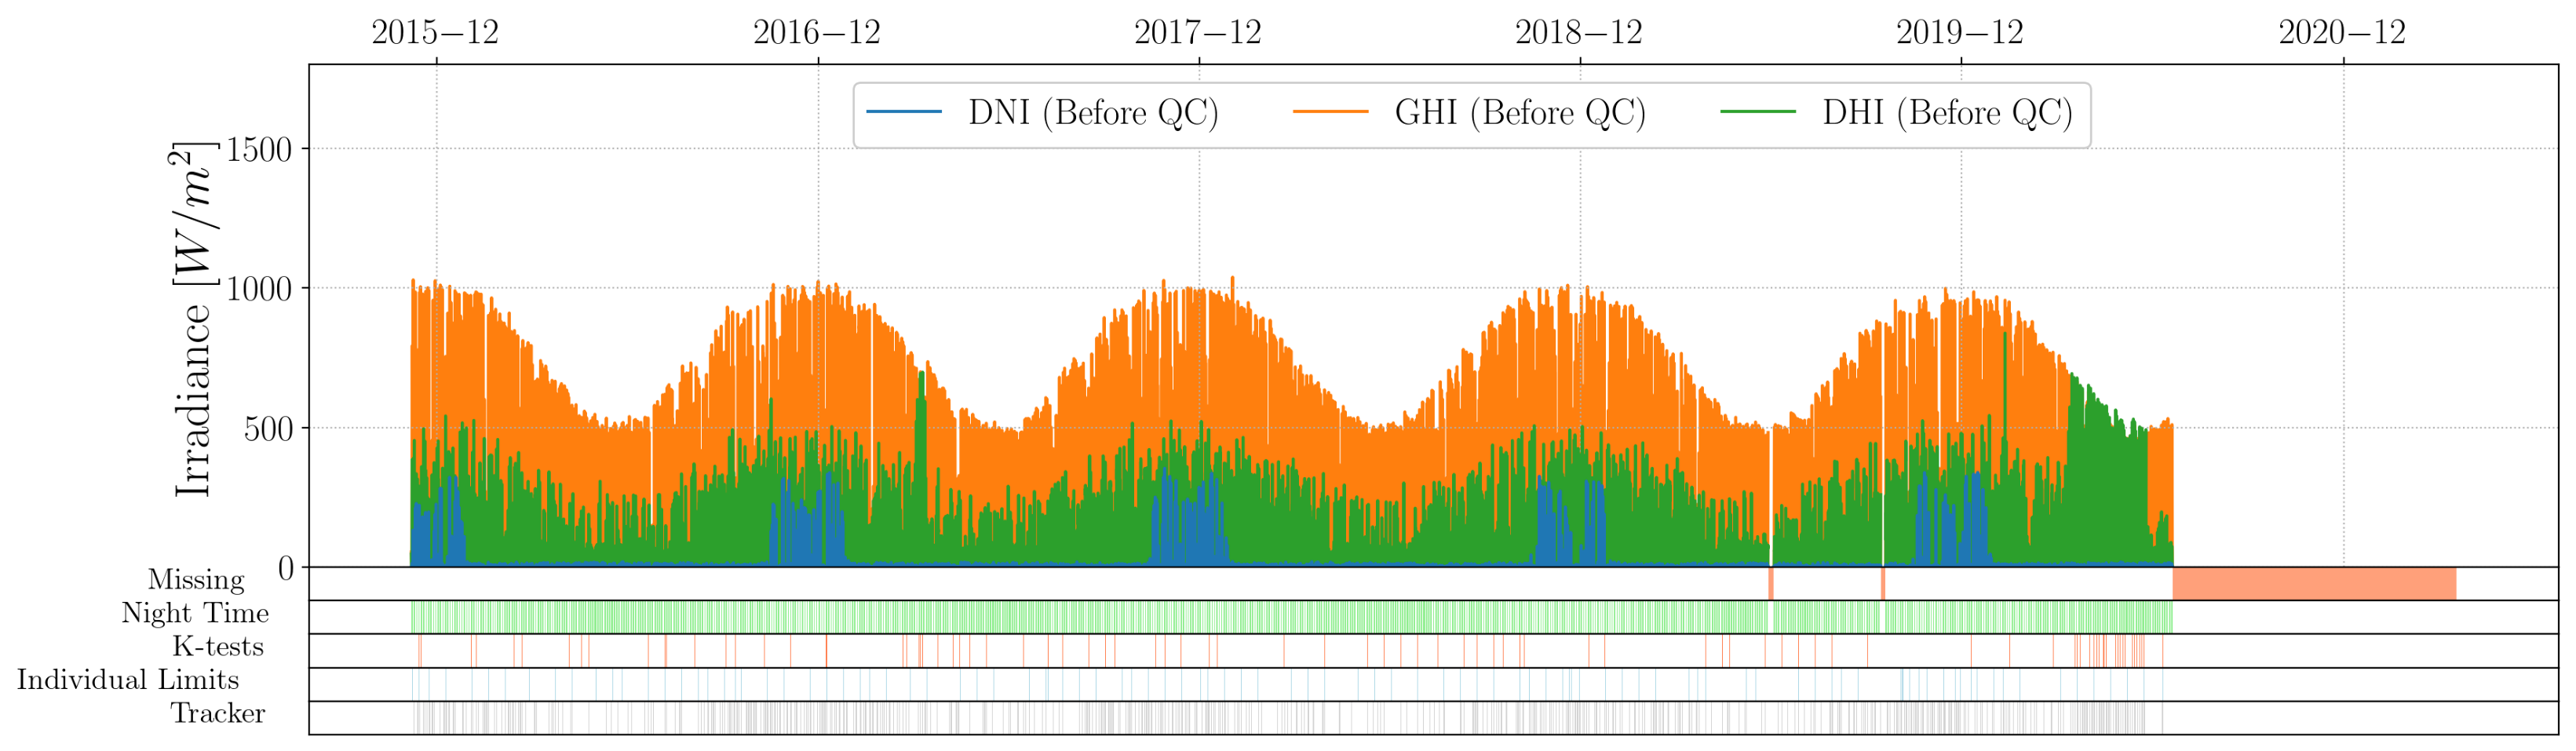
4.1.5. HLO
4.1.6. ILA
4.1.7. KZH
4.1.8. KZW
4.1.9. MIN
4.1.10. MRB
4.1.11. NMU
4.1.12. NUST
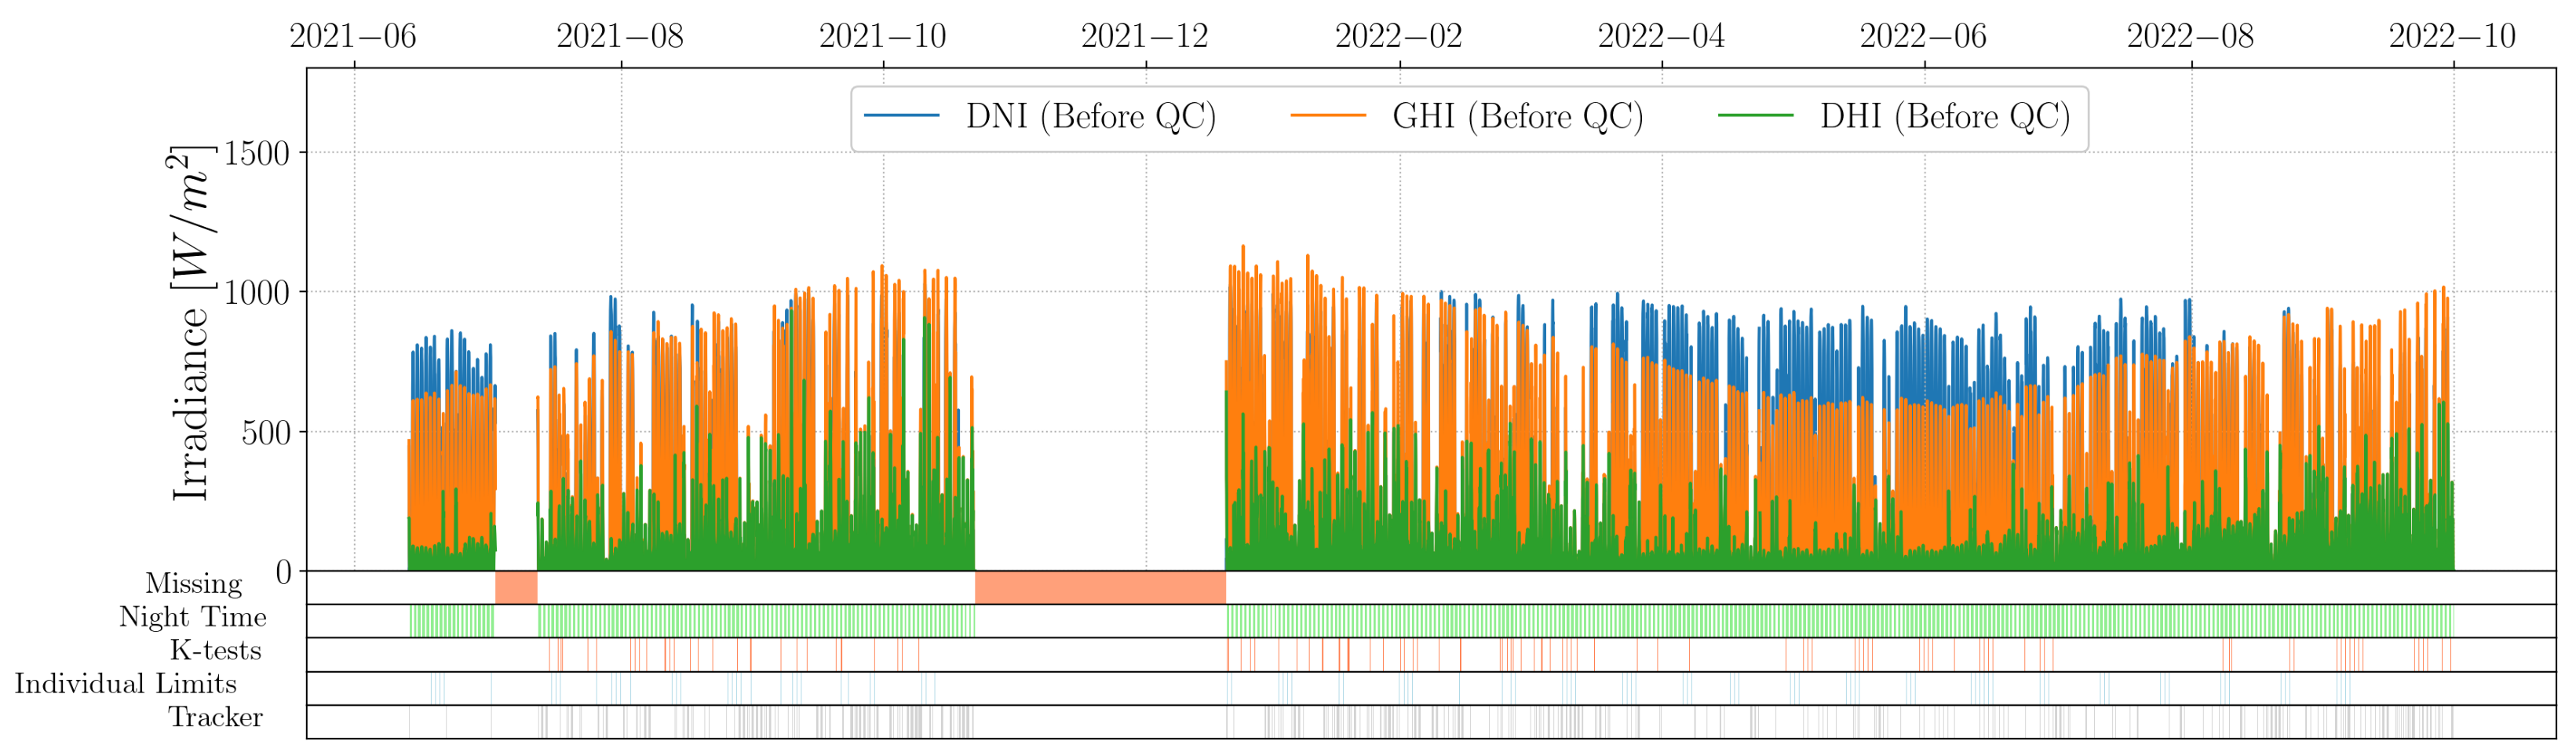
4.1.13. PMB
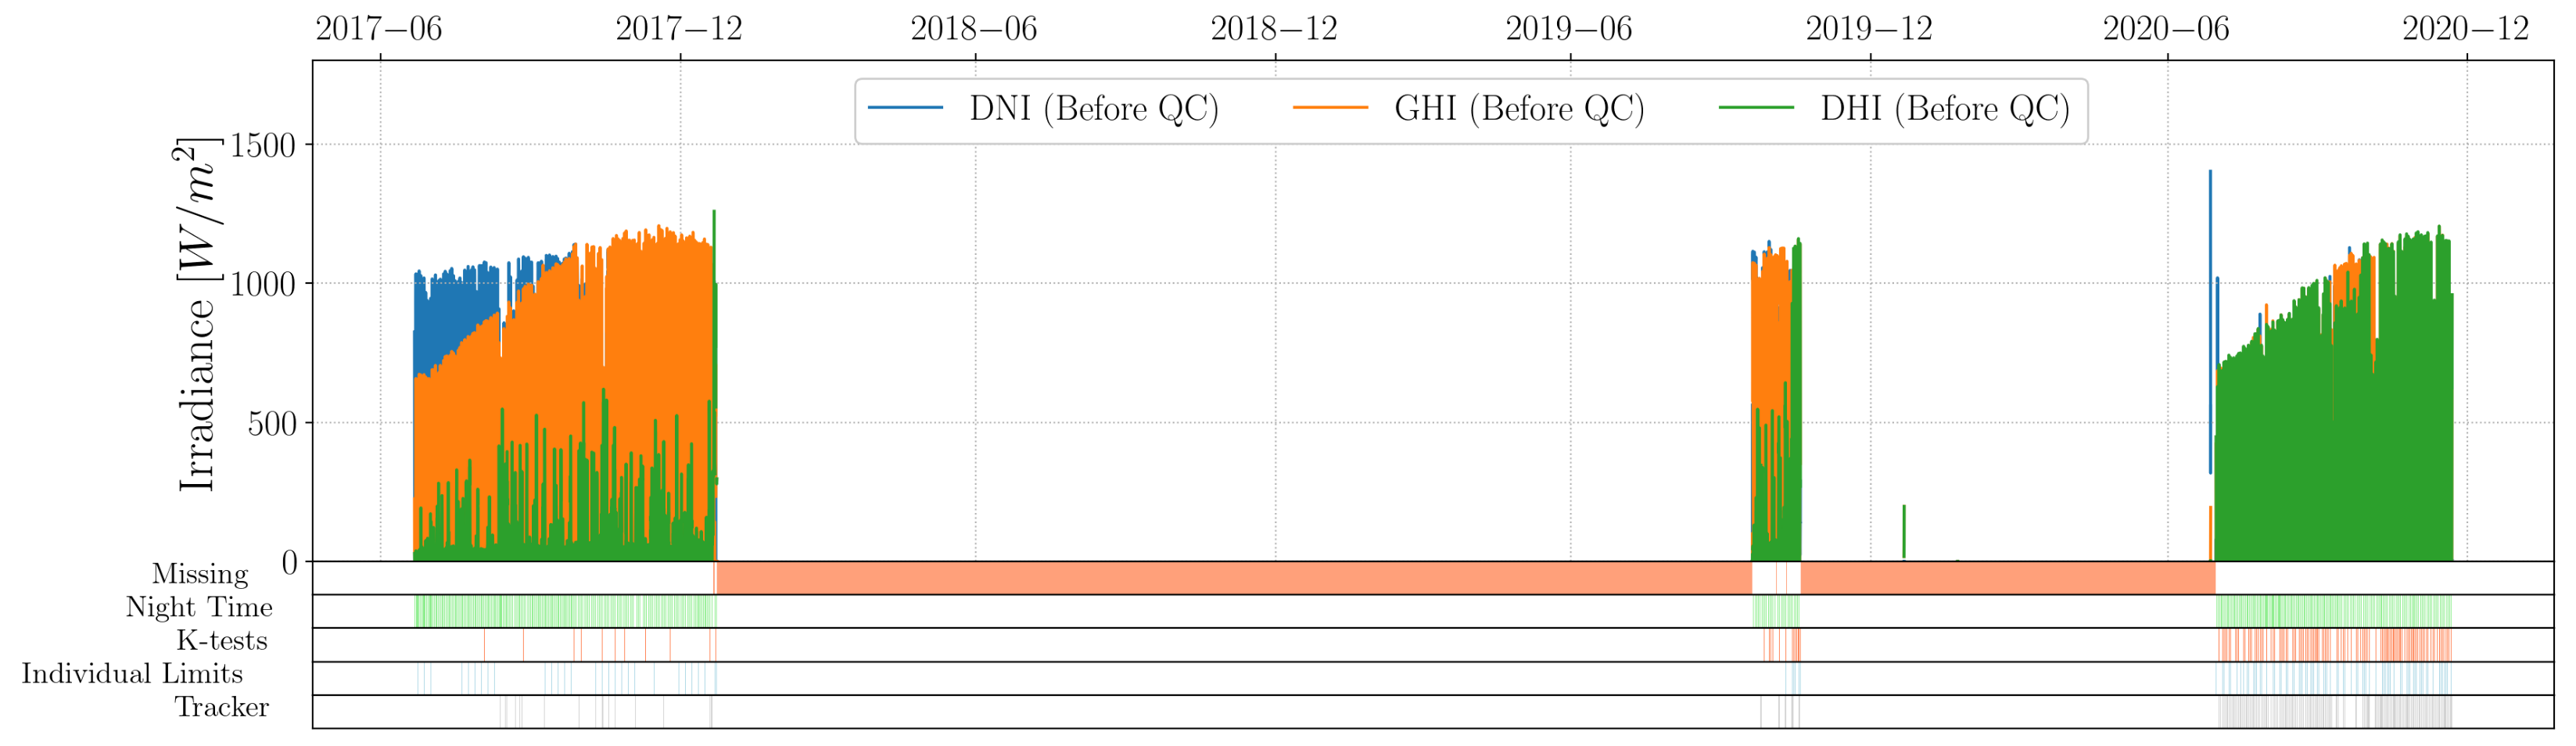
4.1.14. RVD
4.1.15. SALT
4.1.16. STA
4.1.17. SUN
4.1.18. SUT
4.1.19. UBG
4.1.20. UFS
4.1.21. UNV
4.1.22. UNZ
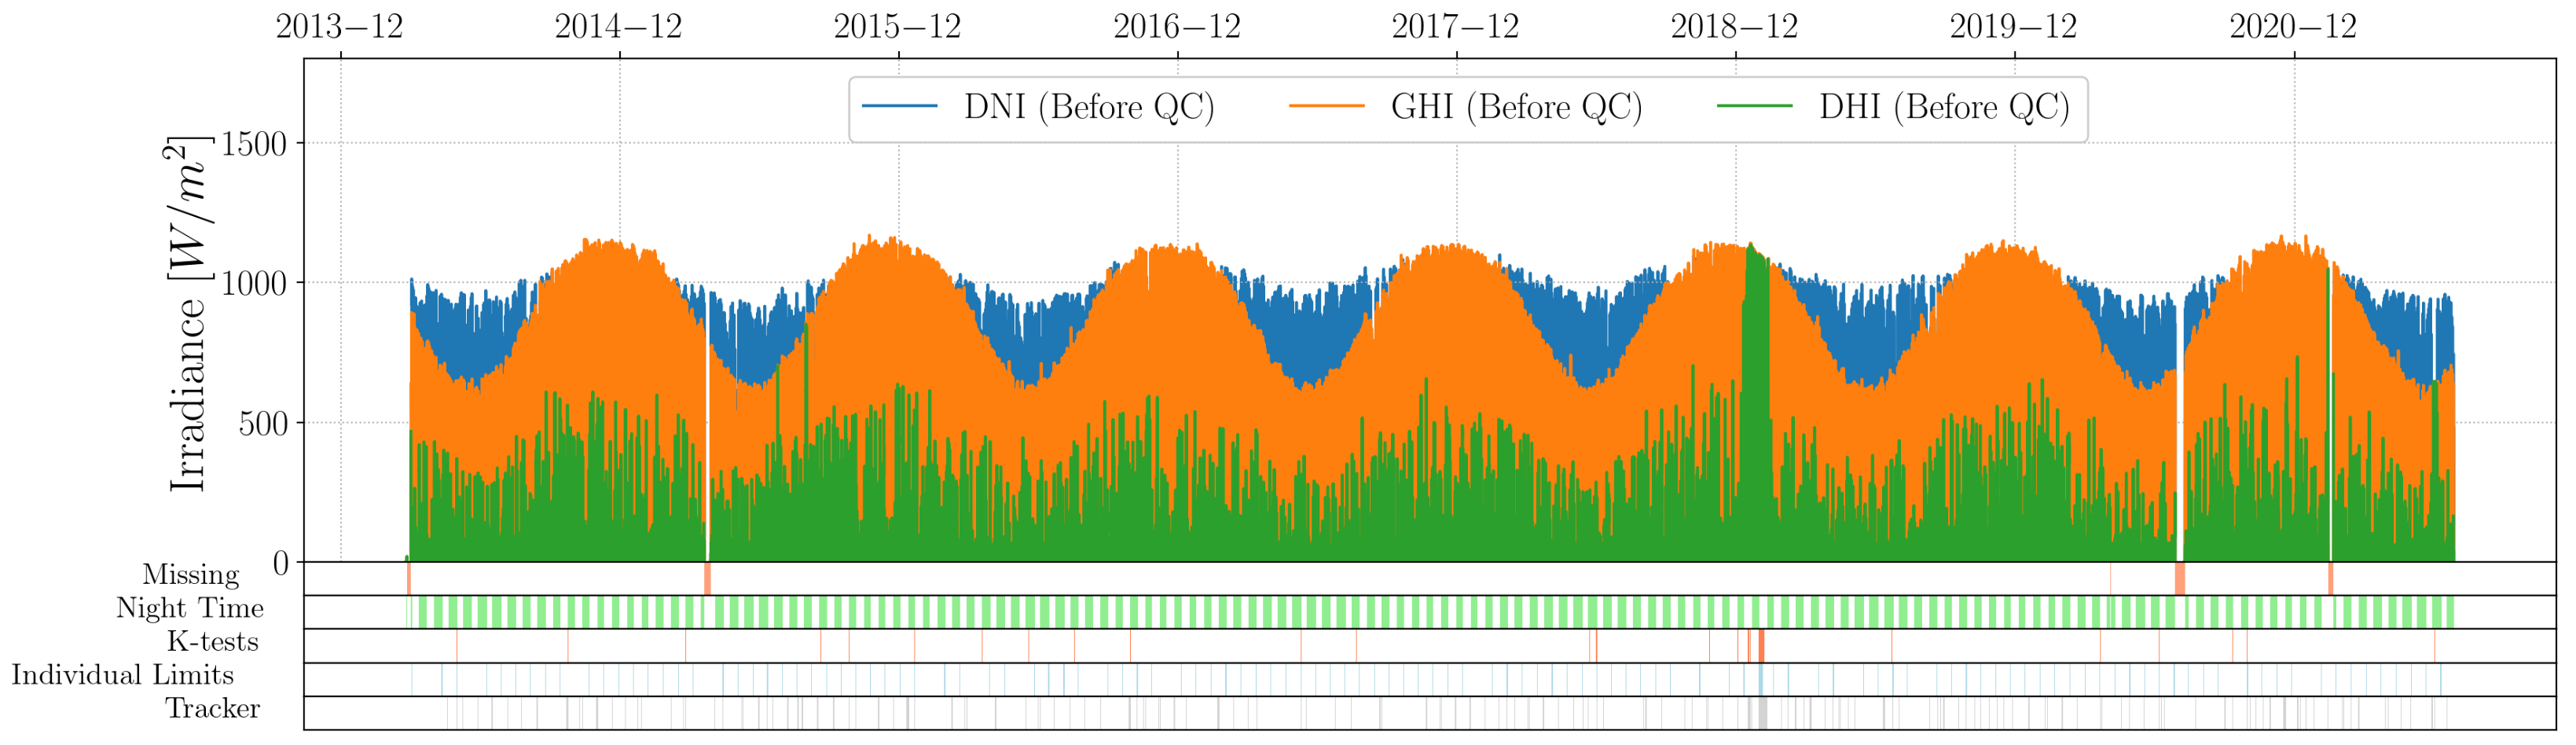
4.1.23. UPR
4.1.24. VAN
4.2. SAURAN Data Correlation Assessment
5. Discussion
5.1. Data Quality and Recommendations
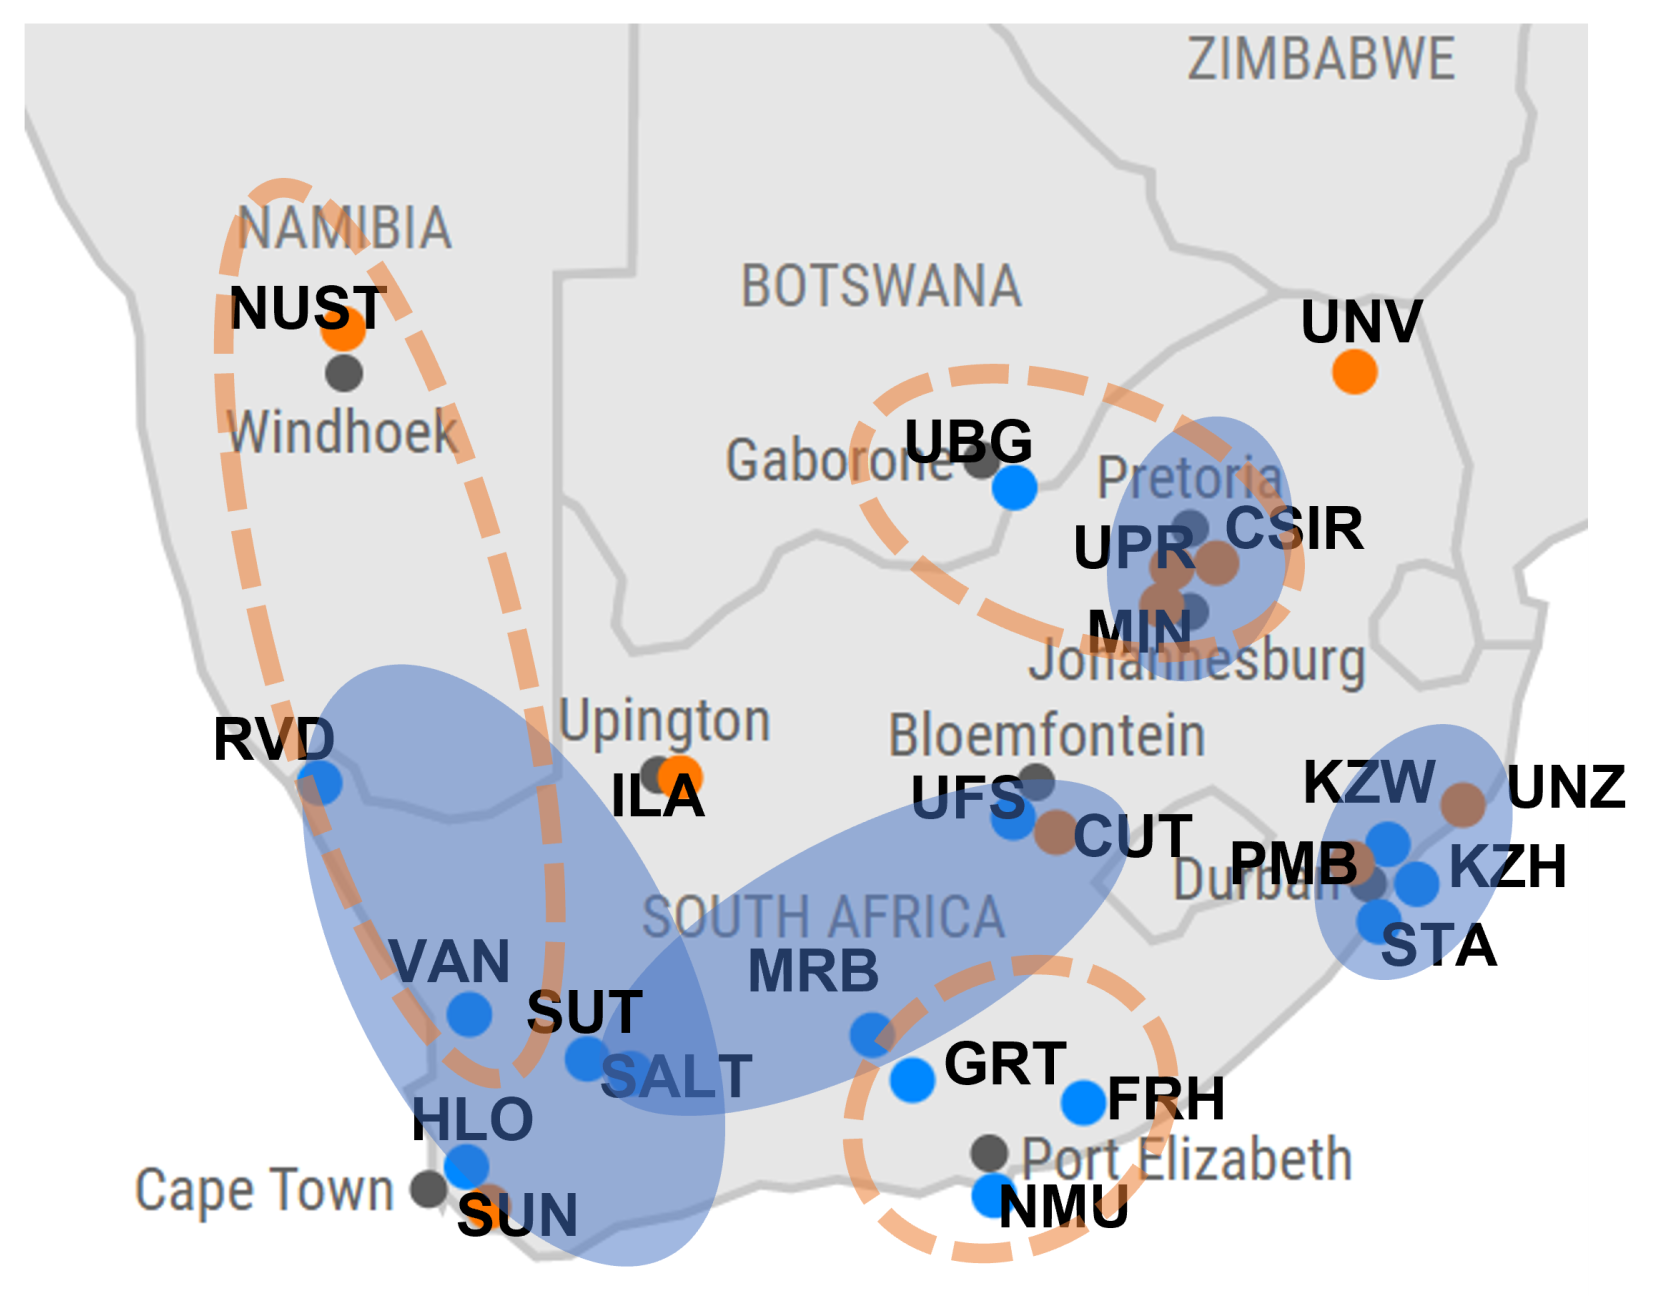
5.2. Irradiance Patterns
- RVD-VAN-SUT-SALT-HLO-SUN;
- SUT-SALT-MRB-UFS-CUT;
- PMB-STA-KZW-KZW-UNZ;
- UPR-CSIR-MIN.
- GRT-FRH-NMU;
- NUST-RVD-VAN;
- UBG-UPR-CSIR.
6. Conclusions
Author Contributions
Funding
Institutional Review Board Statement
Informed Consent Statement
Data Availability Statement
Conflicts of Interest
References
- Gueymard, C.A.; Ruiz-Arias, J.A. Extensive worldwide validation and climate sensitivity analysis of direct irradiance predictions from 1-min global irradiance. Sol. Energy 2016, 128, 1–30. [Google Scholar] [CrossRef]
- Daniel-Durandt, F.; Rix, A. The Automation of Quality Control for Large Irradiance Datasets. In Proceedings of the 2022 International Conference on Electrical, Computer, Communications and Mechatronics Engineering (ICECCME), Maldives, Maldives, 16–18 November 2022; pp. 1–6. [Google Scholar] [CrossRef]
- Forstinger, A.; Wilbert, S.; Jensen, A.; Kraas, B.; Fernández-Peruchena, C.M.; Gueymard, C.; Ronzio, D.; Yang, D.; Collino, E.; Polo, J.; et al. Expert quality control of solar radiation ground data sets. In Proceedings of the ISES Solar World Congress, Virtual, 25–29 October 2021. [Google Scholar]
- SAURAN. 2022. Available online: https://sauran.ac.za/ (accessed on 4 November 2022).
- Fitzgerald, D. Quality Checking of Weather Data. Available online: https://sauran.ac.za/SAURAN%20Quality%20Checking%20Data.zip (accessed on 4 November 2022).
- Muneer, T.; Fairooz, F. Quality control of solar radiation and sunshine measurements – lessons learnt from processing worldwide databases. Build. Serv. Eng. Res. Technol. 2002, 23, 151–166. [Google Scholar] [CrossRef]
- Younes, S.; Claywell, R.; Muneer, T. Quality control of solar radiation data: Present status and proposed new approaches. Energy 2005, 30, 1533–1549. [Google Scholar] [CrossRef]
- el Alani, O.; Ghennioui, H.; Ghennioui, A.; Saint-Drenan, Y.M.; Blanc, P.; Hanrieder, N.; Dahr, F.E. A Visual Support of Standard Procedures for Solar Radiation Quality Control. Int. J. Renew. Energy Dev. 2021, 10, 401–414. [Google Scholar] [CrossRef]
- Brooks, M.; du Clou, S.; Van Niekerk, J.; Gauché, P.; Leonard, C.; Mouzouris, M.; Meyer, R.; Westhuizen, N.; Van Dyk, E.; Vorster, F. SAURAN: A new resource for solar radiometric data in Southern Africa. J. Energy S. Afr. 2015, 26, 2–10. [Google Scholar] [CrossRef]
- Long, C.N.; Dutton, E.G. BSRN Global Network Recommended QC Tests, V2.x; Technical Report; PANGAEA: Bremerhaven, Germany, 2002; Available online: http://hdl.handle.net/10013/epic.38770.d001 (accessed on 6 April 2023).
- Long, C.; Shi, Y. An Automated Quality Assessment and Control Algorithm for Surface Radiation Measurements. Open Atmos. Sci. J. 2008, 2, 23–37. [Google Scholar] [CrossRef]
- Journée, M.; Bertrand, C. Quality control of solar radiation data within the RMIB solar measurements network. Sol. Energy 2011, 85, 72–86. [Google Scholar] [CrossRef]
- Roesch, A.; Wild, M.; Ohmura, A.; Dutton, E.G.; Long, C.N.; Zhang, T. Assessment of BSRN radiation records for the computation of monthly means. Atmos. Meas. Tech. 2011, 4, 339–354. [Google Scholar] [CrossRef]
- Perez-Astudillo, D.; Bachour, D.; Martin-Pomares, L. Improved quality control protocols on solar radiation measurements. Sol. Energy 2018, 169, 425–433. [Google Scholar] [CrossRef]
- Moreno, S.; Silva, M.; Santigosa, L. A proposed methodology for quick assessment of timestamp and quality control results of solar radiation data. Renew. Energy 2015, 78, 531–537. [Google Scholar] [CrossRef]
- Yang, D.; Yagli, G.M.; Quan, H. Quality Control for Solar Irradiance Data. In Proceedings of the 2018 IEEE Innovative Smart Grid Technologies-Asia (ISGT Asia), Singapore, 22–25 May 2018; pp. 208–213. [Google Scholar] [CrossRef]
- Sun, X.; Yang, X.; Wang, P. A Study of Models Combination for Global Clear Sky Irradiance Models. In Proceedings of the 2020 47th IEEE Photovoltaic Specialists Conference (PVSC), Calgary, AB, Canada, 15 June–21 August 2020; pp. 0724–0728. [Google Scholar] [CrossRef]
- Mabhoko, M.; Fitzgerald, D.; Bekker, B. Comparing Long-Term Actual versus Simulated PV System Performance: A Review and Case Study. Technical Report, Centre for Renewable and Sustainable Energy Studies. 2020. Available online: https://www.sasec.org.za/papers2019/84.pdf (accessed on 6 April 2023).
- Lubbe, F.; Maritz, J.; Harms, T. Evaluating the Potential of Gaussian Process Regression for Solar Radiation Forecasting: A Case Study. Energies 2020, 13, 5509. [Google Scholar] [CrossRef]
- Masevhe, L.; Maluta, E.N. Assessment of photovoltaic power output using the estimated global solar radiation at Vuwani Science Resources Centre. Cogent Eng. 2022, 9, 2105031. [Google Scholar] [CrossRef]
- Mutombo, N.M.A.; Mukuna, J.G.M.; Zawilska, E. Preliminary Analysis of Ground-Based Measured Solar Data From Sauran Sta Station at Umlazi, South Africa. Int. J. Mech. Eng. Technol. 2019, 10, 104–113. [Google Scholar]
- Ineichen, P. A Study of Models Combination for Global Clear Sky Irradiance Models. In Proceedings of the 5th Southern African Solar Energy Conference, Cape Town, South Africa, 25–27 June 2018. [Google Scholar]
- Ravele, T.; Sigauke, C.; Jhamba, L. Estimation of Extreme Quantiles of Global Horizontal Irradiance: A Comparative Analysis Using an Extremal Mixture Model and a Generalised Additive Extreme Value Model. Math. Stat. 2022, 10, 116–133. [Google Scholar] [CrossRef]
- Gaonwe, T.; Hohne, P.; Kusakana, K. Optimal energy management of a solar-assisted heat pump water heating system with a storage system. J. Energy Storage 2022, 56, 105885. [Google Scholar] [CrossRef]
- Mdluli, N.; Sharma, G.; Akindeji, K.; Narayanan, K.; Sharma, S. Development of Short Term Solar Radiation Forecasting Using AI Techniques. In Proceedings of the 2022 30th Southern African Universities Power Engineering Conference (SAUPEC), Durban, South Africa, 25–27 January 2022; pp. 1–6. [Google Scholar] [CrossRef]
- Jacovides, C.; Tymvios, F.; Assimakopoulos, V.; Kaltsounides, N. Comparative study of various correlations in estimating hourly diffuse fraction of global solar radiation. Renew. Energy 2006, 31, 2492–2504. [Google Scholar] [CrossRef]
- Le Roux, W. Optimum tilt and azimuth angles for fixed solar collectors in South Africa using measured data. Renew. Energy 2016, 96, 603–612. [Google Scholar] [CrossRef]
- McArthur, L. Baseline Surface Radiation Network (BSRN)-Operation Manual Version 2.1. 2005. Available online: https://epic.awi.de/id/eprint/30644/1/McArthur_2005.pdf (accessed on 19 January 2023).
- Larrañeta, M.; Fernandez-Peruchena, C.; Silva-Pérez, M.; Lillo-Bravo, I. Methodology to synthetically downscale DNI time series from 1-h to 1-min temporal resolution with geographic flexibility. Sol. Energy 2018, 162, 573–584. [Google Scholar] [CrossRef]
- Sun, X.; Bright, J.M.; Gueymard, C.A.; Bai, X.; Acord, B.; Wang, P. Worldwide performance assessment of 95 direct and diffuse clear-sky irradiance models using principal component analysis. Renew. Sustain. Energy Rev. 2021, 135, 110087. [Google Scholar] [CrossRef]
- Nwokolo, S.C.; Obiwulu, A.U.; Ogbulezie, J.C.; Amadi, S.O. Hybridization of statistical machine learning and numerical models for improving beam, diffuse and global solar radiation prediction. Clean. Eng. Technol. 2022, 9, 100529. [Google Scholar] [CrossRef]
- Geuder, N.; Wolfertstetter, F.; Wilbert, S.; Schüler, D.; Affolter, R.; Kraas, B.; Lüpfert, E.; Espinar, B. Screening and Flagging of Solar Irradiation and Ancillary Meteorological Data. Energy Procedia 2015, 69, 1989–1998. [Google Scholar] [CrossRef]
- Walpole, R.E.; Myers, R.H.; Myers, S.L.; Ye, K. Probability & Statistics for Engineers and Scientists, 9th ed.; Pearson Education: Upper Saddle River, NJ, USA, 2012. [Google Scholar]
- Farmer, W.; Rix, A. Mapping the spatial perturbations seen by the power system network due to intermittent renewable energy sources. In Proceedings of the 2021 Southern African Sustainable Energy Conference, Stellenbosch, South Africa, 17–19 November 2021. [Google Scholar]


| Parameter | Typical Instrument | Unit |
|---|---|---|
| GHI | Kipp&Zonen CMP11 pyranometer | W/m |
| DNI | Kipp&Zonen CHP1 pyrheliometer | W/m |
| DHI | Kipp&Zonen CMP11 pyranometer | W/m |
| Label | Name (Location) | Coordinates (Lat (S), Long (E)) | Elevation (m) | |
|---|---|---|---|---|
| 1 | CSIR | CSIR Energy Centre (Pretoria, South Africa) | 25.747, 28.279 | 1400 |
| 2 | CUT | Central University of Technology (Bloemfontein, South Africa) | 29.121, 26.216 | 1397 |
| 3 | FRH | University of Fort Hare (Alice, South Africa) | 32.785, 26.845 | 540 |
| 4 | GRT | Graaff-Reinet (Graaff-Reinet, South Africa) | 32.485, 24.586 | 660 |
| 5 | HLO | Mariendal (Mariendal, South Africa) | 33.854, 18.824 | 178 |
| 6 | ILA | Ilanga CSP Plant (Upington, South Africa) | 28.490, 21.520 | 884 |
| 7 | KZH | University of KwaZulu-Natal Howard College (Durban, South Africa) | 29.871, 30.977 | 150 |
| 8 | KZW | University of KwaZulu-Natal Westville (Durban, South Africa) | 29.817, 30.945 | 200 |
| 9 | MIN | CRSES Mintek (Johannesburg, South Africa) | 26.089, 27.978 | 1521 |
| 10 | MRB | Murraysburg (Murraysburg, South Africa) | 31.890, 24.056 | 1548 |
| 11 | NMU | Nelson Mandela University (Gqeberha, South Africa) | 34.009, 25.665 | 35 |
| 12 | NUST | Namibian University of Science and Technology (Windhoek, Namibia) | 22.565, 17.075 | 1683 |
| 13 | PMB | University of KwaZulu-Natal Pietermaritzburg (Pietermaritzburg, South Africa) | 29.621, 30.397 | 680 |
| 14 | RVD | Richtersveld (Alexander Bay, South Africa) | 28.561, 16.761 | 141 |
| 15 | SALT | Eskom Sutherland SALT (Sutherland, South Africa) | 32.378, 20.812 | 1761 |
| 16 | STA | Mangosuthu University of Technology (Umlazi, South Africa) | 29.970, 30.915 | 95 |
| 17 | SUN | Stellenbosch University (Stellenbosch, South Africa) | 33.935, 18.867 | 119 |
| 18 | SUT | Sutherland (Sutherland, South Africa) | 32.222, 20.348 | 1450 |
| 19 | UBG | Gaborone (Gaborone, Botswana) | 24.661, 25.934 | 1014 |
| 20 | UFS | University of Free State (Bloemfontein, South Africa) | 29.111, 26.185 | 1491 |
| 21 | UNV | Venda (Vuwani, South Africa) | 23.131, 30.424 | 628 |
| 22 | UNZ | University of Zululand (KwaDlangezwa, South Africa) | 28.853, 31.852 | 90 |
| 23 | UPR | University of Pretoria (Pretoria, South Africa) | 25.753, 28.229 | 1410 |
| 24 | VAN | Vanrhynsdorp (Vanrhynsdorp, South Africa) | 31.617, 18.738 | 130 |
| Station | Dataset Size | Start Date | End Date | |||
|---|---|---|---|---|---|---|
| Before QC | Night-Time & Duplicates Removed | Other Flags Removed | After QC | |||
| CSIR | 46,434 | 26,539 | 9560 (21%) | 16,979 (37%) | 11 March 2017 | 31 October 2022 |
| CUT | 28,077 | 14,619 | 2737 (10%) | 11,882 (42%) | 24 October 2017 | 31 October 2022 |
| FRH | 40,895 | 22,233 | 8148 (20%) | 14,085 (34%) | 7 February 2017 | 24 February 2022 |
| GRT | 18,541 | 9774 | 2438 (13%) | 7336 (40%) | 27 November 2013 | 24 January 2016 |
| HLO | 21,532 | 11,728 | 3503 (16%) | 8225 (38%) | 8 October 2015 | 27 October 2020 |
| ILA | 8832 | 4676 | 1057 (12%) | 3619 (41%) | 13 October 2021 | 31 October 2022 |
| KZH | 52,323 | 38,898 | 29,612 (57%) | 9286 (18%) | 7 December 2015 | 07 August 2022 |
| KZW | 20,291 | 10,756 | 4503 (22%) | 6253 (31%) | 7 December 2015 | 12 December 2018 |
| MIN | 8185 | 4423 | 1308 (16%) | 3115 (38%) | 28 October 2021 | 31 October 2022 |
| MRB | 4201 | 2462 | 850 (20%) | 1612 (38%) | 17 March 2017 | 22 October 2019 |
| NMU | 39,969 | 23,130 | 11,171 (28%) | 11,959 (30%) | 10 December 2015 | 30 September 2022 |
| NUST | 52,004 | 27,401 | 6096 (12%) | 21,305 (41%) | 26 July 2016 | 31 October 2022 |
| PMB | 9773 | 5415 | 2337 (24%) | 3078 (31%) | 13 July 2021 | 31 October 2022 |
| RVD | 63,716 | 34,457 | 8234 (13%) | 26,223 (41%) | 27 March 2014 | 28 July 2021 |
| SALT | 14,151 | 9908 | 7526 (53%) | 2382 (17%) | 21 July 2017 | 22 December 2020 |
| STA | 40,256 | 21,751 | 10,413 (26%) | 11,338 (28%) | 7 December 2015 | 19 April 2021 |
| SUN | 87,720 | 47,733 | 14,304 (16%) | 33,429 (38%) | 24 May 2010 | 31 October 2022 |
| SUT | 1715 | 902 | 115 (7%) | 787 (46%) | 8 February 2017 | 20 April 2017 |
| UBG | 38,917 | 20,646 | 6534 (17%) | 14,112 (36%) | 26 November 2014 | 6 November 2020 |
| UFS | 31,665 | 17,152 | 4060 (13%) | 13,092 (41%) | 16 January 2014 | 30 August 2017 |
| UNV | 59,100 | 33,144 | 15,226 (26%) | 17,918 (30%) | 23 April 2015 | 31 October 2022 |
| UNZ | 56,399 | 30,373 | 18,953 (34%) | 11,420 (20%) | 11 July 2014 | 31 October 2022 |
| UPR | 78,792 | 42,128 | 10,464 (13%) | 31,664 (40%) | 19 September 2013 | 31 October 2022 |
| VAN | 24,701 | 13,234 | 3414 (14%) | 9820 (40%) | 26 August 2016 | 10 July 2019 |
 |
 |
 |
| Station | Summary | Recommendation | ||
|---|---|---|---|---|
| Minimum One Complete Year | Minimal Missing Data | Currently Online | ||
| CSIR | ✓ | ✗ | ✓ | Recommended |
| CUT | ✗ | ✗ | ✓ | Use with caution |
| FRH | ✓ | ✗ | ✗ | Recommended |
| GRT | ✓ | ✓ | ✗ | Recommended |
| HLO | ✗ | ✗ | ✗ | Use with caution |
| ILA | ✗ | ✓ | ✓ | Use with caution |
| KZH | ✓ | ✗ | ✗ | Recommended |
| KZW | ✗ | ✗ | ✗ | Use with caution |
| MIN | ✗ | ✗ | ✓ | Use with caution |
| MRB | ✗ | ✗ | ✗ | Use with extreme caution |
| NMU | ✗ | ✗ | ✗ | Use with extreme caution |
| NUST | ✓ | ✗ | ✓ | Recommended |
| PMB | ✗ | ✗ | ✓ | Use with caution |
| RVD | ✓ | ✓ | ✗ | Recommended |
| SALT | ✗ | ✗ | ✗ | Use with extreme caution |
| STA | ✗ | ✗ | ✗ | Use with extreme caution |
| SUN | ✓ | ✗ | ✓ | Use with caution |
| SUT | ✗ | ✓ | ✗ | Use with extreme caution |
| UBG | ✓ | ✗ | ✗ | Use with caution |
| UFS | ✓ | ✓ | ✗ | Recommended |
| UNV | ✓ | ✗ | ✓ | Use with caution |
| UNZ | ✓ | ✗ | ✓ | Use with caution |
| UPR | ✓ | ✓ | ✓ | Recommended |
| VAN | ✓ | ✗ | ✗ | Use with caution |
Disclaimer/Publisher’s Note: The statements, opinions and data contained in all publications are solely those of the individual author(s) and contributor(s) and not of MDPI and/or the editor(s). MDPI and/or the editor(s) disclaim responsibility for any injury to people or property resulting from any ideas, methods, instructions or products referred to in the content. |
© 2023 by the authors. Licensee MDPI, Basel, Switzerland. This article is an open access article distributed under the terms and conditions of the Creative Commons Attribution (CC BY) license (https://creativecommons.org/licenses/by/4.0/).
Share and Cite
Daniel-Durandt, F.M.; Rix, A.J. Automating Quality Control of Irradiance Data with a Comprehensive Analysis for Southern Africa. Solar 2023, 3, 596-617. https://doi.org/10.3390/solar3040032
Daniel-Durandt FM, Rix AJ. Automating Quality Control of Irradiance Data with a Comprehensive Analysis for Southern Africa. Solar. 2023; 3(4):596-617. https://doi.org/10.3390/solar3040032
Chicago/Turabian StyleDaniel-Durandt, Francisca Muriel, and Arnold Johan Rix. 2023. "Automating Quality Control of Irradiance Data with a Comprehensive Analysis for Southern Africa" Solar 3, no. 4: 596-617. https://doi.org/10.3390/solar3040032