

Optimal Sizing and Assessment of Standalone Photovoltaic Systems for Community Health Centers in Mali


Abstract
:1. Introduction
2. Materials and Methods
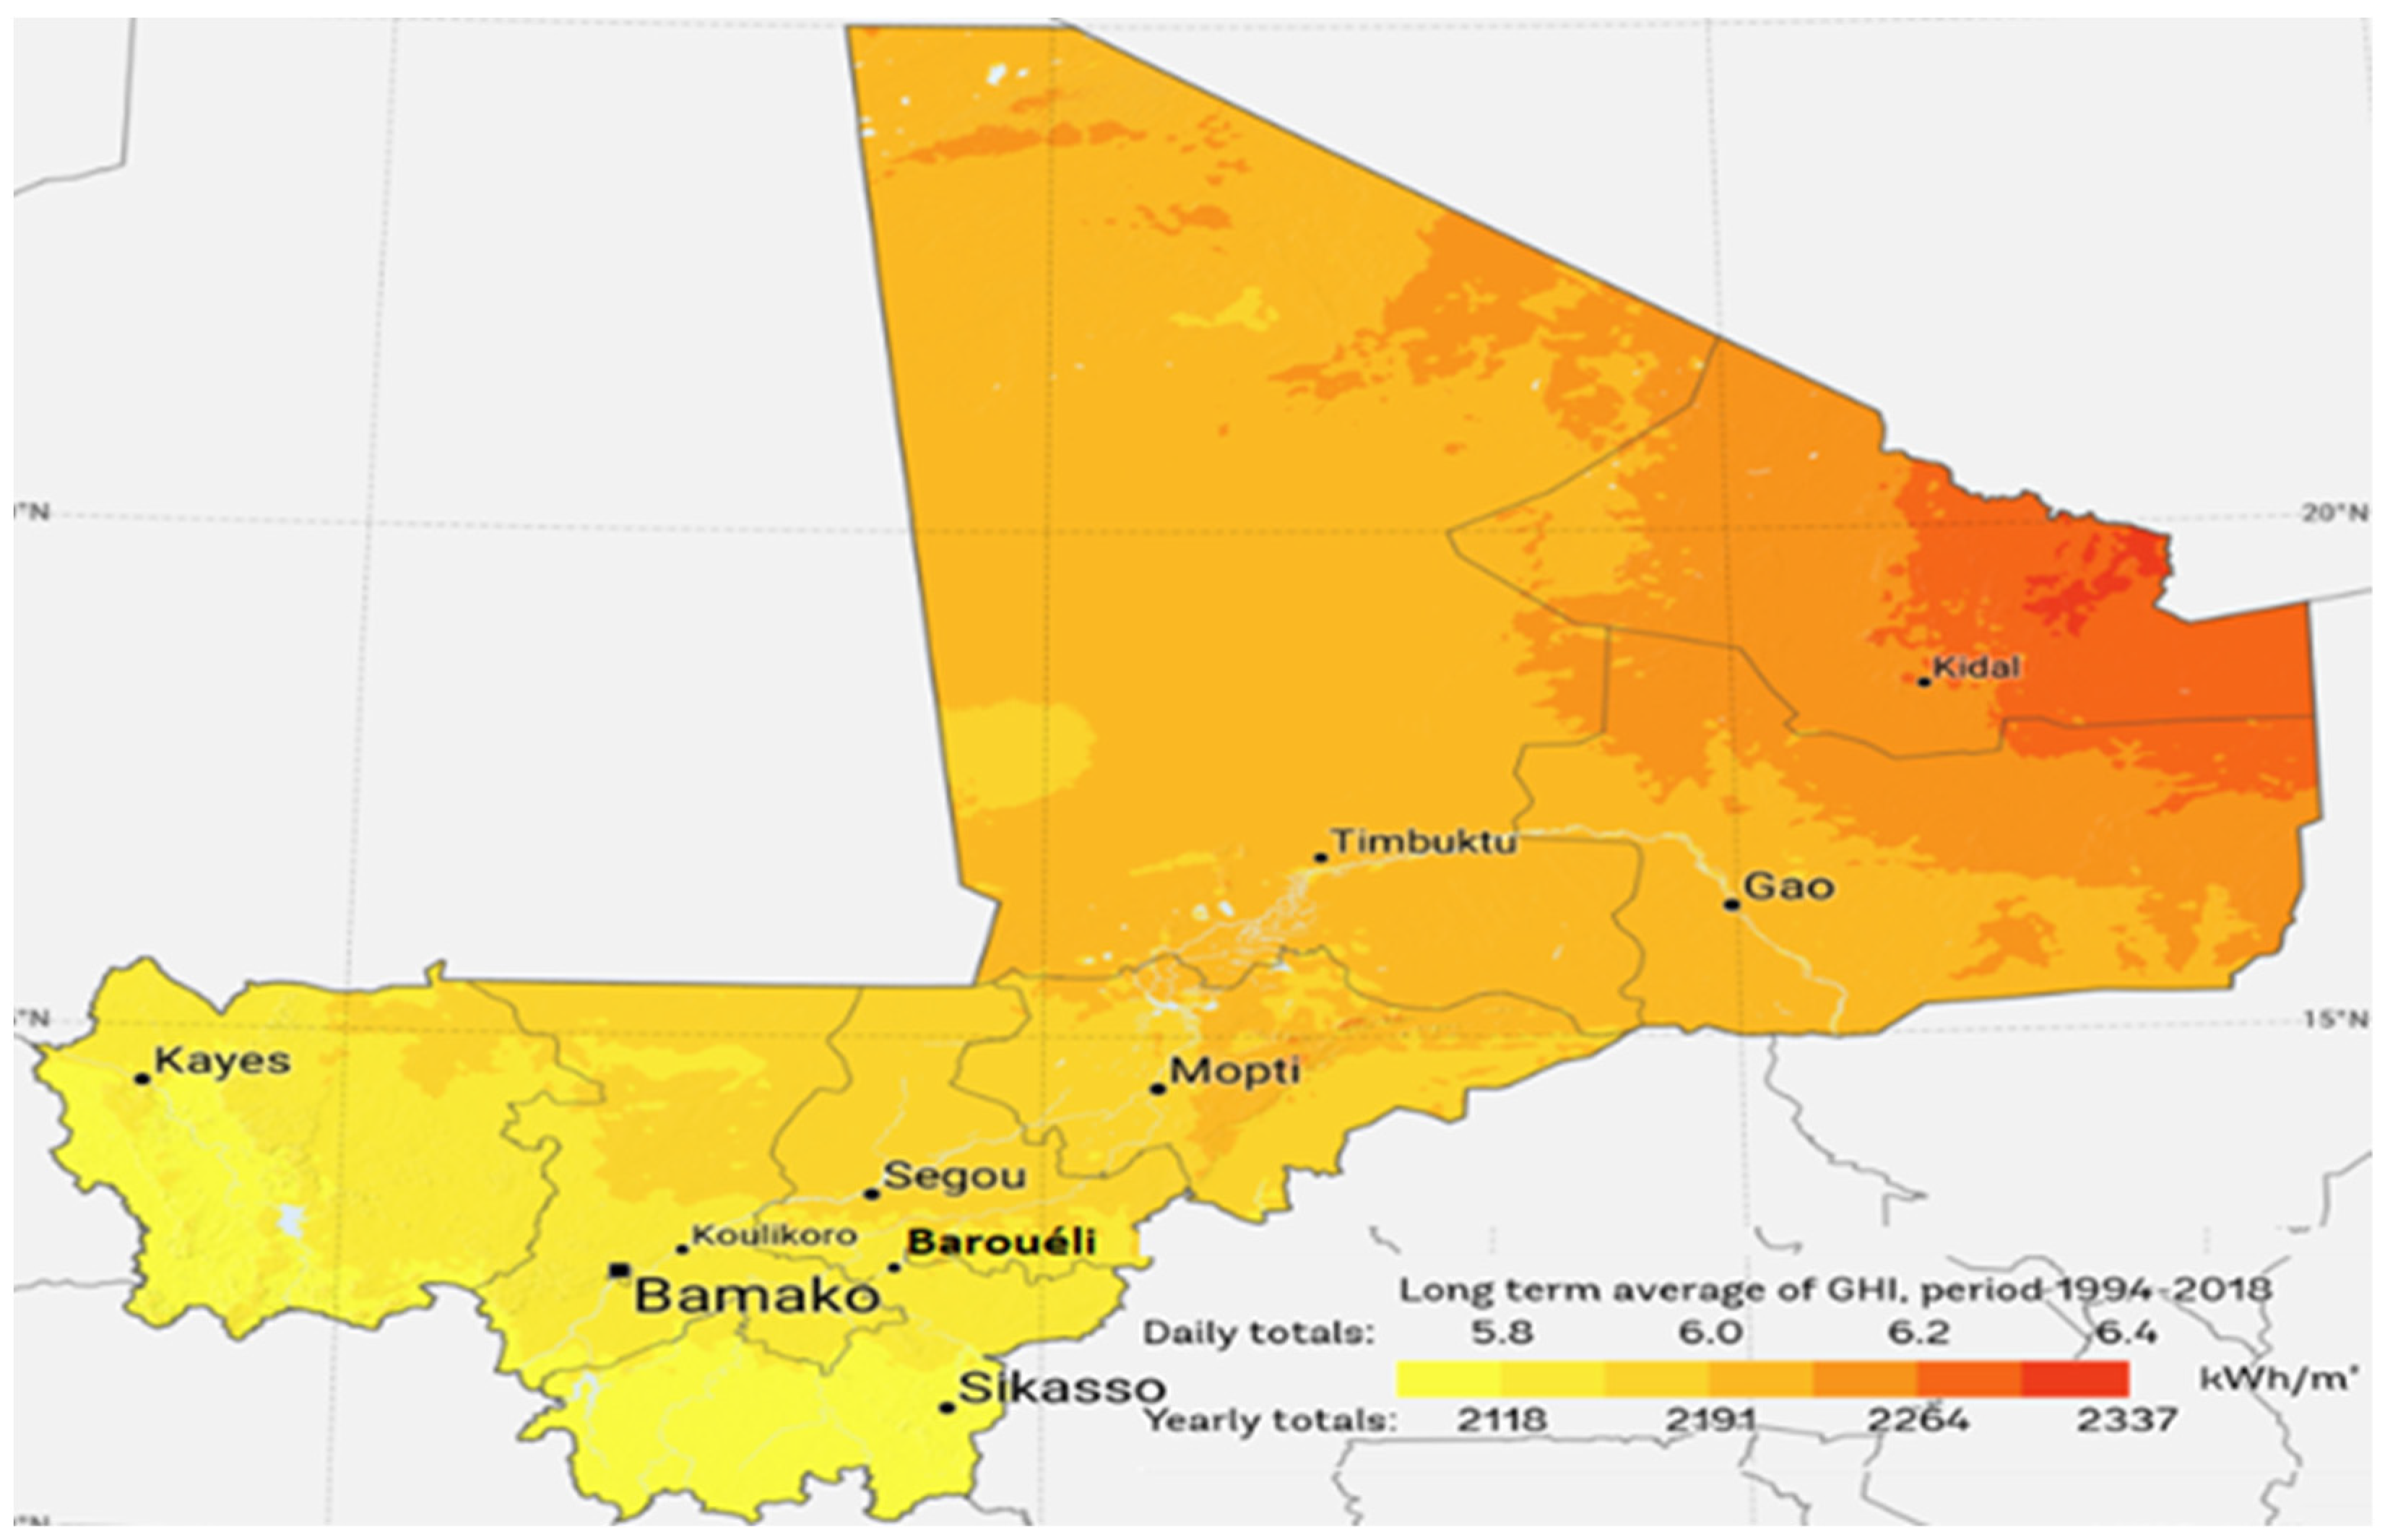
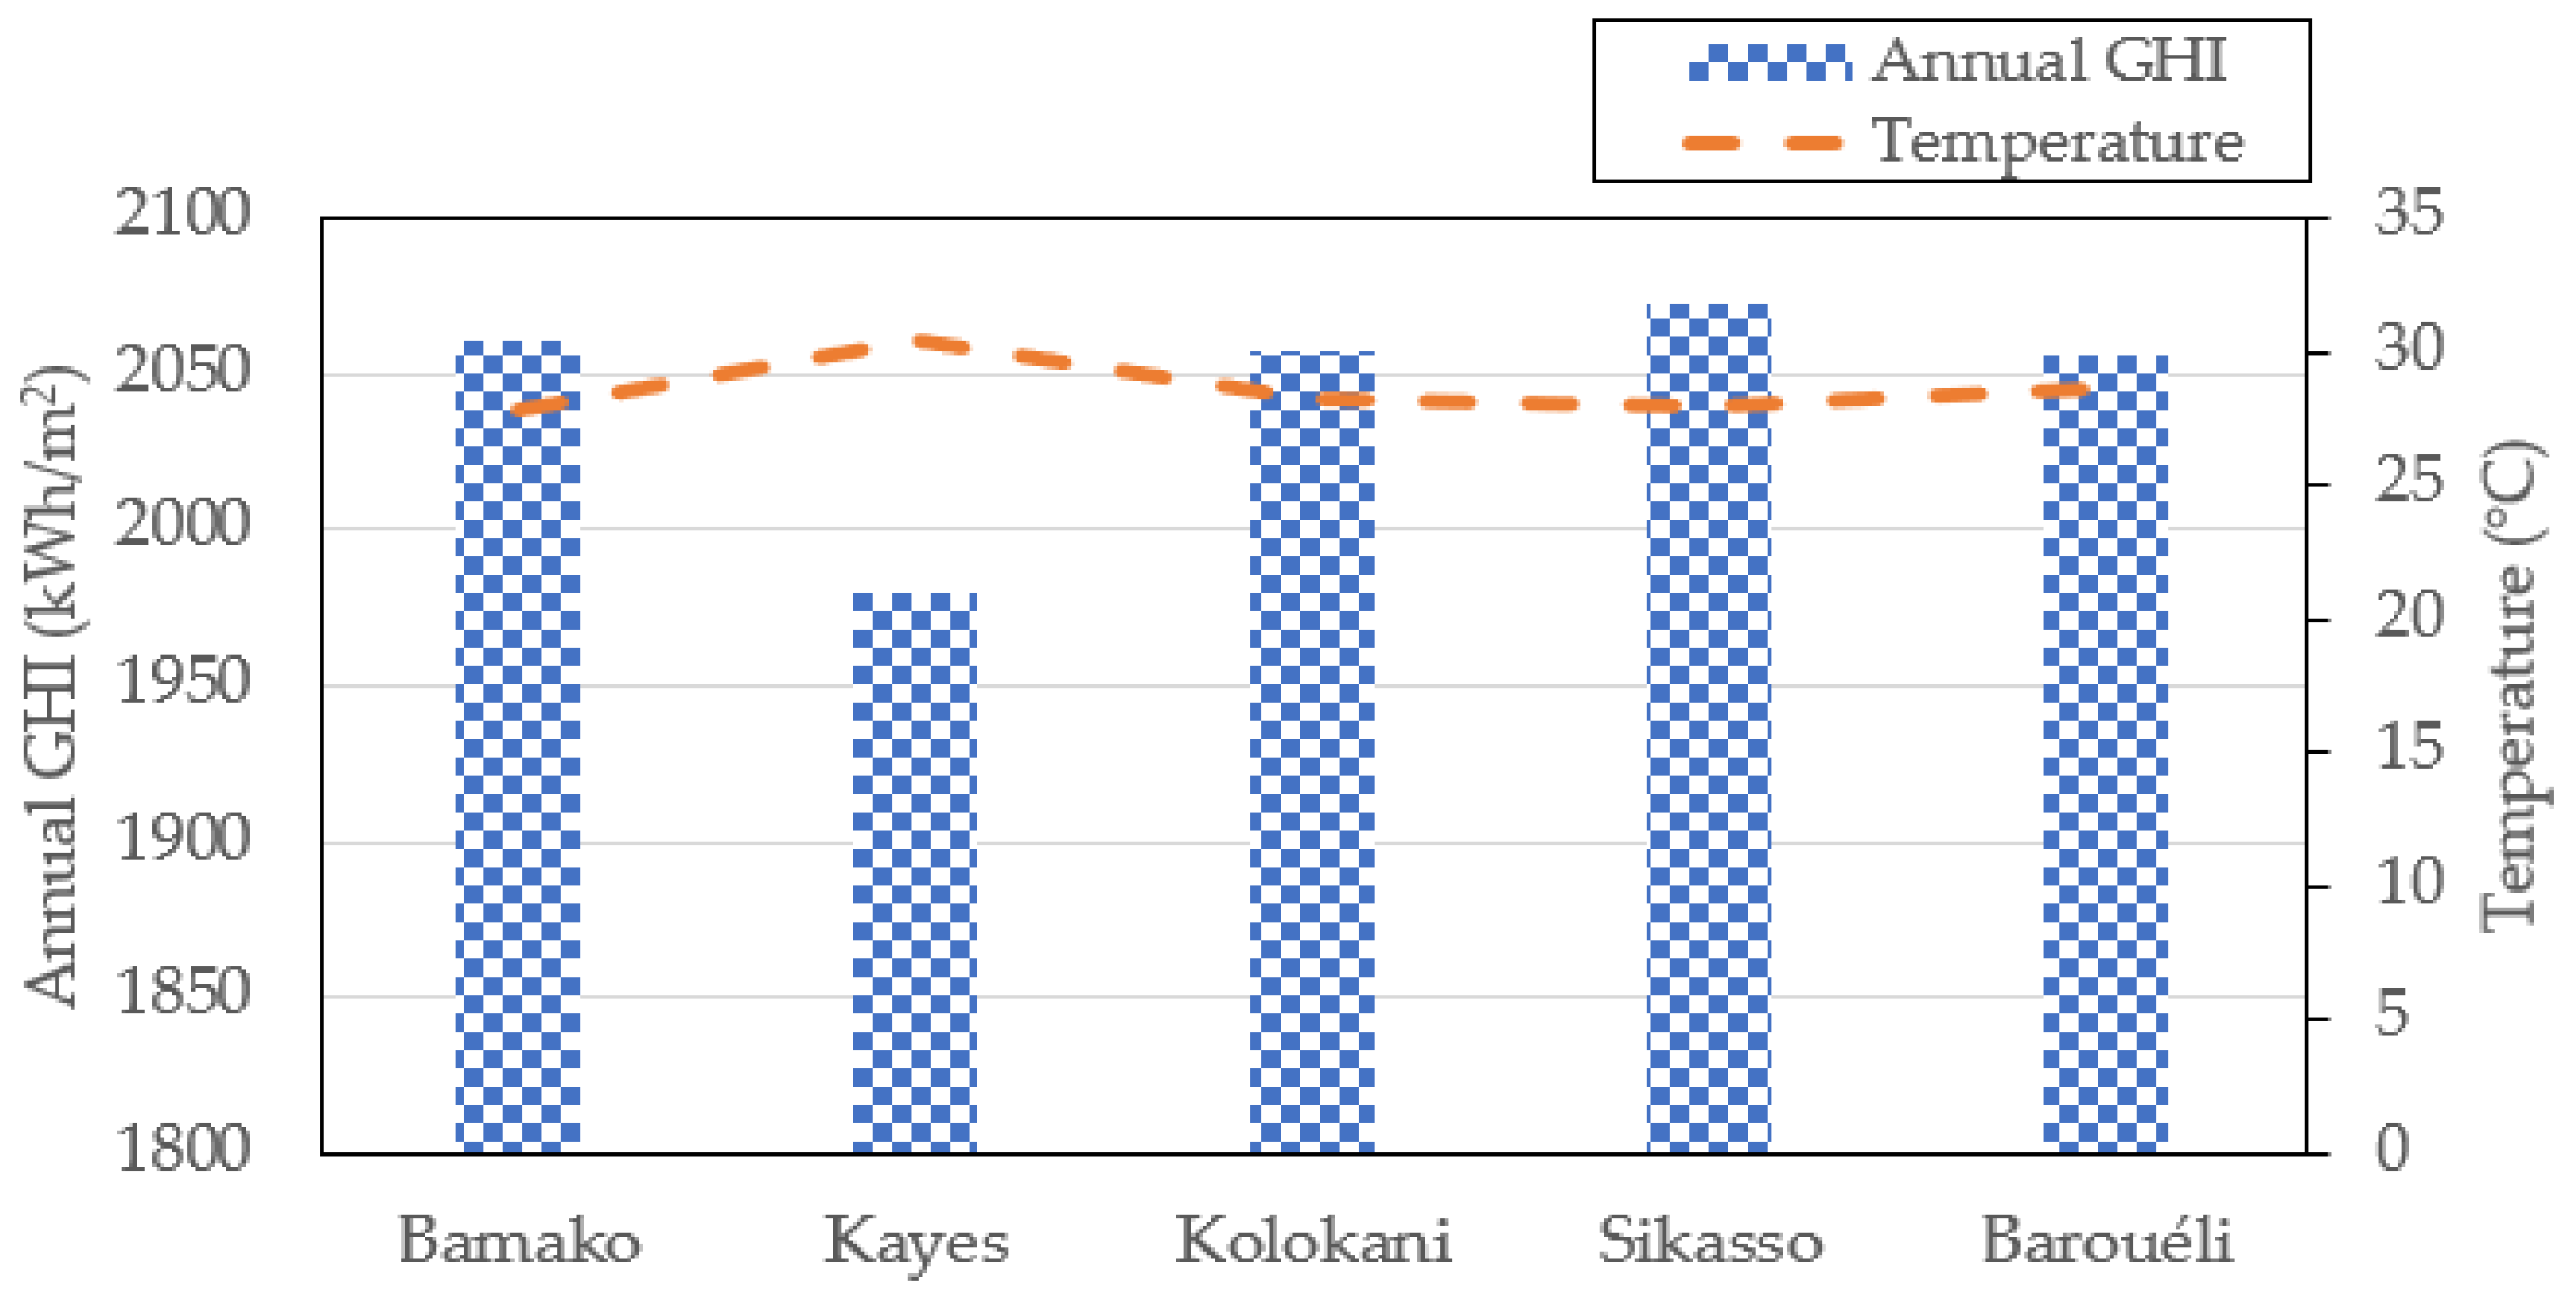
2.1. Locations and Meteorological Data
2.2. Orientations for Installation of PV Modules
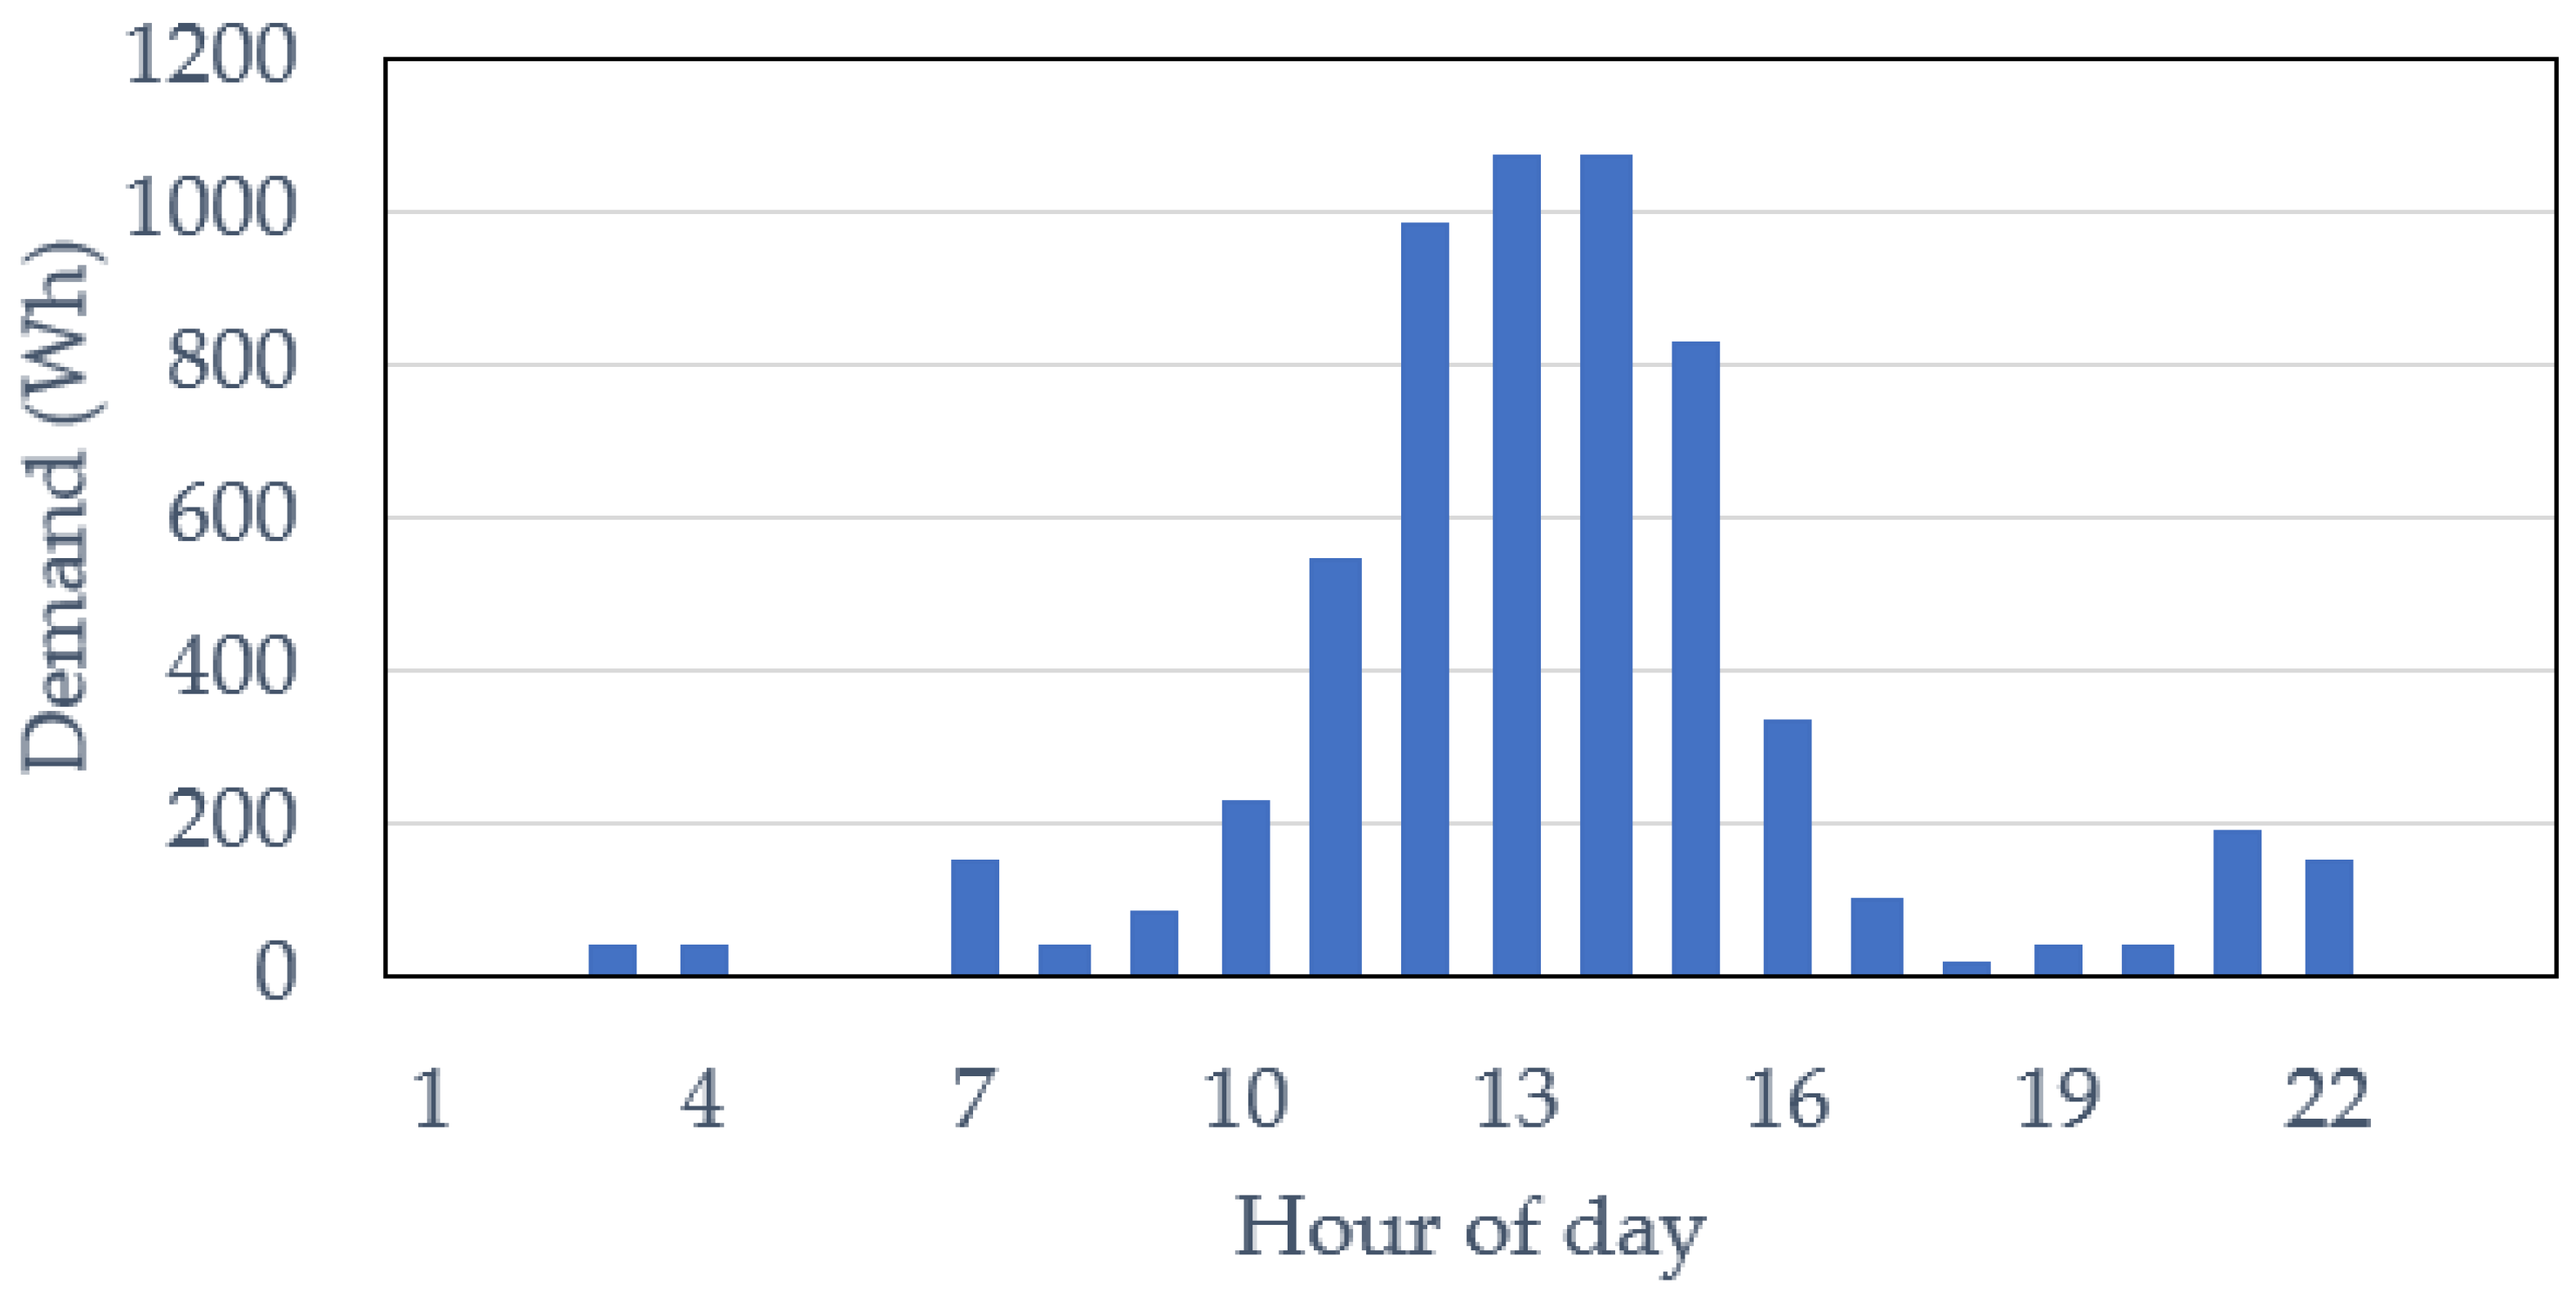
Electrical Loads for Community Health Centers
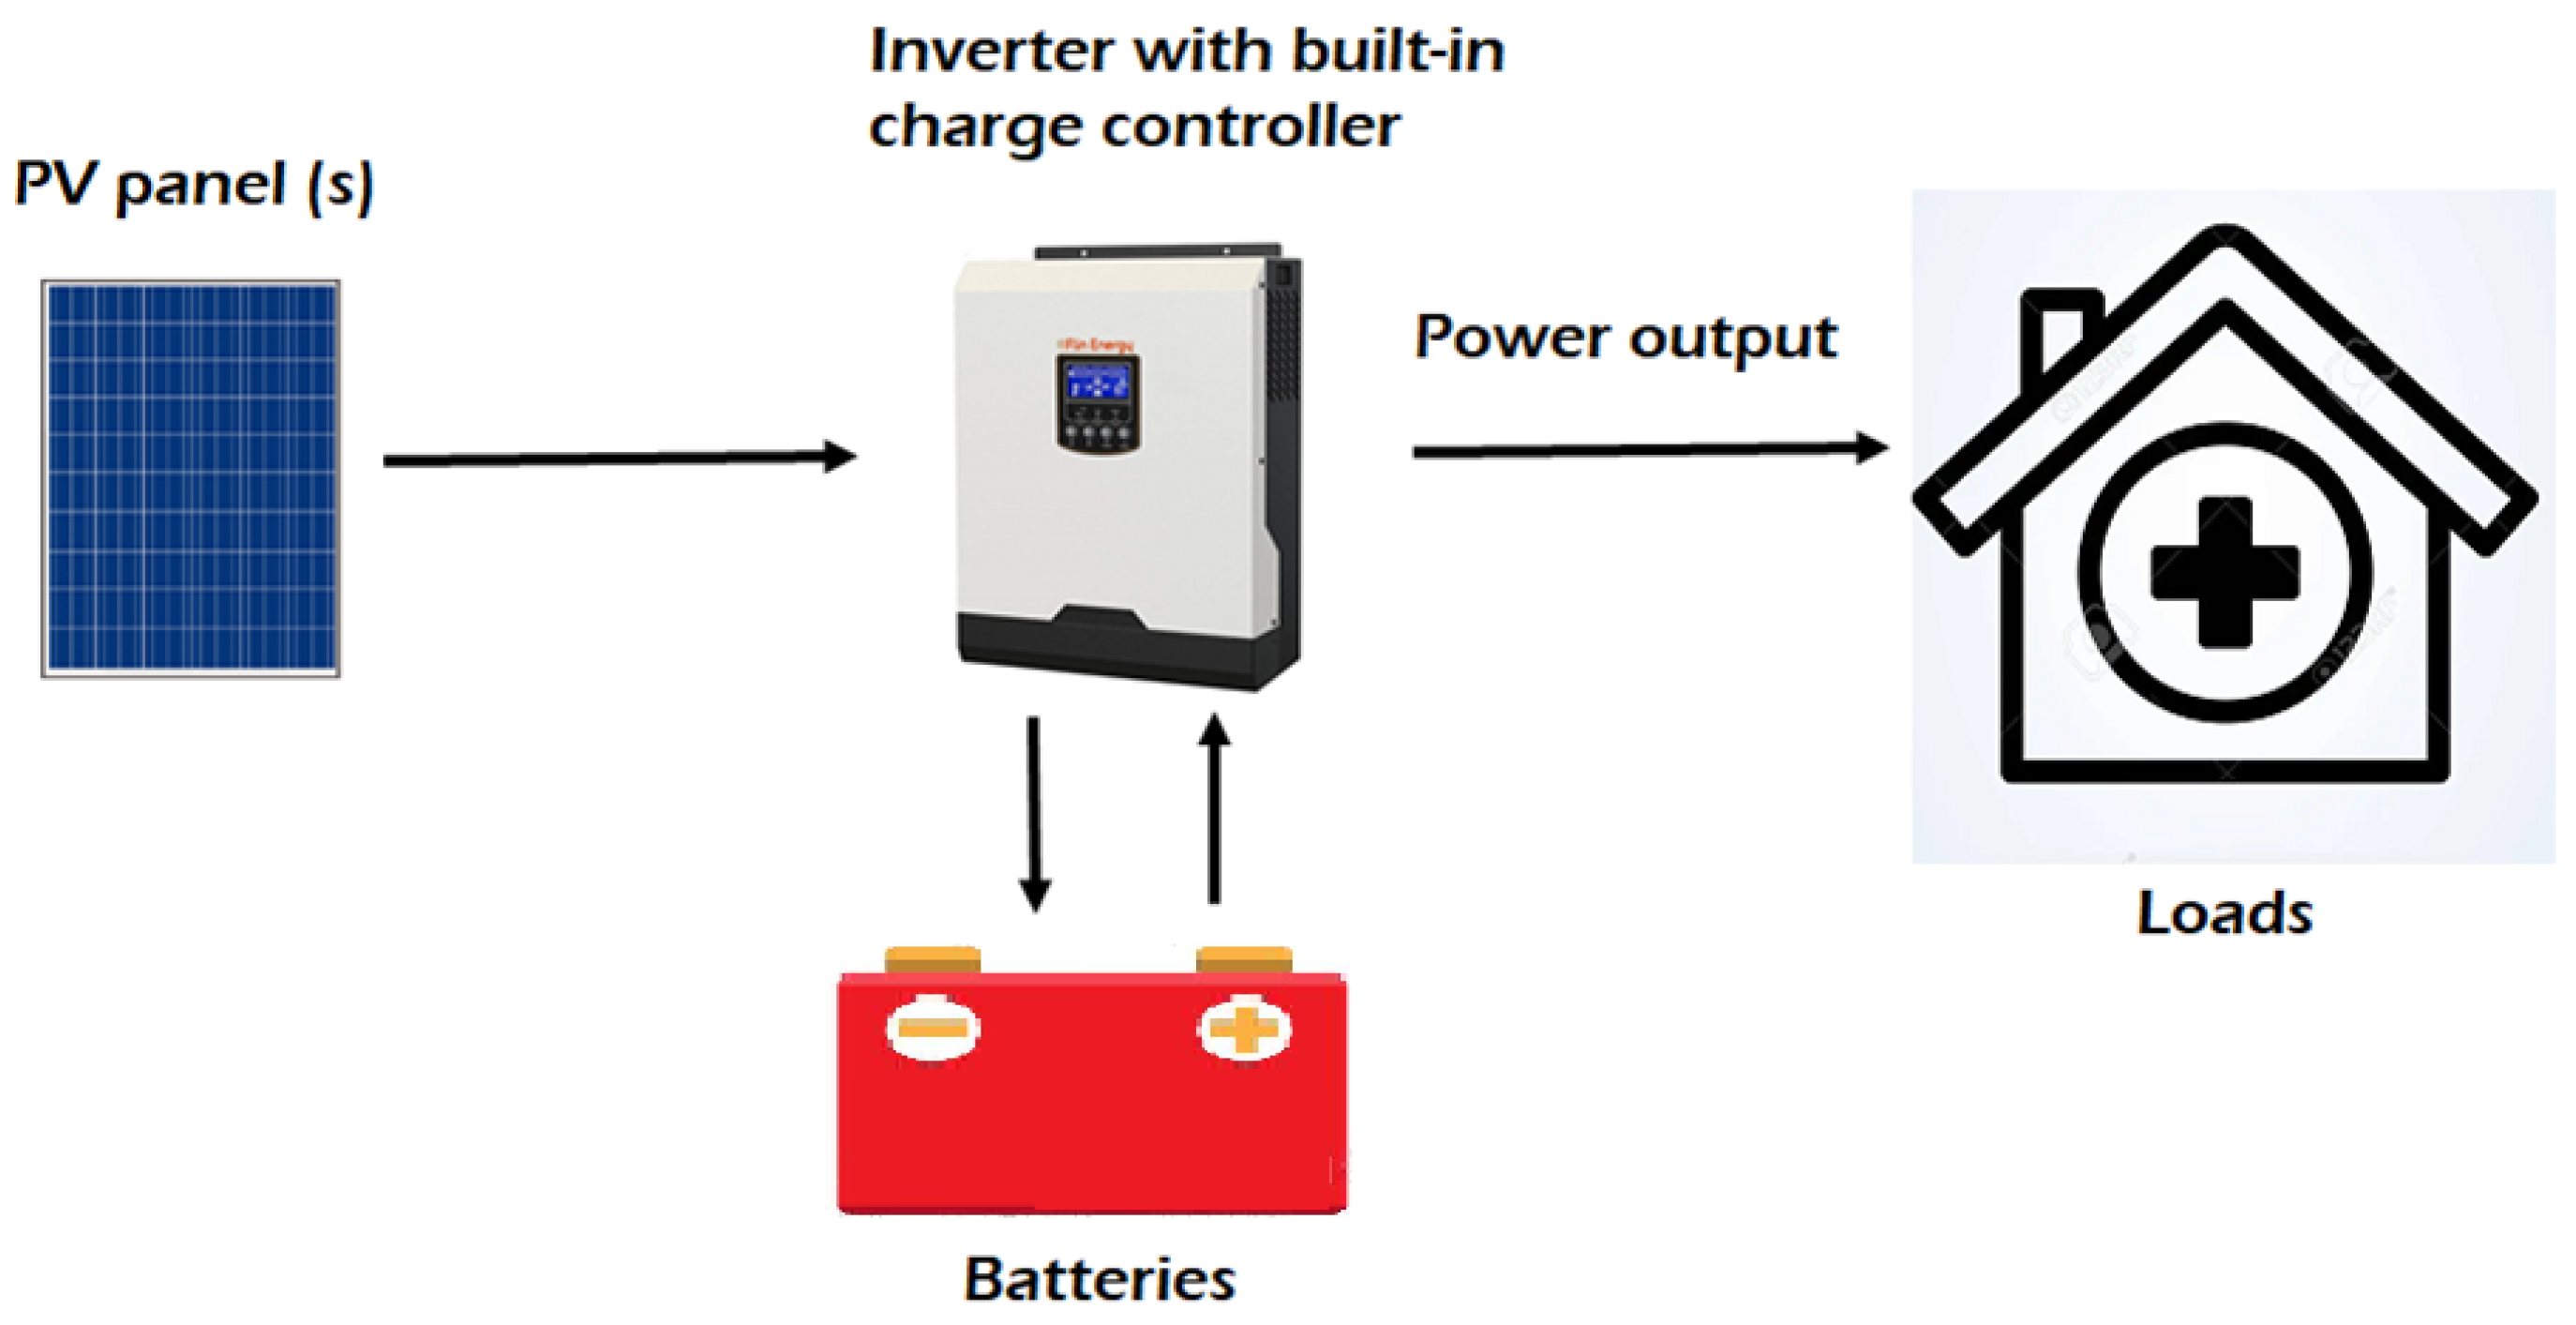
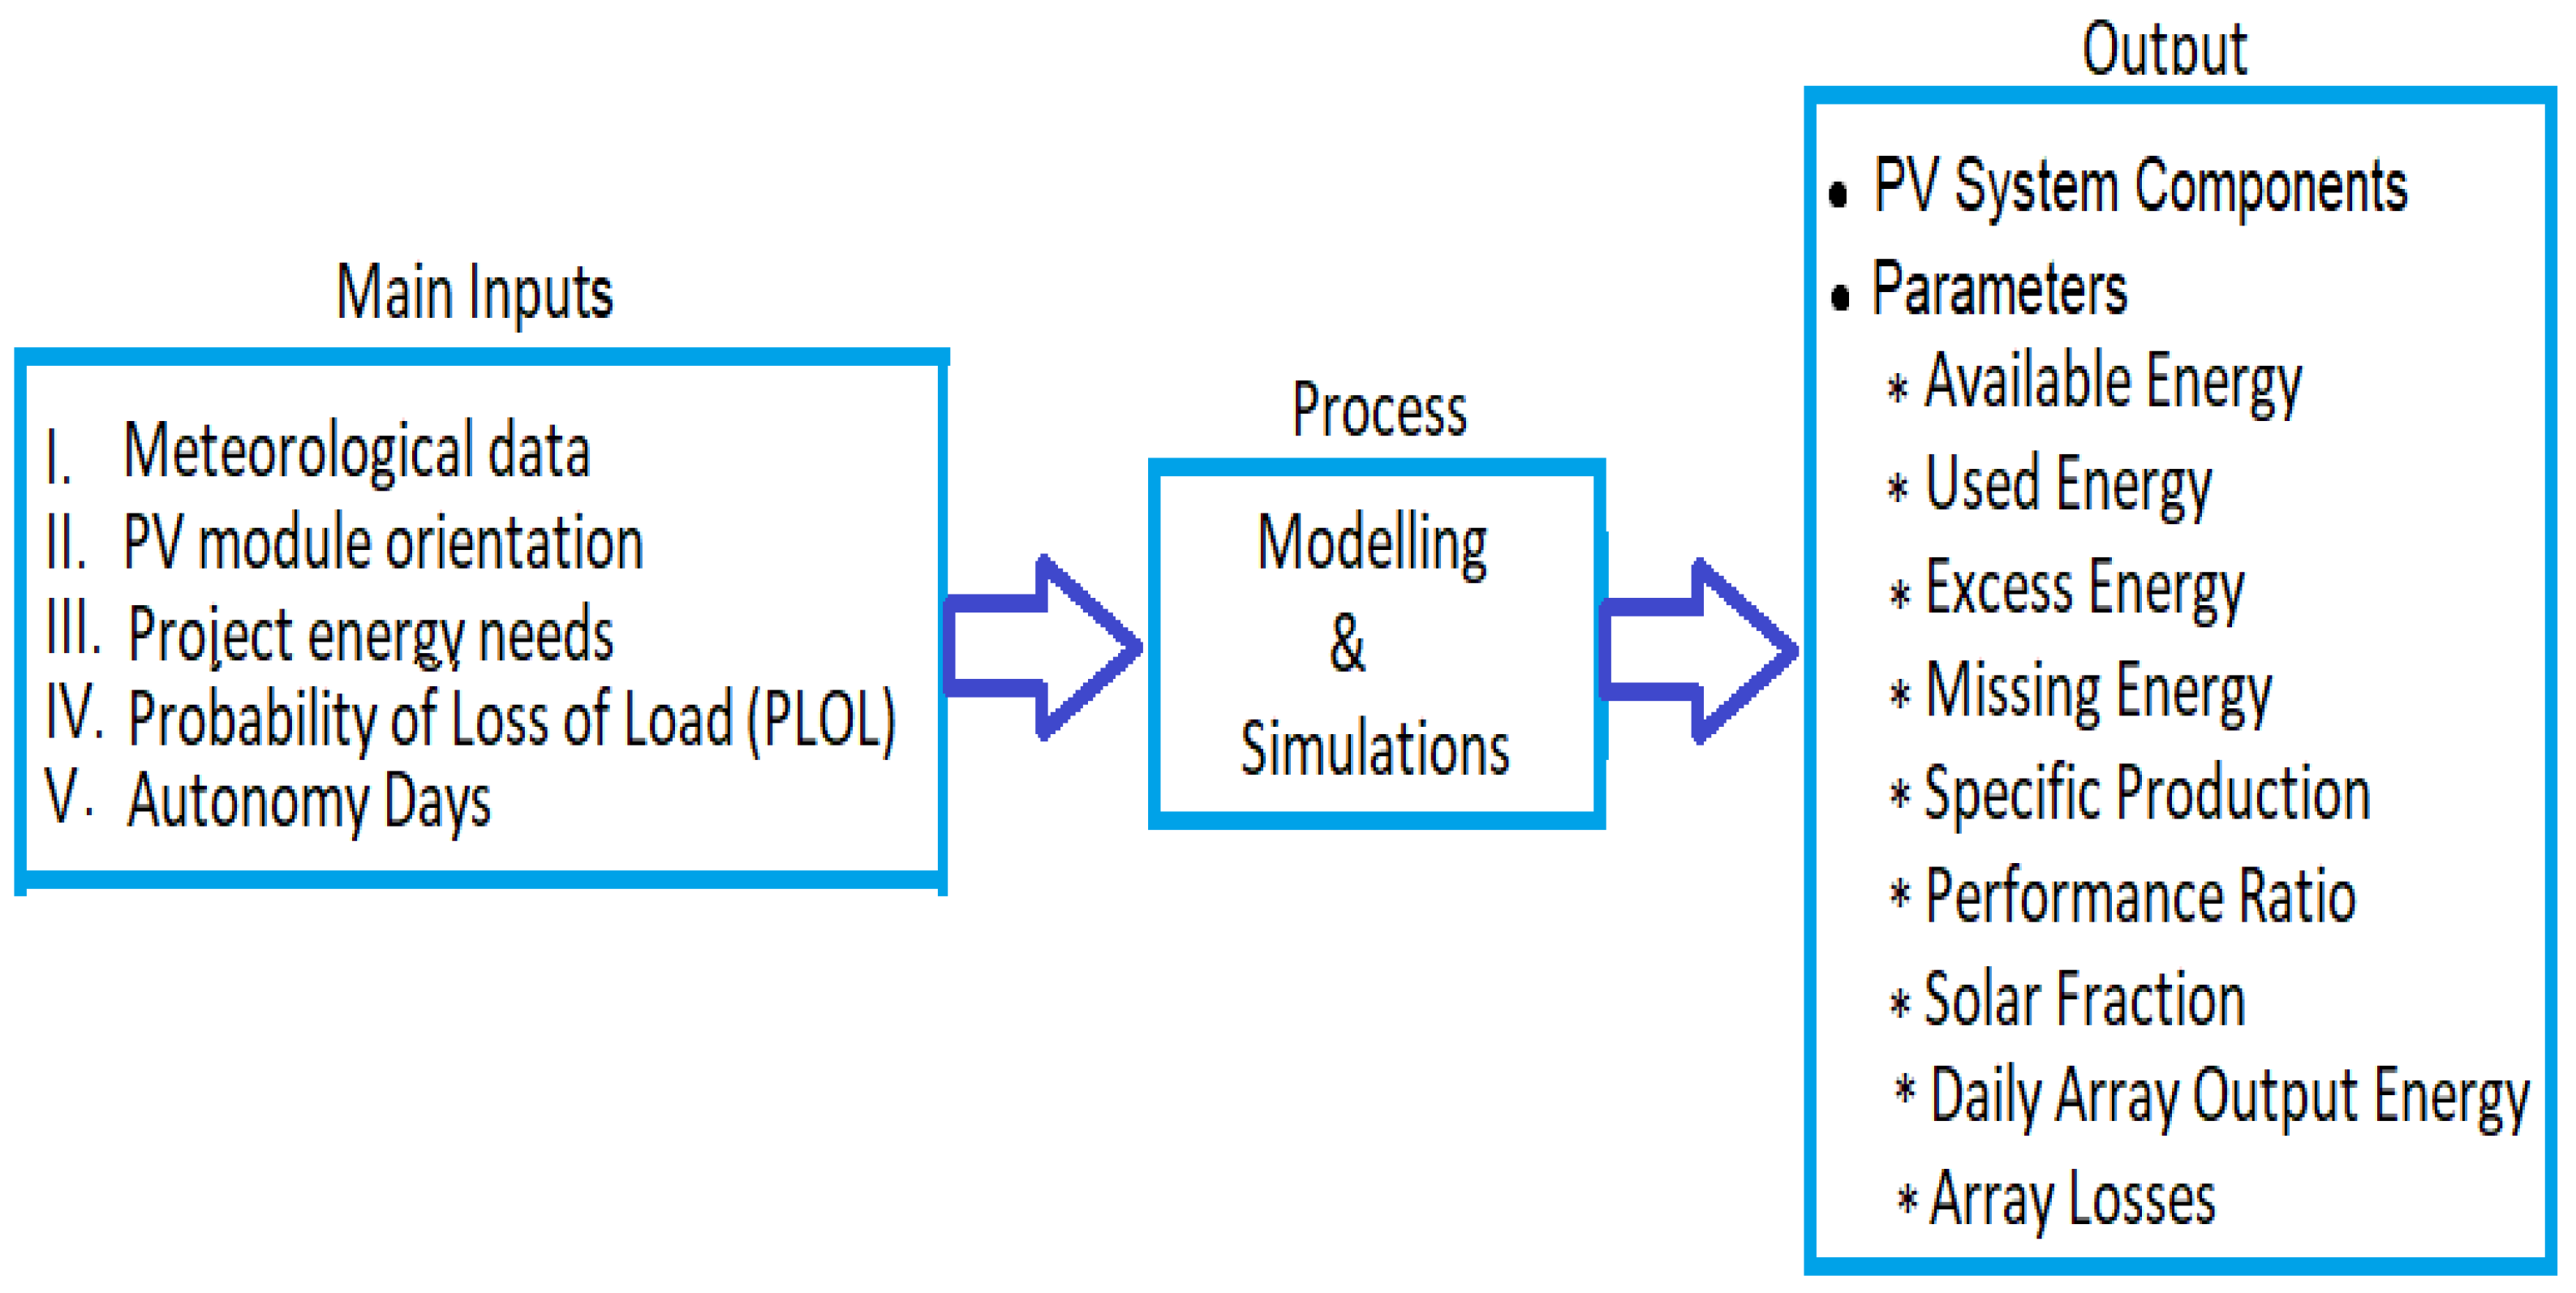
2.3. Sizing Methodology for Standalone PV Systems in PVsyst
- I.
- Meteorological data, as provided in Section 2.1.
- II.
- PV module orientation, as provided in Section 2.2.
- III.
- Project energy needs, as provided in Section 2.3.
- IV.
- Probability of loss of load (PLOL). This generic term refers to the percentage of the energy demand that cannot be supplied by electrical generators [33]. In PVsyst, PLOL is the percentage of time during which PV installation cannot meet the project’s needs. For example, with 1% of PLOL, there is a probability that 3.65 days may suffer from a shortage of energy. The value of PLOL is very important to consider in PVsyst for standalone PV systems. The sizing of PV arrays and battery storage is significantly influenced by the PLOL value used. In literature, PLOL is seen to vary between 2 and 10% for renewable energy systems [34,35]. For sensitivity analysis and impact of varying PLOL on the sizing of PV arrays, a PLOL with values ranging from 1 to 5% is considered.
- V.
- Autonomy days. For standalone PV systems, calculation for batteries is the first step in the design process. The number of batteries required is mainly dependent on the daily energy consumption by the loads and the number of autonomy days. Autonomy days refer to the number of days that battery will be capable of providing the required daily needs without the support of the PV modules. Autonomy days are very important to consider for cases such as monsoon seasons or similar weather conditions, when there is a possibility that Sun may not shine for one or more days. Generally, choice of autonomy days for standalone PV systems depends on the weather conditions or the user preference. Because prices of batteries are very high at the moment, the choice of autonomy days has to be made very carefully. Any increase in autonomy days will increase the number of batteries, and ultimately, this will increase the total cost and make the PV system more expensive. In the literature, autonomy is seen to vary from 1 to 3 days [36,37,38]. For sensitivity analysis and impact of autonomy days on the sizing and overall performance of the PV system, during the modeling and simulation for this study, 1, 2, and 3 autonomy days were considered.
2.3.1. Solar Fraction
2.3.2. Performance Ratio (PR)
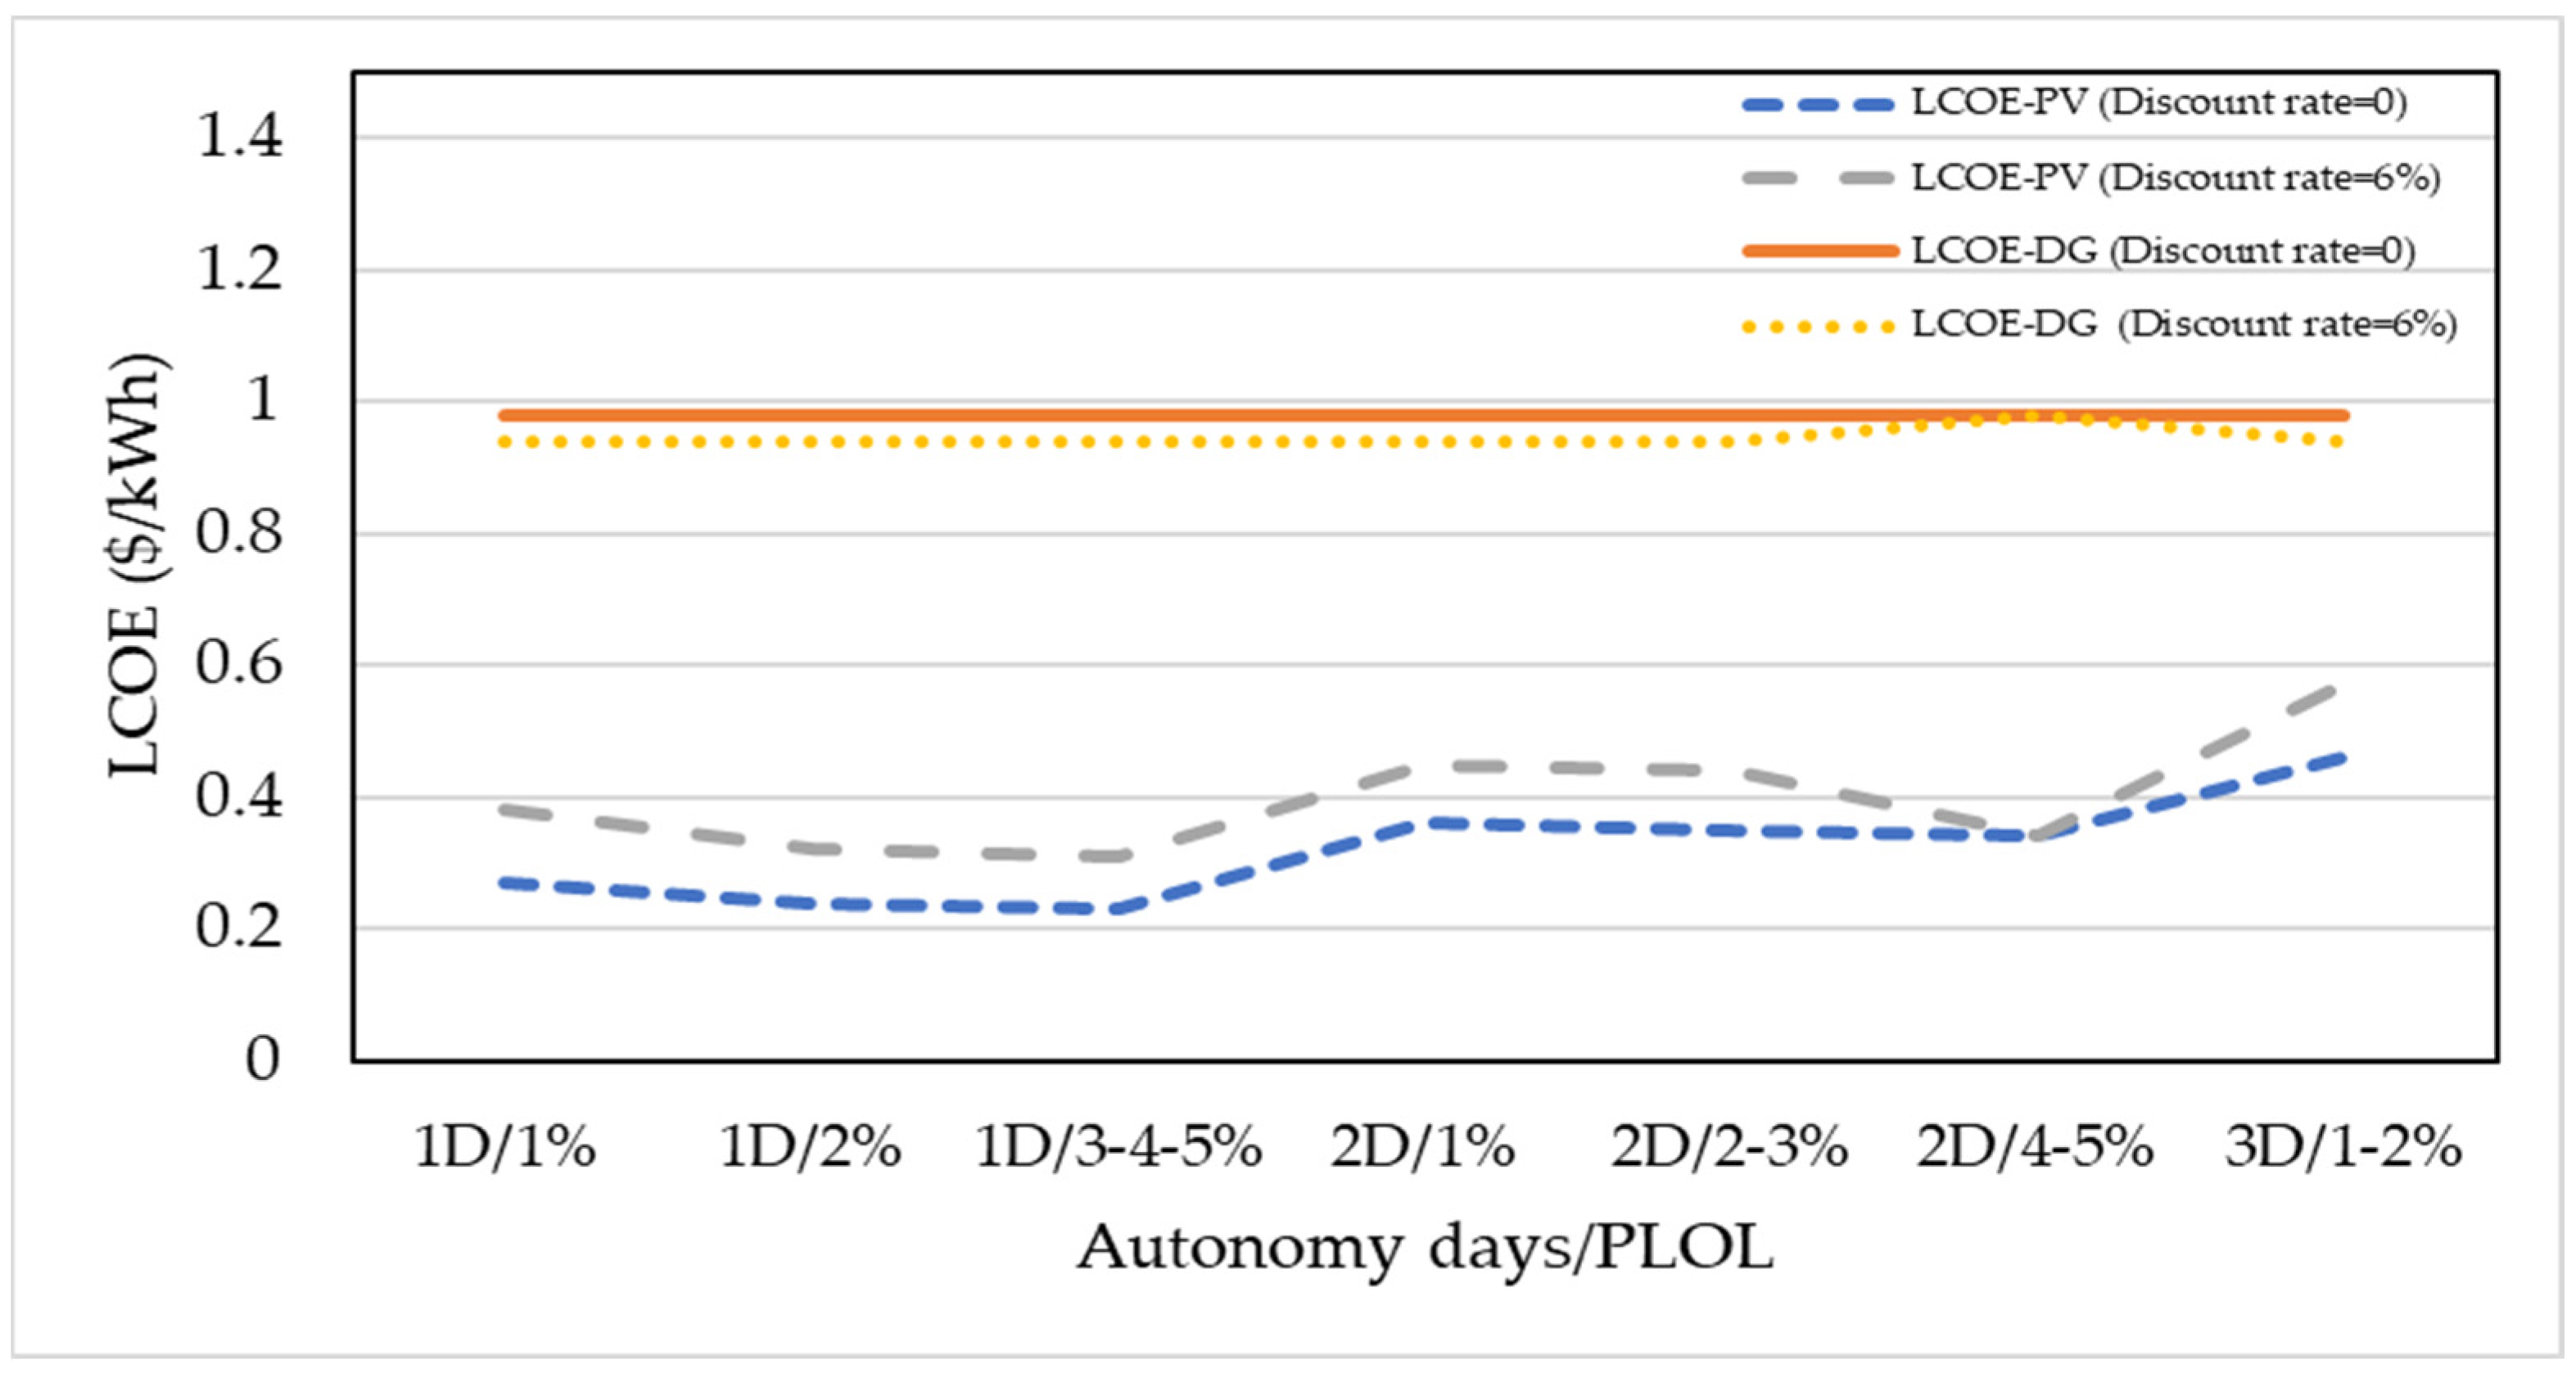
2.3.3. Levelized Cost of Electricity (LCOE)
2.3.4. Payback Period
2.3.5. Return on Investment (ROI)
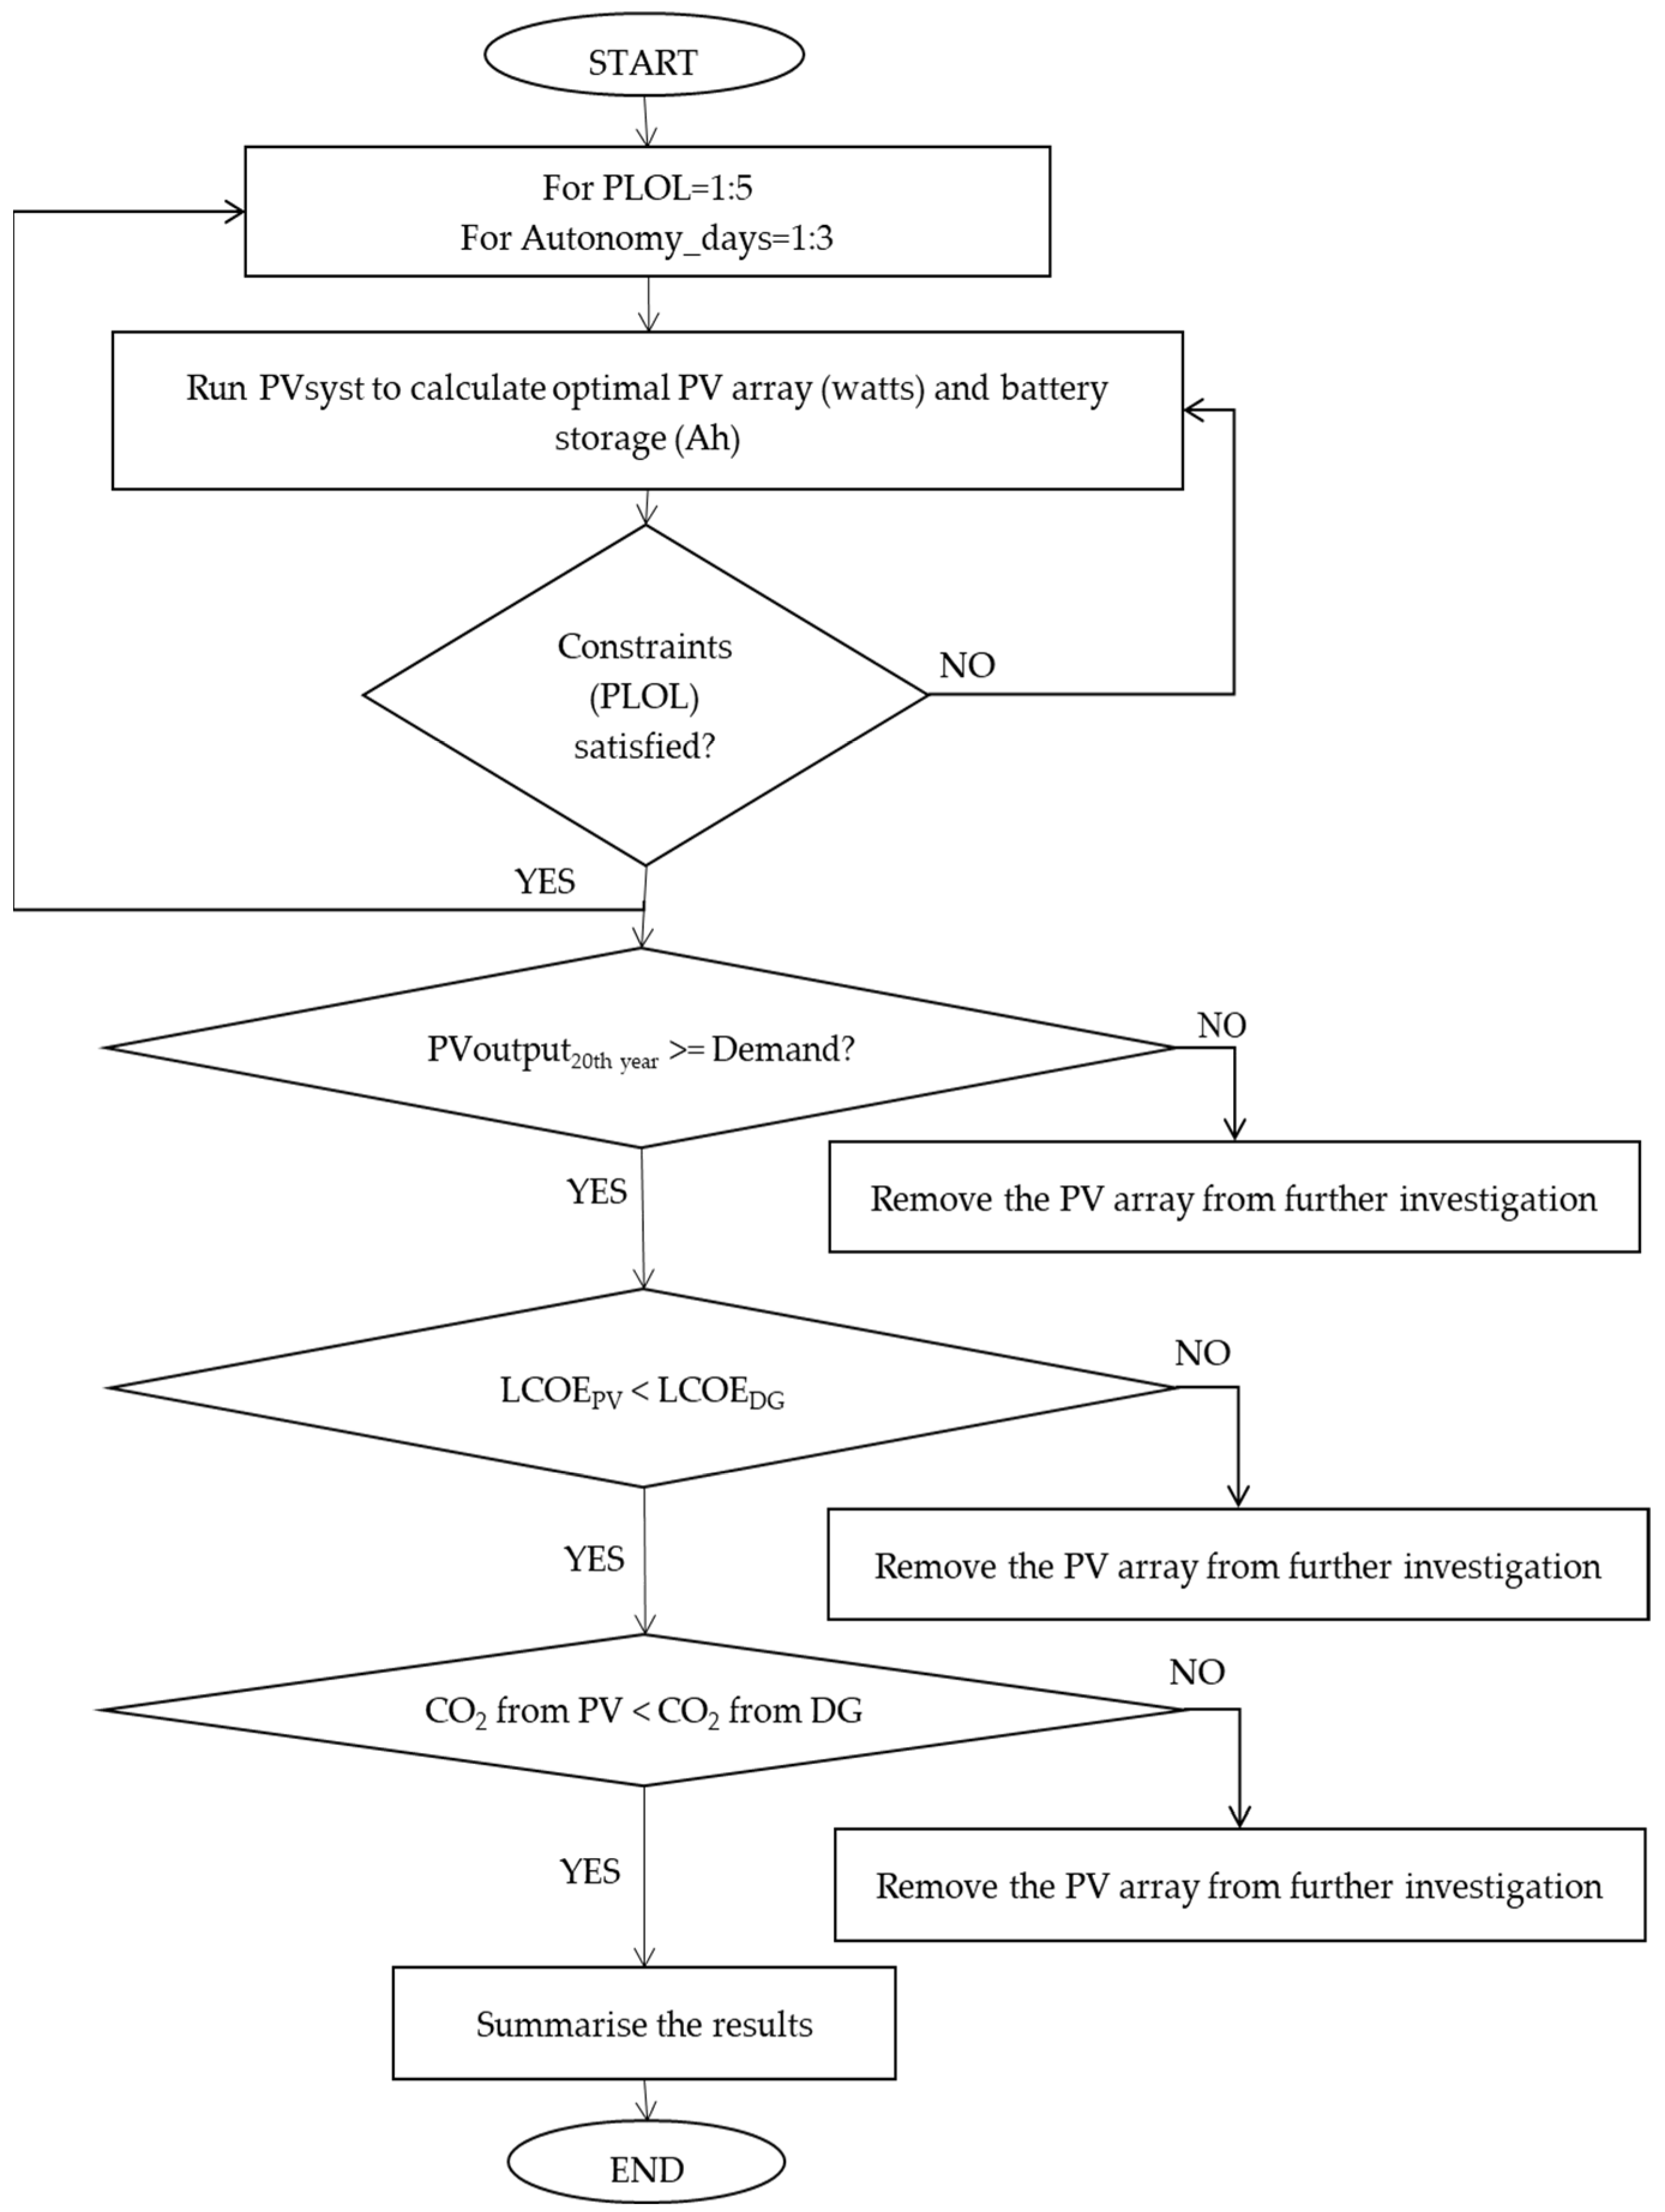
2.4. Optimization Flowchart
3. Results and Discussion
3.1. Technical Evaluation
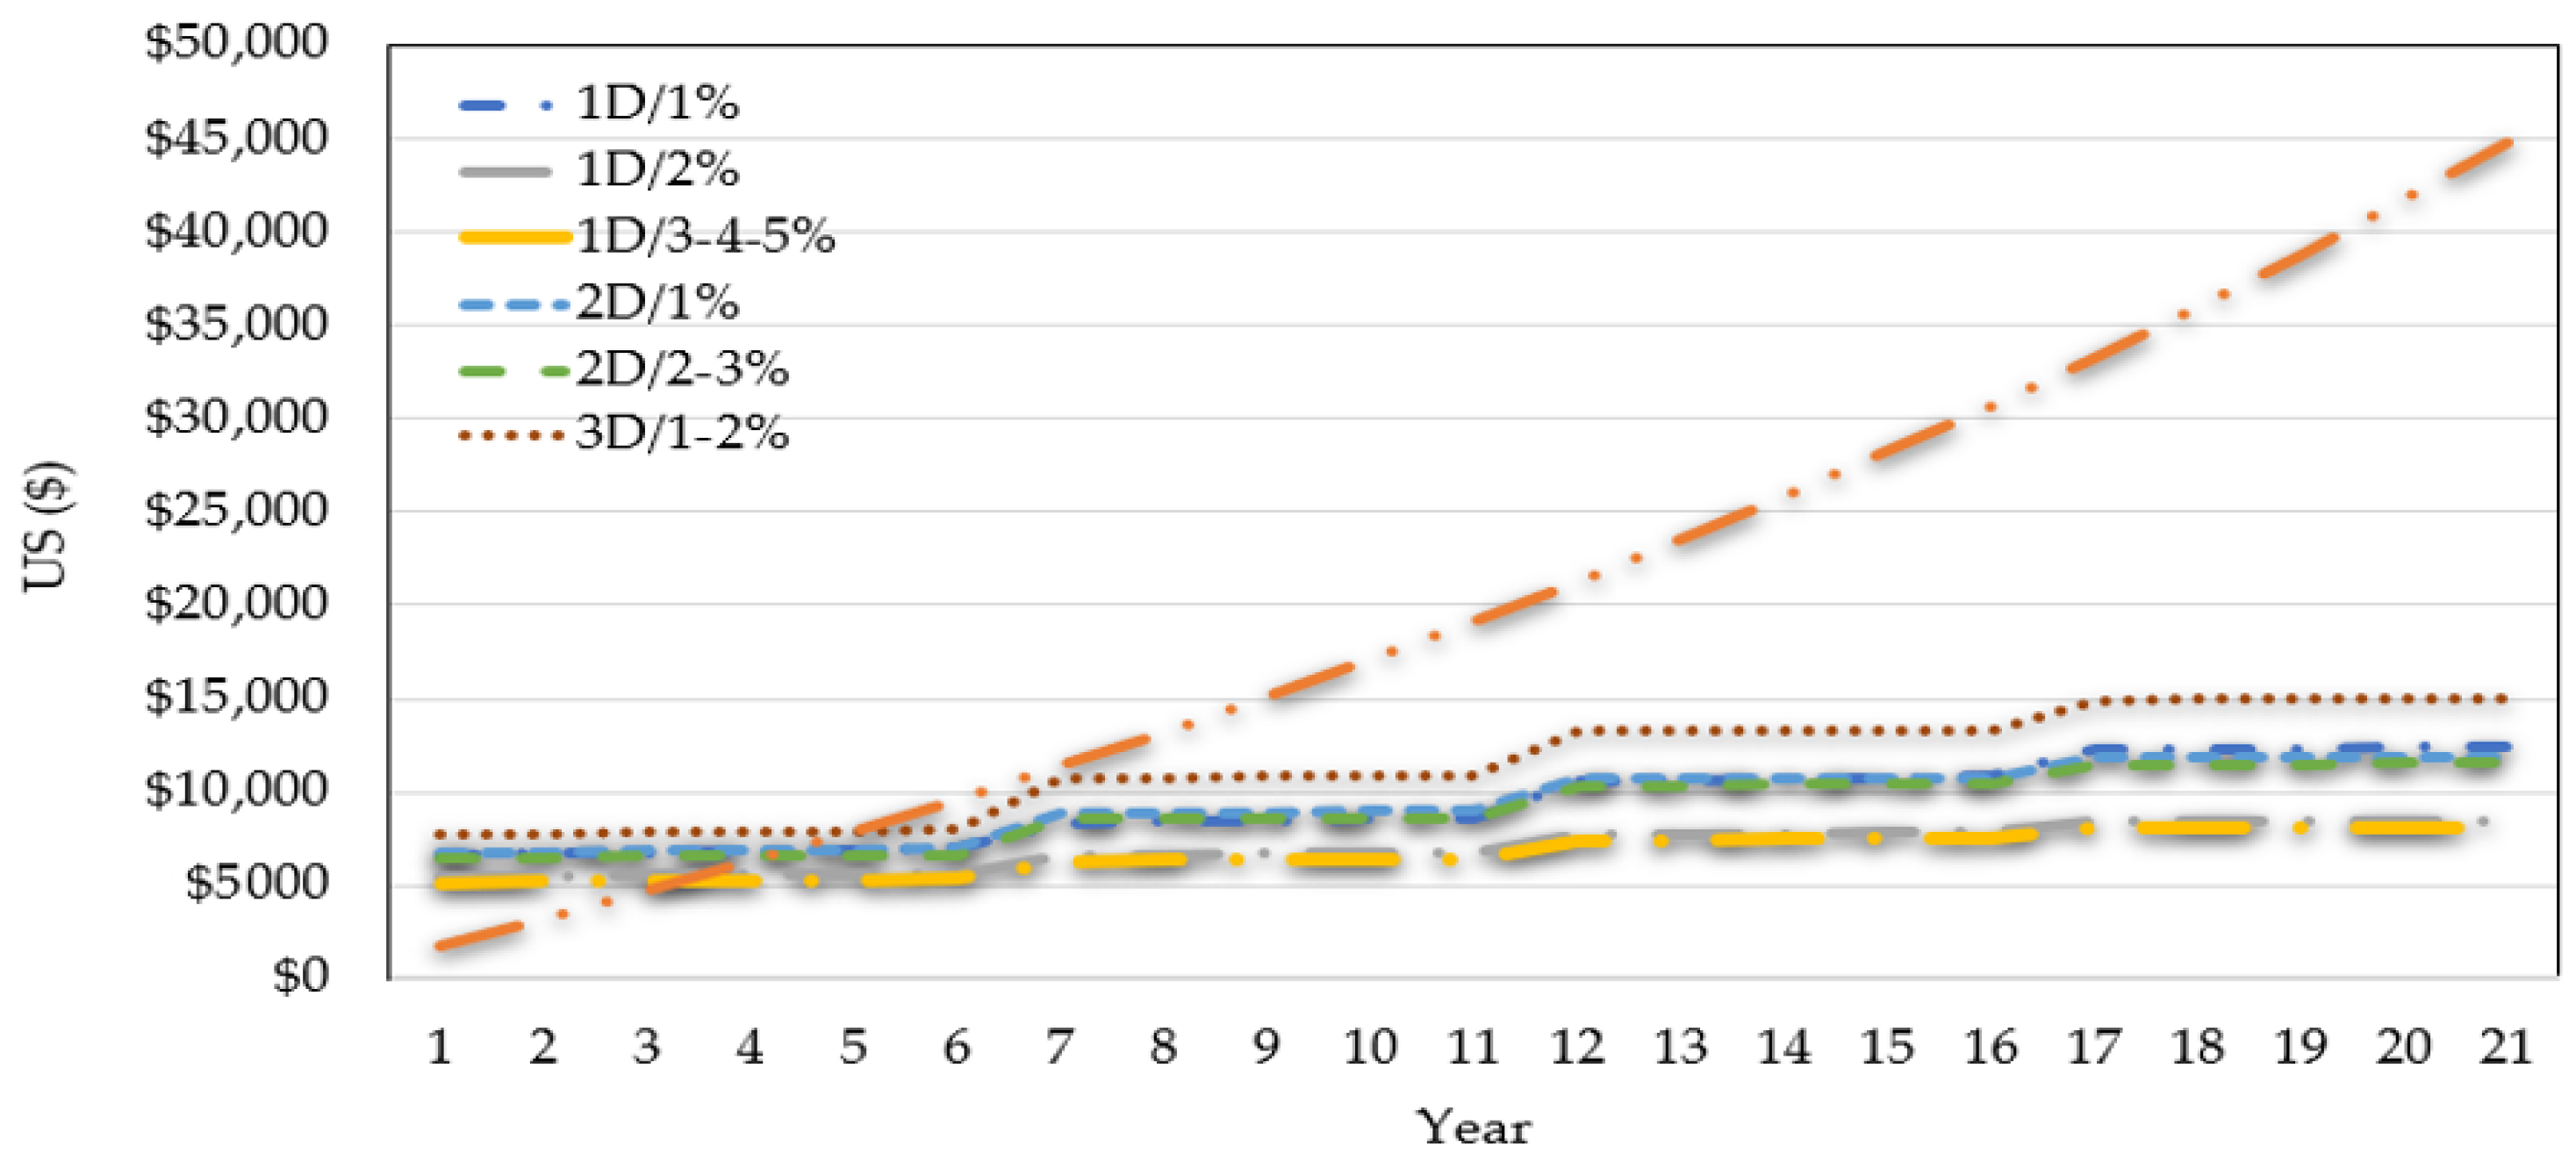
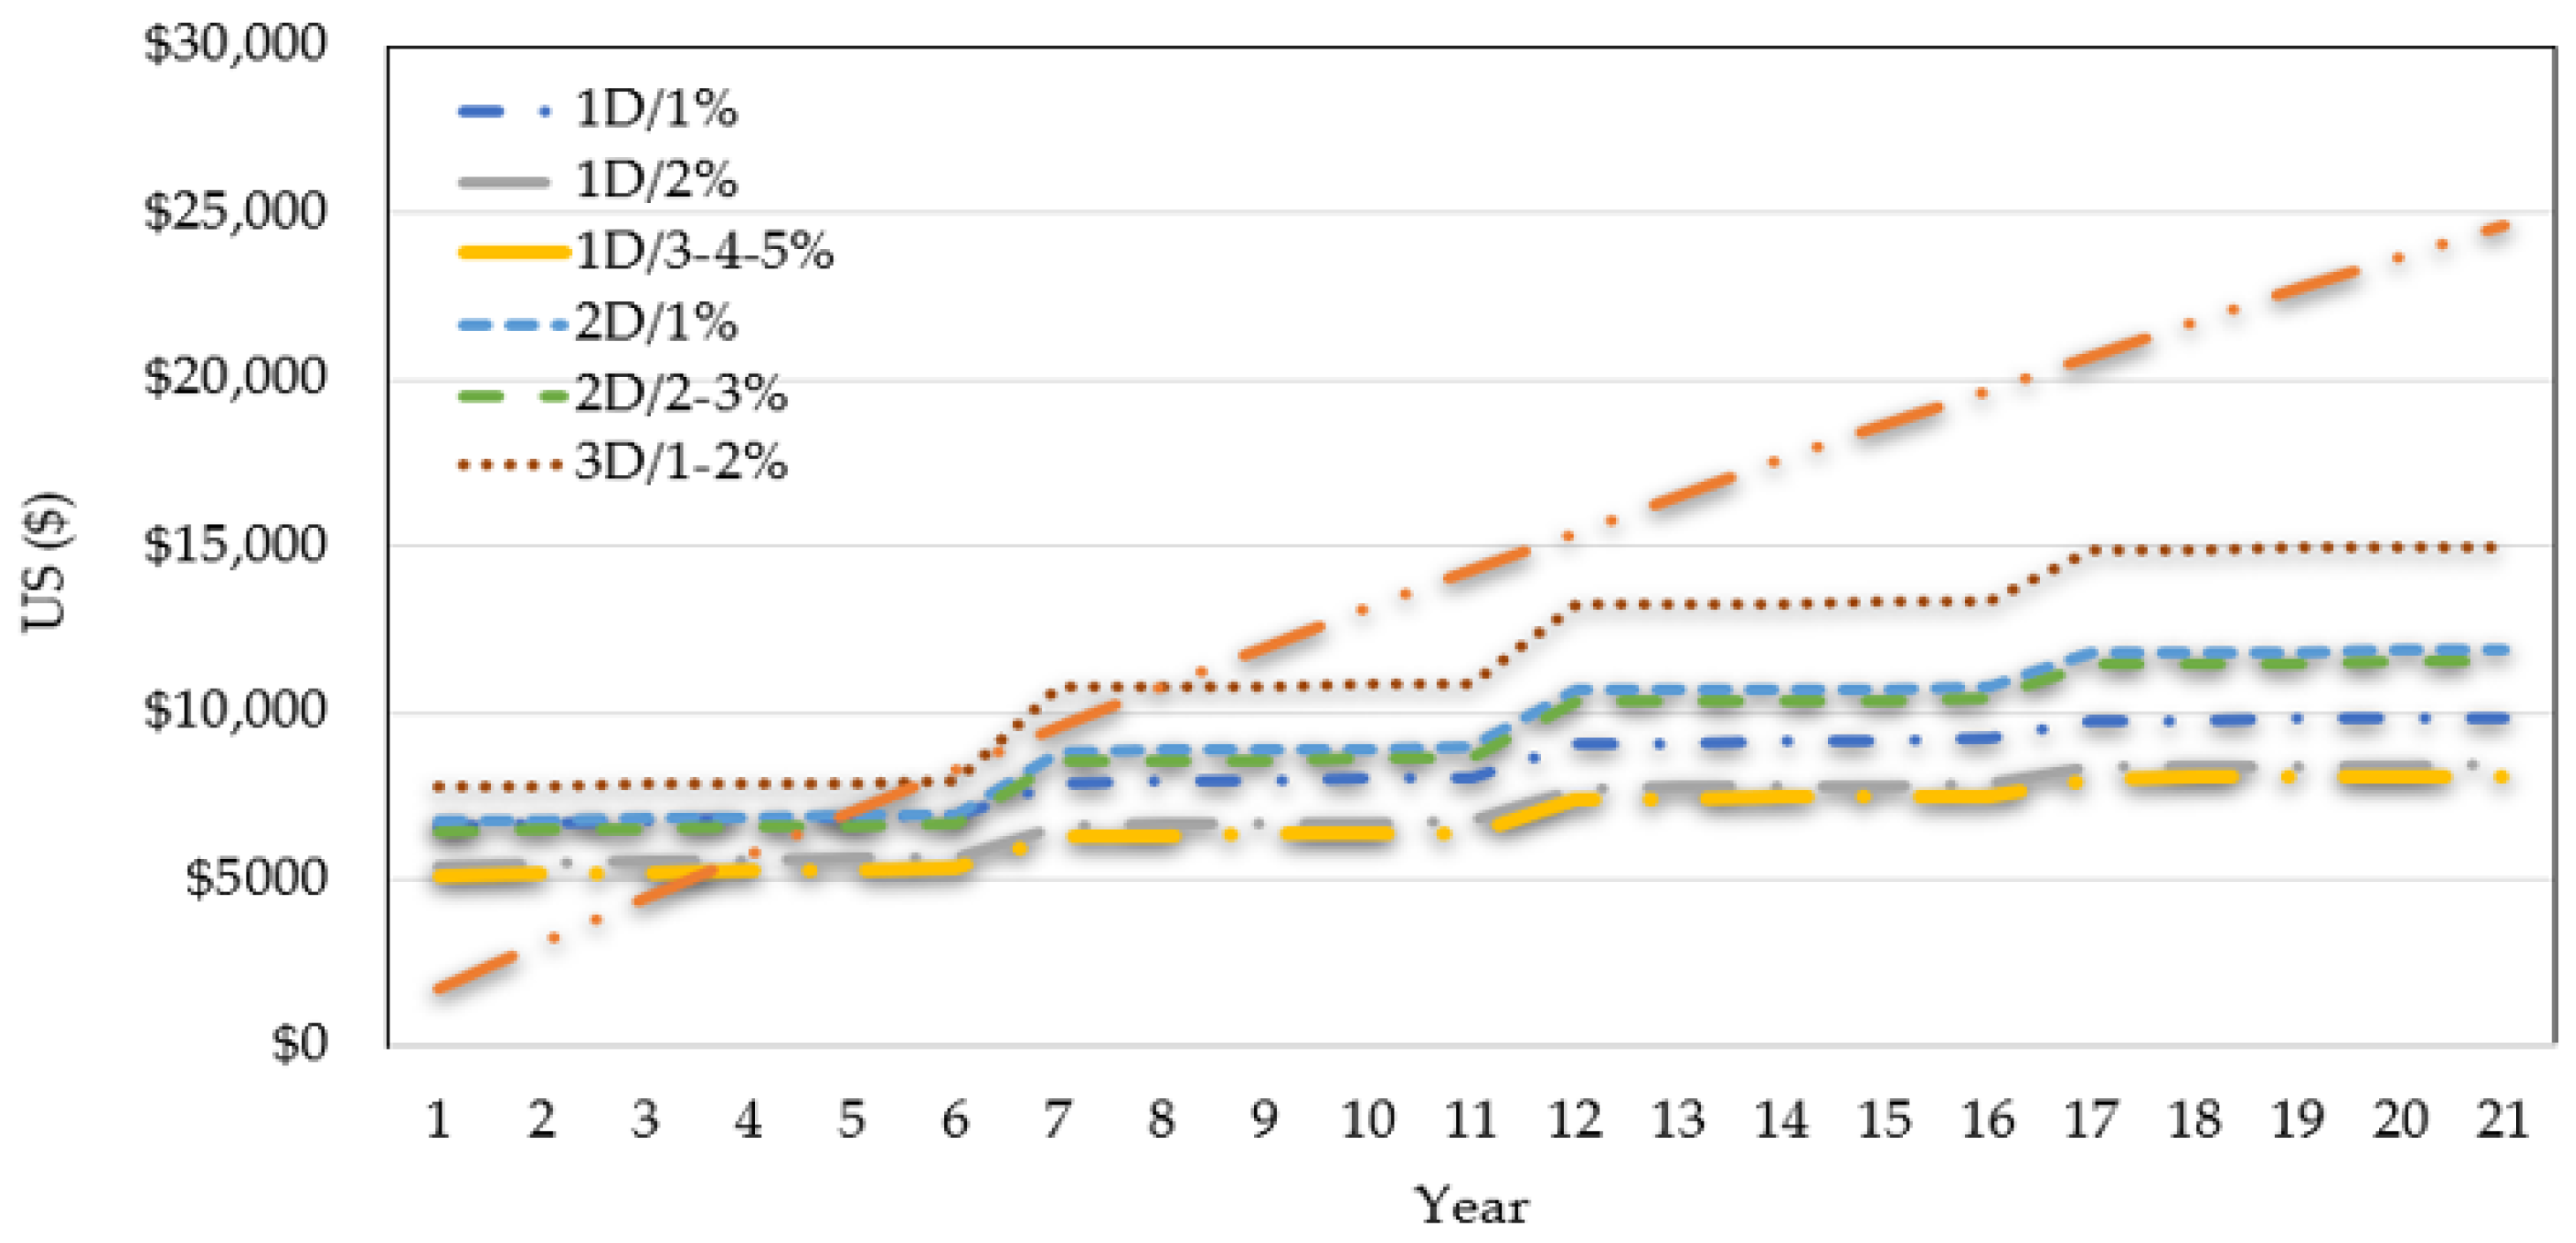
3.2. Economic Evaluation
3.3. Environmental Evaluation
4. Conclusions
5. Directions for Further Research
Author Contributions
Funding
Institutional Review Board Statement
Informed Consent Statement
Data Availability Statement
Acknowledgments
Conflicts of Interest
References
- Bhatia, M. Access to Modern Energy Services for Health Facilities in Resource-Constrained Settings: A Review of Status, Significance, Challenges and Measurement; World Health Organization: Geneva, Switzerland, 2015. [Google Scholar]
- Berahab, R. The Energy Crisis of 2021 and its Implications for Africa; Policy Brief, Number 06/22, Published in February 2022; The Policy Center for the New South: Rabat, Morocco, 2022. [Google Scholar]
- Gbedey, F.; Toga, M. Electricity Utility Reform in Mali: Lessons from Operations; World Bank: Washington, DC, USA, 2020. [Google Scholar]
- Ngangue, P.; Robert, K.; Ly, B.A.; Traoré, F.; Vezina, M. Evaluating the effects of an intervention to improve the health environment for mothers and children in health centres (BECEYA) in Mali: A qualitative study. Pan Afr. Med. J. 2023, 44, 138. [Google Scholar] [CrossRef] [PubMed]
- Simon, P. Renewable Energy Medium-Term Market Report 2015; Market Analysis and Forecasts to 2020-Executive Summary; International Energy Agency: Paris, France, 2015; p. 14. [Google Scholar]
- Mokhtara, C.; Negrou, B.; Settou, N.; Bouferrouk, A.; Yao, Y.; Assessments. Optimal design of grid-connected rooftop PV systems: An overview and a new approach with application to educational buildings in arid climates. Sustain. Energy Technol. 2021, 47, 101468. [Google Scholar] [CrossRef]
- Feldman, D.; Dummit, K.; Zuboy, J.; Heeter, J.; Xu, K.; Margolis, R. Spring 2022 Solar Industry Update; National Renewable Energy Lab. (NREL): Golden, CO, USA, 2022.
- Aslam, A.; Ahmed, N.; Qureshi, S.A.; Assadi, M.; Ahmed, N. Advances in solar PV systems; A comprehensive review of PV performance, influencing factors, and mitigation techniques. Energies 2022, 15, 7595. [Google Scholar] [CrossRef]
- Roy, P.; Ghosh, A.; Barclay, F.; Khare, A.; Cuce, E. Perovskite solar cells: A review of the recent advances. Coatings 2022, 12, 1089. [Google Scholar] [CrossRef]
- Nazir, S.; Ali, A.; Aftab, A.; Muqeet, H.A.; Mirsaeidi, S.; Zhang, J.-M. Techno-Economic and Environmental Perspectives of Solar Cell Technologies: A Comprehensive Review. Energies 2023, 16, 4959. [Google Scholar] [CrossRef]
- Jing, W.; Lai, C.H.; Wong, W.S.; Wong, M.D. A comprehensive study of battery-supercapacitor hybrid energy storage system for standalone PV power system in rural electrification. Appl. Energy 2018, 224, 340–356. [Google Scholar] [CrossRef]
- Khalilpour, K.R.; Vassallo, A. Technoeconomic parametric analysis of PV-battery systems. Renew. Energy 2016, 97, 757–768. [Google Scholar] [CrossRef]
- Marques Lameirinhas, R.A.; Torres, J.P.N.; de Melo Cunha, J. A photovoltaic technology review: History, fundamentals and applications. Energies 2022, 15, 1823. [Google Scholar] [CrossRef]
- Etukudor, C.; Robu, V.; Früh, W.-G.; Flynn, D.; Orovwode, H. Yield assessment of Off-grid PV systems in Nigeria. In Proceedings of the 2021 IEEE PES/IAS PowerAfrica, Virtual, 23–27 August 2021. [Google Scholar]
- Okoye, C.O.; Oranekwu-Okoye, B.C. Economic feasibility of solar PV system for rural electrification in Sub-Sahara Africa. Renew. Sustain. Energy Rev. 2018, 82, 2537–2547. [Google Scholar] [CrossRef]
- Akinsipe, O.C.; Moya, D.; Kaparaju, P. Design and economic analysis of off-grid solar PV system in Jos-Nigeria. J. Clean. Prod. 2021, 287, 125055. [Google Scholar] [CrossRef]
- Nguimdo, L.A.; Tassi, L.T. Optimum Sizing and Economic Analysis of Standalone PV System with a Small Size Grinding Mill. Energy Power Eng. 2020, 12, 432–444. [Google Scholar] [CrossRef]
- Mbinkar, E.N.; Asoh, D.A.; Tchuidjan, R.; Baldeh, A. Design of a photovoltaic mini-grid system for rural electrification in Sub-Saharan Africa. Energy Power Eng. 2021, 13, 91–110. [Google Scholar] [CrossRef]
- Babatunde, O.M.; Adedoja, O.S.; Babatunde, D.E.; Denwigwe, I.H.; Engineering. Off-grid hybrid renewable energy system for rural healthcare centers: A case study in Nigeria. Energy Sci. 2019, 7, 676–693. [Google Scholar] [CrossRef]
- Bosisio, A.; Moncecchi, M.; Cassetti, G.; Merlo, M. Microgrid design and operation for sensible loads: Lacor hospital case study in Uganda. Sustain. Energy Technol. Assess. 2019, 36, 100535. [Google Scholar] [CrossRef]
- Ladu, N.S.D.; Samikannu, R.; Gebreslassie, K.G.; Sankoh, M.; Hakim, L.E.R.; Badawi, A.; Latio, T.P.B. Feasibility study of a standalone hybrid energy system to supply electricity to a rural community in South Sudan. Sci. Afr. 2022, 16, e01157. [Google Scholar] [CrossRef]
- Ghazi, S.; Ip, K. The effect of weather conditions on the efficiency of PV panels in the southeast of UK. Renew. Energy 2014, 69, 50–59. [Google Scholar] [CrossRef]
- Umar, N.; Bora, B.; Banerjee, C.; Panwar, B. Comparison of different PV power simulation softwares: Case study on performance analysis of 1 MW grid-connected PV solar power plant. Int. J. Eng. Sci. Invent. 2018, 7, 11–24. [Google Scholar]
- González-Peña, D.; García-Ruiz, I.; Díez-Mediavilla, M.; Dieste-Velasco, M.I.; Alonso-Tristán, C. Photovoltaic prediction software: Evaluation with real data from northern Spain. Appl. Sci. 2021, 11, 5025. [Google Scholar] [CrossRef]
- Mermoud, A.; Villoz, A.; Wittmer, B.; Apaydin, H.; PVsyst, S. Economic Optimization of PV Systems with Storage. In Proceedings of the 37th European Photovoltaic Solar Energy Conference, Online, 7–11 September 2020. [Google Scholar]
- Irwan, Y.; Amelia, A.; Irwanto, M.; Leow, W.; Gomesh, N.; Safwati, I. Stand-alone photovoltaic (SAPV) system assessment using PVSYST software. Energy Procedia 2015, 79, 596–603. [Google Scholar] [CrossRef]
- Karki, P.; Adhikary, B.; Sherpa, K. Comparative study of grid-tied photovoltaic (PV) system in Kathmandu and Berlin using PVsyst. In Proceedings of the 2012 IEEE Third International Conference on Sustainable Energy Technologies (ICSET), Kathmandu, Nepal, 24–27 September 2012. [Google Scholar]
- Soualmia, A.; Chenni, R. Modeling and simulation of 15MW grid-connected photovoltaic system using PVsyst software. In Proceedings of the 2016 International Renewable and Sustainable Energy Conference (IRSEC), Marrakech, Morocco, 14–17 November 2016. [Google Scholar]
- Global Solar Atlas. Global Photovoltaic Power Potential by Country. Available online: https://globalsolaratlas.info/download/mali (accessed on 13 August 2023).
- Şenpinar, A.; Cebeci, M. Evaluation of power output for fixed and two-axis tracking PVarrays. Appl. Energy 2012, 92, 677–685. [Google Scholar] [CrossRef]
- Bahrami, A.; Okoye, C.O. The performance and ranking pattern of PV systems incorporated with solar trackers in the northern hemisphere. Renew. Sustain. Energy Rev. 2018, 97, 138–151. [Google Scholar] [CrossRef]
- Mermoud, A.; Roecker, C.; Bonvin, J. PVSYST 3.0: Implementation of an Expert System Module in PV Simulation Software. In Proceedings of the Sixteenth European Photovoltaic Solar Energy Conference, Glasgow, UK, 1–5 May 2000; Routledge: London, UK, 2000. [Google Scholar]
- Boroujeni, H.F.; Eghtedari, M.; Abdollahi, M.; Behzadipour, E. Calculation of generation system reliability index: Loss of Load Probability. Life Sci. J. 2012, 9, 4903–4908. [Google Scholar]
- Arnaoutakis, G.E.; Kocher-Oberlehner, G.; Katsaprakakis, D.A. Criteria-Based Model of Hybrid Photovoltaic–Wind Energy System with Micro-Compressed Air Energy Storage. Mathematics 2023, 11, 391. [Google Scholar] [CrossRef]
- Satya Prakash Oruganti, K.; Aravind Vaithilingam, C.; Rajendran, G. Design and sizing of mobile solar photovoltaic power plant to support rapid charging for electric vehicles. Energies 2019, 12, 3579. [Google Scholar] [CrossRef]
- Dabbousa, T.A.; Al-Reqeb, I.; Al-Mutayeb, Y.; Alattar, J.; Zainuri, M.A.A.M. Performance Comparison of Different Manufacturers Solar PV Modules Used in Gaza Strip. In Proceedings of the 2021 International Conference on Electric Power Engineering–Palestine (ICEPE-P), Gaza, Palestine, 23–24 March 2021. [Google Scholar]
- Singh, A.; Shaha, S.S.; Sekhar, Y.R.; Saboor, S.; Ghosh, A. Design and analysis of a solar-powered electric vehicle charging station for Indian cities. World Electr. Veh. J. 2021, 12, 132. [Google Scholar] [CrossRef]
- Belboul, Z.; Toual, B.; Kouzou, A.; Mokrani, L.; Bensalem, A.; Kennel, R.; Abdelrahem, M. Multiobjective optimization of a hybrid PV/Wind/Battery/Diesel generator system integrated in microgrid: A case study in Djelfa, Algeria. Energies 2022, 15, 3579. [Google Scholar] [CrossRef]
- Zerari, H.; Messikh, L.; Dendouga, A.; Kouzou, A.; Bekhouche, S.E.; Ouchtati, S.; Chergui, A. A two-stage sizing method of standalone solar lighting systems. In Proceedings of the 2019 4th International Conference on Power Electronics and Their Applications (ICPEA), Elazig, Turkey, 25–27 September 2019. [Google Scholar]
- Aksoy, M.H.; Çalik, M.K. Performance investigation of bifacial photovoltaic panels at different ground conditions. Konya Mühendislik Bilim. Derg. 2022, 10, 704–718. [Google Scholar] [CrossRef]
- Syahindra, K.D.; Ma’arif, S.; Widayat, A.A.; Fauzi, A.F.; Setiawan, E.A. Solar PV system performance ratio evaluation for electric vehicles charging stations in transit oriented development (TOD) areas. E3S Web Conf. 2021, 231, 02002. [Google Scholar] [CrossRef]
- Bernal-Agustín, J.L.; Dufo-Lopez, R. Simulation and optimization of stand-alone hybrid renewable energy systems. Renew. Sustain. Energy Rev. 2009, 13, 2111–2118. [Google Scholar] [CrossRef]
- Amer, M.; Namaane, A.; M’sirdi, N. Optimization of hybrid renewable energy systems (HRES) using PSO for cost reduction. Energy Procedia 2013, 42, 318–327. [Google Scholar] [CrossRef]
- Messenger, R.A.; Abtahi, A. Photovoltaic Systems Engineering; CRC Press: Boca Raton, FL, USA, 2017. [Google Scholar]
- Lai, C.S.; McCulloch, M.D. Levelized cost of electricity for solar photovoltaic and electrical energy storage. Appl. Energy 2017, 190, 191–203. [Google Scholar] [CrossRef]
- Minh Khuong, P.; McKenna, R.; Fichtner, W. A cost-effective and transferable methodology for rooftop PV potential assessment in developing countries. Energies 2020, 13, 2501. [Google Scholar] [CrossRef]
- Umar, N.H.; Bora, B.; Banerjee, C.; Gupta, P.; Anjum, N. Performance and economic viability of the PV system in different climatic zones of Nigeria. Sustain. Energy Technol. Assess. 2021, 43, 100987. [Google Scholar]
- Hassane, A.I.; Didane, D.H.; Tahir, A.M.; Hauglustaine, J.-M.; Manshoor, B.; Batcha, M.F.M.; Tamba, J.-G.; Mouangue, R.M. Techno-economic feasibility of a remote PV mini-grid electrification system for five localities in Chad. Int. J. Sustain. Eng. 2022, 15, 177–191. [Google Scholar] [CrossRef]
- Riakhi, F.-E.; Khaldoun, A. PV Sizing of a Stand Alone Solar Carport System Linked to Charging Stations and its Economic Analysis (A Case Study). In Proceedings of the 2021 9th International Renewable and Sustainable Energy Conference (IRSEC), Agadir, Morocco, 23–27 November 2021. [Google Scholar]
- Qi, L.; Jiang, M.; Lv, Y.; Zhang, Z.; Yan, J. Techno-economic assessment of photovoltaic power generation mounted on cooling towers. Energy Convers. Manag. 2021, 235, 113907. [Google Scholar] [CrossRef]
- Jordan, D.C.; Kurtz, S.R.; VanSant, K.; Newmiller, J. Compendium of photovoltaic degradation rates. Prog. Photovolt. Res. Appl. 2016, 24, 978–989. [Google Scholar] [CrossRef]
- Nikzad, A.; Chahartaghi, M.; Ahmadi, M.H. Technical, economic, and environmental modeling of solar water pump for irrigation of rice in Mazandaran province in Iran: A case study. J. Clean. Prod. 2019, 239, 118007. [Google Scholar] [CrossRef]
- Pirolli, M. Sustainable Energy Handbook European Union 2016. Available online: https://europa.eu/capacity4dev/public-energy/wiki/sustainable-energy-handbook (accessed on 5 June 2022).
- ESMAP. Technical and Economic Assessment of Off-Grid, Mini-Grid and Grid Electrification Technologies; World Bank: Washington, DC, USA, 2007. [Google Scholar]
- Krebs, L.; Frischknecht, R.; Stolz, P.; Sinha, P. Environmental life cycle assessment of residential pv and battery storage systems. In International Energy Agency PVPS Task; International Energy Agency: Paris, France, 2020; Volume 12, Available online: https://iea-pvps.org/key-topics/environmental-life-cycle-assessment-of-residential-pv-and-battery-storage-systems/ (accessed on 5 June 2022).
- PVsyst. Project Design–Carbon Balance Tool–Detailed System LCE. Available online: https://www.pvsyst.com/help/detailed_system_lce.htm (accessed on 7 February 2023).
- Mensah, L.D.; Yamoah, J.O.; Adaramola, M.S. Performance evaluation of a utility-scale grid-tied solar photovoltaic (PV) installation in Ghana. Energy Sustain. Dev. 2019, 48, 82–87. [Google Scholar] [CrossRef]
- Manoj Kumar, N.; Sudhakar, K.; Samykano, M. Techno-economic analysis of 1 MWp grid connected solar PV plant in Malaysia. Int. J. Ambient. Energy 2019, 40, 434–443. [Google Scholar] [CrossRef]


| Software/Tool | Advantages | Disadvantages |
|---|---|---|
| SAM | User-friendly; easy to understand | Limited weather analysis |
| PVsyst | Extensive meteorological and PV system component databases; has ability to identify the weaknesses of the system design through loss diagram; results include several dozens of simulation variables | Inability to handle shadow analysis |
| HOMER | Determines the possible combinations of a list of different technologies; has optimization algorithms used for feasibility and economic analysis | Inability to guess missing values or sizes; complex and time-consuming; detailed input data are needed |
| PV*SOL | Vast meteorological database; strong component database | Complexity in building and site modeling; advanced scientific calculation is not supported |
| RETScreen | Strong meteorological and product database; high strength in financial analysis | No option for time series data; does not support advanced calculations |
| Analytical/ numerical | User-defined | Extensive time and complexity in calculating large number of variables and summarizing results |
| Description | Quantity | Power (Watts) | Total Power (Watts) | Operation Duration (Hours/Day) | Energy (Wh) |
|---|---|---|---|---|---|
| Refrigerator-vaccines | 1 | 40 | 40 | 10 | 400 |
| Refrigerator-non-medical | 1 | 150 | 150 | 5 | 750 |
| Centrifuge | 2 | 242 | 484 | 4 | 1936 |
| Microscope | 2 | 20 | 40 | 6 | 240 |
| Blood chemical analyzer | 1 | 45 | 45 | 4 | 180 |
| Hematology analyzer | 1 | 230 | 230 | 4 | 920 |
| CD4 machine | 1 | 200 | 200 | 4 | 800 |
| Radio | 1 | 15 | 15 | 2 | 30 |
| Tubular LED lights | 4 | 18 | 72 | 8 | 576 |
| Desktop computer | 1 | 30 | 30 | 4 | 120 |
| Total | 1306 watts | 5952 Wh | |||
| Location | Bamako, Kayes, Kolokani, Sikasso, and Barouéli |
|---|---|
| Source of meteorological data | Metenorm within PVsyst |
| Daily energy demand | 5.95 kWh |
| Peak load | 1306 watts |
| System voltage | 12 Volts |
| Number of autonomy days | 1, 2 and 3 days |
| Value of PLOL | 1%, 2%, 3%, 4% and 5% |
| Component | Technology | Manufacturer | Model | Availability in PVsyst Databse |
|---|---|---|---|---|
| PV Module | Poly-silicon | Generic | Poly 150 Wp 36 cells | Available |
| Battery | Lithium ion LFP | Victron Energy | LFP-CB 12.8/200 | Available |
| Inverter | Hybrid solar inverter | Primax | Venus 2000 | Manually added |
| Description | Unit | Value |
|---|---|---|
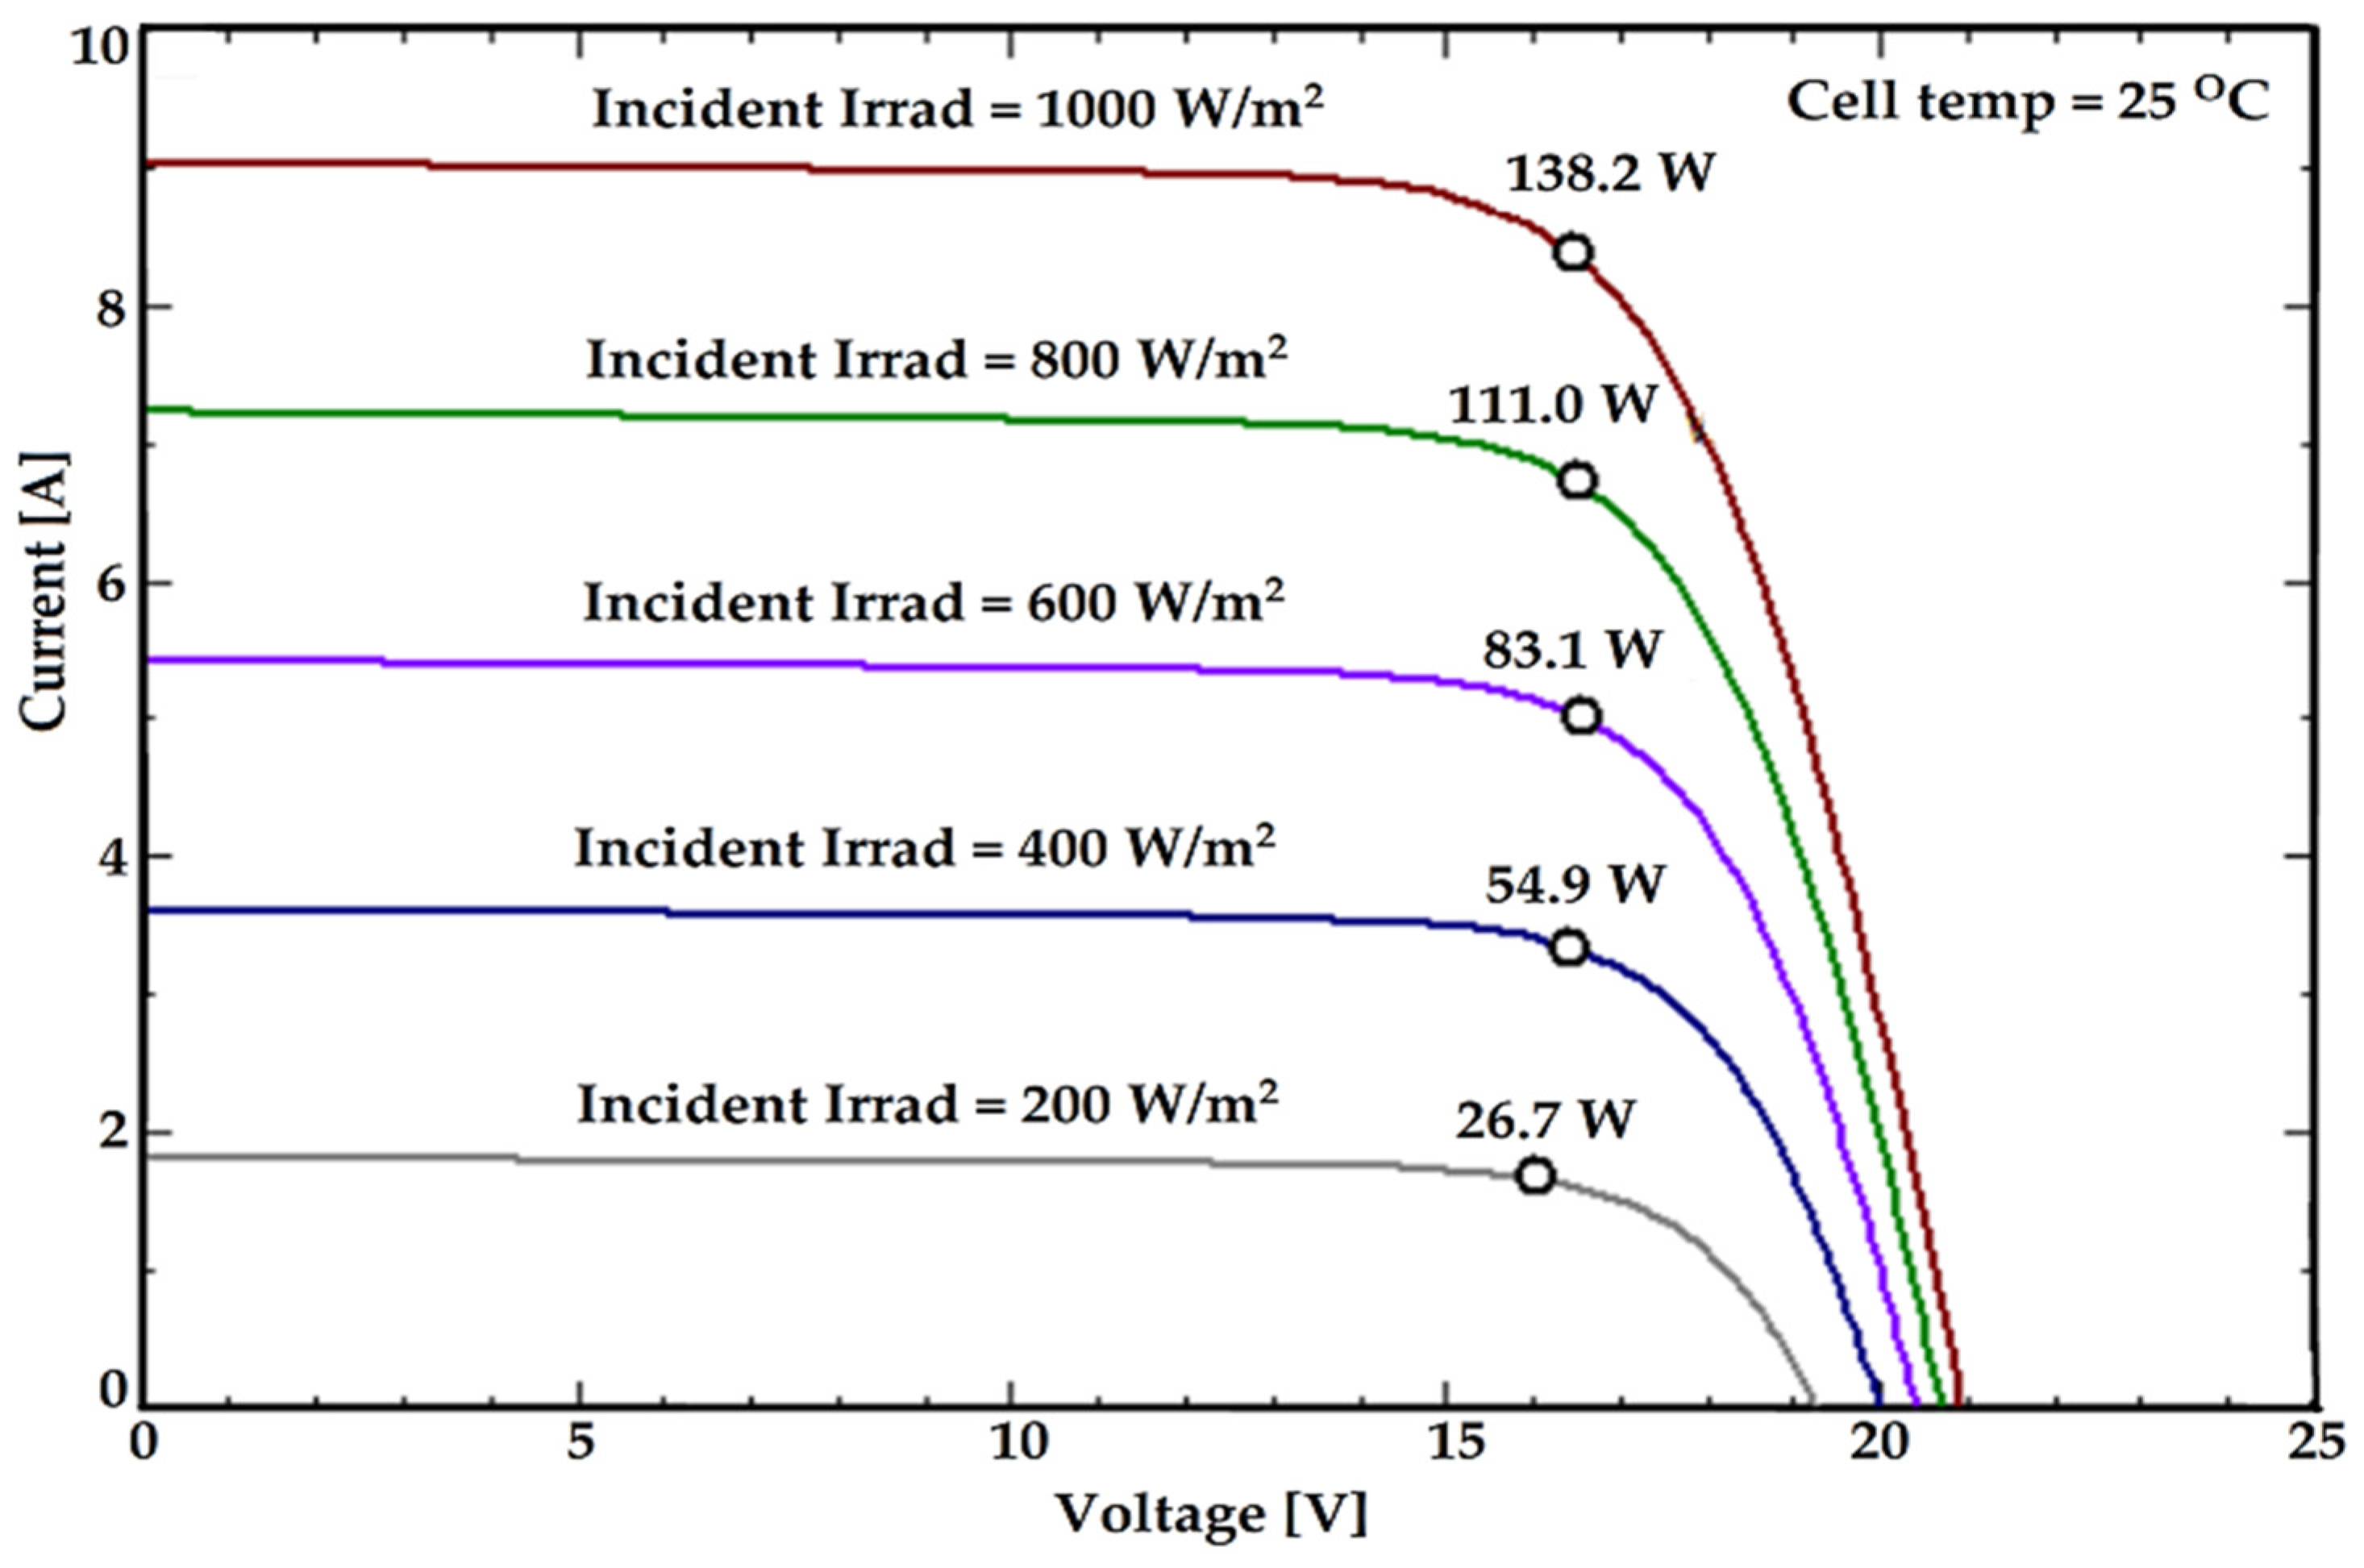
| Maximum power rating (Pmax) | Wp | 150 |
| Maximum power voltage (Vmp) | V | 17.80 |
| Maximum power current (Imp) | A | 8.43 |
| Open circuit voltage (Voc) | V | 22.40 |
| Short circuit current (Isc) | A | 8.93 |
| Module efficiency | % | 16.99 |
| Normal operating cell temperature (STC) | [°C] | 25 |
| Short circuit temperature coefficient Isc | [%/°C] | 0.6 |
| Open circuit voltage temperature coefficient Voc | [mV/°C] | −0.73 |
| Maximum power point temperature coefficient Pmp | [%/°C] | −0.40 |
| Autonomy Days | System Size | PLOL (%) | ||||
|---|---|---|---|---|---|---|
| 1 | 2 | 3 | 4 | 5 | ||
| 1 | PV array (watts) | 2400 | 1800 | 1650 | 1650 | 1650 |
| Battery (Ah) | 606 | 606 | 606 | 606 | 606 | |
| 2 | PV array (watts) | 1800 | 1650 | 1650 | 1500 | 1500 |
| Battery (Ah) | 1212 | 1212 | 1212 | 1212 | 1212 | |
| 3 | PV array (watts) | 1650 | 1650 | 1500 | 1500 | 1500 |
| Battery (Ah) | 1818 | 1818 | 1818 | 1818 | 1818 | |
| Location | PV Array Size (Watt) | |
|---|---|---|
| Min | Max | |
| Bamako | 1500 | 2400 |
| Kayes | 1500 | 2550 |
| Kolokani | 1500 | 2550 |
| Sikasso | 1500 | 2550 |
| Barouéli | 1500 | 2250 |
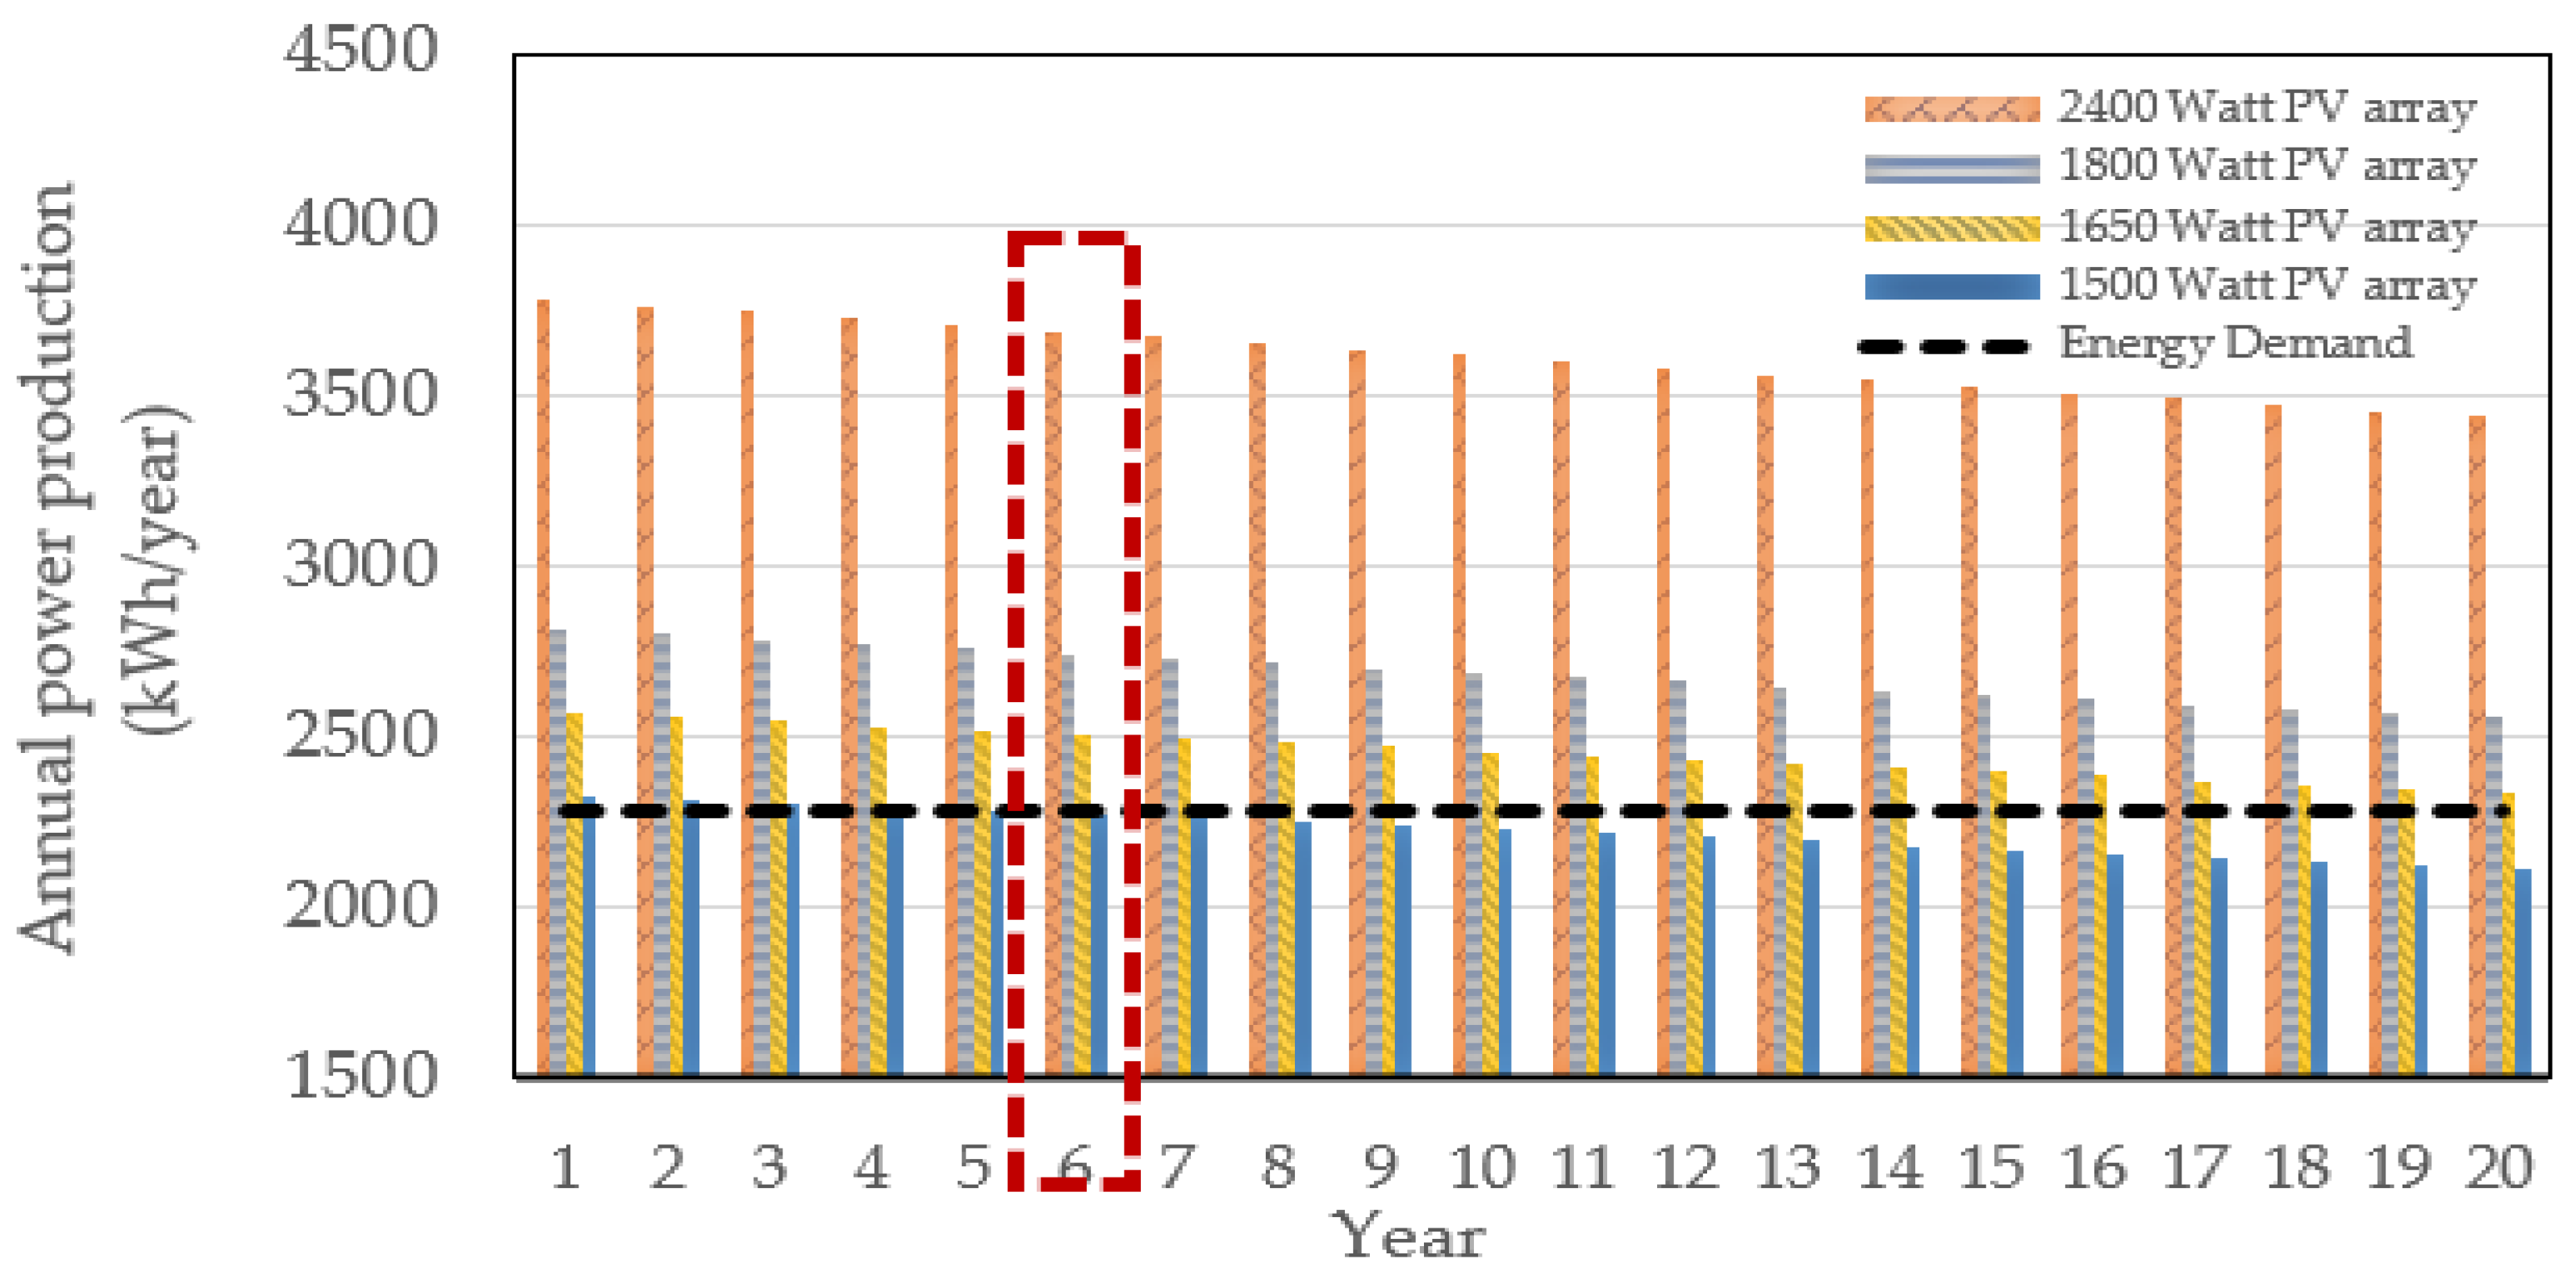
| Autonomy Days/PLOL | System Size | PV Energy Produced (kWh) | PV Energy Unused (kWh) | Energy Missing (kWh) | Energy Supplied (kWh) | Solar Fraction (%) | Performance Ratio (%) |
|---|---|---|---|---|---|---|---|
| 1D/1% | 2400 W 606 Ah | 3784.9 | 1447.7 | 1.0 | 2279.8 | 99.90 | 46.10 |
| 1D/2% | 1800 W 606 Ah | 2814.9 | 492.4 | 2.8 | 2278.0 | 99.90 | 61.40 |
| 1D/3–4–5% | 1650 W 606 Ah | 2572.7 | 268.8 | 17.2 | 2263.7 | 99.20 | 66.60 |
| 2D/1% | 1800 W 1212 Ah | 2814.9 | 478.1 | 0.0 | 2280.9 | 100 | 61.50 |
| 2D/2–3% | 1650 W 1212 Ah | 2571.8 | 248.1 | 0.0 | 2280.9 | 100 | 67.00 |
| 2D/4–5% | 1500 W 1212 Ah | 2331.6 | 66.3 | 52.1 | 2228.8 | 97.70 | 72.10 |
| 3D/1–2% | 1650 W 1818 Ah | 2571.2 | 241.3 | 0.0 | 2280.9 | 100 | 67.10 |
| 3D/3–4–5% | 1500 W 1818 Ah | 2331.3 | 58.1 | 43.2 | 2237.7 | 98.10 | 72.40 |
| Location | Autonomy Days | System Size | Solar Fraction (%) | Performance Ratio (%) |
|---|---|---|---|---|
| 1 | 1650 W 606 Ah | 98.60 | 67.28 | |
| Kayes | 2 | 1500 W 1212 Ah | 96.60 | 72.50 |
| 3 | 1500 W 1818 Ah | 100 | 53.63 | |
| 1 | 1500 W 606 Ah | 98.26 | 70.68 | |
| Kolokani | 2 | 1500 W 1212 Ah | 99.12 | 71.30 |
| 3 | 1500 W 1818 Ah | 99.51 | 71.58 | |
| 1 | 1500 W 606 Ah | 98.69 | 71.09 | |
| Sikasso | 2 | 1500 W 1212 Ah | 99.55 | 71.71 |
| 3 | 1500 W 1818 Ah | 99.70 | 71.82 | |
| 1 | 1500 W 606 Ah | 98.55 | 71.12 | |
| Barouéli | 2 | 1500 W 1212 Ah | 99.64 | 71.90 |
| 3 | 1500 W 1818 Ah | 100 | 72.16 |
| Equipment | Cost | |
|---|---|---|
| PV System | PV modules + BOS | 2 USD/W |
| Battery | 0.18 USD/Wh | |
| Inverter | 0.32 USD/W | |
| Diesel | Diesel generator | 1 USD/W |
| Description | Value | |
|---|---|---|
| Diesel | Fuel consumption (liters/kWh) | 0.4 |
| Fuel Price (USD/liter) | 1.2 | |
| Diesel OM (USD/kWh) | 0.2 | |
| Fuel price increase per year (%) | 5 | |
| CO2 from diesel generator (kg/liters) | 2.6 | |
| PV System | PV OM (USD/kW) | 28.94 |
| CO2 from PV systems (kg/kWh) | 0.085 |
| Equipment | Operational Lifespan (Years) |
|---|---|
| PV modules | 25 |
| Battery | 5 |
| Inverter | 10 |
| Diesel generator | 20 |
| Autonomy Days/PLOL | System Size | Expenses—PV ($) | Expenses—DG ($) | LCOE-PV ($/kWh) | LCOE-DG ($/kWh) |
|---|---|---|---|---|---|
| 1D/1% | 2400 W 606 Ah | 12,512 | 44,841 | 0.27 | 0.98 |
| 1D/2% | 1800 W 606 Ah | 10,965 | 44,841 | 0.24 | 0.98 |
| 1D/3–4–5% | 1650 W 606 Ah | 10,578 | 44,841 | 0.23 | 0.98 |
| 2D/1% | 1800 W 1212 Ah | 16,201 | 44,841 | 0.36 | 0.98 |
| 2D/2–3% | 1650 W 1212 Ah | 15,814 | 44,841 | 0.35 | 0.98 |
| 3D/1–2% | 1650 W 1818 Ah | 21,050 | 44,841 | 0.46 | 0.98 |
| Autonomy Days/PLOL | System Size | Expenses—PV (USD) | Expenses—DG (USD) | LCOE-PV (USD/kWh) | LCOE-DG (USD/kWh) |
|---|---|---|---|---|---|
| 1D/1% | 2400 W 606 Ah | 9864 | 24,676 | 0.38 | 0.94 |
| 1D/2% | 1800 W 606 Ah | 8465 | 24,676 | 0.32 | 0.94 |
| 1D/3–4–5% | 1650 W 606 Ah | 8115 | 24,676 | 0.31 | 0.94 |
| 2D/1% | 1800 W 1212 Ah | 11,901 | 24,676 | 0.45 | 0.94 |
| 2D/2–3% | 1650 W 1212 Ah | 11,551 | 24,676 | 0.44 | 0.94 |
| 3D/1–2% | 1650 W 1818 Ah | 14,988 | 24,676 | 0.57 | 0.94 |
| Autonomy Days/PLOL | System Size | Revenue (USD) | Profit (USD) | ROI (%) | Payback Period (Years) |
|---|---|---|---|---|---|
| 1D/1% | 2400 W 606 Ah | 44,841 | 32,328 | 258.36 | 5.58 |
| 1D/2% | 1800 W 606 Ah | 44,841 | 33,876 | 308.92 | 4.89 |
| 1D/3–4–5% | 1650 W 606 Ah | 44,841 | 34,262 | 323.88 | 4.72 |
| 2D/1% | 1800 W 1212 Ah | 44,841 | 28,640 | 176.77 | 7.23 |
| 2D/2–3% | 1650 W 1212 Ah | 44,841 | 29,027 | 183.54 | 7.05 |
| 3D/1–2% | 1650 W 1818 Ah | 44,841 | 32,328 | 113.02 | 9.39 |
| Autonomy Days/PLOL | System Size | Revenue (USD) | Profit (USD) | ROI (%) | Payback Period (Years) |
|---|---|---|---|---|---|
| 1D/1% | 2400 W 606 Ah | 24,676 | 14,812 | 150.17 | 7.99 |
| 1D/2% | 1800 W 606 Ah | 24,676 | 16,211 | 191.52 | 6.86 |
| 1D/3–4–5% | 1650 W 606 Ah | 24,676 | 16,561 | 204.08 | 6.58 |
| 2D/1% | 1800 W 1212 Ah | 24,676 | 12,775 | 107.34 | 9.65 |
| 2D/2–3% | 1650 W 1212 Ah | 24,676 | 13,124 | 113.62 | 9.36 |
| 3D/1–2% | 1650 W 1818 Ah | 24,676 | 9688 | 64.64 | 12.15 |
| Location | Autonomy Days | System Size | LCOE-PV (USD/kWh) | LCOE-DG (USD/kWh) | Payback Periods |
|---|---|---|---|---|---|
| 1 | 1650 W 606 Ah | 0.23 | 0.98 | 4.72 | |
| Kayes | 2 | 1500 W 1212 Ah | 0.34 | 0.98 | 6.88 |
| 3 | 1500 W 1818 Ah | 0.45 | 0.98 | 9.22 | |
| 1 | 1500 W 606 Ah | 0.22 | 0.98 | 4.55 | |
| Kolokani | 2 | 1500 W 1212 Ah | 0.34 | 0.98 | 6.88 |
| 3 | 1500 W 1818 Ah | 0.45 | 0.98 | 9.22 | |
| 1 | 1500 W 606 Ah | 0.22 | 0.98 | 4.55 | |
| Sikasso | 2 | 1500 W 1212 Ah | 0.34 | 0.98 | 6.88 |
| 3 | 1500 W 1818 Ah | 0.45 | 0.98 | 9.22 | |
| 1 | 1500 W 606 Ah | 0.22 | 0.98 | 4.55 | |
| Barouéli | 2 | 1500 W 1212 Ah | 0.34 | 0.98 | 6.88 |
| 3 | 1500 W 1818 Ah | 0.45 | 0.98 | 9.22 |
| Lifetime CO2 Emission (tCO2eq) | |||
|---|---|---|---|
| PV System | 2400 watts | 1800 watts | 1650 watts |
| 6.77 | 5.03 | 4.60 | |
| Diesel generator | 82.78 | 61.57 | 56.28 |
Disclaimer/Publisher’s Note: The statements, opinions and data contained in all publications are solely those of the individual author(s) and contributor(s) and not of MDPI and/or the editor(s). MDPI and/or the editor(s) disclaim responsibility for any injury to people or property resulting from any ideas, methods, instructions or products referred to in the content. |
© 2023 by the authors. Licensee MDPI, Basel, Switzerland. This article is an open access article distributed under the terms and conditions of the Creative Commons Attribution (CC BY) license (https://creativecommons.org/licenses/by/4.0/).
Share and Cite
Ali, A.; Volatier, M.; Darnon, M. Optimal Sizing and Assessment of Standalone Photovoltaic Systems for Community Health Centers in Mali. Solar 2023, 3, 522-543. https://doi.org/10.3390/solar3030029
Ali A, Volatier M, Darnon M. Optimal Sizing and Assessment of Standalone Photovoltaic Systems for Community Health Centers in Mali. Solar. 2023; 3(3):522-543. https://doi.org/10.3390/solar3030029
Chicago/Turabian StyleAli, Abid, Maïté Volatier, and Maxime Darnon. 2023. "Optimal Sizing and Assessment of Standalone Photovoltaic Systems for Community Health Centers in Mali" Solar 3, no. 3: 522-543. https://doi.org/10.3390/solar3030029