Article

Factors Associated with Unplanned Hospital Readmission after Discharge: A Descriptive and Predictive Study Using Electronic Health Record Data

by
Safaa Dafrallah
* and
Moulay A. Akhloufi
*
Perception, Robotics and Intelligent Machines (PRIME), Department of Computer Science, Université de Moncton, Moncton, NB E1A 3E9, Canada
*
Authors to whom correspondence should be addressed.
BioMedInformatics 2024, 4(1), 219-235; https://doi.org/10.3390/biomedinformatics4010014
Submission received: 31 August 2023 / Revised: 21 September 2023 / Accepted: 3 January 2024 / Published: 12 January 2024
(This article belongs to the Special Issue Feature Papers in Computational Biology and Medicine)

Abstract

:
Hospital readmission involves the unplanned emergency admission of patients within 30 days from discharge after the previous admission. According to the Canadian Health Institute (CIHI), 1 in 11 patients were readmitted within 30 days of leaving the hospital in 2021. In the USA, nearly 20% of Medicare patients were readmitted after discharge, where the average cost of readmission was approximately USD 15,000, as reported by the Agency for Healthcare Research and Quality (AHQR) in 2018. To tackle this issue, we first conducted a descriptive analysis study to understand the risk factors associated with hospital readmission, and then we applied machine learning approaches to predict hospital readmission by using patients’ demographic and clinical data extracted from the Electronic Health Record of the MIMIC-III clinical database. The results showed that the number of previous admissions during the last 12 months, hyperosmolar imbalance and comorbidity index were the top three significant factors for hospital readmission. The predictive model achieved a performance of 95.6% AP and an AUC = 97.3% using the Gradient Boosting algorithm trained on all features.

1. Introduction

Unplanned hospital readmission became a serious issue for healthcare systems due to the high rates of unplanned emergency readmission, and it is additionally represented as a quality indicator for the healthcare system. According to the Agency for Healthcare Research and Quality, the USA counted that nearly 20% of Medicare patients experienced unplanned readmission in 2018, where an inpatient stay costs approximately USD 15,000 [1]. Besides the financial issue, researchers claimed a high r rate among readmitted patients compared to nonreadmitted ones [2,3]. The use of a decision-support tool may assist caregivers in identifying high-risk patients. To this aim, we intend to predict potential readmitted patients and identify the risk factors associated with readmission by using MIMIC-III clinical data.
In order to understand the real factors behind hospital unplanned readmission, several research studies have conducted a descriptive analysis by using Electronic Health Records (EHRs) provided by hospitals.
Glans et al. [4] conducted a comparative study about hospital-readmission risk factors for 720 older adults more than 65 years old. The authors used multiple logistic regression analysis to assert that readmission risk increased significantly for patients living in communities with home care, suffering from multiple comorbidities and using 10 or more medications on a daily basis. They also showed that readmitted patients had a high comorbidity score, frequent hospital admissions in the last 12 months and an initial length of stay of 5 days or longer. Another main factor identified in this paper is that patients discharged on Fridays and from surgical units are more likely to be readmitted within 30 days; this was explained by the authors by the need for hospitals to decrease their bed count and personnel over the weekend, which could result in forced discharges on Fridays.
Li et al. [5] proposed a hospital-readmission prediction model for Chronic Obstructive Pulmonary Disease (COPD) patients by using a Decision-Tree-based approach with a precision of 73.85%. The authors used EHR data from 782 records, taken from Kiang Wu Hospital in China where 26.5% of the hospitalizations were readmitted. The study found that the patient’s age, smoke status and number of hospital admissions in the last 12 months were the top risk factors for COPD patients.
Zhu et al. [6] conducted a study on comorbidities in lung cancer and their association with hospital readmission. The study conducted by using the Beijing University Cancer Hospital database showed that 32.2% of lung cancer patients had at least one comorbidity with a proportion of 21.7%, 8.3% and 2.2% for one, two and three or more comorbidities, respectively. According to the authors, the most frequent comorbidities among Chinese lung cancer patients were malignancy, hypertension, pulmonary disease, diabetes mellitus, cardiovascular disease and liver disease. They affirmed that lung cancer patients with a comorbidity had a higher risk of 31-days readmission compared to other patients without any comorbidity. Their study also showed that the risk of unplanned hospital readmission increased with the increase in comorbidities.
Bowles et al. [7] described, in their paper, the early readmission risk factors for sepsis survivors. According to the authors, a large proportion of sepsis readmission occurred during the first 7 days after discharge, which represented approximately 32% of readmissions. They used a dataset of 165,228 sepsis survivors with an average age of 75.1 years; 80.7% of the survivors were diagnosed with severe sepsis, 5.7% with a septic shock and the remaining 13.6% had sepsis without acute organ dysfunction. Based on the paper, 10.2% of sepsis survivors were primarily diagnosed with pneumonia, 8.4% with Congestive Heart Failure and 6.2% with obstructive chronic bronchitis. The authors identified several risk factors for 7-days readmission including fluid and electrolyte disorder, dyspnea at rest, ADL/IADL dependencies, a length of stay (LOS) of more than 8 days during the first admission and a diagnosis of septic shock.
Deschepper et al. [8] proposed a predictive model for unplanned readmission by using Random Forests. Their study included 29,702 patients (821 readmitted) extracted from Ghent University Hospital discharge data in Belgium. The predicted variables provided by the authors contained administrative predictors such as the gender and the age of the patients, the length of stay and the number of previous admissions within the last year. Along with the administrative variables, the authors used pathology records as predictors, including the major diagnostic, the diagnosis category and the procedure. The authors identified the major predictors by using Logistic Regression to select the best features for readmission prediction. The best model achieved a performance of 77% by using the Area Under the Curve (AUC) measure, where the highest important features for administrative variables were the age of the patient, the type of the previous admission and the number of previous admissions, along with a connective tissue disorder, alcohol- and drug-related pathology, urinary disorder and pressure ulcer for pathology variables. According to the authors, the administrative data had the largest impact on the prediction, assuming that a detailed level of diagnosis information is not needed for a readmission predicted model.
Lo et al. [9] predicted 14-days unplanned readmission by using medical records belonging to the academic medical center in Tainan, Taiwan. The database contained 24,722 patients with an unplanned readmission rate of 1.22%. The authors chose to include in the prediction model several variable categories like the patient’s demographic characteristics, major diagnoses in the past year, comorbidity score by using the Charlson Comorbidity Index (CCI), presence and absence of depression and discharge information. The prediction performance achieved a precision of 94.7% and a sensitivity of 56% by using the CatBoost model. The interpretation of the model by using the SHapley Additive exPlanations (SHAP) framework showed that patients with a higher number of diagnoses within a year from admission were more likely to be readmitted.
Mohanty et al. [10] proposed an explainable AI for predicting readmission risk by using machine learning models. The paper takes into consideration various features to estimate the readmission risk, including demographics, comorbidities and frailty parameters. The study focused more on patients with diseases such as heart failure and chronic obstructive pulmonary disease (COPD), and the authors used, in addition to demographics and comorbidities, high-risk medications and blood biomarker laboratory tests extracted from the Electronic Health Records (EHRs). The study was conducted on 128,581 observations from 68,152 patients. The prediction performance achieved an AUROC of 72% by using the CatBoost model, and the explainability of the model showed that the discharge disposition, the number of diagnoses and prior readmissions are the top important features for readmission prediction.
Gruneir et al. [11] proposed a validated predictive algorithm in order to describe hospitalization characteristics among patients identified as being at high risk for readmission by using the LACE index. The features used to compute the LACE index were the length of stay in days, the number of emergency department visits during the last 6 months and whether the patient was designated as requiring an “alternative level of care” (ALC). The study was conducted on 26,045 patients whereby the most commonly reported diagnosis included heart failure, pneumonia and gastrointestinal disorders. The descriptive study showed that 19% of high-risk patients were readmitted within 30 days of discharge and 32% were readmitted within 90 days of discharge.
The aim of this study is to define the risk factors behind unplanned readmission by using a descriptive analysis of EHR data and to develop a predictive model that can be used as a decision-support tool for caregivers and identify high-risk patients.

2. Methods

2.1. Dataset

MIMIC-III [12] is a large free clinical database that contains Electronic Health Record (EHR) data of Intensive Care Unit (ICU) patients admitted to Beth Israel Hospital in Boston, USA. The database contains 26 tables linked to each other by using a shared ID referring to a unique patient. These data are associated with 58,976 distinct admissions and 46,520 adult patients admitted between 2001 and 2012. Among the existing tables, we are interested in ‘ADMISSIONS’, ‘DIAGNOSES_ICD’, ‘D_ICD_DIAGNOSES’ and ‘PATIENTS’. The first table contains all the admissions, and each admission record has a unique identifier in addition to the patient’s unique identifier; the time of admission and discharge; the admission type, i.e., if it is elective or emergency; the primary diagnosis at the time of admission; and the death time, if it exists. It also contains demographic information about the patient, including ethnicity. Each patient has a unique subject ID and is linked to at least one admission; the ‘PATIENTS’ table is significant for extracting the patient’s information, like their gender and age. The ‘DIAGNOSES_ICD’ table contains the International Code Description (ICD-9 codes), which is the official system of assigning codes to diagnoses; the codes are related to the PATIENTS and ADMISSIONS tables, and a unique admission can have multiple ICD-9 codes in the case of multiple diagnoses. Each ICD-9 code is assigned to short and long diagnosis titles that are detailed in the ‘D_ICD_DIAGNOSES’ table. The MIMIC database also contains a text-based table named ‘NOTEEVENTS’ that contains discharge notes for each admission, in addition to laboratory measurements for each admission in the ‘LABEVENTS’ table.
In this work, we are interested in the tables that contain the patient’s admissions, diagnoses and demographic information, which are ‘ADMISSIONS’, ‘PATIENTS’, ‘DIAGNOSES_ICD’ and ‘D_ICD_DIAGNOSES’.

2.2. Data Preprocessing

The ‘ADMISSIONS’ table contains a total of 58,976 distinct admissions belonging to 46,520 patients. Among the admissions, 42,071 (71.33%) are described as an emergency, as shown in Figure 1, which illustrates the rate of admission types from the ‘ADMISSIONS’ table.
In this study, we are interested in unplanned 30-days readmission only, so we removed data related to newborn and death admissions along with elective readmissions. The remaining data contained 45,321 admissions. As we are interested in 30-days readmission, we selected only readmissions within 30 days of discharge.
The initial data analysis indicated that ‘Pneumonia’, ‘Congestive Heart Failure (CHF)’ and ‘Sepsis’ are the frequent primary diagnoses of readmitted patients with a rate of 4.47%, 3.53% and 2.74%, respectively, as shown in Figure 2, while patients with a CHF diagnosis have the highest readmission rate with 13.4% followed by ‘Abdominal Pain’ and ‘Hypotension’ with 11.6% and 11.5%, respectively. Figure 3 illustrates the pie chart of the top 10 diagnoses with the highest patient-readmission rates.
After removing newborn and death admissions, the remaining records contained 34,560 patients with a total of 45,321 hospital admissions. We linked afterward each admission with the diagnostics codes (ICD-9) reported in the ‘DIAGNOSES_ICD’ table by using the admission unique ID (HADM_ID); each patient may have multiple admissions, and each admission may contain several diagnostics. A total of 6579 unique ICD-9 codes were reported for the remaining admissions. We chose from the 6579 codes the most frequent ones, and then we replaced each ICD-9 code with its corresponding disease category. Figure 4 presents a bar plot of the short title of the top 10 most frequent ICD-9 codes among admissions. The titles of the ICD-9 codes are extracted from the ‘D_ICD_DIAGNOSES’ table.

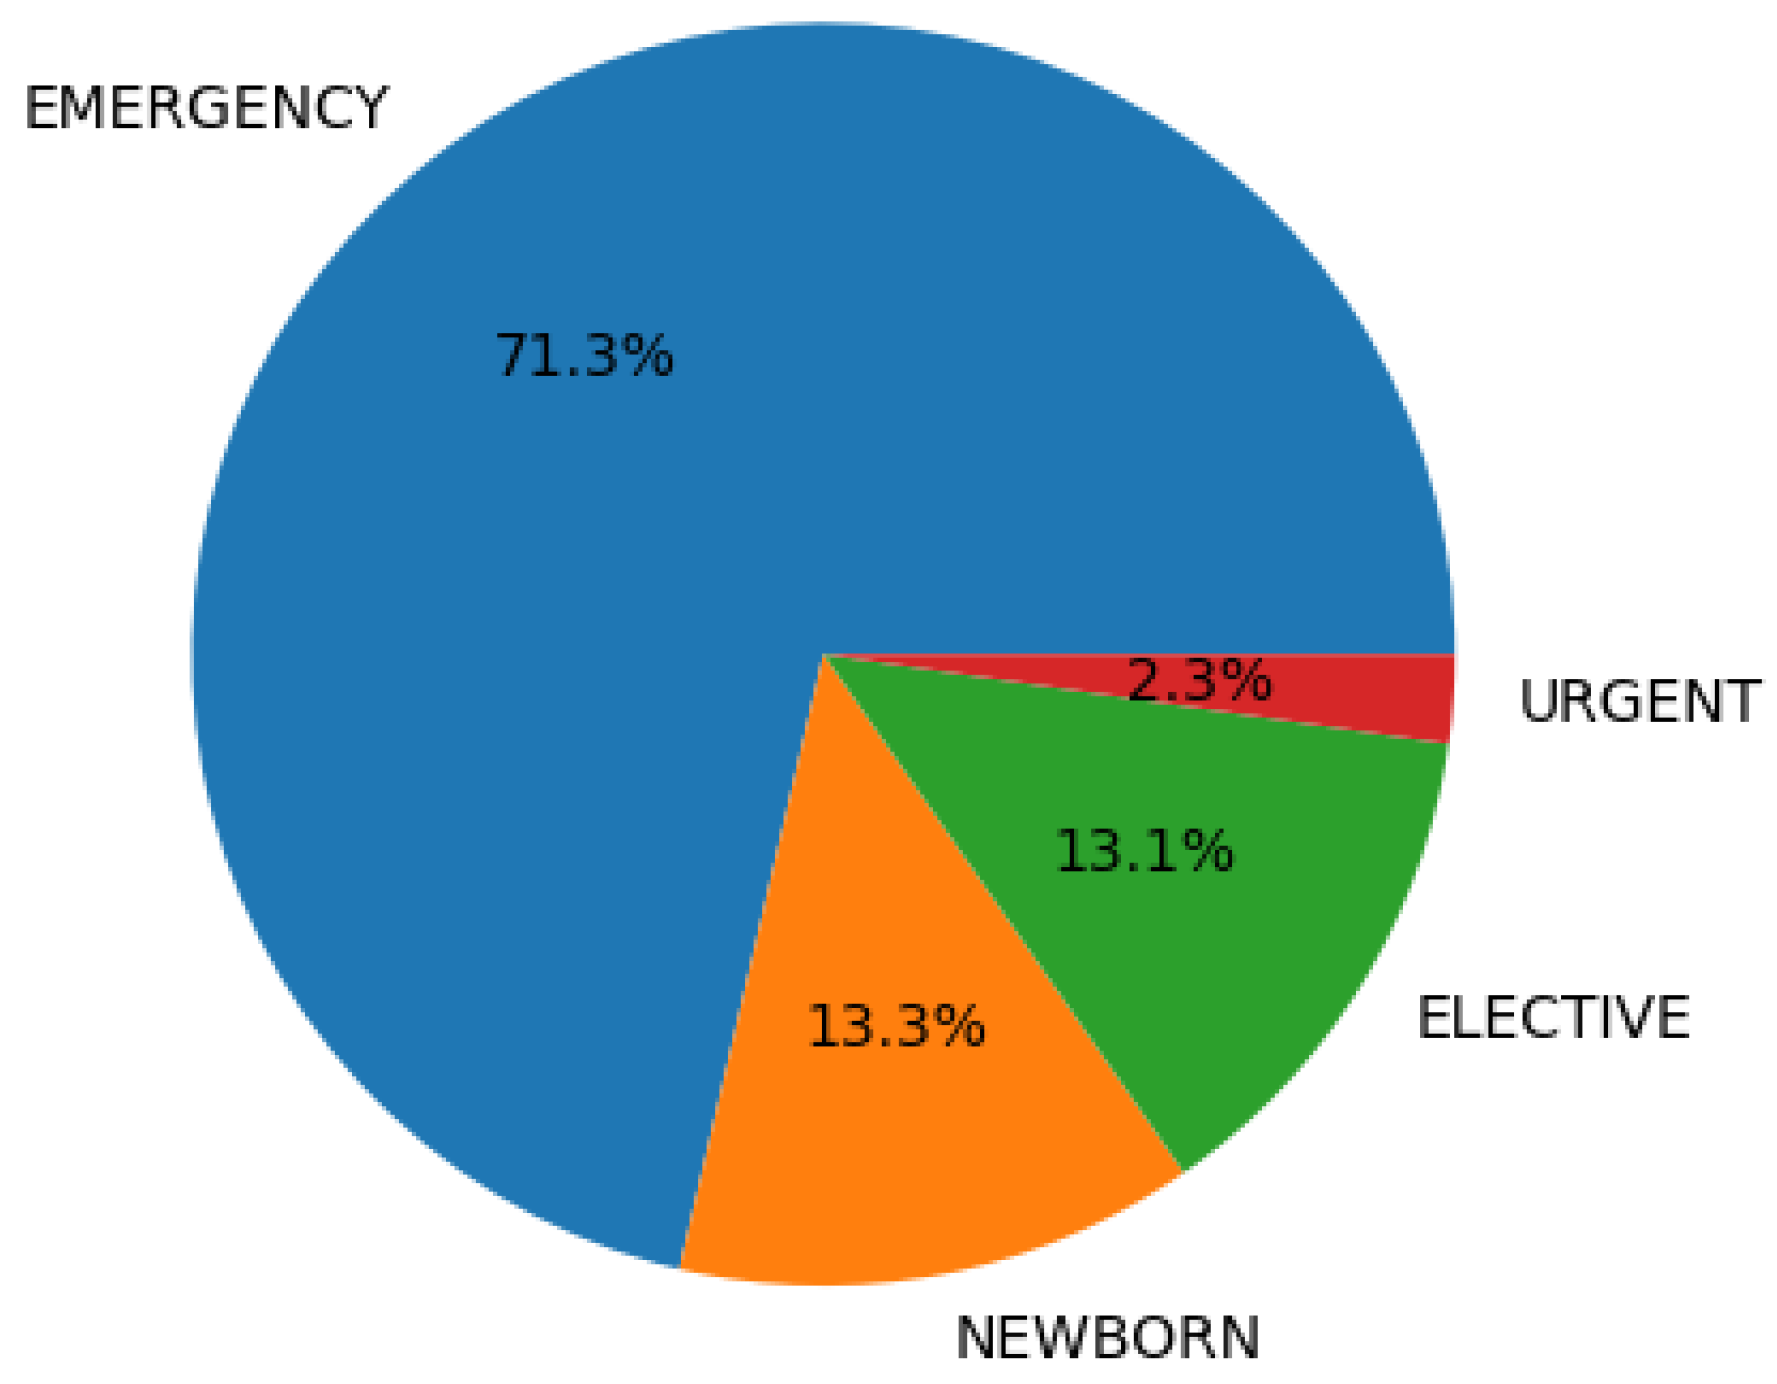
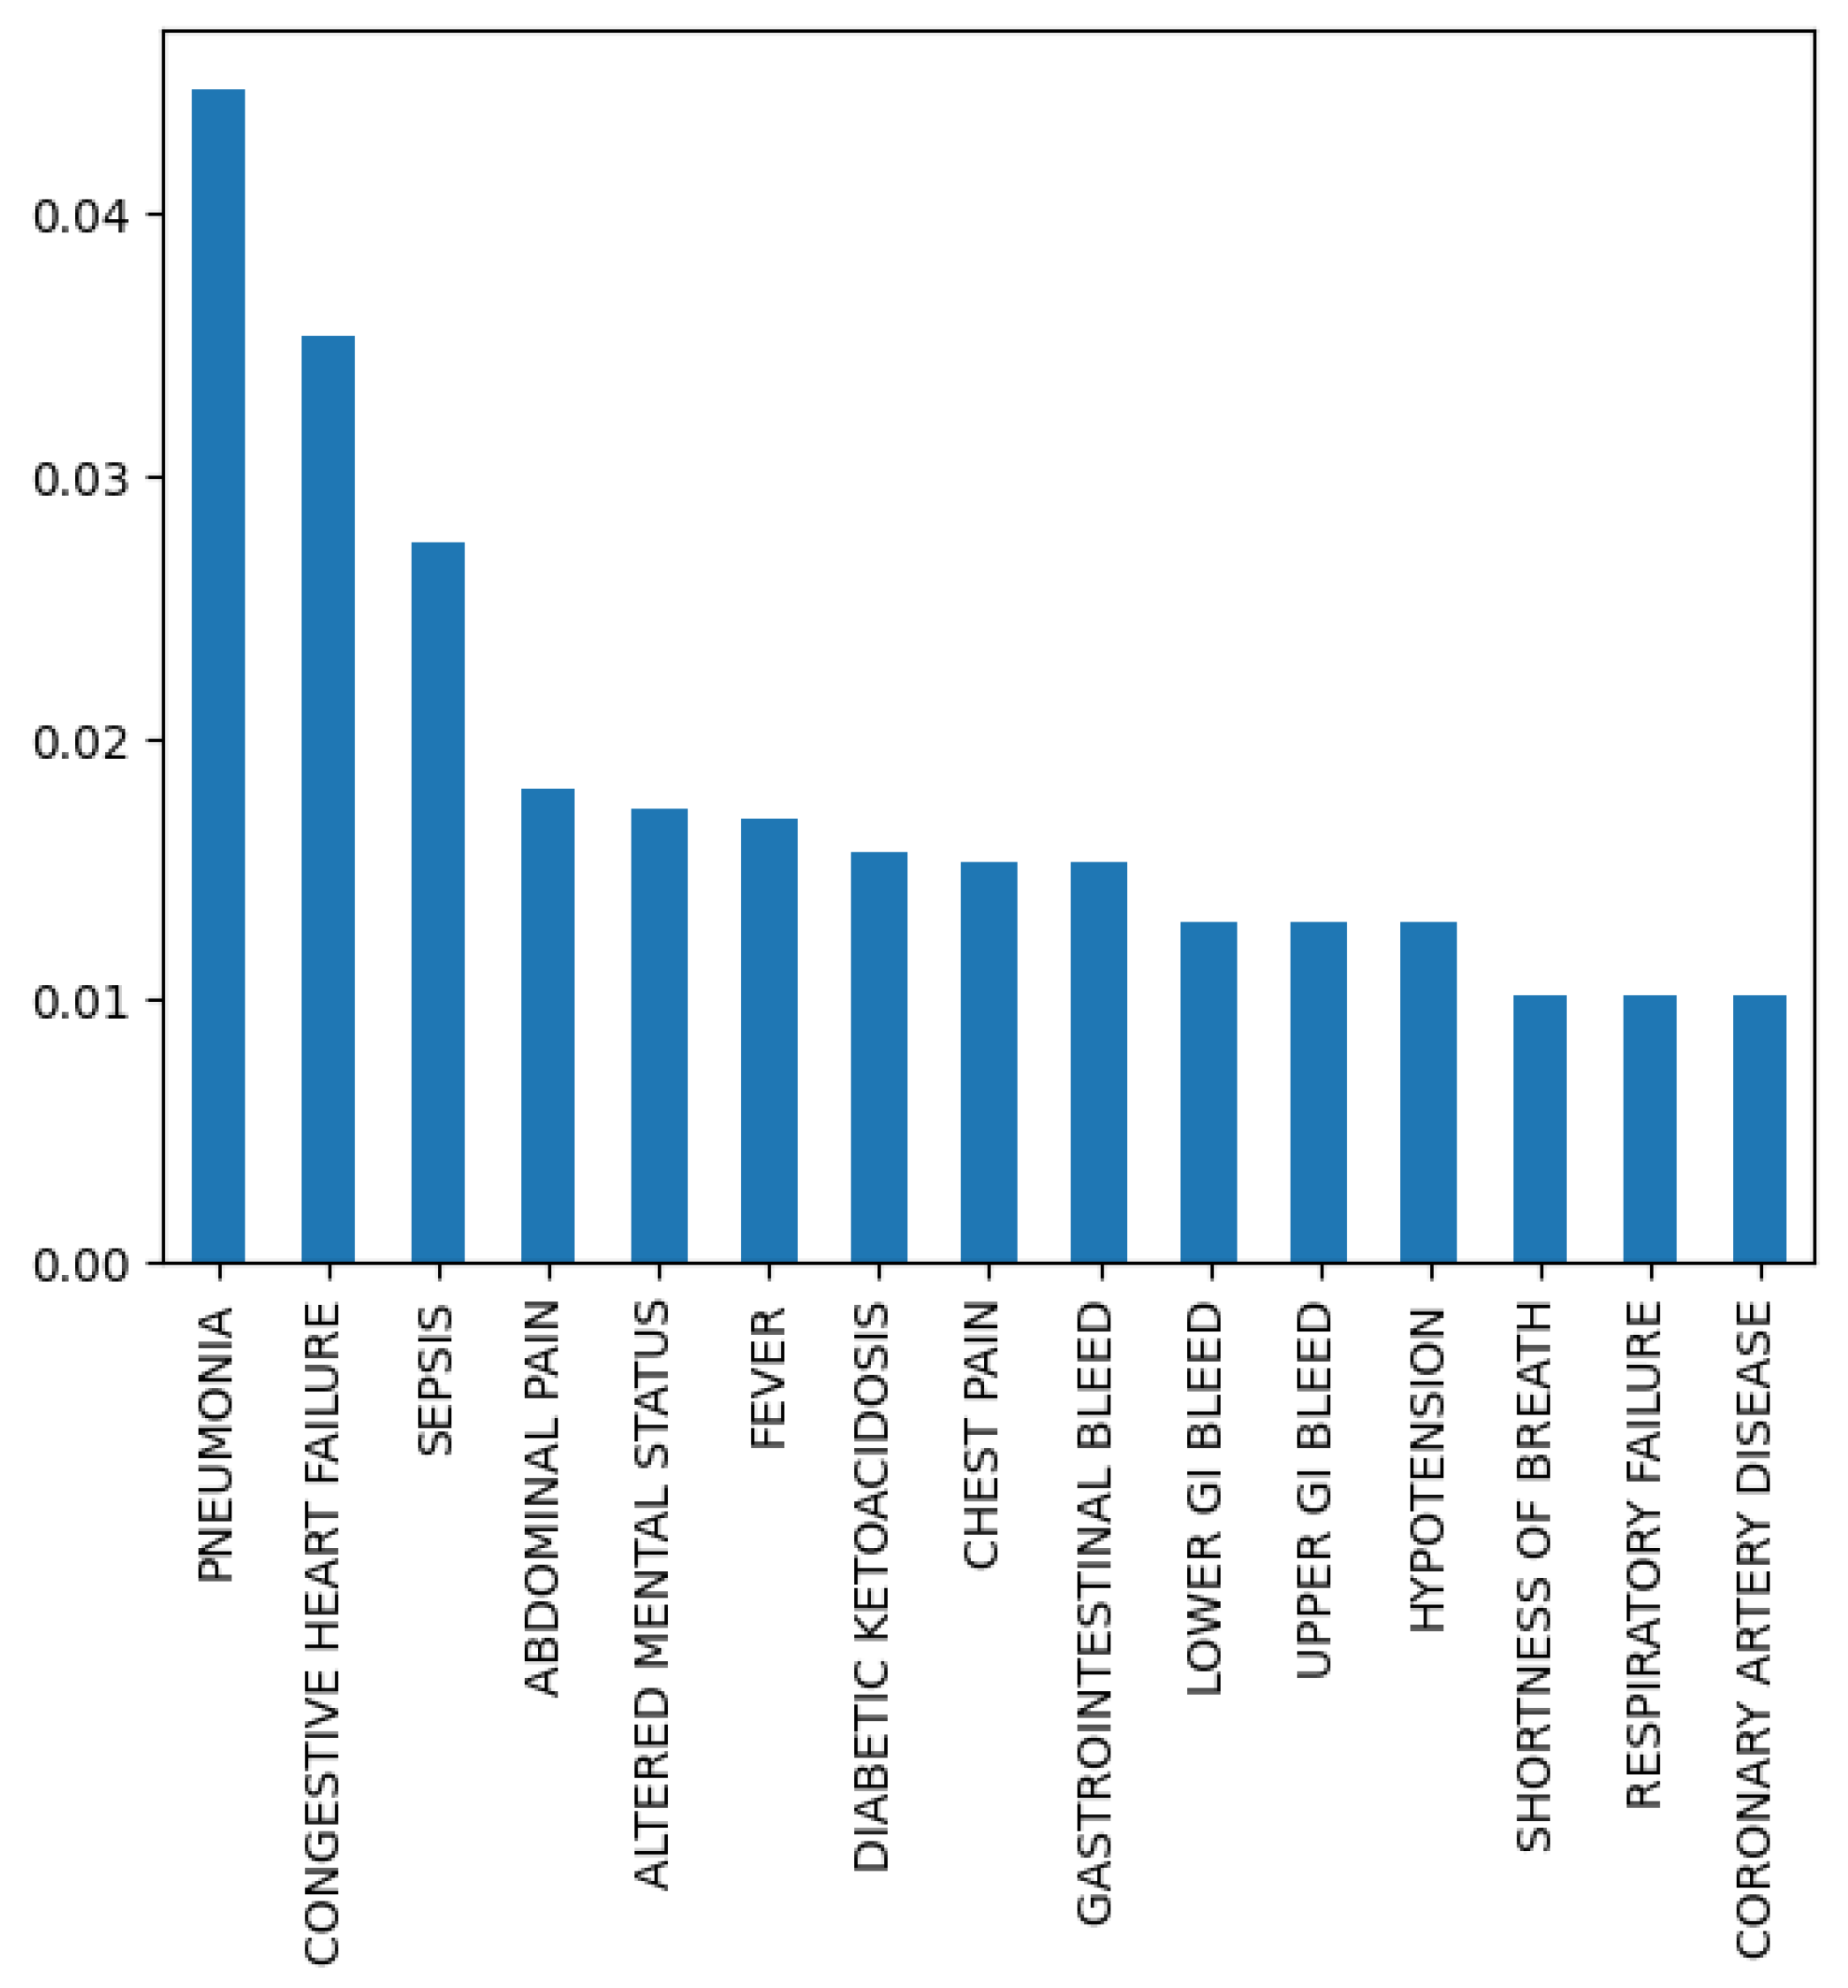
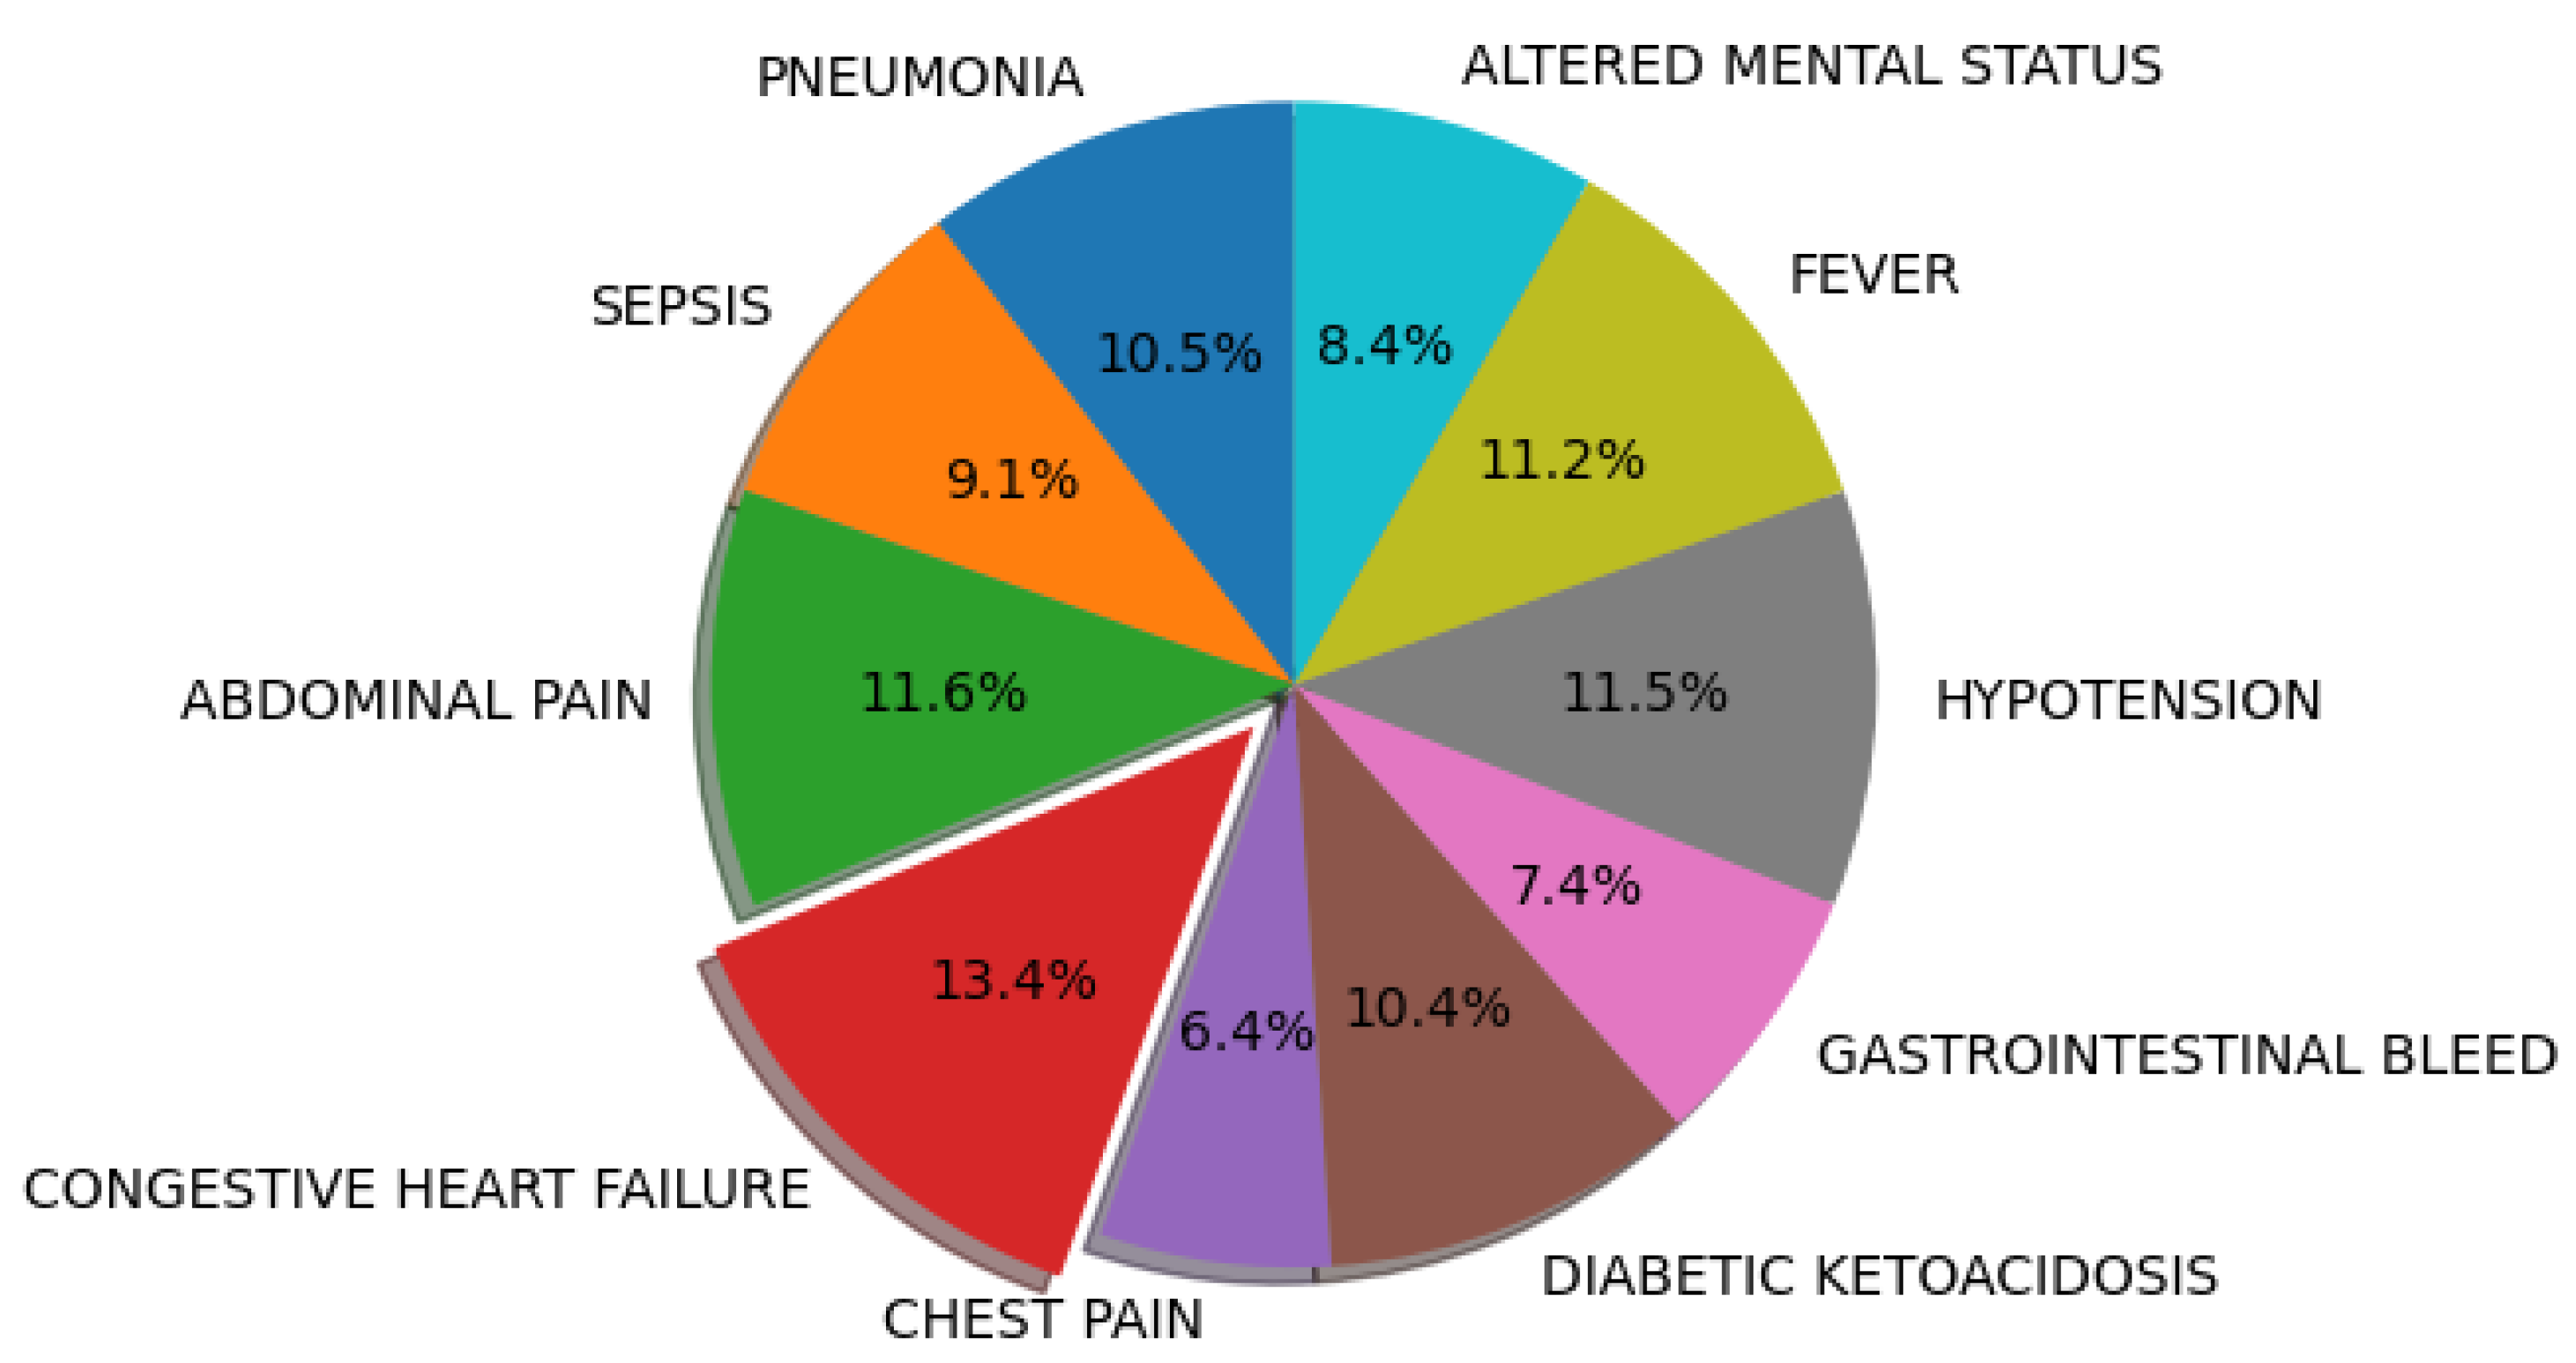
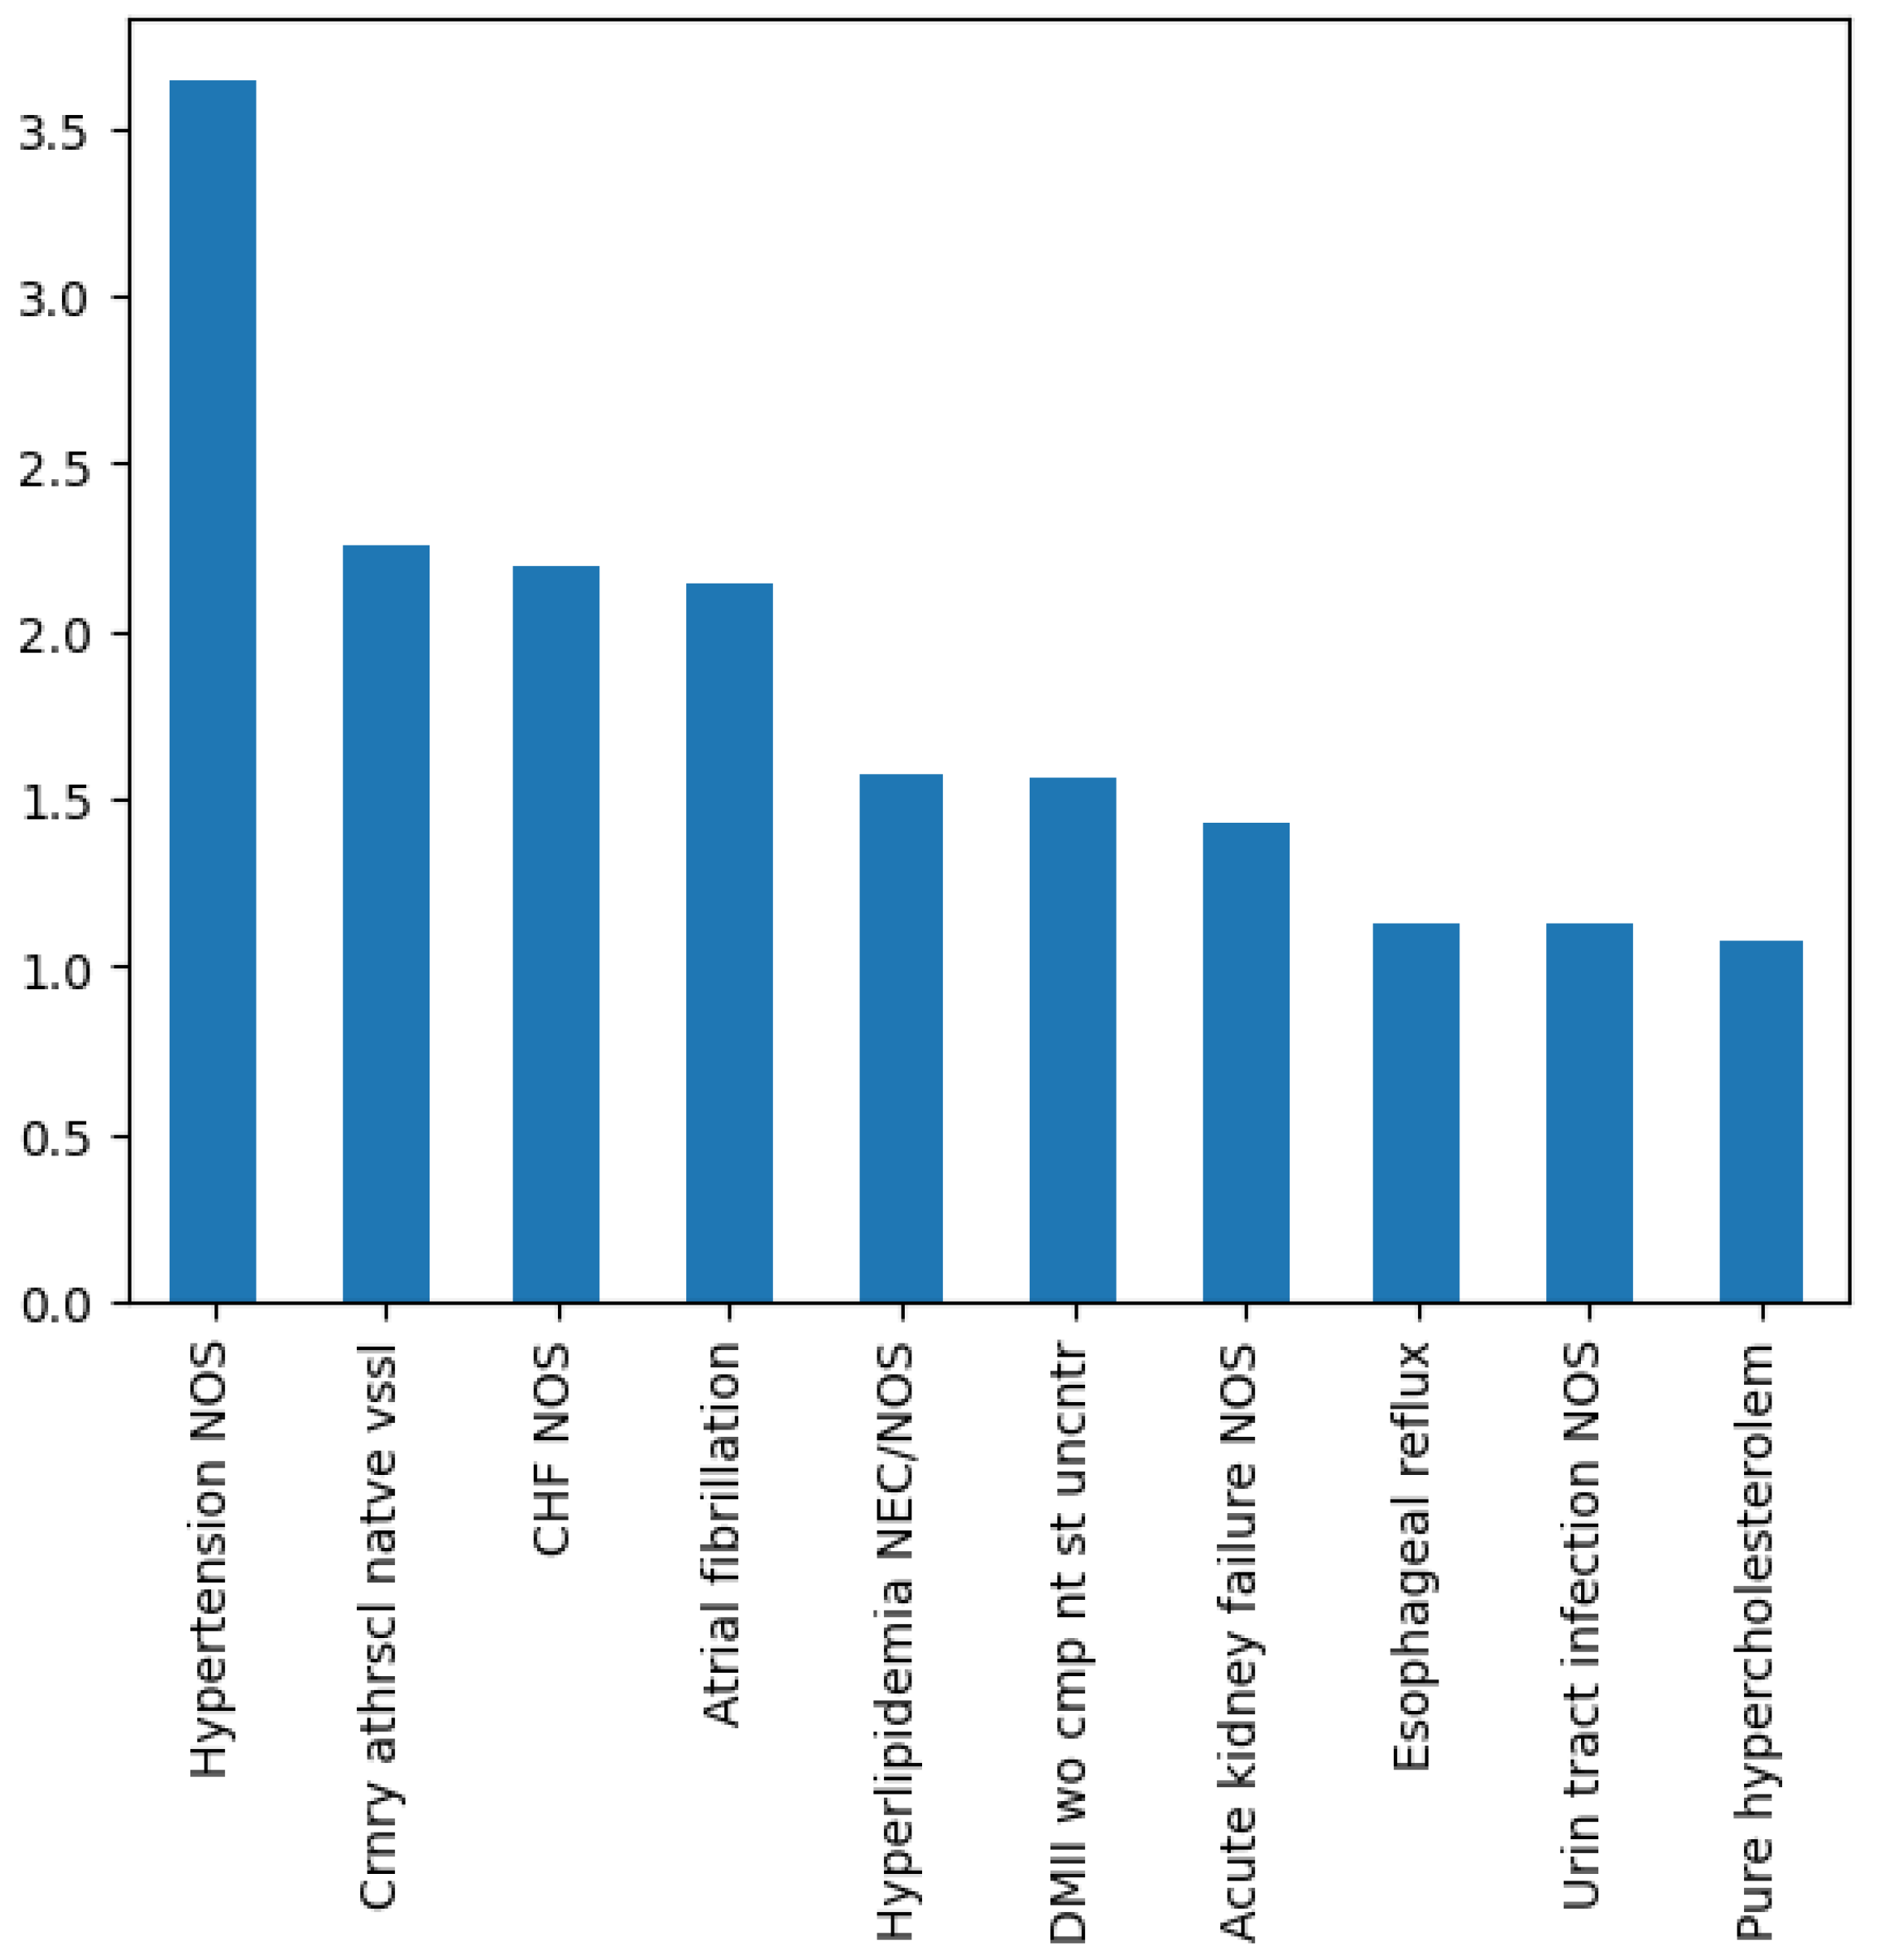
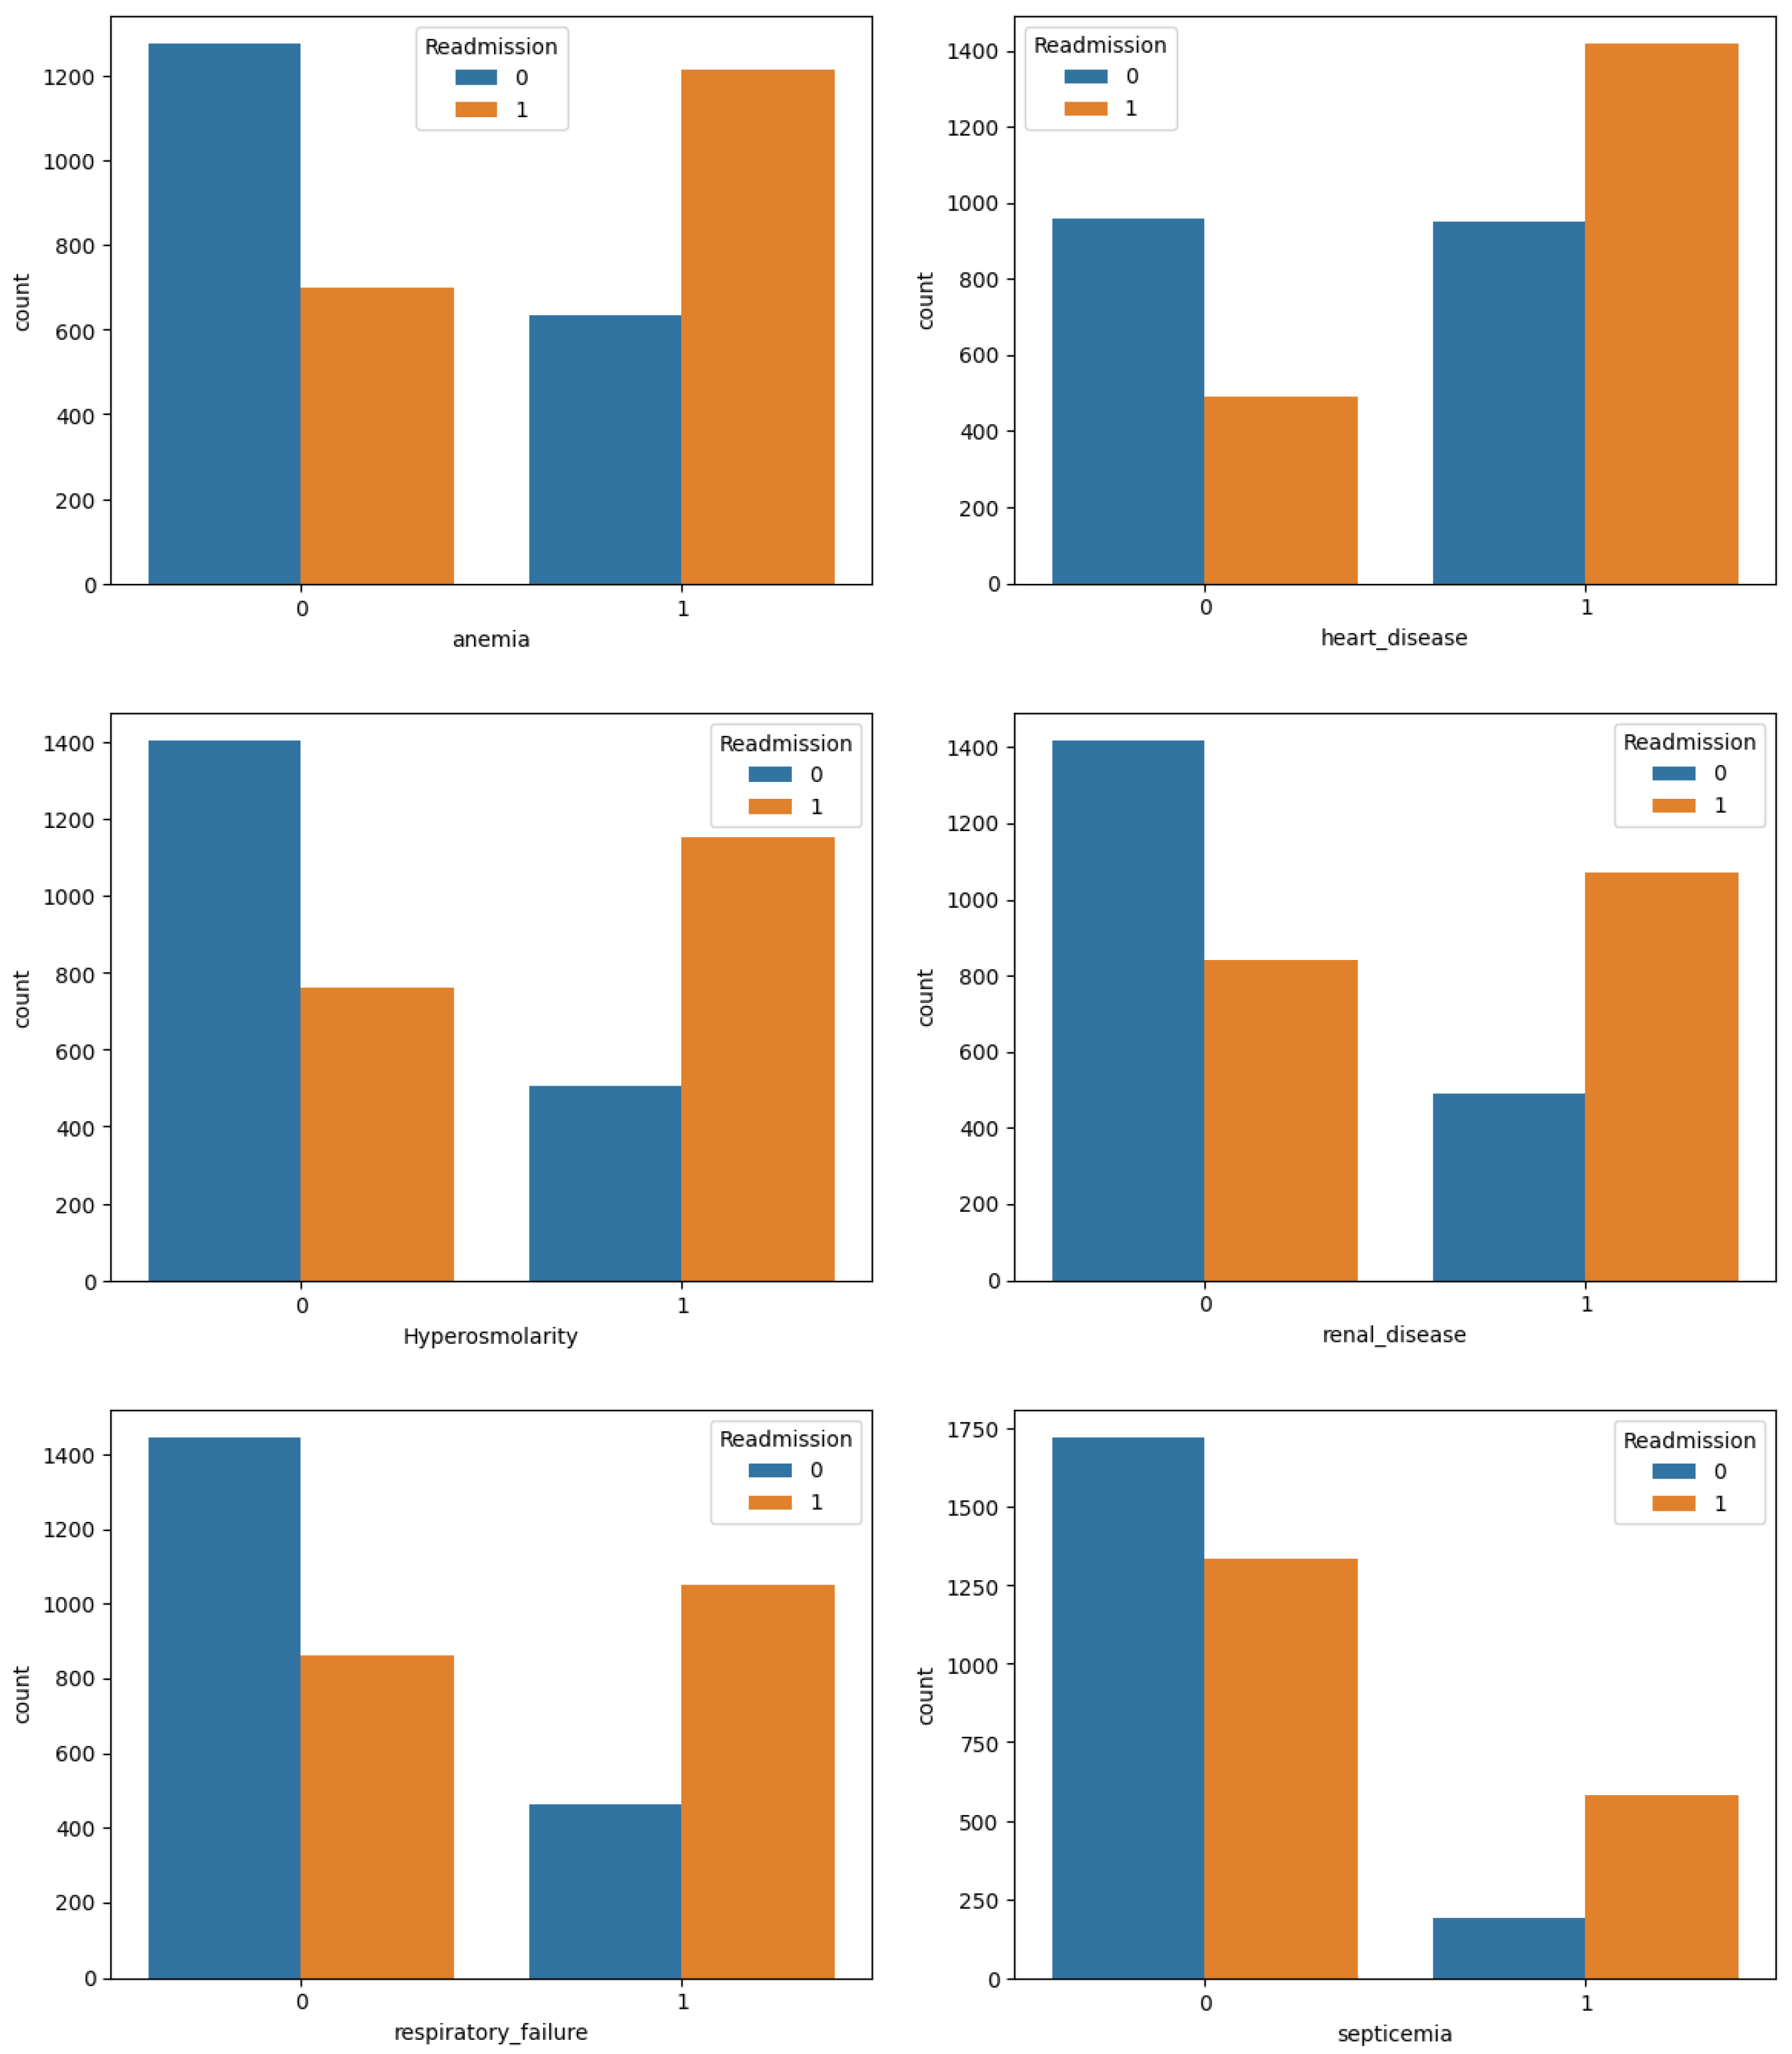
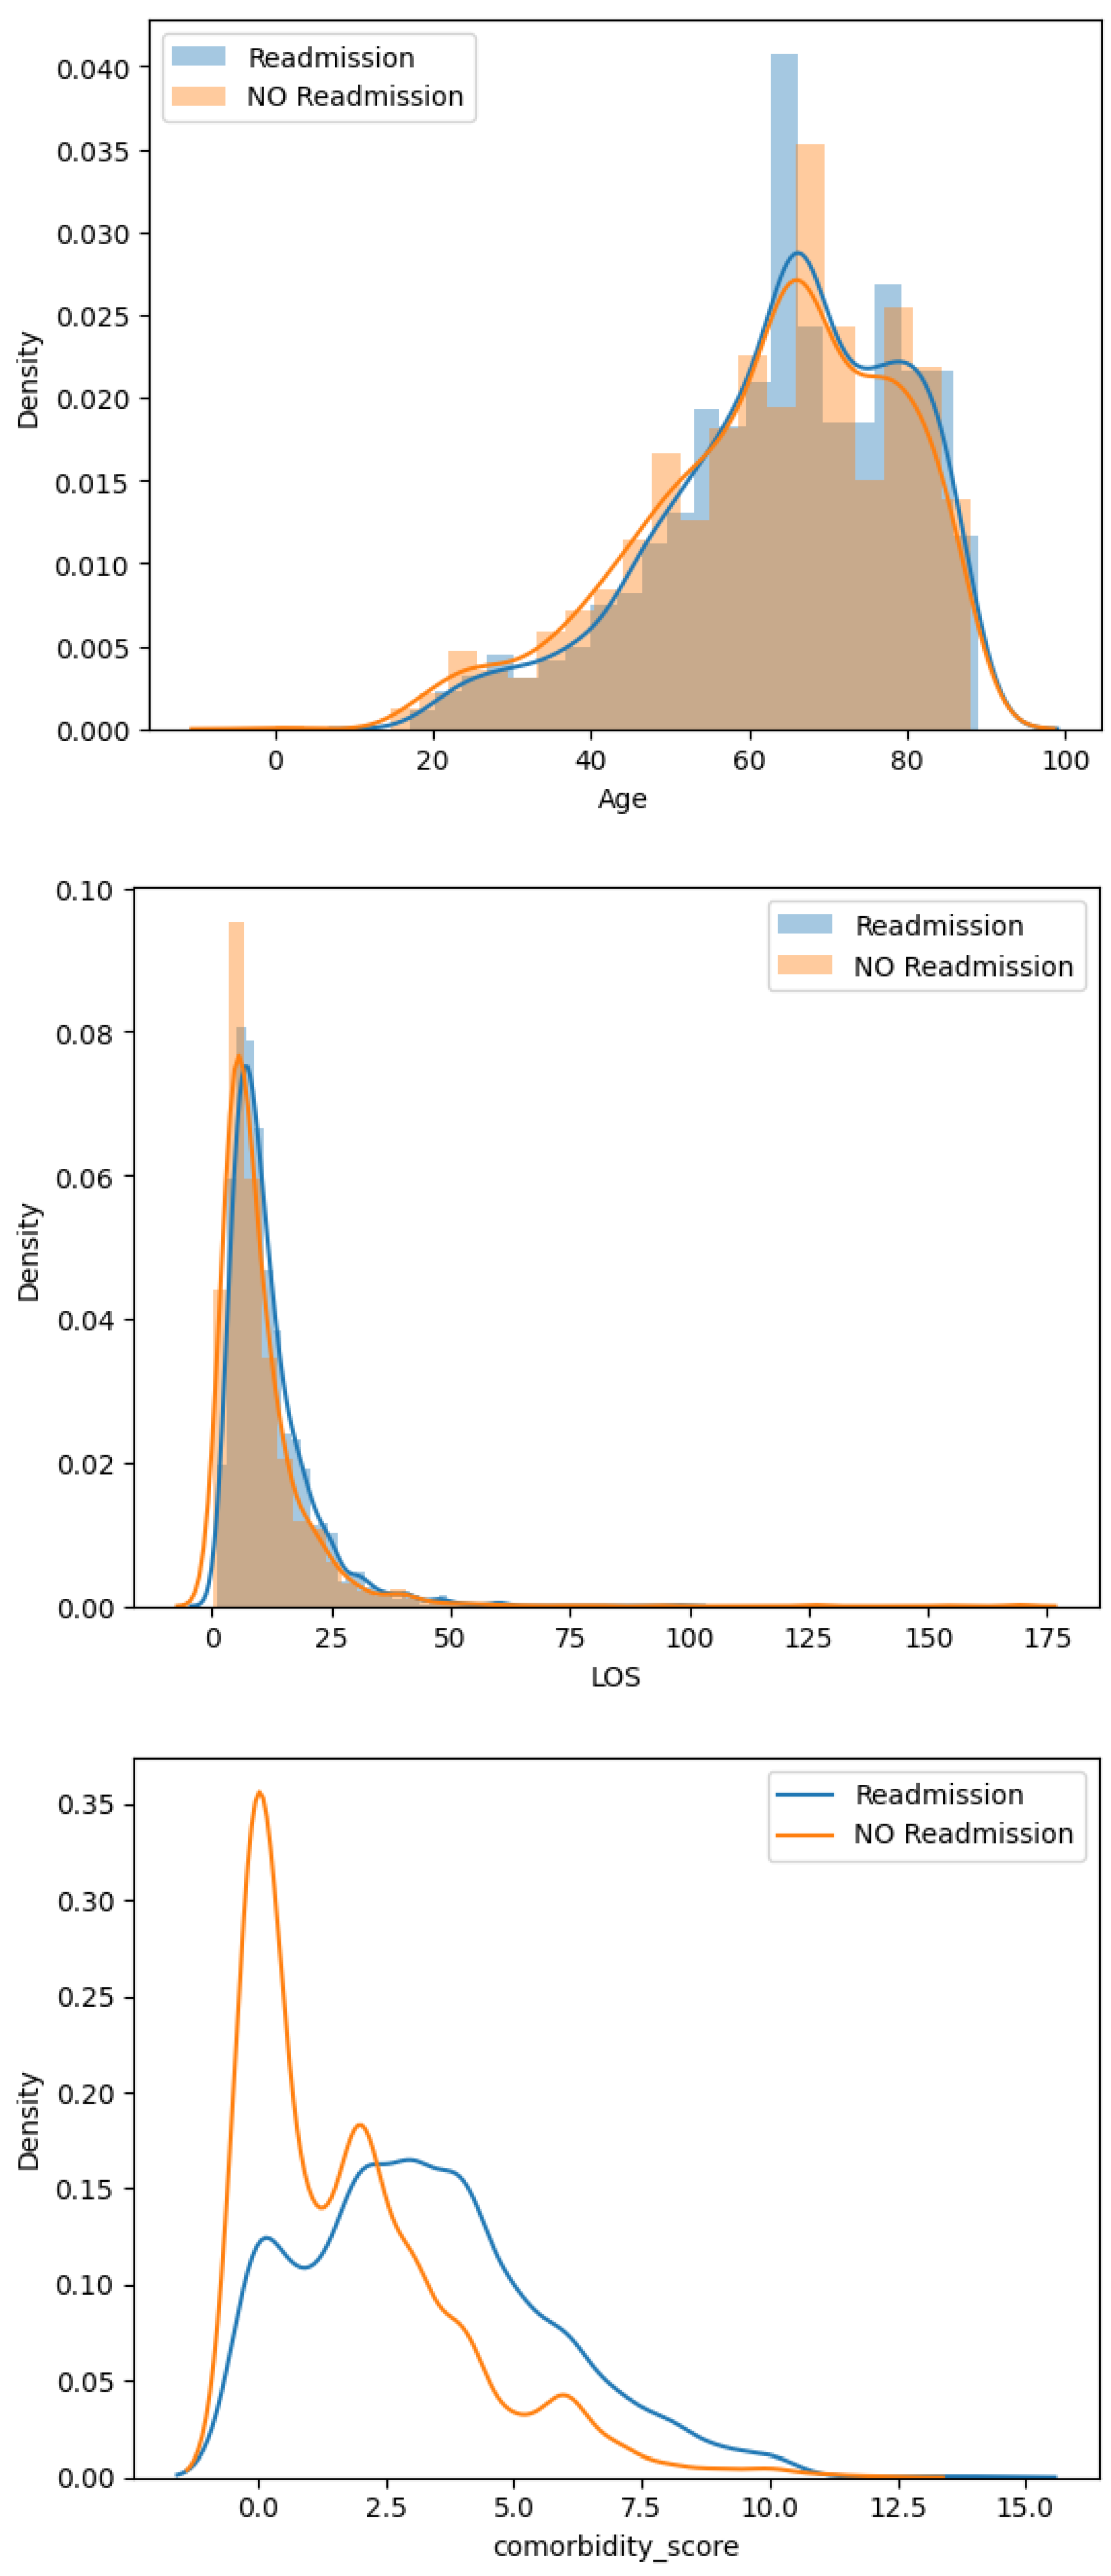
2.3. Descriptive Analysis

The preprocessed data had a readmission prevalence of 5.74% with 1911 records. In order to balance the dataset, we subsampled the not-readmitted samples by choosing randomly 1911 records. Therefore, the balanced dataset contains 3822 samples with an equal proportion of samples with and without readmission. The independent features included the patients’ clinical diagnoses along with demographic and administrative features like gender and age, number of hospital admissions during the last 12 months, length of stay (LOS) of the previous admission and comorbidity. In order to evaluate the likelihood impact of comorbidity presence on readmission, we used the Charlson Comorbidity Index (CCI) [13], which associates a weight on each comorbidity category based on the risk of mortality.
A statistical analysis of the demographic and administrative variables is represented in Table 1. We used the percentage for categorical variables and the mean/median for continuous ones. The initial analysis revealed that the number of previous hospitalizations during the last 12 months is significantly higher for readmitted patients, where 88.80% of readmitted patients were admitted to the hospital from 1 to 3 times before readmission. This comparative description may lead to the hypothesis that the presence of previous admissions may increase the risk of readmission. The Charlson Comorbidity Index (CCI) score appeared to also have an impact on the readmission rate; as can be seen from Table 1, 67% of patients with a CCI score higher than 2 and 72% of those with a score higher than 5 were readmitted, while nearly 60% of all the readmitted patients were indicated to have a CCI score of at least 3.
From a preliminary descriptive analysis of diagnostic features, we noticed a high rate of hospital readmission among patients positive for some diseases compared to a lower readmission rate for the ones negative for the same diseases. The plots in Figure 5 present some of the diseases that may increase the odds of being readmitted, including anemia, heart disease, hyperosmolality, renal disease, respiratory failure and septicemia.
The distribution plots of the continuous variables (age, LOS and comorbidity score) represented in Figure 6 showed a higher rate of readmission among elder patients aged more than 60 years, while a slightly higher rate was observed for patients with a length of stay longer than 10 days. We additionally observed from the distribution plot that the readmission rate increased for patients with a CCI score higher than 3, which means they were more likely to get readmitted compared to those with a lower CCI score. This indicates that the CCI score had a positive effect on the readmission rate, assuming that the higher the score, the more likely the patient will be readmitted. According to [14], a CCI score of 1–2 was considered mild, a score of 3–4 was considered moderate and a score higher or equal to 5 was considered severe.
From this quantitative and qualitative descriptive study, we presume that the patient’s age, number of previous admissions and comorbidity index were significant regarding readmission cases. This initial study also hypothesizes that some diagnostics, in particular, heart disease, hyperosmolality, anemia, renal disease, septicemia and respiratory failure, tend to be part of the most common causes of readmission.

3. Results

For all the models, we split the data into 80% for training and 20% for testing. We trained our data by using five ML classification models, including Decision Trees [15], K-Nearest Neighbors (KNN) [16], Gradient Boosting [17], eXtreme Gradient Boosting (XGboost) [18] and Random Forests [19]. The metrics used to evaluate the models were the average precision and the Area Under the Curve (ROC-AUC), and the five-fold cross-validation method was used to obtain reliable results. The balanced data had 3822 samples with 52 predictor variables. We split our predictors into two categories: the first group contained demographic and administrative variables including the patient’s age and gender, length of stay, Charlson Comorbidity Index (CCI) and number of previous admissions during the last 12 months, while the second group is based on clinical diagnostics in EHRs. An overview of all the results is summarized in Table 2.

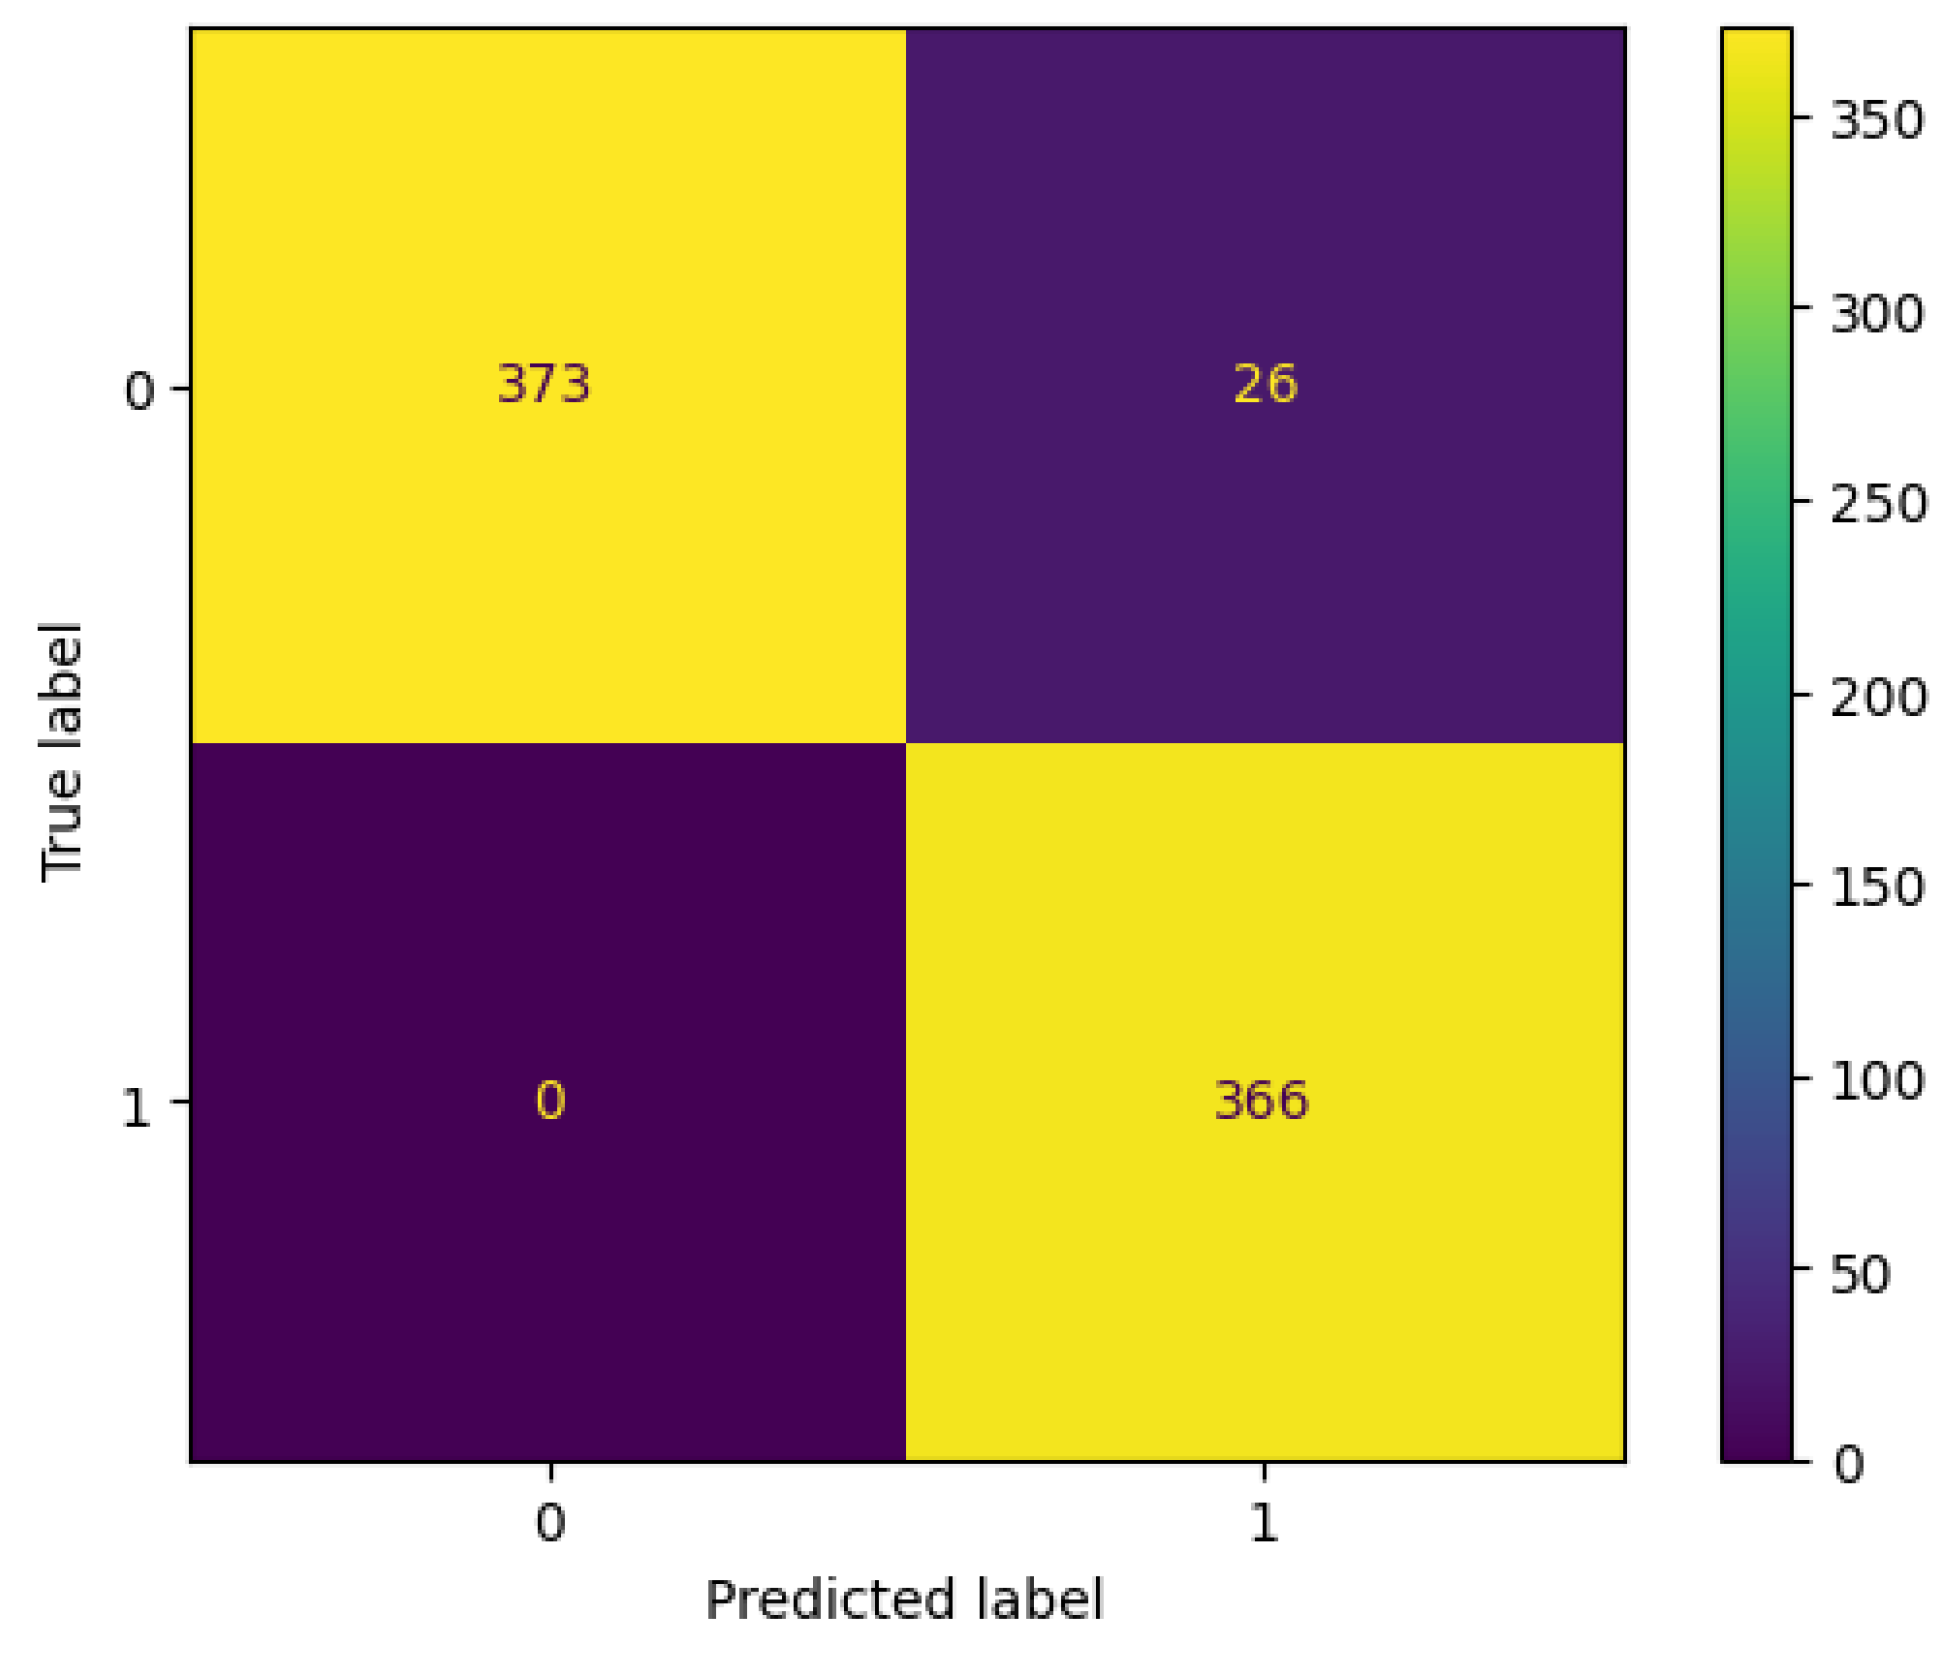
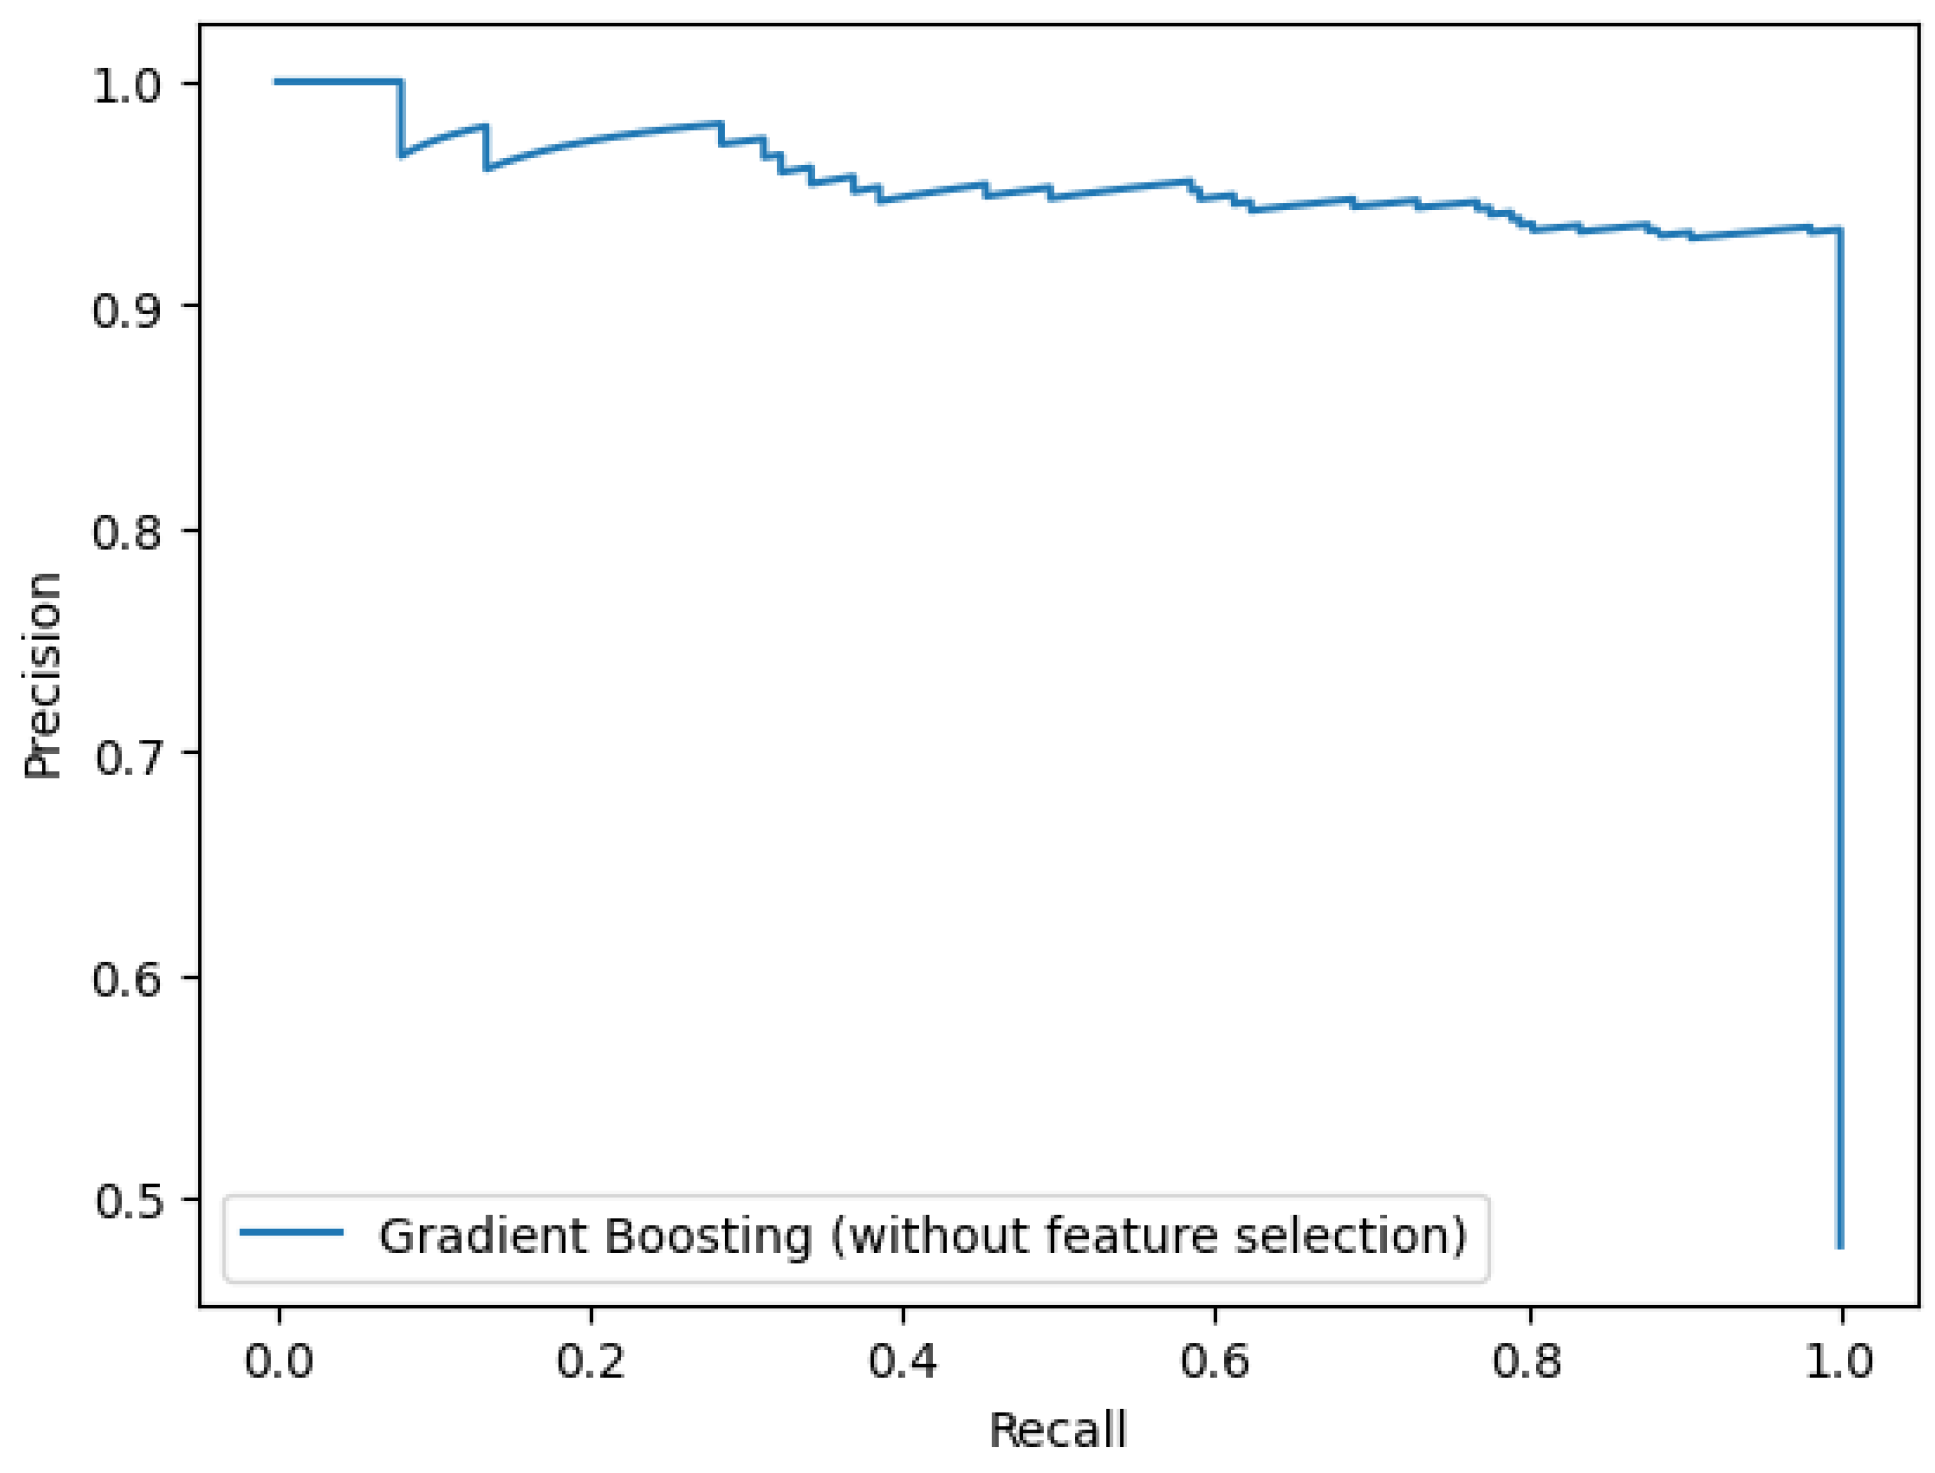
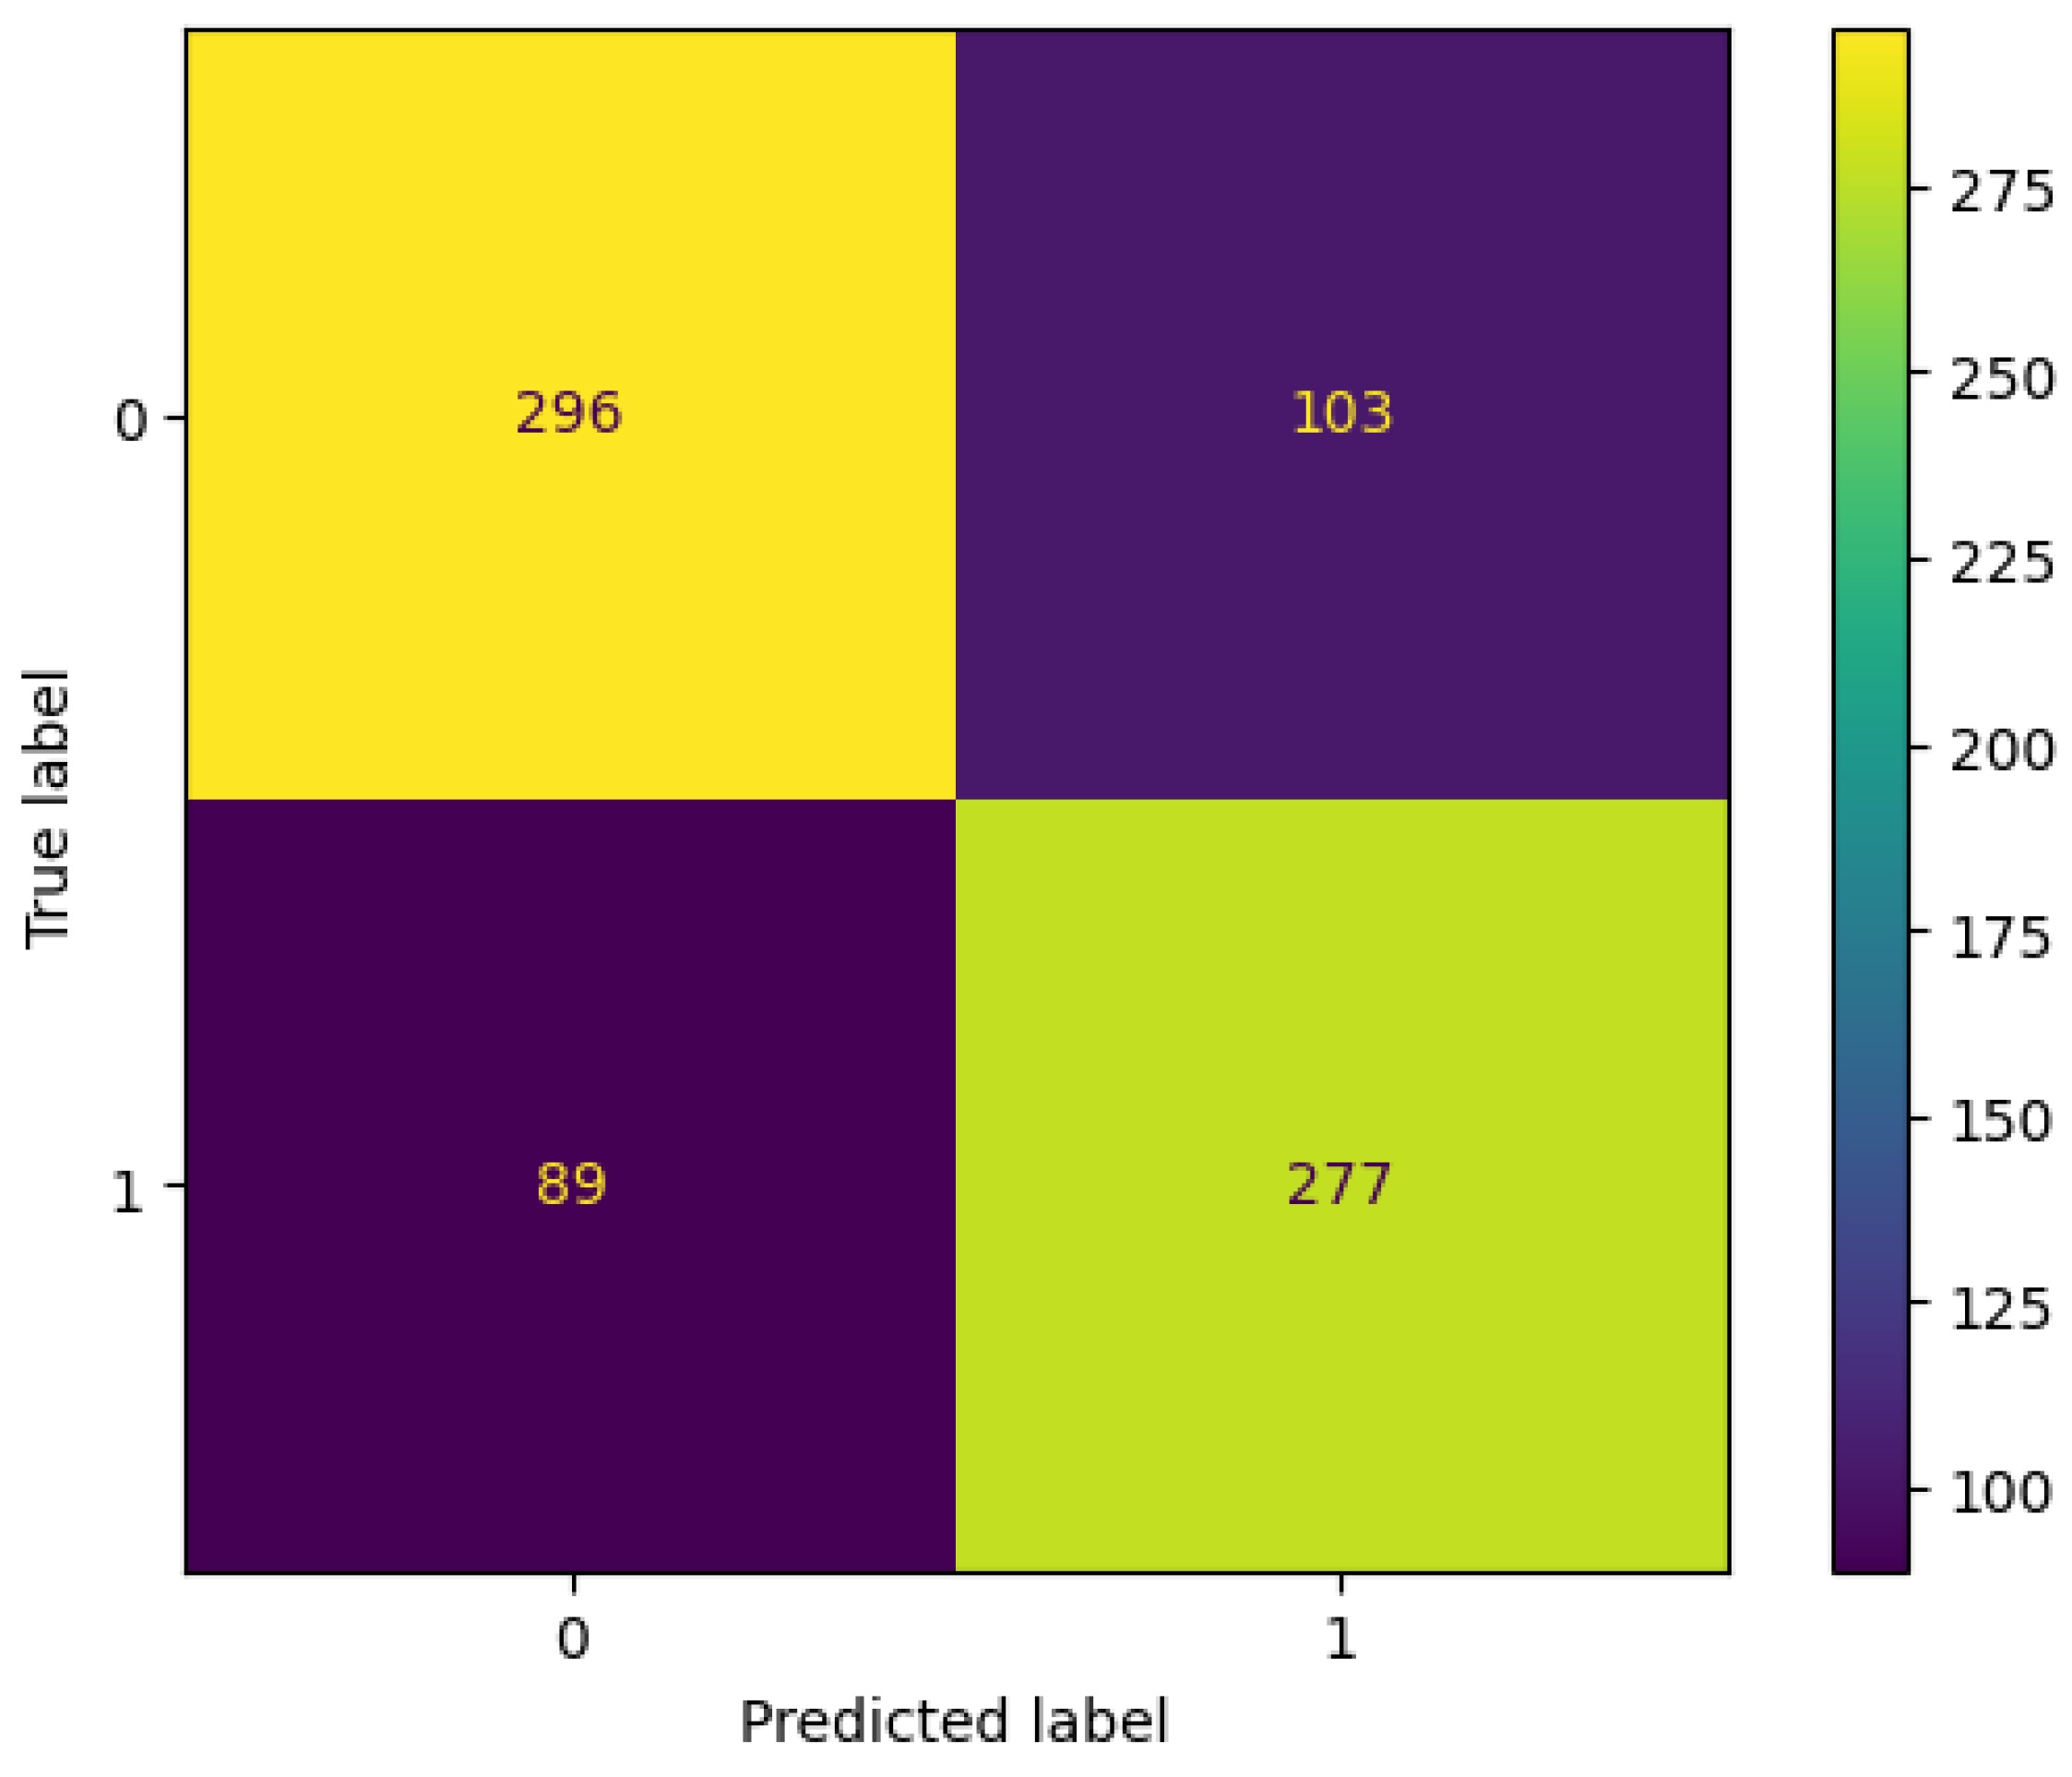
3.1. Without Feature Selection

We first trained the models by using all the features in order to use them as a base reference. The comparative results in terms of the average precision (AP) and ROC-AUC are summarized in Table 2. In terms of the average precision, Gradient Boosting and the Decision Tree had the best performance with 95.6%, followed by XGBoost with a performance of 95.3%, while Random Forests and KNN had a lower performance with an AP of 94.8% and 80.1%, respectively. The ROC-AUC, Gradient Boosting and XGBoost had the best performance with 97.3%, followed by the Decision Tree with 96.9%.
The confusion matrix represented in Figure 7 of the Decision Tree and Gradient Boosting showed that all the samples of the readmitted class were correctly classified, yet 26 samples of the negative class were misclassified as readmitted with a recall of 93%. The precision–recall curve of the Gradient Boosting model is represented in Figure 8.

3.2. Using Only Clinical Predictors

We retrained the same models by using only the clinical variables (42 diseases). The overall performance was less than the one achieved by using all the features. Gradient Boosting had the best performance with an AP of 80.4%, followed by XGBoost and KNN with 77.9% and 76.7%, respectively. Unlike the previous results without feature selection, the Decision Tree had the worst performance with an average precision of 74.5%. The confusion matrices of all the models showed a high rate of false positives and false negatives, with 89 from 366 of the readmitted samples being misclassified as not readmitted and 103 from 399 of the not readmitted samples being misclassified as readmitted. We can assume from the results that diagnoses are not efficient predictors as the use of only diagnoses features was not efficient at predicting readmission. Figure 9 shows the confusion matrix of the Gradient Boosting algorithm.

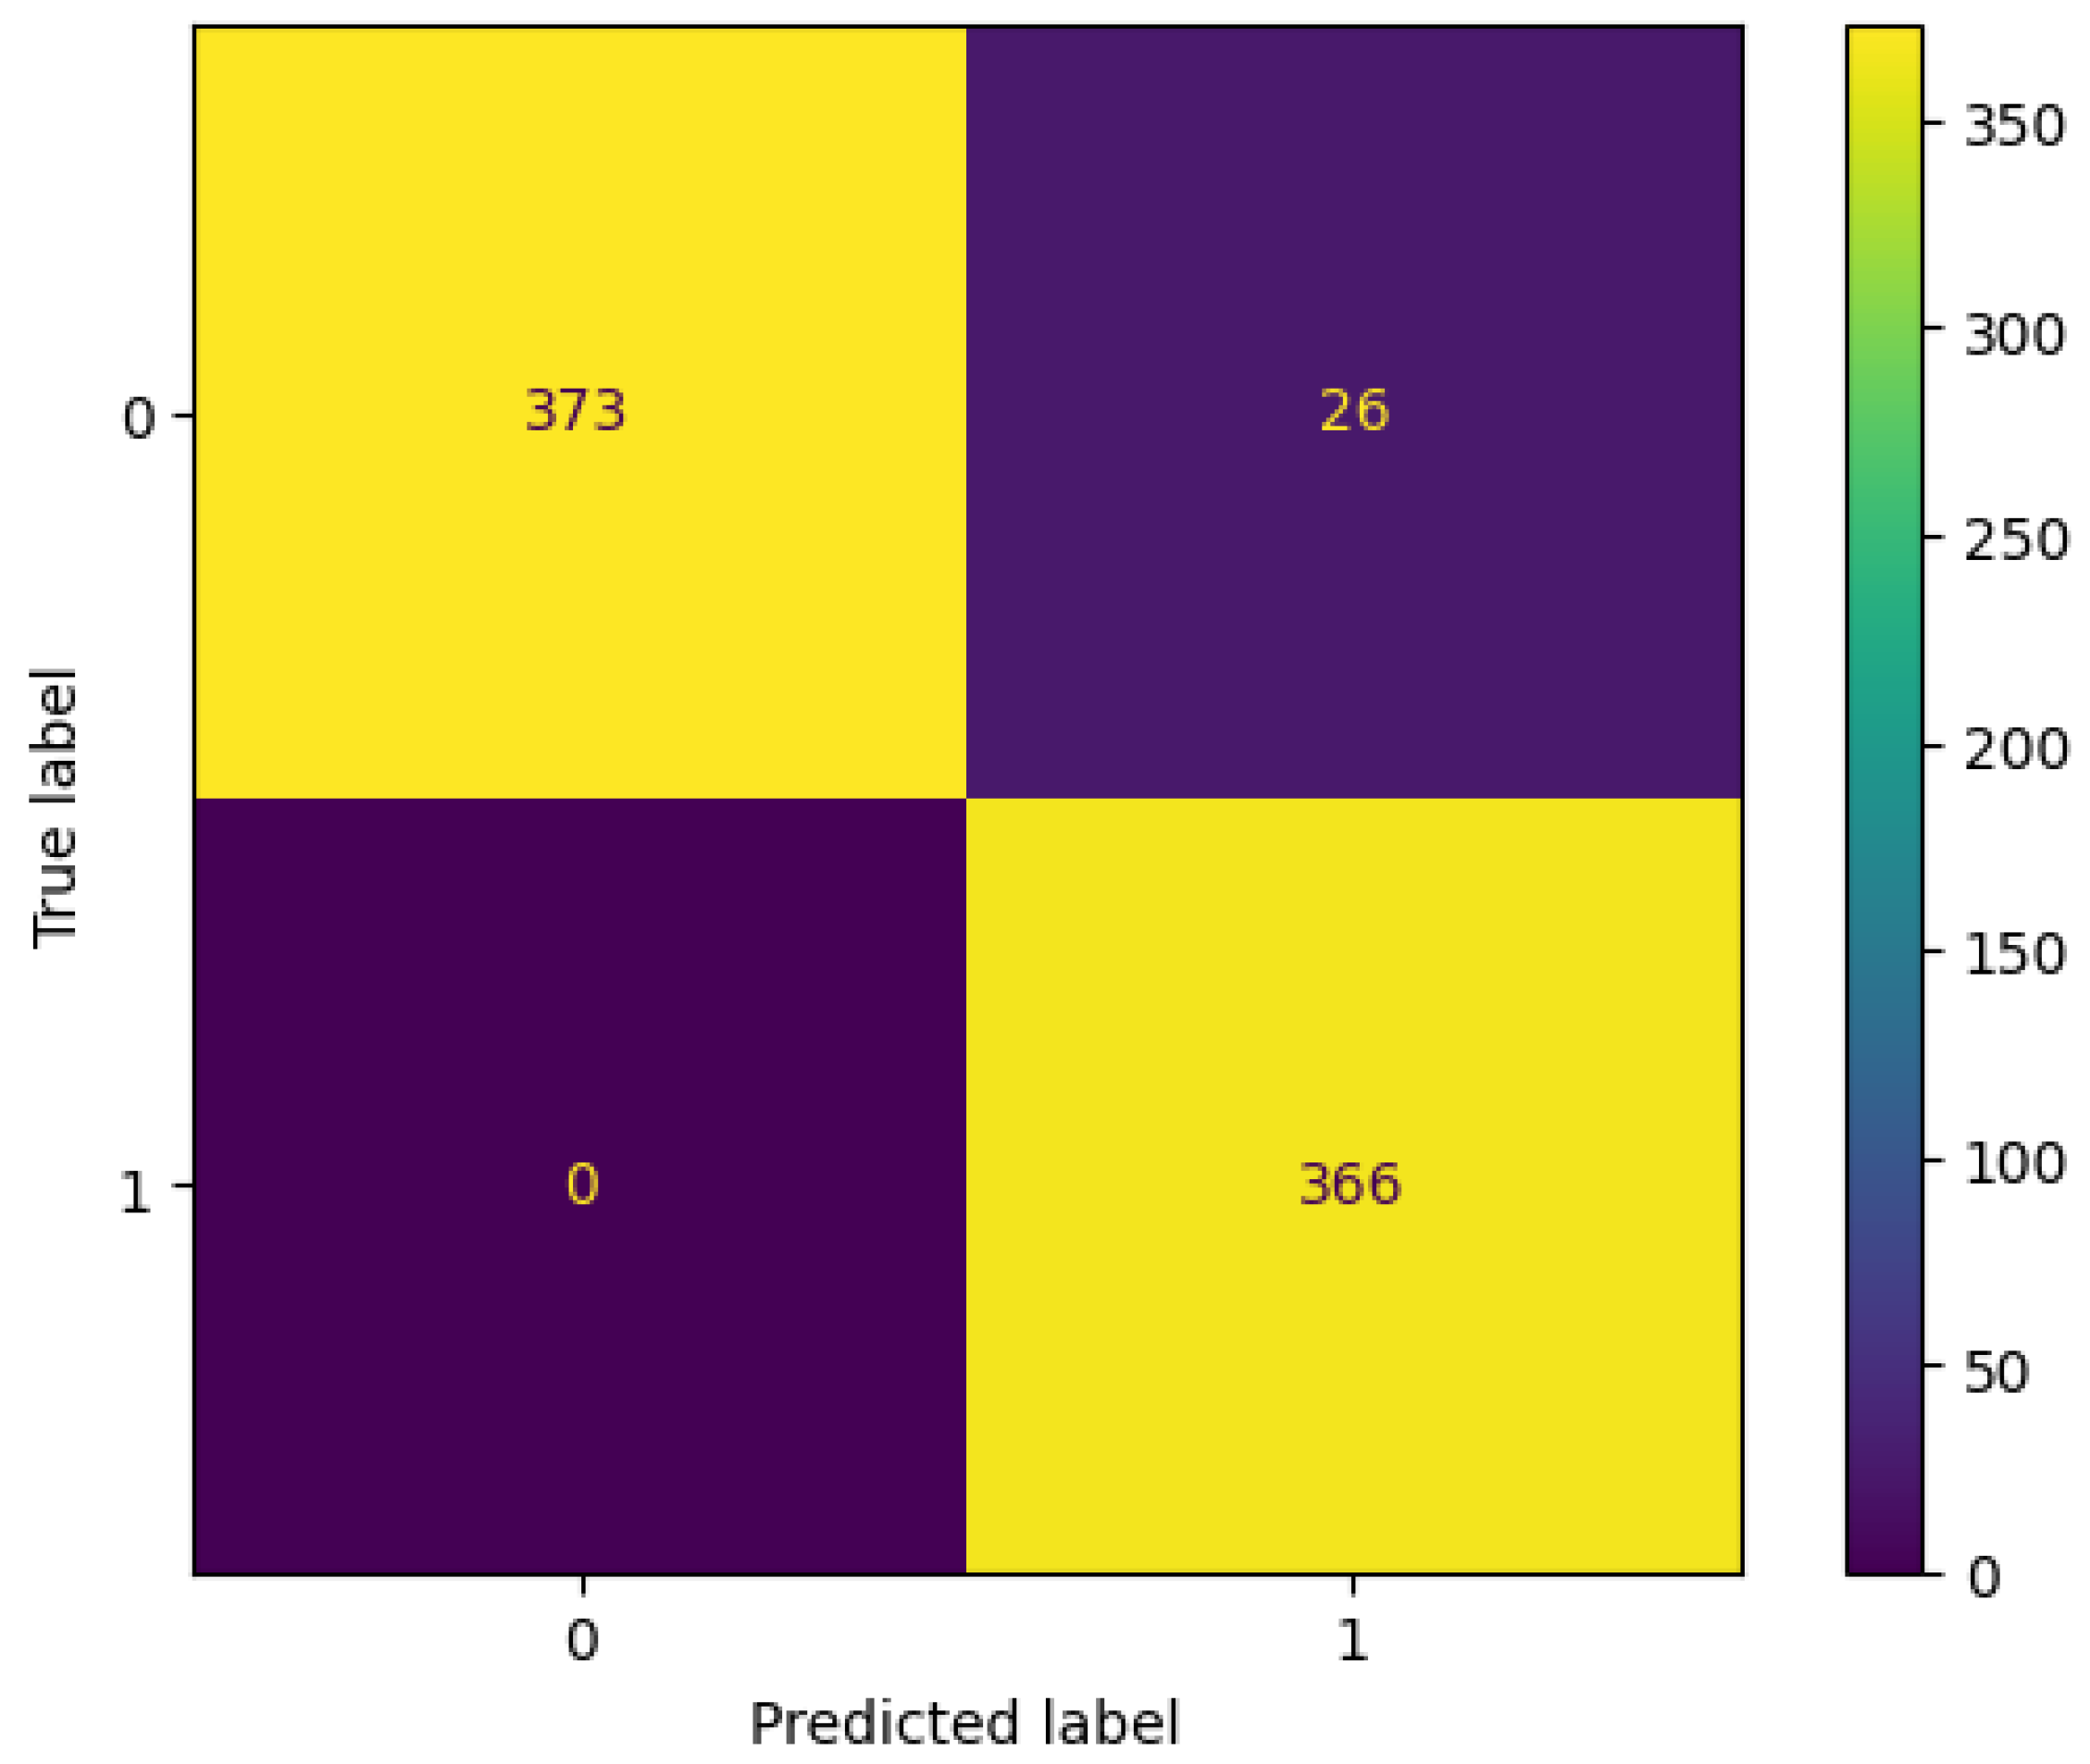
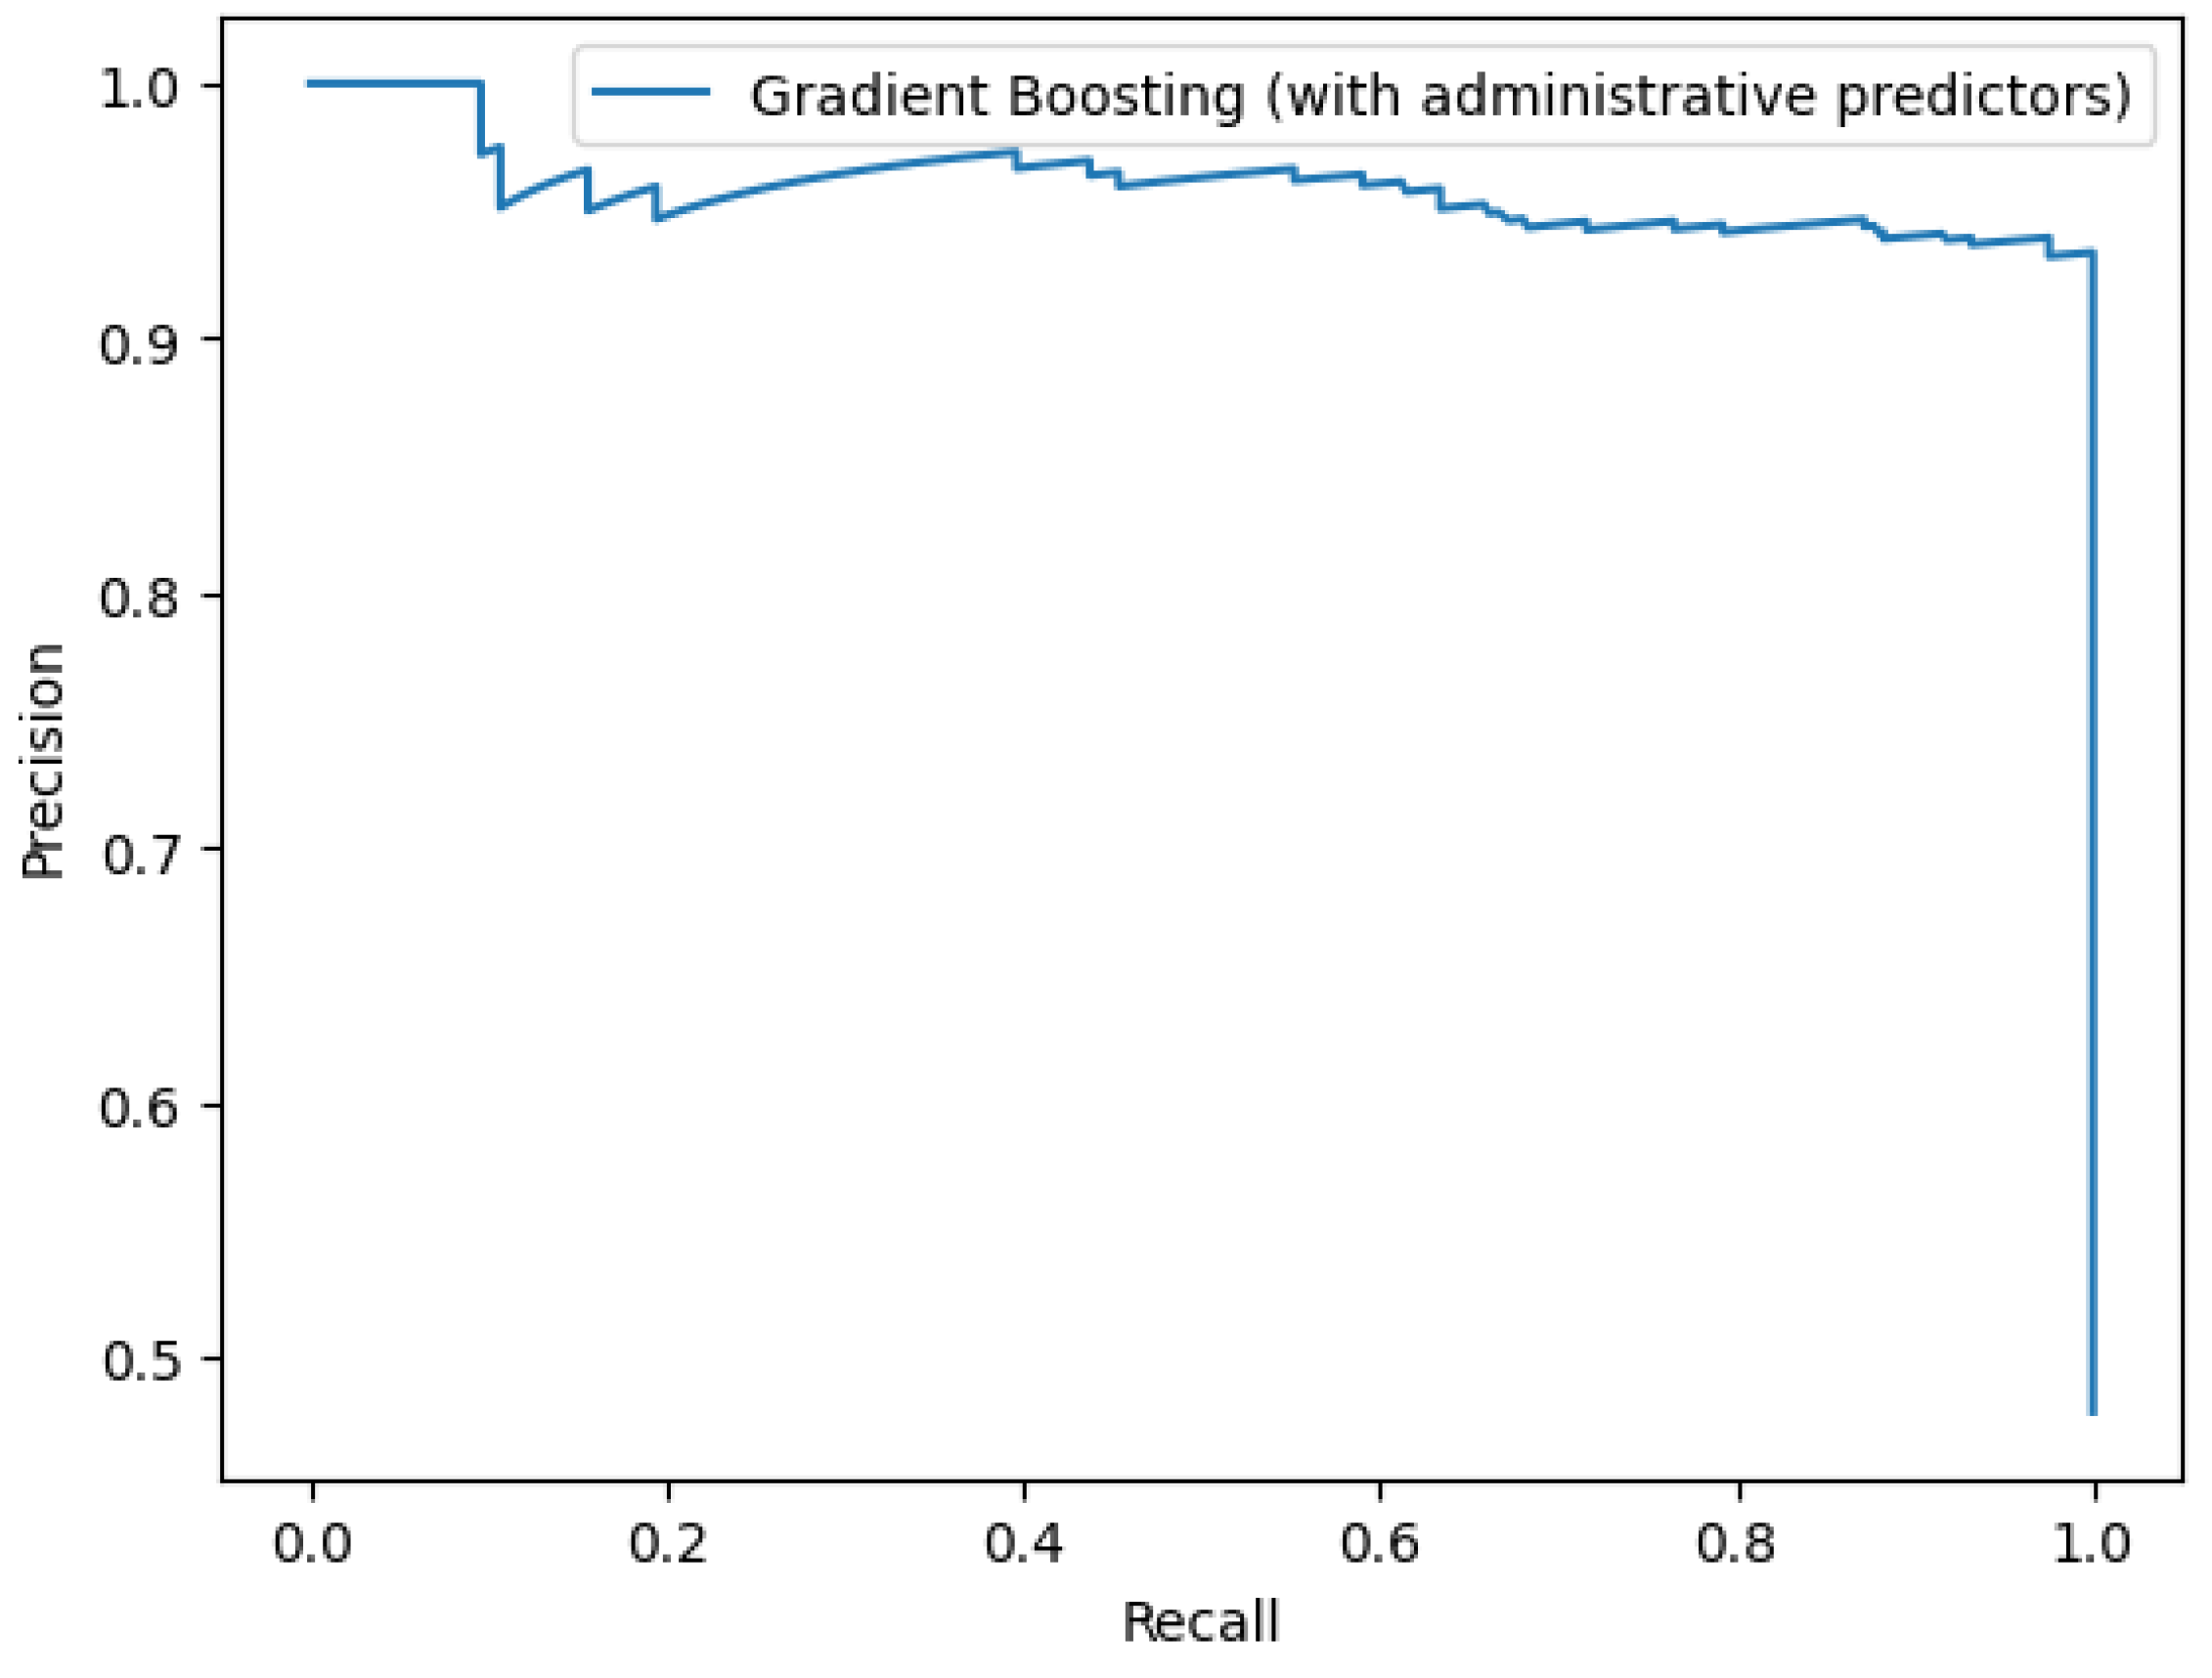
3.3. Using Only Demographic and Administrative Predictors

We trained the same models by using only the demographic and administrative predictors (five features). The features included the patient’s age and gender, length of stay, number of admissions during 12 months and comorbidity score. The Gradient Boosting, XGBoost and Decision Tree models had the best performance with an ROC-AUC of 97.6%, 97.5% and 96.9% and an AP of 95.9%, 95.3% and 95.1%, respectively, followed by Random Forests and KNN with an ROC-AUC of 96.5% and 94.6% and an AP of 93.7% and 94.4%, respectively. The confusion matrices showed no false negative (FN) samples for the Gradient Boosting and Decision Tree models and only two FN samples for Random Forests. Figure 10 and Figure 11 illustrate the confusion matrix and precision–recall curve of Gradient Boosting by using administrative data, respectively.
We can observe from the aforementioned results that all the models had a good performance without using any diagnosis features. Conforming to the results, predictors like the number of previous admissions and the comorbidity index could be more important in predicting hospital readmission.

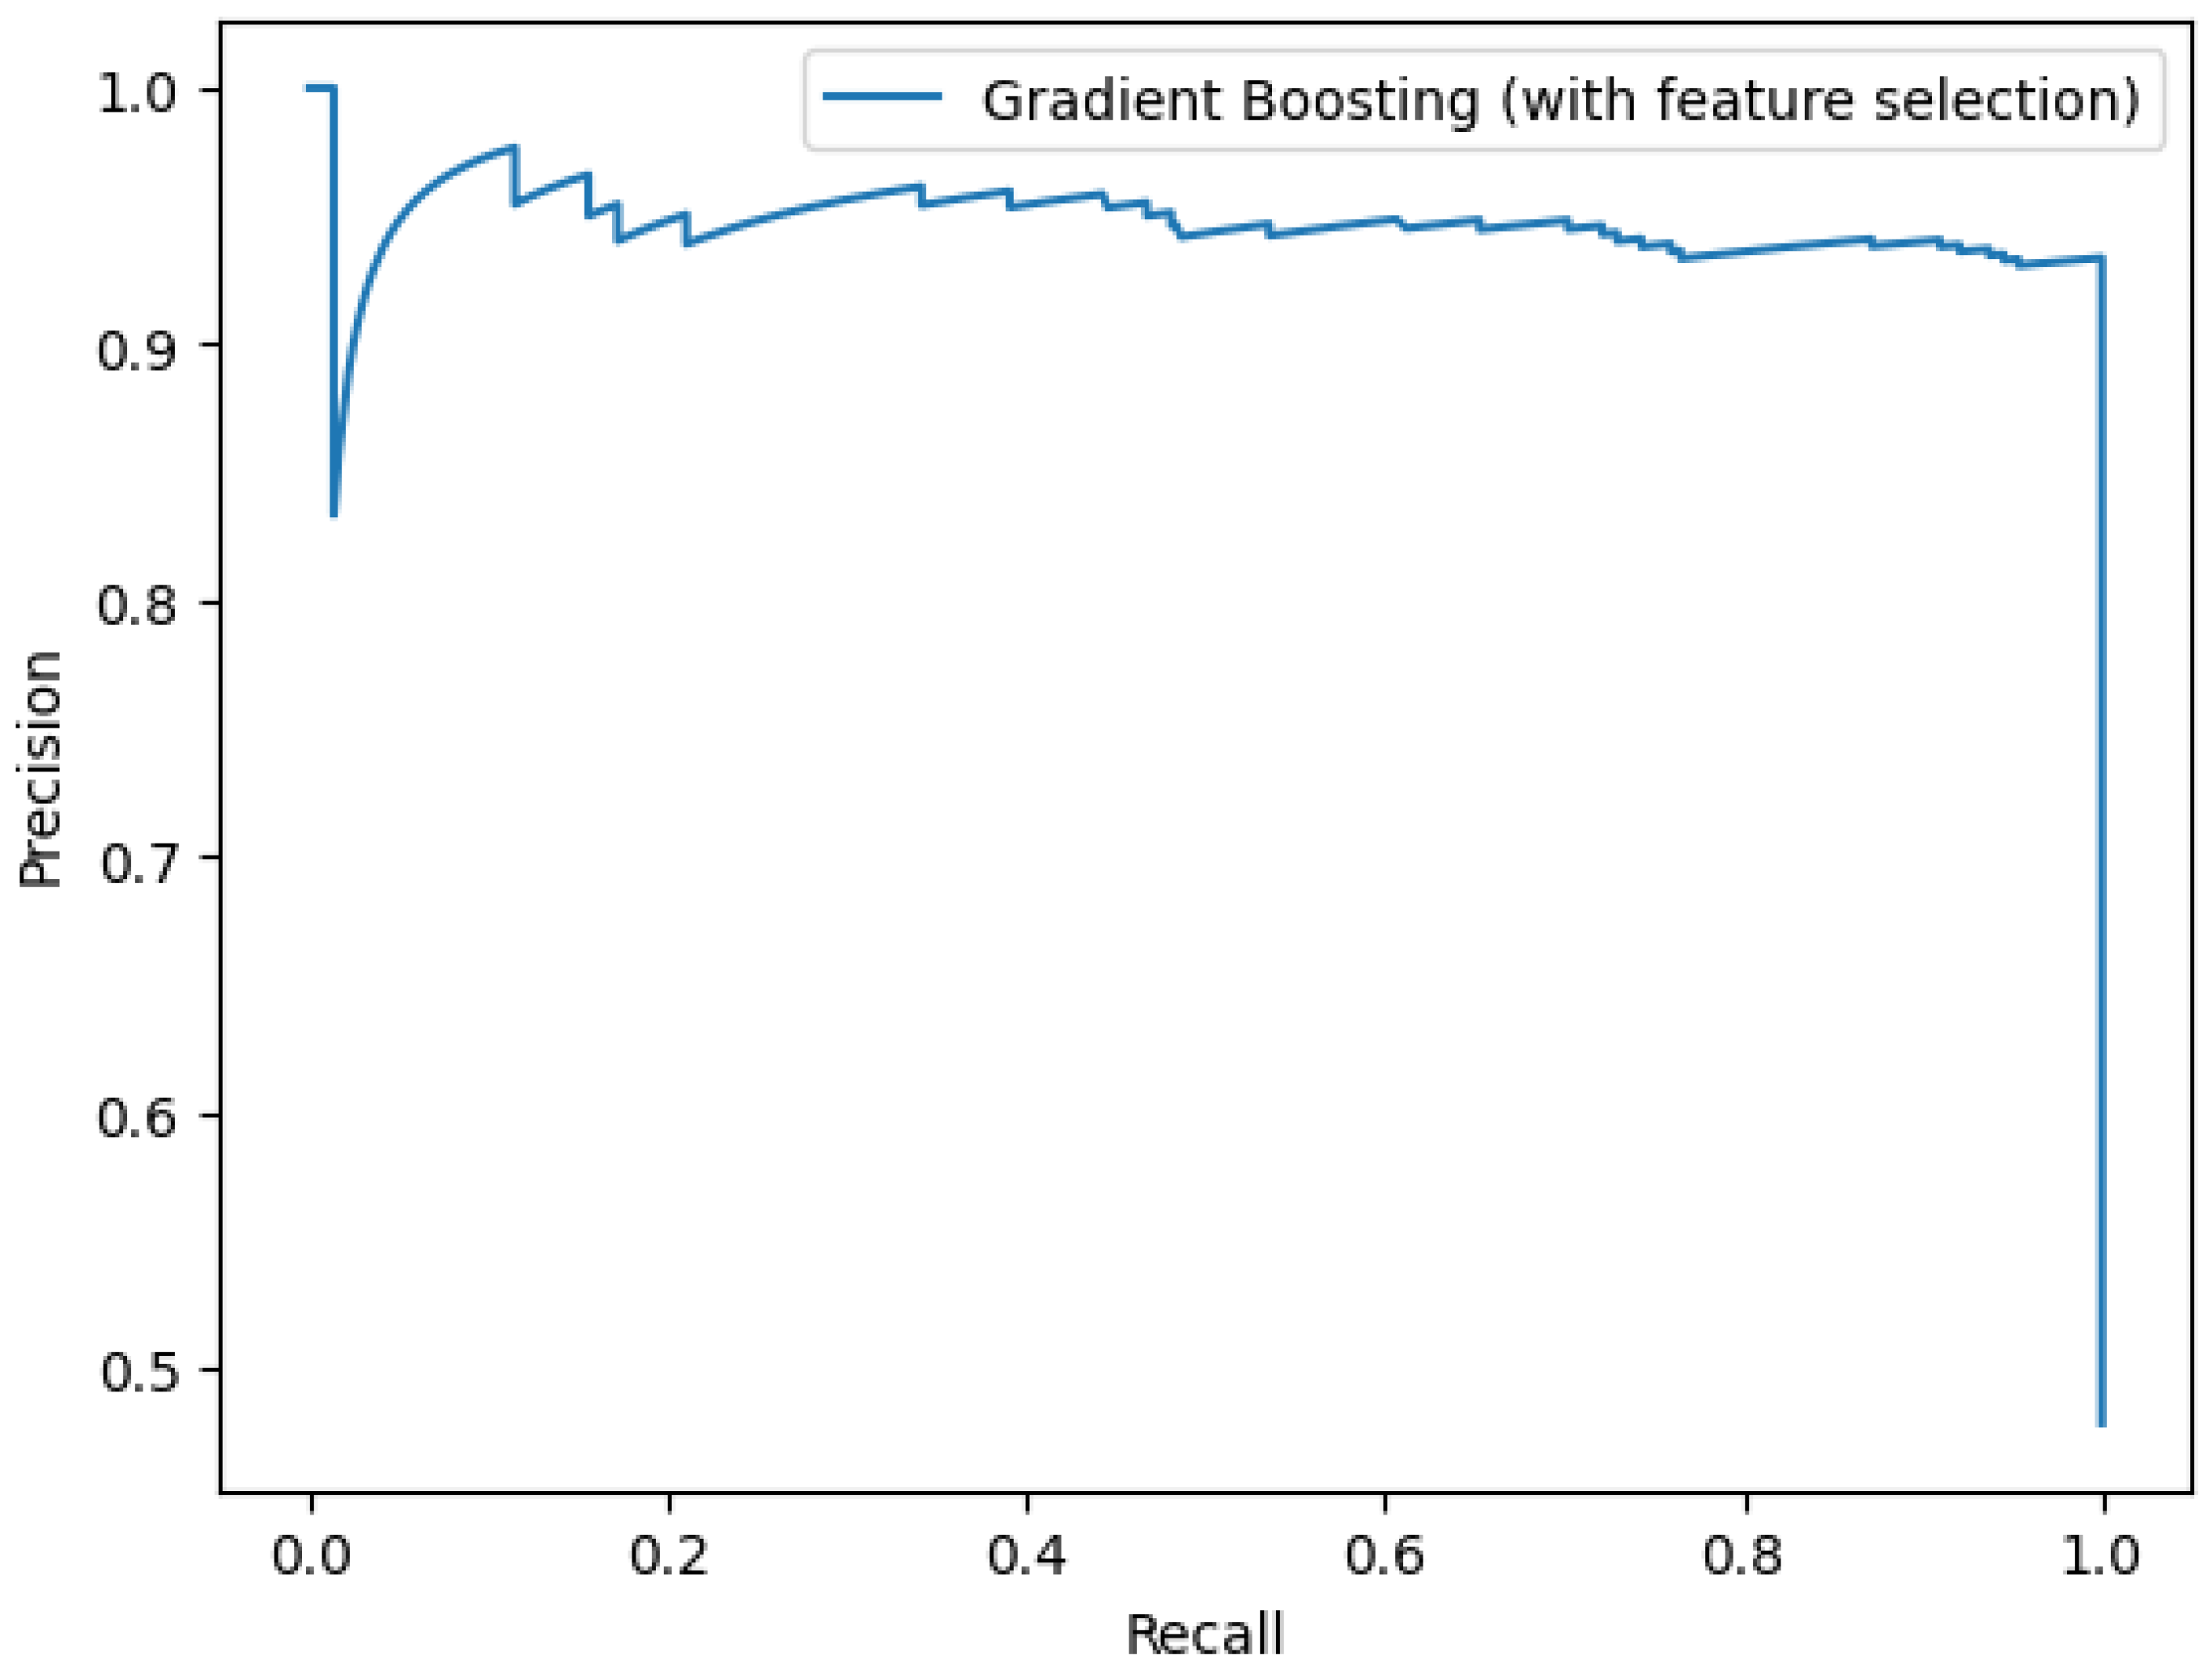
3.4. Feature Selection Using Statistical Tests

We used the statistical student test (t-test) [20] to select the relevant features that are significant for readmission modeling. We first used an alpha variable of 0.05 and then a value of 0.02 to select only the best predictors, but the null hypothesis was rejected for almost all the features. Table 3 summarizes the most significant features conforming to the t-test results (p-value). As can be seen from Table 3, the number of hospital admissions during the last 12 months was the most significant feature with a p-value of 1.40 × 10 225 , followed by hyperosmolarity with a p-value of 4.83 × 10 104 and the Charlson Comorbidity Index (CCI) with a p-value of 5.79 × 10 89 . We can assume from this result that the patients with a higher comorbidity index and with multiple admissions during the same year had a greater risk of being readmitted. The t-test results showed that a hyperosmolar imbalance, respiratory failure and renal disease were the three most important diseases to predict readmission with p-values of 4.83 × 10 104 , 3.29 × 10 88 and 2.72 × 10 84 , respectively. We also notice that the diagnoses presented in Figure 5 are among the ones with the largest impact on readmission rates, as seen in Table 3.
The second feature-selection model used was the sklearn method SelectKBest, which selects the K predictors with the highest score. The selected features and the importance score were the same as the t-test, where the number of admissions during the same year was selected as the most important predictor with the highest score. In order to evaluate the performance of the models by using different numbers of features, we retrained and evaluated the models by using a K value of 5, 10, 15 and 20 features.
The best result in terms of the AP was achieved by the Decision Tree model by using the 15 most important features with an AP of 96.3%, while in terms of the ROC-AUC, Gradient Boosting was the best model with a performance of 97.3%. In terms of false negatives and false positives, the Decision Tree model incorrectly classified three positive samples as not readmitted and 26 negative samples as readmitted, whereas the Gradient Boosting model performed slightly better with no misclassification for the positive samples; however, the AP was 94.7%, which is less than the one achieved by the Decision Tree.
As the Decision Tree method was among the models that achieved the best performance in most of the techniques, we displayed its feature-importance scores so as to recognize the relevant features that were useful for the algorithm to predict hospital readmission. The method selected the number of previous admissions during the last 12 months as the most significant predictor with a score of 99%. In order to manifest the importance of this feature, we evaluated all the models by using the number of previous admissions as the only predictor. We noticed that all the models achieved the same performance with an AP of 95%, with no misclassification for the readmitted class.
From the above results, we can consider that the number of previous hospital admissions during the same year is a major and dominant feature in predicting if the patient would be readmitted within 30 days after discharge. To assess the importance of the rest of the features on readmission prediction, we removed this predictor from the features and displayed again the feature-importance scores. The method selected ‘Hyperosmolarity’ as the most important predictor from the remaining features with a score of 40.78%, followed by ‘respiratory failure’ with a score of 14.6%; the other selected features included comorbidity with 6%, as well as ‘anemia’, ‘heart disease’, ‘circulatory system disease’, ‘chronic rheumatic heart disease’, ‘urinary infection’, ‘coagulation disorder’ and ‘peptic ulcer disease’. We retrained the models for the last time by using all the features except for the number of previous admissions, and the performance of all the models collapsed to achieve a maximum AP of 79.2% by Gradient Boosting.
The predictive results showed that the performance was slightly better by using only administrative predictors (ROC-AUC = 97.6%) compared to the use of all features (ROC-AUC = 97.3%) and was highly improved compared to clinical predictors (ROC-AUC = 83.7%). Figure 12 represents the precision–recall curve of Gradient Boosting trained on the top 15 features.

3.5. Performance of Top Selected Features and Administrative Data without the “Number of Hospital Admissions”

To better understand the performance of the top selected features and of the demographic and administrative predictors, we added an ablation study by retraining the features without the “Number of Hospital admissions”. We observed from Table 4 that the performance of all the models decreased significantly without the use of the number of previous admissions, achieving an AP of 81.6% compared to 96.4% for the selected statistical features and an AP of 65.2% compared to 95.9% for administrative predictors. The decrease in performance revealed the importance of the number of previous hospital admissions as a key predictor for future readmissions specially when using only administrative features.

4. Discussion

The initial descriptive study showed that Congestive Heart Failure was the primary diagnosis of 13.4% of readmitted patients, followed by abdominal pain and hypotension. The association between readmission rates and diagnoses revealed that diseases including hyperosmolarity, heart disease, respiratory failure, hypertensive disease, anemia and renal disease increased the odds of being readmitted. We also perceived that patients readmitted in less than 30 days after discharge had a higher comorbidity index (more than three) and were hospitalized multiple times during the last 12 months.
We found from the predictive study that the number of previous admissions during the same year had the largest impact on the prediction compared to other features. Using the number of previous admissions as the only predictor performed better than using medical diagnoses as features with an AP of 95% compared to 80.4% for clinical features. This result was consistent with the outcome of the statistical techniques used to identify relevant features, where the number of previous admissions was considered the most important predictor with a score of 99% by the Decision Tree feature-selection model and a p-value of 1.40 × 10 225 by the t-test and the SelectKBest methods.
We also presume from this descriptive and predictive study that clinical diagnostics are not always sufficient to predict hospital readmission, while demographic and administrative data including the number of previous admissions, comorbidity index, age and length of stay could be more efficient and accurate.
A potential limitation of this work involves the use of diagnoses and demographic data as the only predictors for unplanned readmission. Other factors may influence hospital readmission such as lab test results, vital sign measurements, procedures, etc. In this work, we showed that the number of previous admissions and comorbidities were significant for readmission prediction; in future work, we aim to combine the data used in this work with lab values and vital measurements to obtain more accurate results, and we moreover intend to predict unplanned readmissions by using clinical notes from the discharge summary.

5. Conclusions

In conclusion, this paper provided a descriptive analysis of the data and features used for predicting unplanned readmission within 30 days after discharge. We thereafter trained our models by using various types of feature selection and highlighted the most significant predictors for readmission prediction. We found that patients with multiple admissions during the same year and with a high comorbidity index had higher odds of being readmitted in less than 30 days. In order to reveal the influence of the number of previous hospital admissions on the overall performance, we conducted an ablation study on administrative predictors and on the top 15 selected features. It showed that the “Number of hospital admissions” had a strong influence especially on the performance of the administrative predictors. It is important to note that in this paper, we used ICD-9 codes instead of ICD-10 due to the use of the MIMIC-III database that does not contain ICD-10 codes. We aim to use ICD-10 codes in future works.

Author Contributions

Conceptualization, M.A.A. and S.D.; methodology, S.D. and M.A.A.; validation, S.D. and M.A.A.; formal analysis, S.D. and M.A.A.; writing—original draft preparation, S.D.; writing—review and editing, M.A.A.; funding acquisition, M.A.A. All authors have read and agreed to the published version of the manuscript.

Funding

This research was enabled in part by support provided by the New Brunswick Health Research Foundation (NBHRF) and by the Natural Sciences and Engineering Research Council of Canada (NSERC), funding reference number RGPIN-2018-06233.

Institutional Review Board Statement

Not applicable.

Informed Consent Statement

Not applicable.

Data Availability Statement

The dataset used in this paper is publicly available (MIMIC-III [12]). See Section 2.1 for more details.

Conflicts of Interest

The authors declare no conflicts of interest.

References

  1. Weiss, A.J.; Jiang, H.J. Overview of Clinical Conditions with Frequent and Costly Hospital Readmissions by Payer, 2018; Agency for Healthcare Research and Quality: Rockville, MD, USA, 2021.
  2. Liechti, F.D.; Bütikofer, L.; Mancinetti, M.; Leuppi, J.D.; Genné, D.; John, G.; Donzé, J.D. Factors associated with one-year mortality after hospital discharge: A multicenter prospective cohort study. PLoS ONE 2023, 18, e0288842. [Google Scholar] [CrossRef] [PubMed]
  3. Rubens, M.; Ramamoorthy, V.; Saxena, A.; Ruiz-Pelaez, J.G.; Ahmed, M.A.; Zhang, Z.; McGranaghan, P.; Chaparro, S.; Jimenez, J. Association Between Frailty, 30-day Unplanned Readmission and Mortality After Hospitalization for Heart Failure: Results From the Nationwide Readmissions Database. J. Aging Health 2023, 35, 08982643231152694. [Google Scholar] [CrossRef] [PubMed]
  4. Glans, M.; Kragh Ekstam, A.; Jakobsson, U.; Bondesson, Å.; Midlöv, P. Risk factors for hospital readmission in older adults within 30 days of discharge–a comparative retrospective study. BMC Geriatr. 2020, 20, 467. [Google Scholar] [CrossRef] [PubMed]
  5. Li, M.; Cheng, K.; Ku, K.; Li, J.; Hu, H.; Ung, C.O.L. Modelling 30-day hospital readmission after discharge for COPD patients based on electronic health records. NPJ Prim. Care Respir. Med. 2023, 33, 16. [Google Scholar] [CrossRef] [PubMed]
  6. Zhu, D.; Ding, R.; Ma, Y.; Chen, Z.; Shi, X.; He, P. Comorbidity in lung cancer patients and its association with hospital readmission and fatality in China. BMC Cancer 2021, 21, 557. [Google Scholar] [CrossRef] [PubMed]
  7. Bowles, K.H.; Murtaugh, C.M.; Jordan, L.; Barrón, Y.; Mikkelsen, M.E.; Whitehouse, C.R.; Chase, J.A.D.; Ryvicker, M.; Feldman, P.H. Sepsis survivors transitioned to home health care: Characteristics and early readmission risk factors. J. Am. Med. Dir. Assoc. 2020, 21, 84–90. [Google Scholar] [CrossRef] [PubMed]
  8. Deschepper, M.; Eeckloo, K.; Vogelaers, D.; Waegeman, W. A hospital wide predictive model for unplanned readmission using hierarchical ICD data. Comput. Methods Programs Biomed. 2019, 173, 177–183. [Google Scholar] [CrossRef] [PubMed]
  9. Lo, Y.T.; Liao, J.C.; Chen, M.H.; Chang, C.M.; Li, C.T. Predictive modeling for 14-day unplanned hospital readmission risk by using machine learning algorithms. BMC Med. Inform. Decis. Mak. 2021, 21, 288. [Google Scholar] [CrossRef]
  10. Mohanty, S.D.; Lekan, D.; McCoy, T.P.; Jenkins, M.; Manda, P. Machine learning for predicting readmission risk among the frail: Explainable AI for healthcare. Patterns 2022, 3, 100395. [Google Scholar] [CrossRef] [PubMed]
  11. Gruneir, A.; Dhalla, I.A.; van Walraven, C.; Fischer, H.D.; Camacho, X.; Rochon, P.A.; Anderson, G.M. Unplanned readmissions after hospital discharge among patients identified as being at high risk for readmission using a validated predictive algorithm. Open Med. 2011, 5, e104. [Google Scholar] [PubMed]
  12. Johnson, A.E.; Pollard, T.J.; Shen, L.; Lehman, L.w.H.; Feng, M.; Ghassemi, M.; Moody, B.; Szolovits, P.; Anthony Celi, L.; Mark, R.G. MIMIC-III, a freely accessible critical care database. Sci. Data 2016, 3, 160035. [Google Scholar] [CrossRef] [PubMed]
  13. Charlson, M.; Szatrowski, T.P.; Peterson, J.; Gold, J. Validation of a combined comorbidity index. J. Clin. Epidemiol. 1994, 47, 1245–1251. [Google Scholar] [CrossRef] [PubMed]
  14. D’Hoore, W.; Sicotte, C.; Tilquin, C. Risk adjustment in outcome assessment: The Charlson comorbidity index. Methods Inf. Med. 1993, 32, 382–387. [Google Scholar]
  15. Kingsford, C.; Salzberg, S.L. What are decision trees? Nat. Biotechnol. 2008, 26, 1011–1013. [Google Scholar] [CrossRef] [PubMed]
  16. Guo, G.; Wang, H.; Bell, D.; Bi, Y.; Greer, K. KNN model-based approach in classification. In Proceedings of the on the Move to Meaningful Internet Systems 2003: CoopIS, DOA, and ODBASE: OTM Confederated International Conferences, CoopIS, DOA, and ODBASE 2003, Catania, Sicily, Italy, 3–7 November 2003; Springer: Berlin/Heidelberg, Germany, 2003; pp. 986–996. [Google Scholar]
  17. Friedman, J.H. Stochastic gradient boosting. Comput. Stat. Data Anal. 2002, 38, 367–378. [Google Scholar] [CrossRef]
  18. Chen, T.; Guestrin, C. Xgboost: A scalable tree boosting system. In Proceedings of the 22nd ACM Sigkdd International Conference on Knowledge Discovery and Data Mining, San Francisco, CA, USA, 13–17 August 2016; ACM: New York, NY, USA, 2016; pp. 785–794. [Google Scholar]
  19. Liu, Y.; Wang, Y.; Zhang, J. New machine learning algorithm: Random forest. In Proceedings of the Information Computing and Applications: Third International Conference, ICICA 2012, Chengde, China, 14–16 September 2012; Proceedings 3; Springer: Berlin/Heidelberg, Germany, 2012; pp. 246–252. [Google Scholar]
  20. Semenick, D. Tests and measurements: The T-test. Strength Cond. J. 1990, 12, 36–37. [Google Scholar] [CrossRef]
Figure 1. Hospital admission types’ rate in MIMIC-III database.
Biomedinformatics 04 00014 g001
Figure 2. Primary diagnosis of readmitted patients.
Biomedinformatics 04 00014 g002
Figure 3. Pie chart of the top 10 diagnoses with the highest readmission rates.
Biomedinformatics 04 00014 g003
Figure 4. Bar plot of the top 10 most frequent diseases among the reported admissions.
Biomedinformatics 04 00014 g004
Figure 5. Bar plot of disease features that could have an impact on the readmission rate.
Biomedinformatics 04 00014 g005
Figure 6. Distribution plots for continuous variables (age, LOS and comorbidity score). The two lines in the figures represent the distribution of the readmission and no readmission data for the age and LOS variables represented by Figure 1 and Figure 2 respectively.
Biomedinformatics 04 00014 g006
Figure 7. Confusion matrix of Gradient Boosting model without feature selection.
Biomedinformatics 04 00014 g007
Figure 8. Precision–recall curve of Gradient Boosting model without feature selection.
Biomedinformatics 04 00014 g008
Figure 9. Confusion matrix of Gradient Boosting model using clinical variables.
Biomedinformatics 04 00014 g009
Figure 10. Confusion matrix of Gradient Boosting model with demographic variables.
Biomedinformatics 04 00014 g010
Figure 11. Precision–recall curve of Gradient Boosting model with demographic variables.
Biomedinformatics 04 00014 g011
Figure 12. Precision–recall curve of Gradient Boosting model with top 15 features.
Biomedinformatics 04 00014 g012
Table 1. Data analysis of MIMIC-III database and comparison between readmitted and not readmitted patients.
VariablesAll (%)Readmitted (%)Not Readmitted (%)
Gender
Male2140 (56%)1083 (56.67%)1057 (55.31%)
Female1682 (44%)828 (43.32%)854 (44.68%)
Age (years)
Mean63.4064.2862.52
Median666665
LOS (days)
Mean11.0511.8510.26
Median8.389.487.18
NoH-12
No1775 (46.44%)-1775 (92.89%)
1–31831 (47.90%)1697 (88.80%)134 (7.01%)
4+216 (5.65%)214 (11.20%)2 (0.1%)
Comorbidity (CCI)
No1042 (27.26%)276 (14.44%)766 (40.08%)
1–21082 (28.3%)496 (25.58%)586 (30.65%)
3–4978 (25.58)621 (32.48%)357 (18.68%)
5+720 (18.83%)518 (27.10%)202 (10.57%)
Table 2. Overview of all models for readmission prediction and comparative results with and without feature selection.
ModelAverage PrecisionROC-AUC
With all features
KNN80.1%74.3%
Decision Tree95.6%96.9%
Random Forests94%96.4%
Gradient Boosting95.6%97.3%
XGBoost95.3%97.3%
With clinical predictors
KNN76.7%72%
Decision Tree74.5%71.5%
Random Forests76%75.2%
Gradient Boosting80.4%83.7%
XGBoost77.9%80.1%
With administrative predictors
KNN94.4%94.6%
Decision Tree95.1%96.9%
Random Forests93.7%96.5%
Gradient Boosting95.9%97.6%
XGBoost95.3%97.5%
With statistical feature selection (K = 20)
KNN84.8%79.1%
Decision Tree95.4%96.3%
Random Forests93.2%96.2%
Gradient Boosting95.2%97.4%
XGBoost93.8%96.9%
With statistical feature selection (K = 15)
KNN85.9%81.6%
Decision Tree96.4%96.3%
Random Forests93.4%96.3%
Gradient Boosting94.7%97.3%
XGBoost94.4%97.1%
With statistical feature selection (K = 10)
KNN88.4%83.8%
Decision Tree95.4%96.3%
Random Forests94.4%96.6%
Gradient Boosting95.6%97.5%
XGBoost94.8%97.4%
With statistical feature selection (K = 5)
KNN94.0%95.7%
Decision Tree95.5%96.7%
Random Forests94.1%96.2%
Gradient Boosting95.3%97.2%
XGBoost94.7%97.0%
Table 3. Features selected as best predictors for hospital-readmission prediction.
Variablesp-Value
Number of hospital admissions 1.40 × 10 225
Hyperosmolarity 4.83 × 10 104
Charlson Comorbidity Index 5.79 × 10 89
Respiratory failure 3.29 × 10 88
Renal disease 2.72 × 10 84
Anemia 4.65 × 10 82
Circulatory system disease 1.29 × 10 79
Pneumonia 5.19 × 10 73
Urinary infection 1.885 × 10 60
Heart disease 2.59 × 10 57
Septicemia 1.22 × 10 57
Coagulation disorder 1.58 × 10 43
Pulmonary circulation disease 5.56 × 10 37
Intestinal disease 5 × 10 37
Hypertensive chronic kidney disease 4.22 × 10 36
Chronic rheumatic heart disease 1.27 × 10 28
Fluid disorder 1.17 × 10 26
Table 4. Performance of top selected features and administrative data without the “Number of Hospital admissions”.
ModelAverage PrecisionROC-AUC
With statistical feature selection (K = 15)
KNN77.8%73.6%
Decision Tree76.1%70.8%
Random Forests72.4%71.0%
Gradient Boosting81.6%83.4%
XGBoost79.1%80.1%
With administrative features
KNN63.0%64.5%
Decision Tree65.2%67.3%
Random Forests60.8%62.1%
Gradient Boosting65.1%71.2%
XGBoost63.1%68.1%
Disclaimer/Publisher’s Note: The statements, opinions and data contained in all publications are solely those of the individual author(s) and contributor(s) and not of MDPI and/or the editor(s). MDPI and/or the editor(s) disclaim responsibility for any injury to people or property resulting from any ideas, methods, instructions or products referred to in the content.

