Article

Depleted-MLH1 Expression Predicts Prognosis and Immunotherapeutic Efficacy in Uterine Corpus Endometrial Cancer: An In Silico Approach

1
Institute of Biopharmaceutical and Health Engineering, Tsinghua Shenzhen International Graduate School, Tsinghua University, Shenzhen 518055, China
2
Tsinghua Berkeley Shenzhen Institute, Tsinghua Shenzhen International Graduate School, Tsinghua University, Shenzhen 518055, China
*
Authors to whom correspondence should be addressed.
These authors contributed equally to this work.
BioMedInformatics 2024, 4(1), 326-346; https://doi.org/10.3390/biomedinformatics4010019
Submission received: 11 December 2023 / Revised: 8 January 2024 / Accepted: 22 January 2024 / Published: 1 February 2024
(This article belongs to the Special Issue Feature Papers in Computational Biology and Medicine)

Abstract

:
Uterine corpus endometrial carcinoma (UCEC) poses significant clinical challenges due to its high incidence and poor prognosis, exacerbated by the lack of effective screening methods. The standard treatment for UCEC typically involves surgical intervention, with radiation and chemotherapy as potential adjuvant therapies. In recent years, immunotherapy has emerged as a promising avenue for the advanced treatment of UCEC. This study employs a multi-omics approach, analyzing RNA-sequencing data and clinical information from The Cancer Genome Atlas (TCGA), Gene Expression Profiling Interactive Analysis (GEPIA), and GeneMANIA databases to investigate the prognostic value of MutL Homolog 1 (MLH1) gene expression in UCEC. The dysregulation of MLH1 in UCEC is linked to adverse prognostic outcomes and suppressed immune cell infiltration. Gene Set Enrichment Analysis (GSEA) data reveal MLH1’s involvement in immune-related processes, while its expression correlates with tumor mutational burden (TMB) and microsatellite instability (MSI). Lower MLH1 expression is associated with poorer prognosis, reduced responsiveness to Programmed cell death protein 1 (PD-1)/Programmed death-ligand 1 (PD-L1) inhibitors, and heightened sensitivity to anti-cancer agents. This comprehensive analysis establishes MLH1 as a potential biomarker for predicting prognosis, immunotherapy response, and drug sensitivity in UCEC, offering crucial insights for the clinical management of patients.

Graphical Abstract

1. Introduction

Uterine cancer can develop in the uterus’s inner lining (endometrium) or the uterine muscle layer (myometrium). Adenocarcinomas, which arise from the endometrium, and sarcomas, which arise from the myometrium, are the two types of uterine cancer [1]. Both types are managed differently; nevertheless, adenocarcinomas are more common, ranging from 70 to 80%. Endometrium cancer (EC) is a common malignancy, but its prevalence varies by region [2]. It is the sixth most common type of cancer in women and the 15th most common cancer worldwide, also known as womb or corpus uteri cancer. With a global incidence of 1.3% every year from 2007 to 2016, uterine corpus endometrial carcinoma (UCEC) is one of the most common and deadly gynecologic cancers. In the United States, 66,570 estimated new cases and 12,940 estimated deaths from UCEC were reported in 2020 [3,4,5]. UCEC is the second most frequent gynecologic cancer in China [6]. All-stage patients have a 5-year relative survival rate of about 81% [7]. However, individuals with distant metastases from UCEC still have a dismal prognosis; as little as 16% of them will survive for five years [5].
The lack of significant advancements in the treatment for individuals with recurrent and metastatic UCEC is partly responsible for the unchanging survival rate [8]. Finding new and effective biomarkers is therefore essential for targeted and prognosis evaluation of UCEC. Metastatic endometrial cancer patients have diverse treatment options contingent on their health status, tumor attributes, and prior therapies [9]. Standard chemotherapy regimens, typically including Paclitaxel and Carboplatin, have shown a median overall survival period of approximately 12 to 18 months [10]. Targeted therapies such as Enviroximes and hormonal treatments can be used to address specific molecular alterations, leading to extended progression-free survival [11]. Immunotherapy shows promise, particularly for patients with microsatellite instability-high (MSI-H) or mismatch repair-deficient (dMMR) tumors, offering the potential for lasting responses and long-term survival [12]. Hormone therapy, primarily tailored to hormone receptor-positive cases, contributes to tumor regression and stability, potentially extending survival by several months [13]. Combination therapies can synergistically enhance treatment efficacy and survival rates by incorporating a personalized approach that takes into account individual patient and tumor characteristics [14]. However, metastatic tumors often demonstrate a remarkable capacity to adapt and evolve, resulting in resistance to various treatment modalities. This presents a significant challenge in effectively treating metastatic UCEC [15].
The challenge of drug resistance emerges in treating UCEC, characterized by a spectrum of molecular and genetic attributes [16]. This diversity translates into heterogeneous responses to treatments and the emergence of drug resistance across distinct tumor sub-types [17]. Hormonal therapies, frequently employed for oestrogen receptor-positive tumors, may eventually encounter resistance, mirroring similar scenarios with chemotherapy and targeted therapies exploiting specific molecular anomalies [18]. While holding promise, immunotherapy confronts obstacles in the form of immune evasion and shifts within the tumor microenvironment [19].
Genetic mutations, exemplified by gene alterations like phosphatase and tensin homolog (PTEN) and tumor protein p53 (TP53), contribute to treatment resistance by influencing pivotal cellular signaling and DNA repair mechanisms [19]. The presence of intratumoral heterogeneity fosters the survival of drug-resistant cell populations, complemented by adaptive signaling and microenvironmental factors that bolster cancer cell resilience against therapy-induced stress [20]. The absence of dependable predictive biomarkers further compounds the complexity, hampering personalized treatment approaches [21]. Nevertheless, ongoing research endeavors and clinical trials are dedicated to deciphering the intricate mechanisms of drug resistance, forging innovative strategies to surmount this challenge, and enhancing outcomes for individuals grappling with UCEC.
Epigenetic modifications have considerable influence over therapy resistance, extending their impact across diverse cancer types, including UCEC [22,23]. These modifications encompass alterations in DNA and associated histone proteins, orchestrating nuanced shifts in gene expression without altering the core genetic code [24]. This dynamic in gene regulation and chromosome organization plays a significant role in undermining the effectiveness of therapeutic interventions. Epigenetic modifications foster resistance mechanisms through a multifaceted spectrum by influencing fundamental aspects of cellular behavior. Alterations in the transcriptome, transcription factors, DNA, and chromatin regulatory proteins contribute to resistance against targeted therapeutic agents [25]. Epigenetic modifications can disrupt drug targets, thereby reducing the effectiveness of targeted therapies. In tandem, they can activate survival pathways that strengthen cancer cells against the onslaught of treatment-induced cell death [26]. Additionally, epigenetic changes mastermind epithelial-mesenchymal transition (EMT), facilitating heightened invasiveness and rendering cells more impervious to therapeutic actions [27]. By influencing DNA repair pathways, these modifications amplify the cell’s aptitude to mend damage inflicted by treatment modalities, thereby enhancing cell survival [28]. Epigenetically driven cancer stem cells, equipped with heightened resilience, weather treatment challenges and propagate disease resurgence [29]. The pliability and adaptability stemming from these epigenetic changes contribute to the intricate tapestry of intratumoral heterogeneity, underscoring subsets of cells that prove impervious to therapeutic interventions [30]. Furthermore, the intricate dance between epigenetics and the tumor microenvironment introduces additional layers of intricacy, shaping responses to therapeutic regimens [31]. The convergence of these factors underscores the potential of epigenetic changes to serve as discerning biomarkers, portending resistance patterns. The reversible nature of select epigenetic modifications lights the prospect of therapeutic interventions that recalibrate sensitivity to treatment modalities. Collectively, unraveling these intricate epigenetic dynamics and strategizing countermeasures emerge as a pivotal endeavor in the ceaseless quest to surmount therapy resistance and amplify outcomes for cancer patients [32].
In the context of enhancing the treatment landscape for UCEC patients, in silico analysis plays a pivotal role, encompassing computer-based modeling and data analysis [33]. This approach offers valuable insights into the interplay between epigenetic changes and therapeutic responses [34]. It proves instrumental in uncovering the intricate mechanisms that underlie the impact of epigenetics on treatment effectiveness and resistance [35]. This analysis reveals correlations between specific epigenetic modifications and treatment responses by skillfully integrating diverse omics data ranging from epigenomic profiles to clinical outcomes [36]. Additionally, rooted in computational data mining, predictive modeling allows for projections regarding the potential influence of distinct epigenetic alterations on treatment outcomes, offering indispensable insights [37]. Acting as a catalyst, in silico analysis identifies potential epigenetic biomarkers indicative of treatment response or resistance, thus guiding the shaping of tailored treatment strategies [38].
Furthermore, computational analysis delves into pathways influenced by epigenetic changes, untangling the intricate mechanistic connections that interweave epigenetics with the development of treatment resistance [39]. By merging patient-specific epigenetic data with information on treatment responses, this approach forges pathways to personalized treatment. The power of virtual clinical trials, powered by computational simulations, enables meticulous examination of treatment strategies, optimizing designs prior to implementation in the clinic [40]. Altogether, in silico analysis bridges the gap between epigenetics and patient treatment complexities, steering therapeutic efforts toward heightened precision and efficacy [41]. Given the aforementioned factors, this study hypothesizes that DNA methylation can serve as a predictive indicator for both prognosis and the effectiveness of immunotherapy with immunological activity in patients with UCEC. Therefore, we attempted to construct distinctive and precise models by conducting a multi-omics characteristic analysis based on DNA methylation to improve the evaluation of prognosis and treatment decision-making for UCECs.
Here, we integrated multi-omics data from 513 patients across five cancer types from the Clinical Proteomic Tumor Analysis Consortium (CPTAC) [42], encompassing 513 patients with five distinct types of cancer, and we methodically investigated the effects of aberrant DNA methylation events on information flow, characteristics, and functional implications. Our investigation revealed both widespread and tissue-specific epigenetic changes, including notable modifications in cancer genes that impact signature pathways. Specific methylation patterns identified distinct cancer subtypes, which were corroborated by RNA and protein signatures, indicating the biological traits of each subtype. Moreover, we identified putative druggable genes tightly regulated by DNA methylation, offering potential targets for tailored therapeutic interventions. Among the outputs, the focus of this article is on the study of MutL Homolog 1 (MLH1) in UCEC. It is identified that in UCEC, MLH1 expression is the most notable druggable target biomarker. The analysis demonstrated that MLH1 was expressed throughout the entire progression of UCEC.

2. Results

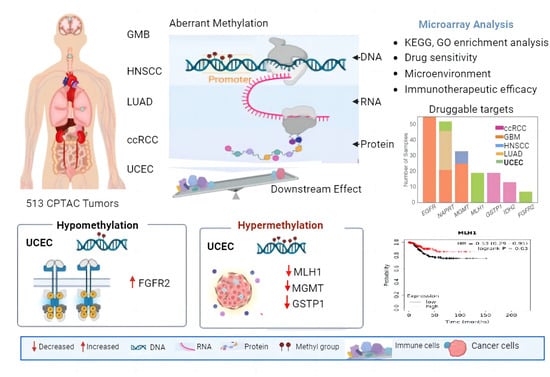
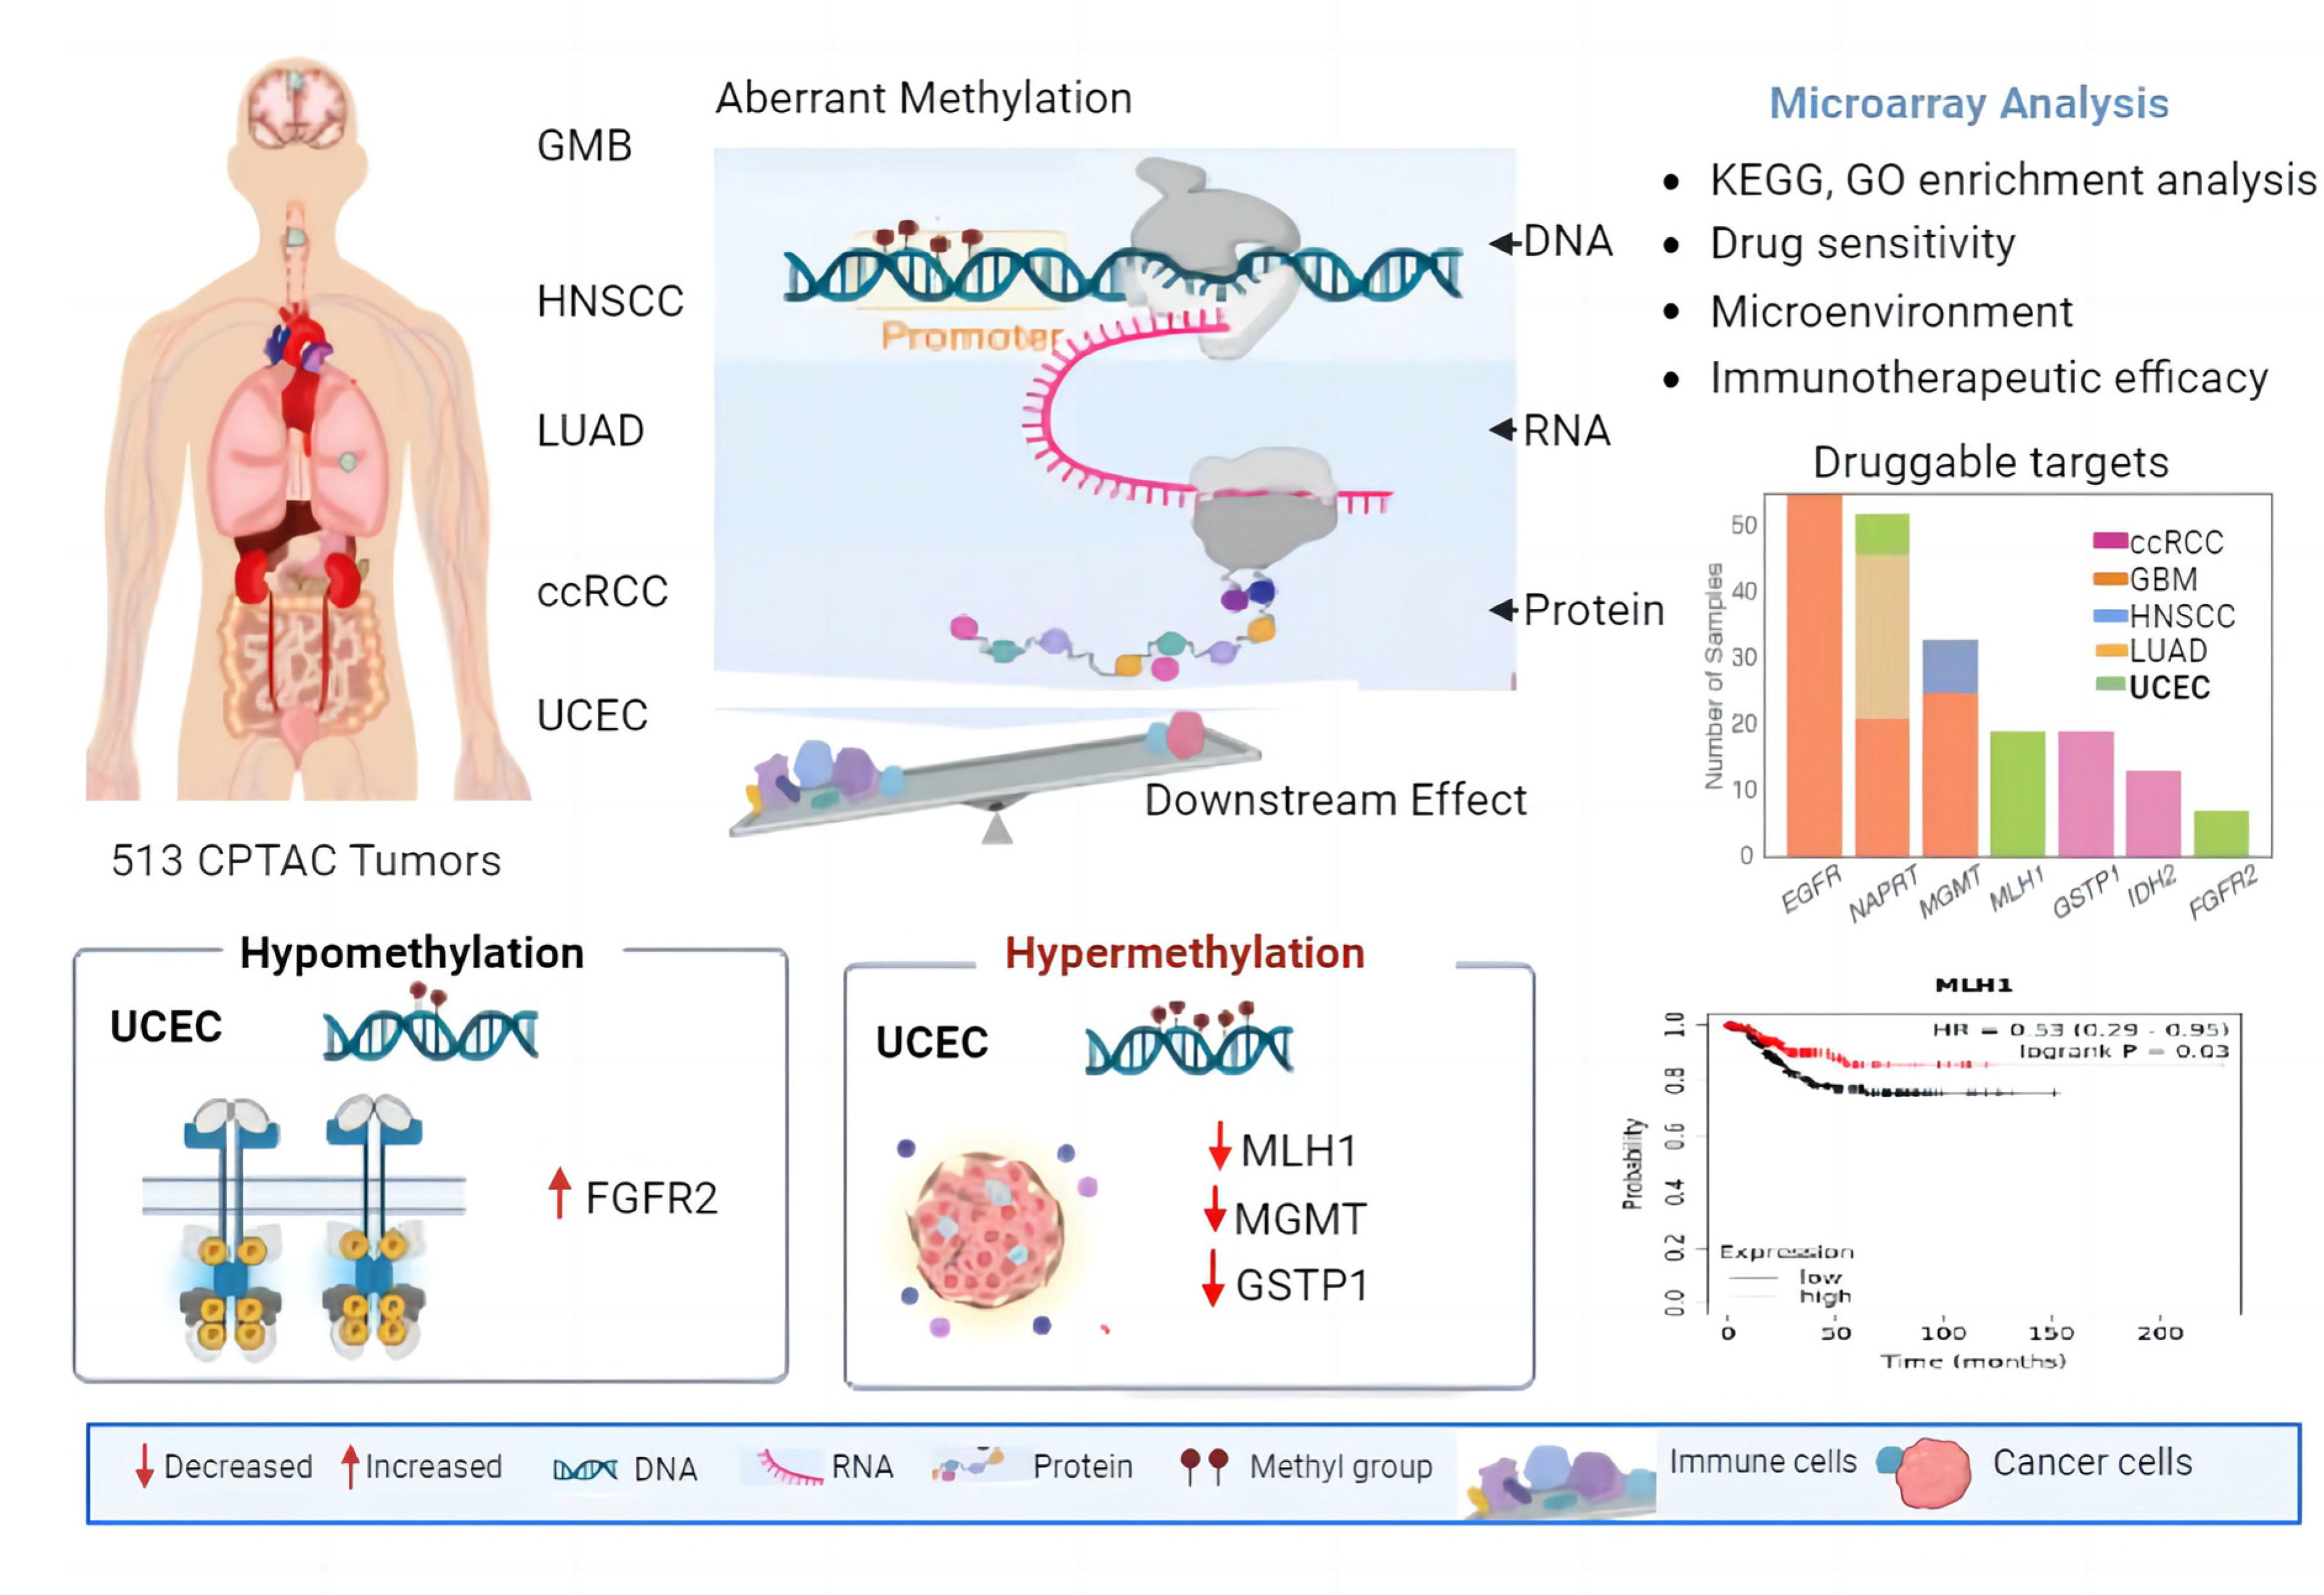
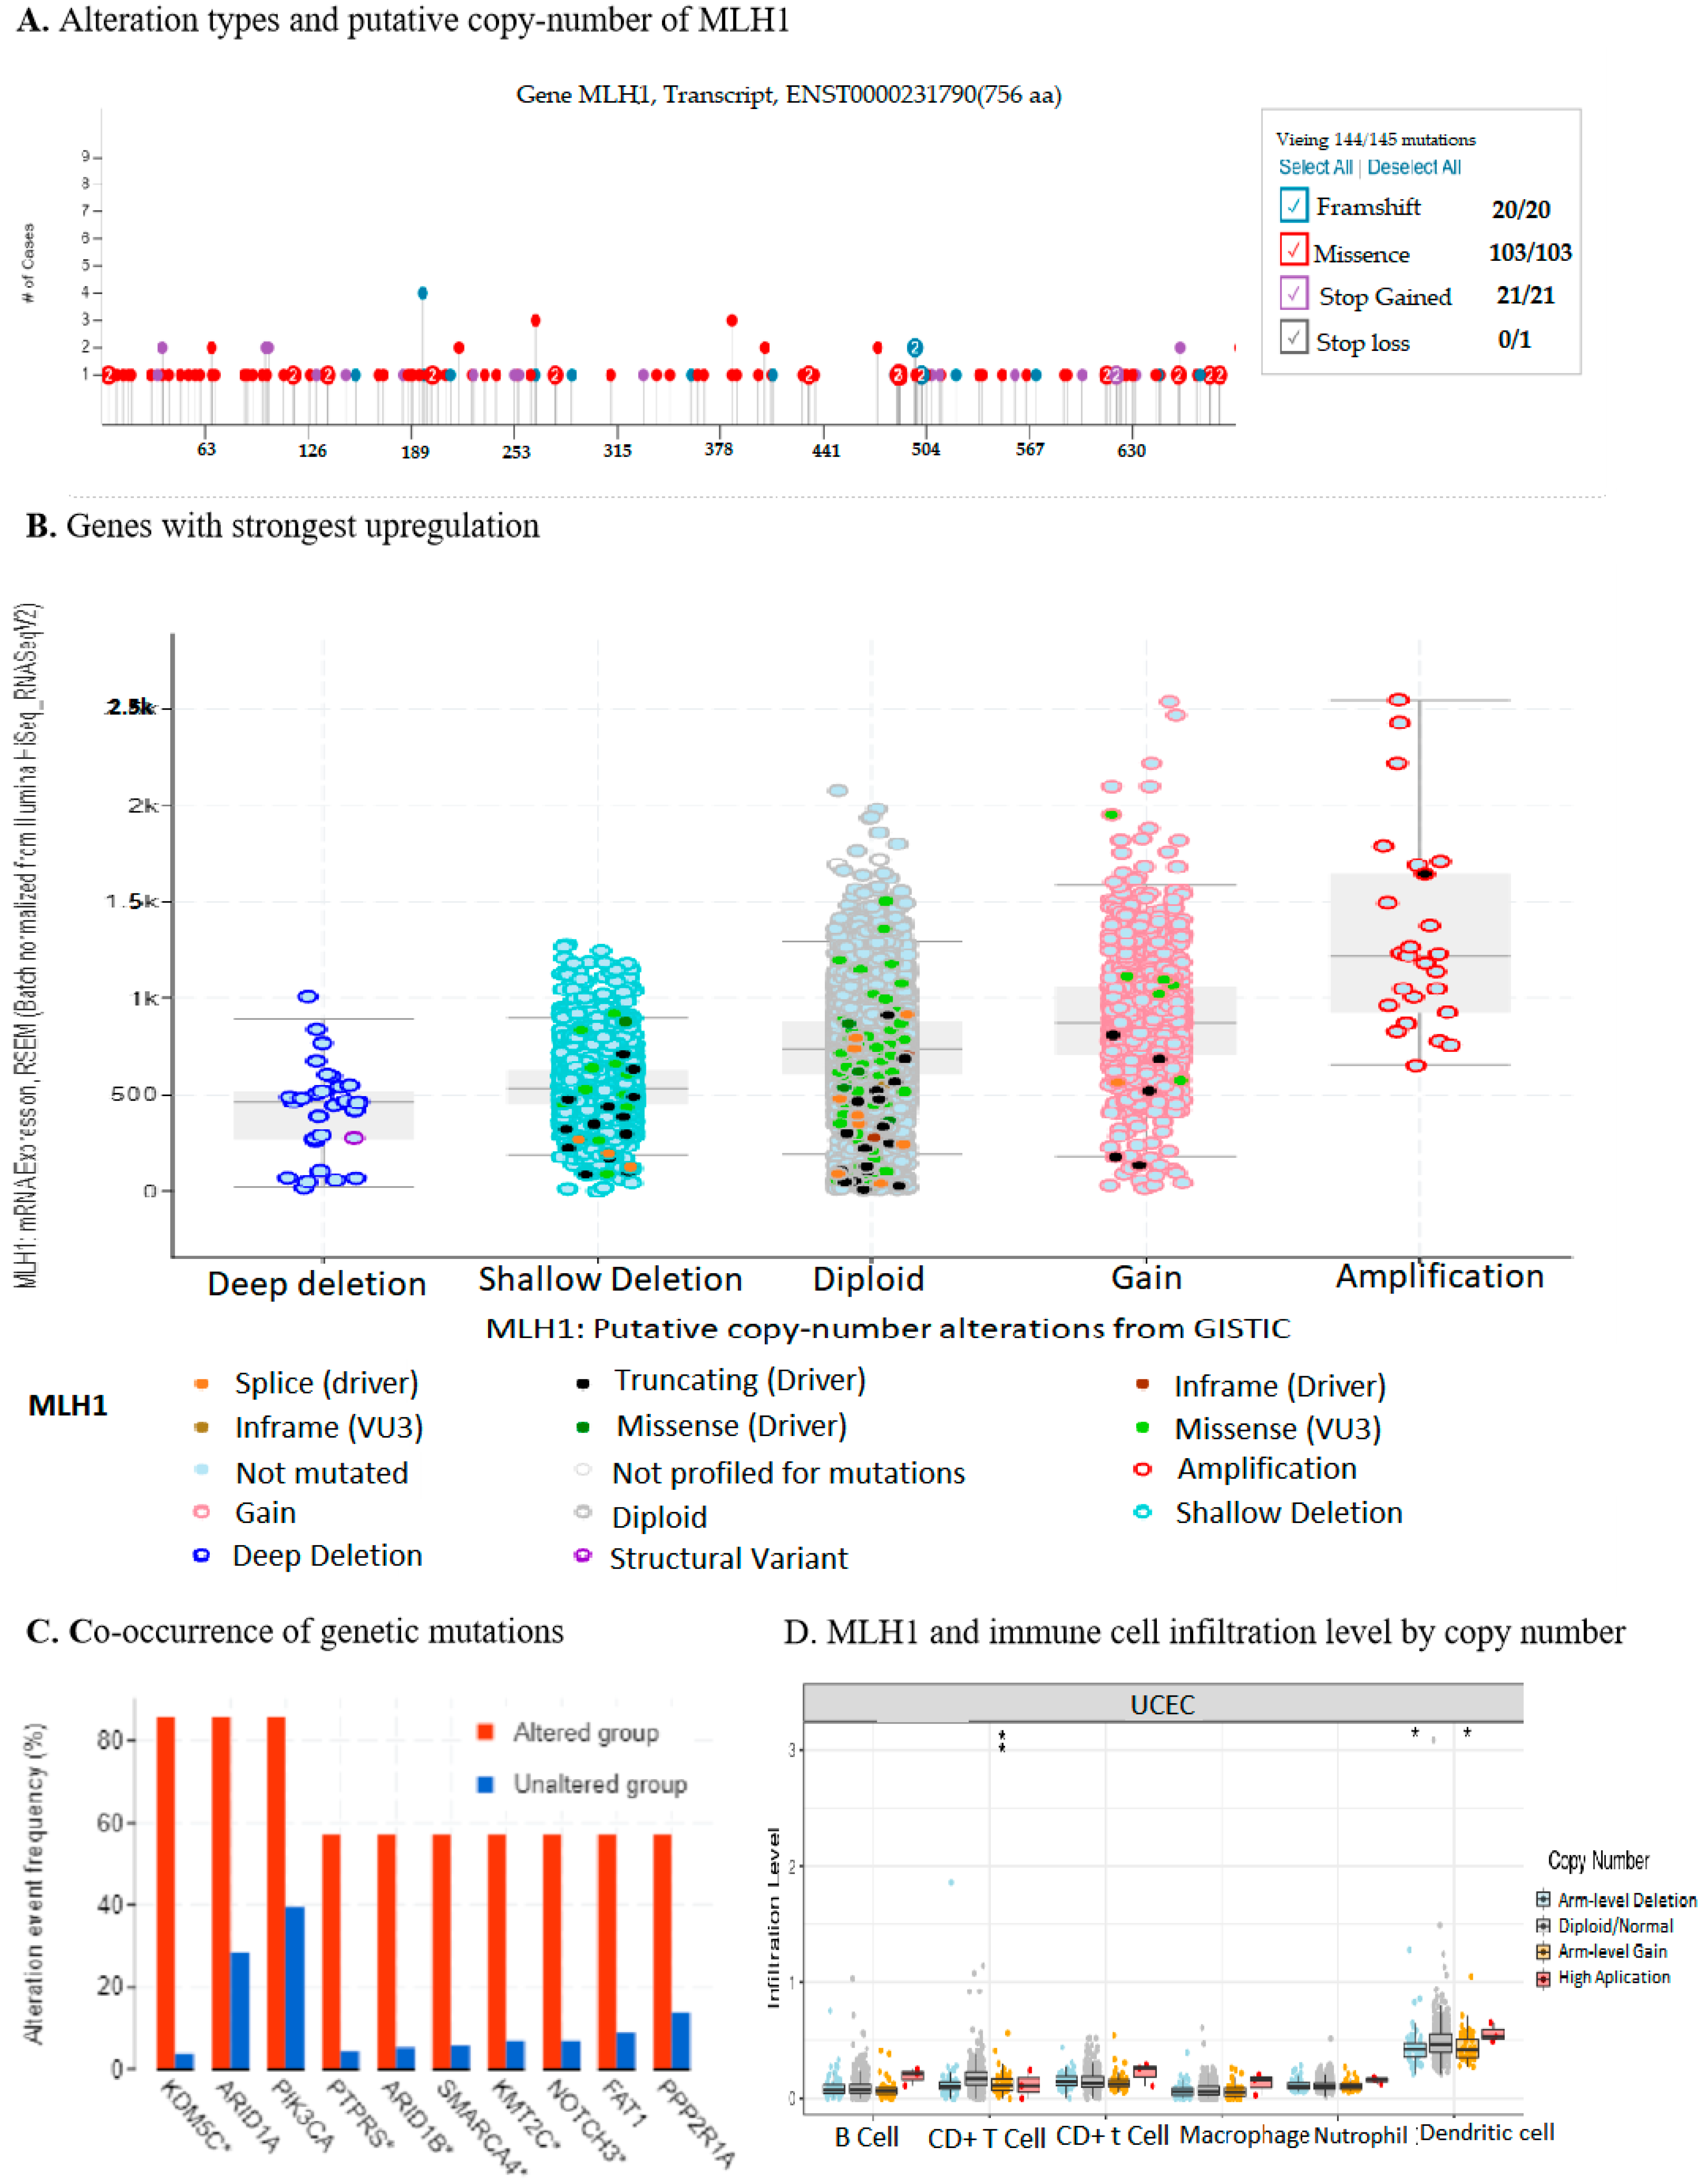
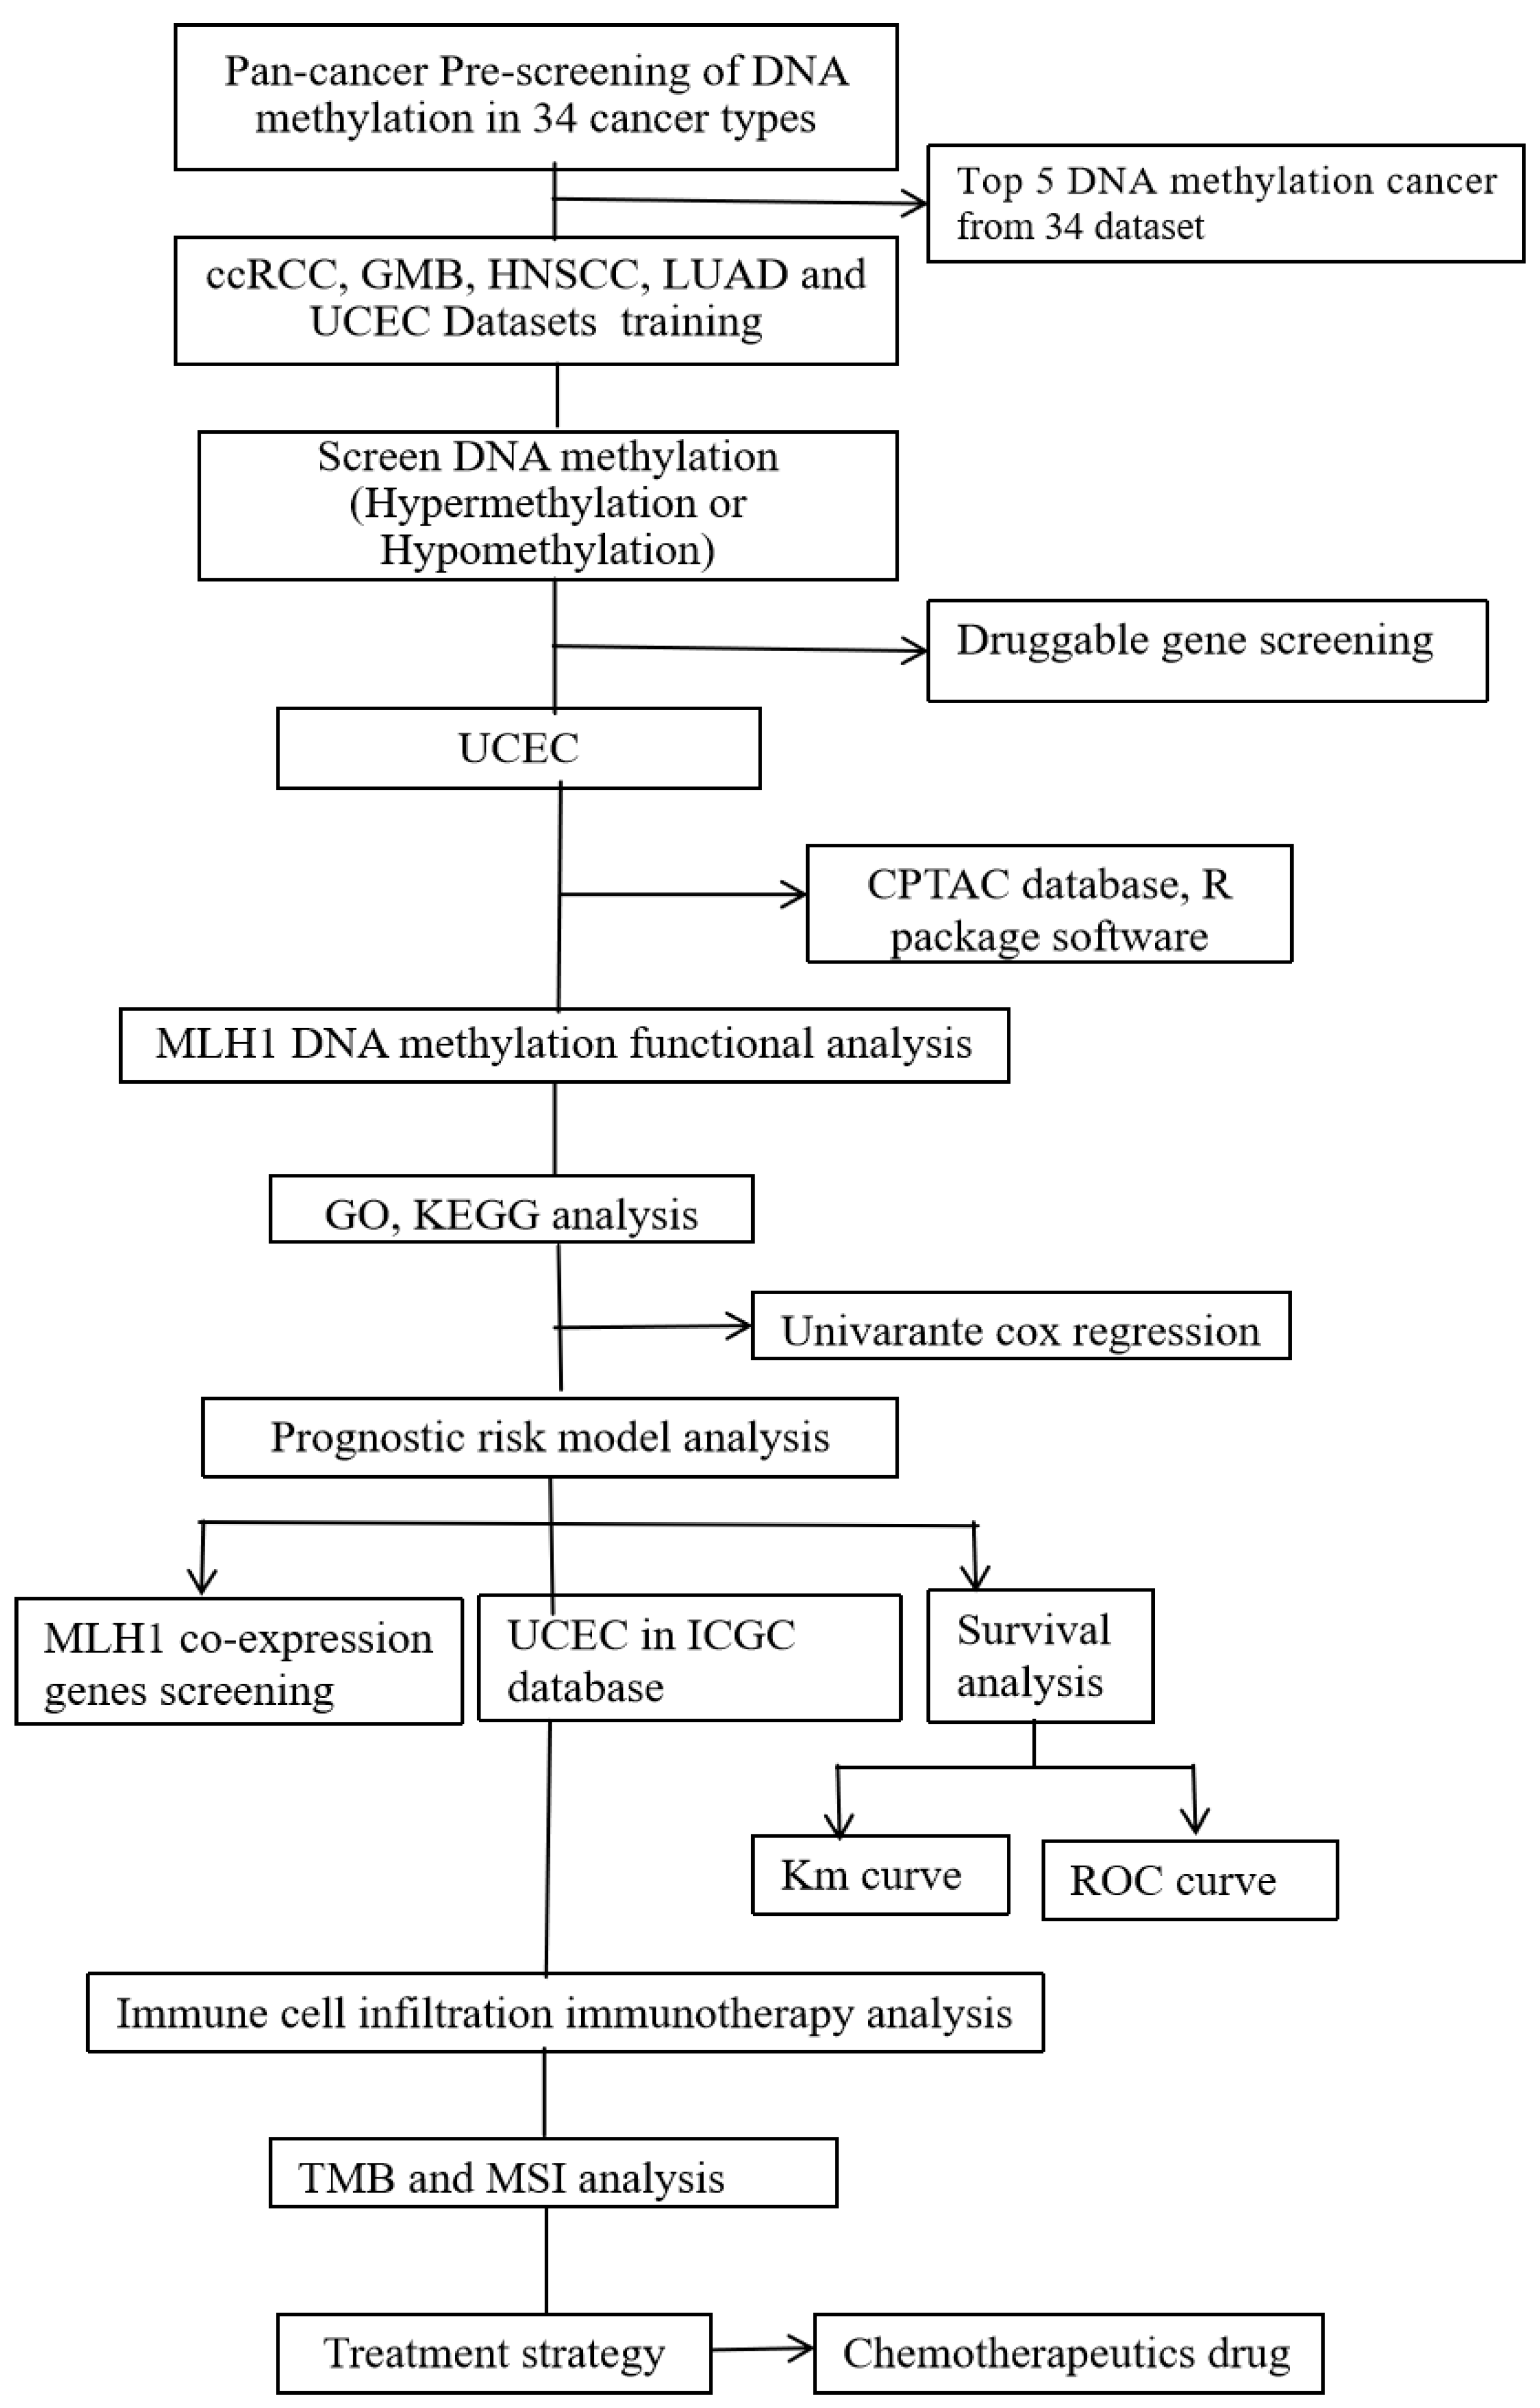
2.1. Multi-Omics Approach Identified MLH1 as a Druggable Target in UCEC

The methylome, transcriptome, and proteome are intricately linked through epigenetic regulation, offering promising potential for the discovery of actionable biomarkers [43]. To obtain a comprehensive understanding of the integrated landscape in different types of cancers, we initially extracted methylome data from the Clinical Proteomic Tumor Analysis Consortium (CPTAC) pan-cancer datasets (Figure 1A). By assessing the correlation between global methylation levels with both mortality and morbidity, the top five cancer types exhibiting the most promising potential for uncovering druggable markers via an integrated omics approach were identified. These cancer types were clear cell renal cell carcinoma (ccRCC), glioblastoma (GBM), head and neck squamous cell carcinoma (HNSCC), lung adenocarcinoma (LUAD), and uterine corpus ndometrial carcinoma (UCEC) (Figure 1A). To construct the integrating-omics landscape for these selected cancers, correlation analyses between methylation and mRNA or protein levels were conducted. In general, positive correlations between global methylation and the expression levels of mRNA or protein were observed (Figure 1A). For biomarkers with consistent transcription–translation patterns associated with both hypermethylation or hypomethylation, 382 biomarkers exhibited consistencies with hypermethylation and 83 biomarkers with hypomethylation (Figure 1B). Considering the significant influences of hypermethylation in gene promoter CpG island toward tumor progression compared to other methylation types [44], biomarkers with hypermethylation in promoter CpG were filtered from the above 382 + 83 consistent biomarkers in ccRCC, GBM, HNSCC, LUAD, and UCEC. Therefore, biomarkers with significant (−logFDR (False Discovery Rate) < 1) expression alternation induced by promoter CpG hypermethylation were highlighted (Figure 1C and Figure S1A). To identify druggable biomarkers within these biomarkers of selected cancers, a CIViC (Clinical Interpretation of Variants in Cancer) analysis was conducted, revealing notable candidates. In ccRCC, the druggable biomarkers included GSTP1 and IDH2, while in GBM, the featured biomarkers were EGFR, NAPRT, and MGMT. HNSCC exhibited MGMT as a target for drug therapy, while LUAD showcased NAPRT. UCEC stood out with NAPRT, MLH1, and FGFR2 (Figure 1D). Among the outputs, the focus of this article is on the study of MLH1 in UCEC. It is identified that in UCEC, MLH1 expression is the most notable druggable target biomarker. The analysis demonstrated that MLH1 was expressed throughout the entire progression of UCEC (Supplementary Figure S1B) and in both normal and tumor tissues (Supplementary Figure S1C).

2.2. MLH1 Depletion in UCEC Positively Correlated with Poorer OS and DFS

To assess the prognostic significance in UCEC, TCGA-UCEC cases were divided into two groups based on MLH1 expression: high MLH1 expression and low MLH1 expression, using the mean as the cutoff. Comparison in overall survival (OS) and disease-free survival (DFS) of high- and low- MLH1-expression groups was subsequently performed using Kaplan–Meier (KM) curves based on TCGA clinical information. These curves revealed that high MLH1 expression was significantly favorable for overall survival (OS) in UCEC (p = 0.049) (Figure 1E). Likewise, the DFS analysis demonstrated that high MLH1 expression led to significantly longer disease-free survival times (p = 0.03) (Figure 1F). Conclusively, decreased MLH1 expression gives rise to poorer OS (Figure 1E) and disease-free survival (Figure 1F) in UCEC.

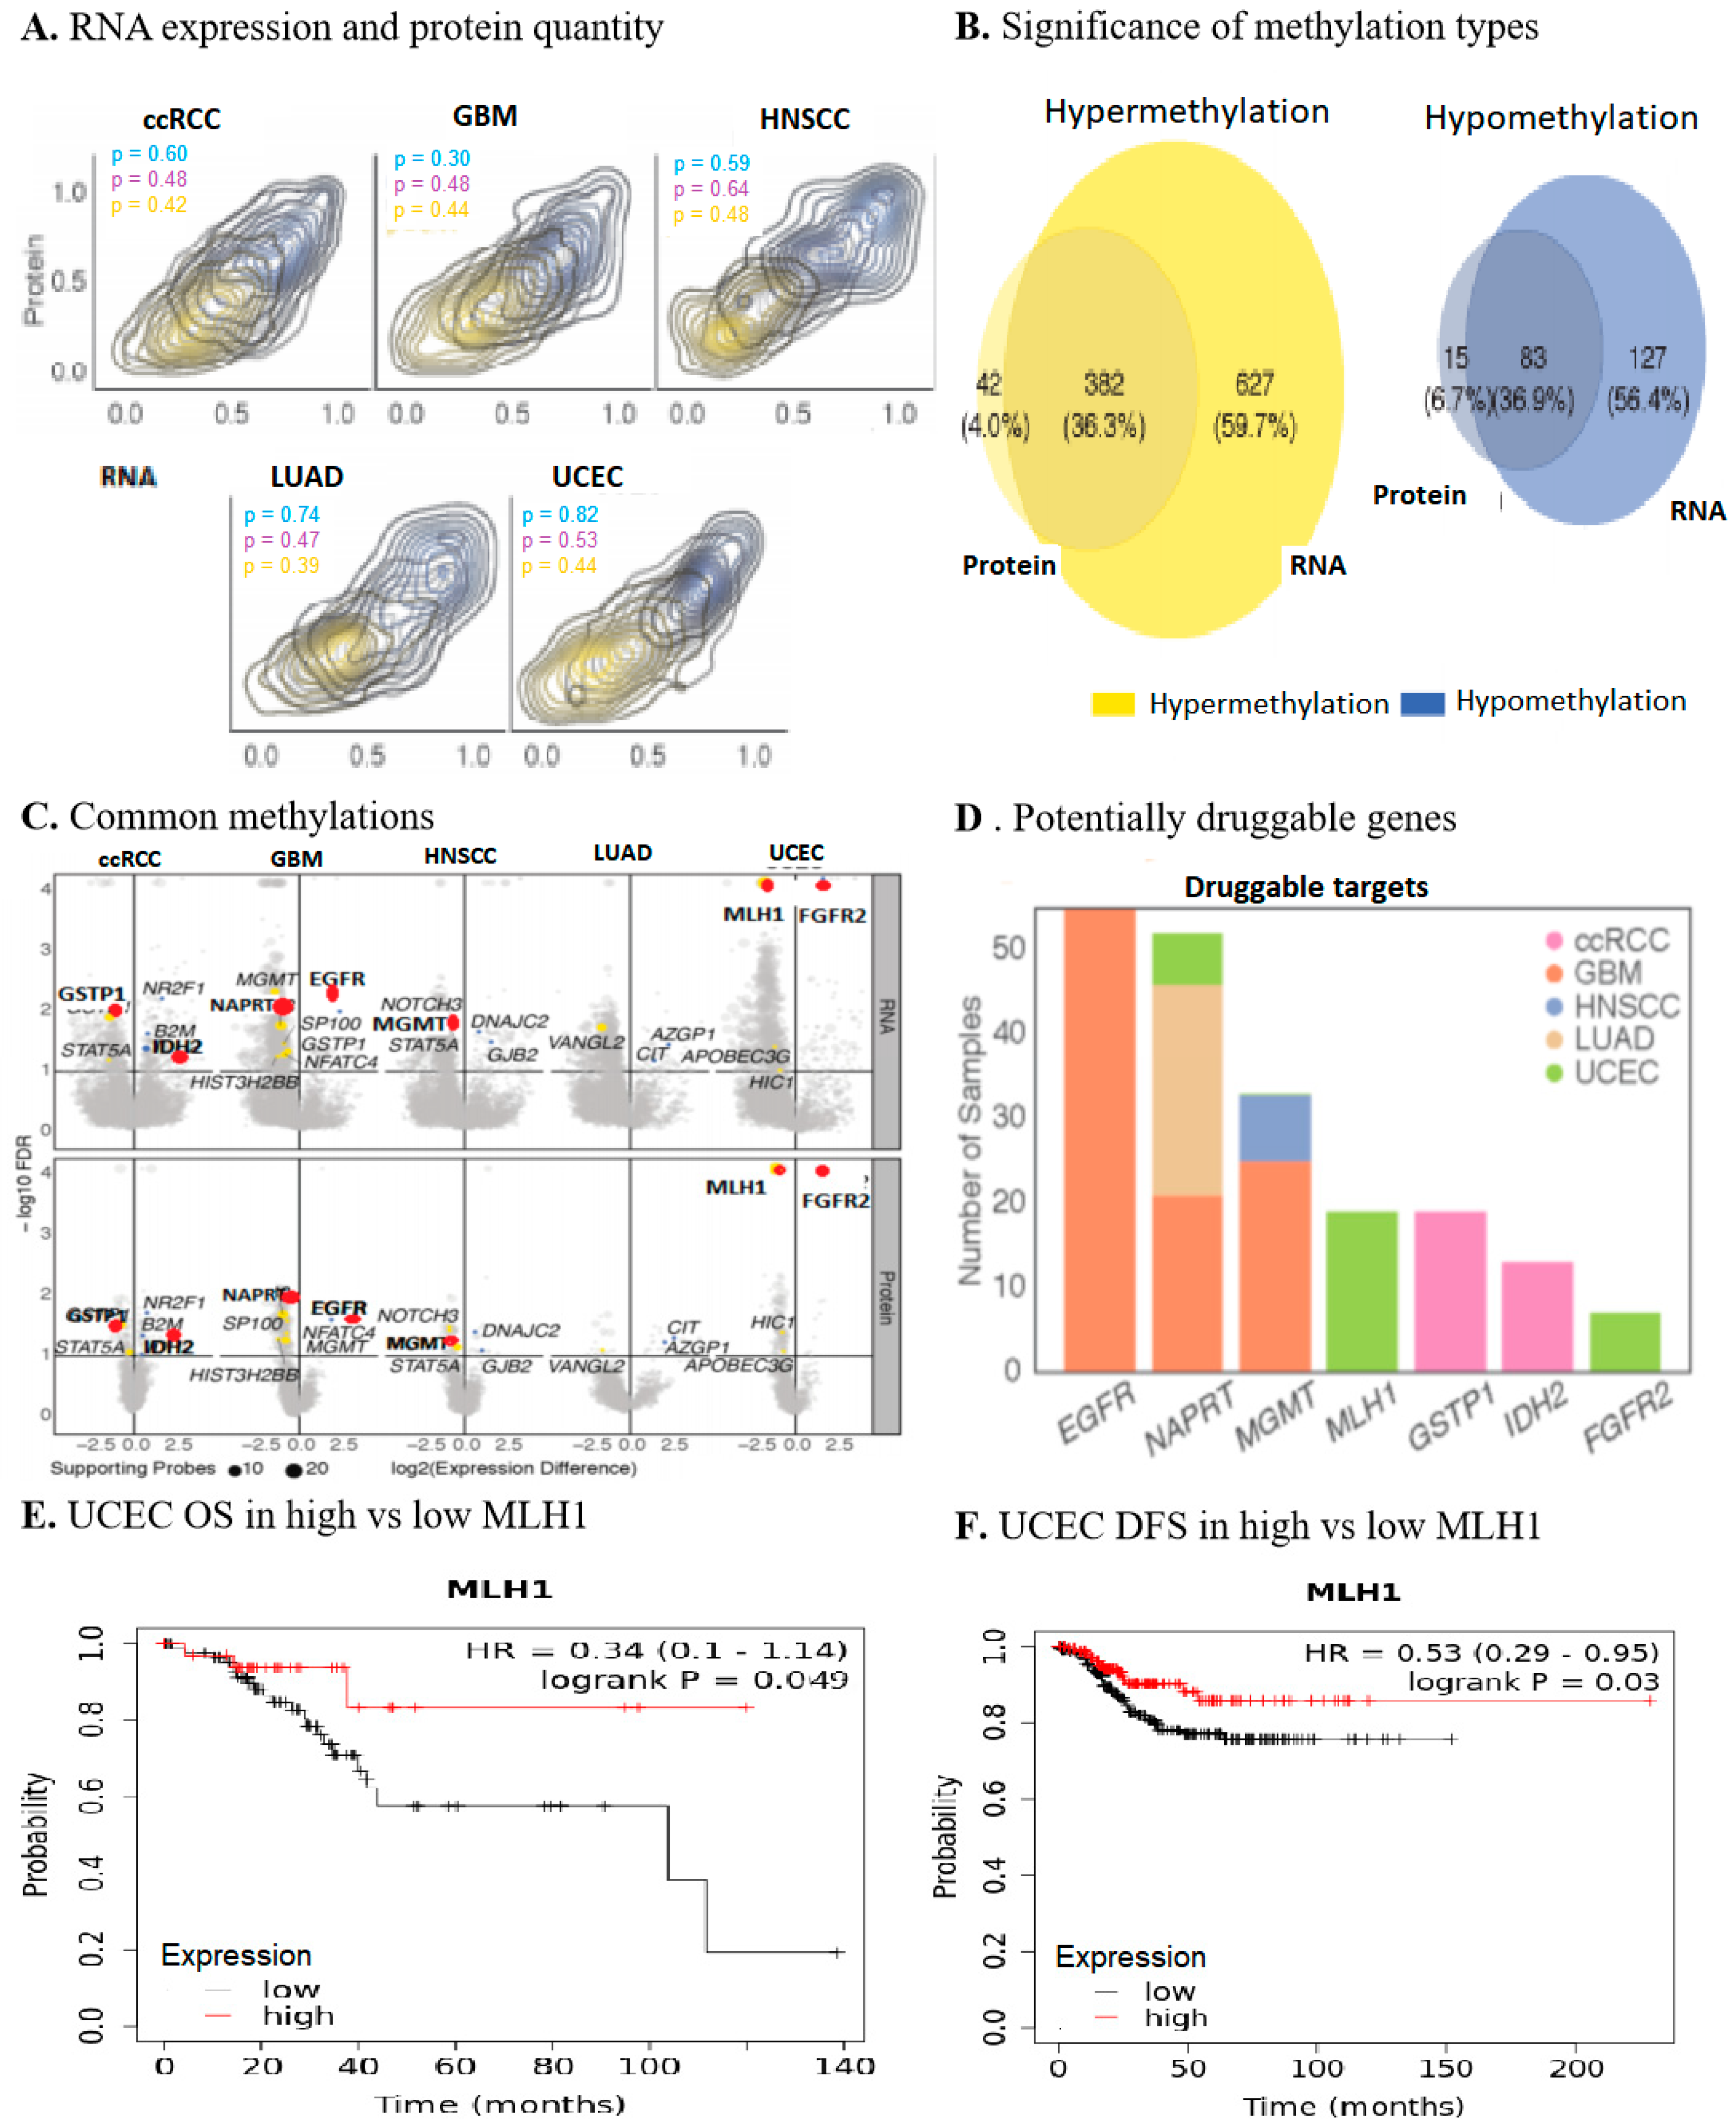
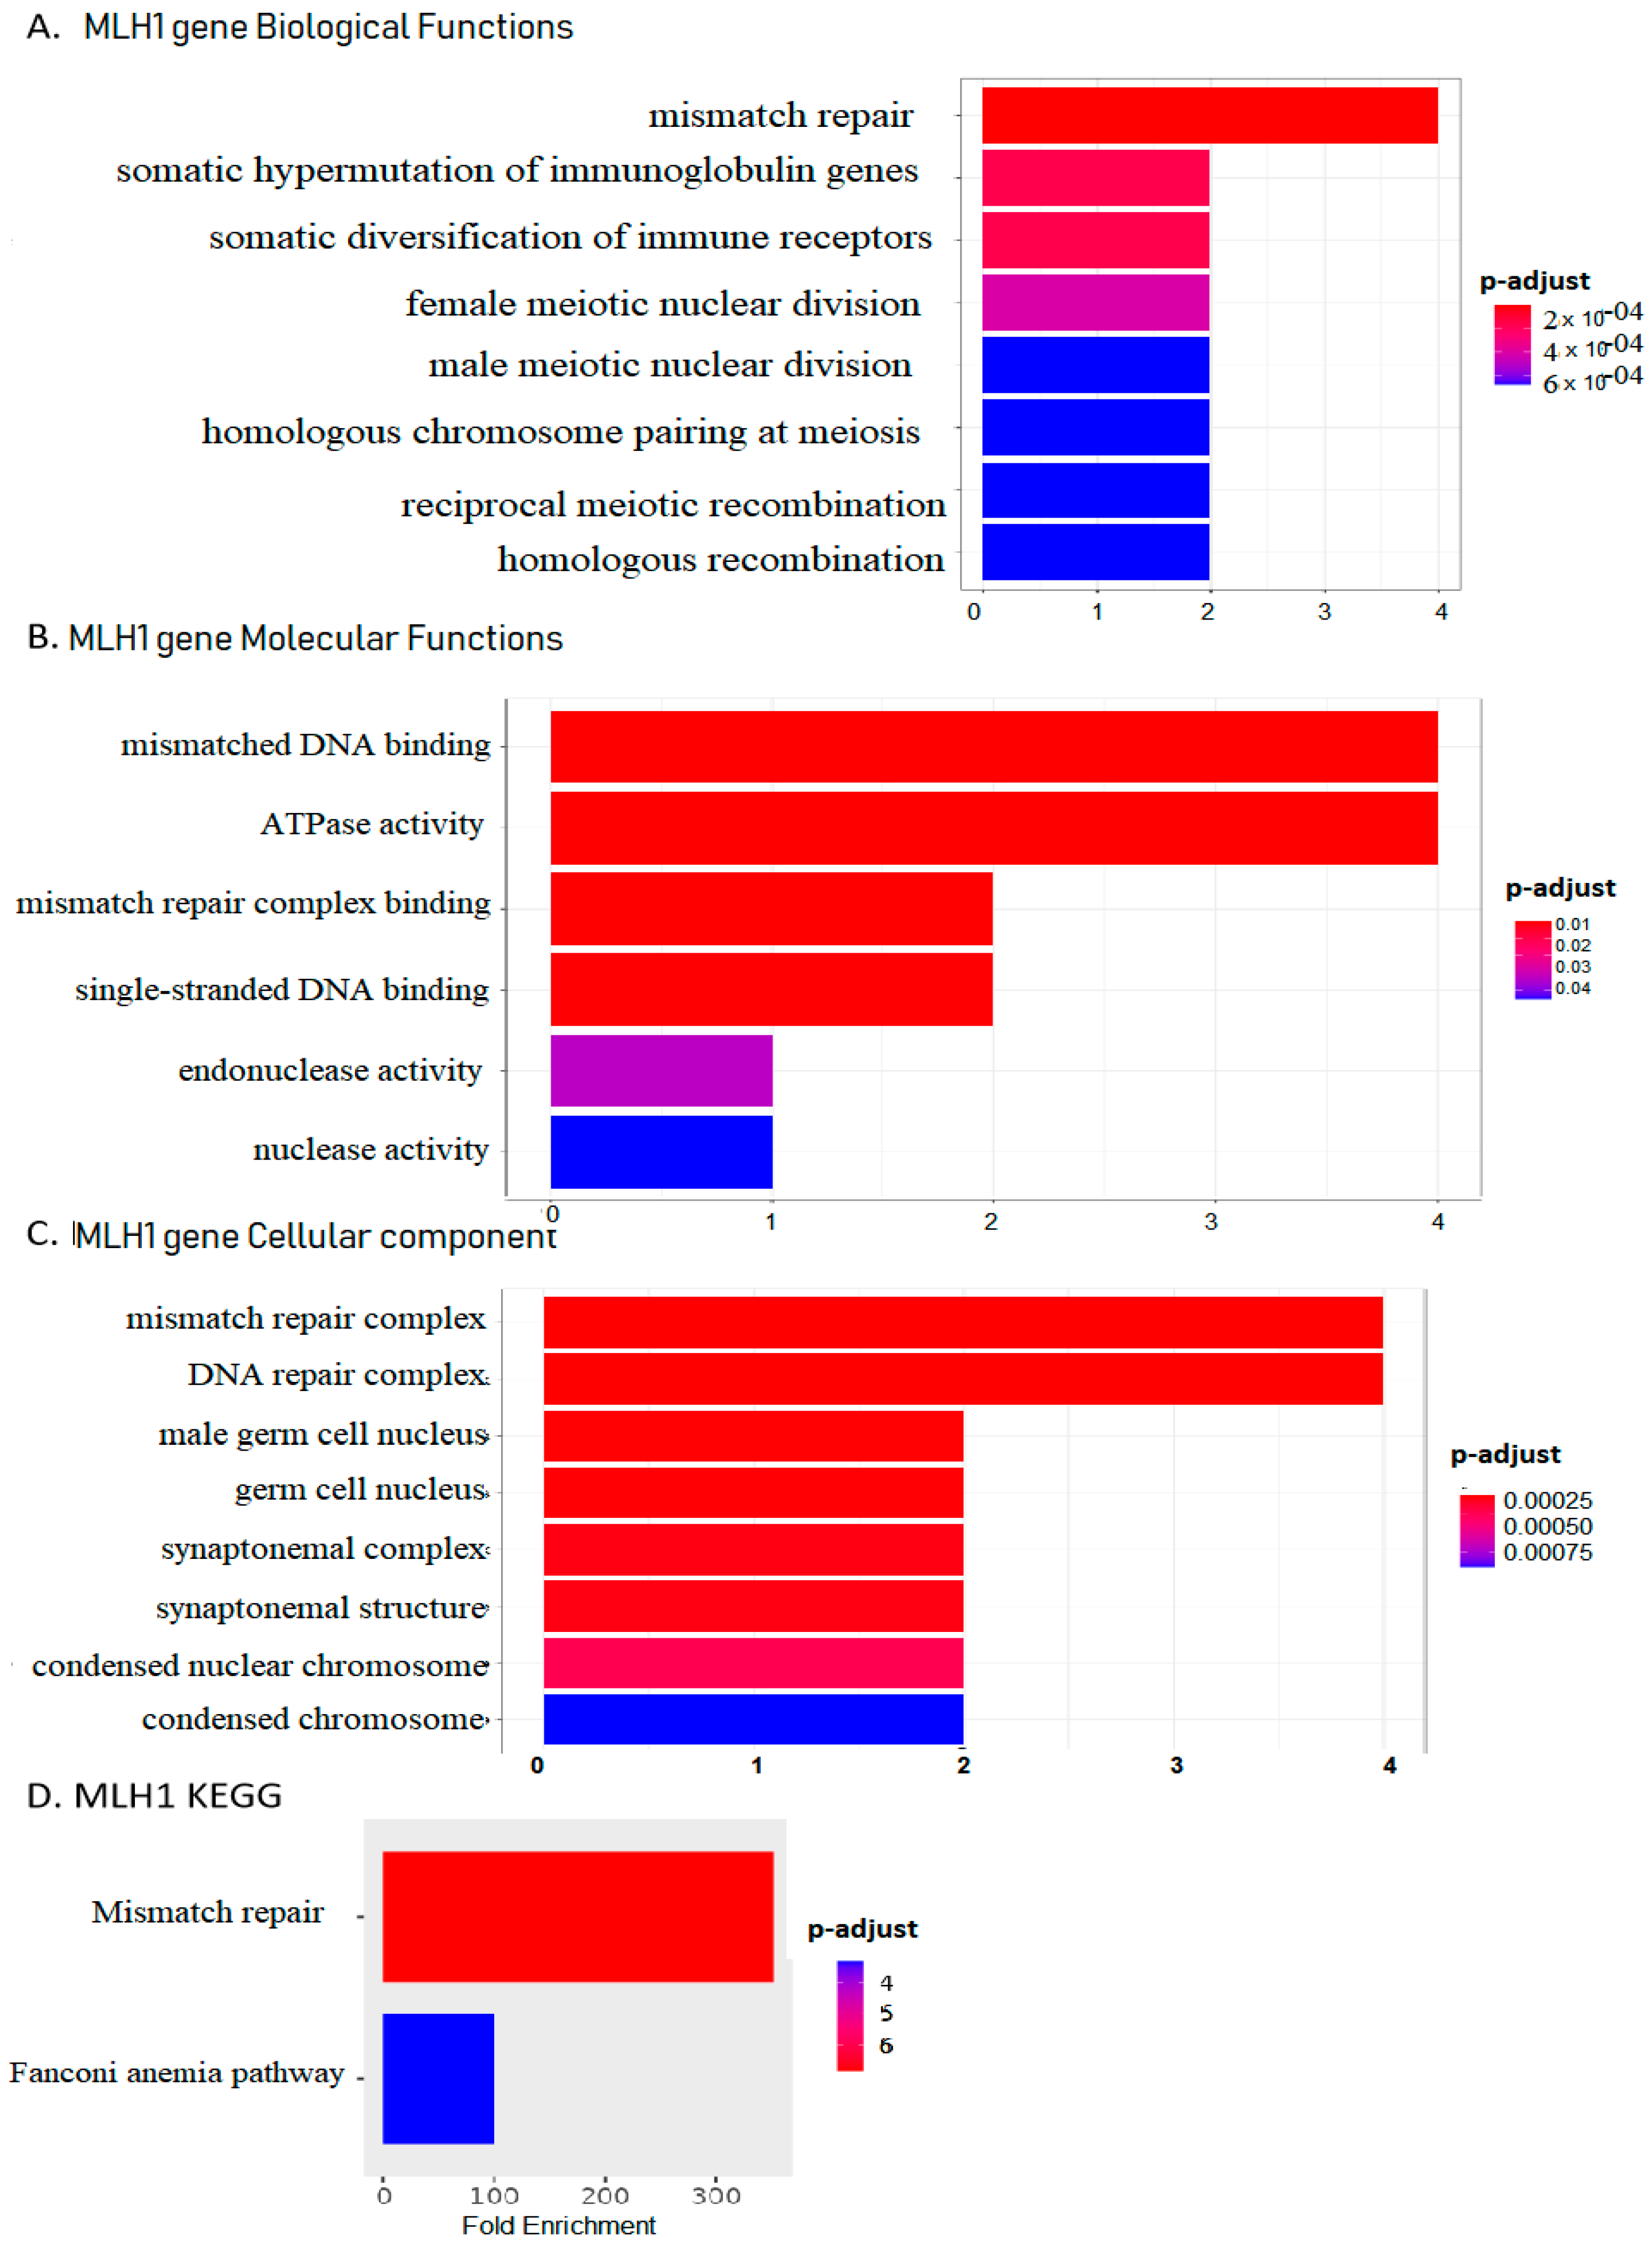
2.3. MLH1 Plays Roles in Mismatch Repair, Fanconi Anemia Pathways, ATPase Activity, and Endonuclease Activity in UCEC

To gain insight into the potential biological roles and signaling pathways of MLH1 involved in UCEC, enrichment analyses of KEGG (Kyoto Encyclopedia of Genes and Genomes) pathways and GO functional assessments were conducted on genes associated with MLH1 sourced from the molecular signature database (Extract Source, hsa03430).
MLH1 exhibited a significant impact on various aspects of cellular activities, including mismatch repair, somatic hypermutation of immunoglobulin genes (Figure 2A), ATPase activity, endonuclease activity (Figure 2B), mismatch repair complex, and DNA repair complex (Figure 2C). These findings revealed the pivotal roles of MLH1 in maintaining genomic stability by orchestrating DNA damage repair processes. In the KEGG pathway analysis, the mismatch repair and Fanconi anemia pathways were enriched with MLH1, both of which play crucial roles in the development of UCEC (Figure 2D).
In summary, our analyses suggested that MLH1 plays a central role in UCEC progression. It leads to DNA damage repair mechanisms and exerts a significant influence on the tumor microenvironment. Therefore, downregulated MLH1 expression induced by promoter hypermethylation may impair the DNA damage repair process, resulting in a poor prognosis [45].

2.4. Downregulation of MLH1 Enhanced TMB and Worsened the Prognosis of UCEC

DNA damage repair can be impaired by MLH1 downregulation, which may increase the tumor mutation burden (TMB) [46]. To investigate the correlation of MLH1 levels with the TMB in UCEC, Cox regression analysis was performed. The analysis revealed a significant negative correlation between MLH1 expression and the TMB level in UCEC (Supplementary Figure S2A). MLH1 downregulation by promoter CpG hypermethylation is frequently observed in the UCEC [47]. Therefore, a relatively high TMB is in UCEC. Under high TMB stress, genetic alternations will be frequently observed. Notably, the genetic alternation of MLH1 itself was frequently observed in the UCEC [48]. To investigate the association of MLH1-genetic-alternation with UCEC prognosis, online open-access tools (cbioportal and TCGA) were utilized to assess the genetic alteration features of MLH1. Using cBioPortal, the genetic alteration frequency of MLH1 was observed ranging from 1% to 2.5% in the TCGA–UCEC cohort. The genetic alterations in MLH1 primarily manifest as deep deletions, amplifications, and missense mutations (Figure 3A,B). Additionally, MLH1 exhibited a range of suspected copy-number abnormalities, as identified by the Genomic Identification of Significant Targets in Cancer (GISTIC) analysis in UCEC (Figure 3B).
Considering the predictive role of MLH1 in UCEC prognosis, as shown in Figure 2E, most of the abnormalities, particularly deep deletions, have the potential to adversely affect patients’ survival outcomes. Comparing the MLH1-altered group to the unaltered group, there were more frequent genetic changes observed in other genes, including KDM5C, ARID1A, PIK3CA, PTPRS, ARID1B, SMARCA4, KMT2C, NOTCH3, FAT1, and PPP2R1A (Figure 3C). Kaplan–Meier curve analysis revealed that 9 out of the 10 genes (KDM5C, ARID1A, PIK3CA, ARID1B, SMARCA4, KMT2C, NOTCH3, FAT1, and PPP2R1A) were significantly negatively related to the 5-year overall survival (OS) in unaltered group genes co-expressed with MLH1 in UCEC (Supplementary Figure S3A–J).
Interestingly, our findings suggest that the predictive impacts of co-occurring mutations may involve complex and cascading interactions rather than simple additive effects, warranting further investigation. Taken together, the results indicated the presence of genomic alterations in MLH1 and distinct co-expression patterns in UCEC patient tissues, implying a potential role in the progression of UCEC. Exploring the impact of copy number variations on immune cell infiltration, we found that a decrease in the MLH1 copy number reduces the infiltration of CD8+ T cells and dendritic cells. On the other hand, deletion of MLH1 copies at the arm level specifically affected the infiltration of dendritic cells in UCEC (Figure 3D).

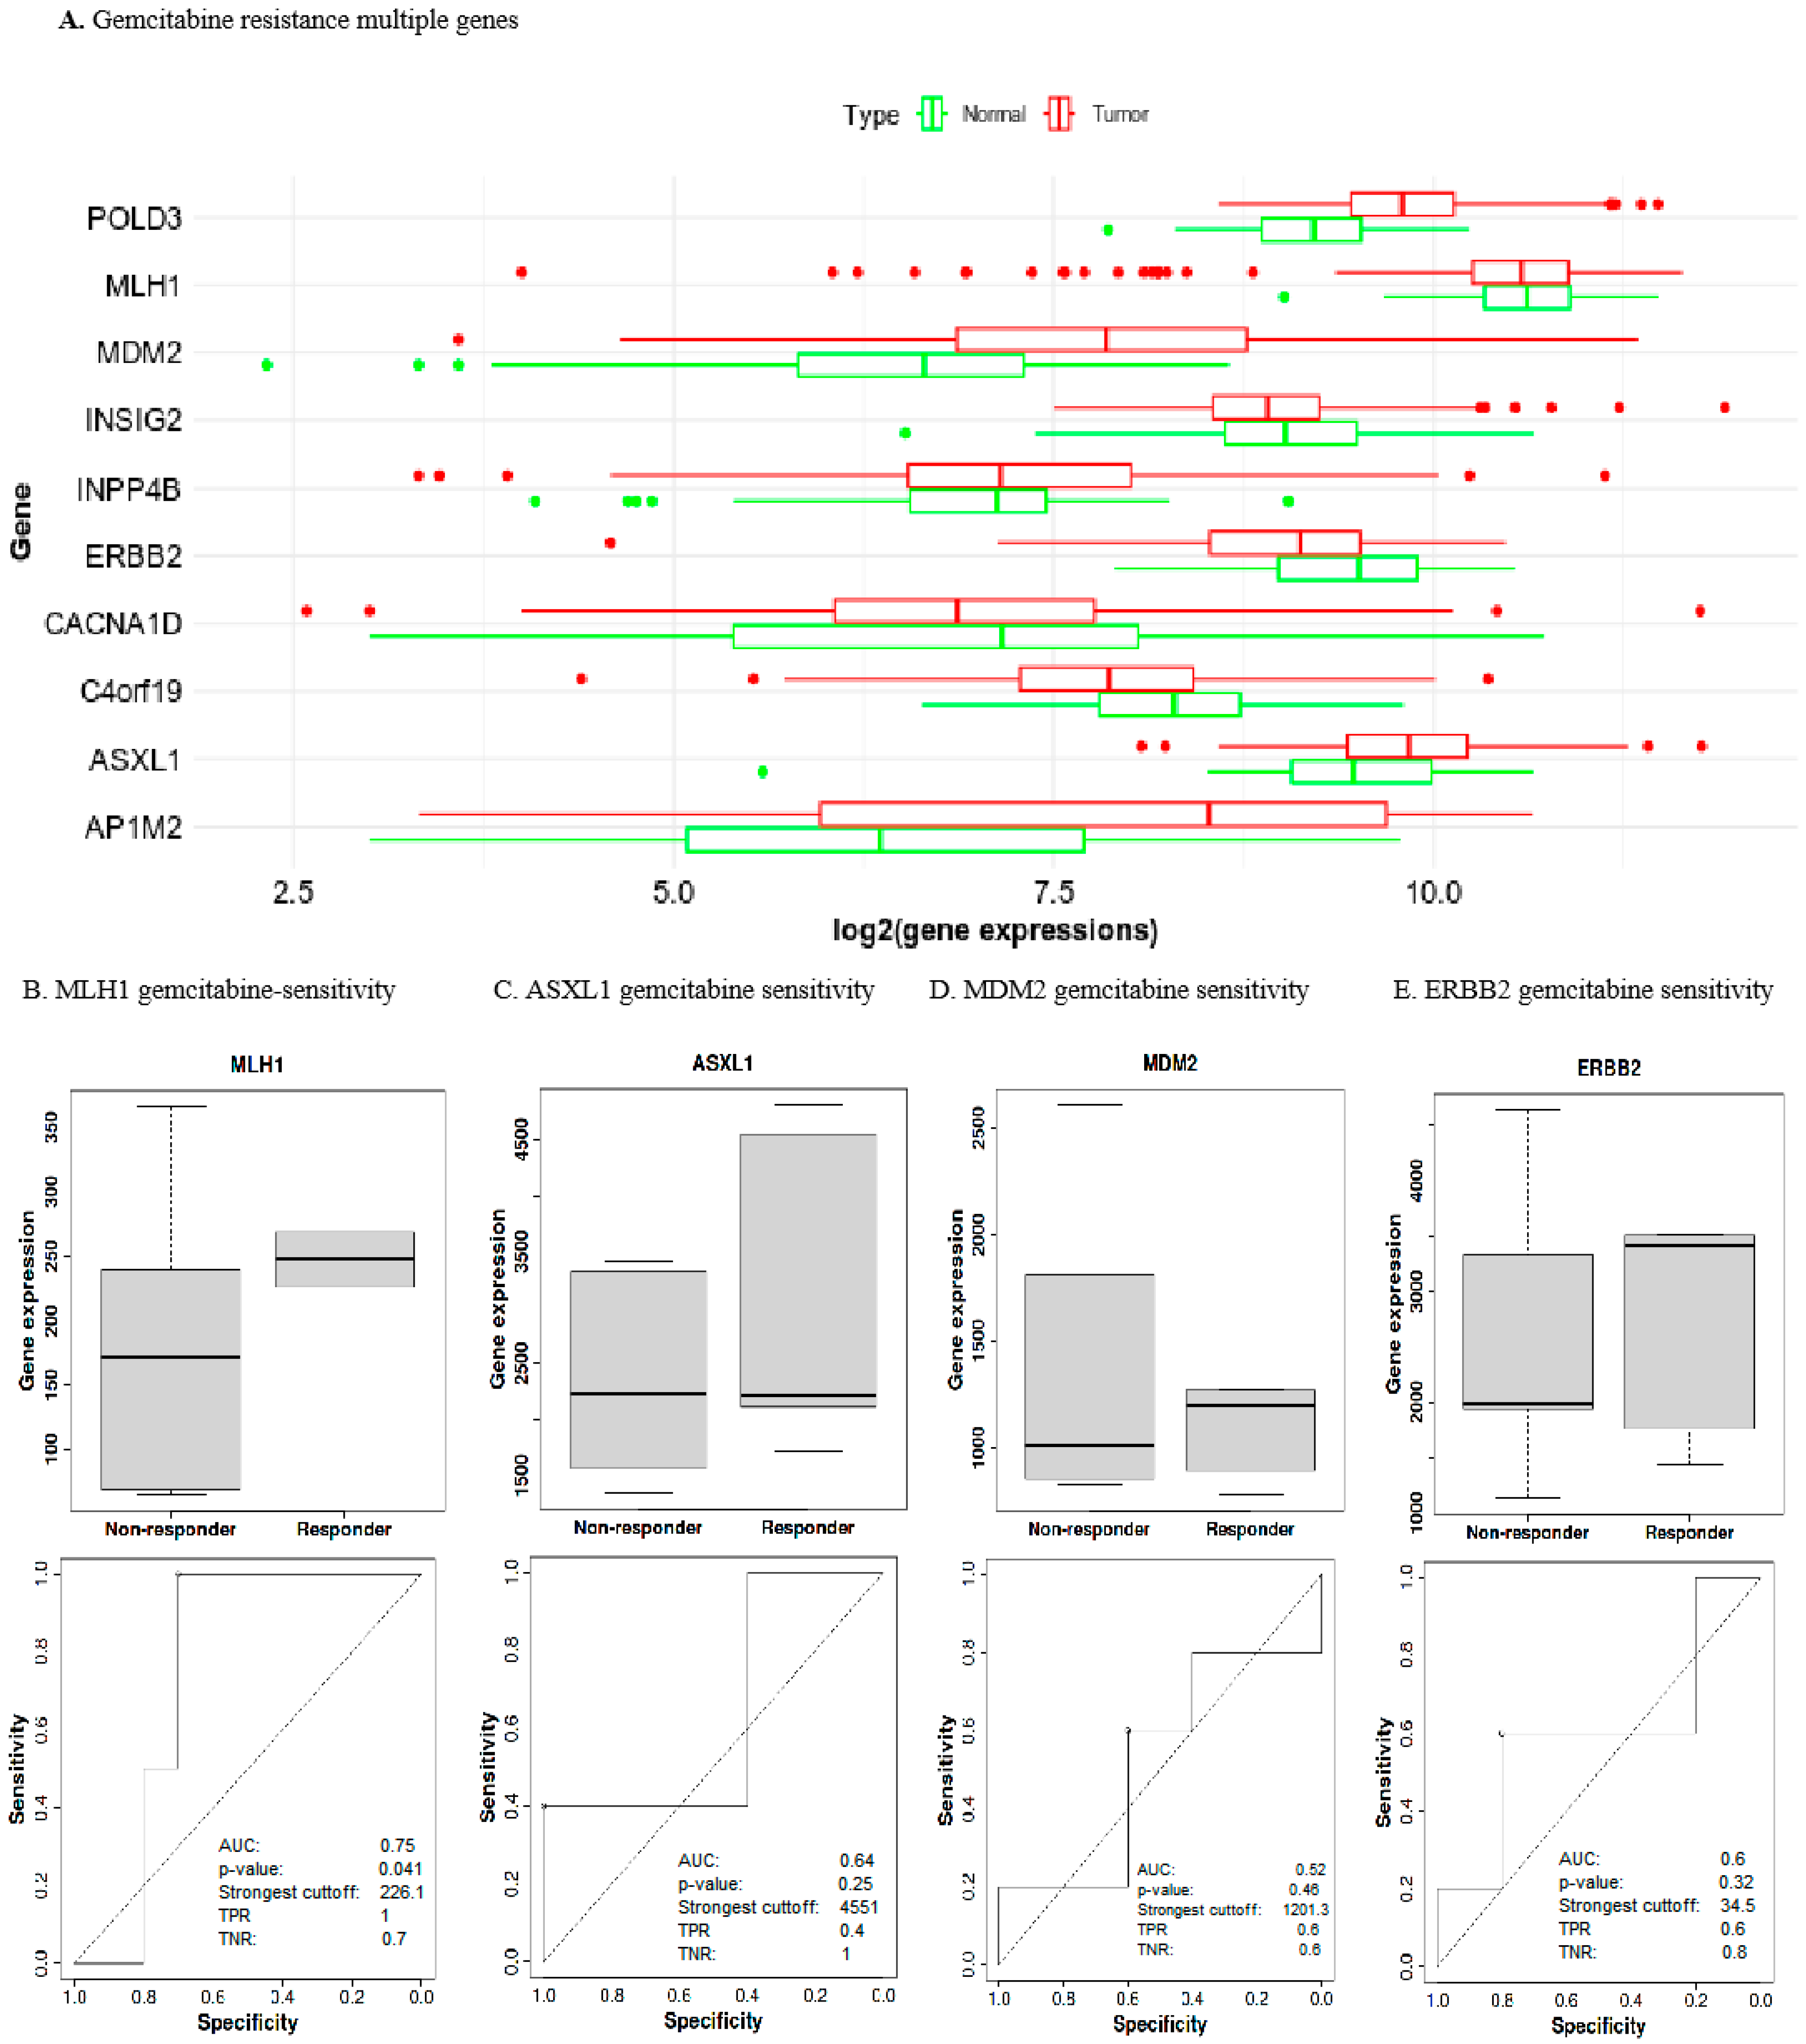
2.5. Prognostic Gene Expression Levels Associated with Gemcitabine Chemoresistance in UCEC

Gemcitabine has been used to treat advanced UCEC, despite a lack of published studies demonstrating its effectiveness [49]. To identify the key genes associated with gemcitabine resistance, we detected deferentially expressed genes (DEGs) using the “limma” R package. This analysis was based on RNA-sequencing data from EC cell lines obtained from the CTRP database. Thereof, the EC cell lines were divided into groups of gemcitabine-resistance, gemcitabine-intermediate-response, and gemcitabine-sensitivity with Z-scores of “≤−0.5”, “−0.5 < Z score < 0.”, “Z score ≥ 0.5”, respectively, using the “oncoPredict” method. 11 DEGs (AP1M2, ASXL1, CACNA1D, C4orf19, ERBB2, MDM2, MLH1, SH3RF2, POLD3, INPP4B, and INSIG2) were detected as responsible genes for EC gemcitabine resistance. Notably, the mRNA expression of the 11 DEGs was observed with higher levels in tumor samples compared to normal endometrial tissue samples (Figure 4A). Among the 11 differentially expressed genes (DEGs), DEGs of ASXL, ERBB2, and MDM2 showed significant prognostic implications (Supplementary Figure S4A–H).
However, MLH1 did not exhibit a direct association with gemcitabine chemoresistance in our analysis. Nevertheless, out of the 11 DEGs, potential modulation of ASXL1, ERBB2, and MDM2 suggests their role in gemcitabine resistance of EC [50]. ROC curve analysis was employed to evaluate the ability of gene expression to discriminate gemcitabine-sensitivity/resistance and different types and grades of EC. As evident in Figure 4B, the total area under the curves (AUCs) of MLH1 was significantly greater than 75%. However, it is evident in Figure 4C–E that the total area under the curves (AUCs) of ASXL1 (AUC = 0.64; p = 0.25), MDM2 (AUC = 0.52; p = 0.46), and ERBB2 (AUC = 0.6; p = 0.32) were significantly less than 65%.

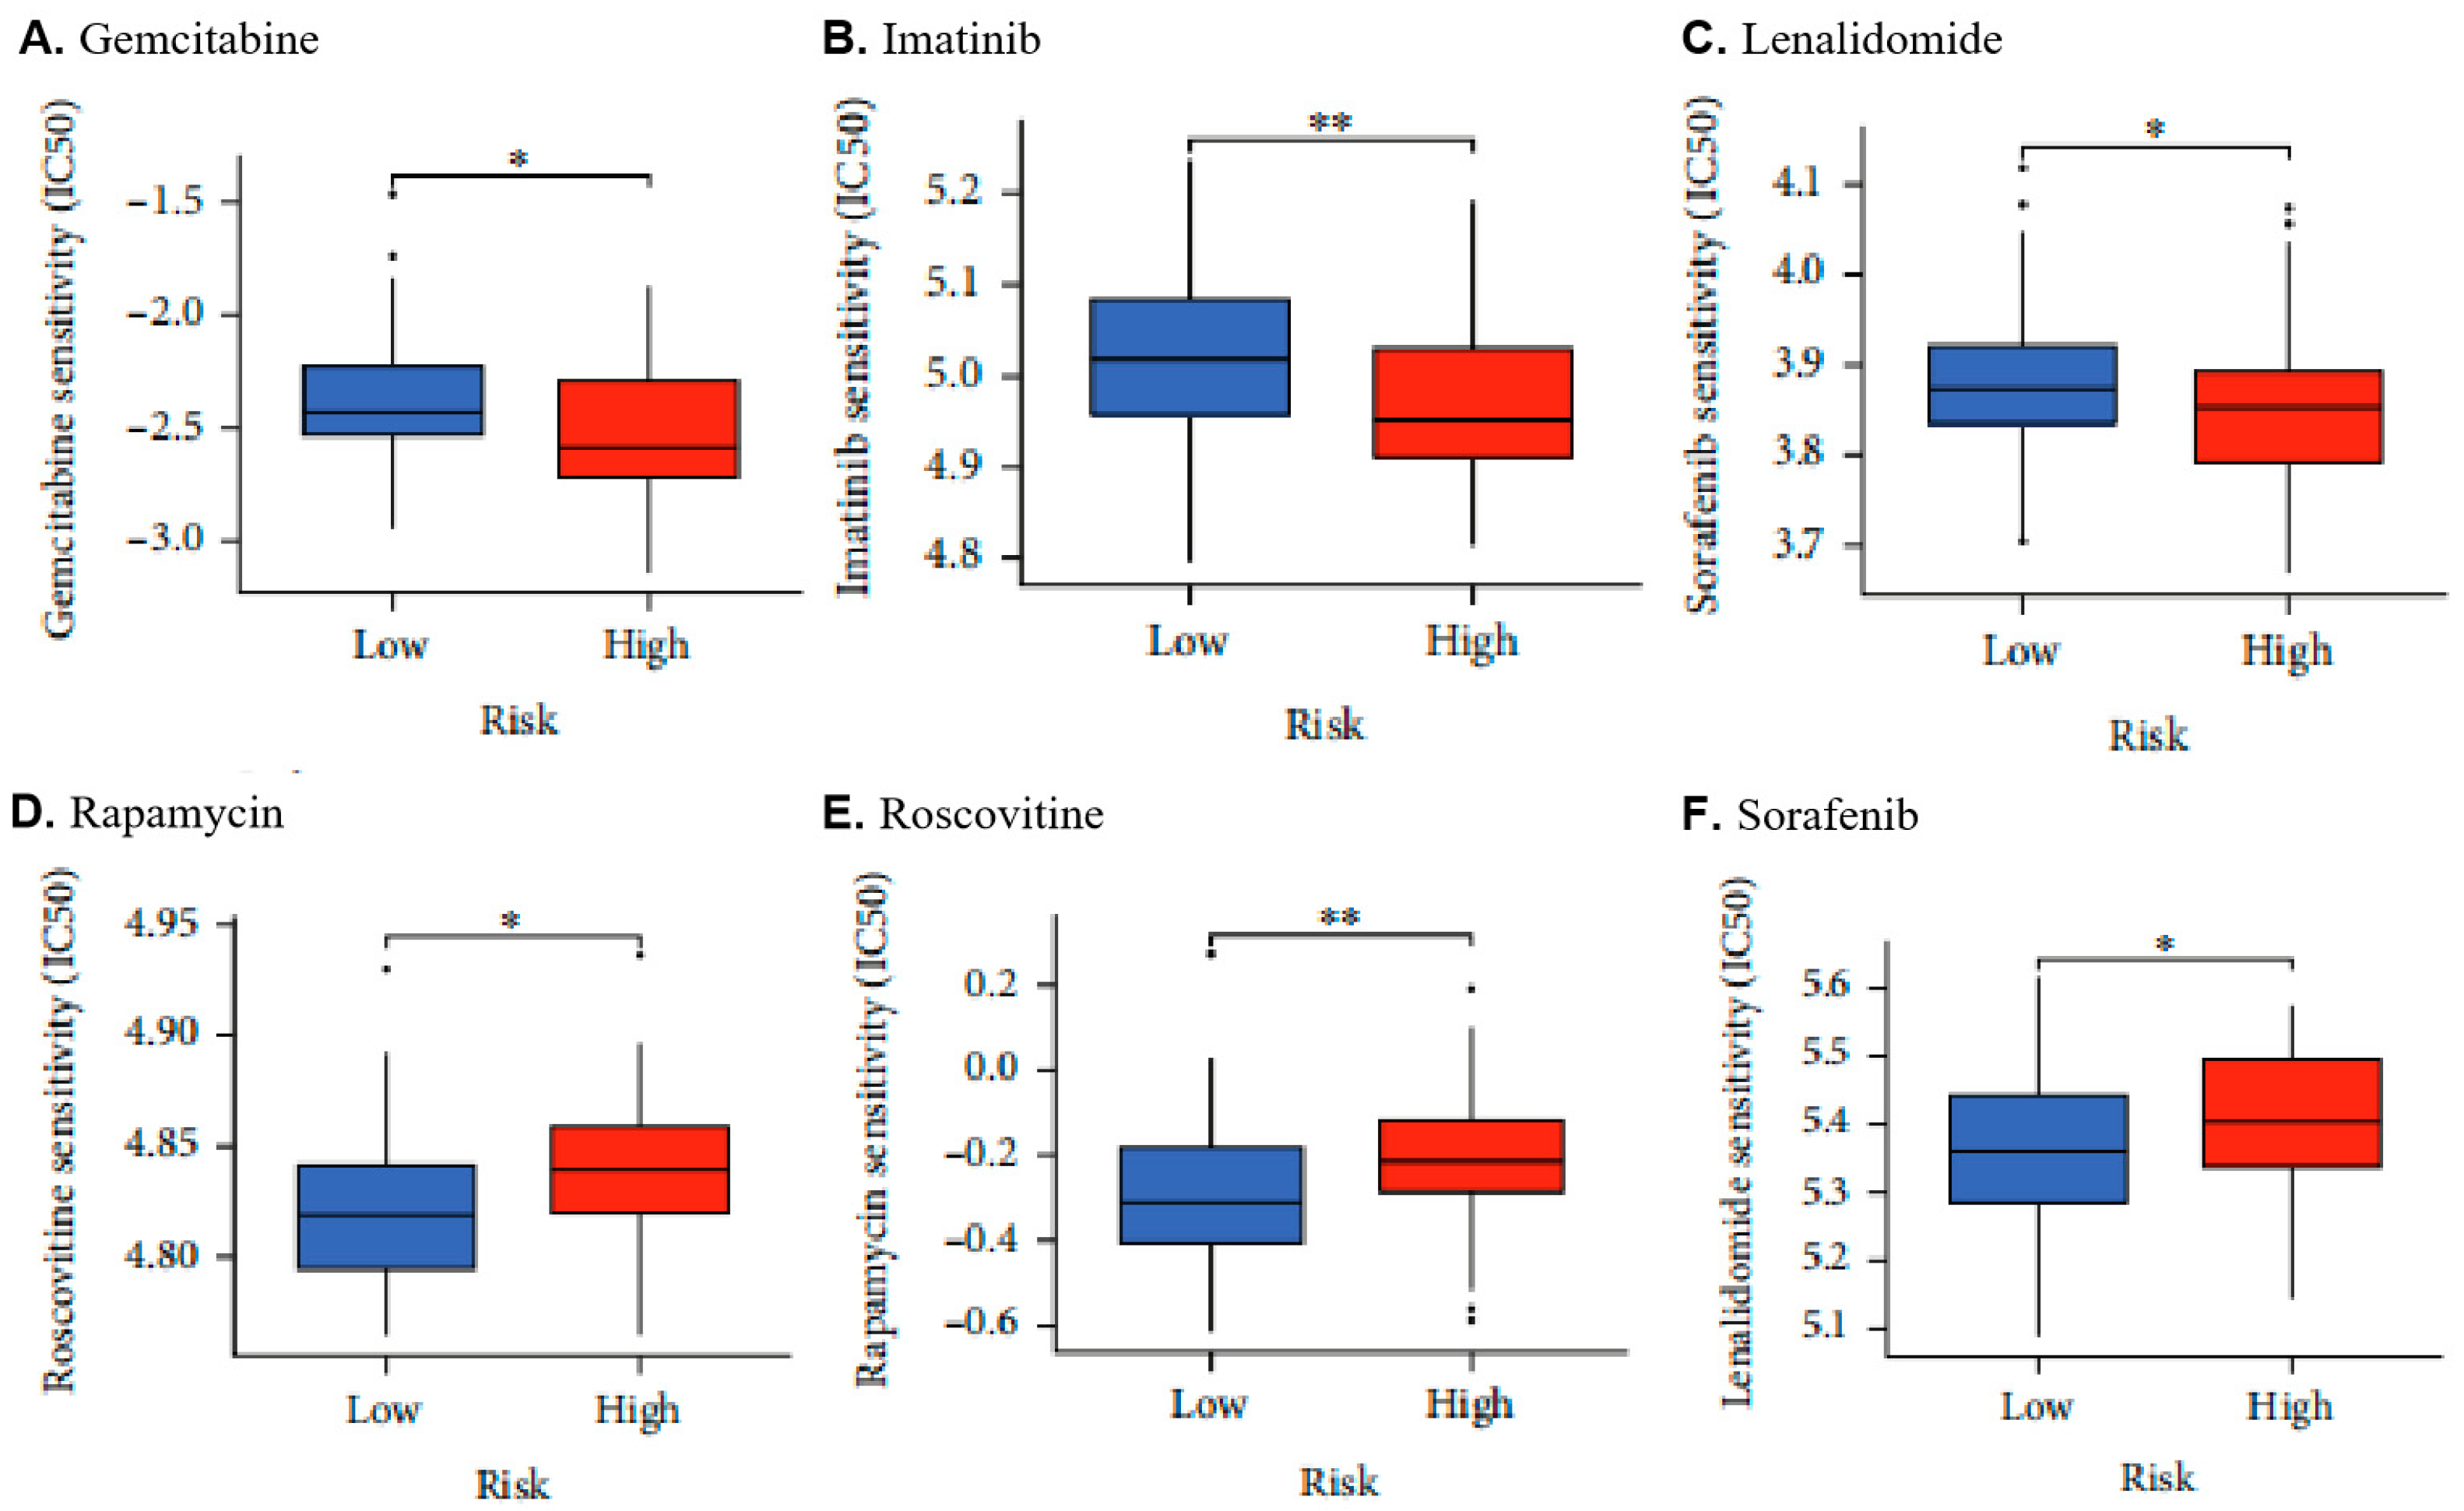
2.6. Low MLH1 Expression Decreased Drug Sensitivity in UCEC

In addition to gemcitabine, other compounds frequently used for clinical UCEC treatment include docetaxel, doxorubicin, gemcitabine, imatinib, lenalidomide, rapamycin, roscovitine, and sorafenib [51]. To investigate the association between the resistance of these compounds and MLH1 expression in UCEC, “pRRophetic” was employed to study the connection between the drugs’ IC50 values and the risks of UCEC cases. The IC50 value of each UCEC case was accessed from the CellMiner™ online database. The risk groups of the UCEC cases were divided based on risk scores established according to MLH1-dominant aggressiveness.
Remarkably, gemcitabine, imatinib, and sorafenib exhibited lower IC50 values in the low-risk groups, indicating a higher responsiveness to these drugs (Figure 5A–C). Conversely, the high-risk group demonstrated increased sensitivity to roscovitine, lenalidomide, and rapamycin (Figure 5D–F).
Of particular interest, our results suggested a significant correlation between MLH1 and the sensitivity to several small molecule inhibitors used in cancer treatment. Notably, conventional chemotherapy treatments, such as gemcitabine, imatinib, and sorafenib, had a limited impact on the survival rates of high-risk patients. It is noteworthy that this particular subgroup of patients showed a more positive response to these specific chemotherapy agents, which could potentially offer hope for personalized treatment strategies (Figure 5A–C). Conclusively, patients with depleted MLH1 expression in UCEC could be good candidates for targeted cancer treatment.

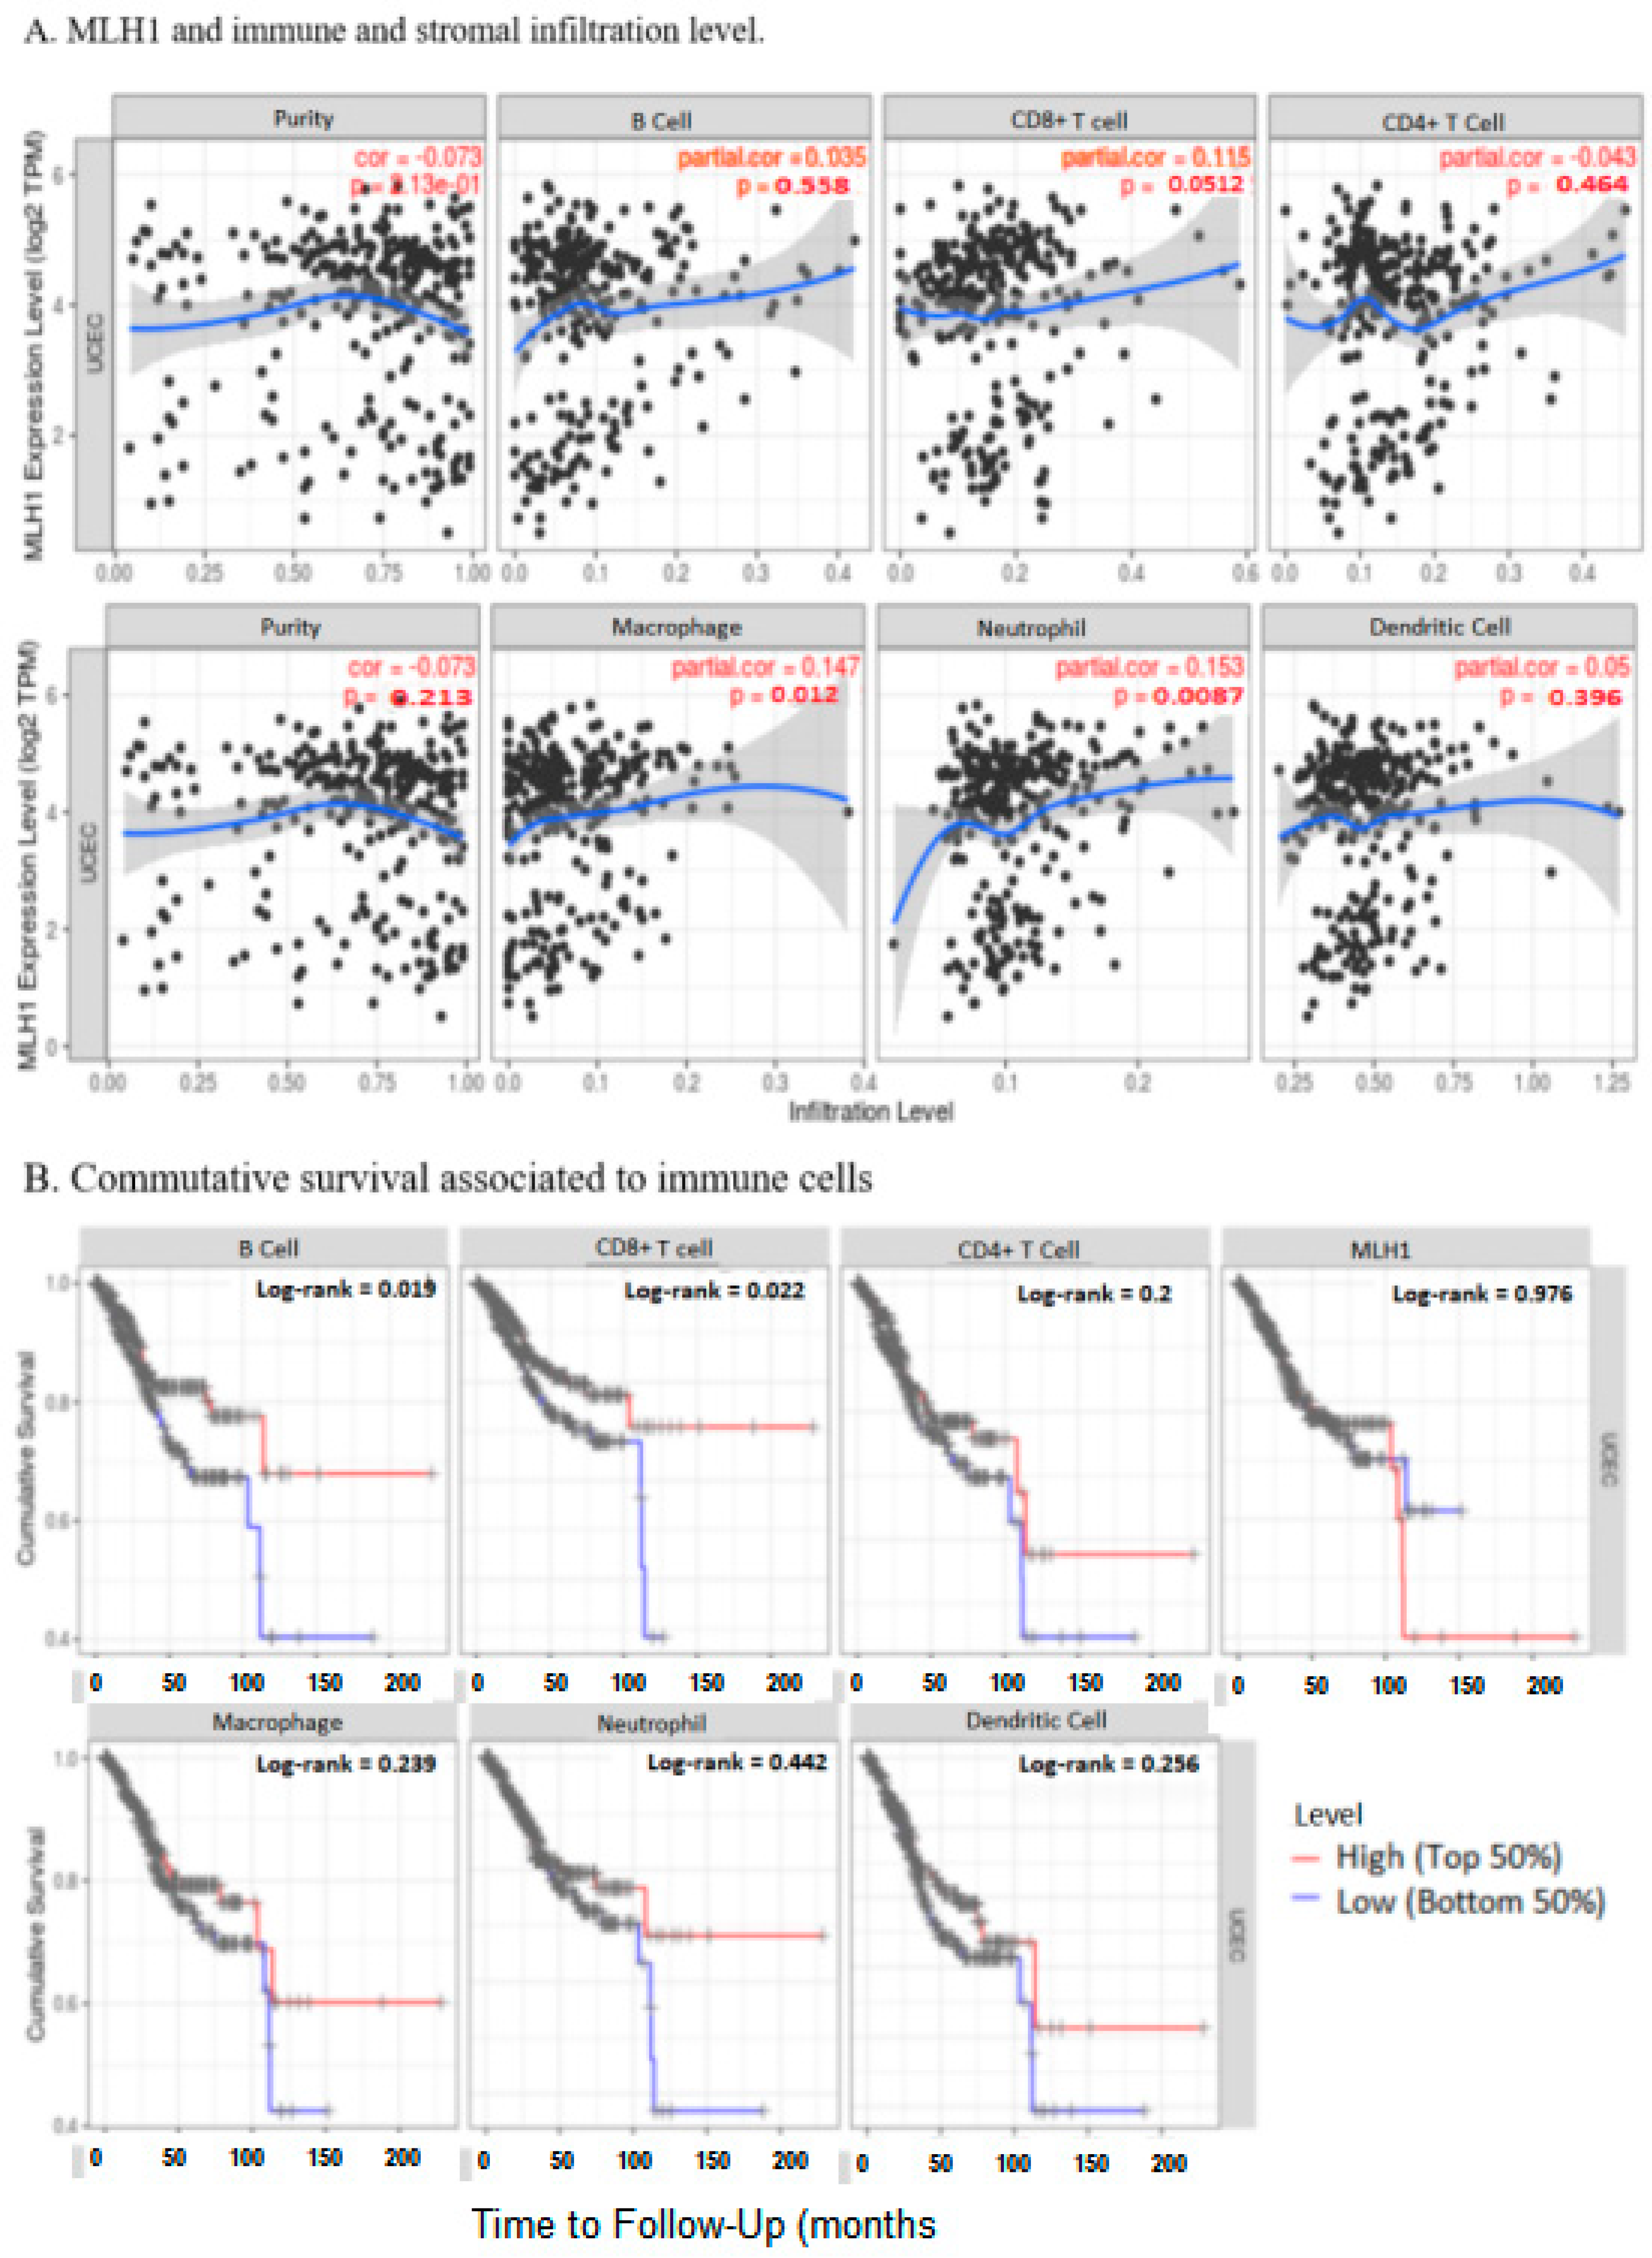
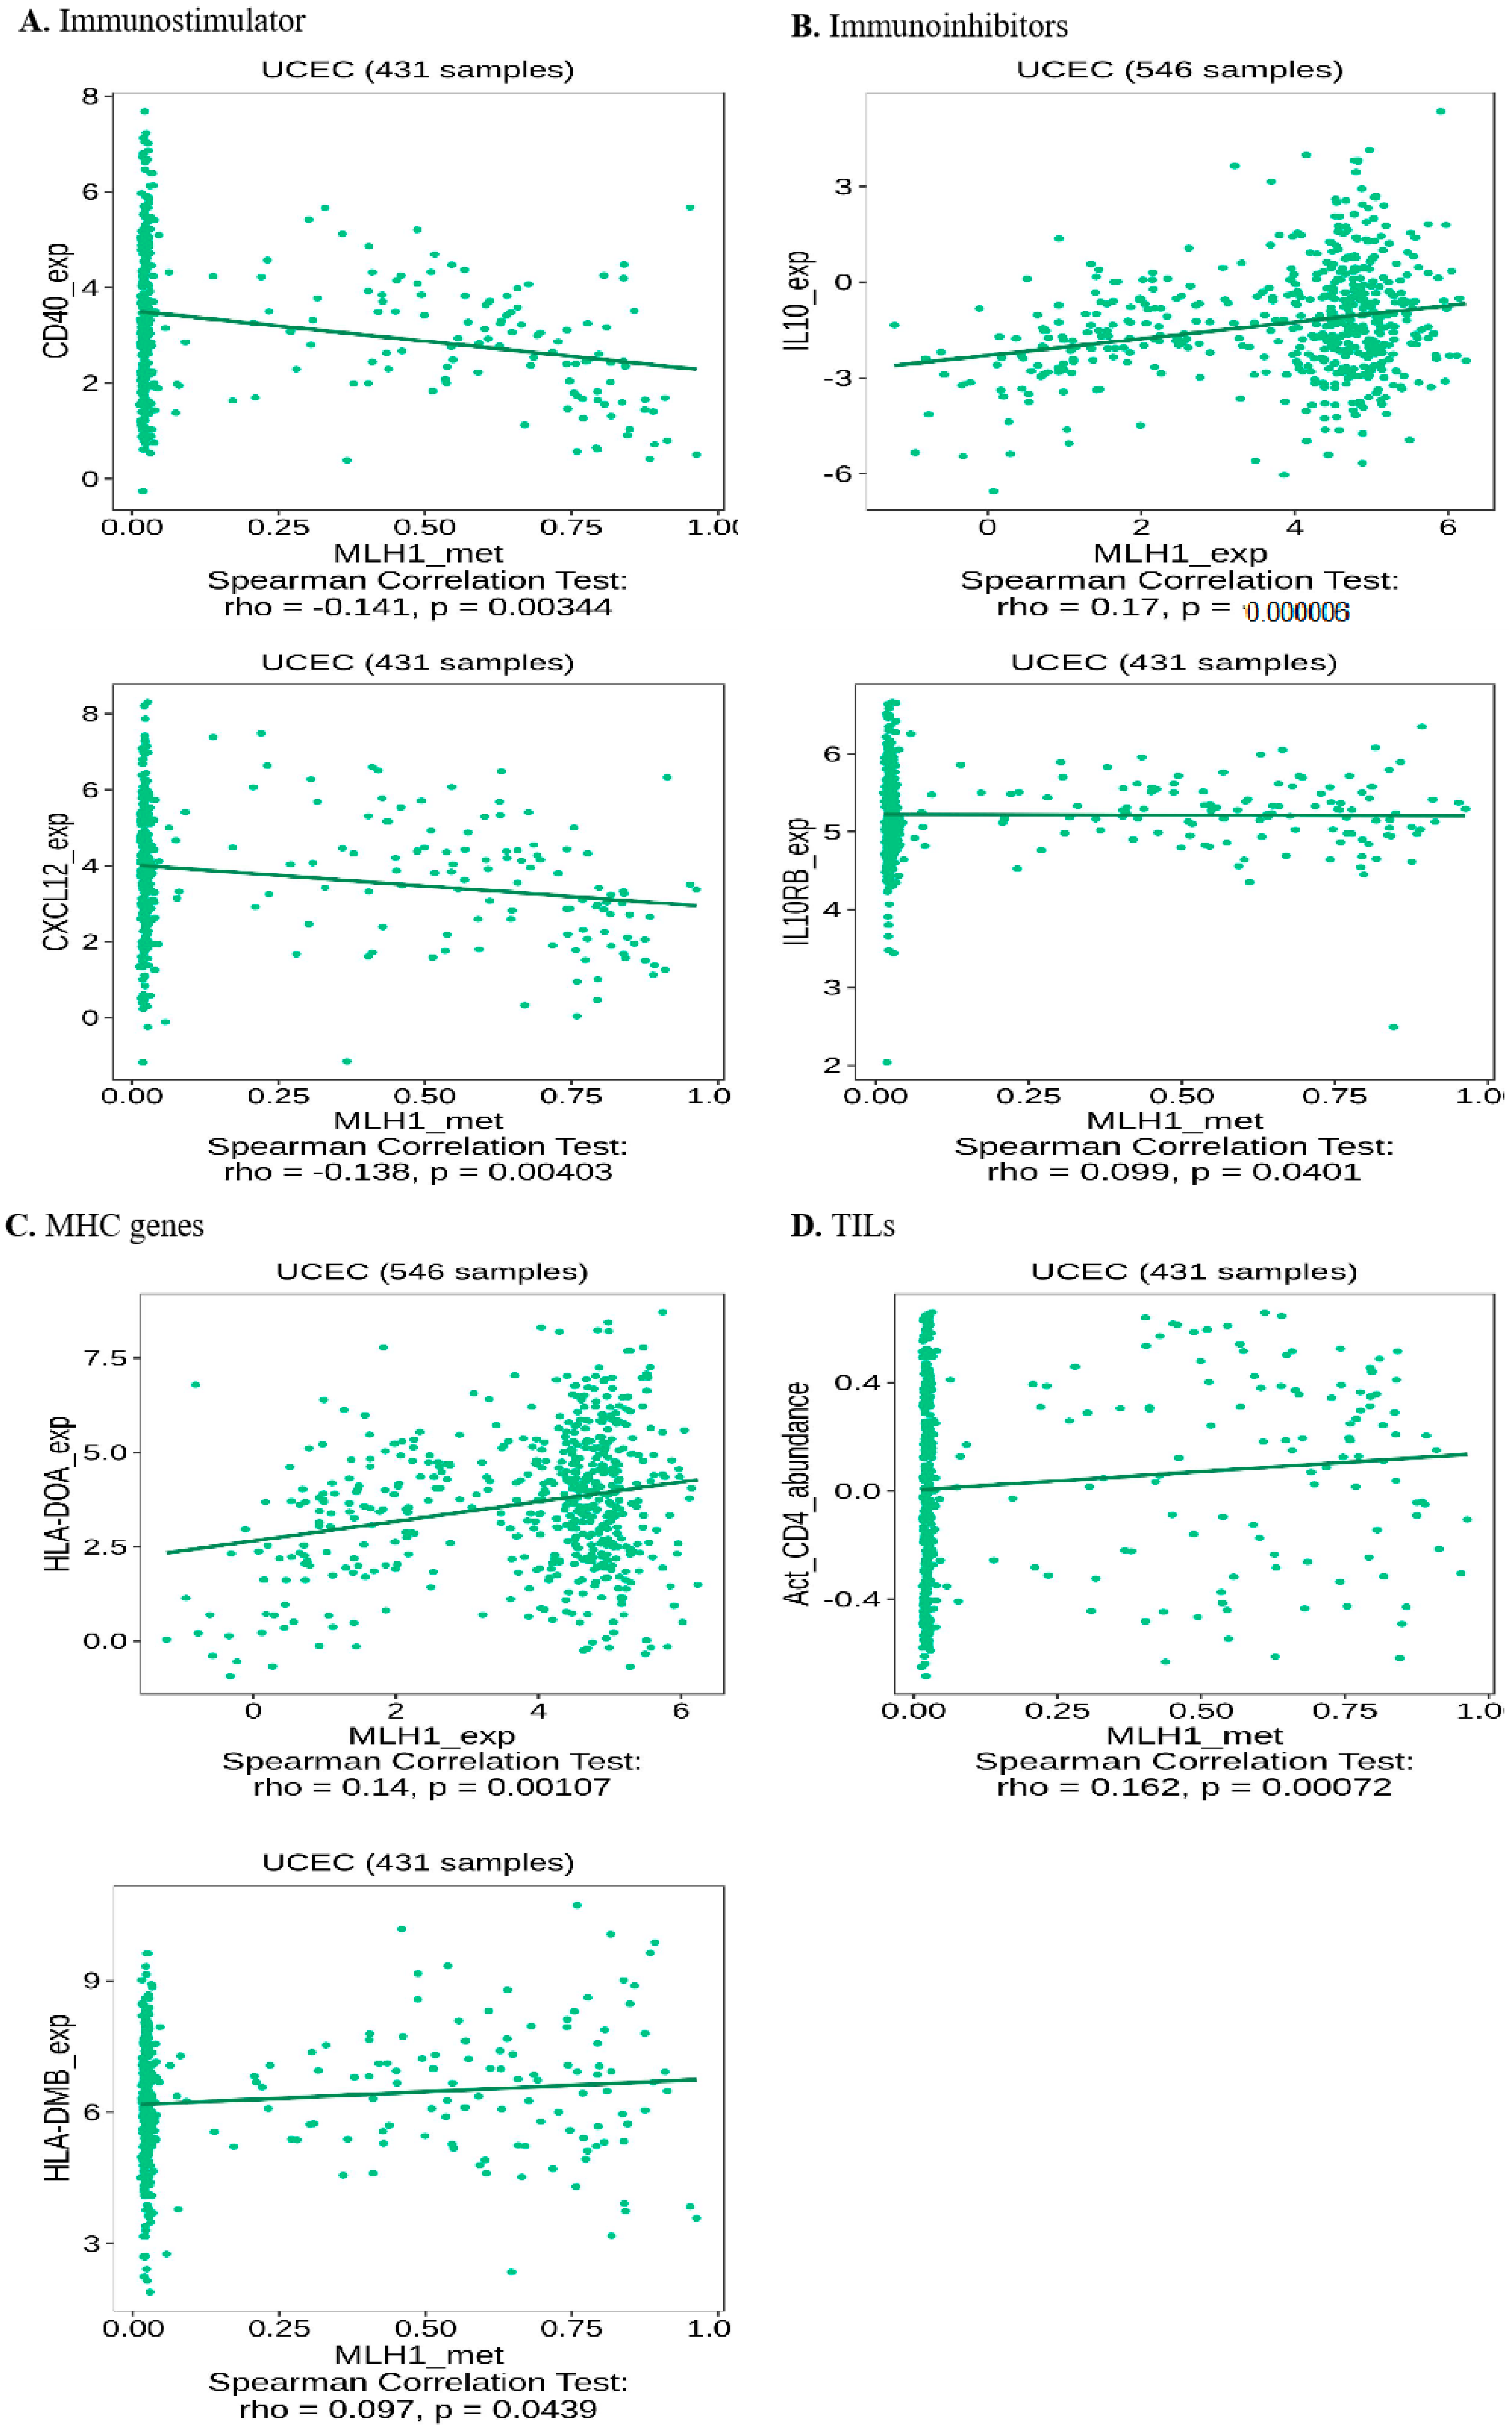
2.7. MLH1 Expression Negatively Correlated with the Tumor Immune Microenvironment in UCEC

To gain insight into the potential immunomodulatory roles of MLH1 in tumor immunity, analyses with ESTIMATE, CIBERSORT, and TISIDB were performed on MLH1 within UCEC. ESTIMATE analysis revealed a positive correlation between immune or stromal scores and MLH1 expression in UCEC. This indicates that higher MLH1 expression was associated with a more favorable tumor-immune microenvironment (Figure 6A). Conversely, decreased MLH1 expression was linked with an unconducive tumor microenvironment.
CIBERSORT revealed that MLH1 expression had a negative correlation with CD8+ T cells and CD4+ T cell infiltration but displayed positive correlations with B cells, macrophages, neutrophils, and dendritic cells (Figure 6A). Notably, patients with a higher infiltration of B cells and CD8+ T cells tended to have a better prognosis, whereas infiltration of CD4+ T cells, macrophages, and neutrophils did not significantly impact prognosis (Figure 6B). Therefore, decreased MLH1 expression might negatively impact the prognosis of UCEC by reducing the infiltration of B cells and CD8+ T cells in UCEC.
TISIDB analysis comprehensively revealed the correlation between MLH1 mRNA expression and immunokine, immune receptors, and tumor-infiltrating lymphocytes. Thereof, positive correlations were observed in MLH1 expression with immunoinhibitors IL10 and IL10RB, immunostimulators CD40 and CXCL12, and MHC genes HLA-DOA and HLA-DMB (Figure 7A–C). Moreover, CD4+ T cell activation was observed with MLH1 expression in UCEC (Figure 7D), which is consistent with the previous report [52]. These comprehensive results suggest that MLH1 expression may serve as a crucial mediator of immune-related biomolecules and lymphocytes within the tumor immune microenvironment [53]. It has been confirmed that there is chronic inflammation of the uterus, as evidenced by the expression of the IL10 gene, which is associated with the expression of the MLH1 gene and corresponding protein levels in the DNA repair mechanisms [54]. The increased expression of IL10RB was found to be associated with a poorer overall survival rate in UCEC. This could be attributed to the activation of the JAK/STAT pathway, which facilitates tumor progression [55]. The mRNA expression of CXCL12 was significantly lower in UCEC samples [56]. Such remarkable consistencies further provide evidence of hub gene dysregulation as a hallmark of UCEC pathogenesis. Further studies on the correlation between MLH1 and CD40, HLA-DOA, and HLA-DMB could be a potential area of research in UCEC.

2.8. Depleted MLH1 Expression Negatively Correlated with Immunotherapeutic Efficacy in UCEC

To assess the potential of MLH1 as a predictive biomarker in cancer immunotherapy, we investigated its correlation with TMB (tumor mutational burden) and MSI (microsatellite instability), two important indicators associated with the effectiveness of immunotherapy [57]. It has been proven that downregulation of MLH1 expression can increase TMB in UCEC (Supplementary Figure S2A). Meanwhile, the MSI subtype of UCEC exhibited low MLH1 expression levels compared to CN-LOW, CN-HIGH, and POLE subtypes (Supplementary Figure S2A). Therefore, MLH1 may be used to predict immunotherapeutic efficacy in UCEC.
To investigate the potential of MLH1 as a predictive marker in cancer immunotherapy, this study delved into the effectiveness of anti-PD-1/PD-L1. [58]. A comparative analysis was conducted to examine MLH1 expression in cohorts of immunotherapy-responsive and non-responsive patients. Data from three sources, namely GSE17025, GSE115810, and GSE36389 (Table 1), were utilized.
In the GSE115810 and GSE17025 cohorts, our analysis revealed significantly higher MLH1 expression in patients who did not respond to immunotherapy (Figure 8A,B). However, in the GSE36389 group, no statistically significant difference was observed. These results hint at the potential of MLH1 as a unique therapeutic target for overcoming resistance to immunotherapy and as a predictive tool for assessing immunotherapy responses in patients with UCEC.

3. Discussion

The inactivation of MLH1, primarily through hypermethylation, aids in tumor development [59]. Mismatch repair (MMR) systems are fundamental in identifying mismatched nucleotides in double-stranded DNA and initiating the repair process [60]. The MLH1 protein plays a crucial role in this process by attracting essential enzymes to correct mismatches [61]. Moreover, MMR proteins are involved in activating the cell cycle checkpoint and inducing apoptosis when DNA damage exceeds a certain threshold [62]. Furthermore, we discovered a connection between UCEC and signs of MSI, a decrease in MLH1 expression, and an increase in MLH1 promoter methylation. This prompted us to hypothesize that MLH1 promoter methylation might be linked to MLH1 expression in prognosis and immunotherapeutic efficacy in UCEC.
Cytosolic DNA is induced, and the cGAS-STING pathway is activated by MLH1 deficiency [63]. This is due to the fact that MLH1 physically interacts with Exo1 to control Exo1’s nuclease activity during the DNA end resection [64]. RPA exhaustion, DNA breaks, and ultimately aberrant chromosomes result from hyperexcision during DNA end resection, which is triggered by MLH1 depletion or disruption of the MLH1–Exo1 connection. Nuclear DNA is subsequently released into the cytoplasm, initiating the cGAS-STING pathway [65]. Base–base replacement and small insertion–deletion mutations have been linked to MMR deficiency. Yet, a growing body of research indicates that dMMR, namely MLH1 loss, may occasionally result in chromosomal instability (CIN). Premature chromosomal separation and incomplete recombination result in aberrant crossover during meiosis and severely damaged chromosomes, making Mlh1-knockout mice sterile [66].
The reduced expression of MLH1 has been linked to a better prognosis and may be a predictor of the chemosensitivity of ovarian cancer [67]. This contradicts the current study, possibly due to differences in cancer type and the dataset used. The molecular processes by which MLH1 affects ovarian cancer patients’ survival and chemosensitivity may involve Claudin-4. MLH1 interacts with cancer-associated pathways such as apoptosis and other DNA repair molecules, playing a significant role in repairing diverse genetic abnormalities [68]. Furthermore, the MLH1 protein interacts with cytoskeletal scaffolding proteins, including the non-erythrocytic alpha-II-spectrin (SPTAN1) [69]. MLH1 and SPTAN1 have a high association, controlling tumor growth [68]. Given the significance of SPTAN1 in both cell–cell adhesion and tight junction integrity [68], the robust association between MLH1 and SPTAN1 implies a plausible function for MLH1 in controlling tight junction proteins. These findings underscore the potential multifaceted functions of the MLH1 protein in cancer.
The study highlights the loss of MLH1 in numerous malignancies, often accompanied by hypermethylation of its promoter. This is particularly relevant in chemotherapy, where mismatch repair deficits can affect the toxicity of specific chemotherapeutic agents like cisplatin. The hypermethylation of MLH1’s promoter can significantly impact the susceptibility of endometrial tumors to such drugs, making it a crucial consideration in chemotherapy regimens. Reduced MLH1 expression is associated with an unfavorable prognosis and is a potential indicator of chemosensitivity. MLH1 plays a crucial role in the development and functionality of immune cells, such as T cells and macrophages, suggesting that its impact on cancer prognosis may be related to its ability to modulate the body’s immune response. The study reveals that decreased MLH1 expression has a substantial detrimental effect on overall and disease-free survival in UCEC. Other research has also shown that methylated mismatch repair-deficient UCEC (MMRd UCEC) has lower recurrence-free survival rates than non-methylated counterparts [70].
The study delves into the complex interplay between DNA methylation regulators and their influence on the immune environment and immunotherapy efficacy. Similarly, in CRC patients, the methylation status of PD-L1 may function as a predictive biomarker of response to immunotherapy [71]. Amplifications of PD-L1 and PD-L2 are noted as contributing to a significant response to immune checkpoint inhibitors. Genetic modifications of MLH1, including deep deletion, amplification, and missense mutation, are identified.
The research encompasses a pan-cancer analysis of MLH1, emphasizing its clinical significance and its role in the tumor immune microenvironment and immunotherapy. Disparities in datasets and databases are attributed to variations in experimental techniques, sample sizes, and data sources, underscoring the need for careful consideration in future research. The correlation between MLH1 expression and the efficacy of immunotherapy has significant implications for cancer treatment. Tumors with elevated MLH1 expression may be less responsive to immunotherapy, while those with reduced expression appear to benefit more, offering insights for clinicians in treatment decision-making. Although the study makes significant contributions to understanding the roles and clinical implications of reduced MLH1 in UCEC, further validation using alternative cohorts is needed to strengthen associations with the efficacy of immunotherapy and anti-cancer medicines. Exploring the complex mechanisms through which MLH1 influences the tumor immune microenvironment remains an intriguing area for future research, paving the way for innovative therapeutic strategies.

4. Materials and Methods

4.1. Data Collection

The data for methylome, transcriptome, proteome, somatic variants, and copy number variations were sourced from multiple repositories, including the Clinical Proteomic Tumor Analysis Consortium (CPTAC) data portal (https://cptac-apps.georgetown.edu/, accessed on 15 May 2023), Genomic Data Commons (GDC, https://gdc.cancer.gov/, accessed on 21 May 2023), and published studies. To access the normalized The Cancer Genome Atlas Program (TCGA) dataset, we referred to the work of Goldman et al. [72], who retrieved these data from The University of California Santa Cruz (UCSC) database (https://xena.ucsc.edu/, accessed on 30 May 2023). For UCEC, we collected expression data for each sample. Additionally, we obtained expression profiles for various cancer cell lines from the Broad Institute Cancer Cell Line Encyclopedia database (https://portals.broadinstitute.org, accessed on 30 June 2023). We also examined the expression levels of the top DNA-methylated genes across 33 malignancies. In Supplementary Table S1, we report the abbreviation for each tumor type.
To assess expression levels in healthy tissues, we utilized expression profiles from the Genotype Tissue Expression (GTEx) database (https://www.gtexportal.org, accessed on 30 July 2023). In our analysis, we compared the differential expression of cancer samples with their corresponding normal samples from the TCGA (Figure 9).

4.2. Prognostic Analysis of Deferentially Expressed Genes (DEGs)

To assess the correlation between DEG expression and overall survival as well as disease-free survival, we utilized TCGA Pan-cancer survival data. The results were presented using a forest plot. Additionally, Kaplan–Meier (K–M) curves with log-rank p-values (a non-parametric method used to estimate the survival probability from observed survival times) were used to illustrate the contrasting survival outcomes between the high MLH1 (MutL Homolog 1) expression and low MLH1 expression groups in UCEC. The analysis involved the use of R packages such as “survival”, “survminer”, “forestplot”, “ggpubr”, and “limma”.

4.3. Identification of Key Genes Regulating Gemcitabine Sensitivity

To identify key genes influencing gemcitabine sensitivity, we utilized the gemcitabine resistance score. We classified uterine endometrial cells into three categories based on the scaled gemcitabine resistance score: gemcitabine-sensitive (Z-score (a statistical measurement that describes a value’s relationship to the mean of a group of values) ≤−0.5), intermediate gemcitabine-resistant (−0.5 < Z score < 0.5), and gemcitabine-resistant (Z score ≥ 0.5). Differential gene expression analysis was conducted using the ‘limma’ package, which identified deferentially expressed genes (DEGs) with a p-value < 0.01 and a log2 fold change (FC) > 1 [73].

4.4. Investigation of MLH1 in Predicting Drug Sensitivity

For predicting chemotherapeutic responses, we considered eight chemotherapy agents: docetaxel, doxorubicin, gemcitabine, imatinib, lenalidomide, rapamycin, roscovitine, and sorafenib. We calculated the half-maximal inhibitory concentration (IC50) of these drugs using the ‘pRRophetic’ tool (used for phenotype prediction from gene expression microarray data).

4.5. Differential Gene Analysis and Functional Enrichment

We conducted differential gene expression (DGE) analysis using the limma-voom methodology. Deferentially expressed genes (DEGs) were identified as those with a p-value < 0.05 and a log2 fold change (FC) > 1. To gain insight into their functional roles, we performed functional enrichment analysis using both gene ontology (GO) enrichment analysis and Kyoto Gene and Genome Encyclopedia (KEGG) pathway analysis. To visualize our findings, we used ggplot2 and Cytoscape software Version 3.9.0.

4.6. Biological Function of MLH1 in UCEC

Gene Set Enrichment Analysis (GSEA) was employed to explore the potential biological functions and signaling pathways that could be influenced by MLH1 in UCEC. In this analysis, a collection of 50 hallmark gene sets sourced from the MSigDB database (https://www.gseamsigdb.org/, accessed on 12 June 2023) was utilized. To perform this analysis, we utilized R packages, including “clusterProfiler”, “enrichplot”, and “ggplot2”, and the results were visually presented.

4.7. Genetic Alternation Analysis of MLH1

We analyzed epigenetic modifications using the TCGA studies’ datasets available on the online database cbioportal (http://cbioportal.org, accessed on 30 August 2023). This analysis focused on exploring MLH1’s altered sites, genetic alteration frequency, types, and copy number alterations [74].

4.8. Analysis of Immune Cell Infiltration in UCEC

We assessed immune cell infiltration in UCEC using multiple immunoassay databases, including McCluster, EPIC, QUANTISEQ, CIBERSORT, TIMER, and XCELL.

4.9. Immune Microenvironment Assessment

To estimate stromal and immune scores, we utilized the ‘ESTIMATE’ R package (based on observational time series data, the estimate R package provides methods for estimating the effective reproductive number promptly) for the analysis of Estimation of Stromal and Immune Cells in UCEC Tissue Using Expression Data (ESTIMATE). Additionally, we investigated the association between MLH1 and immune cells in the immune microenvironment of UCEC using CIBERSORT and Spearman correlation analysis. We also investigated the correlations between MLH1 expression and tumor-infiltrating lymphocytes (TILs), major histocompatibility complex (MHC) genes, immunostimulatory genes, and chemokines in UCEC using the TISIDB online database, accessed on 14 August 2023 [75].

4.10. Investigation of MLH1 in Predicting Immunotherapeutic Efficacy

To investigate the correlation between MLH1 expression and the effectiveness of immune checkpoint blockade (ICB) immunotherapy, we analyzed three datasets that included patients undergoing this treatment. These datasets included EC (GSE17025, GSE115810, GSE36389) and IMvigor210 (endometrial cancer), obtained from the Gene Expression Omnibus (GEO) database (https://www.ncbi.nlm.nih.gov/geo/, accessed on 21 November 2023). We performed the analysis using the ‘ggpubr’ and ‘ggplot2’ R packages.

4.11. Statistical Analysis

All statistical analyses were conducted using R programming (version 4.3.0). Differences in gene expression and methylation levels between cancerous and non-cancerous tissues across various types of cancer were assessed using the Wilcoxon rank-sum test. Spearman correlation analysis was used to calculate correlation coefficient values. Statistical significance was defined as p < 0.05 or lower (denoted as * p < 0.05 and ** p < 0.01).

Supplementary Materials

The following supporting information can be downloaded at: https://www.mdpi.com/article/10.3390/biomedinformatics4010019/s1. Figure S1: The cancer methylome landscape associated with transcriptomic and proteomic change and prognosis; Figure S2: Endometrial cancer by subtypes; Figure S3: KM Curves for Prognostic values and expression levels of the genes related to gemcitabine resistance; Figure S4: KM Curves for Prognostic values of Co-occurrence of genetic mutations in tumors with MLH1 alterations; and Table S1 Abbreviations.

Author Contributions

T.W., V.P. and P.Q. designed the research; T.W., J.H. and P.H. performed data analysis, writing—original draft, data curation, and formal analysis; T.W., J.H., P.H., V.P. and P.Q. reviewed the data; T.W., J.H., V.P. and P.Q. wrote the manuscript. All authors have read and agreed to the published version of the manuscript.

Funding

Tesfaye Wolde received support from the School of Life Science, Department of Biology, Tsinghua Shenzhen International Graduate.

Institutional Review Board Statement

Not applicable.

Informed Consent Statement

Not applicable.

Data Availability Statement

The method and materials have mentioned that all data can be accessed from the open-sourced database.

Acknowledgments

We acknowledge the Institute of Biopharmaceutical and Health Engineering, Tsinghua Shenzhen International Graduate School, China; for administrative support.

Conflicts of Interest

The authors declare that the research was conducted in the absence of any commercial or financial relationships that could be construed as potential conflicts of interest.

References

  1. Bergeron, C.; Amant, F.; Ferenczy, A. Pathology and physiopathology of adenomyosis. Best Pract. Res. Clin. Obs. Gynaecol. 2006, 20, 511–521. [Google Scholar] [CrossRef]
  2. de Haydu, C.; Black, J.D.; Schwab, C.L.; English, D.P.; Santin, A.D. An update on the current pharmacotherapy for endometrial cancer. Expert. Opin. Pharmacother. 2016, 17, 489–499. [Google Scholar] [CrossRef] [PubMed]
  3. Bray, F.; Ferlay, J.; Soerjomataram, I.; Siegel, R.L.; Torre, L.A.; Jemal, A. Global cancer statistics 2018: GLOBOCAN estimates of incidence and mortality worldwide for 36 cancers in 185 countries. CA Cancer J. Clin. 2018, 68, 394–424. [Google Scholar] [CrossRef] [PubMed]
  4. Morice, P.; Leary, A.; Creutzberg, C.; Abu-Rustum, N.; Darai, E. Endometrial cancer. Lancet 2016, 387, 1094–1108. [Google Scholar] [CrossRef] [PubMed]
  5. Mathur, P.; Sathishkumar, K.; Chaturvedi, M.; Das, P.; Sudarshan, K.L.; Santhappan, S.; Nallasamy, V.; John, A.; Narasimhan, S.; Roselind, F.S.; et al. Cancer Statistics, 2020: Report From National Cancer Registry Programme, India. JCO Glob. Oncol. 2020, 6, 1063–1075. [Google Scholar] [CrossRef] [PubMed]
  6. Chen, W.; Zheng, R.; Baade, P.D.; Zhang, S.; Zeng, H.; Bray, F.; Jemal, A.; Yu, X.Q.; He, J. Cancer statistics in China, 2015. CA Cancer J. Clin. 2016, 66, 115–132. [Google Scholar] [CrossRef]
  7. Siegel, R.L.; Miller, K.D.; Fuchs, H.E.; Jemal, A. Cancer Statistics, 2021. CA Cancer J. Clin. 2021, 71, 7–33. [Google Scholar] [CrossRef] [PubMed]
  8. McAlpine, J.N.; Temkin, S.M.; Mackay, H.J. Endometrial cancer: Not your grandmother’s cancer. Cancer 2016, 122, 2787–2798. [Google Scholar] [CrossRef]
  9. Rutten, H.; Verhoef, C.; van Weelden, W.J.; Smits, A.; Dhanis, J.; Ottevanger, N.; Pijnenborg, J.M.A. Recurrent Endometrial Cancer: Local and Systemic Treatment Options. Cancers 2021, 13, 6275. [Google Scholar] [CrossRef]
  10. Miller, D.S.; Filiaci, V.L.; Mannel, R.S.; Cohn, D.E.; Matsumoto, T.; Tewari, K.S.; DiSilvestro, P.; Pearl, M.L.; Argenta, P.A.; Powell, M.A.; et al. Carboplatin and Paclitaxel for Advanced Endometrial Cancer: Final Overall Survival and Adverse Event Analysis of a Phase III Trial (NRG Oncology/GOG0209). J. Clin. Oncol. 2020, 38, 3841–3850. [Google Scholar] [CrossRef]
  11. Ray-Coquard, I.; Favier, L.; Weber, B.; Roemer-Becuwe, C.; Bougnoux, P.; Fabbro, M.; Floquet, A.; Joly, F.; Plantade, A.; Paraiso, D.; et al. Everolimus as second- or third-line treatment of advanced endometrial cancer: ENDORAD, a phase II trial of GINECO. Br. J. Cancer 2013, 108, 1771–1777. [Google Scholar] [CrossRef] [PubMed]
  12. Thomas, J.; Leal, A.; Overman, M.J. Clinical Development of Immunotherapy for Deficient Mismatch Repair Colorectal Cancer. Clin. Color. Cancer 2020, 19, 73–81. [Google Scholar] [CrossRef] [PubMed]
  13. MacKay, H.J.; Freixinos, V.R.; Fleming, G.F. Therapeutic Targets and Opportunities in Endometrial Cancer: Update on Endocrine Therapy and Nonimmunotherapy Targeted Options. Am. Soc. Clin. Oncol. Educ. Book. 2020, 40, 245–255. [Google Scholar] [CrossRef] [PubMed]
  14. Silva, J.P.N.; Pinto, B.; Monteiro, L.; Silva, P.M.A.; Bousbaa, H. Combination Therapy as a Promising Way to Fight Oral Cancer. Pharmaceutics 2023, 15, 1653. [Google Scholar] [CrossRef] [PubMed]
  15. Ma, B.; Wells, A.; Clark, A.M. The pan-therapeutic resistance of disseminated tumor cells: Role of phenotypic plasticity and the metastatic microenvironment. Semin. Cancer Biol. 2020, 60, 138–147. [Google Scholar] [CrossRef] [PubMed]
  16. Moxley, K.M.; McMeekin, D.S. Endometrial carcinoma: A review of chemotherapy, drug resistance, and the search for new agents. Oncologist 2010, 15, 1026–1033. [Google Scholar] [CrossRef] [PubMed]
  17. Akgul, S.; Patch, A.M.; D’Souza, R.C.J.; Mukhopadhyay, P.; Nones, K.; Kempe, S.; Kazakoff, S.H.; Jeffree, R.L.; Stringer, B.W.; Pearson, J.V.; et al. Intratumoural Heterogeneity Underlies Distinct Therapy Responses and Treatment Resistance in Glioblastoma. Cancers 2019, 11, 190. [Google Scholar] [CrossRef]
  18. Belachew, E.B.; Sewasew, D.T. Molecular Mechanisms of Endocrine Resistance in Estrogen-Positive Breast Cancer. Front. Endocrinol. 2021, 12, 599586. [Google Scholar] [CrossRef]
  19. Labani-Motlagh, A.; Ashja-Mahdavi, M.; Loskog, A. The Tumor Microenvironment: A Milieu Hindering and Obstructing Antitumor Immune Responses. Front. Immunol. 2020, 11, 940. [Google Scholar] [CrossRef]
  20. Jurkovicova, D.; Neophytou, C.M.; Gasparovic, A.C.; Goncalves, A.C. DNA Damage Response in Cancer Therapy and Resistance: Challenges and Opportunities. Int. J. Mol. Sci. 2022, 23, 14672. [Google Scholar] [CrossRef]
  21. Crucitta, S.; Cucchiara, F.; Mathijssen, R.; Mateo, J.; Jager, A.; Joosse, A.; Passaro, A.; Attili, I.; Petrini, I.; van Schaik, R.; et al. Treatment-driven tumour heterogeneity and drug resistance: Lessons from solid tumours. Cancer Treat. Rev. 2022, 104, 102340. [Google Scholar] [CrossRef]
  22. Batis, N.; Brooks, J.M.; Payne, K.; Sharma, N.; Nankivell, P.; Mehanna, H. Lack of predictive tools for conventional and targeted cancer therapy: Barriers to biomarker development and clinical translation. Adv. Drug Deliv. Rev. 2021, 176, 113854. [Google Scholar] [CrossRef]
  23. Wajapeyee, N.; Gupta, R. Epigenetic Alterations and Mechanisms That Drive Resistance to Targeted Cancer Therapies. Cancer Res. 2021, 81, 5589–5595. [Google Scholar] [CrossRef]
  24. Al Aboud, N.M.; Tupper, C.; Jialal, I. Genetics, Epigenetic Mechanism. In StatPearls; StatPearls Publishing: Treasure Island, FL, USA, 2023. [Google Scholar]
  25. Ayob, A.Z.; Ramasamy, T.S. Cancer stem cells as key drivers of tumour progression. J. Biomed. Sci. 2018, 25, 20. [Google Scholar] [CrossRef]
  26. Yang, Y.; Li, X.; Wang, T.; Guo, Q.; Xi, T.; Zheng, L. Emerging agents that target signaling pathways in cancer stem cells. J. Hematol. Oncol. 2020, 13, 60. [Google Scholar] [CrossRef]
  27. Sun, L.; Fang, J. Epigenetic regulation of epithelial-mesenchymal transition. Cell Mol. Life Sci. 2016, 73, 4493–4515. [Google Scholar] [CrossRef] [PubMed]
  28. Helleday, T.; Petermann, E.; Lundin, C.; Hodgson, B.; Sharma, R.A. DNA repair pathways as targets for cancer therapy. Nat. Rev. Cancer 2008, 8, 193–204. [Google Scholar] [CrossRef]
  29. Wainwright, E.N.; Scaffidi, P. Epigenetics and Cancer Stem Cells: Unleashing, Hijacking, and Restricting Cellular Plasticity. Trends Cancer 2017, 3, 372–386. [Google Scholar] [CrossRef] [PubMed]
  30. Ghasemi, S. Cancer′s epigenetic drugs: Where are they in the cancer medicines? Pharmacogenomics J. 2020, 20, 367–379. [Google Scholar] [CrossRef] [PubMed]
  31. Klymenko, Y.; Nephew, K.P. Epigenetic Crosstalk between the Tumor Microenvironment and Ovarian Cancer Cells: A Therapeutic Road Less Traveled. Cancers 2018, 10, 295. [Google Scholar] [CrossRef]
  32. Bell, C.C.; Gilan, O. Principles and mechanisms of non-genetic resistance in cancer. Br. J. Cancer 2020, 122, 465–472. [Google Scholar] [CrossRef]
  33. Das Ghosh, D.; Roy Chowdhury, R.; Dutta, R.; Mukhopadhyay, I.; Mukhopadhyay, A.; Roychoudhury, S. In-silico analysis of TCGA data showing multiple POLE-like favourable subgroups overlapping with TP53 mutated endometrial cancer: Implications for clinical practice in low and middle-income countries. Gynecol. Oncol. Rep. 2023, 47, 101209. [Google Scholar] [CrossRef] [PubMed]
  34. Candido, S.; Tomasello, B.M.R.; Lavoro, A.; Falzone, L.; Gattuso, G.; Libra, M. Novel Insights into Epigenetic Regulation of IL6 Pathway: In Silico Perspective on Inflammation and Cancer Relationship. Int. J. Mol. Sci. 2021, 22, 10172. [Google Scholar] [CrossRef] [PubMed]
  35. Shah, K.; Rawal, R.M. Genetic and Epigenetic Modulation of Drug Resistance in Cancer: Challenges and Opportunities. Curr. Drug Metab. 2019, 20, 1114–1131. [Google Scholar] [CrossRef] [PubMed]
  36. Kim, D.Y.; Kim, J.M. Multi-omics integration strategies for animal epigenetic studies—A review. Anim. Biosci. 2021, 34, 1271–1282. [Google Scholar] [CrossRef] [PubMed]
  37. Khanam Irin, A.; Kodamullil, A.T.; Gundel, M.; Hofmann-Apitius, M. Computational Modelling Approaches on Epigenetic Factors in Neurodegenerative and Autoimmune Diseases and Their Mechanistic Analysis. J. Immunol. Res. 2015, 2015, 737168. [Google Scholar] [CrossRef]
  38. Yang, M.; Hlady, R.A.; Zhou, D.; Ho, T.H.; Robertson, K.D. In silico DNA methylation analysis identifies potential prognostic biomarkers in type 2 papillary renal cell carcinoma. Cancer Med. 2019, 8, 5760–5768. [Google Scholar] [CrossRef] [PubMed]
  39. Lu, Y.; Chan, Y.T.; Tan, H.Y.; Li, S.; Wang, N.; Feng, Y. Epigenetic regulation in human cancer: The potential role of epi-drug in cancer therapy. Mol. Cancer 2020, 19, 79. [Google Scholar] [CrossRef]
  40. Hatzimichael, E.; Lagos, K.; Sim, V.R.; Briasoulis, E.; Crook, T. Epigenetics in diagnosis, prognostic assessment and treatment of cancer: An update. EXCLI J. 2014, 13, 954–976. [Google Scholar]
  41. Feehley, T.; O’Donnell, C.W.; Mendlein, J.; Karande, M.; McCauley, T. Drugging the epigenome in the age of precision medicine. Clin. Epigenetics 2023, 15, 6. [Google Scholar] [CrossRef]
  42. Rodriguez, H.; Zenklusen, J.C.; Staudt, L.M.; Doroshow, J.H.; Lowy, D.R. The next horizon in precision oncology: Proteogenomics to inform cancer diagnosis and treatment. Cell 2021, 184, 1661–1670. [Google Scholar] [CrossRef]
  43. Srivastava, A.; Murugaiyan, J.; Garcia, J.A.L.; De Corte, D.; Hoetzinger, M.; Eravci, M.; Weise, C.; Kumar, Y.; Roesler, U.; Hahn, M.W.; et al. Combined Methylome, Transcriptome and Proteome Analyses Document Rapid Acclimatization of a Bacterium to Environmental Changes. Front. Microbiol. 2020, 11, 544785. [Google Scholar] [CrossRef]
  44. Sepulveda, A.R.; Jones, D.; Ogino, S.; Samowitz, W.; Gulley, M.L.; Edwards, R.; Levenson, V.; Pratt, V.M.; Yang, B.; Nafa, K.; et al. CpG methylation analysis--current status of clinical assays and potential applications in molecular diagnostics: A report of the Association for Molecular Pathology. J. Mol. Diagn. 2009, 11, 266–278. [Google Scholar] [CrossRef]
  45. Bader, A.S.; Bushell, M. Damage-Net: A program for DNA repair meta-analysis identifies a network of novel repair genes that facilitate cancer evolution. DNA Repair 2021, 105, 103158. [Google Scholar] [CrossRef]
  46. Li, Z.; Jia, Y.; Zhu, H.; Yuan, H.; Xing, X.; Xin, Y.; Ma, T.; Pang, F.; Zhang, Y.; Hu, Y.; et al. Genomic landscape of microsatellite instability in Chinese tumors: A comparison of Chinese and TCGA cohorts. Int. J. Cancer 2022, 151, 1382–1393. [Google Scholar] [CrossRef] [PubMed]
  47. Russell, H.; Kedzierska, K.; Buchanan, D.D.; Thomas, R.; Tham, E.; Mints, M.; Keranen, A.; Giles, G.G.; Southey, M.C.; Milne, R.L.; et al. The MLH1 polymorphism rs1800734 and risk of endometrial cancer with microsatellite instability. Clin. Epigenetics 2020, 12, 102. [Google Scholar] [CrossRef]
  48. Damaso, E.; Castillejo, A.; Arias, M.D.M.; Canet-Hermida, J.; Navarro, M.; Del Valle, J.; Campos, O.; Fernandez, A.; Marin, F.; Turchetti, D.; et al. Primary constitutional MLH1 epimutations: A focal epigenetic event. Br. J. Cancer 2018, 119, 978–987. [Google Scholar] [CrossRef] [PubMed]
  49. van Roon, E.H.; van Puijenbroek, M.; Middeldorp, A.; van Eijk, R.; de Meijer, E.J.; Erasmus, D.; Wouters, K.A.; van Engeland, M.; Oosting, J.; Hes, F.J.; et al. Early onset MSI-H colon cancer with MLH1 promoter methylation, is there a genetic predisposition? BMC Cancer 2010, 10, 180. [Google Scholar] [CrossRef] [PubMed]
  50. Schafer, A.; Schomacher, L.; Barreto, G.; Doderlein, G.; Niehrs, C. Gemcitabine functions epigenetically by inhibiting repair mediated DNA demethylation. PLoS ONE 2010, 5, e14060. [Google Scholar] [CrossRef]
  51. Umene, K.; Banno, K.; Kisu, I.; Yanokura, M.; Nogami, Y.; Tsuji, K.; Masuda, K.; Ueki, A.; Kobayashi, Y.; Yamagami, W.; et al. New candidate therapeutic agents for endometrial cancer: Potential for clinical practice (review). Oncol. Rep. 2013, 29, 855–860. [Google Scholar] [CrossRef] [PubMed]
  52. Martinez-Mendez, D.; Mendoza, L.; Villarreal, C.; Huerta, L. Continuous Modeling of T CD4 Lymphocyte Activation and Function. Front. Immunol. 2021, 12, 743559. [Google Scholar] [CrossRef]
  53. Gasser, S.; Raulet, D. The DNA damage response, immunity and cancer. Semin. Cancer Biol. 2006, 16, 344–347. [Google Scholar] [CrossRef]
  54. Pineda, M.; Mur, P.; Iniesta, M.D.; Borras, E.; Campos, O.; Vargas, G.; Iglesias, S.; Fernandez, A.; Gruber, S.B.; Lazaro, C.; et al. MLH1 methylation screening is effective in identifying epimutation carriers. Eur. J. Hum. Genet. 2012, 20, 1256–1264. [Google Scholar] [CrossRef]
  55. Zhang, S.; Yang, G. IL22RA1/JAK/STAT Signaling Acts As a Cancer Target Through Pan-Cancer Analysis. Front. Immunol. 2022, 13, 915246. [Google Scholar] [CrossRef] [PubMed]
  56. Li, J.; Ramzan, F.; Zhong, G. Investigating novel biomarkers in uterine corpus endometrial carcinoma: In silico analysis and clinical specimens validation via RT-qPCR and immunohistochemistry. Am. J. Cancer Res. 2023, 13, 4376–4400. [Google Scholar] [PubMed]
  57. Lawlor, R.T.; Mattiolo, P.; Mafficini, A.; Hong, S.M.; Piredda, M.L.; Taormina, S.V.; Malleo, G.; Marchegiani, G.; Pea, A.; Salvia, R.; et al. Tumor Mutational Burden as a Potential Biomarker for Immunotherapy in Pancreatic Cancer: Systematic Review and Still-Open Questions. Cancers 2021, 13, 3119. [Google Scholar] [CrossRef]
  58. Brito, A.B.C.; Camandaroba, M.P.G.; de Lima, V.C.C. Anti-PD1 versus anti-PD-L1 immunotherapy in first-line therapy for advanced non-small cell lung cancer: A systematic review and meta-analysis. Thorac. Cancer 2021, 12, 1058–1066. [Google Scholar] [CrossRef] [PubMed]
  59. Kientz, C.; Prieur, F.; Clemenson, A.; Joly, M.O.; Stachowicz, M.L.; Auclair, J.; Attignon, V.; Schiappa, R.; Wang, Q. MLH1 promoter hypermethylation: Are you absolutely sure about the absence of MLH1 germline mutation? About a new case. Fam. Cancer 2020, 19, 11–14. [Google Scholar] [CrossRef] [PubMed]
  60. Li, G.M. Mechanisms and functions of DNA mismatch repair. Cell Res. 2008, 18, 85–98. [Google Scholar] [CrossRef] [PubMed]
  61. Furman, C.M.; Elbashir, R.; Alani, E. Expanded roles for the MutL family of DNA mismatch repair proteins. Yeast 2021, 38, 39–53. [Google Scholar] [CrossRef]
  62. O’Brien, V.; Brown, R. Signalling cell cycle arrest and cell death through the MMR System. Carcinogenesis 2006, 27, 682–692. [Google Scholar] [CrossRef] [PubMed]
  63. Baker, S.M.; Plug, A.W.; Prolla, T.A.; Bronner, C.E.; Harris, A.C.; Yao, X.; Christie, D.M.; Monell, C.; Arnheim, N.; Bradley, A.; et al. Involvement of mouse Mlh1 in DNA mismatch repair and meiotic crossing over. Nat. Genet. 1996, 13, 336–342. [Google Scholar] [CrossRef] [PubMed]
  64. Guan, J.; Lu, C.; Jin, Q.; Lu, H.; Chen, X.; Tian, L.; Zhang, Y.; Ortega, J.; Zhang, J.; Siteni, S.; et al. MLH1 Deficiency-Triggered DNA Hyperexcision by Exonuclease 1 Activates the cGAS-STING Pathway. Cancer Cell 2021, 39, 109–121.e105. [Google Scholar] [CrossRef] [PubMed]
  65. Kawashima, N.; Yoshida, H.; Miwa, M.; Fujiwara, K. MLH1 Is a Prognostic Biomarker for Serous Ovarian Cancer Treated With Platinum- and Taxane-based Chemotherapy. Anticancer. Res. 2019, 39, 5505–5513. [Google Scholar] [CrossRef] [PubMed]
  66. Romeo, F.; Falbo, L.; Di Sanzo, M.; Misaggi, R.; Faniello, M.C.; Viglietto, G.; Cuda, G.; Costanzo, F.; Quaresima, B. BRCA1 is required for hMLH1 stabilization following doxorubicin-induced DNA damage. Int. J. Biochem. Cell Biol. 2011, 43, 1754–1763. [Google Scholar] [CrossRef] [PubMed]
  67. Hinrichsen, I.; Ernst, B.P.; Nuber, F.; Passmann, S.; Schafer, D.; Steinke, V.; Friedrichs, N.; Plotz, G.; Zeuzem, S.; Brieger, A. Reduced migration of MLH1 deficient colon cancer cells depends on SPTAN1. Mol. Cancer 2014, 13, 11. [Google Scholar] [CrossRef] [PubMed]
  68. Ackermann, A.; Schrecker, C.; Bon, D.; Friedrichs, N.; Bankov, K.; Wild, P.; Plotz, G.; Zeuzem, S.; Herrmann, E.; Hansmann, M.L.; et al. Downregulation of SPTAN1 is related to MLH1 deficiency and metastasis in colorectal cancer. PLoS ONE 2019, 14, e0213411. [Google Scholar] [CrossRef]
  69. Fredriksson, K.; Van Itallie, C.M.; Aponte, A.; Gucek, M.; Tietgens, A.J.; Anderson, J.M. Proteomic analysis of proteins surrounding occludin and claudin-4 reveals their proximity to signaling and trafficking networks. PLoS ONE 2015, 10, e0117074. [Google Scholar] [CrossRef]
  70. Chow, R.D.; Michaels, T.; Bellone, S.; Hartwich, T.M.P.; Bonazzoli, E.; Iwasaki, A.; Song, E.; Santin, A.D. Distinct Mechanisms of Mismatch-Repair Deficiency Delineate Two Modes of Response to Anti-PD-1 Immunotherapy in Endometrial Carcinoma. Cancer Discov. 2023, 13, 312–331. [Google Scholar] [CrossRef]
  71. Goltz, D.; Gevensleben, H.; Dietrich, J.; Dietrich, D. PD-L1 (CD274) promoter methylation predicts survival in colorectal cancer patients. Oncoimmunology 2017, 6, e1257454. [Google Scholar] [CrossRef]
  72. Goldman, M.; Craft, B.; Swatloski, T.; Cline, M.; Morozova, O.; Diekhans, M.; Haussler, D.; Zhu, J. The UCSC Cancer Genomics Browser: Update 2015. Nucleic Acids Res. 2015, 43, D812–D817. [Google Scholar] [CrossRef] [PubMed]
  73. Ritchie, M.E.; Phipson, B.; Wu, D.; Hu, Y.; Law, C.W.; Shi, W.; Smyth, G.K. limma powers differential expression analyses for RNA-sequencing and microarray studies. Nucleic Acids Res. 2015, 43, e47. [Google Scholar] [CrossRef] [PubMed]
  74. Gao, J.; Aksoy, B.A.; Dogrusoz, U.; Dresdner, G.; Gross, B.; Sumer, S.O.; Sun, Y.; Jacobsen, A.; Sinha, R.; Larsson, E.; et al. Integrative analysis of complex cancer genomics and clinical profiles using the cBioPortal. Sci. Signal 2013, 6, pl1. [Google Scholar] [CrossRef] [PubMed]
  75. Chen, B.; Khodadoust, M.S.; Liu, C.L.; Newman, A.M.; Alizadeh, A.A. Profiling Tumor Infiltrating Immune Cells with CIBERSORT. Methods Mol. Biol. 2018, 1711, 243–259. [Google Scholar] [CrossRef] [PubMed]
Figure 1. Cancer methylome landscape and MLH1 correlation analysis. ccRCC: clear cell renal cell carcinoma; GBM: glioblastoma; HNSCC: head and neck squamous cell carcinoma; LUAD: lung adenocarcinoma; UCEC: uterine corpus endometrial carcinoma; MLH1: MutL Homolog 1; HR: Hazard ratio. (A) Correlation between RNA expression and protein abundance of hypermethylation (blue), normal methylation (grey), and hypomethylation (yellow) (B) Significance of methylation associated with transcriptomic and proteomic changes. (C) Identification of common and cancer type-specific methylations. (D) Potentially druggable genes that are significantly upregulated within the five cancer types (ccRCC, GBM, HNSCC, LUAD, and UCEC) (E) Kaplan–Meier analysis of the correlation between MLH1 expression and overall survival in UCEC (F) Kaplan–Meier analysis of the correlation between MLH1 expression and disease-free survival in UCEC.
Biomedinformatics 04 00019 g001
Figure 2. Gene set enrichment analysis (GSEA) of MLH1. (A) GO functional annotation of MLH1 reveals MLH1′s potential biological functions in mismatch repair in cancer and somatic hypermutation of immunoglobulin genes. (B) GO functional annotation of molecular functions of MLH1 in mismatch DNA binding in cancer and ATPase activity. (C) GO functional annotation of MLH1 involvement in mismatch repair in cancer and the DNA repair complex. (D) KEGG pathway analysis of MLH1 indicated that it was most commonly involved in mismatch repair and the Fanconi anemia pathway.
Biomedinformatics 04 00019 g002
Figure 3. The characteristic genetic alteration characteristics of MLH1 in UCEC and immune cell infiltration level by copy number. (A) The alteration frequency of MLH1 with different types of mutations and putative copy numbers of MLH1 in UCEC (B) The boxplots show genes with the strongest up-regulation that are significantly associated with MLH1 mutations in UCEC. (C) Co-occurrence of genetic mutations in tumors with MLH1 alterations among UCEC. (D)MLH1 and immune cell infiltration level by copy number in UCEC. * p < 0.05, ** p < 0.01.
Biomedinformatics 04 00019 g003
Figure 4. Deferentially expressed genes (DEGs) associated with gemcitabine chemoresistance and its prognosis in the TCGA cohort. (A) Stacked box plots comparing the expression profiles of gemcitabine-resistant genes. (B) MLH1 on gemcitabine sensitivity, with an AUC of 0.750 in the validation dataset. (C) ASXL1 on gemcitabine-sensitivity, with an AUC of 0.640 in the validation dataset. (D) MDM2 on gemcitabine-sensitivity, with an AUC of 0.520 in the validation dataset. (E) EBRR2 on gemcitabine-sensitivity, with an AUC of 0.6 in the validation data set. GEO, Gene Expression Omnibus; AUC, Area under curve.
Biomedinformatics 04 00019 g004
Figure 5. Therapeutic sensitivity analyses; * p < 0.05; ** p < 0.01. Comparison of therapeutic responses between high-risk and low-risk patients in UCEC for: (A) Gemcitabine. (B) Imatinib. (C) Lenalidomide. (D) Rapamycin. (E) Roscovitine. (F) Sorafenib.
Biomedinformatics 04 00019 g005
Figure 6. Correlation between MLH1 expression and immune cell infiltration and immune scores in UCEC. (A) Correlation between MLH1 expression and immune cell infiltration levels in UCEC (B) Kaplan–Meier plot of cumulative survival associated with the probability curve of the MLH1 gene in UCEC. cor, correlation.
Biomedinformatics 04 00019 g006
Figure 7. The correlation between MLH1 expression and immune-related biomarkers in the TISIDB database. The co-expression heatmaps show the association between HIC1 expression. (A) Immunostimulator genes significantly associated with MLH1 expression (CD40 and CXCL12). (B) Immunoinhibitors genes significantly associated with MLH1 expression (IL10 and IL10RB). (C) MHC genes significantly associated with MLH1 expression (HLA-DOA and HLADMB). (D) Tumor-infiltrating lymphocytes (TILs) significantly associated with MLH1 expression (activated CD4+ T cells).
Biomedinformatics 04 00019 g007
Figure 8. The correlation between MLH1 expression and TMB levels, MSI events, and immunotherapeutic efficacy. (A) MLH1 efficacy/GSE17025. (B) MLH1 efficacy/GSE115810.
Biomedinformatics 04 00019 g008
Figure 9. Flowchart describing the schematic overview of the study design, outlining the impact of depleted MLH1 expression on predicting prognosis and immunotherapeutic efficacy in UCEC.
Biomedinformatics 04 00019 g009
Table 1. The details of gene expression profiles of endometrial cancer (EC) (GSE115810, GSE17025, GSE36389).
DatasetsTissueTumorNormalPlatform
GSE115810Endometrium243GPL96
GSE170259112GPL570
GSE3689137GPL96
Disclaimer/Publisher’s Note: The statements, opinions and data contained in all publications are solely those of the individual author(s) and contributor(s) and not of MDPI and/or the editor(s). MDPI and/or the editor(s) disclaim responsibility for any injury to people or property resulting from any ideas, methods, instructions or products referred to in the content.

