Article

Using Machine Learning to Expand the Ann Arbor Staging System for Hodgkin and Non-Hodgkin Lymphoma

1
Division of Biometrics IX, OB/OTS/CDER, FDA, Silver Spring, MD 10903, USA
2
Department of Public Health Sciences, Penn State Cancer Institute, Hershey, PA 17033, USA
3
School of Public Health, University of Maryland, College Park, MD 20742, USA
4
Department of Mathematics, Drexel University, Philadelphia, PA 19104, USA
5
Department of Preventive Medicine & Biostatistics, F. Edward Hébert School of Medicine, Uniformed Services University of the Health Sciences, Bethesda, MD 20814, USA
*
Author to whom correspondence should be addressed.
BioMedInformatics 2023, 3(3), 514-525; https://doi.org/10.3390/biomedinformatics3030035
Submission received: 8 May 2023 / Revised: 5 June 2023 / Accepted: 27 June 2023 / Published: 3 July 2023
(This article belongs to the Special Issue Feature Papers in Computational Biology and Medicine)

Abstract

:
The Ann Arbor system is disadvantaged in utilizing information from additional prognostic factors. In this study, we applied the Ensemble Algorithm for Clustering Cancer Data (EACCD) to create a prognostic system for lymphoma that integrates additional prognostic factors. Hodgkin and non-Hodgkin lymphoma survival data were extracted from the Surveillance, Epidemiology, and End Results Program of the National Cancer Institute and divided into the training set (131,725 cases) and the validation set (15,683 cases). Five prognostic factors were studied: Ann Arbor stage, type, site, age, and sex. EACCD was applied to the training set to produce a prognostic system, called an EACCD system, for convenience. The EACCD system stratified patients into eight prognostic groups with well-separated survival curves. These eight prognostic groups had significantly higher accuracies in survival prediction than the 24 Ann Arbor substages. A higher-risk group in the EACCD system roughly corresponds to a higher Ann Arbor substage. The proposed system shows a good performance in risk stratification and survival prediction on both the training and the validation sets. The EACCD system expands the traditional Ann Arbor staging system by leveraging additional prognostic information and is expected to advance treatment management for lymphoma patients.

1. Introduction

Lymphoma is a hematologic malignancy of the lymphatic system originating from lymphocytes. It is the most common hematologic malignancy and the third most common childhood cancer [1]. Lymphoma is generally divided into Hodgkin lymphoma (HL) and non-Hodgkin lymphoma (NHL). Characterized by the presence of Reed–Sternberg cells, HL accounts for about 10% of cases of newly diagnosed lymphoma in the United States [2]. The risk of HL peaks when a person is in early adulthood or at age 55 and older [3]. In 2020, HL contributes 0.4% of new cases and 0.2% of new deaths of all types of cancer worldwide [4]. Compared to HL, NHL is a rather common type of cancer. It is responsible for 2.8% of new cases and 2.6% of new deaths of all types of cancer worldwide in 2020 [4].
Analogous to solid tumors, lymphoma is staged to facilitate the patient’s prognosis and treatment management. The routinely used system is the Ann Arbor staging system. The Ann Arbor system was originally designed for only Hodgkin lymphoma in 1971 by the Committee on Hodgkin’s Disease Staging Classification in Ann Arbor, Michigan, and subsequently applied to NHL as well [5,6]. Based on the extension of the nodal area, the Ann Arbor system classifies patients with lymphoma into four principal stages I–IV. In light of the presence of localized extralymphatic movement in extranodal sites, the involvement of the spleen, and symptoms of fever, night sweats, and weight loss (B symptoms), the principal stages can be further divided into 24 substages.
Staging plays an important role in the treatment approach to lymphoma. Depending on the stage, Hodgkin’s disease is usually treated with different drugs, doses, and cycles of chemotherapy with or without radiotherapy [7]. The standard treatment approach for NHL is a combination of chemotherapy and target therapy, with specific treatment management determined by the stage and other risk factors [8]. Some novel treatment approaches, including stem cell transplantation and immunotherapy, are under active research, and their applications also require the accurate staging of the disease [9,10].
Factors such as site (nodal or extranodal), type (Hodgkin lymphoma or non-Hodgkin lymphoma), age, and sex are known to have important prognostic value [6,11,12]. Unfortunately, the Ann Arbor system is unable to leverage the rich prognostic information of these factors. Several models based on Cox regression and survival trees have been developed to incorporate additional factors into the Ann Arbor system [13,14,15,16]. However, these models were not designed for cancer staging and thus cannot adequately address the need for staging. The Cox models rely on the proportional hazard assumption, which is usually unmet in practice. In addition, by default, Cox models do not produce explicit rules to stratify patients into risk groups as does a staging system such as the Ann Arbor system. Although cutoffs and quantiles have been used to partition patients [17,18], the grouping rules are implicit, and the numbers of groups are very small (e.g., low-/intermediate-/high-risk groups). It is true that survival trees do not generate a sufficient number of groups either. And it has also been shown that the accuracies of tree models are generally low [19]. Therefore, neither Cox nor survival tree modeling is a suitable method for lymphoma staging.
In recent years, machine-learning algorithms have evolved, and the Ensemble Algorithm for Clustering Cancer Data (EACCD) [20,21,22,23,24,25], a novel machine-learning algorithm for grouping subjects, has been successfully applied to a variety of solid tumors [26,27,28,29,30,31]. In this article, we demonstrated that EACCD can also be applied to develop a prognostic system for lymphoma. Utilizing the information of additional prognostic factors (i.e., type, site, age, and sex) from a big lymphoma dataset, we expanded and enhanced the traditional Ann Arbor staging system for lymphoma patients by producing more accurate prognostic groups. The proposed system has been validated internally and temporally to ensure reproducibility in the future.

2. Material and Methods
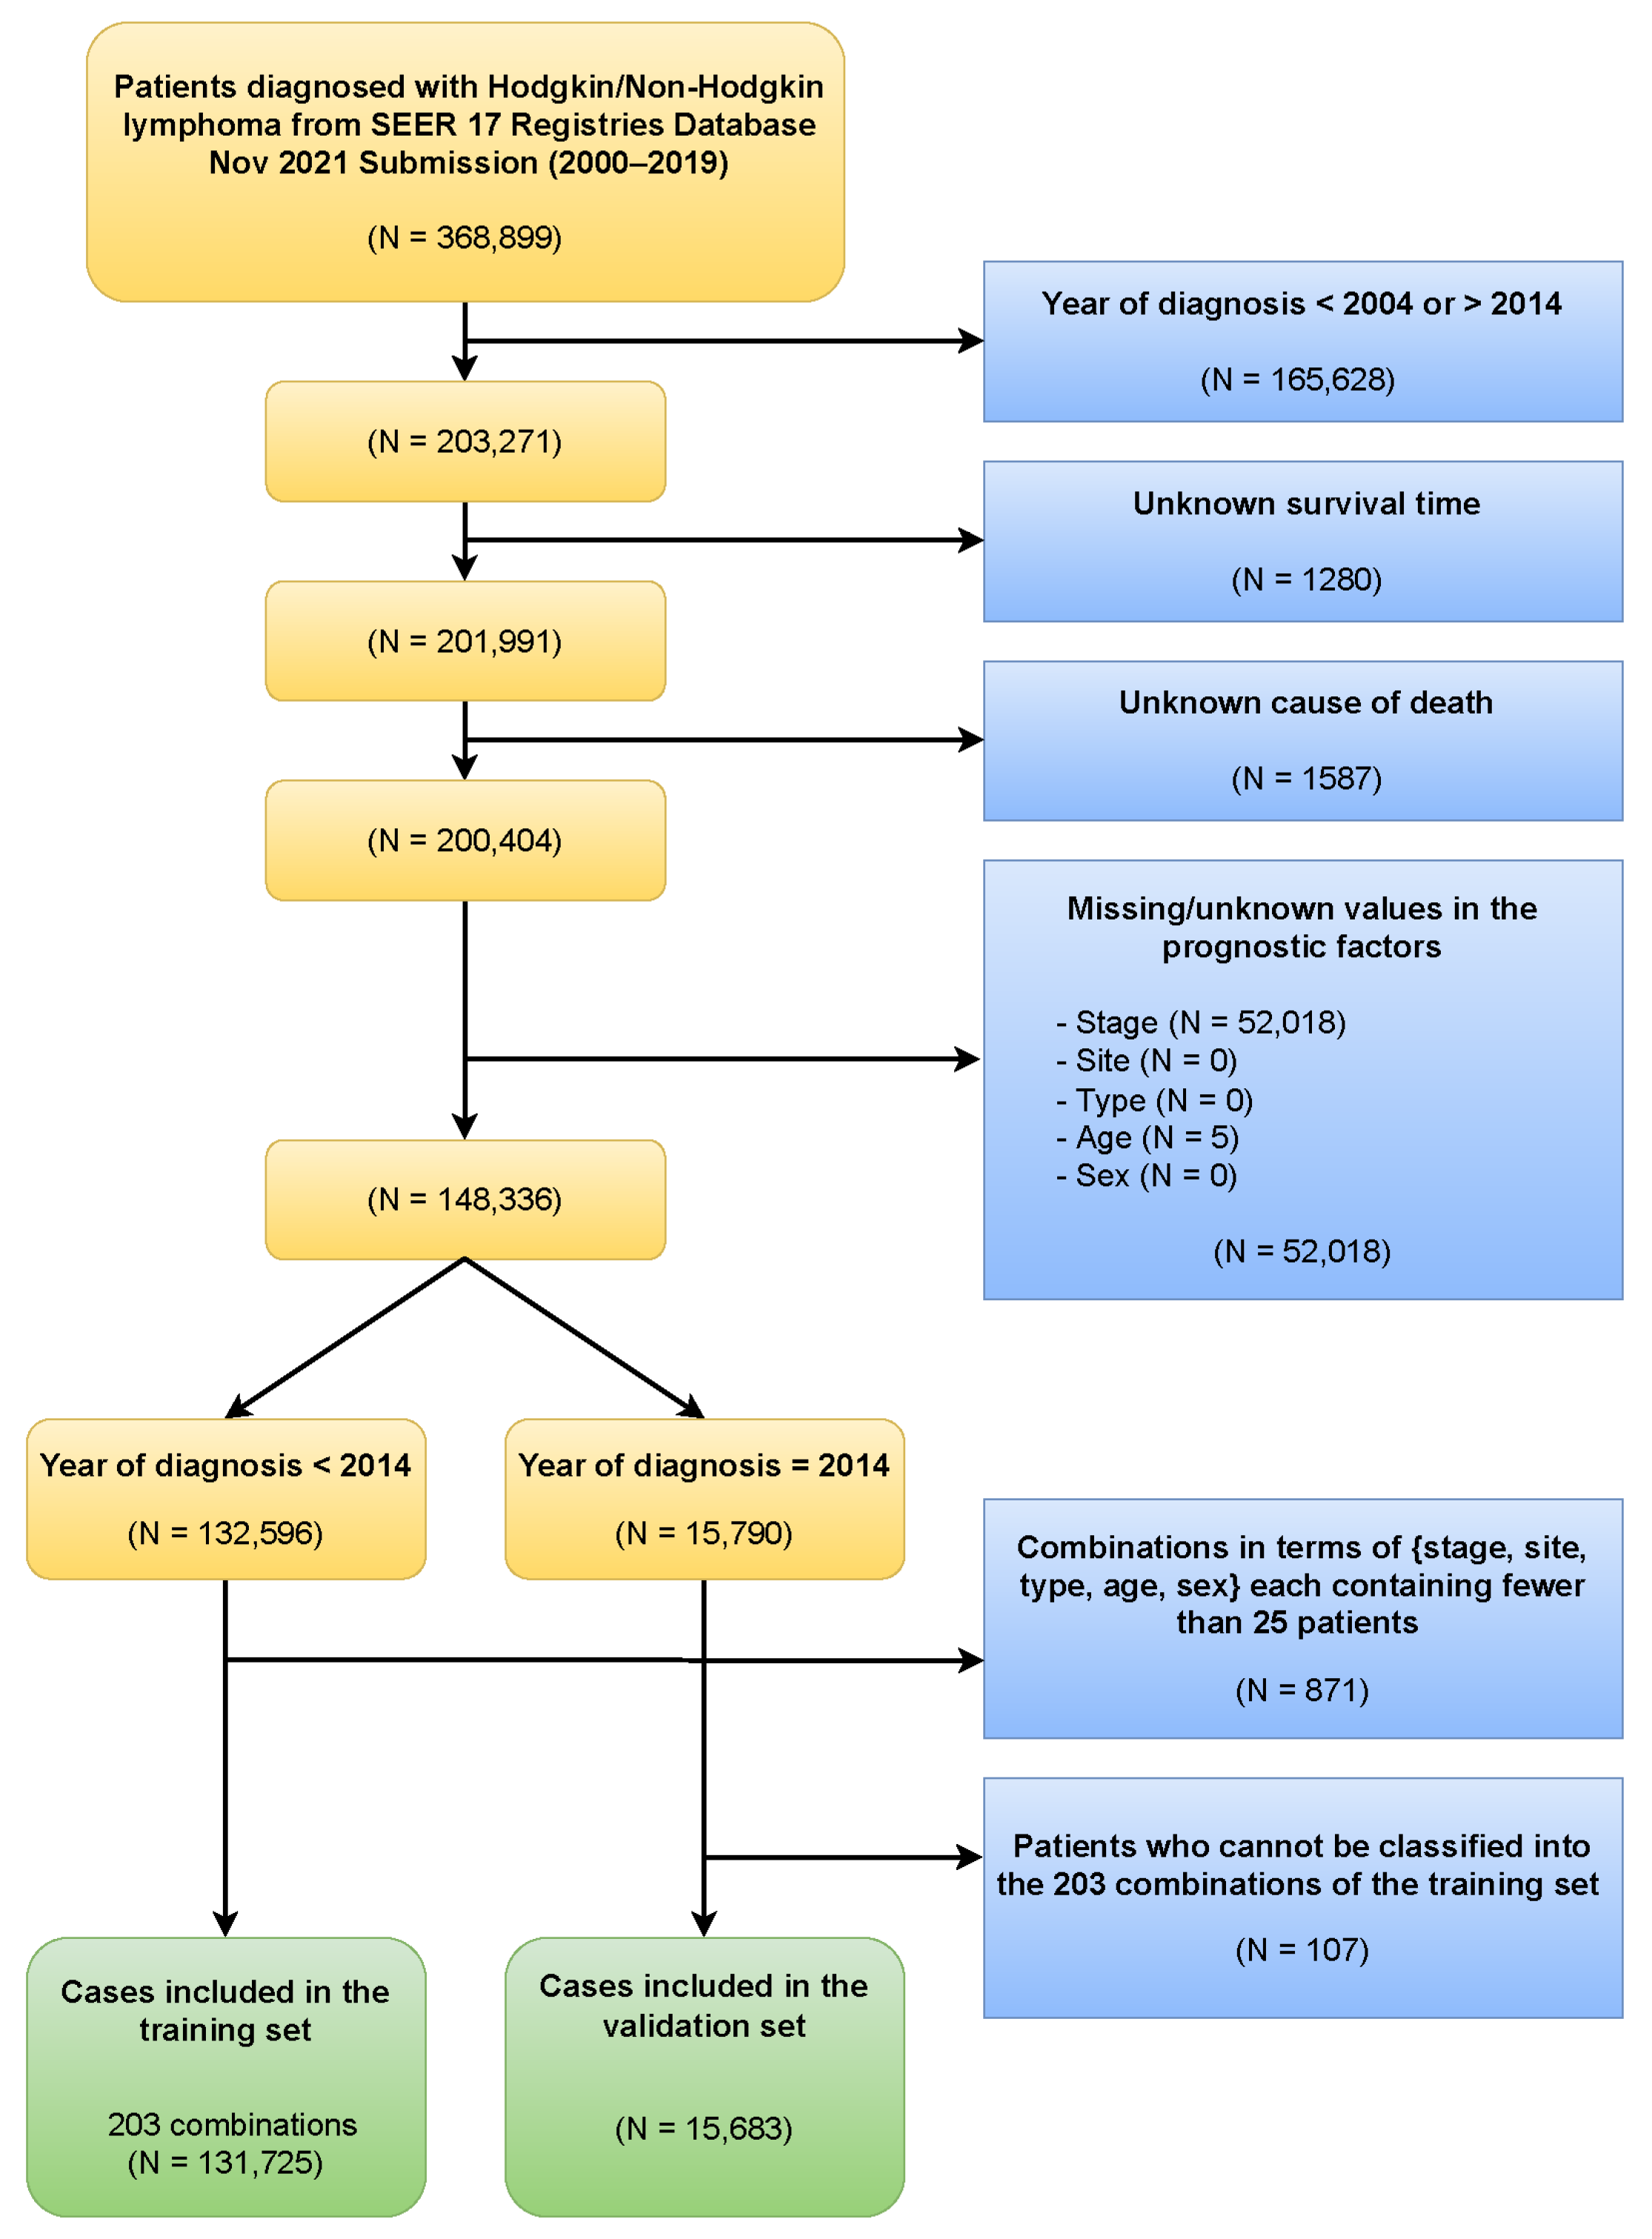
2.1. Data

A total of 203,271 HL/NHL patients diagnosed between 2004 and 2014 were retrieved from 17 databases of the Surveillance, Epidemiology, and End Results Program (SEER) of the National Cancer Institute [32]. We excluded cases before 2004 as it was the first year that included the tumor extension information required for classifying substages in the Ann Arbor system. We excluded cases after 2014 because 2014 was the last year that allowed a follow up of at least five years.
For our study data, we included survival time (measured in months) and SEER cause-specific death classification variable [33] to conduct the lymphoma-specific survival analysis. We also included the grouping of the Ann Arbor staging system in our study. The Ann Arbor system has four principal stages (I, II, III, and IV). Depending on the anatomic extent of the disease and the presence of defined constitutional symptoms, the Ann Arbor principal stages can be further divided into 24 substages (IA/B, IEA/B, ISA/B, IIA/B, IIEA/B, IISA/B, IIESA/B, IIIA/B, IIIEA/B, IIISA/B, IIIESA/B, and IVA/B). This detailed grouping was treated as a factor in our study, denoted stage for simplicity. In addition, we included the following factors: site (nodal (N) or extranodal (EN)), type (Hodgkin lymphoma (HL) or non-Hodgkin lymphoma (NHL)), age (young (Y) or old (O)), and sex (female (F) or male (M)). These variables have been shown to have significant prognostic values and were defined in the vast majority of lymphoma patients in the SEER database [6,11,12]. For age, we used 60 years as the cut off between young and old, which is the same as the cut-off age in two commonly used prognostic systems for lymphoma patients: Risk factors in the International Prognostic Index (IPI) for NHL and Risk factors in the Follicular Lymphoma Prognostic Index (FLIPI) for follicular lymphoma [12]. Detailed definitions of levels of stage, site, type, age, and sex are provided in Supplementary Table S1. Other variables used for prognosis, such as hemoglobin level and white blood cell count, were not collected in the SEER database and therefore were not included. We use a combination of levels of the prognostic factors (in the order of stage, site, type, age, and sex) to represent a subset of patients with corresponding levels. For example, the combination “IIA EN HL O F” represents a subset of patients with stage = IIA, site = EN, type = HL, age = O, and sex = F. We required patients in our study data to have a known level for each factor so that their corresponding combinations could be determined.
For validation purposes, all the cases diagnosed before 2014 were used to form the training set, and cases diagnosed in 2014 as the validation set. In the training set, we only retained combinations in terms of stage, site, type, age, and sex with at least 25 patients for a more accurate survival estimation. The final training set consists of 203 combinations, with a total number of 131,725 patients. To match the training set, we excluded from the validation set cases who cannot be classified into any of the 203 combinations of the training set. The final validation set consists of 15,683 patients. The detailed data management process is shown in Figure 1. The clinical and demographic characteristics of the training and validation sets are presented in Table 1.

2.2. EACCD

The EACCD is a machine-learning algorithm designed to partition survival data. It involves three main steps [25,29]: (1) defining initial dissimilarities between survival functions of any two combinations; (2) obtaining learned dissimilarities using initial dissimilarities and an ensemble learning process; (3) applying hierarchical clustering analysis to cluster combinations using the learned dissimilarities and a linkage method. There are several approaches for each step, and we adopted the following settings in this study. In step 1, the initial dissimilarities were measured by the effect size constructed using the Gehan-Wilcoxon test [25]. In step 2, the ensemble learning process was based on the two-phase Partitioning Around Medoids algorithm [34]. In step 3, the minimax linkage method [35] was chosen for hierarchical clustering. The output of step 3 is a tree-structured dendrogram. A C-index curve was constructed using the dendrogram, and then the optimal number n* of prognostic groups was found using the “knee” point of the C-index curve. Finally, n* prognostic groups were obtained by cutting the dendrogram [25,26].
The C-index was introduced by Harrell et al. to assess the predictive accuracy of survival data [36]: a value of 0.5 indicates no predictive discrimination; a value of 1 indicates perfect predictive discrimination. A higher C-index implies a higher accuracy in survival prediction. The equations for computing the C-index are available in [37].

2.3. Prognostic Systems

Survival curves for the n* prognostic groups were plotted using the Kaplan–Meier estimates [38]. These curves allow for visually examining survival differences among the prognostic groups. The final prognostic system, named EACCD prognostic system for convenience, is a collection of the dendrogram, group assignment, C-index, and survival curves for the prognostic groups.

2.4. Validation Method

The EACCD prognostic system was validated internally on the training set and temporally on the validation set [39]. The internal and temporal validations, both assessing the performance of risk stratification and survival prediction, aimed to verify the system’s validity and reproducibility, respectively. The risk stratification was assessed by examining the survival curves of prognostic groups and comparing the adjacent groups using the logrank test and the univariate Cox proportional hazards regression model. The survival prediction was evaluated by computing the C-index.

2.5. Software

All statistical analyses were conducted in R (Version 4.2.2) using the following libraries: survival (Version 3.4-0), cluster (Version 2.1.4), protoclust (Version 1.6.4), factoextra (Version 1.0.7), compareC (Version 1.3.2), and their respective dependencies.

3. Results

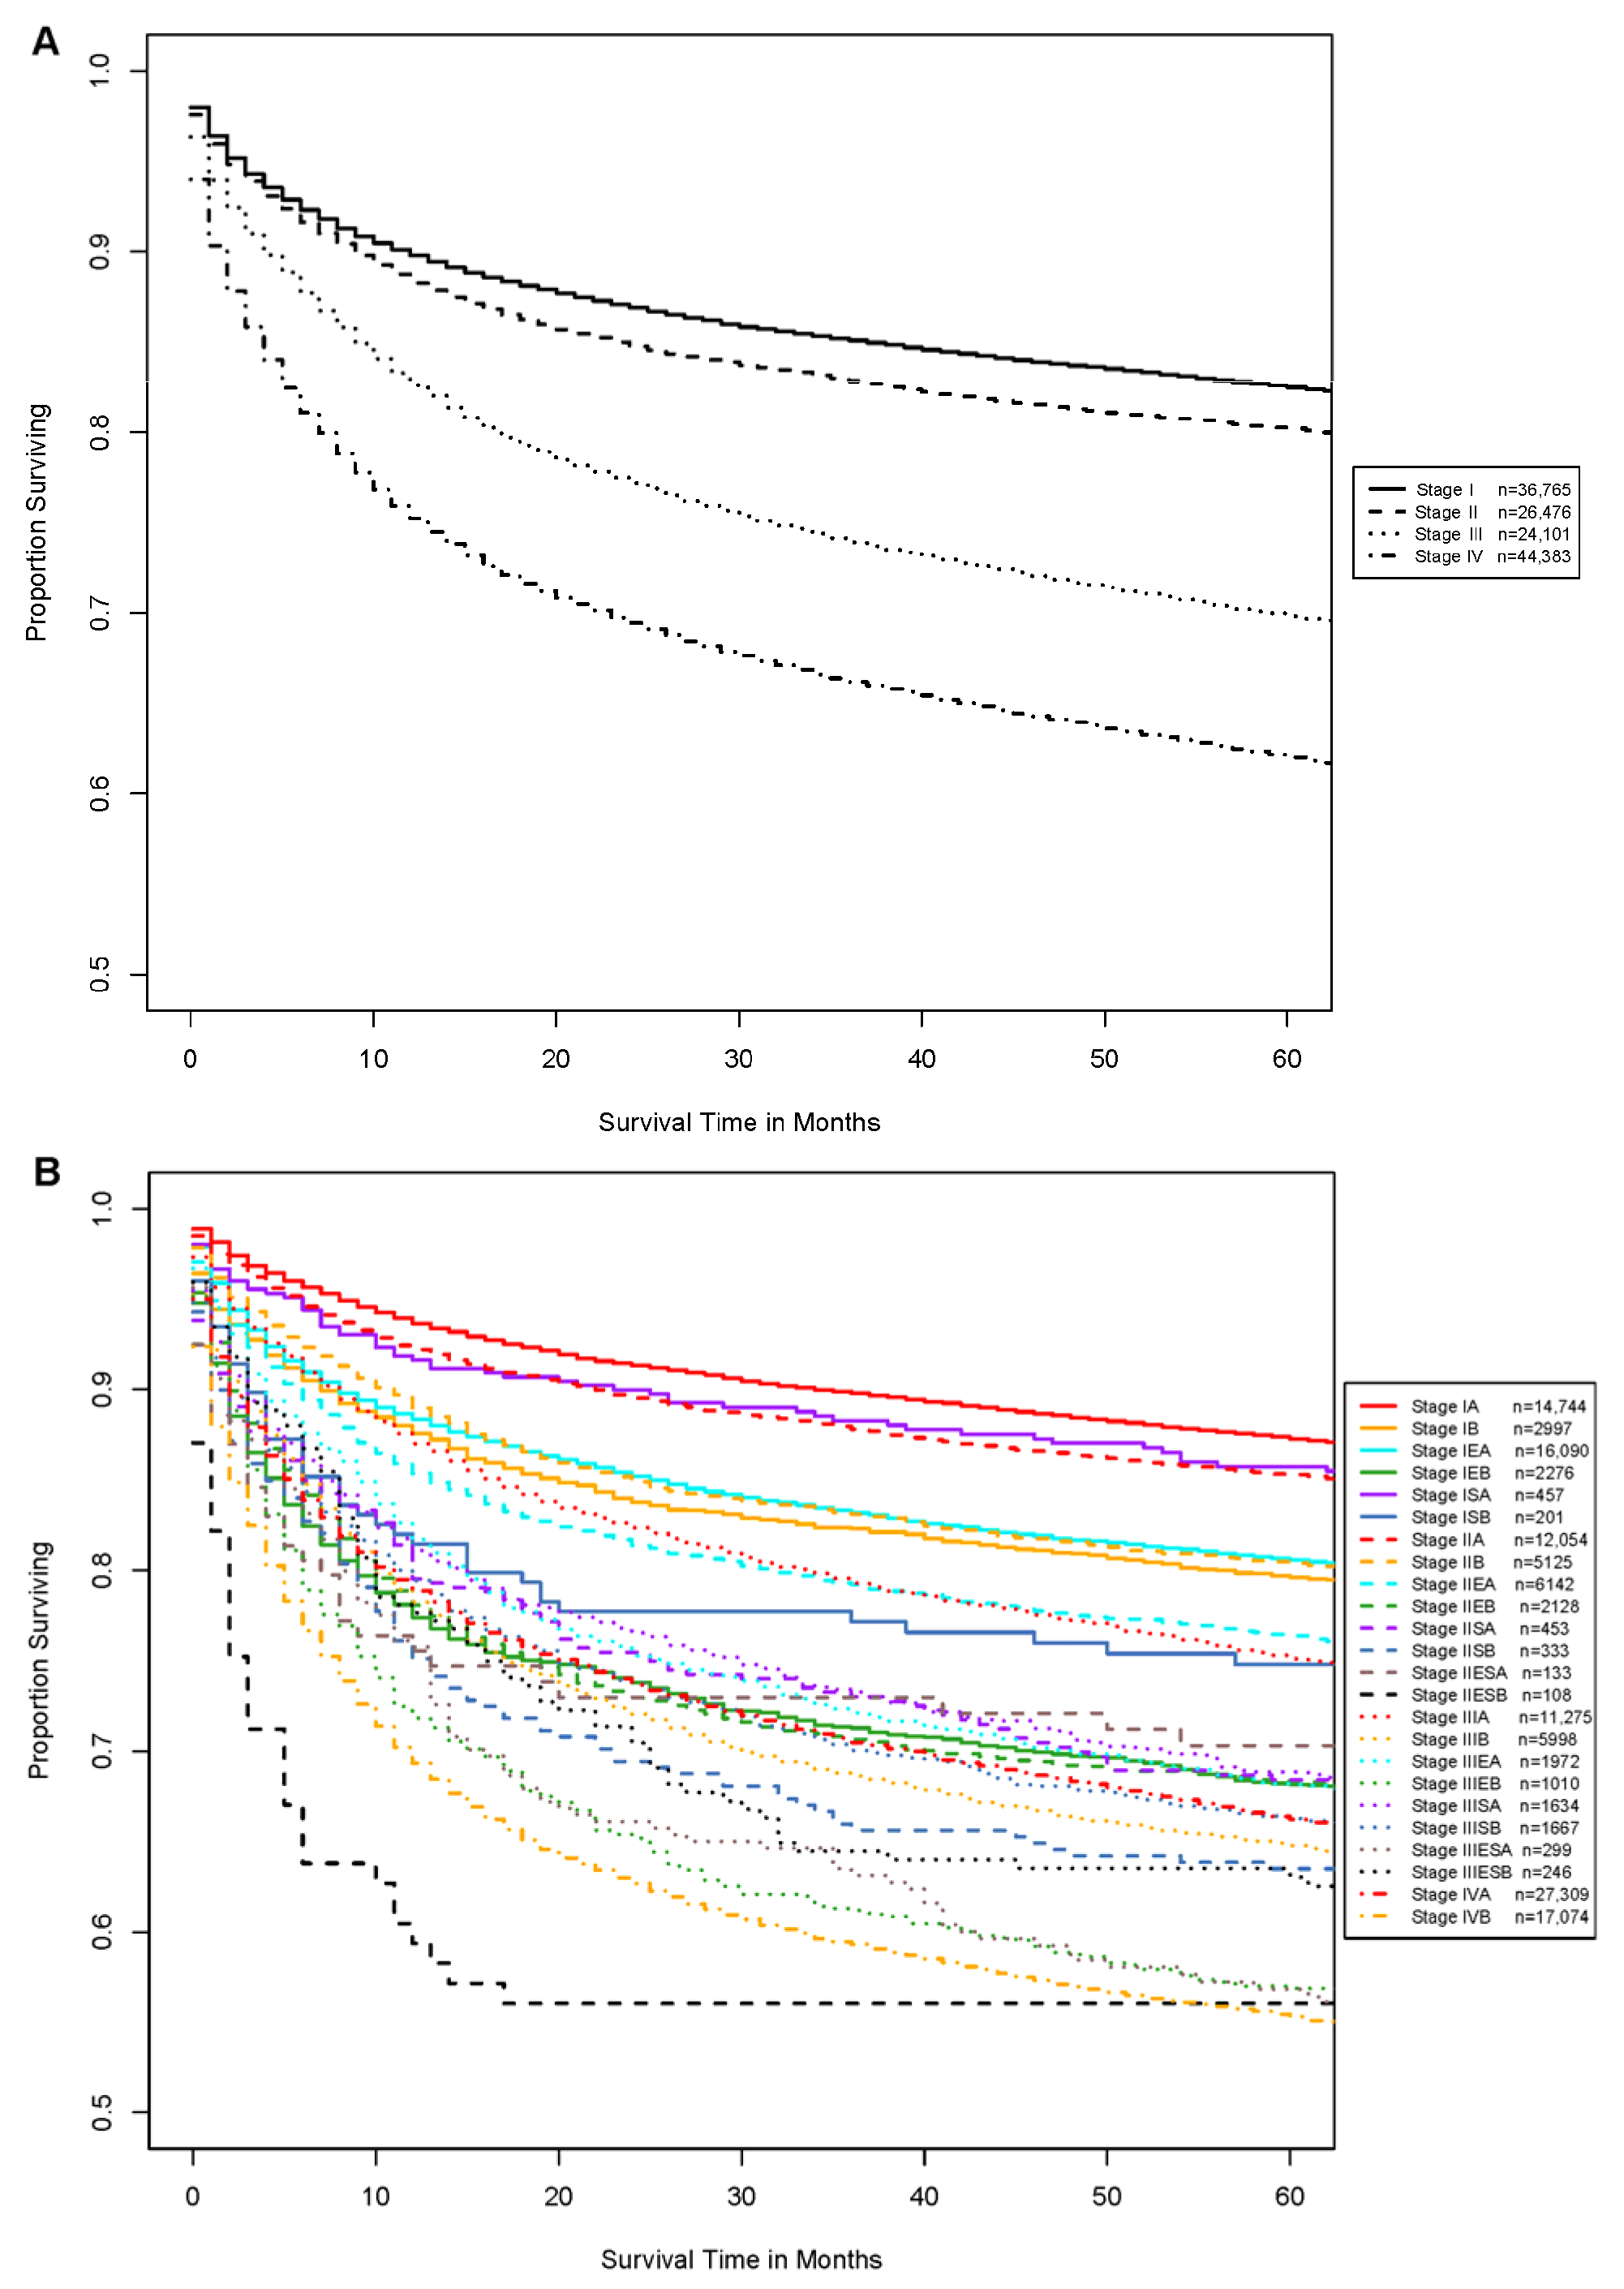
3.1. Ann Arbor Staging System

Based on the training data from this study, the survival curves corresponding to the principal stages and substages of the Ann Arbor system are shown in Figure 2A and Figure 2B, respectively. Concerning only the principal stages, the Ann Arbor staging system has a C-index of 0.6058. Considering only the substages and assuming the expected survival in the order of IA > IB > IEA > IEB > ISA > ISB > IIA > IIB > IIEA > IIEB > IISA > IISB > IIESA > IIESB > IIIA > IIIB > IIIEA > IIIEB > IIISA > IIISB > IIIESA > IIIESB > IVA > IVB, the Ann Arbor staging system has a C-index of 0.6207.

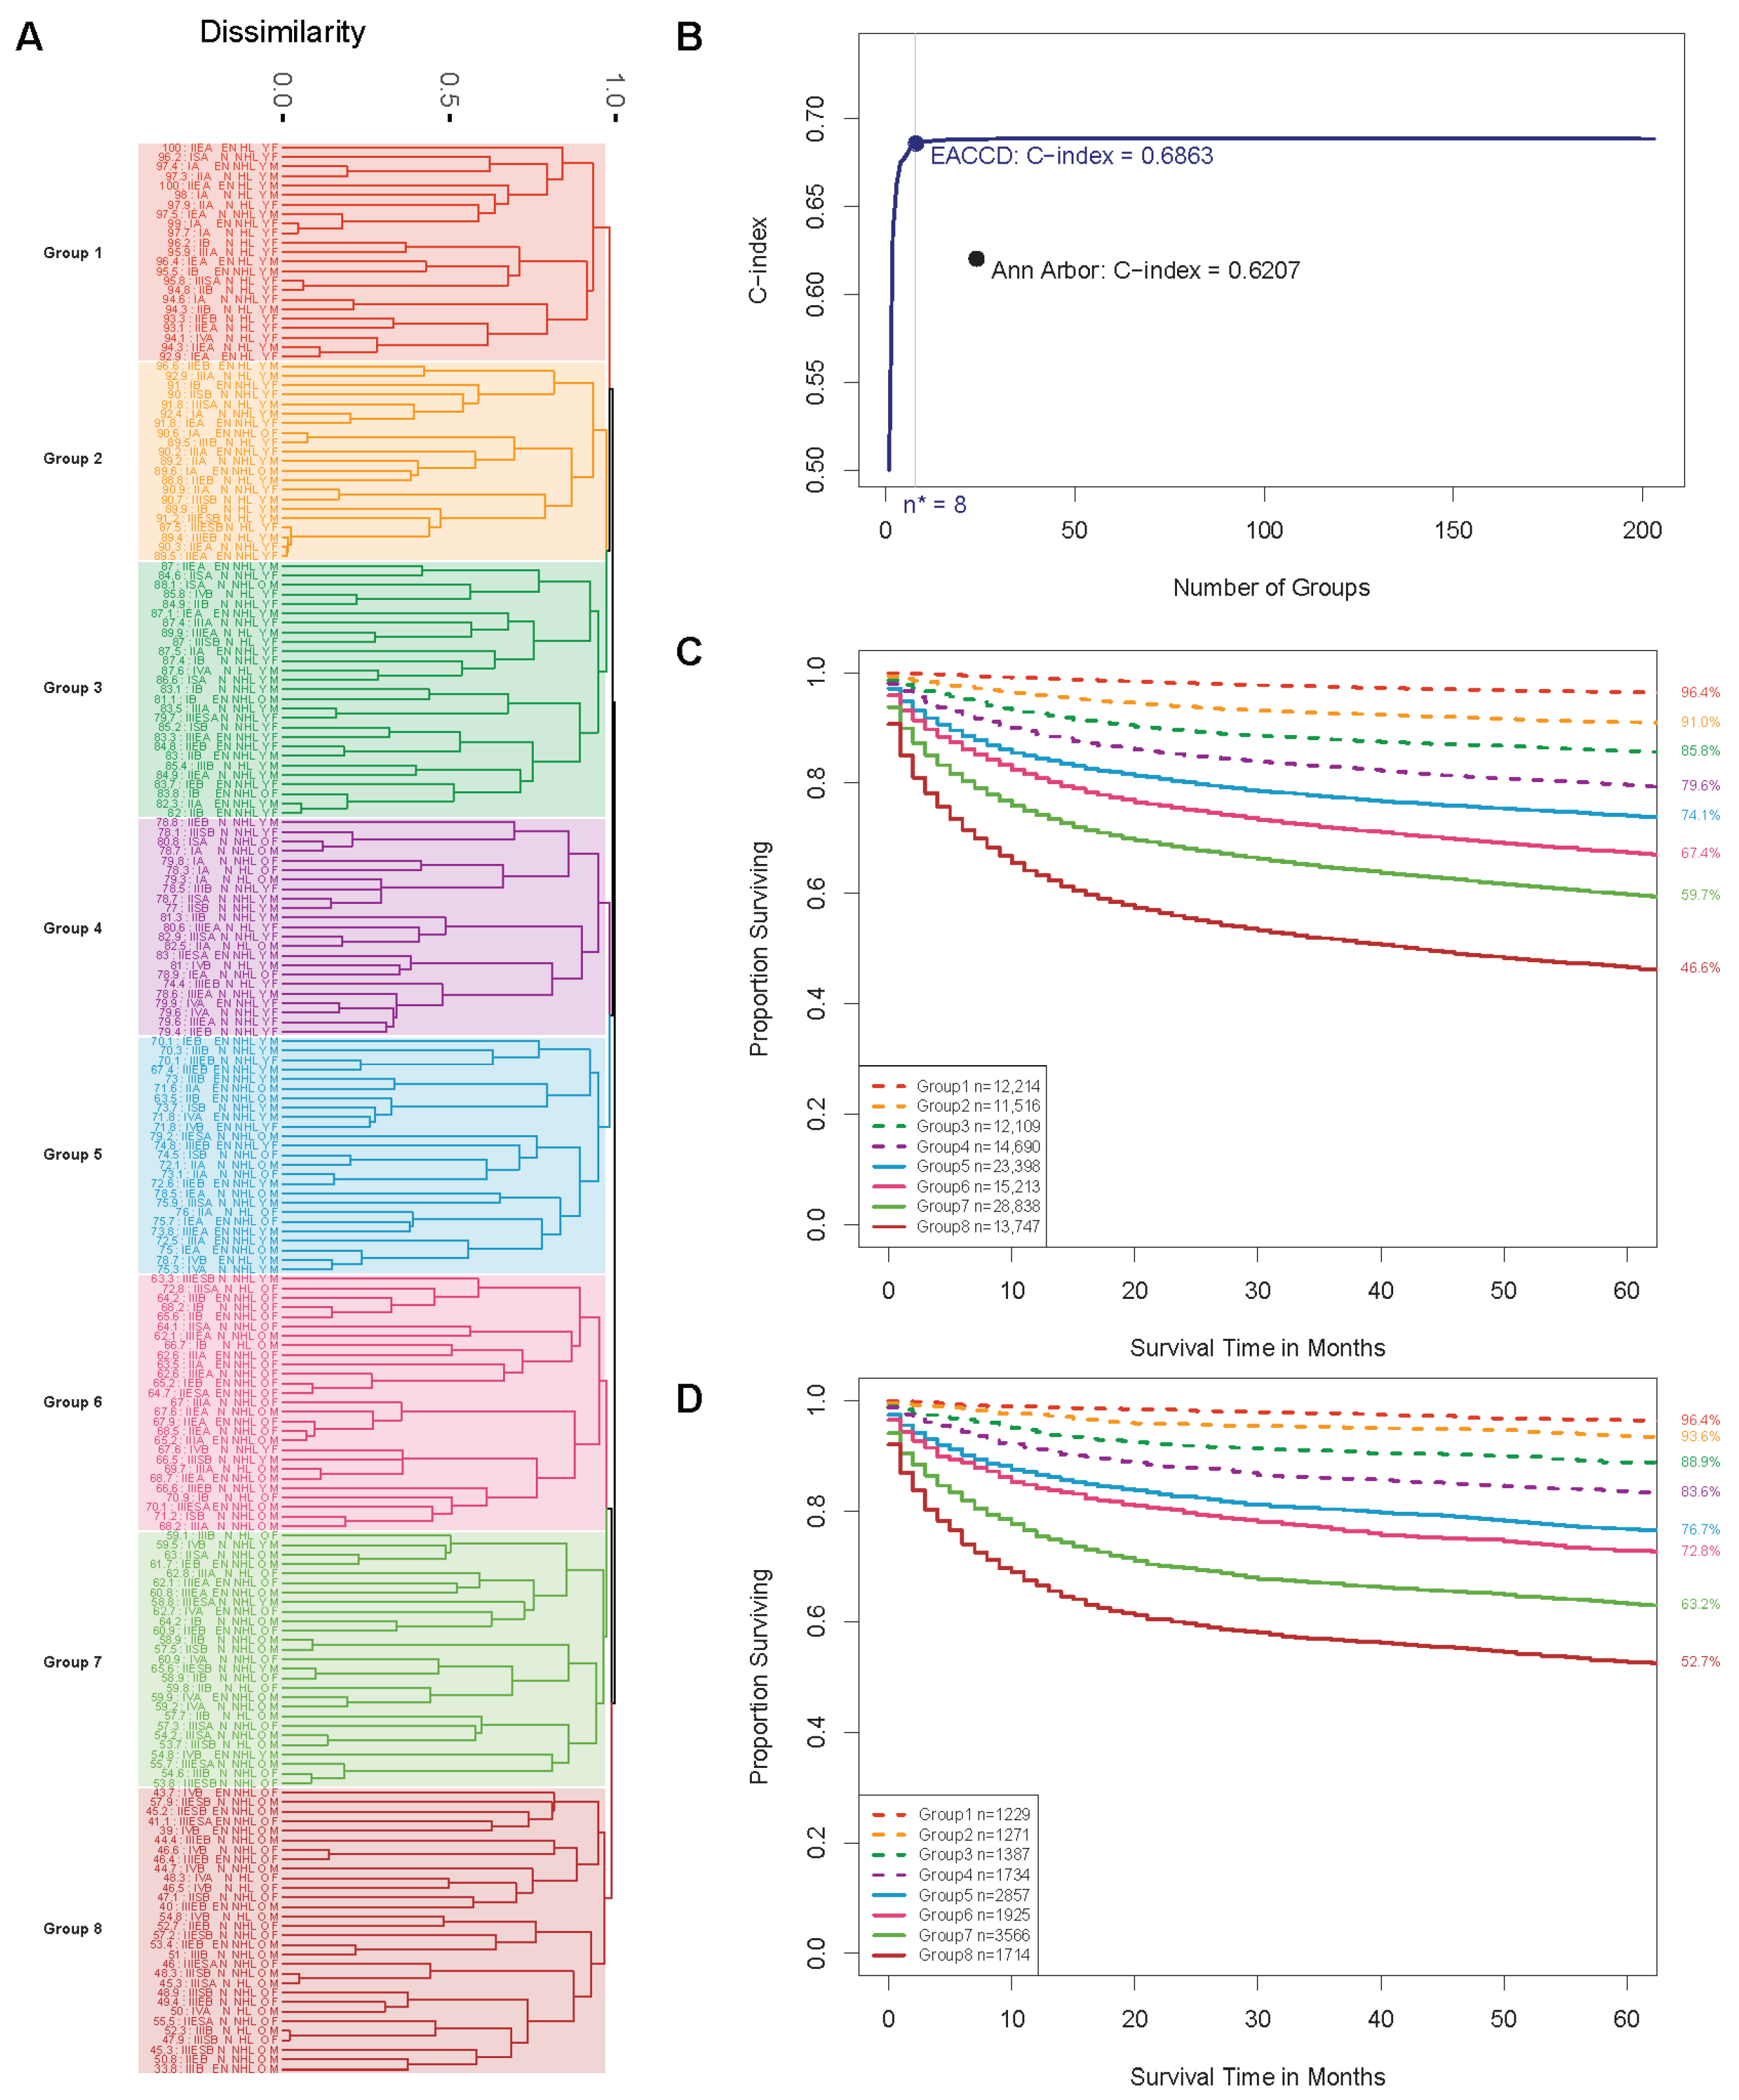
3.2. EACCD Prognostic System

Applying the EACCD with stage, site, type, age, and sex to the training set led to the dendrogram in Figure 3A. A C-index curve derived from the dendrogram is shown in Figure 3B. The knee point of the C-index curve (the point at which the curve started to level off) suggested eight groups, i.e., n* = 8, with a corresponding C-index value of 0.6863. We then divided patients into eight prognostic groups by cutting the dendrogram into eight groups, also shown in Figure 3A. These eight groups are rearranged in Supplementary Table S2 for ease of reference. Figure 3C displays the survival curves of these eight groups on the training set. It is seen that these curves are well separated and ordered by their risk.
The resulting EACCD prognostic system for lymphoma based on stage, site, type, age, and sex includes the dendrogram in Figure 3A, the prognostic groups in Supplementary Table S2, the C-index value in Figure 3B, and the survival curves in Figure 3C.

3.3. Validation of the EACCD Systems

To validate the above EACCD system, we performed internal validation on the training set and temporal validation on the validation set.
The internal validation verifies the performance of the system in two aspects: risk stratification and survival prediction. Figure 3C shows the survival curves of the prognostic groups on the training data. The curves are well separated from each other, indicating a good stratification of patients’ risk. This good risk separation is also supported by the comparison results in Supplementary Table S3, where almost all hazard ratios from adjacent groups are between 1.3 and 1.5, with uniformly significant p-values. The accuracy of the system in terms of survival prediction is evaluated by the C-index. In fact, the EACCD system has a C-index of 0.6863, close to 0.7, a value considered moderate to high for the C-index [40]. Therefore, the internal validation showed that the EACCD system performs well in both risk stratification and survival prediction.
The external validation also verifies the performance of the system with respect to risk stratification and survival prediction. Figure 3D presents the survival curves of the eight prognostic groups on the validation data. Overall, these survival curves are spatially close to those obtained on the training set (Figure 3C). The C-index of the eight prognostic groups on the validation set is 0.6867, which is close to the C-index on the training set. The hazard ratios between adjacent groups are also similar to those obtained on the training set (Supplementary Table S3). The p-values for the hazard ratios and logrank tests between adjacent groups show less significance than those on the training set (due to the smaller sample size of the validation set) but are still small. Thus, the system also has good performance in risk stratification and survival prediction on the validation set.
The above internal and external validations confirm the good stratification and good survival prediction of the EACCD system on the basis of stage, site, type, age, and sex and show the reproducibility of the system performance on future lymphoma data.

4. Discussion

4.1. Comparison with Ann Arbor Staging System

With the training set, we can compare the EACCD prognostic system with the Ann Arbor staging system in terms of prediction, risk stratification, and assignment of patients.
Earlier, we showed that the C-index value (0.6207) of the Ann Arbor system with 24 stages is higher than that (C-index = 0.6058) of the system with only four principal stages but is lower than that (C-index = 0.6863) of the EACCD system. In fact, the EACCD system has a significantly higher survival prediction accuracy than the Ann Arbor system with 24 stages. This is because the p-value of the non-parametric C-index-based test [41] for testing the difference in the prediction accuracy between the two systems (0.0656, 95% CI = (0.0634, 0.0679)) is smaller than 5 × 10−324.
The two systems can be compared on the basis of risk stratification by using their survival curves. As shown in Figure 2B, there are many overlaps and crossovers in the survival curves of the Ann Arbor stages, which could complicate the prognosis of lymphoma. Another problem with the survival curves of Ann Arbor stages is that, contrary to intuition, the nominally more favorable stages may have a lower survival rate. For example, the survival curve of Stage ISB is much lower than that of Stage IIA (Figure 2). In comparison, the EACCD groups have well-separated survival curves, ordered in accordance with their risk (Figure 3).
The relationship between the EACCD groups and Ann Arbor stages can be easily understood via their assignment of patients. In fact, the assignment to four principal stages and that to eight prognostic groups have a moderate Spearman’s rank correlation coefficient [42] of 0.3918 with a p-value of 7.5 × 10⁻⁹. Therefore, a higher principal stage in the Ann Arbor system tends to match a higher-risk group in EACCD and vice versa. This is supported by Supplementary Table S4, which presents the distribution of patients for the Ann Arbor principal stages over the eight EACCD groups. A similar conclusion holds for the 24 ordered Ann Arbor substages, i.e., a higher-risk substage tends to match a higher-risk group in EACCD, and vice versa (Spearman’s rank correlation coefficient = 0.4447, p-value = 3.0 × 10⁻¹¹). This is supported by Supplementary Table S5, which presents the distribution of patients for Ann Arbor substages over the eight EACCD groups.
To conclude, in predicting survival, the EACCD prognostic system has a significantly higher accuracy than the Ann Arbor staging system. In stratifying patients, the EACCD produces well-separated survival curves, with ordering consistent with their risk ordering, while Ann Arbor staging does not. With respect to patients’ assignments, EACCD grouping and Ann Arbor staging are moderately positively associated.

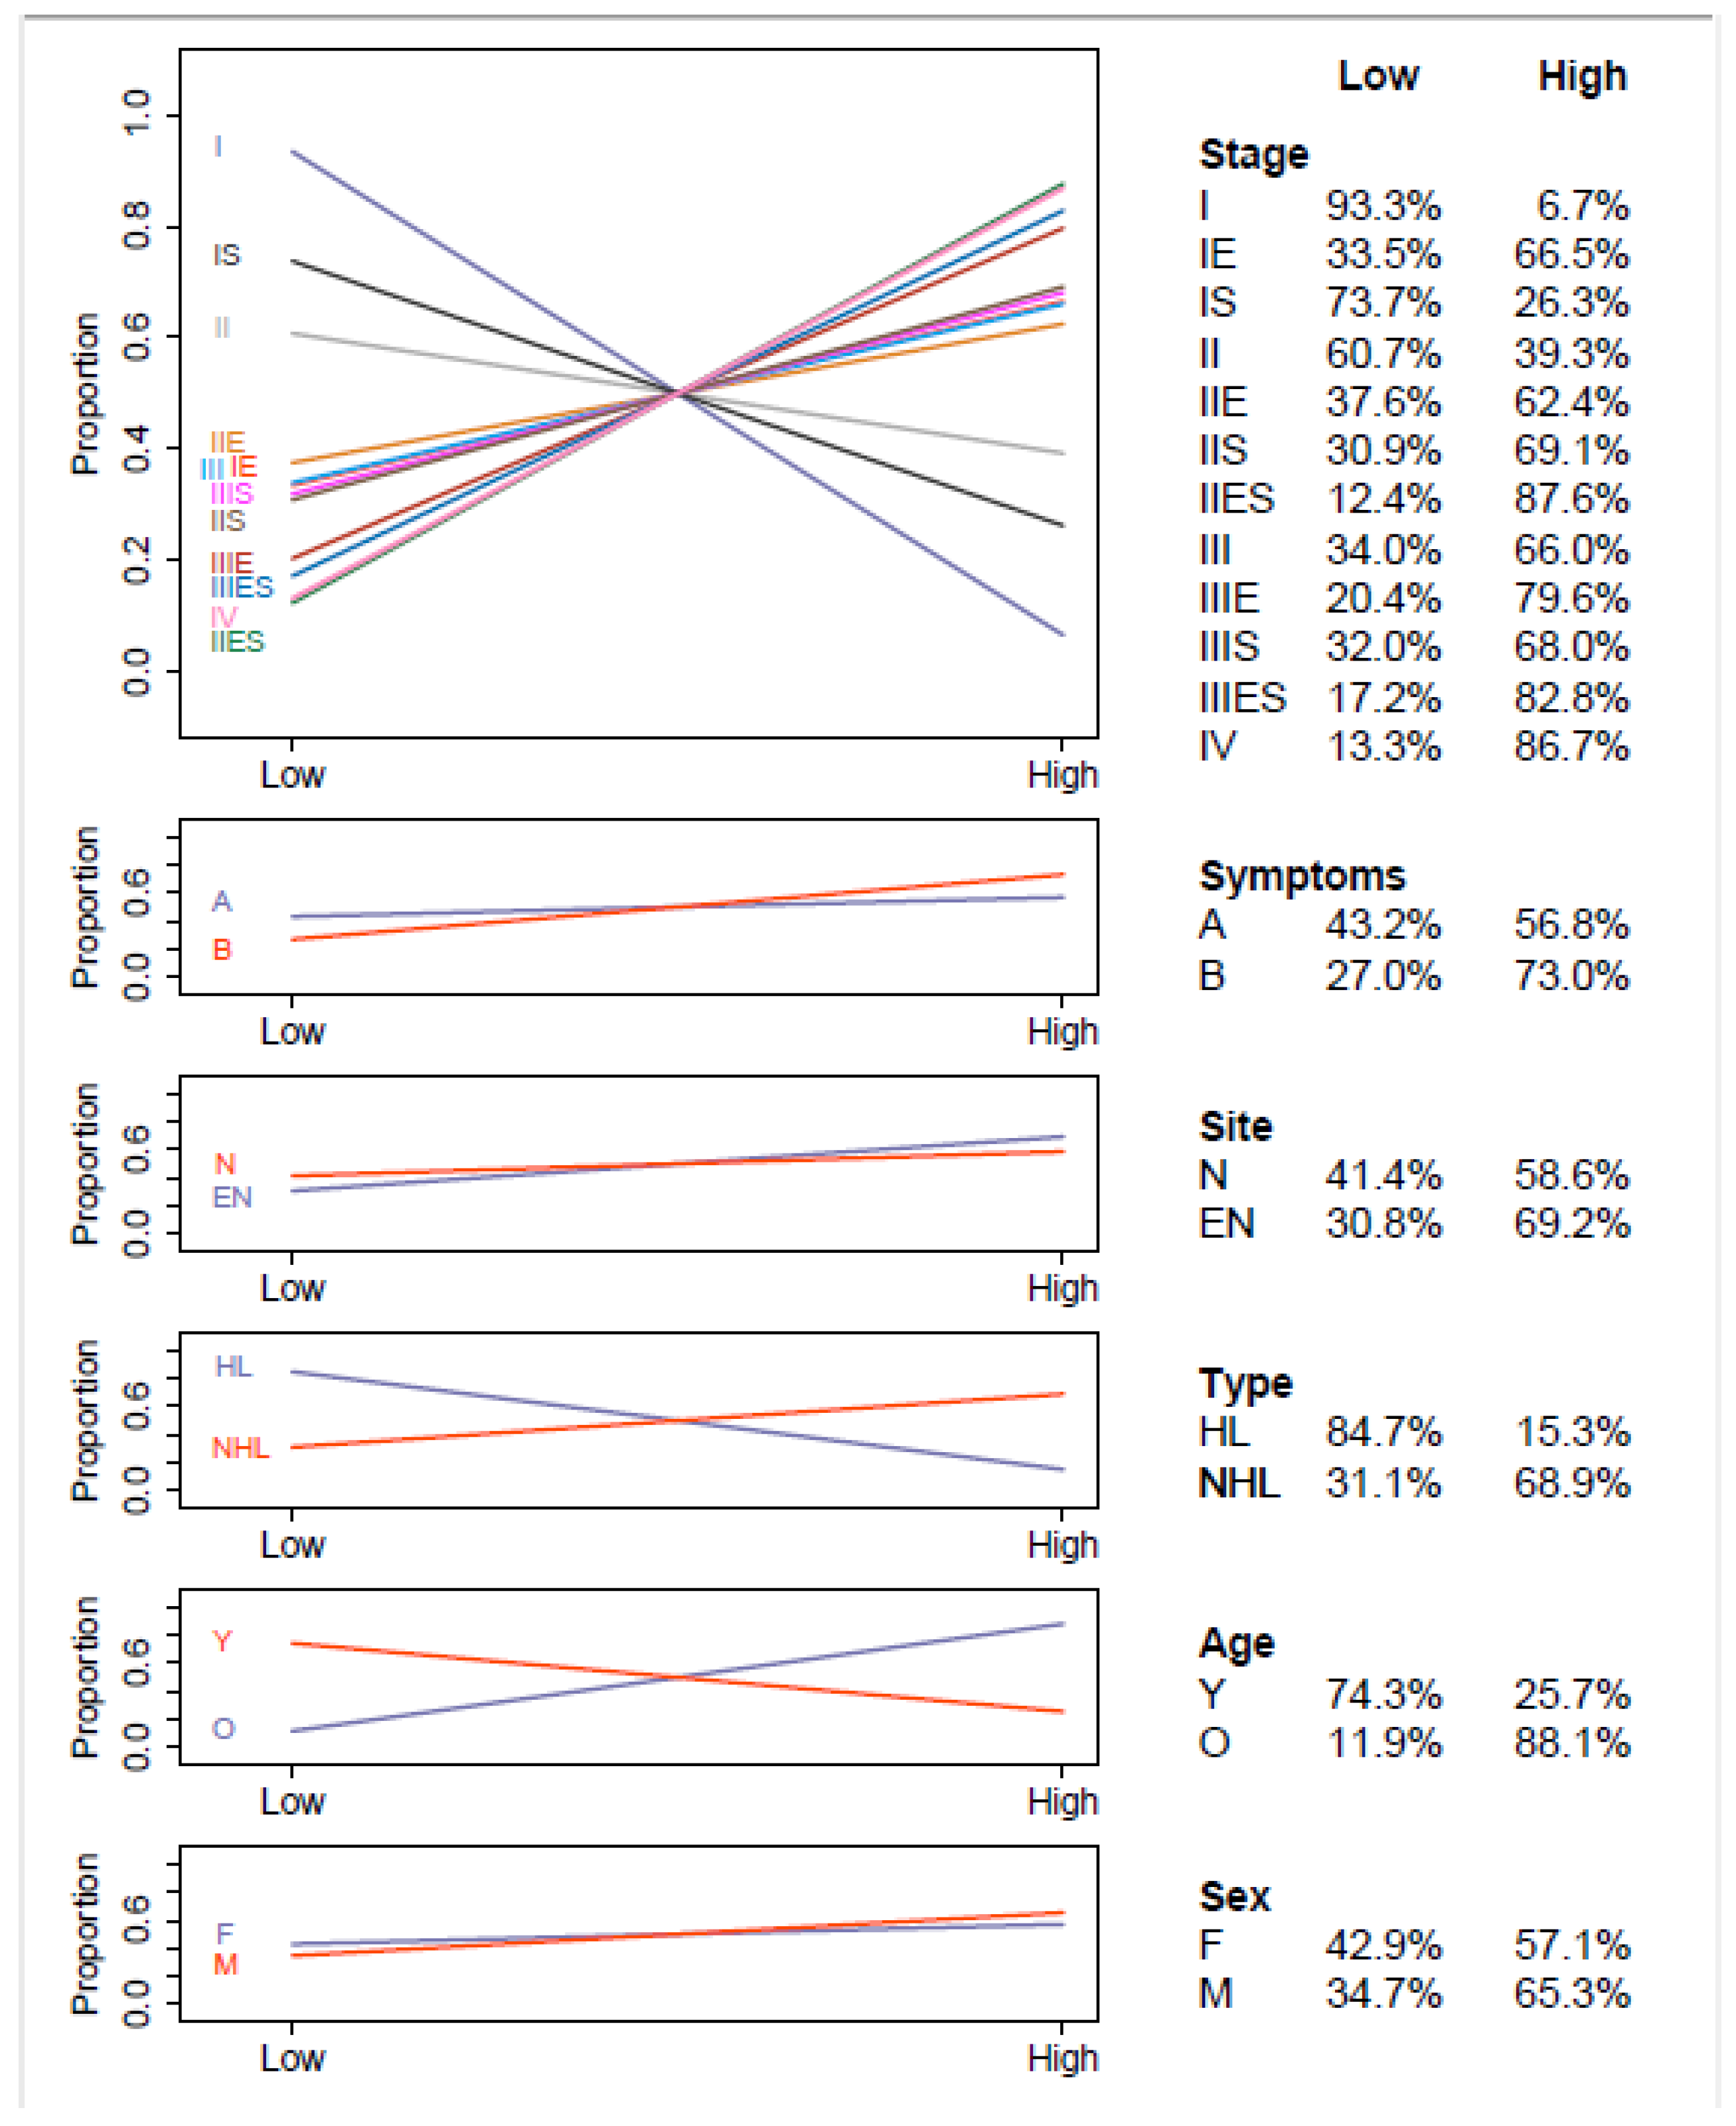
4.2. Effect of Factor Levels on Survival

The EACCD prognostic system involves five factors: stage, site, type, age, and sex. To understand the role of each factor in the EACCD system, we examine the effect of individual factor levels on survival. To simplify the analysis, we place EACCD groups 1–4 into the low-risk category and groups 5–8 into the high-risk category. In addition, symptoms A and B from the factor stage are analyzed separately. Figure 4 presents the distribution of lymphoma patients over the two risk categories for each factor on the training set. The effect of a factor can be examined by simply comparing the proportions at two risk categories.
The first panel in Figure 4 shows the distribution of patients associated with different stages (without symptoms). It is seen that Stages I, IS, and II have a bigger proportion of low risk than high risk. The other nine stages have a bigger proportion of high risk, from 62.4% (Stage IIE) to 87.6% (Stage IIES). Therefore, a higher stage tends to have a higher proportion in high-risk groups (than low-risk groups) and thus a worse prognosis.
The second panel shows that patients with A symptoms are more likely to be distributed in low-risk groups, while patients with B symptoms are more likely to be in high-risk groups. Therefore, A symptoms, in general, indicate a better prognosis than B symptoms. Similarly, panels 4 and 5 suggest that patients with non-Hodgkin lymphoma have a worse prognosis than patients with Hodgkin lymphoma and that younger patients generally have a better prognosis than older patients.
The third panel presents the distribution for the site (nodal or extranodal). The distributions of patients with nodal or extranodal are similar. Therefore, the site factor alone does not provide much information. An analogous conclusion applies to factor sex (female or male) in the sixth panel.
The above analysis reveals the association of factor levels with risk. Although there are no new findings beyond their known effects described in the literature, this is the first time that the roles of these factors in the ordered risk groups are described in a system that integrates these factors together.

4.3. Limitations of Analyses

Our lymphoma-specific survival estimates depended on the SEER cause-specific death classification. Although this classification is optimized for cause-specific analysis based on various characteristics (e.g., tumor sequence, site of original cancer diagnosis, and comorbidities), survival estimates could still be biased by death certificate errors.
The algorithm of EACCD requires a relatively large sample for robust survival estimation. Therefore, we precluded “rare” combinations with fewer than 25 patients. In future updates of the system, the impact of this sample size requirement for combinations will be minimized as more data become available.

5. Conclusions

In this study, we created an EACCD prognostic system for Hodgkin and non-Hodgkin lymphoma patients. The system expands the Ann Arbor staging system by taking advantage of the information on additional factors (site, type, age, and sex) and the machine-learning algorithm EACCD. Even though the EACCD grouping and Ann Arbor staging are moderately positively associated, the EACCD prognostic system has a higher accuracy of survival prediction and produces better risk stratification of patients. We conducted internal and temporal validations of the EACCD system to validate its performance and reproductivity. We also analyzed the effect of each individual factor in the EACCD system. While playing the same role as the Ann Arbor staging system, the EACCD system is expected to offer more assistance in planning clinical trials and treatments for lymphoma.
As biomedicine evolves, increasing data on new important prognostic factors will be utilized to deliver prognosis. Unlike traditional committee-based decision staging systems, our prognostic system is algorithmic and data based. Therefore, the proposed system can be easily updated to incorporate new prognostic factors when survival data of such factors become available in the future.

Supplementary Materials

The following supporting information can be downloaded at: https://www.mdpi.com/article/10.3390/biomedinformatics3030035/s1. Table S1: Definitions of levels of stage, site, type, age, and sex for lymphoma; Table S2: EACCD grouping of lymphoma patients according to stage, site, type, age, and sex; Table S3: Output of the Cox proportional hazards regression model and the logrank test for EACCD grouping on the basis of stage, site, type, age, and sex on the training set; Table S4: Contingency table between EACCD groups and Ann Arbor principal stages; Table S5. Contingency table between EACCD groups and Ann Arbor substages. Reference [43] was cited in Supplementary Materials.

Author Contributions

H.W., Z.L. and D.C. designed the study. H.W. collected the data. H.W. and J.Y. analyzed the data and prepared the tables and figures. H.W., Z.L., J.Y., L.S. and D.C. prepared the manuscript. All authors have read and agreed to the published version of the manuscript.

Funding

This work was partially supported by grants “Using Dendrograms to Create Prognostic Systems for Cancer” and “Creating Prognostic Systems for Cancer”, sponsored by John P. Murtha Cancer Center Research Program.

Institutional Review Board Statement

Not applicable.

Informed Consent Statement

Not applicable.

Data Availability Statement

All data files are available from the SEER database at https://seer.cancer.gov/data (accessed on 10 May 2022). The code used to generate results shown in this study is available at https://github.com/hwang0113/Prognostic-System-for-Lymphoma (accessed on 4 June 2023).

Conflicts of Interest

The authors declare no conflict of interest. The contents, views, or opinions expressed in this publication or presentation are those of the authors and do not necessarily reflect the official policy or position of the Uniformed Services University of the Health Sciences, the Department of Defense (DoD), or Departments of the Army, Navy, or Air Force, or the U.S. Food and Drug Administration. Mention of trade names, commercial products, or organizations does not imply endorsement by the U.S. Government.

References

  1. Siegel, R.L.; Miller, K.D.; Fuchs, H.E.; Jemal, A. Cancer statistics, 2021. CA Cancer J. Clin. 2021, 71, 7–33. [Google Scholar] [CrossRef] [PubMed]
  2. Shanbhag, S.; Ambinder, R.F. Hodgkin lymphoma: A review and update on recent progress. CA Cancer J. Clin. 2018, 68, 116–132. [Google Scholar] [CrossRef] [PubMed] [Green Version]
  3. Ansell, S.M. Hodgkin lymphoma: 2016 update on diagnosis, risk-stratification, and management. Am. J. Hematol. 2016, 91, 434–442. [Google Scholar] [CrossRef] [PubMed] [Green Version]
  4. Sung, H.; Ferlay, J.; Siegel, R.L.; Laversanne, M.; Soerjomataram, I.; Jemal, A.; Bray, F. Global cancer statistics 2020: GLOBOCAN estimates of incidence and mortality worldwide for 36 cancers in 185 countries. CA Cancer J. Clin. 2021, 71, 209–249. [Google Scholar] [CrossRef] [PubMed]
  5. Carbone, P.P.; Kaplan, H.S.; Musshoff, K.; Smithers, D.W.; Tubiana, M. Report of the committee on Hodgkin’s disease staging classification. Cancer Res. 1971, 31, 1860–1861. [Google Scholar]
  6. Amin, M.B.; Edge, S.; Greene, F.; Byrd, D.R.; Brookland, R.K.; Washington, M.K.; Gershenwald, J.E.; Compton, C.C.; Hess, K.R.; Sullivan, D.C.; et al. AJCC Cancer Staging Manual, 8th ed.; Springer International Publishing: Berlin/Heidelberg, Germany, 2017. [Google Scholar]
  7. Eichenauer, D.A.; Aleman, B.M.; André, M.; Federico, M.; Hutchings, M.; Illidge, T.; Engert, A.; Ladetto, M. Hodgkin lymphoma: ESMO Clinical Practice Guidelines for diagnosis, treatment and follow-up. Ann Oncol. 2018, 29, iv19–iv29. [Google Scholar] [CrossRef]
  8. Ansell, S.M. Non-Hodgkin lymphoma: Diagnosis and treatment. Mayo Clin. Proc. 2015, 90, 1152–1163. [Google Scholar] [CrossRef]
  9. Sibon, D.; Morschhauser, F.; Resche-Rigon, M.; Ghez, D.; Dupuis, J.; Marçais, A.; Deau-Fischer, B.; Bouabdallah, R.; Sebban, C.; Salles, G.; et al. Single or tandem autologous stem-cell transplantation for first-relapsed or refractory Hodgkin lymphoma: 10-year follow-up of the prospective H96 trial by the LYSA/SFGM-TC study group. Haematologica 2016, 101, 474. [Google Scholar] [CrossRef] [Green Version]
  10. Vassilakopoulos, T.P.; Chatzidimitriou, C.; Asimakopoulos, J.V.; Arapaki, M.; Tzoras, E.; Angelopoulou, M.K.; Konstantopoulos, K. Immunotherapy in Hodgkin lymphoma: Present status and future strategies. Cancers 2019, 11, 1071. [Google Scholar] [CrossRef] [Green Version]
  11. Otter, R.; Gerrits, W.B.; Sandt, M.M.; Hermans, J.; Willemze, R.; Group, S. Primary extranodal and nodal non-Hodgkin’s lymphoma: A survey of a population-based registry. Eur. J. Cancer Clin. Oncol. 1989, 25, 1203–1210. [Google Scholar] [CrossRef]
  12. Edge, S.B.; Byrd, D.R.; Compton, C.C.; Fritz, A.; Greene, F. AJCC Cancer Staging Manual, 7th ed.; Springer: New York, NY, USA, 2010. [Google Scholar]
  13. Yang, Y.; Zhang, Y.J.; Zhu, Y.; Cao, J.Z.; Yuan, Z.Y.; Xu, L.M.; Wu, J.X.; Wang, W.; Wu, T.; Lu, B.; et al. Prognostic nomogram for overall survival in previously untreated patients with extranodal NK/T-cell lymphoma, nasal-type: A multicenter study. Leukemia 2015, 29, 1571–1577. [Google Scholar] [CrossRef]
  14. Zhong, H.; Chen, J.; Cheng, S.; Chen, S.; Shen, R.; Shi, Q.; Xu, P.; Huang, H.; Zhang, M.; Wang, L.; et al. Prognostic nomogram incorporating inflammatory cytokines for overall survival in patients with aggressive non-Hodgkin’s lymphoma. EBioMedicine 2019, 41, 167–174. [Google Scholar] [CrossRef] [Green Version]
  15. Kwak, L.W.; Halpern, J.; Olshen, R.A.; Horning, S.J. Prognostic significance of actual dose intensity in diffuse large-cell lymphoma: Results of a tree-structured survival analysis. J Clin. Oncol. 1990, 8, 963–977. [Google Scholar] [CrossRef] [Green Version]
  16. Phillips, A.A.; Shapira, I.; Willim, R.D.; Sanmugarajah, J.; Solomon, W.B.; Horwitz, S.M.; Savage, D.G.; Bhagat, G.; Soff, G.; Zain, J.M. A critical analysis of prognostic factors in North American patients with human T-cell lymphotropic virus type-1-associated adult T-cell leukemia/lymphoma: A multicenter clinicopathologic experience and new prognostic score. Cancer 2010, 116, 3438–3446. [Google Scholar] [CrossRef]
  17. Peng, F.; Li, J.; Mu, S.; Cai, L.; Fan, F.; Qin, Y.; Ai, L.; Hu, Y. Epidemiological features of primary breast lymphoma patients and development of a nomogram to predict survival. Breast 2021, 57, 49–61. [Google Scholar] [CrossRef]
  18. Low, S.K.; Zayan, A.H.; Istanbuly, O.; Nguyen Tran, M.D.; Ebied, A.; Mohamed Tawfik, G.; Huy, N.T. Prognostic factors and nomogram for survival prediction in patients with primary pulmonary lymphoma: A SEER population-based study. Leuk Lymphoma 2019, 60, 3406–3416. [Google Scholar] [CrossRef]
  19. Wang, H.; Li, G. A selective review on random survival forests for high dimensional data. Quant. Biosci. 2017, 36, 85. [Google Scholar] [CrossRef]
  20. Chen, D.; Xing, K.; Henson, D.; Sheng, L.; Schwartz, A.; Cheng, X. Developing prognostic systems of cancer patients by ensemble clustering. Biomed. Res. Int. 2009, 2009, 632786. [Google Scholar] [CrossRef] [Green Version]
  21. Qi, R.; Wu, D.; Sheng, L.; Henson, D.; Schwartz, A.; Xu, E.; Xing, K.; Chen, D. On an ensemble algorithm for clustering cancer patient data. BMC Syst. Biol. 2013, 7, S9. [Google Scholar] [CrossRef] [Green Version]
  22. Chen, D.; Hueman, M.T.; Henson, D.E.; Schwartz, A. An algorithm for expanding the TNM staging system. Future Oncol. 2016, 12, 1015–1024. [Google Scholar] [CrossRef]
  23. Wang, H.; Chen, D.; Hueman, M.T.; Sheng, L.; Henson, D. Clustering big cancer data by effect sizes. In Proceedings of the 2017 IEEE/ACM International Conference on Connected Health: Applications, Systems and Engineering Technologies (CHASE), Philadelphia, PA, USA, 17–19 July 2017; pp. 58–63. Available online: https://ieeexplore.ieee.org/abstract/document/8010615 (accessed on 16 November 2020).
  24. Wang, H.; Hueman, M.; Pan, Q.; Henson, D.E.; Schwartz, A.; Sheng, L.; Chen, D. Creating Prognostic Systems by the Mann-Whitney Parameter. In Proceedings of the 2018 IEEE/ACM International Conference on Connected Health: Applications, Systems and Engineering Technologies (CHASE), Washington, DC, USA, 26–28 September 2018; pp. 33–39. Available online: https://ieeexplore.ieee.org/abstract/document/8648686 (accessed on 16 November 2020).
  25. Wang, H.; Chen, D.; Pan, Q.; Hueman, M. Using Weighted Differences in Hazards as Effect Sizes for Survival Data. J. Stat. Theory Pract. 2022, 16, 12. [Google Scholar] [CrossRef]
  26. Hueman, M.T.; Wang, H.; Yang, C.Q.; Sheng, L.; Henson, D.; Schwartz, A.; Chen, D. Creating prognostic systems for cancer patients: A demonstration using breast cancer. Cancer Med. 2018, 7, 3611–3621. [Google Scholar] [CrossRef] [PubMed] [Green Version]
  27. Yang, C.; Gardiner, L.; Wang, H.; Hueman, M.; Chen, D. Creating prognostic systems for well differentiated thyroid cancer using machine learning. Front. Endocrinol. 2019, 10, 288. [Google Scholar] [CrossRef] [PubMed] [Green Version]
  28. Hueman, M.; Wang, H.; Henson, D.; Chen, D. Expanding the TNM for cancers of the colon and rectum using machine learning: A demonstration. ESMO Open 2019, 4, e000518. [Google Scholar] [CrossRef] [Green Version]
  29. Grimley, P.M.; Liu, Z.; Darcy, K.M.; Hueman, M.; Wang, H.; Sheng, L.; Henson, D.; Chen, D. A prognostic system for epithelial ovarian carcinomas using machine learning. Acta Obstet. Gynecol. Scand. 2021, 100, 1511–1519. [Google Scholar] [CrossRef]
  30. Hueman, M.; Wang, H.; Liu, Z.; Henson, D.; Nguyen, C.; Park, D.; Sheng, L.; Chen, D. Expanding TNM for lung cancer through machine learning. Thorac. Cancer 2021, 12, 1423–1430. [Google Scholar] [CrossRef]
  31. Yang, C.Q.; Wang, H.; Liu, Z.; Hueman, M.T.; Bhaskaran, A.; Henson, D.E.; Sheng, L.; Chen, D. Integrating additional factors into the TNM for melanoma of the skin by machine learning. PLoS ONE 2021, 16, e0257949. [Google Scholar]
  32. Surveillance, Epidemiology, and End Results (SEER) Program Research Data (2000–2019), National Cancer Institute, DCCPS, Surveillance Research Program, Released April 2022, Based on the November 2021 Submission. Available online: https://seer.cancer.gov/ (accessed on 10 May 2022).
  33. SEER Cause-Specific Death Classification. Available online: https://seer.cancer.gov/causespecific/ (accessed on 10 May 2022).
  34. Kaufman, L.; Rousseeuw, P.J. Finding Groups in Data: An Introduction to Cluster Analysis; John Wiley & Sons: Hoboken, NJ, USA, 1990. [Google Scholar]
  35. Bien, J.; Tibshirani, R. Hierarchical clustering with prototypes via minimax linkage. J. Am. Stat. Assoc. 2011, 106, 1075–1084. [Google Scholar] [CrossRef] [Green Version]
  36. Kaplan, E.L.; Meier, P. Nonparametric estimation from incomplete observations. J. Am. Stat. Assoc. 1958, 53, 457–481. [Google Scholar] [CrossRef]
  37. Harrell, F.E.; Lee, K.L.; Mark, D.B. Multivariable prognostic models: Issues in developing models, evaluating assumptions and adequacy, and measuring and reducing errors. Stat. Med. 1996, 15, 361–387. [Google Scholar] [CrossRef]
  38. Wang, H. Development of prognostic systems for cancer patients. Doctoral Dissertation, The George Washington University, Washington, DC, USA, 2020. [Google Scholar]
  39. Ramspek, C.L.; Jager, K.J.; Dekker, F.W.; Zoccali, C.; Van Diepen, M. External validation of prognostic models: What, why, how, when and where? Clin. Kidney J. 2021, 14, 49–58. [Google Scholar] [CrossRef]
  40. Tanvetyanon, T.; Finley, D.J.; Fabian, T.; Riquet, M.; Voltolini, L.; Kocaturk, C.; Bryant, A.; Robinson, L. Prognostic nomogram to predict survival after surgery for synchronous multiple lung cancers in multiple lobes. J. Thorac. Oncol. 2015, 10, 338–345. [Google Scholar] [CrossRef] [Green Version]
  41. Kang, L.; Chen, W.; Petrick, N.A.; Gallas, B.D. Comparing two correlated C indices with right-censored survival outcome: A one-shot nonparametric approach. Stat. Med. 2015, 34, 685–703. [Google Scholar] [CrossRef] [Green Version]
  42. Daniel, W.W. Biostatistics: A Foundation for Analysis in the Health Sciences, 7th ed.; John Wiley & Sons: New York, NY, USA, 1999. [Google Scholar]
  43. Site Recode ICD-O-3/WHO 2008 Definition. Available online: https://seer.cancer.gov/siterecode/icdo3_dwhoheme/index.html (accessed on 4 June 2023).
Figure 1. Flow diagram for selecting patients with Hodgkin and non-Hodgkin lymphoma.
Biomedinformatics 03 00035 g001
Figure 2. Lymphoma-specific survival of Ann Arbor stages. (A) The lymphoma-specific survival for Ann Arbor principal stages. (B) The lymphoma-specific survival for Ann Arbor substages. The 5-year lymphoma-specific survival rates are listed on the right side of the figure.
Biomedinformatics 03 00035 g002
Figure 3. EACCD prognostic system for lymphoma. (A) Dendrogram and cutting the dendrogram (shown in rectangles) according to the C-index. Running the EACCD on the training set produces the tree-structured dendrogram. A 5-year lymphoma-specific survival rate in percentage is provided to the left of the leaf of each combination. Cutting the dendrogram according to n* = 8 in panel B creates 8 prognostic groups, shown in rectangles. Listed to the left of the dendrogram are the group numbers. (B) C-index curve based on the dendrogram in panel A. The knee point of the curve corresponds to 8 groups and a C-index value of 0.6863. The black dot point represents the C-index value of 0.6207 from the Ann Arbor system. (C) Lymphoma-specific survival of 8 prognostic groups in panel A on the training data. The 5-year lymphoma-specific survival rates for 8 groups are listed on the right side. (D) Lymphoma-specific survival of 8 prognostic groups in panel A on the validation data. The 5-year lymphoma-specific survival rates for 8 groups are listed on the right side of the figure.
Biomedinformatics 03 00035 g003
Figure 4. Distributions of patients over risk categories. In each panel, one factor is examined, and, for each level of the factor, the distribution of patients (2 proportions in 2 risk categories) is presented in two ways: graph on the left and tabulation on the right.
Biomedinformatics 03 00035 g004
Table 1. Clinical and demographic characteristics of the training and validation datasets.
Training SetValidation Set
N%N%
Stage
IA14,74411.2170610.9
IB29972.33102.0
IEA16,09012.2207513.2
IEB22761.72381.5
ISA4570.3700.4
ISB2010.2280.2
IIA12,0549.212858.2
IIB51253.95113.3
IIEA61424.77224.6
IIEB21281.62661.7
IISA4530.3500.3
IISB3330.3220.1
IIESA1330.190.1
IIESB1080.1100.1
IIIA11,2758.614609.3
IIIB59984.67064.5
IIIEA19721.52551.6
IIIEB10100.81080.7
IIISA16341.22131.4
IIISB16671.31941.2
IIIESA2990.2340.2
IIIESB2460.2270.2
IVA27,30920.7340121.7
IVB17,07413.0198312.6
Site
Nodal94,04328.610,76468.6
Extranodal37,68271.4491931.4
Type
Hodgkin17,77013.5179911.5
Non-Hodgkin113,95586.513,88488.5
Age
Young55,85242.4602038.4
Old75,87357.6966361.6
Sex
Female58,66344.5690744.0
Male73,06255.5877656.0
Disclaimer/Publisher’s Note: The statements, opinions and data contained in all publications are solely those of the individual author(s) and contributor(s) and not of MDPI and/or the editor(s). MDPI and/or the editor(s) disclaim responsibility for any injury to people or property resulting from any ideas, methods, instructions or products referred to in the content.

