Article

Interactions of CdSe Nanocrystals with Cationic Proteins Extracted from Moringa oleifera Seeds

by
Likius Shipwiisho Daniel
1,2,*,
Salatiel Kapofi
1,
Martha Kandawa-Schulz
1 and
Habauka Majority Kwaambwa
3
1
Department of Physics, Chemistry and Material Science, University of Namibia, Private Bag 13301, Windhoek 10026, Namibia
2
Multidisciplinary Research Service, Centre for Research Services, University of Namibia, Private Bag 13301, Windhoek 10026, Namibia
3
Faculty of Health, Natural Resources and Applied Sciences, Namibia University of Science and Technology, Private Bag 13388, 13 Jackson Kaujeua Street, Windhoek 10005, Namibia
*
Author to whom correspondence should be addressed.
Photochem 2024, 4(1), 24-39; https://doi.org/10.3390/photochem4010003
Submission received: 24 September 2023 / Revised: 7 December 2023 / Accepted: 20 December 2023 / Published: 15 January 2024

Abstract

:
Even with significant developments in nanoscience, relatively little is known about the interactions of nanocrystal semiconducting materials with bio-macromolecules. To investigate the interfacial phenomena of cadmium selenide quantum dot (CdSe QD) nanocrystals with proteins extracted from Moringa oleifera seeds, different concentrations of cadmium selenide quantum dots–Moringa oleifera seed protein (CdSe–MSP) complexes were prepared. Respective CdSe QDs with hexagonal phase and crystalline size in the range of 4–7 nm were synthesized and labelled with the purified mesoporous MSP having a surface area of 8.4 m2/g. The interaction mechanism between CdSe QDs and MSP was studied using UV–Vis absorption, fluorescence emission and Fourier Transform Infrared spectroscopies. The UV–Vis absorption spectra showed absorption bands of CdSe–MSP complexes at 546.5 nm. The fluorescence intensity of CdSe QDs was found to decrease with increasing concentration of MSP. The thermodynamic potentials H θ (−321.3 ×   10 3 Jmol−1);   S θ (156.0 JK−1mol−1) and G θ (−46.6 ×   10 3 Jmol−1) were also calculated. The stability of the complex found is strongly influenced by electrostatics interaction and surface-bound complexation equilibrium attraction. This information can help to elucidate the surface characteristics of MSP and its potential interactions with other molecules or nanoparticles.

1. Introduction

Quantum dots (QDs) are semiconductor nanoparticles with unique electronic and optical properties, which make them attractive for various applications, including electronics, optoelectronics, and biotechnology [1]. As a result, QDs have important applications in biological fluorophores imaging, tracking, and sensing. When QDs enter living systems, they first encounter proteins. The interactions between proteins and QDs significantly influence the structures and functions of the proteins, as well as the performance of the QDs [2]. It has been shown that the interaction of QDs with biological molecules can enhance optical properties and their stability, or may conversely lead to their degradation [2,3]. However, the potential toxicity of these nanoparticles raises concerns about their safety for human health and the environment. The usage of Cd-based quantum dots may result in toxicity problems, including cytotoxicity, environmental toxicity, and bioaccumulation. The toxicity of Cd-based quantum dots varies depending on factors such as concentration, exposure time, and physico-chemical properties [4]. The main classification criteria for quantum dots are their core type, shape, structure, size, and ligands [5]. Due to material degradation, core-only quantum dots have been proven to be unstable [6]. Exposure to an oxidizing environment weakens the selenide layer on the surface of core-type quantum dots [7]. This causes leakage of cadmium ions from quantum dots, such as CdSe QDs. The toxicity of cadmium quantum dots may be caused by the hazardous cadmium ions they contain. To make secure QDs for widespread use, we need advanced surface components to prevent any core leakage. Recently, there has been a significant amount of research conducted on the implementation of an additional shell layer on the surface of Cd/Se quantum dots [8,9]. Adding a second shell layer, like a ligand, decreases the oxidation of Se and reduces the leakage of Cd ions [10]. The presence of ligands on the shells of quantum dots (QDs) enhances the stability of the QD dots. Although researchers have found that the shell and ligands of QDs can reduce toxicity by preventing core material leakage, some leakage can still occur [11]. For instance, protein levels may drop below ideal levels for critical biological functions because of the creation of QD clusters. It is important to study how proteins and QDs interact to understand the overall effects of QDs on cells and tissues by understanding the physico-chemical properties of the protein-metal-based quantum system [7]. A study recently published by Shivaji et al. [4] found that coating the Cd-based QDs with protein can prevent the core CdS QDs from photo-corrosion, hence preventing the release of harmful Cd ions into the environment. The study used tea leaf extract, which is a practical method, to biofunctionalize the active surface of CdS QDs. According to the study, the chlorophyll/polyphenol moieties shielded the CdS QDs from photo-corrosion and stopped the leaching of the Cd2+ ions. The use of Cd-based quantum dots in water treatment has the potential to have negative environmental effects, which can be lessened with this strategy. However, more research is needed to understand and address the potential risks of using Cd-based quantum dots in water treatment. This is necessary to ensure their safe and sustainable use. Thus, studies on the interactions between QDs and proteins can provide a theoretical basis for the design, efficient application, and safety evaluation of QDs.
Moringa oleifera is a tropical plant that is widely used for its nutritional and medicinal properties. It has been shown to have coagulation properties, and cationic proteins extracted from its seeds have been used as a natural coagulant for water treatment [12,13,14]. Proteins extracted from the seeds of Moringa oleifera are of low molecular mass and are known to be effective agents in water treatment [12,13]. Previous studies have shown that Moringa seed proteins (MSP) exhibit peculiar properties, some of which include surface activity [15,16], conformational stability over a wide range of pH and ionic strength [17], proteins charge reversal by surfactant [18], adsorption and desorption depending on the surface type [19,20,21,22,23,24,25], amino acid composition [23], inducement of dense floc structures and high fractal dimensions [26] and recovery of cationic precious metals [27]. The solution acts as a natural cationic polyelectrolyte during wastewater treatment [28,29]. Recently, Thanki et al., 2022 [30] investigated the effect of various operational parameters of MSP, such as coagulation-flocculation pH (2–10), coagulant dosage (0.1–1.0 g L−1), optimized operational conditions and sedimentation kinetics. They suggested that MSP can be employed as a promising coagulant for municipal wastewater with improved treatment efficiencies.
Despite many studies on the interaction of QDs with biological molecules [31], there has not been any investigation on the interactions between Moringa oleifera seed proteins (MSP) with QDs emanating from their respective unique properties’ applications, articulated above, and (potential) more diverse applications. Thorough investigations are required to examine several parameters that influence the interaction mechanisms of quantum dots (QDs), including their size, surface charge, and structure. These investigations are crucial to uncover the evident prospective uses of QDs. Moreover, despite the remarkable studies done on nanocrystal QDs, little is known about the surface modification and the interaction mechanism of nanoparticles with macromolecules [32,33]. QD–protein hybrid bioconjugation at an atomic level has been studied for dihydrolipic acid (DHLA) capped CdSe/ZnS core/shell QDs with maltose-binding protein in the gas phase using ab initio and ONIOM methods (which include the IMOMM and IMOMO methods) as a potential candidate for enhanced light harvesting efficiency through theoretical investigation [34].
When CdSe quantum dots interact with cationic proteins extracted from Moringa oleifera seeds in water treatment, several processes may occur. One of the potential mechanisms is an electrostatic attraction between the positively charged cationic proteins and the negatively charged CdSe quantum dots. This attraction can lead to the formation of complexes between the two, which can affect the stability, aggregation, and reactivity of the nanoparticles [33]. When employing MSP for water treatment, a disadvantage is that the organic compounds and other substances extracted during the process can serve as a favourable food supply for bacteria, leading to rapid water contamination [35]. To eliminate this problem, the photocatalytic properties of the quantum dots can be considered, as they may be able to destroy the bacteria. Thus, labelling the MSP with a photocatalyst semiconductor, such as cadmium selenide quantum dots (CdSe QDs), may solve the problem of bacterial accumulation in water. It is known that proteins can chemically bind to many different surfaces as biomarkers [19,20,21,22,23,24,25]. When QDs are used as biomarkers, especially for in vivo bio-labelling, the interactions between small biomolecules in the biosystem and the surface of QDs may influence the efficiency of the electron-hole recombination process [3,36], leading to higher photocatalysis activity of the QDs. It is also important to bear in mind the possible toxicity of the protein–QDs system in water treatment applications.
This study focuses on the interactions of MSP with CdSe QDs, here referred to as the CdSe–MSP complex. The use of cationic proteins extracted from Moringa oleifera seeds as a model protein in the study of the interaction with CdSe quantum dots is a valid approach to understanding the physico-chemical properties of the protein–nanoparticle system. The investigation of the interactions between CdSe QDs and MSP involved various experimental techniques to characterize the physico-chemical properties of the complex system. Brunaver–Emmett–Teller (BET), Transmission electron microscopy (TEM), scanning electron microscope–Energy-dispersive X-ray spectroscopy (SEM–EDX), X-ray diffraction (XRD), UV–Vis, Fluorescence (FL) and the Fourier transform infrared (FTIR) spectroscopies techniques were employed in this research to obtain a comprehensive understanding of the physico-chemical properties and mechanisms involved in the interaction between natural proteins and CdSe QDs. This information can be useful for the development of safer and more efficient QDs for various applications.

2. Materials and Methods

2.1. Chemicals Used

All chemicals and solvents were used as received without further purification and these were a stock solution of cadmium acetate dehydrate (CH3COO)2Cd·2H2O, ≥98%, Merck, Johannesburg, SA), highly pure selenium powder (Se, 99.99% HPLC), trioctyl-n-phosphene oxide (TOPO, 99%, Aldrich), trioctylphosphine (TOP, 97%, Aldrich), hexadecyl amine (HDA, 98%, Aldrich), tetradecyl-phosphonic acid (TDPA, 97%, Aldrich), all from Aldrich, Johannesburg, South Africa. Octadecene (ODE, 90%, Merck, Johannesburg, South Africa), methanol, sodium chloride (NaCl), petroleum ether, ammonium sulfate (NH4)2SO4, carboxymethylcellulose (CM-Cellulose micro granular 25–60 µm, Biophoretics, Reno, NV, USA), toluene and methanol. M. oleifera seeds were purchased from a local supplier in Windhoek, Namibia. All substances were dried and degassed before use to provide rigorously oxygen- and water-free conditions for the synthesis.

2.2. Synthesis of CdSe Quantum Dots

The CdSe quantum dots were synthesized in HDA-TOPO-TOP mixtures as a green chemical approach using the procedure initially reported by Mekis et al. [37] and as modified by Gupta et al. [38]. All synthetic routes were carried out in a dry environment. In a 50 mL three-neck flask, 5 g HDA, 8 g of TOPO, and 0.15 g TDPA were mixed as a one-pot synthesis. The mixture was dried at 120 °C under vacuum for 20 min. The TOPSe stock solution was prepared by mixing selenium powder (2 g) in 5 mL of TOP and the mixture was heated to 270 °C. The cadmium stock solution (2.5 g of Cd(Ac)2 in 10 mL of TOP) was injected into the mixture while stirring, resulting in the nucleation of CdSe nanocrystals. Respectively, the molar ratio between cadmium and selenium precursors was 1.4:1. The injection of the stock solution, as well as the further nanocrystal growth, was carried out at 270 °C. Finally, the red-colored solution was obtained for CdSe QDs and washed several times with methanol, followed by centrifugation at 3000 rpm for 20 min. The washing was repeated three times. The above sediment was heated in a vacuum at 70 °C for ca. 48 h [32].

2.3. Extraction and Purification of MSP

The extraction and purification of protein powder, MSP, was performed using the method of Ndabigengesere and Narasiah [39,40], and the experimental details are as described by Kwaambwa and Maikokera [15,16,17]. The procedure involves extraction with petroleum ether to remove oil, extraction of the proteins with water, precipitation of proteins with ammonium sulfate, filtration, dissolving the precipitate in water, dialysis to remove excess ammonium sulfate, adsorption through carboxymethyl cellulose column, and elution with 1 M NaCl, dialysis, and finally freeze-drying.

2.4. Synthesis of CdSe–MSP Complexes

The aqueous CdSe–MSPn complexes were prepared by mixing the increasing concentration of MSPn (n = 10, 25, 50, 80, 100 g L−1) with CdSe at a fixed concentration (5.23 × 110−3 M) dispersed in toluene; the complexes were prepared in a buffer solution at pH 8 [2]. The mixtures were subjected to an orbital shaker for agitation and homogenization at 25 °C for 25 min at a speed of 150 rpm under a buffer solution at pH 8. The resultant aqueous CdSe–MSP (50 g L−1) was placed on the round bottom flask and subjected to the rotary evaporator at 120 rpm at a temperature of water bath of 40 °C. The semi-solid CdSe–MSP was then subjected to freeze drying and the crystalline CdSe–MSP complexes were obtained.

2.5. Characterization of the Synthesized CdSe QDs and CdSe–MSP Complexes

The synthesized CdSe QDs were characterized for their crystal structure and phase using a Bruker D2 XRD instrument with radiation angle in the range of 0 to 60° at 2θ, using Bruker Eva software, version 3.1. XRD spectra were used to provide information on the phase of the QDs based on their diffraction pattern.
The nanostructure image of CdSe QD was observed with a transmission electron microscope (Tecnai 20 G2 S–Twin TEM) at an accelerating voltage of 200 kV. The TEM image obtained was used to provide information on the size, shape, and uniformity of the QDs, as well as their crystal structure.
To observe the surface characteristics of the QDs, such as the presence of surface ligands, the CdSe–MSP50 sample was prepared by drop-casting the QD-protein complex onto a carbon-coated copper grid. The surface morphology of the resultant complexes was then observed using a field-emission scanning electron microscope (JSM–IT300 SEM) equipped with Energy-dispersive X-ray spectroscopy (EDX) at an accelerating voltage of 5.0 kV.

2.6. Investigation of the Interactions between CdSe QDs and MSPn Complexes

The absorption spectra of CdSe QDs and CdSe–MSP complex samples were performed using a Perkin-Elmer Lambda 35 spectrometer to analyze the interference of MSPn in the optical property of the CdSe sample. The particle size of CdSe QDs was estimated from the UV–Vis absorption spectra recorded at 298 K temperature using Equation (1) [26]:
D = 9.8127 ×   10 7 λ 3 1.7147 × 10 3 λ 2 + ( 1.0064 ) λ 194.84
where D (nm) is the particle size of given CdSe QDs of 5.23 × 10⁻³ M and λ   ( n m ) is the first exciton absorption peak of 546 nm.
The absorption coefficient (α) values were determined in the region of strong absorption using the relation derived from the fundamental absorption edge.
α h v = A ( h v E g ) n
where A is a constant, Eg is the optical band gap of the CdSe QDs, and the exponent n depend on the type of transition. Respectively, the transition energies (band gaps) of given CdSe QD and CdSe–MSPn complexes were obtained by the plot of ( α h v ) 2 versus hv for direct transition and ( α h v ) 1 / 2 versus hv for indirect transition. The direct band gap and indirect band gap were obtained by extrapolating the linear region to the energy X-axis where ( α h v ) 2 = 0 and ( α h v ) 1 / 2 = 0 , respectively.
The physical adsorption of nitrogen molecules and the surface area of the complexes were studied using the Brunaver–Emmett–Teller (BET) technique under nitrogen gas (N2) on the Micromeritics Trista 3000 instrument. Gas adsorption provides a distinct advantage for many classical models for particle measurement and characterization. The surface area and pore size of MSP were analyzed using the BET– surface area and the BET–isotherm plots. The area covered was calculated by considering the amount of N2 molecules used to form the monolayer, as well as the dimensions and the number of molecules.
The mechanisms of interaction between CdSe QDs and MSPn were investigated by studying the physiochemical properties of the synthesized CdSe–MSP complexes. The measurements for the emission spectra and intensity of steady-state fluorescence for CdSe QDs before and after mixing with MSPn solutions were performed using a Perkin Elmer LS 45 spectro-fluorophotometer with fast scan speed and low sensitivity. The CdSe–MSP samples were excited at 280 nm and the emission range was 300–650 nm, the path length of the cuvette was 1 cm. Fluorescence emission spectra were recorded at 298 K and 313 K temperatures.
The FTIR technique was used to analyze the surface functional groups of the MSP50 and CdSe QDs before and after mixing. This also provides information on the nature and density of surface ligands on the CdSe QDs. The spectra were recorded in the range of 4000–500 cm−1 using Opus software (version 6.5.6) on a Bruker Platinum Tensor 27 ATR-IR Spectrophotometer.

3. Results and Discussion

The description of the composition of the extract has already been reported by one of our co-authors (described previously by Kwaambwa and Maikokera [15,16,17]). However, it is worth mentioning that the composition of the extract used in the current investigations has been isolated and characterised through the application of chromatography and mass spectrometry [22]. The predominant protein species had a molecular weight ranging from 11.8 to 12.0 kDa. The protein extract in an aqueous solution at a neutral pH was determined to have a zeta potential of 14 ± 2 mV [18]. The isoelectric point, which is the pH at which a molecule has no net charge, is around pH 10–11. This value is significantly higher than the neutral pH that was employed in the present investigation.

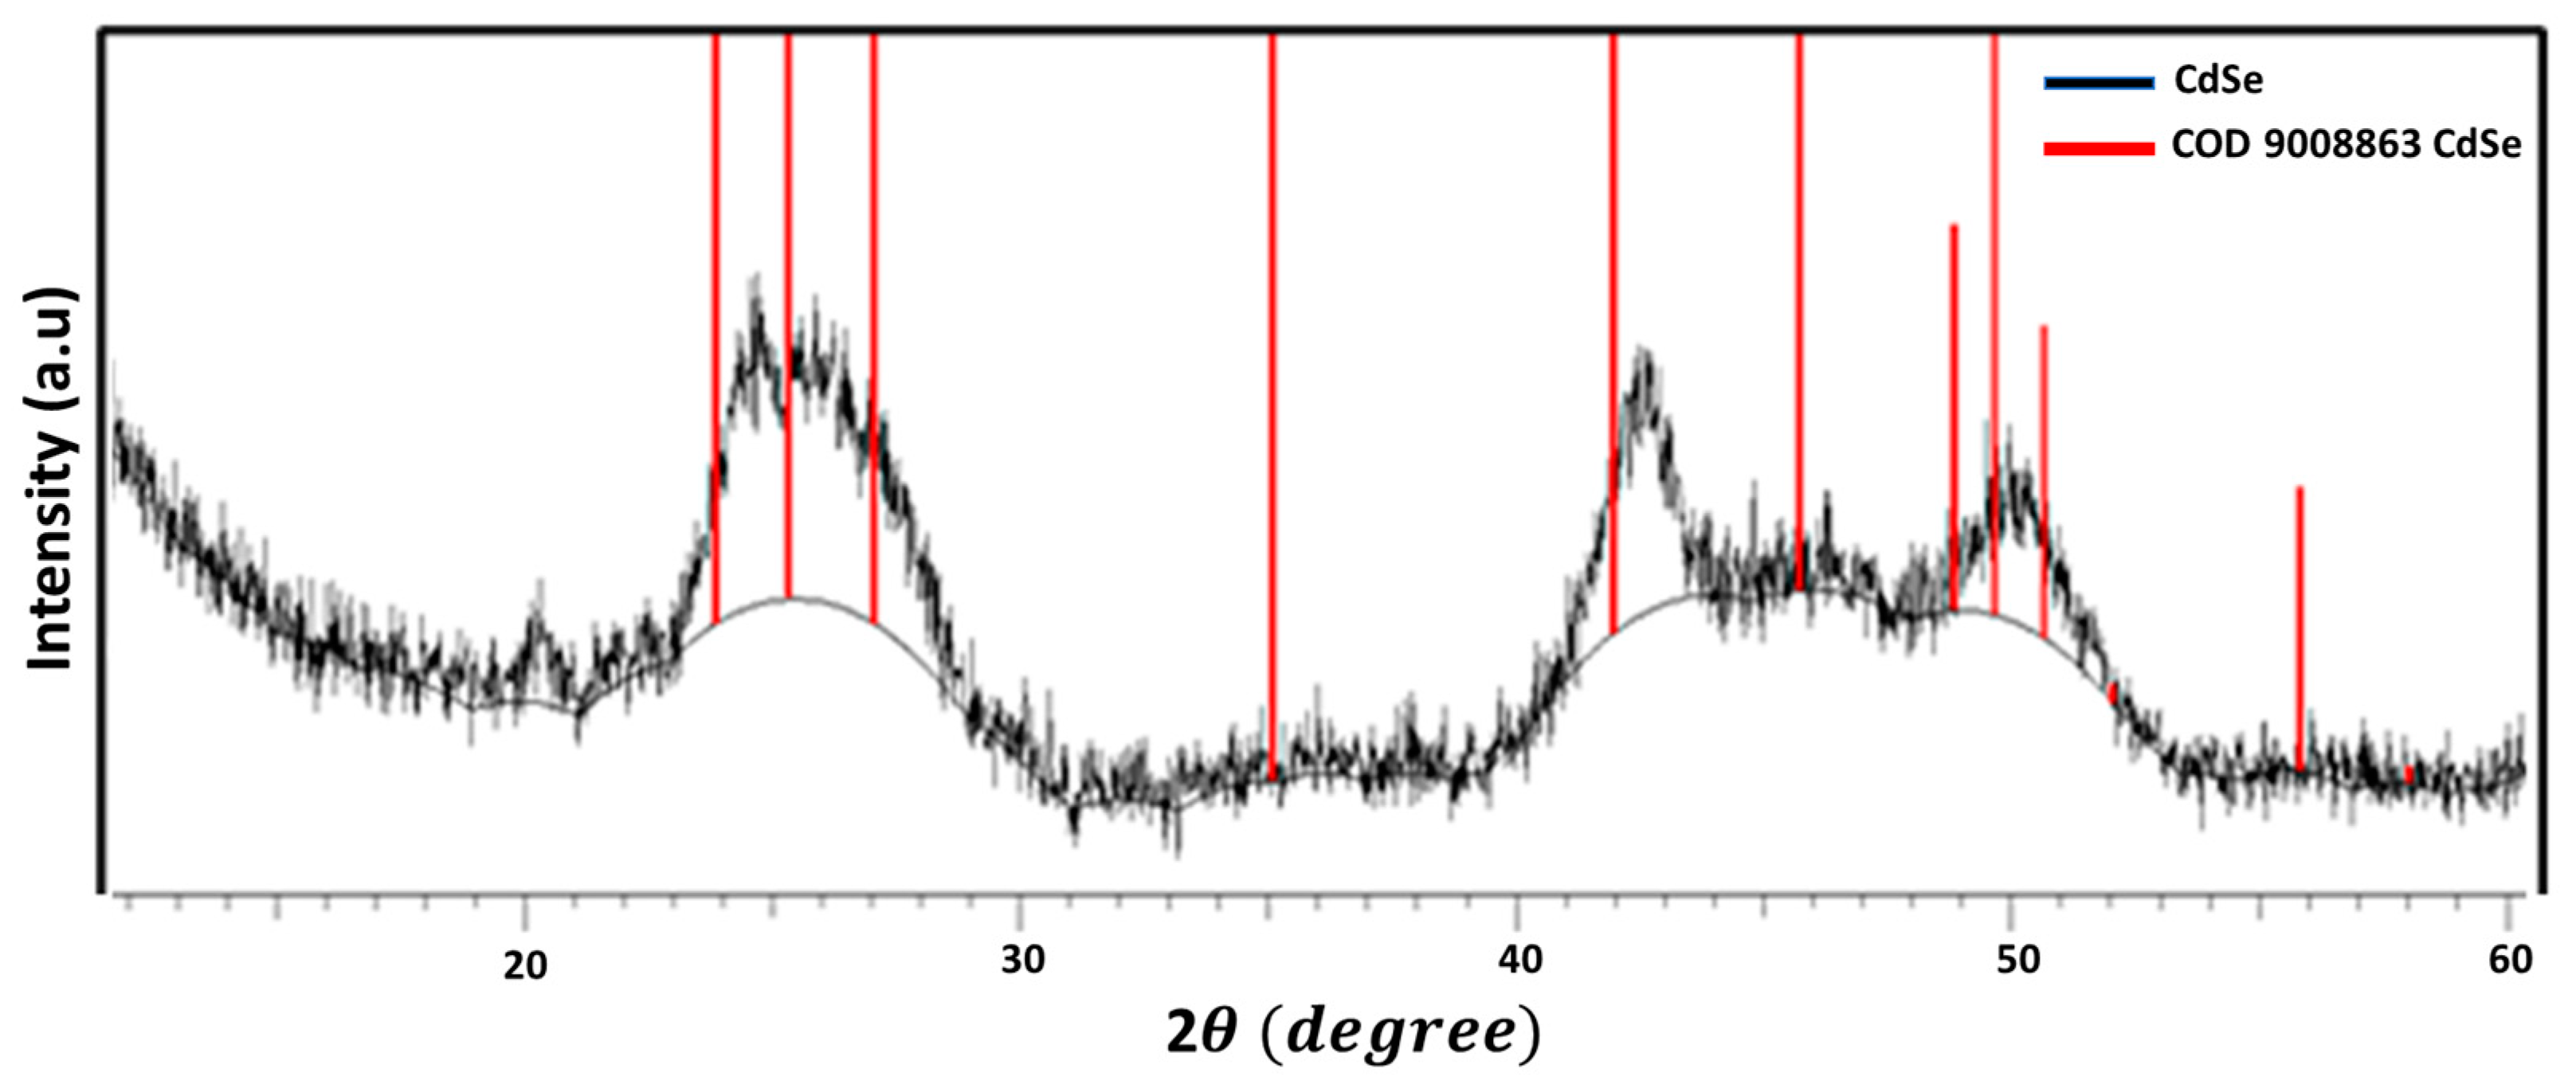
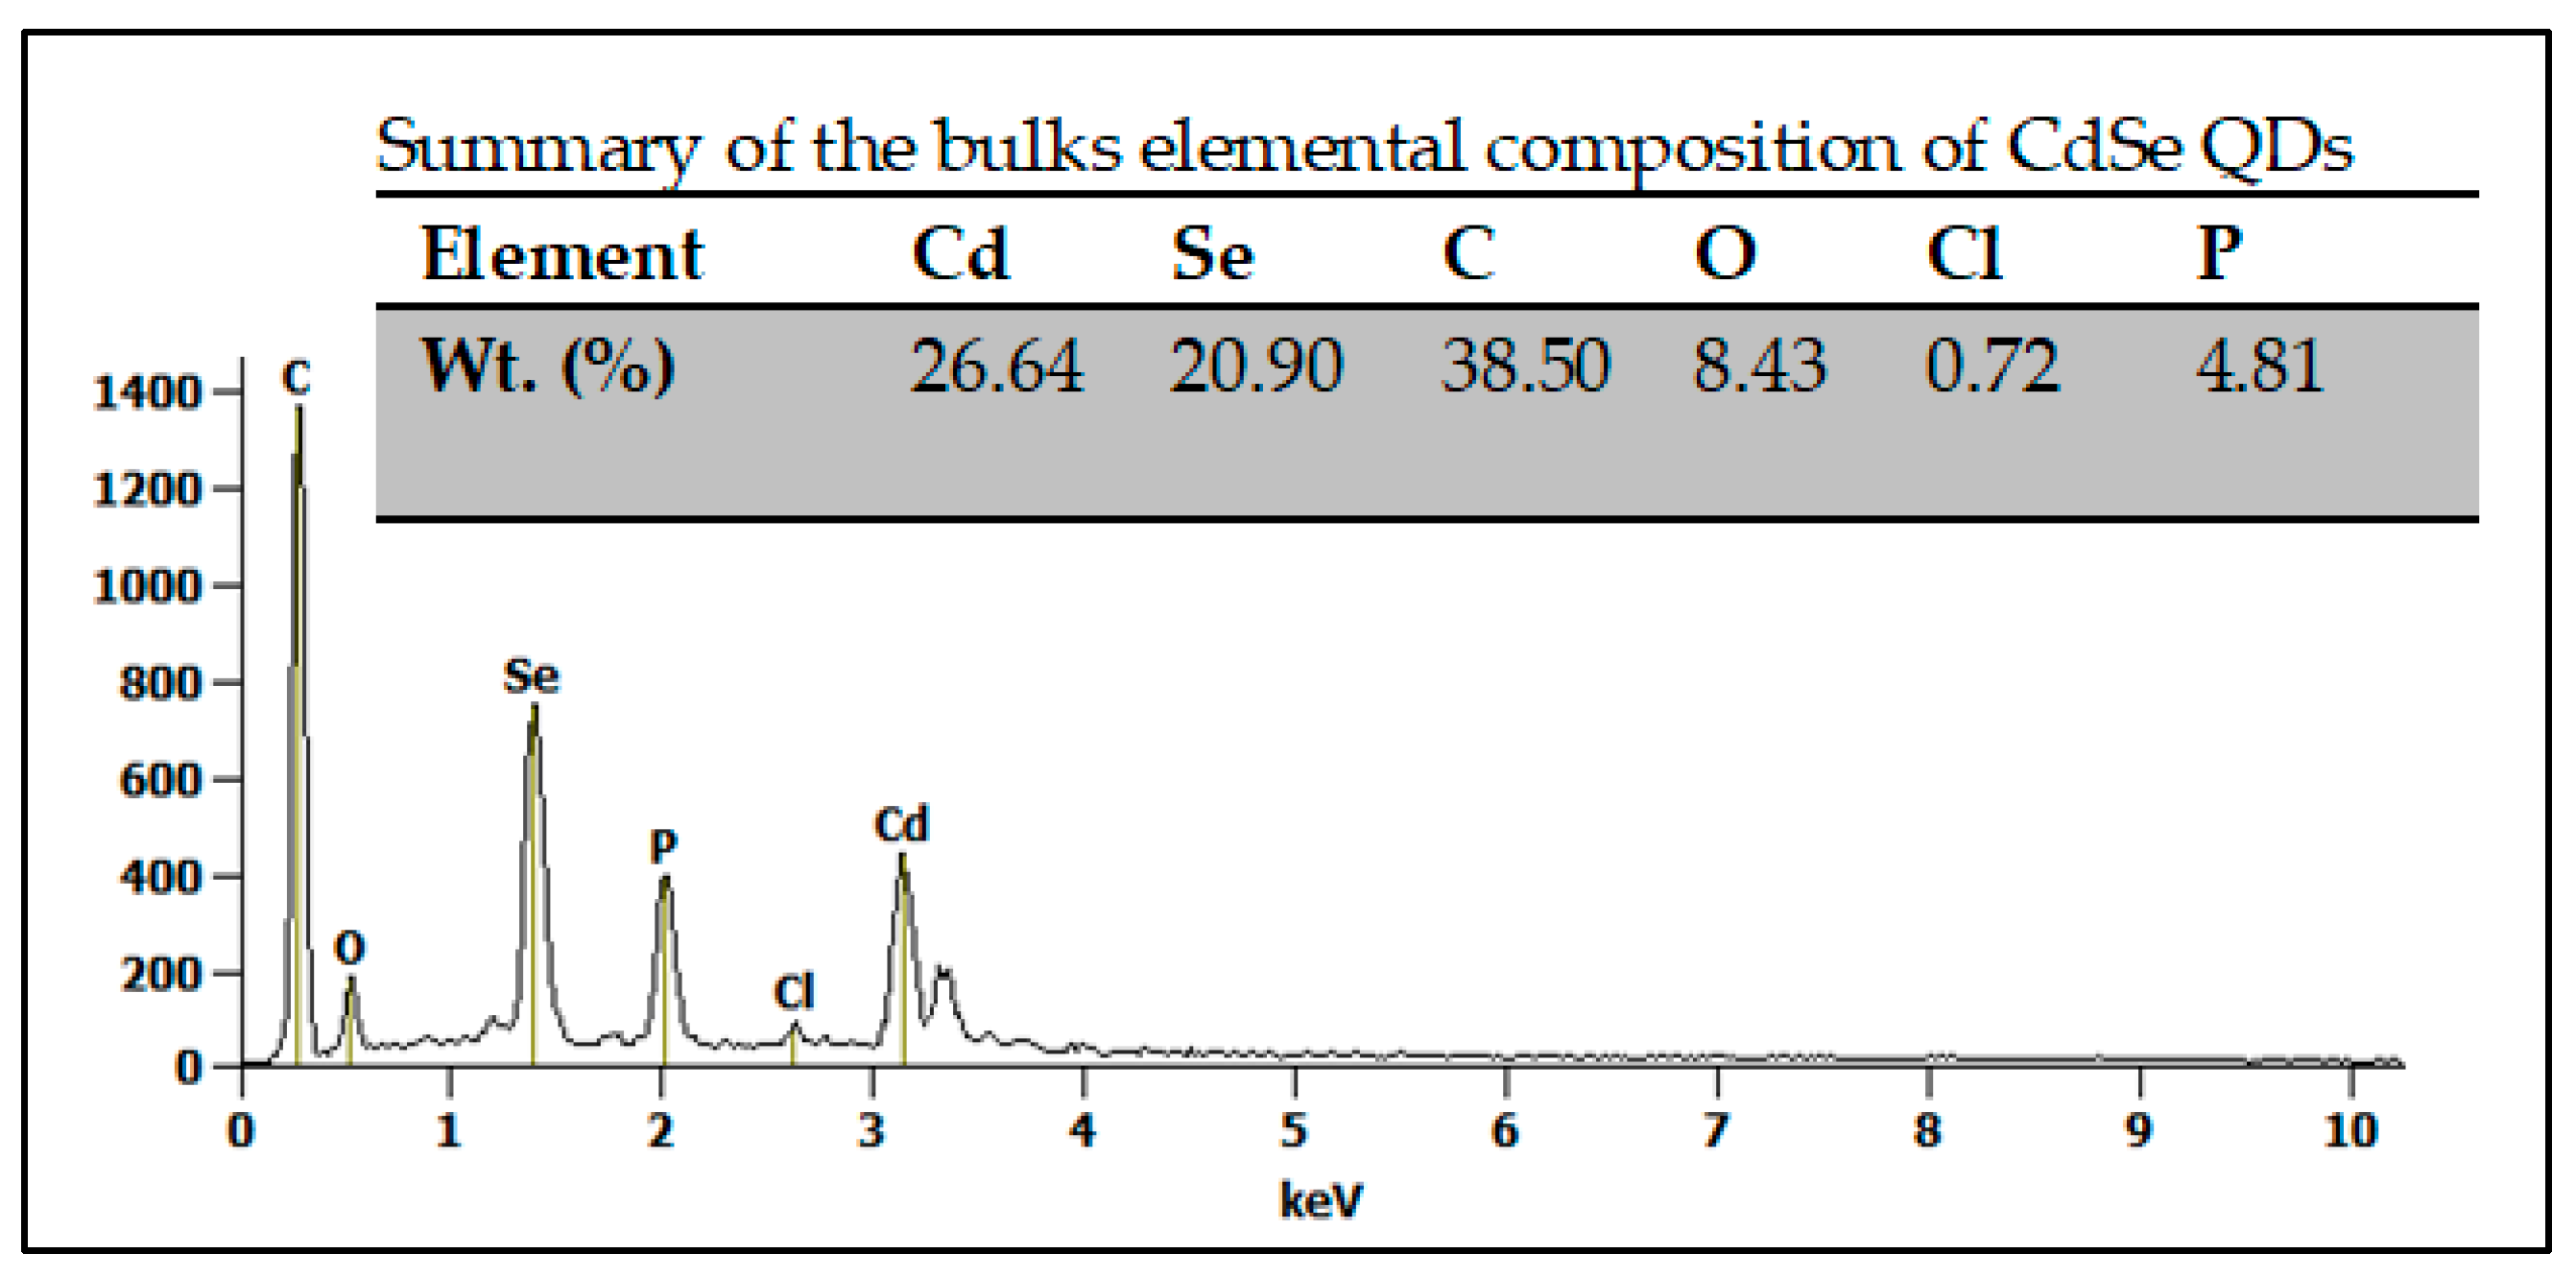
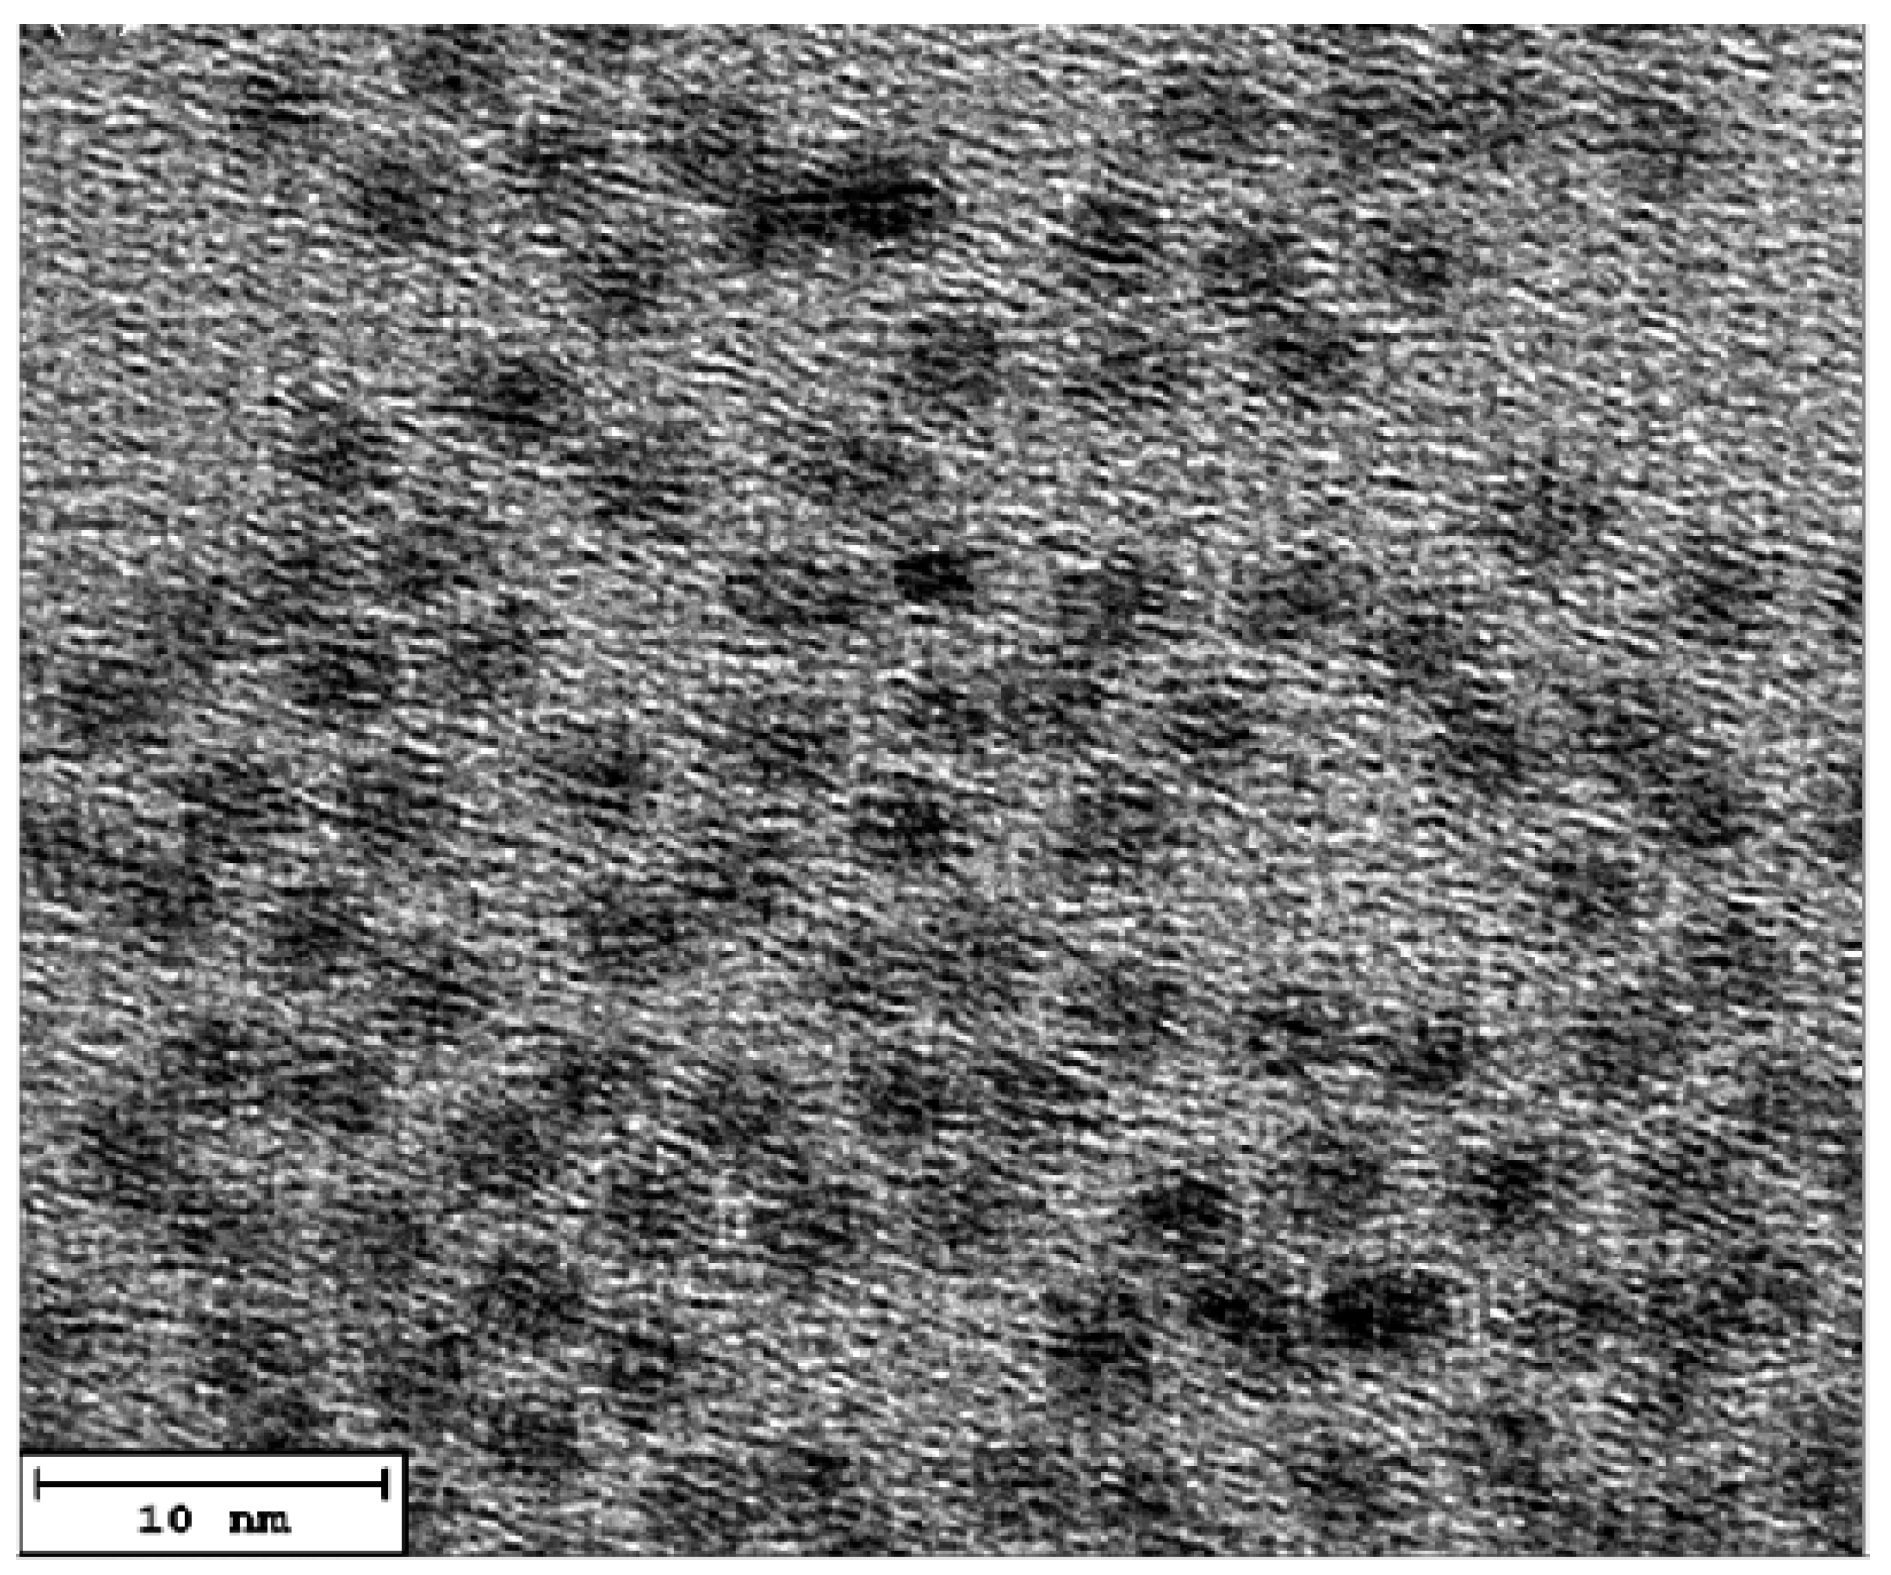
3.1. The Structural and Morphological Characterization of CdSe QDs

The XRD pattern provides information about the crystalline phase of the synthesized CdSe quantum dots. Figure 1 shows the XRD pattern of nanocrystalline CdSe QDs, contains three broad peaks at a diffraction angle of 2θ = 26.55°, 43.87° and 51.93° in correspondence to the Miller indices or plane (111), (220) and (311), respectively, for the bulk-phase zinc blende CdSe [41,42] The absence of reflections at 35.1° and 45.8° 2θ angles, specifically (102) and (103) reflections, respectively, provides confirmation of the absence of the wurtzite phase [41]. These quantum dots clearly have a surface rich in selenium, which results in the manifestation of the zinc blende phase, as opposed to the wurtzite (hexagonal) phase.
Figure 2 shows the EDX micrograph of CdSe QDs, which reveals the elemental composition present in CdSe QDs. The ratio in percentage by weight (%) of Cd:Se was found to be 1:0.8 and also shows the presence of other elements, such as carbon, oxygen phosphorus and chlorine, which may have resulted from the organic solvents used, such as trioctyl-n-phosphene oxide, trioctyl-phosphine and other chemical reagents used during the synthesis of CdSe QDs. The elemental composition is summarized in the inserted table.
The TEM image presented in Figure 3 was used to visualize the morphology and structure of CdSe QDs at the nanoscale level. This image provides information on the shape, size, and uniformity of the QDs’ crystal structure. The TEM image shows an even distribution of nearly spherical-shaped crystalline particles of CdSe QDs. The particle size was in the range of 4–7 nm, which is similar to the crystal size of CdSe QDs reported [41,42]. Ideally, the CdSe QDs should be as uniform as possible to ensure consistent behaviour and properties. The variation in particle size can be a result of the strain field [22]. The particle size of CdSe QDs was further estimated using UV–Vis absorption spectra and was found to be 3.0 nm. The same quantum dot material with different sizes showed distinct variations in their properties [42].

3.2. The Morphological Characterization of MSP and CdSe–MSP Complexes

In the analysis of the surface area and pore size of MSP, the BET isotherm plot was employed to understand the physico-chemical properties of the protein. Figure S1 depicts the adsorption isotherm of N2 gas on MSP obtained using the data calculated and tabulated in Table S1. The adsorption of N2 gas on MSP occurs in situations where interaction between the adsorbate molecules approaches that between adsorbate and adsorbent, i.e., the heat of adsorption is like the heat of condensation. Therefore, it is necessary to have a significant partial pressure of adsorbate before the adsorption process commences. Having the surface covered with adsorbate, the favourable adsorbed–adsorbate interaction would then lead to a very rapid adsorption process, as the partial pressure increases from 0.3 to 1.0 P/P0. This type of isotherm is typically observed when there is a limited number of available adsorption sites (MSP sites) on the surface, and the adsorbate molecules (N2) begin to cluster or aggregate onto the surface, resulting in a lower adsorption capacity at higher concentrations [43].
From the surface area plot, a series of equations was obtained, Equations (S1)–(S5). Table S2 presents the BET MSP surface area data obtained from the BET investigation of MPS adsorption. Analysis of the experimental results using the BET equation gave a good straight-line data fit, shown in Figure S2, over the partial pressure range 0.05–0.30. The BET isotherm gives an accurate account of adsorption isotherm only within a restricted pressure range, i.e., 0.05 P/P0  0.30. From the plot, the data are considered acceptable, since the square of a correlation coefficient, r2, is not less than 0.995 [43]. The BET surface area of MSP was calculated to be 8.41 m2/g. The pore volume at single point adsorption total pore volume of pores less than 302 nm in diameter at P/P0 = 0.9936 was obtained as 0.0245 cm3/g. The pore size of MSP50 was calculated to be 11.7 nm, thus the M. oleifera seed coagulant protein is classified as mesoporous [31].
This information can help to elucidate the surface characteristics of MSP and its potential interactions with other molecules or nanoparticles. Instead, it is expected that the mesoporous pores of MSP observed can be applied to host many guest molecules, such as fluorescent imaging agents, including the recent synthesis CdSe QD (particle sizes 4–7 nm). Hence, the MSP has a higher adsorption capability toward other molecules, such as surfactant and charged particles [3].

3.3. The Structural and Morphological Characterization of CdSe–MSCP Complexes

To evaluate the CdSe QD for the presence of surface MSPn, the surface morphology of CdSe–MSP50 was investigated using the SEM image presented in Figure S3; the image shows small particles of CdSe incorporated in the large MSP50 matrix. It was then observed that there is no uniform distribution of the particles of CdSe–MSP, hence the complex is not a crystalline structure. The presence of MSP provides a protective layer around the nanoparticle, preventing aggregation and degradation and improving CdSE QD stability and biocompatibility [44]. MSP has a natural cationic protein [18] that can bind to the surface of CdSe QDs, stabilizing them and preventing aggregation or degradation. This binding is due to electrostatic interactions between the positively charged protein and the negatively charged surface of the QDs [45]. Thus, the MSP has a protective effect, preventing the CdSe QDs from interacting with other molecules or surfaces that may cause them to degrade or aggregate. In addition to improving stability, the presence of MSP has enhanced the biocompatibility of CdSe QDs [28], making them more suitable for biological applications. This is because MSP is a natural protein that is non-toxic and biocompatible, and, therefore, its presence on the surface of CdSe QDs can reduce their toxicity and improve their biocompatibility [46].

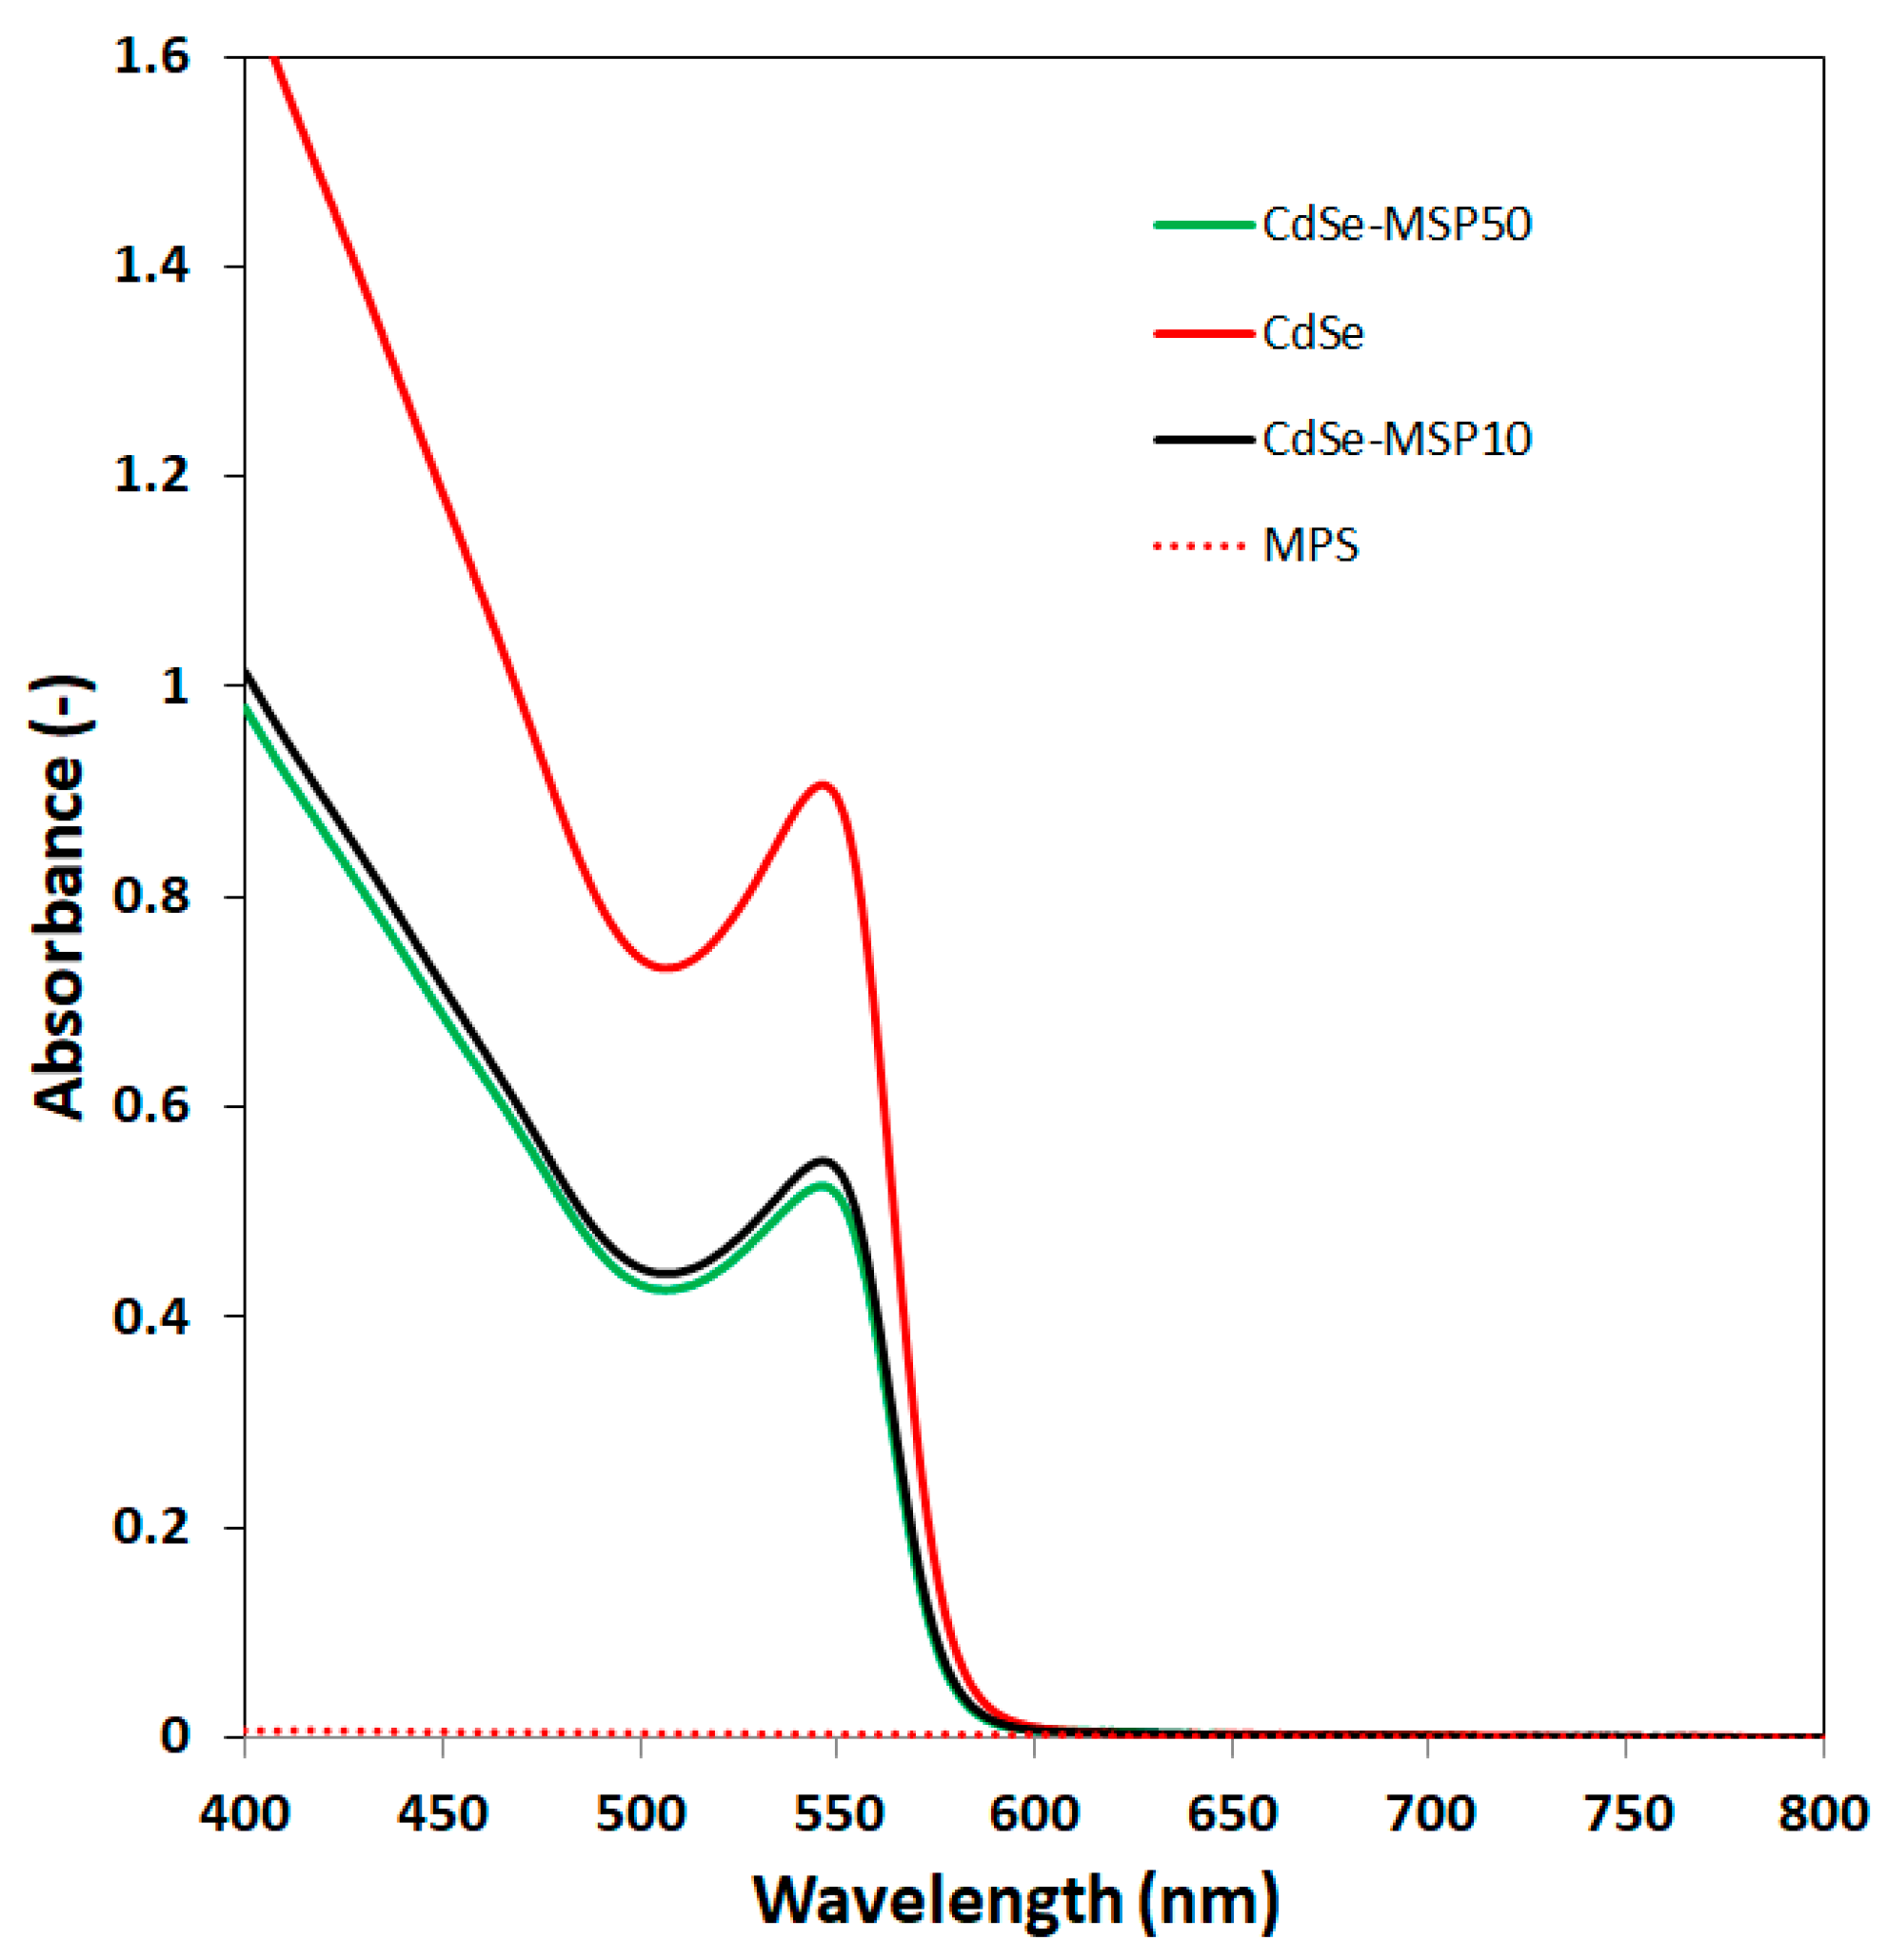
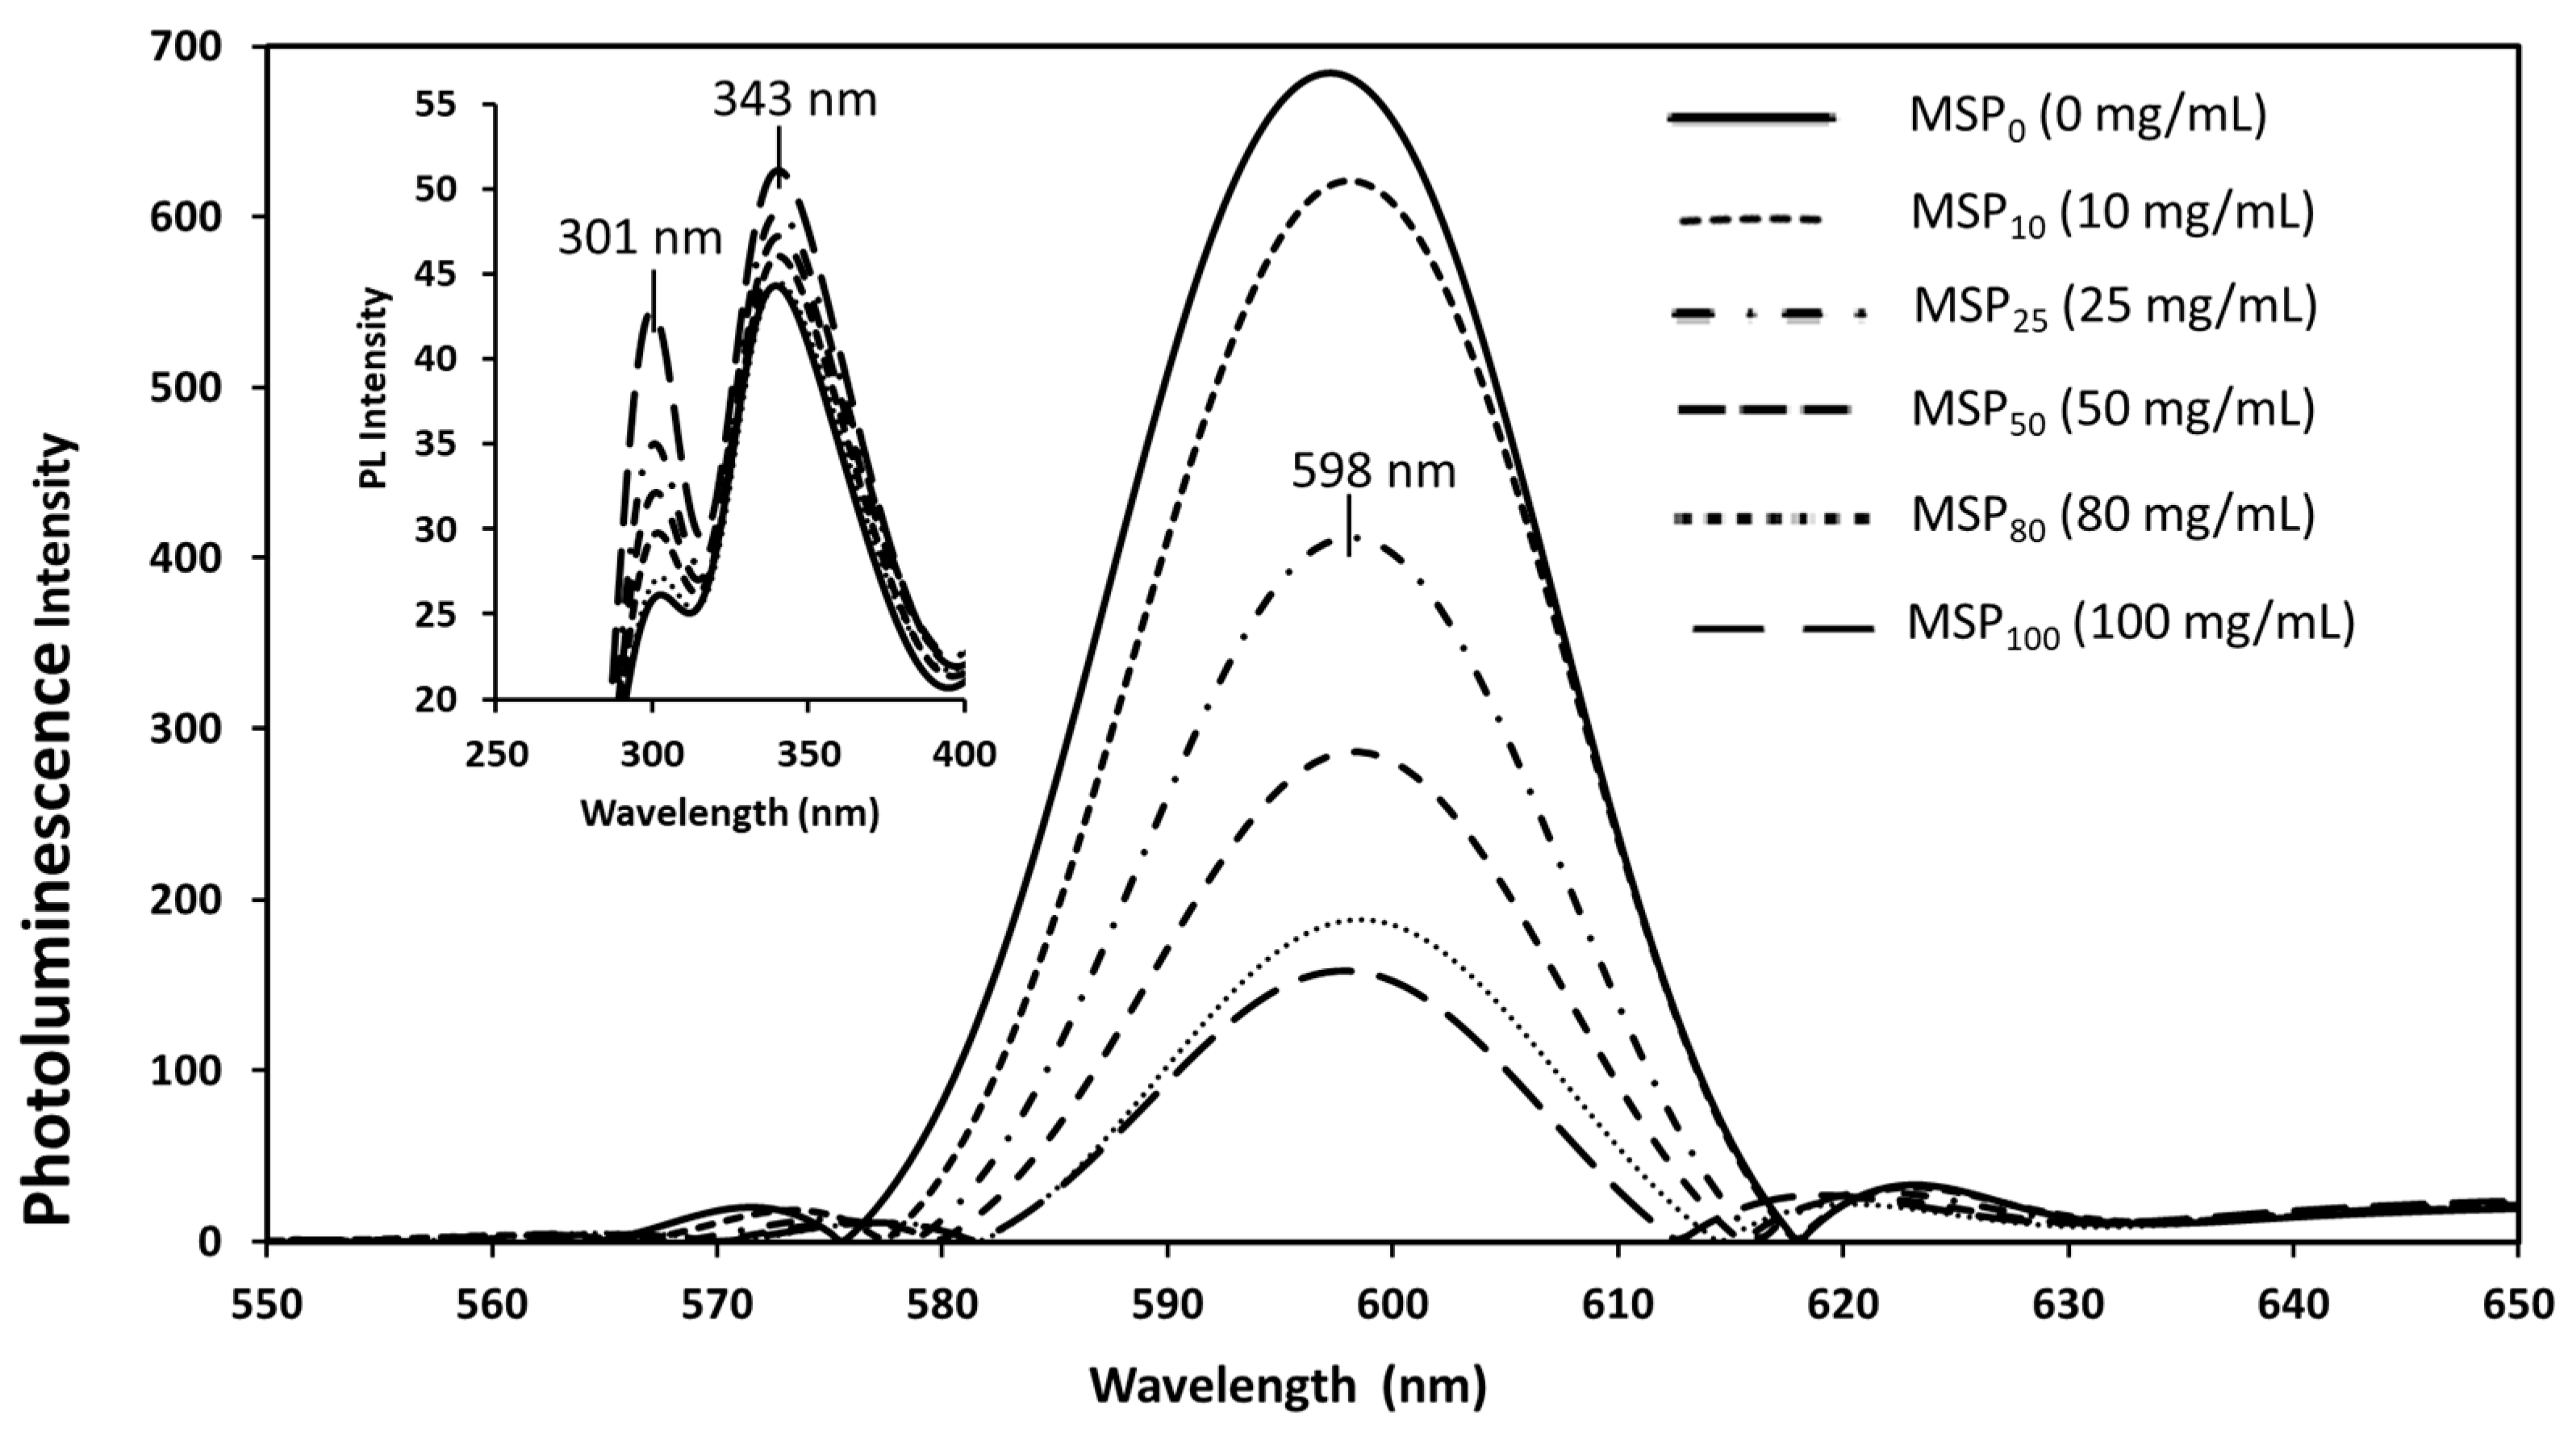
3.4. Interaction between CdSe QDs and MSP Using the UV–Vis Absorption and Fluorescence Spectra

Figure 4 shows the well-defined absorption spectra of the CdSe QDs in the presence and absence of MSP at different concentrations. No peak is observed by MSP sample. The well-defined spectra indicate that the QD dispersions are homogeneous and contain mono-dispersity nanocrystals. Presence of any peak at around 330 nm and 550 nm confirms the presence of nanoparticle aggregation [47]. The first excitonic absorption peak center is at 546 nm, corresponding to an absorption energy of 2.27 eV of CdSe QD. The absorption energy can be different as compared to pieces in the literature, depending on particle size and shape [30,48]. Upon the mixing of the CdSe solution with the different concentrations of MSP (10, 50 and 100 g/L), there was no new band observed. However, blue shifts in the absorption peaks and changes in the intensity of the maximum absorption band of CdSe QDs were observed. The shifts in the absorption spectra indicate the presence of strong interaction between CdSe QDs and MSP, which can be attributed to molecular complexation in the formation of the CdSe–MSP stable conjugates. The resultant change in absorption intensity may indicate that the protein residues in the MSP were in the hydrophobic environment [36].
The band gap structure of CdSe QDs and CdSe–MSPn was studied using the Tauc plot, to determine the energy of direct and indirect band gaps. As shown in Table 1, it was found that the direct band gap of CdSe QDs is 2.27 eV, and the indirect band gap is 2.20 eV. The CdSe band gap decreased with the increase in the concentration of MSP. The formation of this complex can modify the electronic structure of the QDs, resulting in a change in their band gap energy [49]. These results indicate that CdSE QD interacts with MSP. The quenching of fluorescence emission results from the dynamic or static interaction between a quencher and fluorophore [50]. The quenching mechanisms between MSP and CdSe QDs were found to be dynamic, which is confirmed by the changes observed in the absorption spectra of the UV–Vis absorption analysis. This was further evaluated by fluorescence quenching experiments, discussed as follows.
The intrinsic fluorescence intensity of the sample decreases due to the quenching of protein [16]. In this study, the intrinsic fluorescence of a protein originates mainly from tryptophan, phenylalanine, and tyrosine amino acid residues, which often change upon interaction with nanocrystals [51]. To confirm this assertion, the interaction between CdSe QDs and MSP ligand was further studied using fluorescence quenching spectra. Figure 5 shows the fluorescence quenching spectra of the CdSe–MSP complexes at different concentrations. The result reflects that non-florescent CdSe–MSP complexes were formed due to quenching [52]. The inset figure demonstrates that the spectra have two emission peaks in the range of 280–400 nm wavelength, suggesting the presence of only two fluorescing proteins type in the solutions. The tyrosine residue emission can be seen in the spectra at 301 nm and the emission of MSP is dominated by tryptophan which absorbs at 343 nm [16]. This implies that the excitation of 280 nm selectively excites tryptophan and a minimum amount of tyrosine fluorescence. The contributors to the fluorescence of proteins are usually tryptophan, tyrosine and phenylalanine residues [16]. However, in this case, phenylalanine is not a significant contributor to the fluorescence spectra, since there is no emission peak at 280 nm. The fluorescence intensity reduced gradually with increased concentration of MSP, and a blue shift was also observed suggesting that the fluorescent CdSe nanocrystals are placed in a more hydrophobic environment after the addition of MSP, hence energy transfer occurred [51]. Fluorescence quenching was therefore due to the formation of a non-florescent complex [50].
The fluorescence spectra of CdSe QDs in the absence and presence of MSP at different concentrations are shown in Figure 5 (the main spectra). The CdSe QD emission can be seen in the spectra at 598 nm [53]. At a very low concentration of 10 gL−1 (MSP10), there was a minimal decrease in fluorescence intensity compared to pure CdSe QD. However, sudden decreases in fluorescence intensities were observed at a higher concentration of MSP (MSP100). Thus, fluorescence quenching is higher at high concentrations of MSP. The quenching of fluorescence emission results from the dynamic interaction between a quencher and fluorophore [50]. In many interaction studies of quantum dots and protein, QDs have quenched the protein [53]. When QDs are near a protein, their fluorescence emission can be quenched due to energy transfer from the QD to the MSP.
In many interaction studies of quantum dots and protein, QDs have quenched the protein [52,53]. In the previous studies, we have used standard quenchers, viz. acrylamide, iodide and nitrate, to quench the fluorescence of the Moringa seed proteins [15], whereas, in the present study, the FL spectra showed a strong quenching effect of MSP in the fluorescence of CdSe QDs, which is higher at MSP100. According to the study by Yan et al., 2012 [54], the combination of protein with QD interaction changes the external environment and structure of a protein, which yields decreased fluorescence intensity. Hence, a similar explanation can be applied in the quenching between MSP and CdSe QDs. There exists a strong interaction between CdSe QDs and MSP as reflected by the steady decrease in fluorescence intensity that give rise to the quenching mechanisms [49]. The quenching effect may result from many molecular interaction mechanisms, such as surface-bound complexation equilibrium, ground state complex formation, molecular rearrangement, the electrostatic interaction and the energy transfer process [35,37,38,49] between the CdSe QDs and MSP

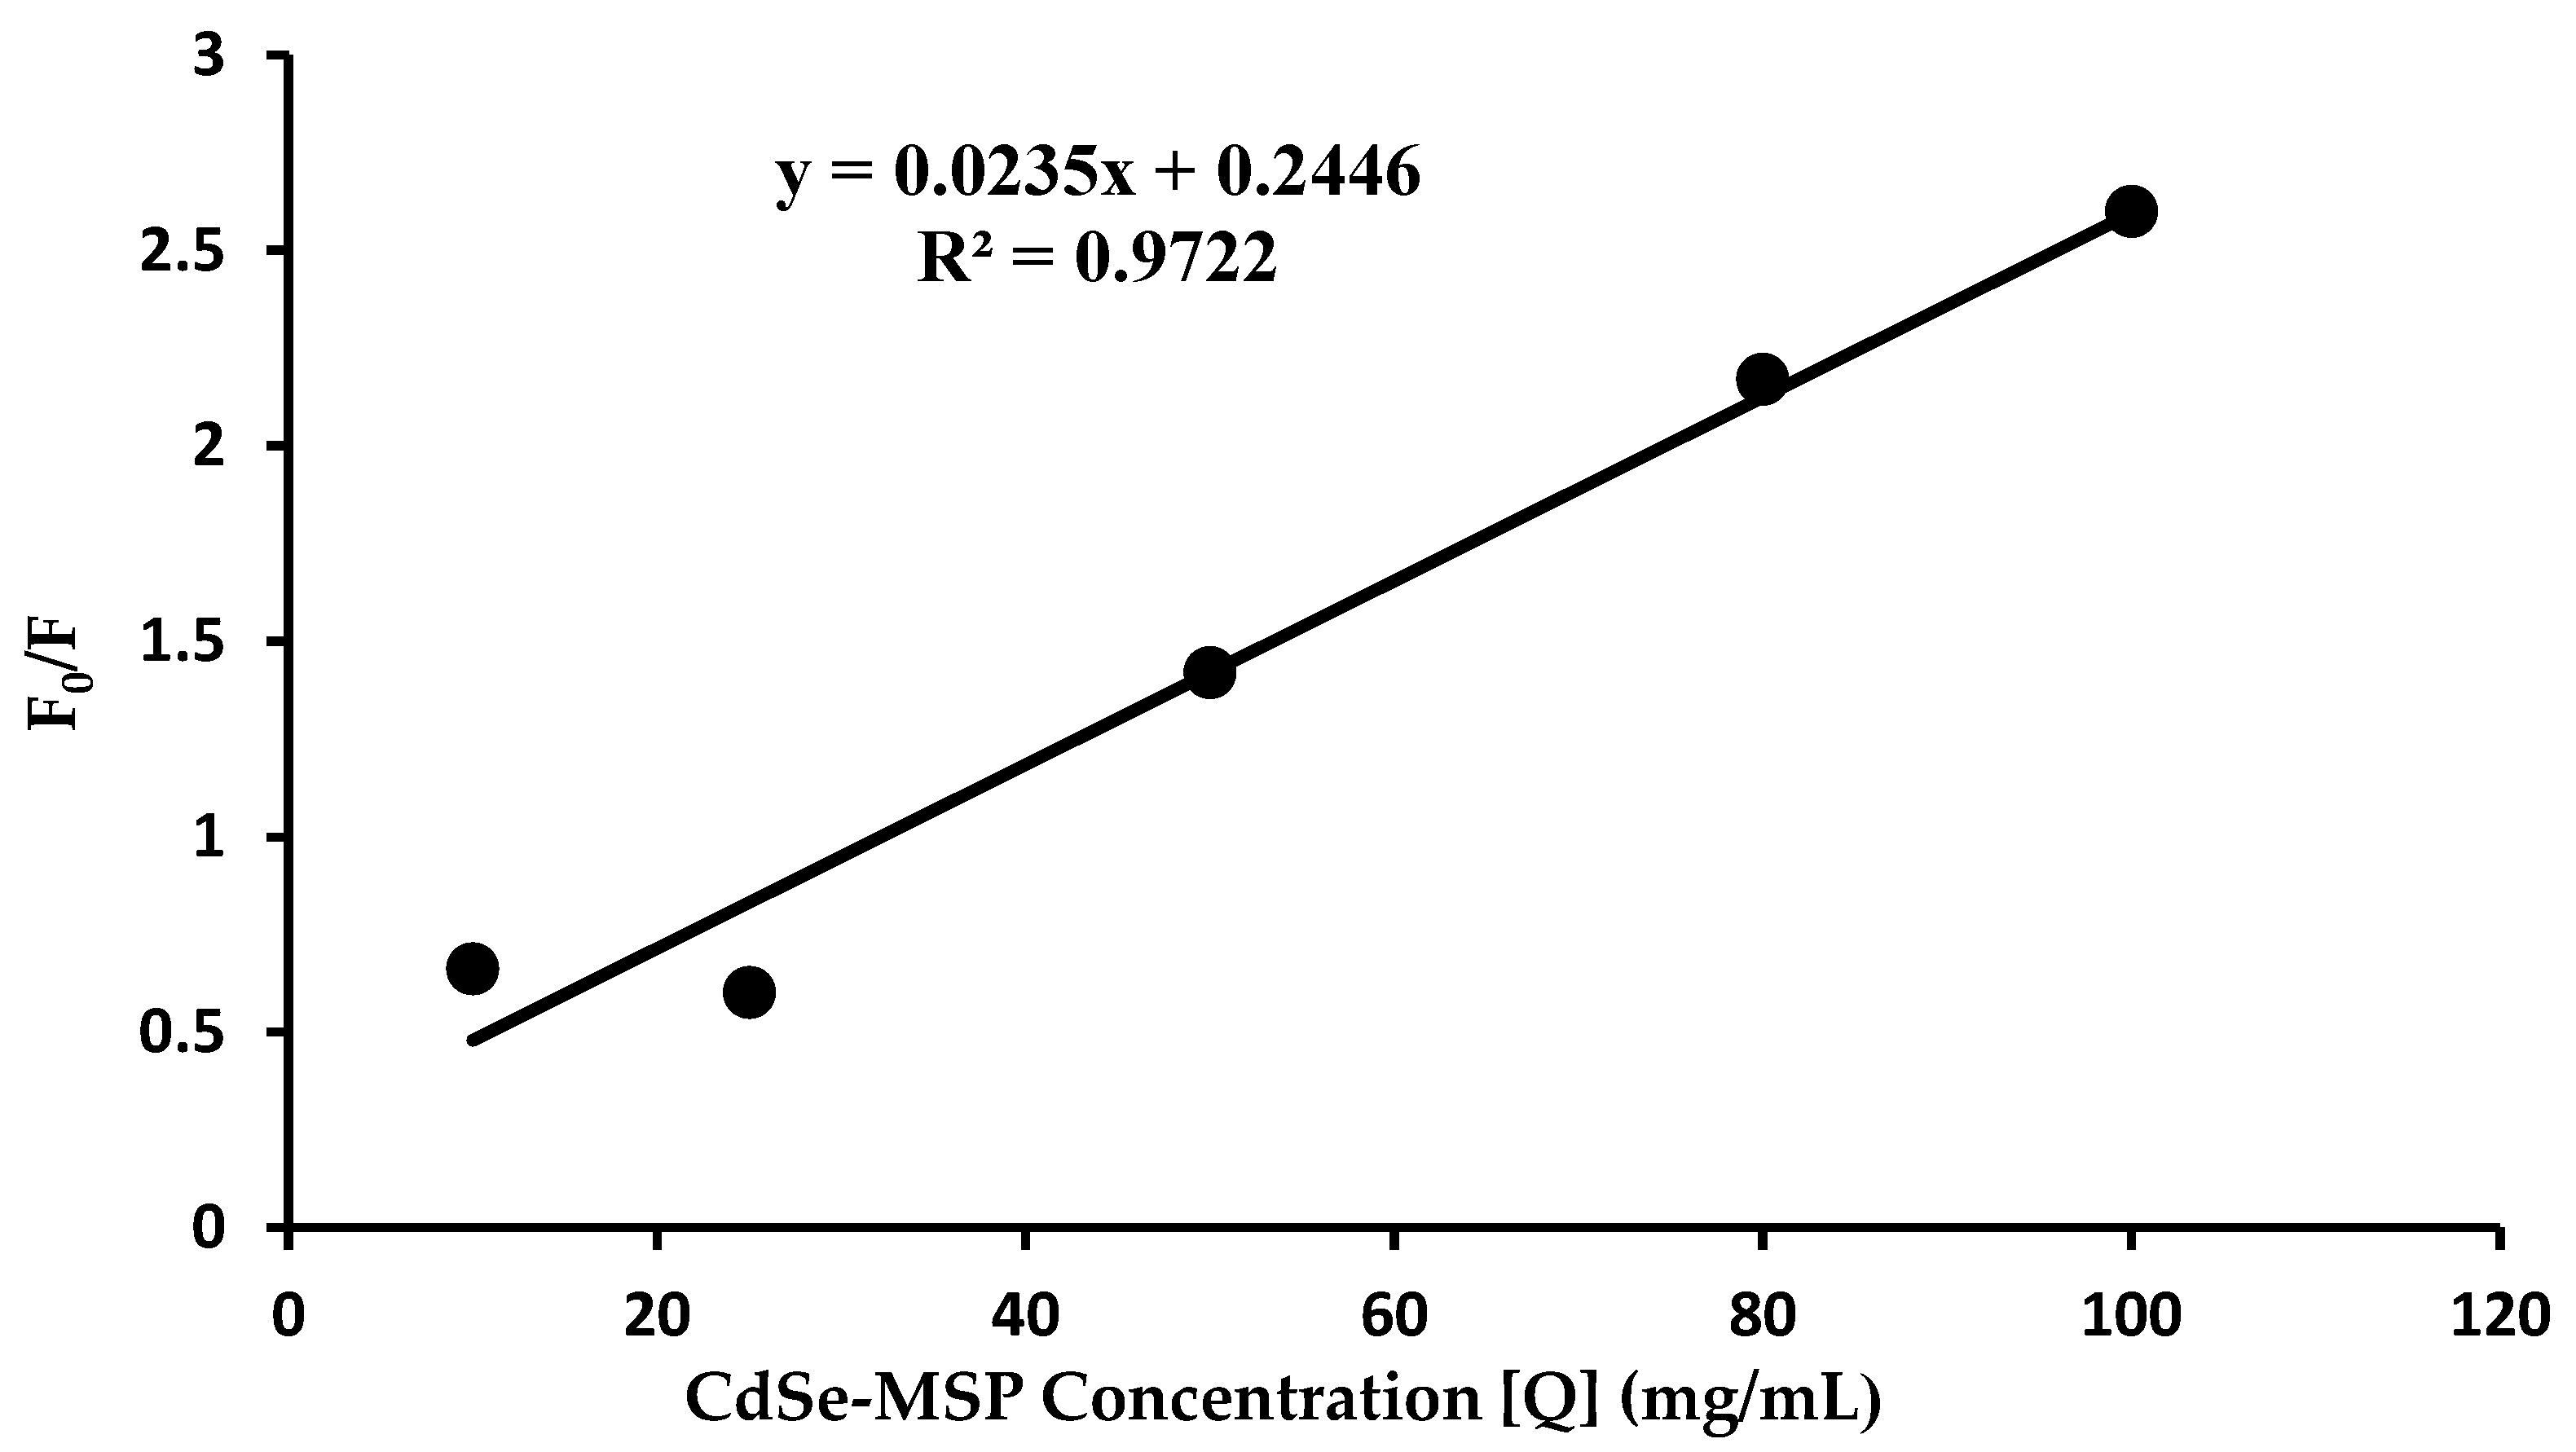
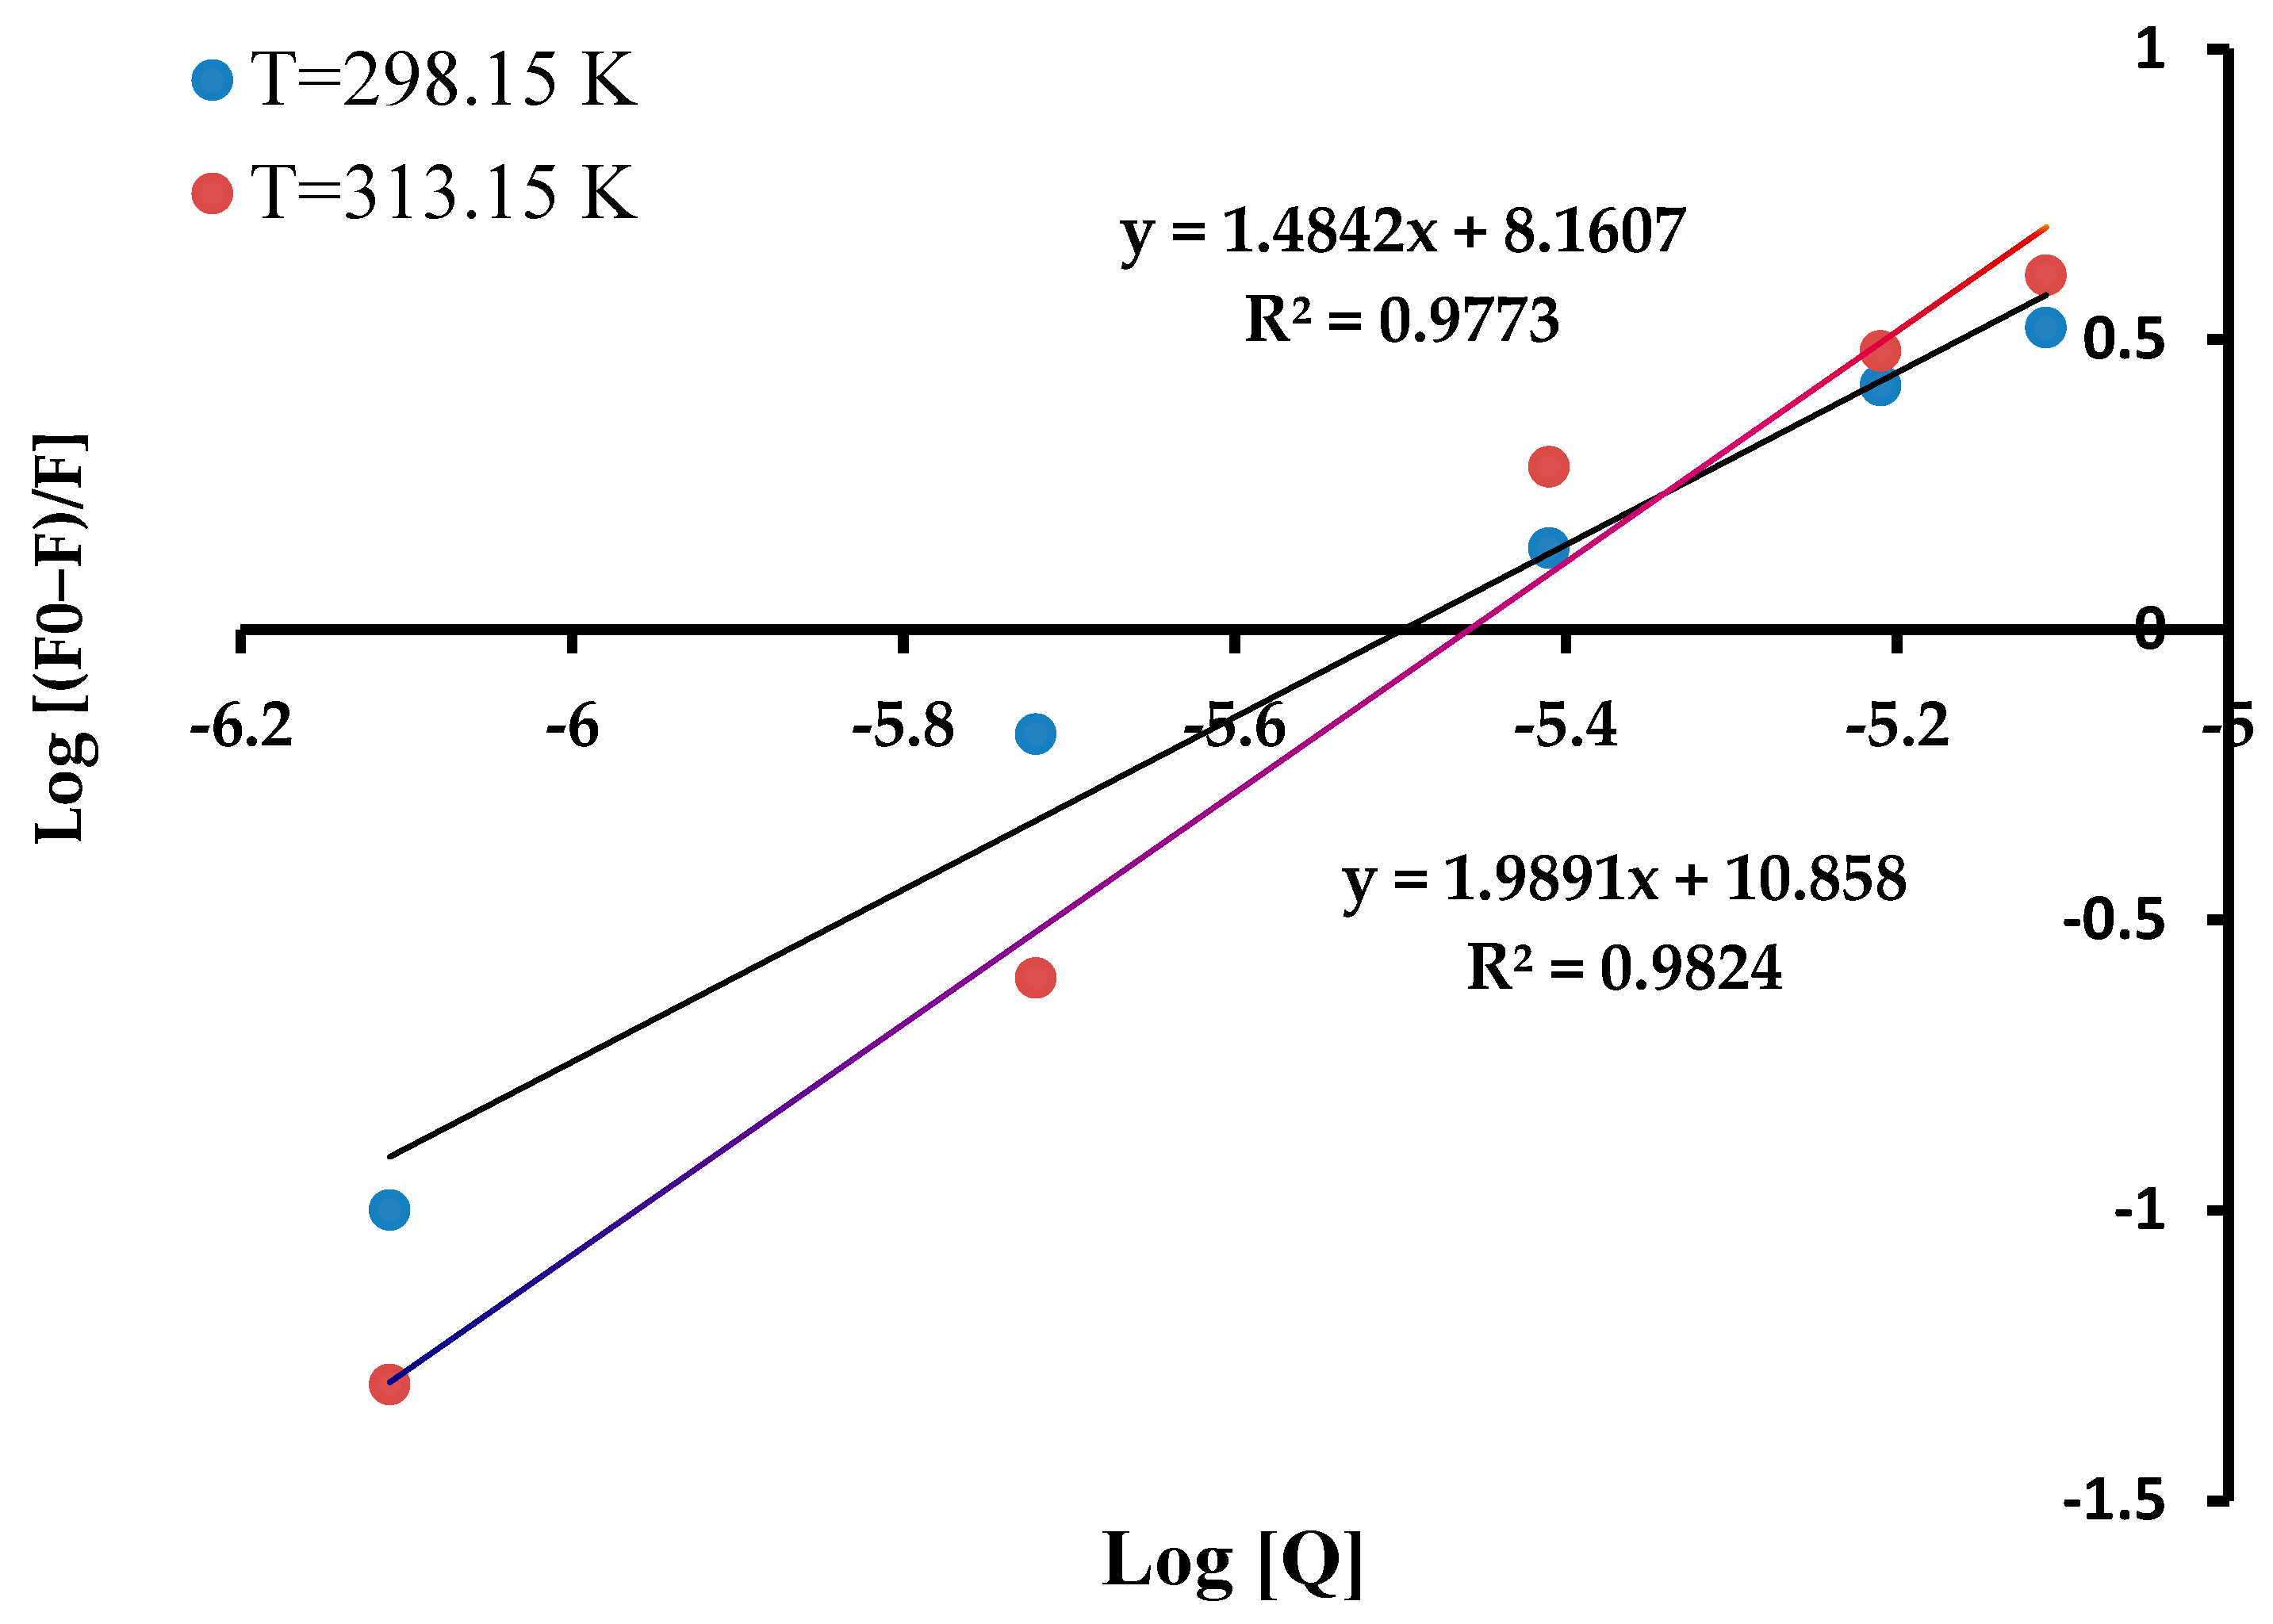
3.5. Stern–Volmer Analysis of the CdSe QDs–MSP System Interactions

The Stern–Volmer plot of F0/F against the CdSe–MSP system with different concentrations of MSP was employed to provide valuable insights into the nature and strength of the interaction and determine the binding constant and quenching constants between a fluorophore (in this case, CdSe quantum dots) and a quencher (MSP) [19]. To perform the Stern–Volmer analysis, the fluorescence quenching intensity (F0) of the CdSe QDs in the absence and presence of different concentrations of MSP (F10,25,50,80,100) was extracted from Figure 5, and the data was plotted on a Stern–Volmer plot shown in Figure 6, based on the Stern–Volmer equation presented in Equation (3):
F 0 F = 1 + k q τ 0 Q = 1 + K s v   [ Q ]
where F0 is the fluorescence intensity of CdSe QDs in the absence of the quencher, F is the fluorescence intensity of CdSe QD in the presence of the quencher, Ksv is the Stern–Volmer quenching constant, [Q] is the concentration of the quencher and Kq is protein quenching rate constant, and τ0 is the average lifetime of the fluorophore in the excited state; usually, for a biomolecule, this is 10−8 s. By plotting F/F0 against [Q], the Stern–Volmer constant (Ksv) was determined from the slope of the linear fit.
The Stern–Volmer plot presented establishes that there is a linear relationship between the relative fluorescence of a fluorophore (CdSE nanocrystals) intensity and concentration of quencher (MSP). At a very low concentration of the MSP (10 and 25 gL−1), there was no significant change in the quenching effect, which suggests that there is minimal quenching to nearly stationed fluorescence quenching [39]. Therefore, at low concentrations and a very rare chance of conformational change, it shows stationary fluorescence quenching then, at higher concentrations due to structural rigidity, steric hindrance may occur against acquiring electrostatic interaction with CdTe QDs because of high affinity towards them [3]. A steady increase in the quenching effect was observed upon the increase in the concentration of MSP (50 g/L to 100 g/L), which suggests a strong interaction and conformational change in the MSP structure and hence indicates the possible existence of more binding sites and a higher affinity of MSP toward the CdSe QDs [40]. The Stern–Volmer quenching constant (Ksv) was obtained as 0.0235. The complex formation was further confirmed from the value of rate constant Kq, using Equation (4):
K q = K s v   τ
The binding constant (Kb) and the quenching constant (Kq) were also determined as 1.78 × 10⁵ mL/mg and 1.97 × 10⁷ Lg−1, respectively. The fluorescence lifetime ( τ 0 ) of the excited state of CdSe QDs in the absence of MSP was also derived from a Stern–Volmer analysis and was found to be τ 0   = 1.91 × 10⁻⁹ s−1.
The quenching mechanisms of MSP with CdSe QDs were analysed using the modified Stern–Volmer equation known as the Scatchard method (Equations (5)–(9)) [30]. The number of binding sites (n) and the static quenching constant (K), which is the equilibrium constant in this present paper, were calculated using the Scatchard relation approximation. The thermodynamic parameter, the Gibbs free energy G θ , the enthalpy change H θ , and the entropy change S θ were calculated using the equations below:
l o g F 0 F F = L o g K + n l o g   Q
  G θ = R T   I n K
I n K 2 K 1 = 1 T 2 1 1 H θ R
I n K θ = H θ R T + S θ R
G θ = H θ T S θ
where T is the temperature in (K) and R is the gas constant 8.314 JK−1mol−1. The interaction was carried at temperatures of 298.15 K and 313.15 K.
From the Scatchard relation plot [33], Equation (5) was equated to the equation of a straight line, thus the slope is equal to n and the y-intercept is a log. Therefore, the number of binding sites (n), and the binding constant, which is also referred to as the equilibrium constant (K), was obtained. The Scatchard relation is represented by plotting of log ((F0F)/F) versus log (Q) at temperature 298.1 K and 313.15 K, respectively, as shown in Figure 7.
The steady decrease in the fluorescence of CdTe QDs after interaction with MSP strongly indicates that some conformational changes are occurring due to the interaction, suggesting the availability of more binding sites for CdTe QDs [3]. The number of binding sites was found to be 1.50 and 2.00 at temperature 298.15 K and 313.15 K, respectively. The quenching constant was determined as K = 1.45 × 10⁸ and 7.21 × 10¹⁰ at temperature (T) 298.15 K and 313.15 K, respectively. This implies that the system is dynamic quenching, since the quenching constants tend to increase with temperature, as higher temperature results in a larger diffusion coefficient. The enthalpy change ( H θ ) was calculated to be −321.3 JK−1mol−1, a negative value, and S θ was found to be 156.0 JK−1mol−1, a positive value; based on these values, there is an indication that the binding mechanisms of MSP with CdSe QDs are entropically driven [40]. The change in Gibbs free energy ( G θ ) was calculated to be −46.6 ×   10 3 Jmol−1 at 298.15 K and −65.1 ×   10 3   Jmol−1 at 313.15 K; a negative value indicates that the binding interaction is spontaneous [48]. The negative values of both H θ and G θ reveal that the major interaction mechanisms are the electrostatic interaction, van der Waals forces and hydrophobic interaction [37,38,39,40].

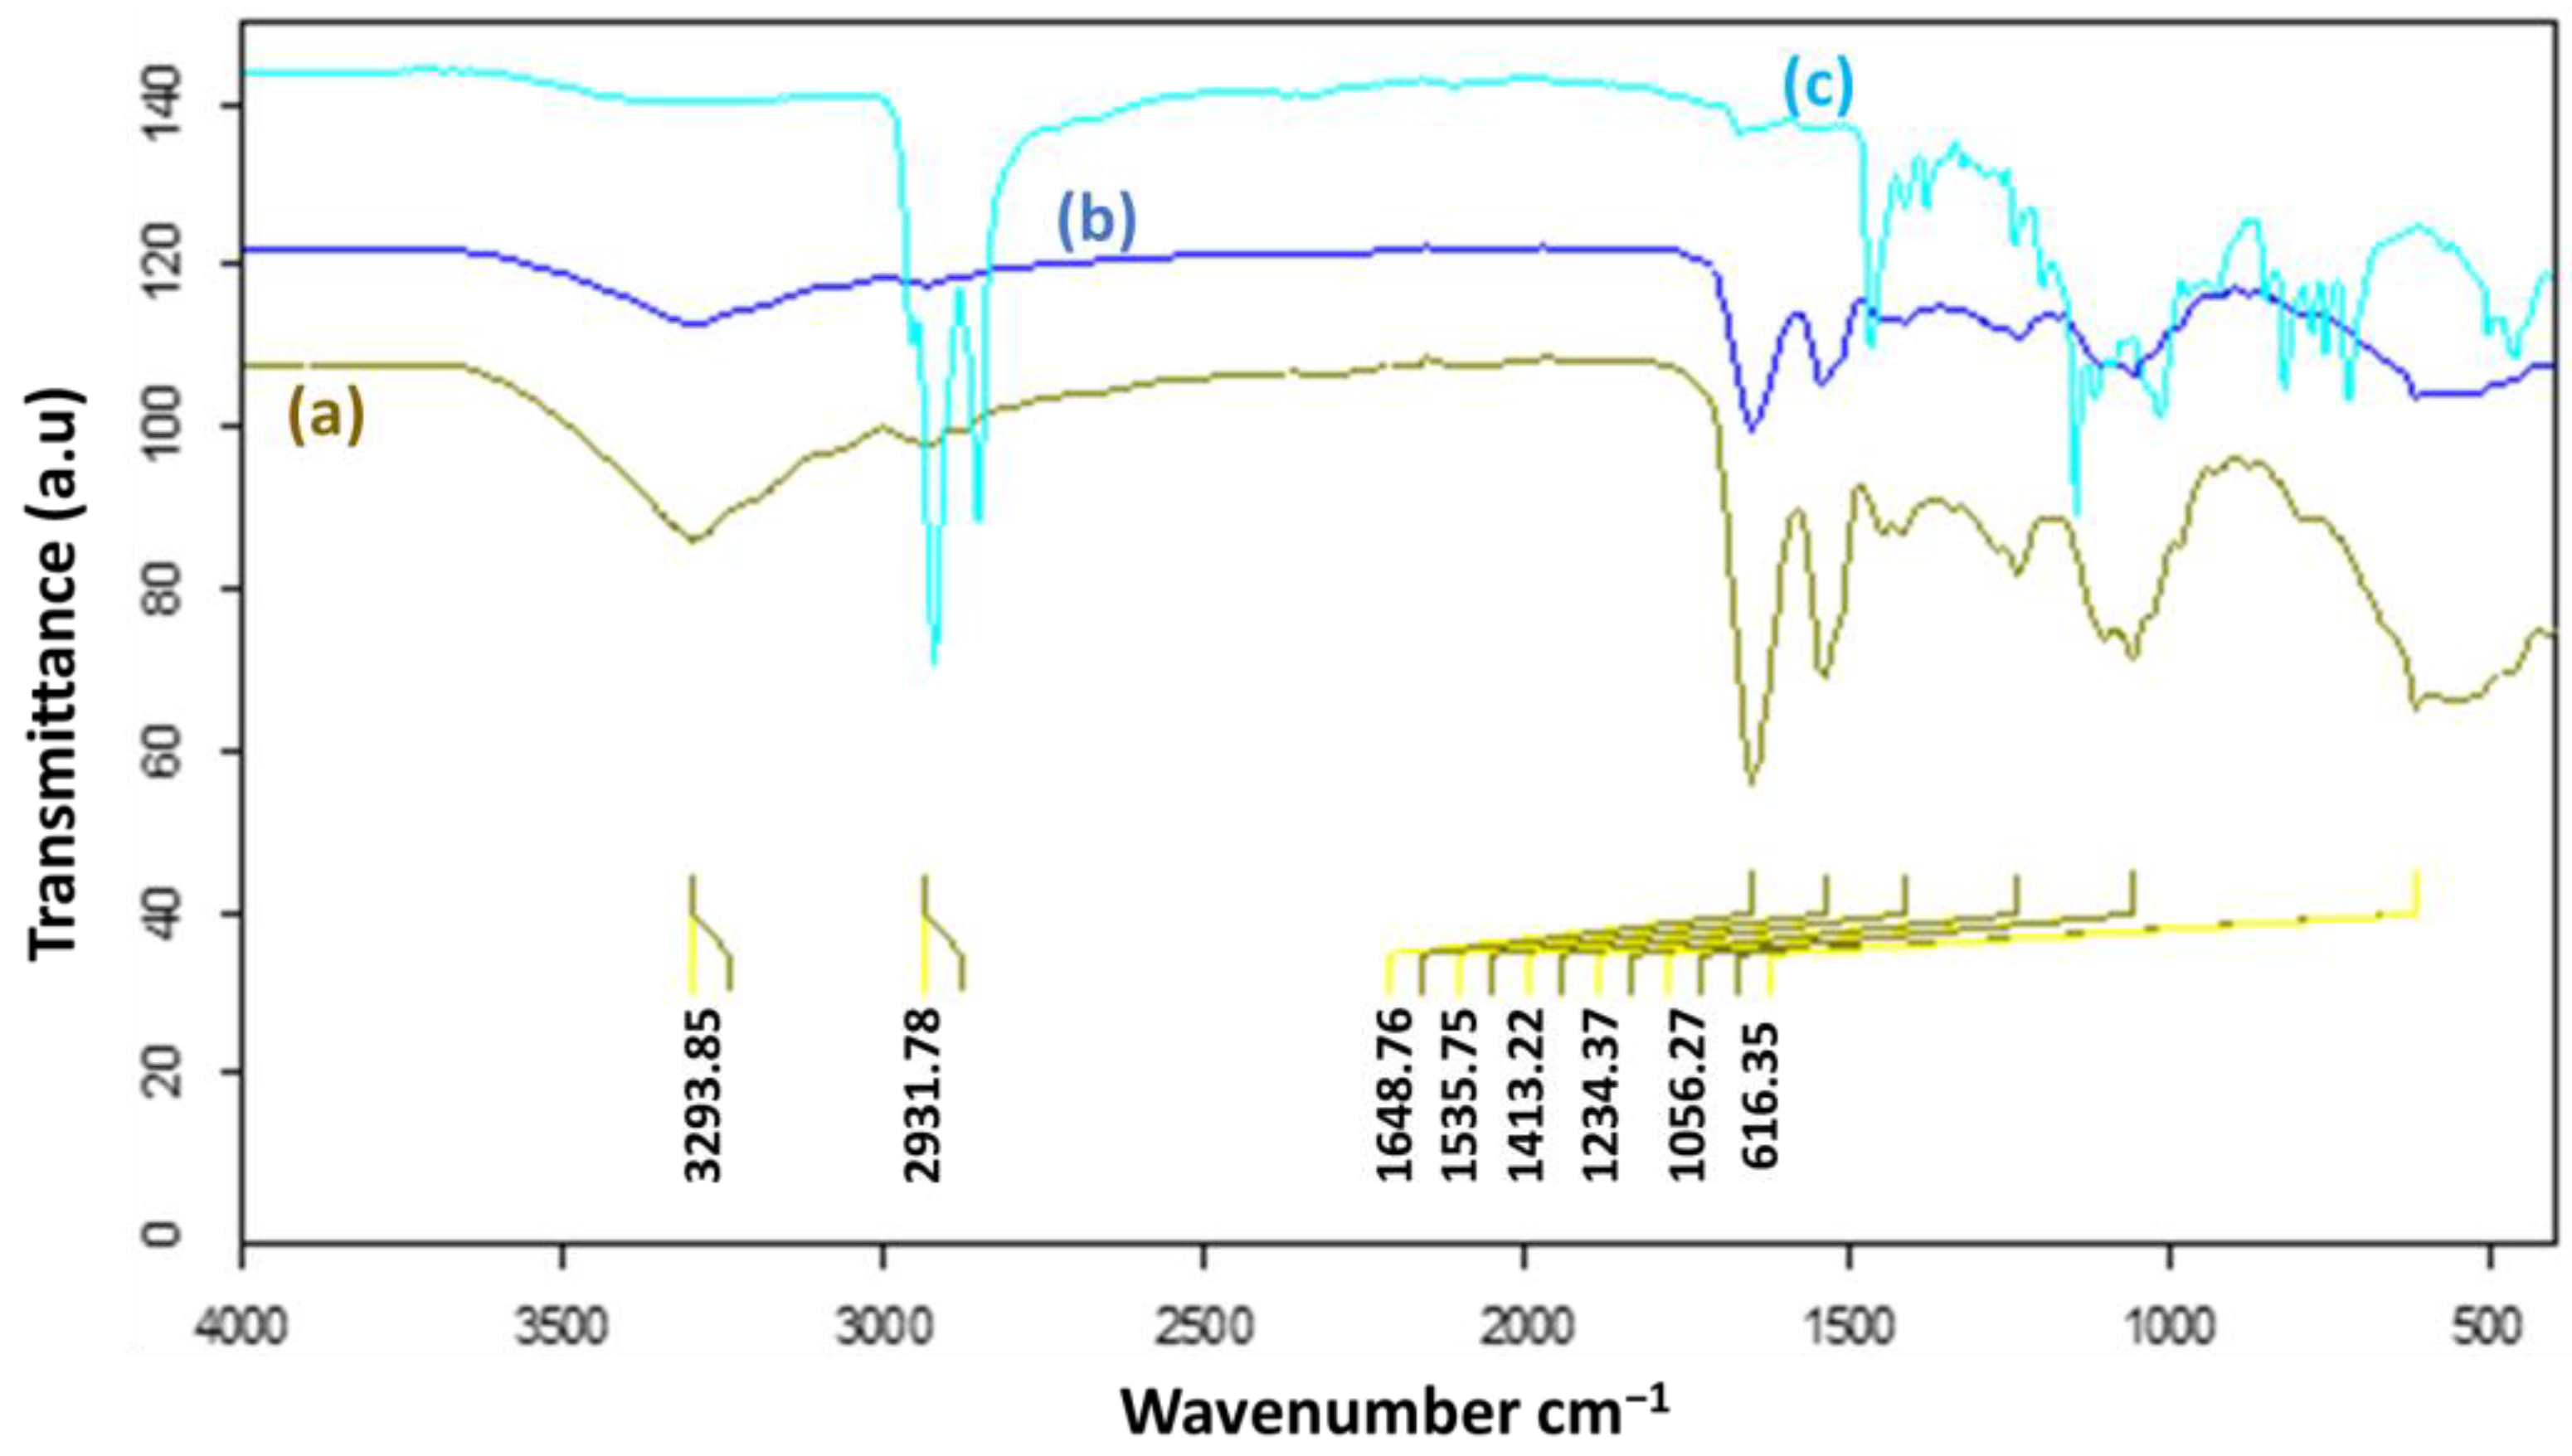
3.6. FTIR Analysis of the CdSe QDs–MSP System Interactions

To study the mechanism of electrostatic interactions of CdSe QDs with proteins at different concentrations, FTIR spectra of MSP, CdSe QDs, and CdSe–MSP50, were determined, as shown in Figure 8.
In the case of MSP, Figure 8a shows notable absorption peaks of the phenol group at 3293.85 cm−1, primary amine at 1648.76 cm−1, nitro group at 1535.75 cm−1 and an aliphatic amine at 1234 cm−1. The functional group of the two absorption bands at 1648.76 cm−1 and 1535.75 cm−1 can also be related and shows the presence of the amide I and amide II functional groups. The band at 1535.75 cm−1 can also indicate the presence of the α -helices [43]. In comparison, Kwaambwa and Maikokera [44] showed the presence of the α -helix secondary structure given by the band at 1291 cm−1, which is absent in the FTIR spectrum of MSP, thus phenylalanine residues were not detected in the PL spectra in this study. The difference in the extracted structures of MSPs depends on the method of extraction and purification techniques used.
Figure 8b shows the spectrum of CdSe–MSP at a concentration of 50 mg/mL of protein. The spectrum is identical to that of MSP, hence a conclusion can be drawn that there is no new functional group between the CdSe QDs and MSP [45]. The formation of the new bond could have changed the CdSe–MSP spectrum, thus the CdSe QDs did not influence the chemical structure of MSP. CdSe QDs are adsorbed into the MSP utilizing electrostatic interaction and surface-bound complexation equilibrium attractions, which correlate to the fluorescence quenching mechanisms and the UV–Vis absorption spectra results [34]. The alkyl chains of methanol molecules in CdSe QDs exhibit C–H stretching vibrations, as indicated by distinct bands at 2931 and 2855 cm−1 in Figure 8c [45,55].

4. Conclusions

The CdSe QDs were synthesized using the organic solvent trioctyl-n-phosphene oxide (TOPO) and trioctylphosphine (TOP). The crystalline size of CdSe QDs was determined by UV–Vis absorption to be in the range pf 3.0 nm. XRD analysis revealed that CdSe QDs have a hexagonal phase with a particle size of 3.0–8.0 nm. The TEM image showed an even distribution and the spherical surface of CdSe QDs and confirmed the crystalline size CdSe QDs at a 10 nm scale. The BET analysis determined the surface area and pore size of MSP and it was classified as mesoporous. The SEM image indicated that the CdSe–MSP complex is not a crystalline structure. The interaction of CdSe QDs with the increasing concentration of MSP showed a decrease in fluorescence intensity, which is classified as dynamic quenching. The Stern–Volmer quenching constant (Ksv), binding constant (Kb), quenching constant (Kq) and the number of binding sites (n) were determined, demonstrating the formation of CdSe–MSP complex, which proved the UV–Vis absorption spectra. The thermodynamic potentials were calculated using the Scatchard equation, ΔG° < 0, ΔH° < 0 and ΔS° > 0, which indicates that the binding mechanisms in entropically favoured and spontaneous; it further demonstrated that the stable CdSe–MSP complex is a result of electrostatic interaction, molecular complexation and presence of hydrophobic interaction and Van der Waals forces. From the Scatchard relation plot of log ((Fo − F)/F)) versus log (Q) at temperature 298.1 K and 313.15 K, respectively, the slopes (Ksv) obtained do not depend on the concentration of MSP in dynamic quenching, whereas they do not change at any concentration of MSP in static quenching. The results obtained here confirm that the quenching of the CdSe by MSP is a dynamic process. Overall, the study of the interaction between MSP and CdSe QDs can contribute to the development of safer and more efficient nanoparticles for various applications, as well as providing a deeper understanding of the complex processes involved in the interaction between natural proteins and nanoparticles. Through the application of bioengineering, there is a potential that MSP can still retain coagulation/flocculation properties, while the CdSe acts as a photocatalyst response in killing the waterborne bacteria, since it can enhance light harvesting efficiency.

Supplementary Materials

The following supporting information can be downloaded at https://www.mdpi.com/article/10.3390/photochem4010003/s1: Figure S1: Adsorption isotherm of N2 gas on MSP; Figure S2: BET linear plot of the adsorption isotherm of N2 gas on MSP; Figure S3: The SEM image of CdSe-MSP50; Table S1. BET analysis Isotherm linear plot (Moringa Adsorption); Table S2: BET MSP Surface Area plot.

Author Contributions

Conceptualization, L.S.D., S.K., M.K.-S. and H.M.K.; methodology, L.S.D., S.K. and H.M.K.; validation, L.S.D. and H.M.K.; formal analysis, S.K. and L.S.D.; investigation, S.K. and L.S.D.; resources, H.M.K.; data curation, L.S.D. and H.M.K.; writing—original draft preparation, M.K.-S. and L.S.D.; writing—review and editing, L.S.D. and H.M.K.; supervision, H.M.K., L.S.D. and M.K.-S.; project administration, H.M.K. and L.S.D. All authors have read and agreed to the published version of the manuscript.

Funding

National Commission of Science and Technology (NCRST): NCRST Capacity Building Research Grant.

Data Availability Statement

Data are contained within the article and Supplementary Materials.

Acknowledgments

Authors are grateful to the UNAM and NUST for providing support and facility to conduct this research and the Centre of Research Service (CRS) for providing technical help and support.

Conflicts of Interest

The authors declare no conflicts of interest.

References

  1. Bera, D.; Qian, L.; Tseng, T.K.; Holloway, P.H. Quantum dots and their multimodal applications: A review. Materials 2010, 3, 2260–2345. [Google Scholar] [CrossRef]
  2. Poderys, V.; Matulionyte, M.; Selskis, A.; Rotomskis, R. Interaction of water-soluble CdTe quantum dots with bovine serum albumin. Nanoscale Res. Lett. 2011, 6, 9. Available online: http://www.nanoscalereslett.com/content/6/1/9 (accessed on 21 December 2023). [CrossRef]
  3. Joglekar, S.S.; Gholap, H.M.; Alegaonkar, P.S.; Kale, A.A. The interactions between CdTe quantum dots and proteins: Understanding nano-bio interface. AIMS Mater. Sci. 2017, 4, 209–222. [Google Scholar] [CrossRef]
  4. Shivaji, K.; Sridharan, K.; Kirubakaran, D.D.; Velusamy, J.; Emadian, S.S.; Krishnamurthy, S.; Devadoss, A.; Nagarajan, S.; Das, S.; Pitchaimuthu, S. Biofunctionalized CdS Quantum Dots: A Case Study on Nanomaterial Toxicity in the Photocatalytic Wastewater Treatment Process. ACS Omega 2023, 8, 19413–19424. Available online: https://pubs.acs.org/doi/10.1021/acsomega.3c00496 (accessed on 21 December 2023). [CrossRef] [PubMed]
  5. Vasudevan, D.; Gaddam, R.R.; Trinchi, A.; Cole, I. Core–shell quantum dots: Properties and applications. J. Alloys Compd. 2015, 636, 395–404. [Google Scholar] [CrossRef]
  6. Wang, Z.; Tang, M. The cytotoxicity of core-shell or non-shell structure quantum dots and reflection on environmental friendly: A review. Environ. Res. 2021, 194, 110593. [Google Scholar] [CrossRef] [PubMed]
  7. Le, N.; Zhang, M.; Kim, K. Quantum dots and their interaction with biological systems. Int. J. Mol. Sci. 2022, 23, 10763. [Google Scholar] [CrossRef]
  8. Ratnesh, R.K.; Mehata, M.S. Synthesis and optical properties of core-multi-shell CdSe/CdS/ZnS quantum dots: Surface modifications. Opt. Mater. 2017, 64, 250–256. [Google Scholar] [CrossRef]
  9. Liu, G.; Liang, W.; Xue, X.; Rosei, F.; Wang, Y. Atomic Identification of Interfaces in Individual Core@ shell Quantum Dots. Adv. Sci. 2021, 8, 2102784. [Google Scholar] [CrossRef]
  10. Tarantini, A.; Wegner, K.D.; Dussert, F.; Sarret, G.; Béal, D.; Mattera, L.; Lincheneau, C.; Proux, O.; Truffier-Boutry, D.; Moriscot, C.; et al. Physicochemical alterations and toxicity of InP alloyed quantum dots aged in environmental conditions: A safer by design evaluation. NanoImpact 2019, 14, 100168. [Google Scholar] [CrossRef]
  11. Derfus, A.M.; Chan, W.C.; Bhatia, S.N. Probing the cytotoxicity of semiconductor quantum dots. Nano Lett. 2004, 4, 11–18. [Google Scholar] [CrossRef] [PubMed]
  12. Ndabigengesere, A.; Narasiah, K.S.; Talbot, B.G. Active agents and mechanism of coagulation of turbid waters using Moringa oleifera. Water Res. 1995, 29, 703–710. [Google Scholar] [CrossRef]
  13. Sánchez-Martín, J.; Beltrán-Heredia, J.; Peres, J.A. Improvement of the flocculation process in water treatment by using Moringa oleifera seeds extract. Braz. J. Chem. Eng. 2012, 29, 495–502. [Google Scholar] [CrossRef]
  14. El Bouaidi, W.; Libralato, G.; Tazart, Z.; Enaime, G.; Douma, M.; Ounas, A.; Yaacoubi, A.; Lofrano, G.; Carotenuto, M.; Saviano, L.; et al. Nature-based coagulants for drinking water treatment: An ecotoxicological overview. Water Environ. Res. 2022, 94, e10782. [Google Scholar] [CrossRef]
  15. Maikokera, R.; Kwaambwa, H.M. Interfacial properties and fluorescence of a coagulating protein extracted from Moringa oleifera seeds and its interaction with sodium dodecyl sulphate. Colloids Surf. B Biointerfaces 2007, 55, 173–178. [Google Scholar] [CrossRef] [PubMed]
  16. Kwaambwa, H.M.; Maikokera, R. A fluorescence spectroscopic study of a coagulating protein extracted from Moringa oleifera seeds. Colloids Surf. B Biointerfaces 2007, 60, 213–220. [Google Scholar] [CrossRef]
  17. Kwaambwa, H.M.; Maikokera, R. Infrared and circular dichroism spectroscopic characterisation of secondary structure components of a water treatment coagulant protein extracted from Moringa oleifera seeds. Colloids Surf. B Biointerfaces 2008, 64, 118–125. [Google Scholar] [CrossRef]
  18. Kwaambwa, H.M.; Rennie, A.R. Interactions of surfactants with a water treatment protein from Moringa oleifera seeds in solution studied by zeta-potential and light scattering measurements. Biopolymers 2012, 97, 209–218. [Google Scholar] [CrossRef]
  19. Kwaambwa, H.M.; Hellsing, M.; Rennie, A.R. Adsorption of a water treatment protein from Moringa oleifera seeds to a silicon oxide surface studied by neutron reflection. Langmuir 2010, 26, 3902–3910. [Google Scholar] [CrossRef]
  20. Jerri, H.A.; Adolfsen, K.J.; McCullough, L.R.; Velegol, D.; Velegol, S.B. Antimicrobial sand via adsorption of cationic Moringa oleifera protein. Langmuir 2012, 28, 2262–2268. [Google Scholar] [CrossRef]
  21. Kwaambwa, H.M.; Hellsing, M.S.; Rennie, A.R.; Barker, R. Interaction of Moringa oleifera seed protein with a mineral surface and the influence of surfactants. J. Colloid Interface Sci. 2015, 448, 339–346. [Google Scholar] [CrossRef] [PubMed]
  22. Moulin, M.; Mossou, E.; Signor, L.; Kieffer-Jaquinod, S.; Kwaambwa, H.; Nermark, F.; Gutfreund, P.; Mitchell, E.; Haertlein, M.; Forsyth, V.; et al. Towards a molecular understanding of the water purification properties of Moringa seed proteins. J. Colloid Interface Sci. 2019, 554, 296–304. [Google Scholar] [CrossRef]
  23. Nordmark, B.A.; Bechtel, T.M.; Riley, J.K.; Velegol, D.; Velegol, S.B.; Przybycien, T.M.; Tilton, R.D. Moringa oleifera seed protein adsorption to silica: Effects of water hardness, fractionation, and fatty acid extraction. Langmuir 2018, 34, 4852–4860. [Google Scholar] [CrossRef] [PubMed]
  24. Nouhi, S.; Pascual, M.; Hellsing, M.S.; Kwaambwa, H.M.; Skoda, M.W.; Höök, F.; Rennie, A.R. Sticking particles to solid surfaces using Moringa oleifera proteins as a glue. Colloids Surf. B Biointerfaces 2018, 168, 68–75. [Google Scholar] [CrossRef] [PubMed]
  25. Nouhi, S.; Kwaambwa, H.M.; Gutfreund, P.; Rennie, A.R. Comparative study of flocculation and adsorption behaviour of water treatment proteins from Moringa peregrina and Moringa oleifera seeds. Sci. Rep. 2019, 9, 17945. [Google Scholar] [CrossRef]
  26. Hellsing, M.S.; Kwaambwa, H.M.; Nermark, F.M.; Nkoane, B.B.; Jackson, A.J.; Wasbrough, M.J.; Berts, I.; Porcar, L.; Rennie, A.R. Structure of flocs of latex particles formed by addition of protein from Moringa seeds. Colloids Surf. A Physicochem. Eng. Asp. 2014, 460, 460–467. [Google Scholar] [CrossRef]
  27. Amuanyena, M.O.; Kandawa-Schulz, M.; Kwaambwa, H.M. Magnetic iron oxide nanoparticles modified with Moringa seed proteins for recovery of precious metal ions. J. Biomater. Nanobiotechnol. 2019, 10, 142. [Google Scholar] [CrossRef]
  28. Drbohlavova, J.; Adam, V.; Kizek, R.; Hubalek, J. Quantum dots—Characterization, preparation and usage in biological systems. Int. J. Mol. Sci. 2009, 10, 656–673. [Google Scholar] [CrossRef]
  29. Sutherland, J.P.; Folkard, G.K.; Grant, W.D. Natural coagulants for appropriate water treatment: A novel approach. Waterlines 1990, 8, 30–32. [Google Scholar] [CrossRef]
  30. Thanki, A.; Padhiyar, H.; Singh, N.K.; Yadav, M.; Christian, J. Municipal Wastewater Treatment Using Moringa oleifera Seed and Press Cake Powder: A Comparative Analysis. CLEAN–Soil Air Water 2022, 51, 2100336. [Google Scholar] [CrossRef]
  31. Rosenthal, S.J.; Chang, J.C.; Kovtun, O.; McBride, J.R.; Tomlinson, I.D. Biocompatible quantum dots for biological applications. Chem. Biol. 2011, 18, 10–24. [Google Scholar] [CrossRef] [PubMed]
  32. Kapofi, S. Interactions of Cadmium Selenide (CdSe) Quantum Dots with Coagulant Proteins Extracted from Moringa oleifera Seeds. Doctoral Dissertation, University of Namibia, Windhoek, Namibia, 2019. Available online: https://repository.unam.edu.na/bitstream/handle/11070/2559/kapofi2019.pdf?sequence=1&isAllowed=y (accessed on 21 December 2023).
  33. Lohse, S.E.; Murphy, C.J. Applications of colloidal inorganic nanoparticles: From medicine to energy. J. Am. Chem. Soc. 2012, 134, 15607–15620. [Google Scholar] [CrossRef] [PubMed]
  34. Kathiresan, R.; Gopalakrishnan, S.; Kolandaivel, P. Interaction and bioconjugation of CdSe/ZnS core/shell quantum dots with maltose-binding protein. Comput. Theor. Chem. 2017, 1101, 96–101. [Google Scholar] [CrossRef]
  35. Wang, Y.; Zheng, J.; Zhang, Z.; Yuan, C.; Fu, D. CdTe nanocrystals as luminescent probes for detecting ATP, folic acid and l-cysteine in aqueous solution. Colloids Surf. A Physicochem. Eng. Asp. 2009, 342, 102–106. [Google Scholar] [CrossRef]
  36. Liang, J.; Cheng, Y.; Han, H. Study on the interaction between bovine serum albumin and CdTe quantum dots with spectroscopic techniques. J. Mol. Struct. 2008, 892, 116–120. [Google Scholar] [CrossRef]
  37. Mekis, I.; Talapin, D.V.; Kornowski, A.; Haase, M.; Weller, H. One-pot synthesis of highly luminescent CdSe/CdS core-shell nanocrystals via organometallic and “Greener” chemical approaches. J. Phys. Chem. B 2003, 107, 7454–7462. [Google Scholar] [CrossRef]
  38. Gupta, D.K.; Verma, M.; Sharma, K.; Saxena, N.S. Synthesis, characterization and optical properties of CdSe/CdS and CdSe/ZnS core-shell nanoparticles. Indian J. Pure Appl. Phys. (IJPAP) 2017, 55, 113–121. [Google Scholar] [CrossRef]
  39. Ndabigengesere, A.; Narasiah, K.S. Use of Moringa oleifera seeds as a primary coagulant in wastewater treatment. Environ. Technol. 1998, 19, 789–800. [Google Scholar] [CrossRef]
  40. Ndabigengesere, A.; Narasiah, K.S. Quality of water treated by coagulation using Moringa oleifera seeds. Water Res. 1998, 32, 781–791. [Google Scholar] [CrossRef]
  41. Soni, U.; Arora, V.; Sapra, S. Wurtzite or zinc blende? Surface decides the crystal structure of nanocrystals. CrystEngComm 2013, 15, 5458–5463. [Google Scholar] [CrossRef]
  42. Kim, S.H.; Man, M.T.; Lee, J.W.; Park, K.D.; Lee, H.S. Influence of size and shape anisotropy on optical properties of CdSe quantum dots. Nanomaterials 2020, 10, 1589. [Google Scholar] [CrossRef] [PubMed]
  43. Naderi, M. Surface area: Brauer–emmett–teller (BET). In Progress in Filtration and Separation; Academic Press: Cambridge, MA, USA, 2015; pp. 585–608. [Google Scholar] [CrossRef]
  44. Yu, M.; Saeed, M.H.; Zhang, S.; Wei, H.; Gao, Y.; Zou, C.; Zhang, L.; Yang, H. Luminescence Enhancement, Encapsulation, and Patterning of Quantum Dots Toward Display Applications. Adv. Funct. Mater. 2022, 32, 2109472. [Google Scholar] [CrossRef]
  45. Wang, H.; Nienhaus, K.; Shang, L.; Nienhaus, G.U. Highly Luminescent Positively Charged Quantum Dots Interacting with Proteins and Cells. Chin. J. Chem. 2022, 40, 2685–2693. [Google Scholar] [CrossRef]
  46. Nisha, R.R.; Jegathambal, P.; Parameswari, K.; Kirupa, K. Biocompatible water softening system using cationic protein from moringa oleifera extract. Appl. Water Sci. 2017, 7, 2933–2941. [Google Scholar] [CrossRef]
  47. Irfan, M.; Munir, H.; Ismail, H. Moringa oleifera gum based silver and zinc oxide nanoparticles: Green synthesis, characterization and their antibacterial potential against MRSA. Biomater. Res. 2021, 25, 17. [Google Scholar] [CrossRef] [PubMed]
  48. Yuan, G.; Gomez, D.; Kirkwood, N.; Mulvaney, P. Tuning single quantum dot emission with a micromirror. Nano Lett. 2018, 18, 1010–1017. [Google Scholar] [CrossRef]
  49. Dzagli, M.M.; Canpean, V.; Iosin, M.; Mohou, M.A.; Astilean, S. Study of the interaction between CdSe/ZnS core-shell quantum dots and bovine serum albumin by spectroscopic techniques. J. Photochem. Photobiol. A Chem. 2010, 215, 118–122. [Google Scholar] [CrossRef]
  50. Lai, L.; Lin, C.; Xu, Z.-Q.; Han, X.-L.; Tian, F.-F.; Mei, P.; Li, D.-W.; Ge, Y.-S.; Jiang, F.-L.; Zhang, Y.-Z.; et al. Spectroscopic studies on the interactions between CdTe quantum dots coated with different ligands and human serum albumin. Spectrochim. Acta Part A Mol. Biomol. Spectrosc. 2012, 97, 366–376. [Google Scholar] [CrossRef]
  51. Siddiqui, G.A.; Siddiqi, M.K.; Khan, R.H.; Naeem, A. Probing the binding of phenolic aldehyde vanillin with bovine serum albumin: Evidence from spectroscopic and docking approach. Spectrochim. Acta Part A Mol. Biomol. Spectrosc. 2018, 203, 40–47. [Google Scholar] [CrossRef]
  52. Hu, Y.J.; Ou-Yang, Y.; Dai, C.M.; Liu, Y.; Xiao, X.H. Binding of berberine to bovine serum albumin: Spectroscopic approach. Mol. Biol. Rep. 2010, 37, 3827–3832. Available online: https://link.springer.com/article/10.1007/s11033-010-0038-x (accessed on 21 December 2023). [CrossRef]
  53. Chu, V.H.; Lien Nghiem, T.H.; Le, T.H.; Lam Vu, D.; Nhung Tran, H.; Lien Vu, T.K. Synthesis and optical properties of water-soluble CdSe/CdS quantum dots for biological applications. Adv. Nat. Sci. Nanosci. Nanotechnol. 2012, 3, 025017. [Google Scholar] [CrossRef]
  54. Yan, H.; Wu, J.; Dai, G.; Zhong, A.; Chen, H.; Yang, J.; Han, D. Interaction mechanisms of ionic liquids [Cnmim] Br (n = 4, 6, 8, 10) with bovine serum albumin. J. Lumin. 2012, 132, 622–628. [Google Scholar] [CrossRef]
  55. Lima, C.N.; Cabral Filho, P.E.; Santos, B.S.; Moura, P.; Fontes, A. Interactions of mannose binding-lectin with red blood cells by employing cationic quantum dots. Int. J. Biol. Macromol. 2019, 125, 1168–1174. [Google Scholar] [CrossRef] [PubMed]
Figure 1. Powder X-ray diffraction pattern of CdSe QDs.
Photochem 04 00003 g001
Figure 2. EDX micrograph of CdSe QDs.
Photochem 04 00003 g002
Figure 3. TEM micrograph of CdSe QDs.
Photochem 04 00003 g003
Figure 4. The UV–vis absorption spectra of pure CdSe QDs and CdSe–MSPn with the concentration of MSPn where n = 0, 10 and 50 mg/mL, respectively.
Photochem 04 00003 g004
Figure 5. Fluorescence quenching spectra of CdSe nanocrystals in the presence and absence of MSP. The concentration of CdSe QDs = 5.23 × 10⁻³ M and excitation wavelength = 280 nm.
Photochem 04 00003 g005
Figure 6. Stern–Volmer equation analysis of the CdSe–MSP system: the figure shows the plot of the ratio for relative fluorescence (F0/F) versus increasing concentration of MSP [Q] in mg/mL.
Photochem 04 00003 g006
Figure 7. Scatchard relation represented by the plot of log ((F0F)/F)) versus log (Q) at temperature 298.1 K and 313.15 K, respectively.
Photochem 04 00003 g007
Figure 8. Diagram represents the FTIR spectra of (a) MSP; (b) CdSe–MSP; (c) CdSe QDs.
Photochem 04 00003 g008
Table 1. Direct and indirect band gaps of CdSe QDs and CdSe–MSP complexes.
Direct Band GapIndirect Band Gap
CdSe QDs2.272.20
CdSe–MSP102.192.12
CdSe–MSP502.200.85
CdSe–MSP1002.210.87
Disclaimer/Publisher’s Note: The statements, opinions and data contained in all publications are solely those of the individual author(s) and contributor(s) and not of MDPI and/or the editor(s). MDPI and/or the editor(s) disclaim responsibility for any injury to people or property resulting from any ideas, methods, instructions or products referred to in the content.

