Article

Photocatalytic Degradation of Methylene Blue by Magnetic Opal/Fe3O4 Colloidal Crystals under Visible Light Irradiation

by
Abraham Jorge Carmona-Carmona
1,
Enrique Sánchez Mora
2,
Jesús Ivan Peña Flores
2,
César Márquez-Beltrán
2,
María Dolores Castañeda-Antonio
3,
Marlén Alexis González-Reyna
4,
María Concepción Barrera
5,
Khashayar Misaghian
6,7,
Jesús Eduardo Lugo
1,6,7,* and
Miller Toledo-Solano
8,*
1
Facultad de Ciencias Físico-Matemáticas, Benemérita Universidad Autónoma de Puebla, Puebla 72570, Mexico
2
Instituto de Física “Luis Rivera Terrazas”, Benemérita Universidad Autónoma de Puebla, Puebla 72570, Mexico
3
Centro en Investigaciones en Ciencias Microbiológicas, Instituto de Ciencias BUAP, Puebla 72570, Mexico
4
Centro de Física Aplicada y Tecnología Avanzada, Universidad Autónoma de México, Campus UNAM 3001, Querétaro 76230, Mexico
5
Facultad de Ciencias Químicas, Universidad Veracruzana, Coatzacoalcos 96538, Mexico
6
Faubert Lab, Université de Montréal, Montreal, QC H3T 1P1, Canada
7
Sage-Sentinel Smart Solutions, 1919-1 Tancha, Onna-son, Kunigami-gun, Okinawa 904-0495, Japan
8
CONAHCYT-Facultad de Ciencias Físico-Matemáticas, Benemérita Universidad Autónoma de Puebla, Puebla 72570, Mexico
*
Authors to whom correspondence should be addressed.
Photochem 2023, 3(4), 390-407; https://doi.org/10.3390/photochem3040024
Submission received: 12 August 2023 / Revised: 18 September 2023 / Accepted: 28 September 2023 / Published: 8 October 2023

Abstract

:
In this study, opal–magnetite photocatalysts based on SiO2 artificial opal crystals infiltrated with different concentrations of Fe3O4 nanoparticles (NPs) were synthesized using a combination of lateral infiltration and co-assembly methods. By adjusting the concentration of Fe3O4 NPs in the SiO2 opal crystal, the energy band gap (Eg) was tuned to enable efficient degradation of methylene blue (MB) under visible light (410 nm and 575 nm). The photocatalytic process involved two stages: MB adsorption on the surface due to charge differences in the composite film and subsequent degradation through oxidative radicals on the catalyst’s surface. The developed material exhibited potential for applications in water remediation.

1. Introduction

In recent years, the increasing solubility of organic dyes in water has posed significant challenges for conventional treatment methods, including flocculation, activated carbon adsorption, and bioremediation [1]. Notably, these techniques often prove ineffective in reducing contaminants and generate substantial amounts of sludge, compounding environmental concerns [2]. Consequently, researchers have shifted their focus towards developing novel catalytic devices, particularly thin film materials with rigid supports, to address these issues [3]. However, one prominent drawback of these materials is their limited surface area, resulting in insufficient interaction between contaminants and the catalyst surface, thereby reducing the overall reaction rate [4].
To overcome these limitations, extensive attention has been given to utilizing nanostructured materials, which offer enhanced performance and efficiency in various applications. The continuous advancement in nanotechnology opens up exciting possibilities for exploring and tailoring nanostructured materials to tackle the diverse challenges associated with water purification, offering innovative and sustainable solutions for a cleaner and safer water supply. Among these materials, we can distinguish the following: (1) Graphene-based materials: Graphene and its derivatives, such as graphene oxide (GO) and reduced graphene oxide (rGO), possess exceptional mechanical strength, high surface area, and excellent adsorption properties. These materials have shown promise in removing heavy metals, organic contaminants, and even pathogens from water [5]. (2) Metal–organic frameworks (MOFs): MOFs are highly porous materials comprising metal ions coordinated with organic ligands. Their tunable structure and large surface area make them effective adsorbents for various pollutants, including heavy metals, dyes, and organic compounds [6]. (3) Carbon nanotubes (CNTs): CNTs exhibit remarkable mechanical, electrical, and adsorption properties. Functionalized CNTs can efficiently remove organic and inorganic contaminants from water through adsorption and catalytic degradation processes [7]. (4) Titanium dioxide nanoparticles (TiO2 NPs): TiO2 NPs are widely investigated for their photocatalytic properties. Under UV or visible light irradiation, they can generate reactive oxygen species, leading to the degradation of organic pollutants and the inactivation of pathogens [8]. (5) Silver nanoparticles (Ag NPs): Due to their potent antimicrobial properties, Ag NPs are employed for disinfection, helping combat waterborne pathogens, and preventing microbial growth in water systems [9]. (6) Nanostructured zeolites: Nano-sized zeolites possess excellent ion exchange capabilities, making them helpful in removing heavy metal ions and ammonium from water [10]. (7) Metal nanoparticles (e.g., Pd, Pt, Cu, Au): These nanoparticles, supported on various materials like mesoporous silica, carbon, or alumina, exhibit catalytic properties that facilitate the degradation of organic pollutants and the reduction of toxic substances in water [11]. (8) Nanocellulose: Derived from plant-based cellulose, nanocellulose materials have high mechanical strength and a large surface area. They can be used for adsorption, filtration, and as support matrices for other nanoparticles [12]. (9) Nanoscale zero-valent iron (nZVI): nZVI comprises iron nanoparticles with high reactivity and surface area. It can effectively reduce various contaminants, such as chlorinated solvents, heavy metals, and nitroaromatic compounds, through redox reactions [13]. (10) Magnetic nanocomposites: Among these materials, magnetic oxide nanoparticles (NPs) have garnered substantial interest due to their small size, high magnetism, and low toxicity [14,15]. Magnetic NPs have demonstrated remarkable efficacy in wastewater purification, heavy metal removal, and photocatalytic dye degradation [16,17]. Nonetheless, the application of powder catalysts presents challenges in terms of recovery, recycling, and separation, posing potential risks to human health and the environment [18].
A promising strategy to address these concerns and improve catalyst efficiency involves incorporating magnetic NPs into nanostructured supports, such as the sphere matrix of an artificial opal [19,20]. In this context, amorphous silica emerges as a suitable candidate. Opals, known for their large surface area and porosity, are frequently employed as adsorbents and nanomaterial support [21]. Integrating Fe3O4 NPs into an assembly of SiO2 particles creates a recovered photocatalyst with enhanced potential. Furthermore, this approach facilitates scalability by introducing an array of nanostructured supports as a catalytic bank, promoting ease of implementation.
The objectives of this study are two-fold: first, to examine the performance of the SiO2-Fe3O4 nanoparticle assembly as a photocatalyst for the degradation of methylene blue (MB). MB is a prominent organic pollutant from the textile industry, causing significant adverse environmental effects [22,23]. Second, and central to this investigation, is the role of Fe3O4 NPs within the artificial opal matrix, influencing both the bandgap energy and the number of active catalytic sites. By optimizing the concentration of Fe3O4 NPs, the catalytic reduction performance can be finely tuned, enhancing the overall efficacy of the photocatalyst. The tunability ranges from 433 nm (Blue) to 591 nm (Orange). This opens up the possibility of using solar energy to achieve the photocatalyst. Conversely, the state of the art for these photocatalytic processes always uses artificial UV light, making the process more expensive. The experiments were conducted at two different wavelengths within the visible range to enable efficient degradation while maintaining a low oxygen concentration environment to prevent phase changes in the NPs. The degradation process was carefully monitored using high-performance liquid chromatography (HPLC). Additionally, the kinetic model employed to describe the reduction process is of particular interest, as it follows a pseudo-second-order pattern, characteristic of chemisorption and ionic exchange between the superficial hydroxyl groups and the MB molecules.
By integrating SiO2-Fe3O4 nanoparticle assemblies as recovered photocatalysts, this study presents a different approach to tackle the challenges posed by organic dye pollution in wastewater, further contributing to advancing wastewater treatment technologies and environmental preservation.

2. Materials and Methods

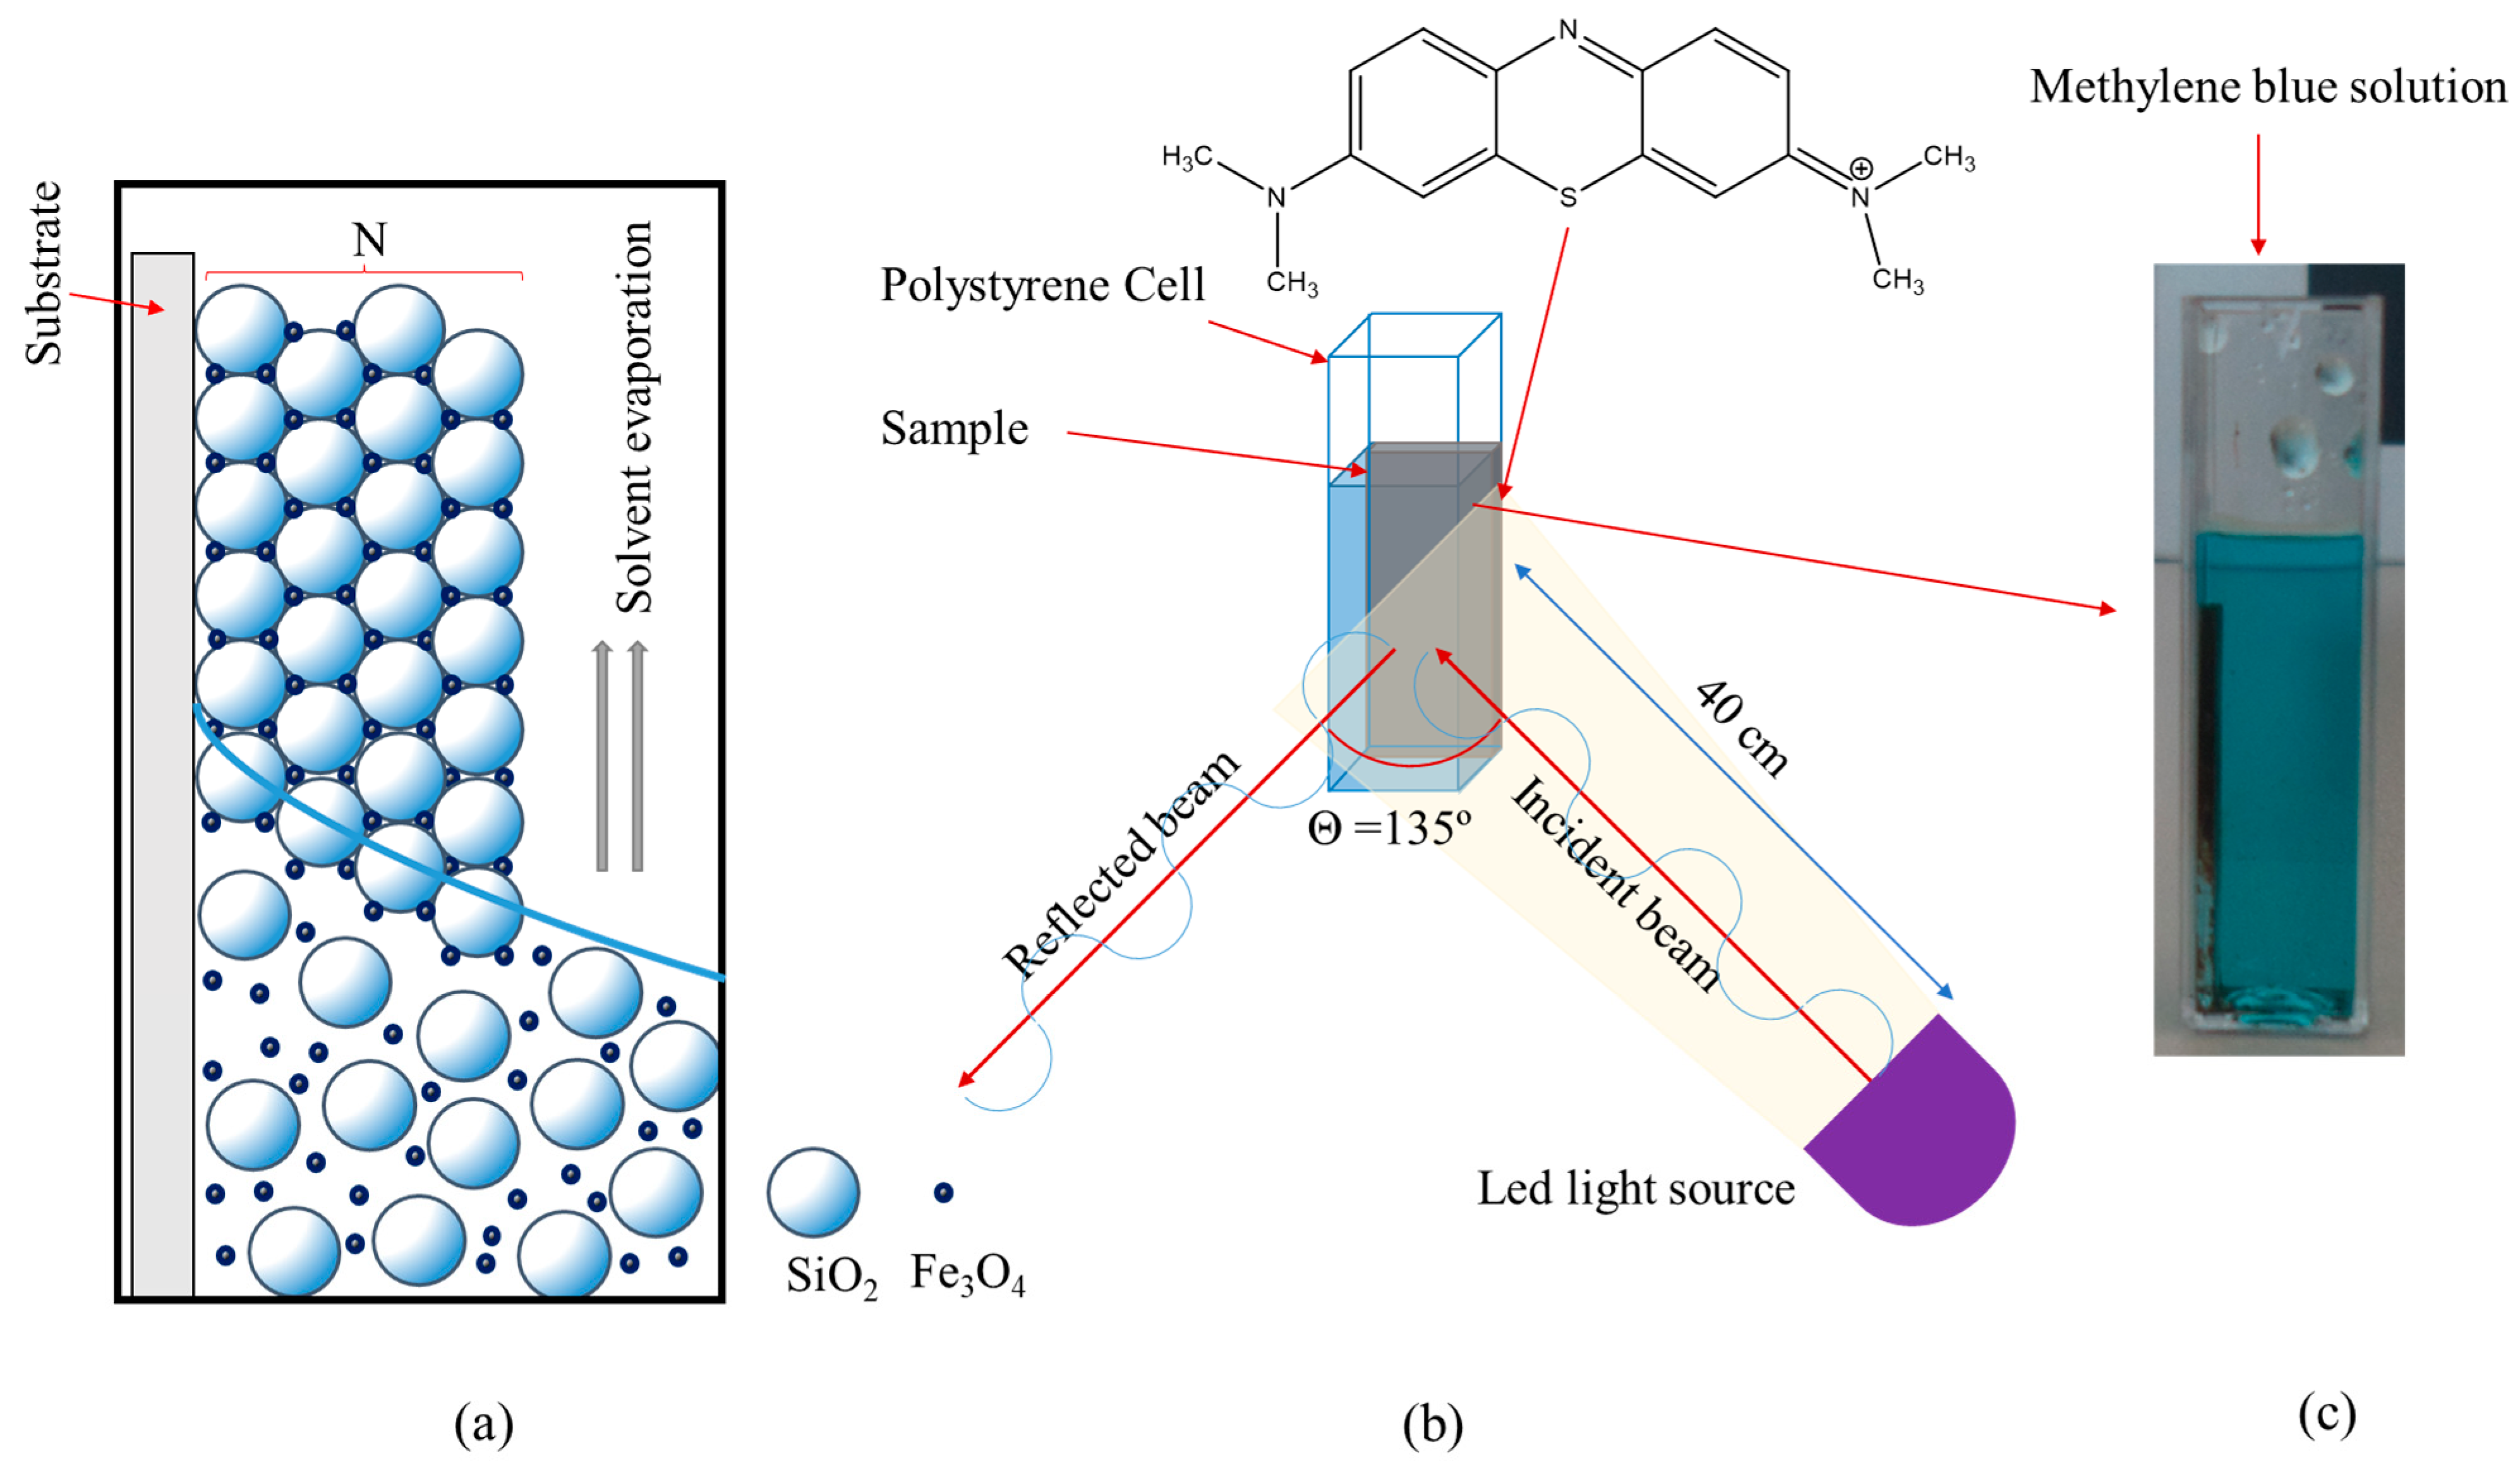
2.1. Synthesis of the SiO2-Fe3O4 Composites

Synthesis of Fe3O4 NPs, SiO2 spheres, and films of SiO2-Fe3O4 composites followed the methodology reported by Carmona-Carmona et al. [24]. Briefly, Fe3O4 NPs were synthesized by the chemical precipitation of 200 mL solution containing 0.3 M of FeCl3·6H2O and 0.16 M of FeCl2·4H2O at 70 °C by adding 16.00 g of NaOH under N2 for five hours. The solution was then cooled down until room temperature. Corresponding precipitates were separated and washed with deionized water until they reached neutral pH, washed with acetone, and dried (80 °C). Finally, a 0.058 M solution of Fe3O4 with deoxygenated water and one mL of TMAOH (added as a surfactant) was prepared.
The SiO2 microspheres were synthesized using the Stöber [25] and Santamaría et al. [26] methods by mixing two solutions, one containing NH4OH, ethanol, and deionized water (1:7:24 mol proportion). The other consisted of 6.60 mL of TEOS and 93.40 mL of ethanol. Both solutions were mixed and stirred for one hour at room temperature to form the SiO2 spheres. Then, they were separated through centrifugation, washed three times with deionized water, and redispersed in the same solvent (at a concentration of 0.002 M). The pH was determined conventionally, obtaining a value of ~7, and the Z-potential was favorably negative (~−55 mV). The latter was determined with a Zetasizer nano ZS90. In a measurement range of 0.3 nm to 5 microns with a 633 nm laser at ambient conditions.
Five SiO2-Fe3O4 composites were prepared at different Fe3O4 nanoparticle concentrations (Table 1), according to the procedure reported by Carmona-Carmona et al. [24]. Briefly, a specific volume of Fe3O4 solutions and 14 mL of the colloidal solution of SiO2 spheres were mixed. Subsequently, deionized water was added to complete the 30 mL total volume. Suspensions were stirred for 15 min. Then, a glass substrate was vertically inserted to form a film by evaporating the solvent at 80 °C (8 h). The dimensions of the substrate were approximately 10 × 25 × 1.5 mm3.

2.2. Evaluation of the Photocatalytic Activity

Samples were vertically introduced in a polystyrene cell (10 × 10 × 45 mm3 volume) containing 3 mL of MB at 12 ppm concentration. The MB solution was prepared with deionized water to avoid the change in the oxidation state of the Fe3O4 NPs. Thus, the only oxidant involved in the process came from dissolved oxygen in the aqueous solution (Figure 1).
The cell containing the composite sample was isolated from the environment and irradiated with a visible LED light at 12 W power and from a 40 cm distance. The light wavelengths used during the experiments were 410 and 575 nm. Once the procedure started, samples of the MB solution were taken every 15 min during the first hour and subsequently at intervals of 60 min until reaching 300 min.
MB concentration decrease was determined using high-performance liquid chromatography (HPLC) with a PerkinElmer® 200 series chromatograph (PerkinElmer, Shelton, CT, USA). The apparatus had a DAD200 diode array detector at 292 nm wavelength. We took 100 µL of the MB solutions using a ThermoFishier© C-18 (ThermoFishier, Waltman, MA, USA) column (150 mm × 4.6 mm, 5 µm particle size). The mobile phase was ammonium acetate (7.708 g/L with pH of 5.3) and acetonitrile (JT Baker 99.9%) with a 50:50 v:v ratio and 0.8 mL/min flow rate at 550 psi [27]. MB concentration was estimated through a calibration curve from corresponding standard solutions at 0, 2, 4, 6, 8, 10, and 12 ppm. UV–vis absorption spectroscopy was also used to monitor MB elimination, Agilent© Cary 5000 UV-VIS-NIR spectrophotometer (Agilent, Santa Clara, CA, USA).

2.3. XRD Characterization

Structural and crystalline characterization was performed with X-ray diffraction (XRD) 100 data obtained on a Bruker© D8 Discover 20 kV diffractometer (Bruker, Harvard, MA, USA) using Cu Kα radiation (λ = 1.54056 Å). The size of the crystals within the Fe3O4 NPs was calculated using the Debye–Scherrer formula (Equation (1)) [28].
D = K λ B h k l C o s θ
where D is the particle size, λ is the X-ray wavelength (nm), θ is Bragg’s angle, and B is the full peak width at half the maximum intensity (1). The broad of the (311) peak indicates that the Fe3O4 crystallite size was approximately 11 nm ± 10% nm and is nearly the same in each composite.

3. Results and Discussion

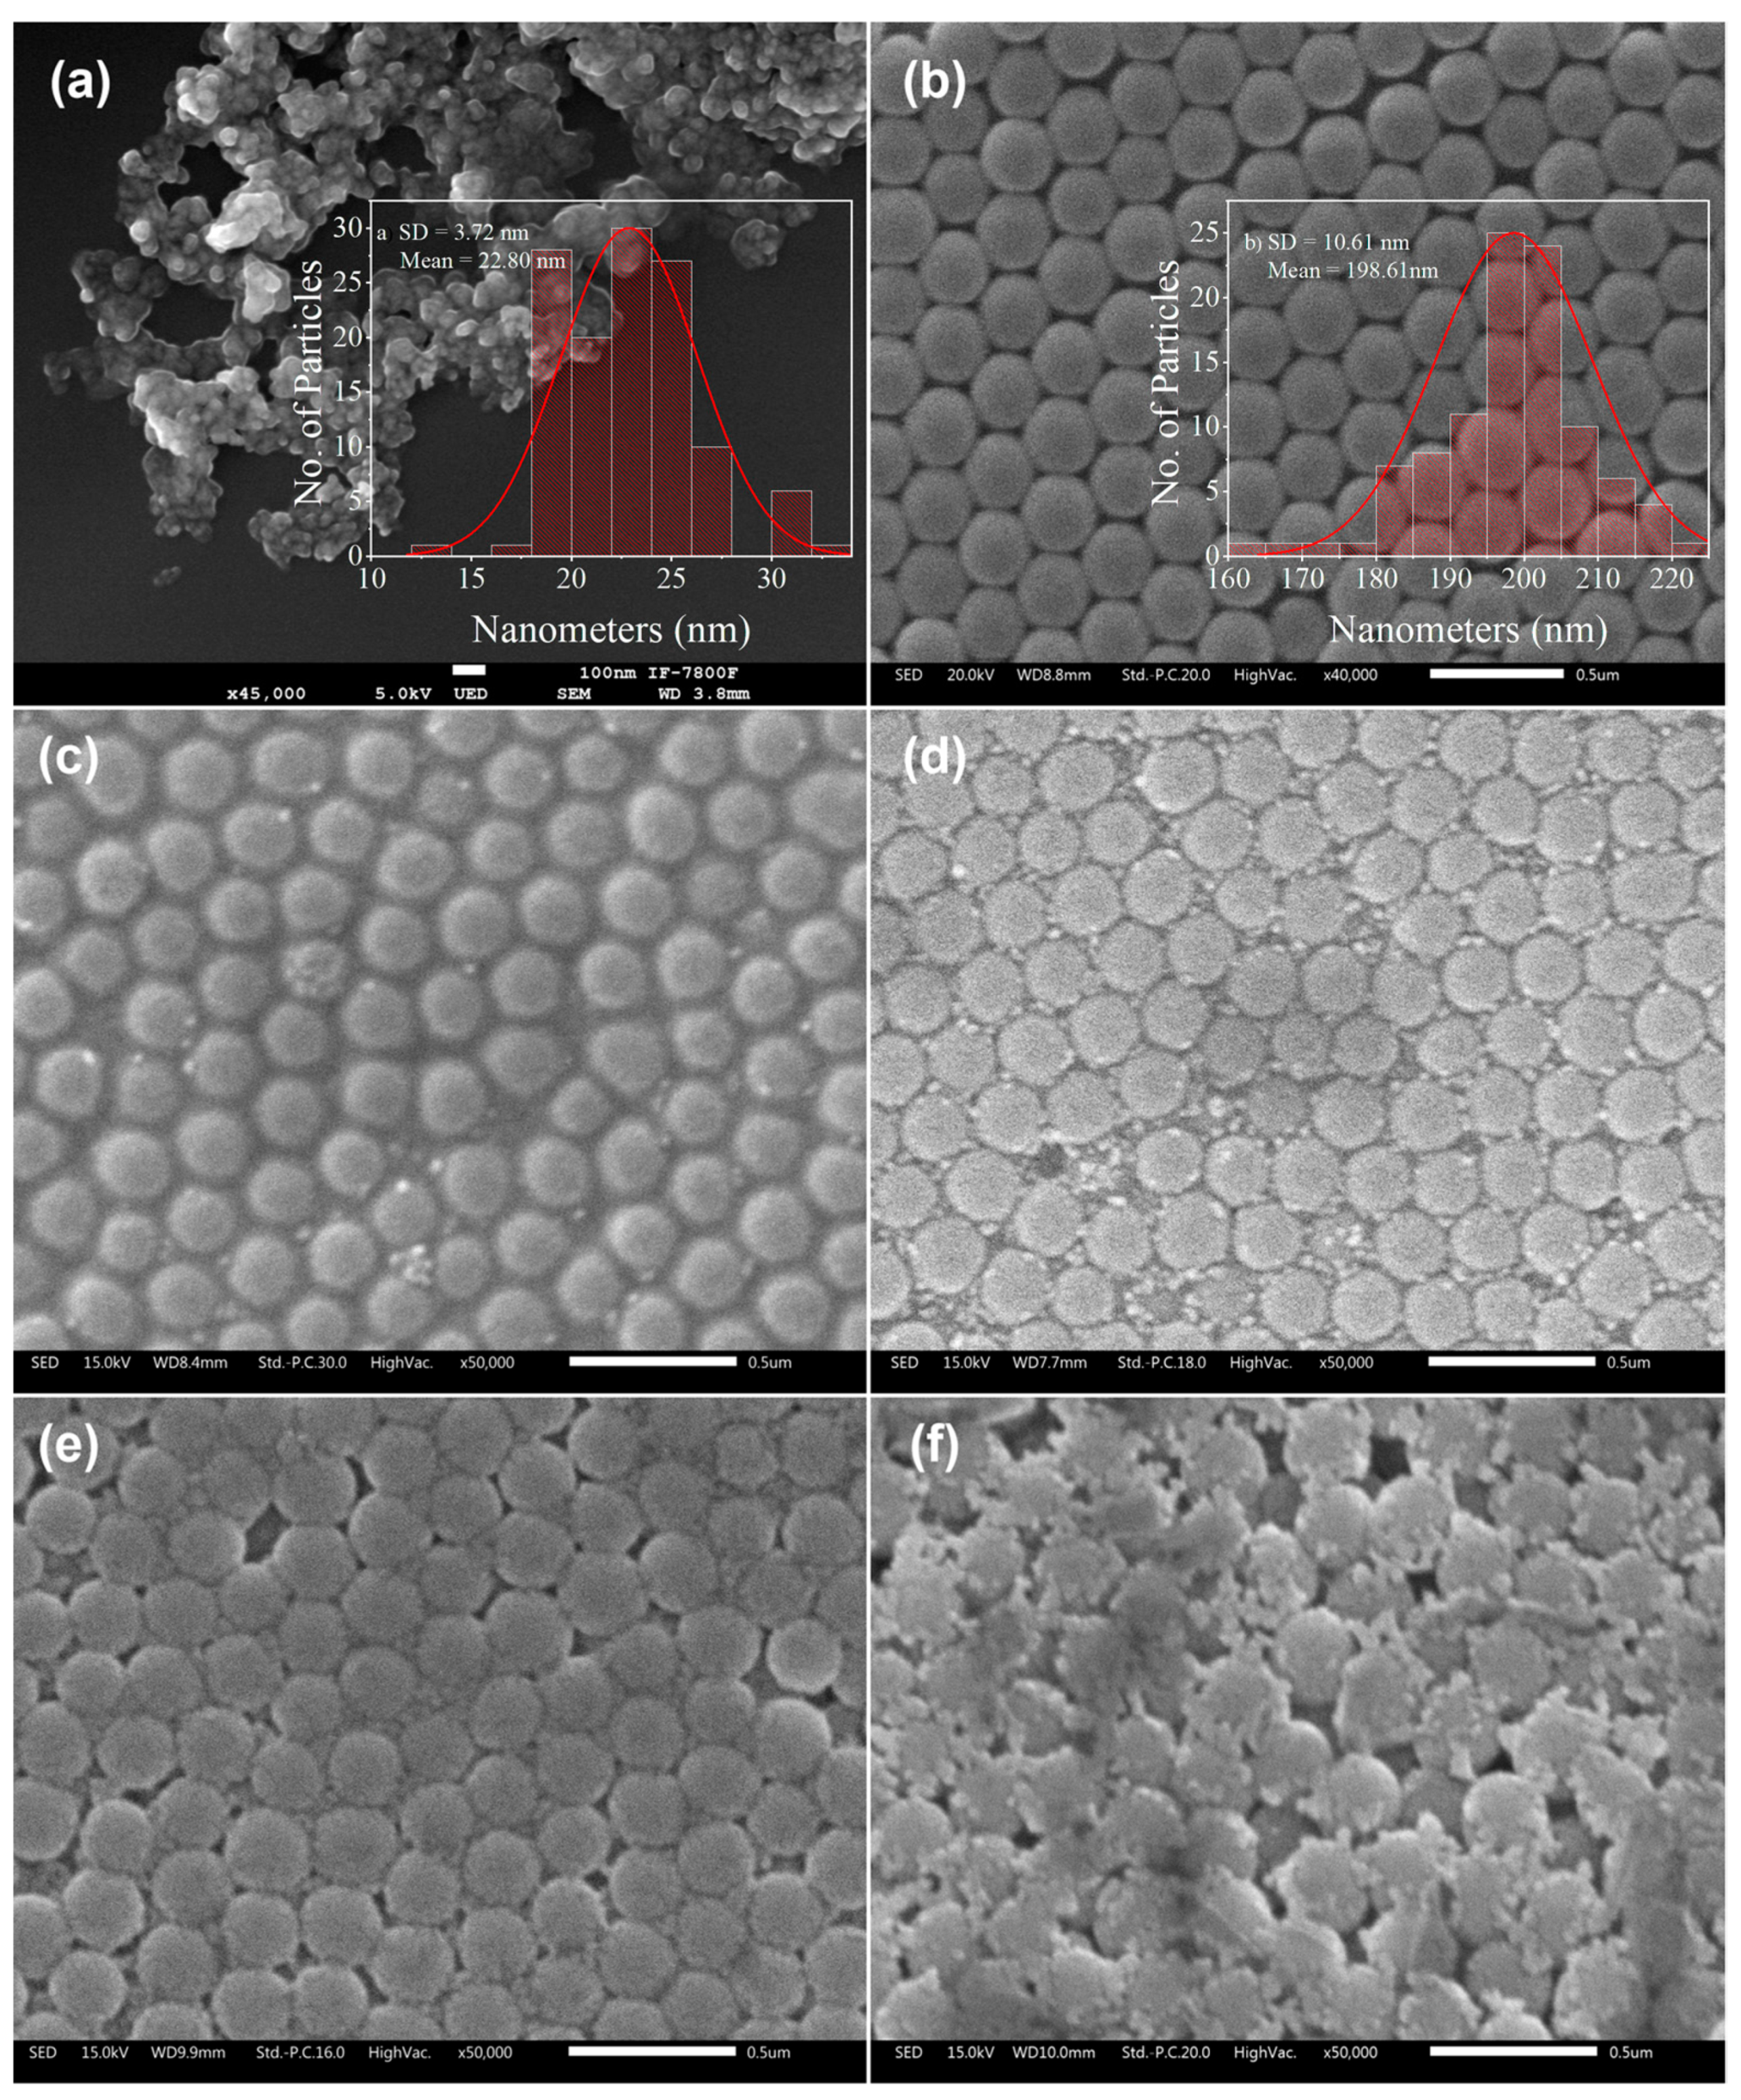
3.1. Morphologic Analysis

The morphology of the samples was analyzed with a JEOL JSM-6610LV scanning electron microscope (SEM). Fe3O4 NP particles (Figure 2a) showed aggregation due to their magnetic interaction, even in the presence of TMAOH surfactant, in complete agreement with reports by Andrade et al. [29]. The NPs have a quasi-spherical morphology and 23 nm average size (~4 nm standard deviation). Figure 2b shows the surface of an opal-like film of SiO2, and a structure similar to a Face-Centered Cubic (FCC) array can be identified. The spheres have an average diameter of 199 nm (11 nm standard deviation) with interstices of approximately 45 nm. Figure 2c does not show an evident infiltration in the composite associated with the low amount of Fe3O4 NPs. In the case of the SC3 composite (see Figure 2d), the Fe3O4 NPs were uniformly distributed in the interstices of the SiO2 opal matrix. TMAOH surfactant covered the Fe3O4 NPs, avoiding agglomerations through electrostatic repulsions, resulting in a uniform distribution of NPs among the interstitial spaces of the SiO2 spheres. For the SC4 and SC5 composites (Figure 2e,f), where the proportion of Fe3O4 NPs was higher, it can be observed how the matrix of SiO2 opal spheres is distorted. Meanwhile, Fe3O4 NPs agglomerated, forming clusters. These clusters significantly increased the distance between the centers of the SiO2 spheres. The deposited films had a 4.958 µm average thickness, which was equivalent to 16 layers of SiO2 spheres.

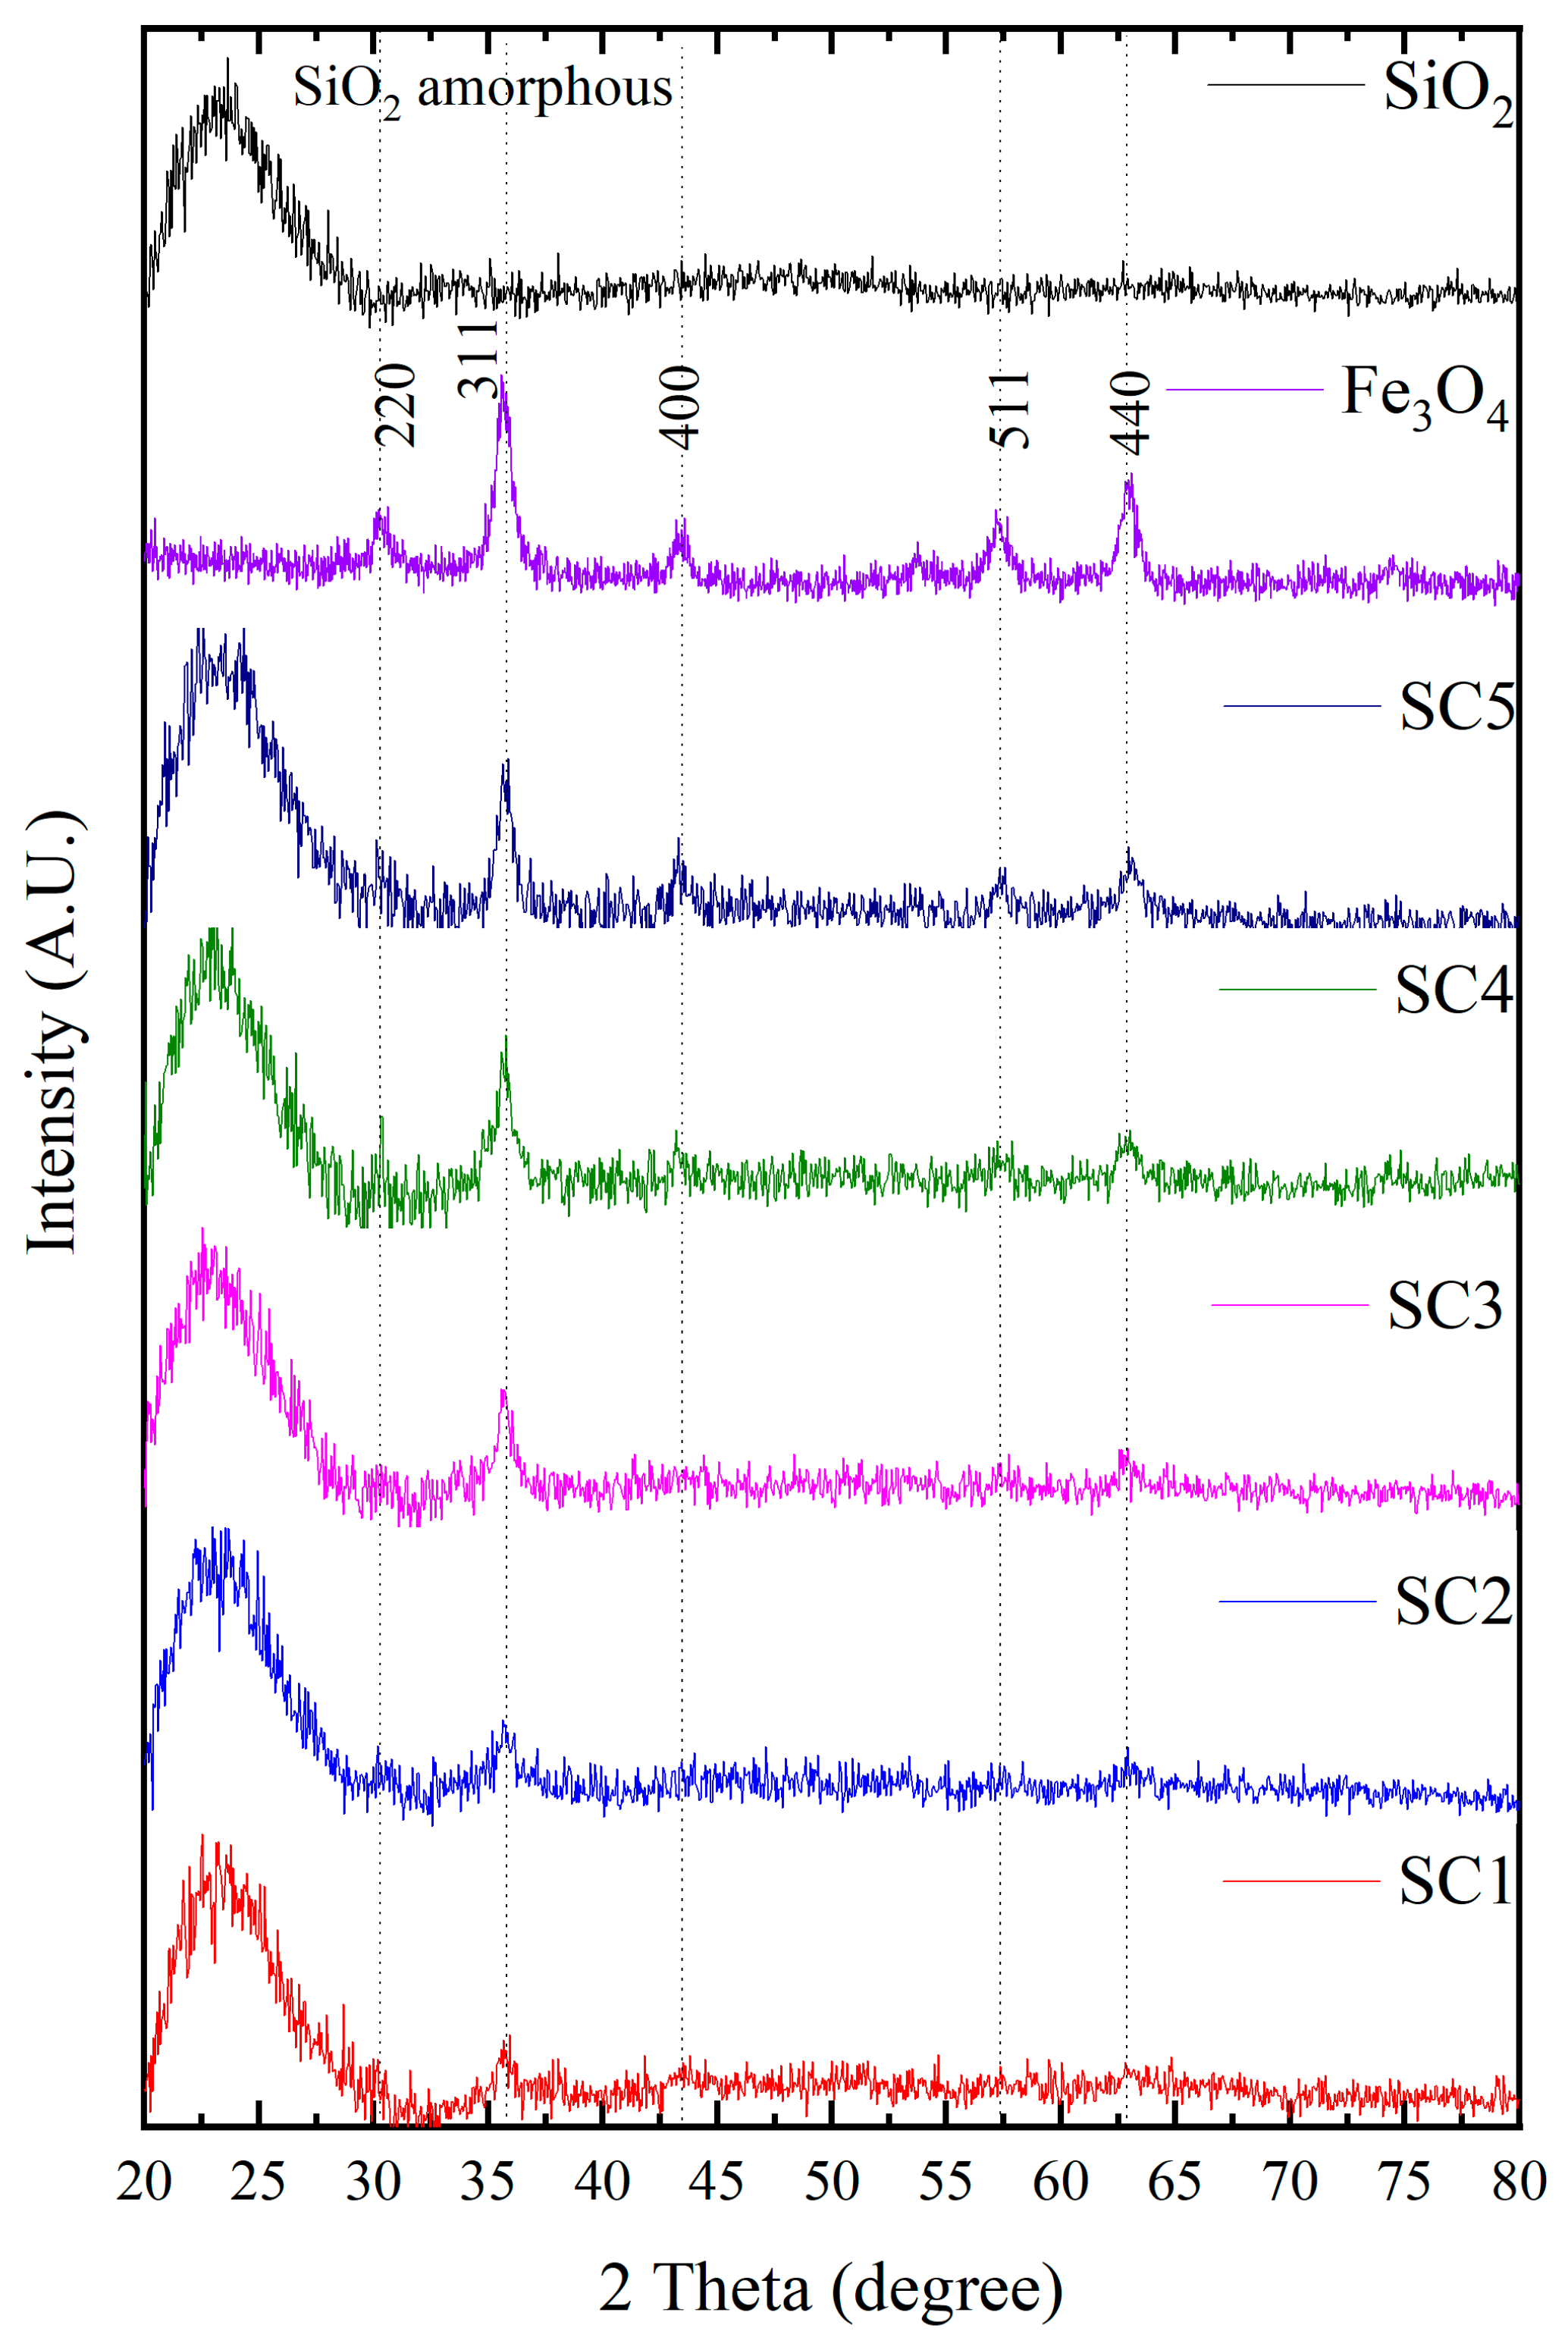
3.2. XRD Measurements

Figure 3 shows the XRD pattern for the samples studied. The SiO2 microspheres present a broad peak centered between 20° and 30°, which indicates that the SiO2 microspheres are amorphous. Usually, the products obtained through alkoxide hydrolysis are amorphous or poorly crystallized [30]. This result agrees with what has already been reported in the literature [31].
In the same way, the XRD pattern corresponding to the Fe3O4 NPs confirms their crystallinity, in addition to the Fe3O4 phase. The characteristic peaks of the Fe3O4 NPs correspond very well to the standard magnetite card (JCPDS:19-0629) [32]. The XRD patterns corresponding to the composites SC1 to SC5 confirm the increased concentration of NPs within the matrix of spheres in the SiO2 opal. This is observed in the increase in the intensity of the peaks corresponding to the Fe3O4 NPs when the concentration increases. The diffraction patterns of the composites have inherent characteristics of the patterns corresponding to the SiO2 microspheres and the Fe3O4 NPs, in addition to the fact that the interaction between the molecules caused by the infiltration process does not affect the positions and shapes of the peaks in comparison with the SiO2 and pure Fe3O4, as in the results presented by Ranfang Zuo et al. [33].

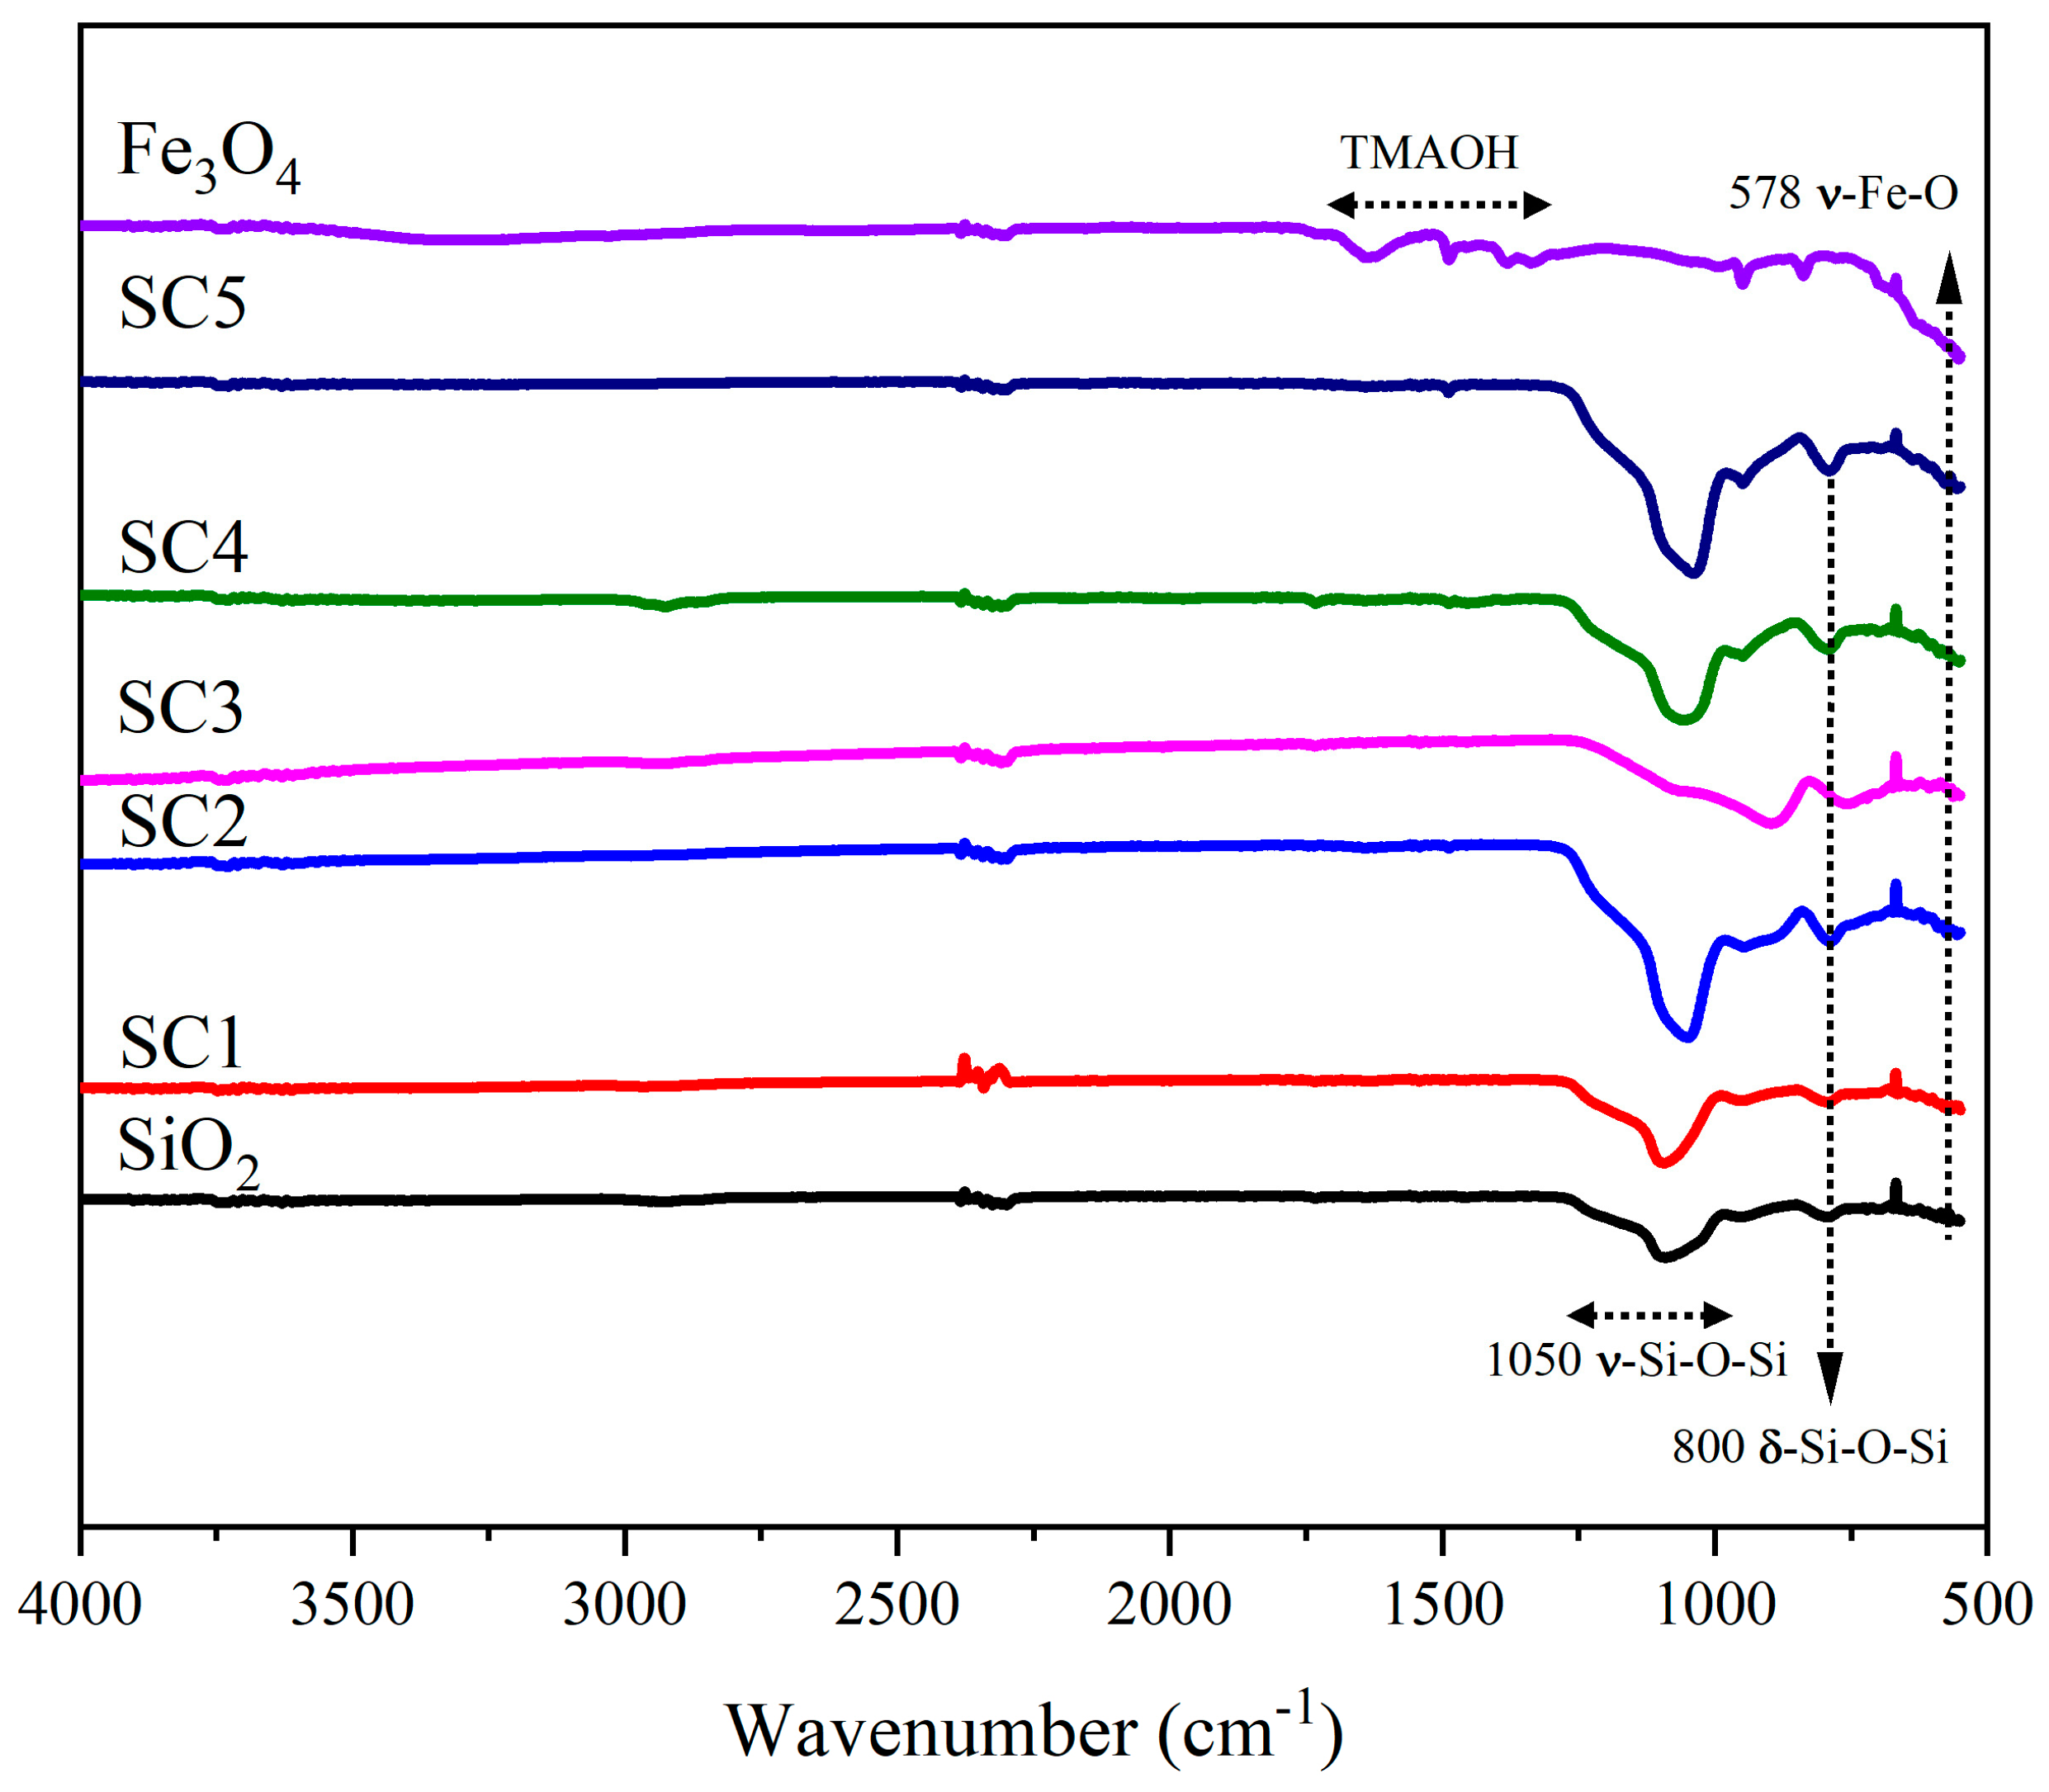
3.3. FTIR Measurements

All the samples showed flat-line FTIR spectra beyond 1800 cm−1 and an apparent absence of C-H bonds (Figure 4), confirming their inorganic nature. Infrared bands for inorganic materials are generally broader, fewer in number, and appear at lower wavenumbers than those observed for organics. The spectrum of the SiO2 opal film presented the typical Si-O-Si band between 1200 and 1000 cm−1. This band is intense and shows an asymmetric shape caused by overlapping two vibrational signals. The first center, around 1100 cm−1 was assigned to asymmetric stretching mode of interstitial oxygen presented in SiO2 NPs. Meanwhile, Si-O bond stretching modes were identified at 1050 cm−1. The symmetric stretch of the Si-O-Si chain was centered at 800 cm−1.
The Fe3O4 peak, centered at 1631 cm−1, was attributed to N-H groups, while methyl groups caused three absorption peaks at 1490, 1383, and 1337 cm−1. Infrared bands related to Fe-O stretching and bending vibrations should appear between 550 and 400 cm−1. Considering that the infrared spectrometer did not cover that wavenumber range, only a faint absorption band close to 500 cm−1 related to the Fe-O bonds stretching [34] was observed.
Due to silica concentration, the spectra composites (SC1 to SC5) showed more similarity to the SiO2 spheres than those corresponding to Fe3O4 NPs. All the samples showed peaks due to the Fe-O bond, whose intensity was related to Fe3O4 NP concentrations.

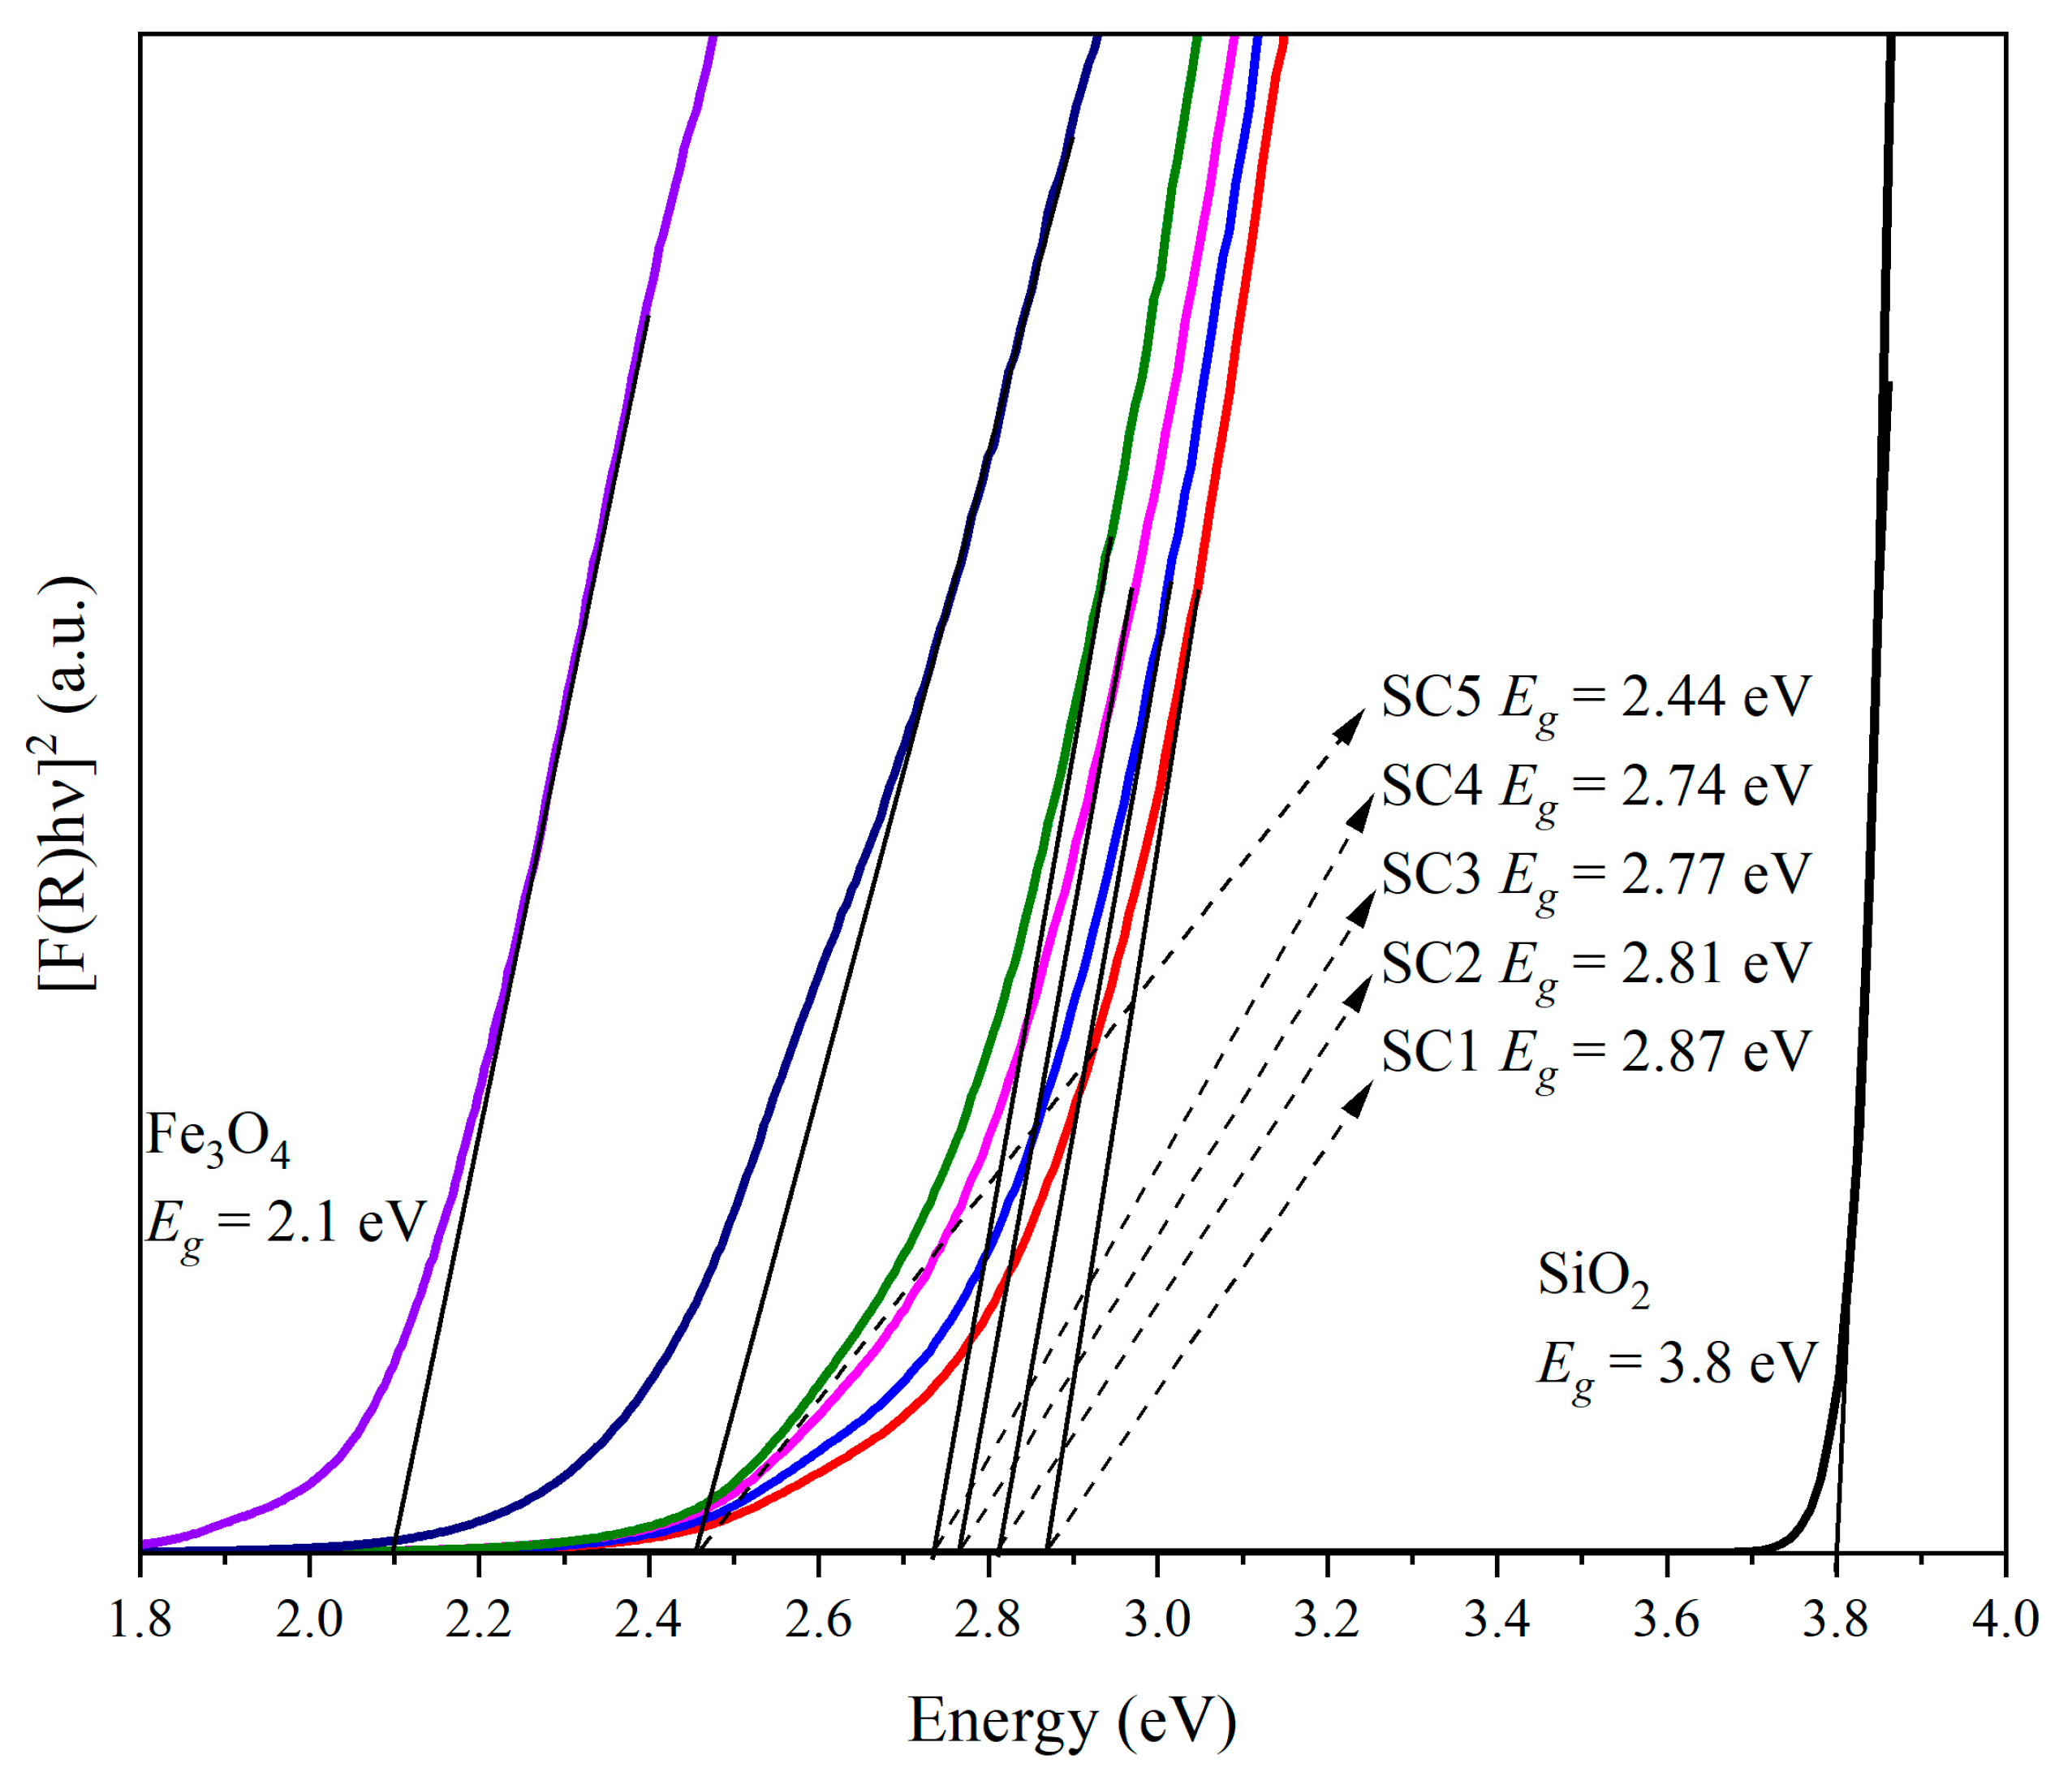
3.4. Bandgap Determination

An essential parameter for any material used as a photocatalyst is its band gap energy, Eg. The value of the bandgap Eg is obtained by extrapolating the linear-fitted regions to [F(R) hν]2 = 0 in a typical Tauc plot [35] (Figure 5). When the photocatalyst is exposed to light, if electromagnetic radiation energy equals or exceeds the Eg, a surface electron-hole pair is created on its surface, producing highly reactive hydroxyl radicals. Formation of these radicals is crucial in degrading organic dyes due to their high reduction–oxidation potential. If the band gap is small, less energy could be required to excite an electron from the valence band into the conduction one.
The Eg values obtained for SiO2 opal and Fe3O4 samples were 3.8 and 2.1 eV, which agree with previously reported values [24,36]. Considering that materials of Eg higher than 3.09 require UV light to be excited, the SiO2 opal could not act as a photocatalyst under visible light. On the other hand, Fe3O4 NPs could be efficiently excited. As the Fe3O4 NPs are infiltrated into the opal matrix, the Eg is redshifted by the surface and interface effects on the band edge absorption [37,38], allowing the composite to be sensitive to visible light.

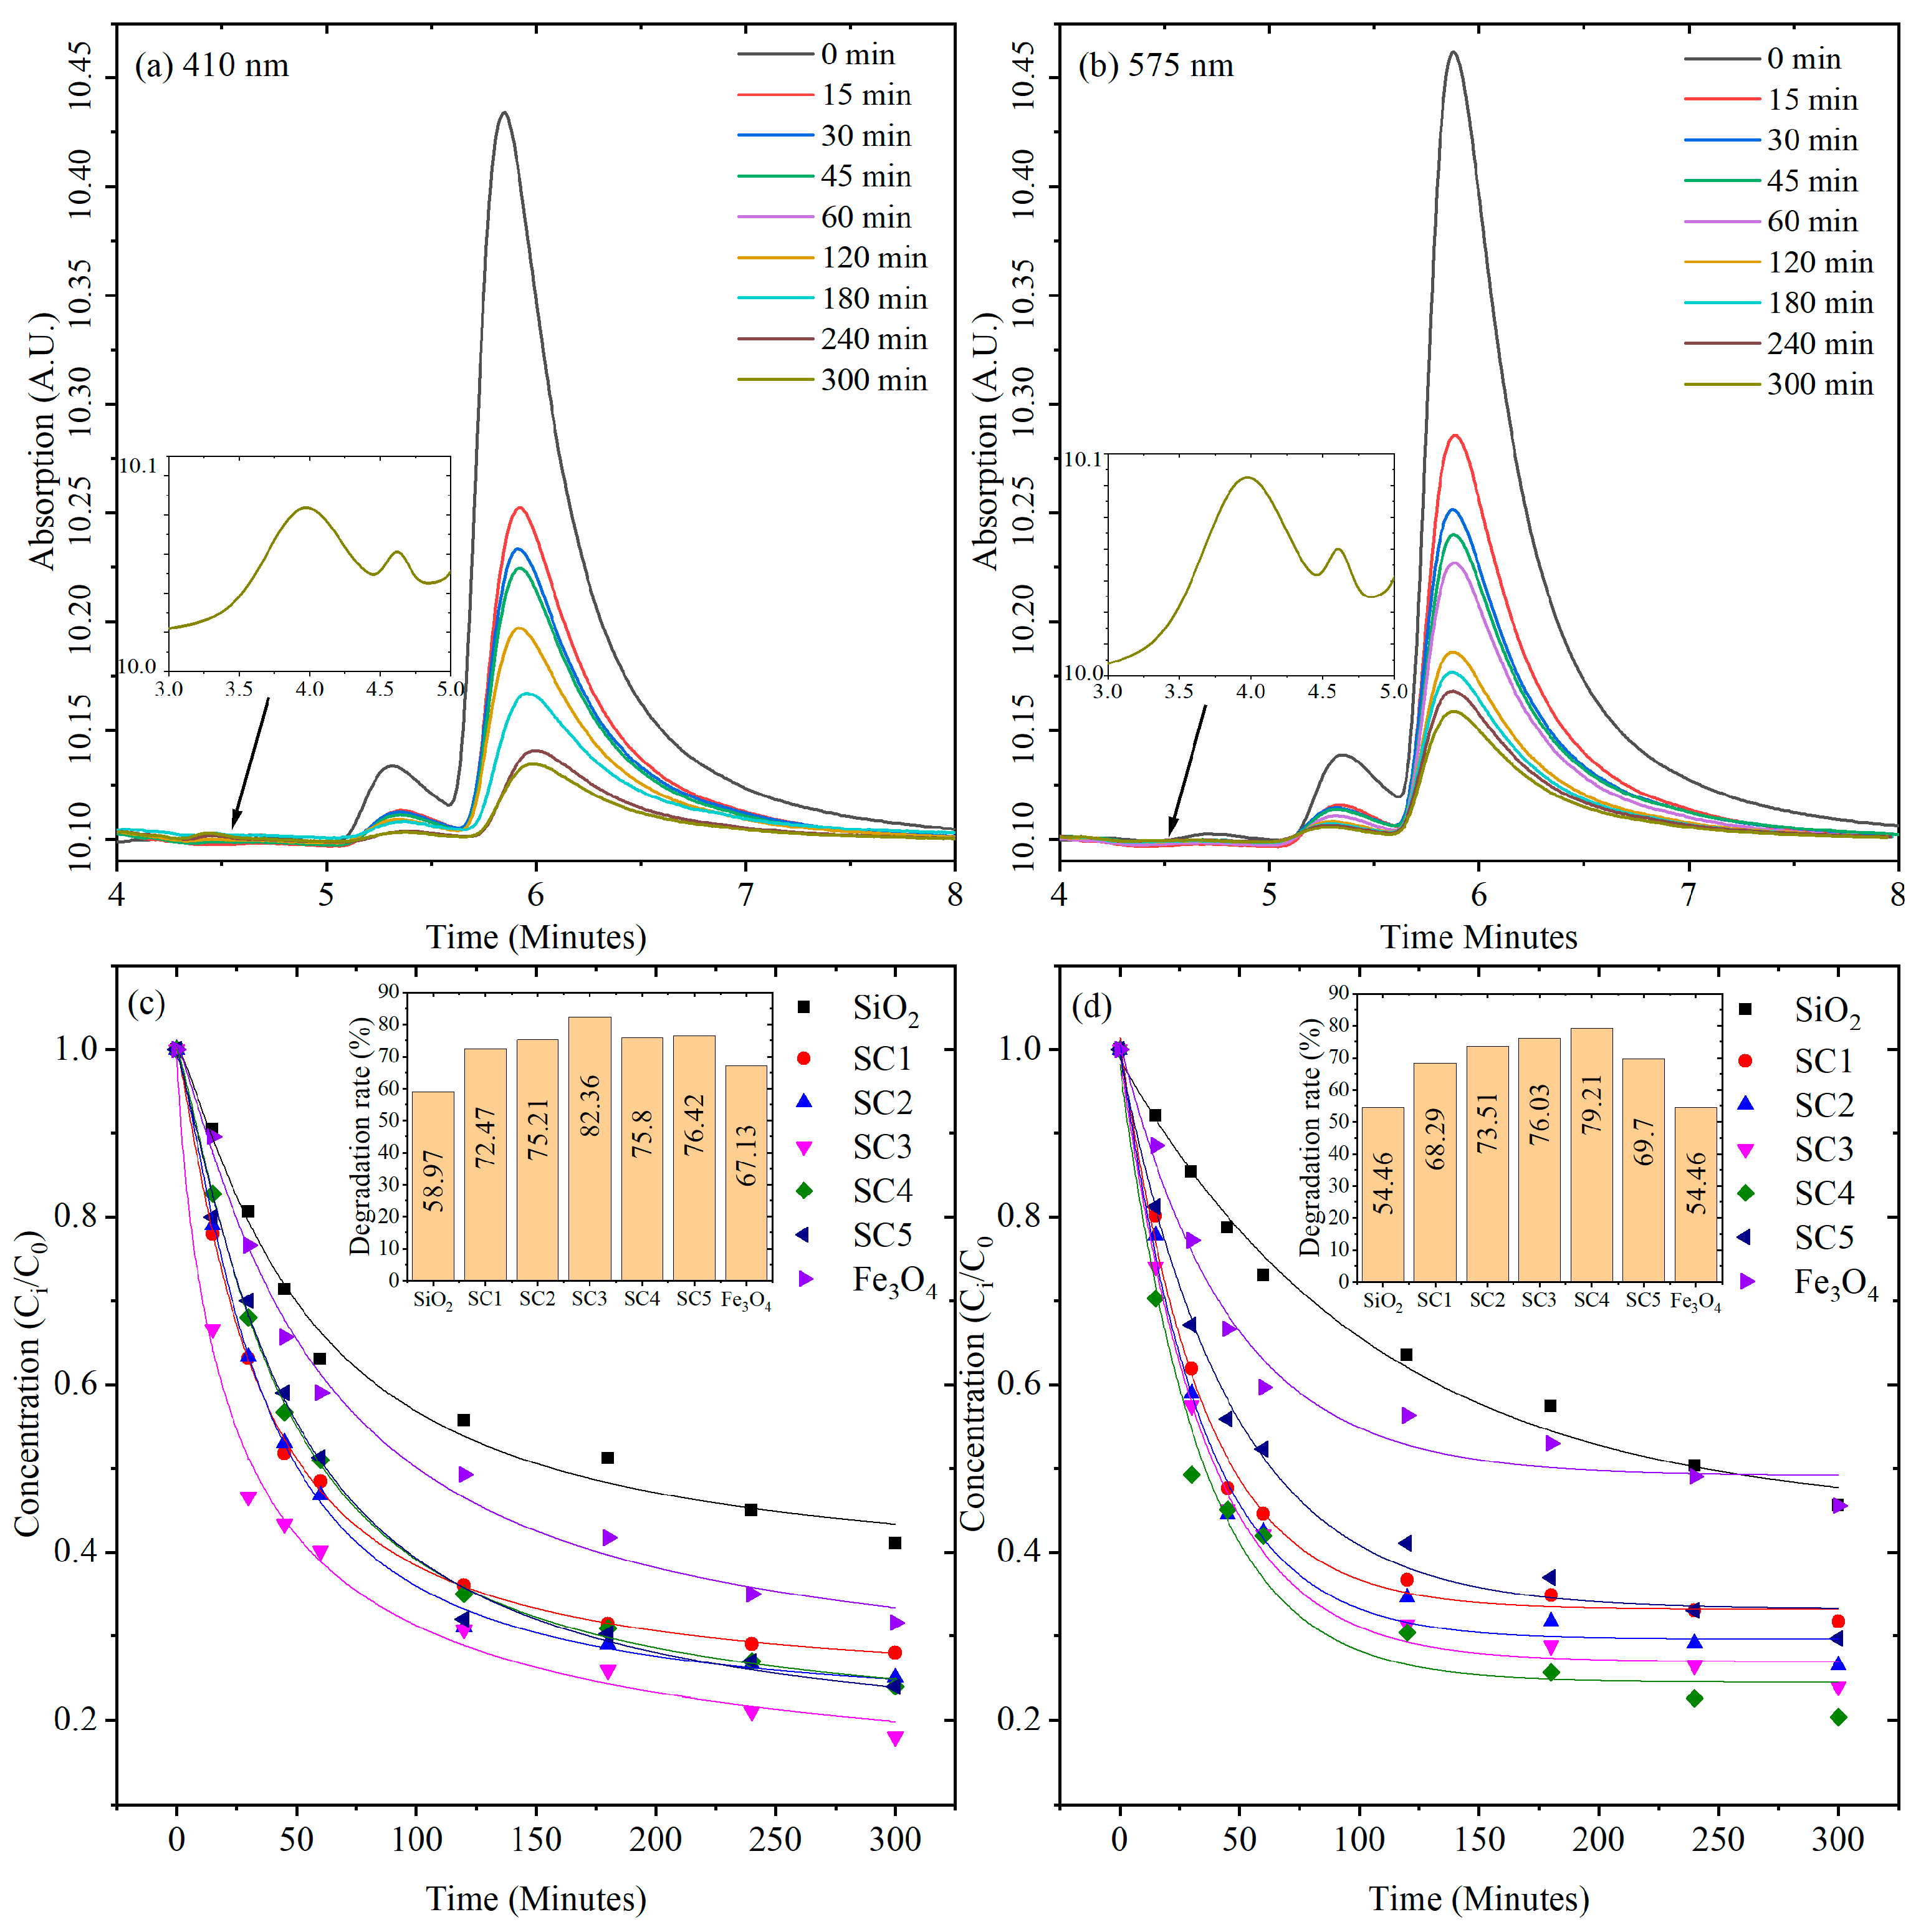
3.5. Photocatalytic Activity under Limited O2

All measurements were performed under a limited oxygen supply to subject the composites to the harshest reaction regime, where the general reaction rate could be dictated with dye adsorption on the catalyst surface. The only oxidant came from dissolved oxygen within the liquid; additional oxygen could only be provided by transfer across the surface of the reaction [34]. Photocatalytic degradation of MB could occur under these conditions at reaction rates comparable to those under oxygen-rich conditions [39].
Maximum MB absorption (centered at 664 nm) decreased with increasing time under illumination in the presence of the SiO2, Fe3O4 NPs, and the different opal–magnetite composites. The MB remotion was also monitored using HPLC, where the peak corresponding to MB appeared at 5.75 min retention time (Figure 6 and Figure 7). According to Beer’s law, the MB peak in the chromatograms decreased its area as the irradiation time increased [40]. Only diminished peak intensity was observed in all experiments, and without any shift toward high or low wavelengths. The insets in Figure 6c,d and Figure 7c,d show the degradation rate of MB in each photocatalyst.
SiO2 required more energy to be considered photocatalyst-sensitive at both tested irradiation wavelengths. Then, the corresponding degradation was caused only by surface adsorption. Conversely, Fe3O4 NPs are photo-catalytically active. Hence, MB results from a combination of adsorption and chemical degradation caused by reactive hydroxyl radicals [41]. Composites SC1 to SC5 should be only photocatalytic active under visible light at λ = 410 nm (3.02 eV). Interestingly, Fe3O4 NPs reached inefficient degradation, suggesting that the appropriate nanoparticles distribution on the thin films allowed higher MB remotion.
On the other hand, when the aqueous MB solutions were exposed to light at λ = 575 nm (2.15 eV), the maximum MB absorption decreased at a longer reaction time but with minor efficiency than at λ = 410 nm. This suggests adsorption and chemical degradation, because the composites still removed more MB than their bare SiO2 opal or Fe3O4 NPs, pointing out that the shorter wavelengths emitted by the non-monochromatic LED light may be causing the observed photocatalytic activity.
UV-vis UV–vis absorption of the MB as a function of irradiation time and HPLC chromatograms in the presence of these composite samples are shown in Figure 6 and Figure 7, at 410 and 575 nm, respectively. The best reduction in MB elimination at λ = 410 nm and at λ = 575 nm was observed for catalysts SC3 and SC4, respectively.
According to N. Martin et al. [42]., the small peak present in the chromatograms of Figure 7a,b can be attributed to Azure B, an oxidation product of MB. Thus, we can confirm the presence of Azure B and MB in solution by controlling the area of the first and second peak in the chromatogram, respectively. We can observe in the insets of Figure 7a,b the presence of Azures A and C, but these MB by-products only start to appear around 300 min of the reaction time. Although detected in HPLC analysis, Azure A, B, and C are not visible in the UV–vis measurements (Figure 6a,b). This is because their absorption wavelength maxima (650, 644 and 604 nm, respectively, for Azure A, B and C) are very close to that of MB (664 nm). On the other hand, their concentrations in solution, as shown by the area of the peaks in the chromatogram, are lower than those of MB (Figure 7a,b). Thus, their absorption peaks in the UV–vis spectra are hidden in the absorption peak of MB, which explains why they cannot be seen.
The following section is a discussion of the degradation rates shown in the inserts of Figure 6 and Figure 7. Samples SC3 and SC4 achieved the best degradation rates. For a wavelength of 410 nm, the degradation rate values were 72.26% and 82.36% using UV-vis UV–vis absorption spectroscopy and HPLC, respectively. On the contrary, for a wavelength of 575 nm, the degradation rate values were 65.13% and 79.21% using UV–vis absorption spectroscopy and HPLC, respectively. To obtain a degradation rate higher than 99%, the process should be continued for 15.5 h and 19.4 h for 410 nm and 575 nm wavelengths, respectively. However, a similar degradation rate can be achieved in 2 h by using UV light [42]. Thus, sunlight should vary the degradation time between 2 and 20 h.
By comparing the degradation rate curve obtained through UV-vis UV–vis measurements and the one received through HPLC analysis, it is evident that the degradation rate measured through UV–vis is lower than that measured through HPLC. However, both curves should intersect at some point beyond 300 min of degradation. As the HPLC measurement is more precise [42], it can be assumed that the UV-vis measurement underestimates the degradation rate in the initial stages of the reaction.
Finally, the dangerous chronic exposure threshold of MB is 5 mg/kg of corporal [42] mass every day for two years for rats. As the mean body mass of adults in the world is 62 kg, assuming an adult intakes 1.5 L of contaminated water with MB, then 5 mg/kg × 62 kg/1.5 L = 206.6 mg/L or 206.6 ppm is the exposure concentration threshold of MB for adults if they drank 1.5 L of it every day for two years. If we use the lower degradation rate we found here of 65.13% at 5 h, then 317.2 ppm is the maximum MB concentration in water that can be used to attain the safe threshold with our scheme. Higher concentrations can be treated if we wait more than 5 h.

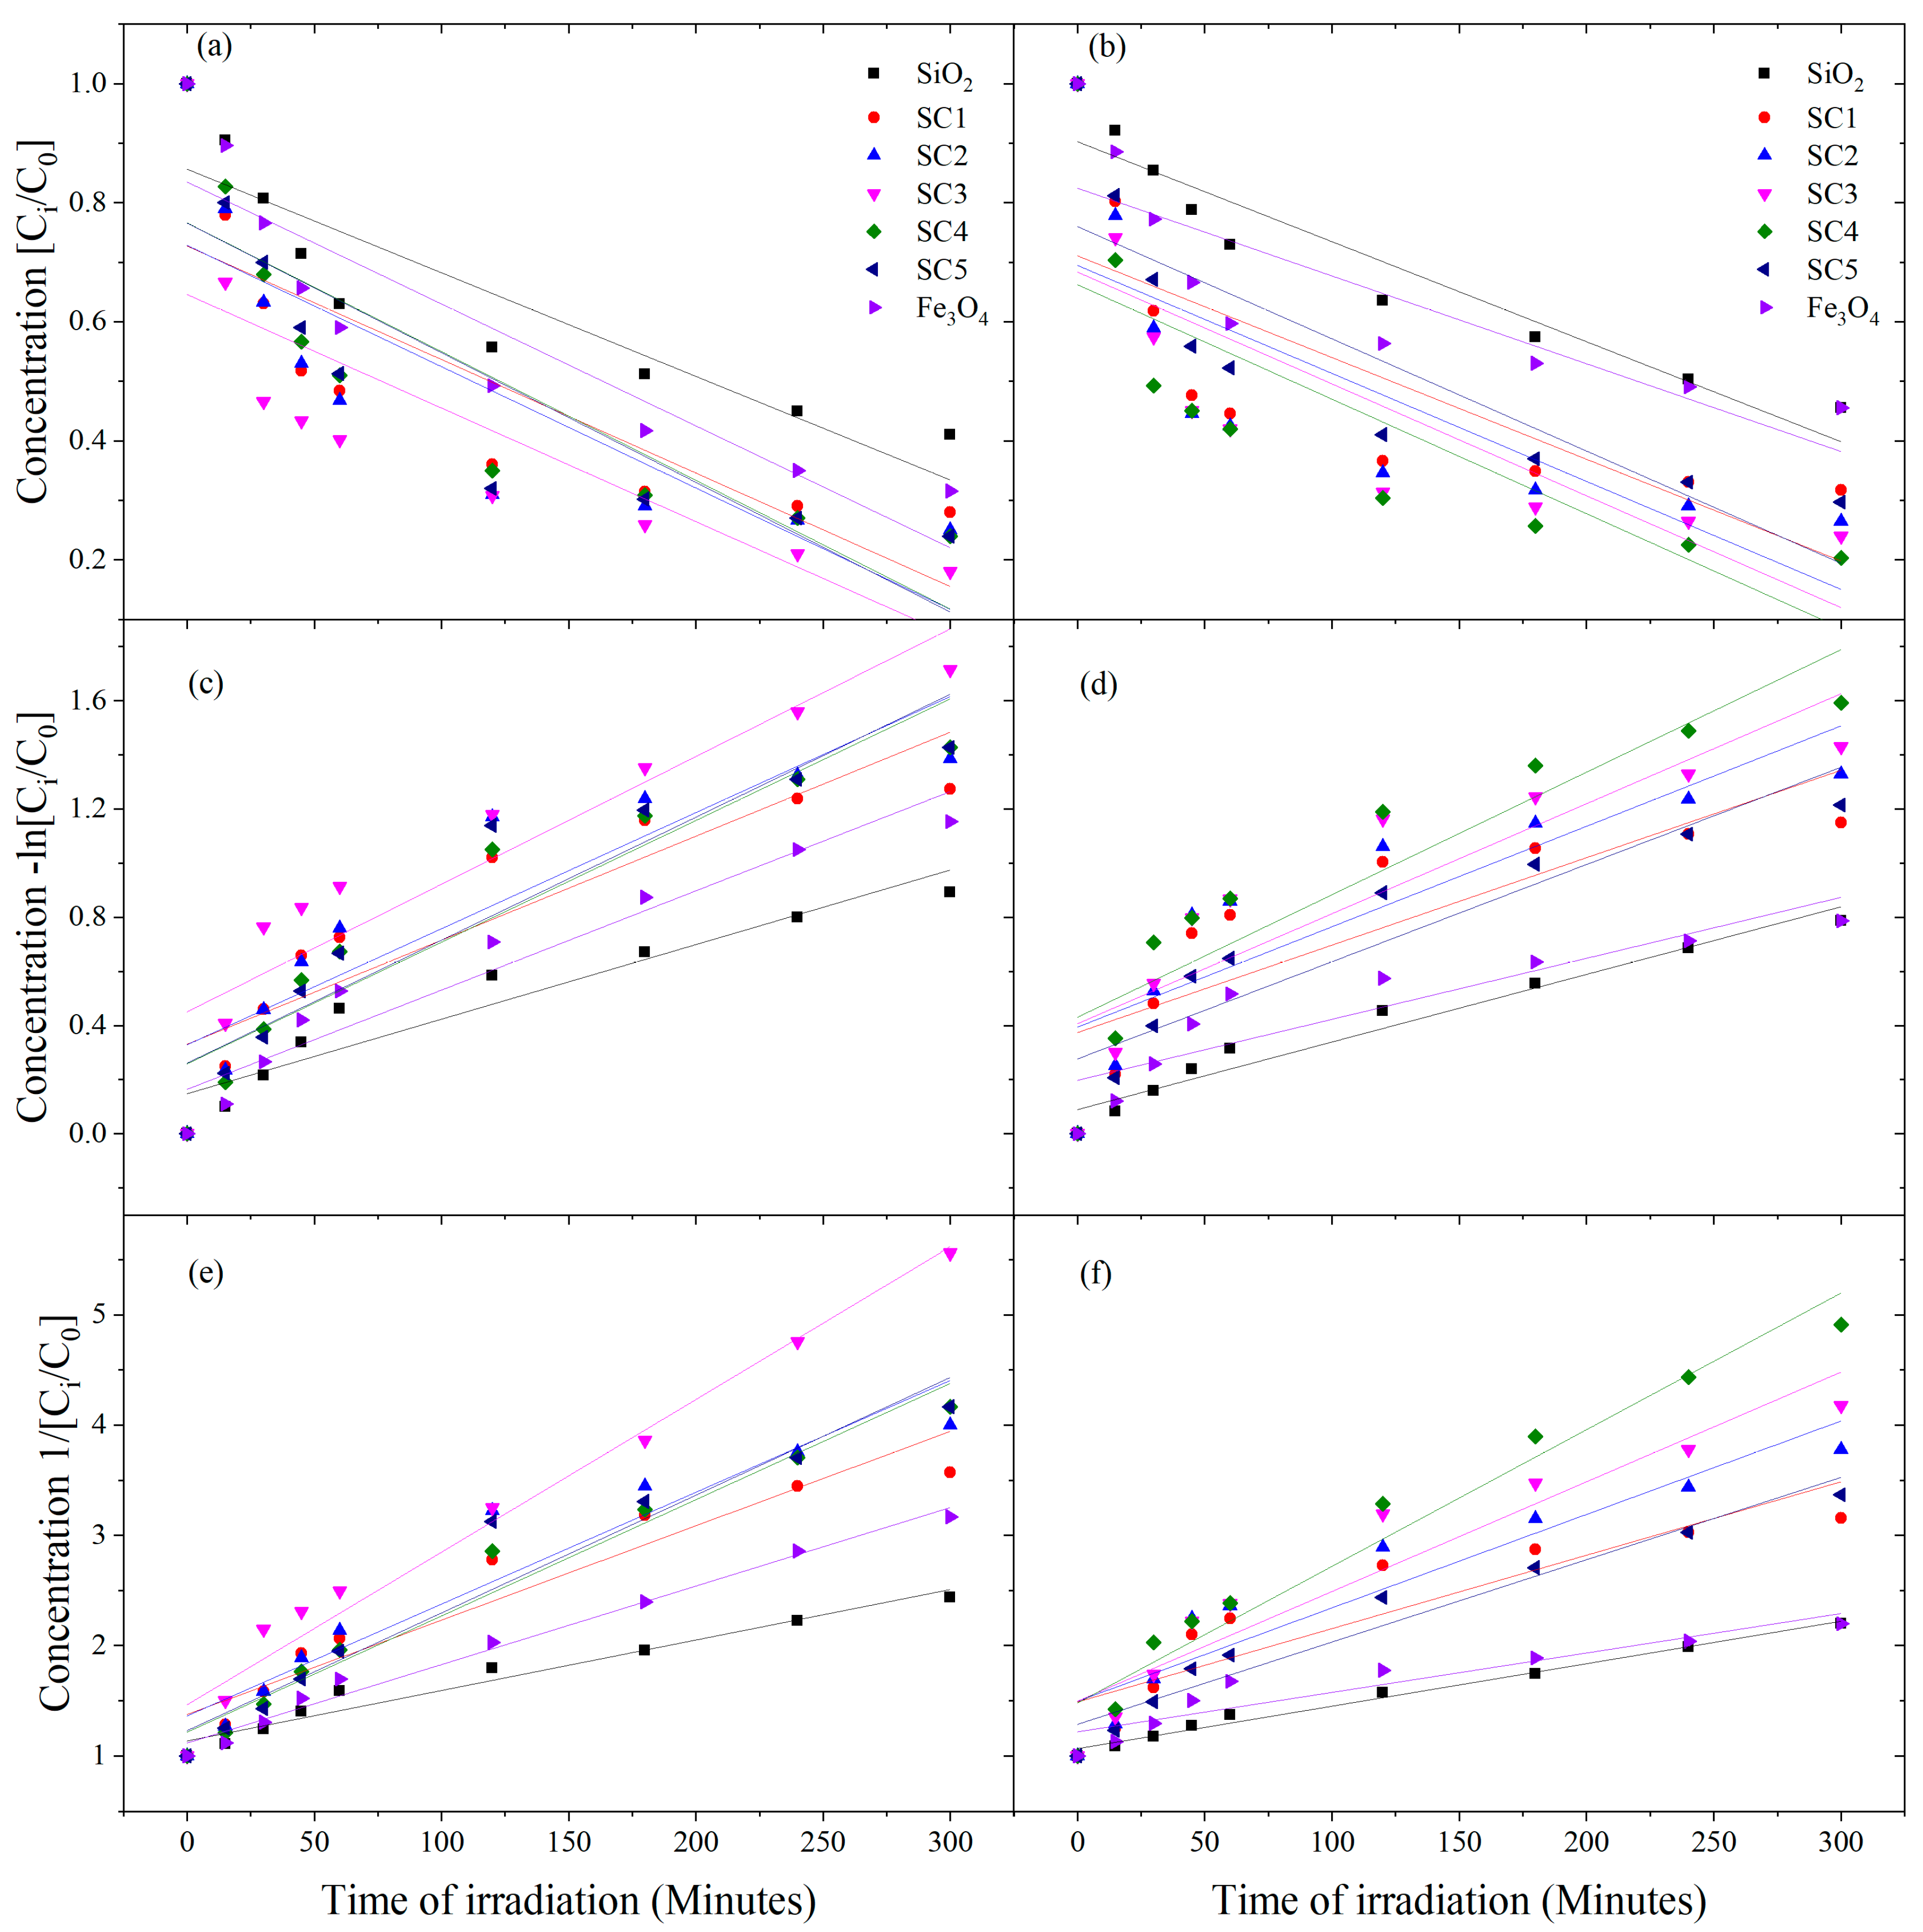
3.6. Kinetic Model Analysis

Kinetic parameters were calculated to suggest the possible mechanisms in the removal process. Based on the experimental data, the best approximation was determined by using the correlation factor R2 of the linear fit of the kinetic models. The most used models are the zero order, the Lagergren pseudo-first-order (PFO) [43], and Ho and Mckay [44] pseudo-second-order (PSO). Figure 8 shows the modeled results of MB degradation on SiO2 opal, Fe3O4 NPs, and opal–magnetite composites (SC1 to SC5) under visible range illumination at λ = 410 and λ = 575 nm.
Table 2 shows that all the composite samples followed the PSO model based on the assumption that the rate-limiting step was chemisorption [45]. Ionic pollutant-charged catalyst surface and ion exchange could also be the primary pathways for reactant adsorption. Thus, those results described photocatalytic remotion by ionic exchange and chemisorption process [46,47].
Table 2 [C0] represents the reactant concentration (MB, ppm) of the reactant at time t = 0; meanwhile, [C] stands for MB concentration at time t. Kinetic constants (k1, k2, and k3) for each kinetic model were determined. For instance, for the pseudo-first-order kinetic model, and from the slope of linear regression plot of −ln[C/C0] versus reaction time corresponding to first-order apparent kinetic constant k was estimated [48,49,50,51].
The catalytic activity of the composites SC1–SC5 was attributed to the synergistic effects between SiO2 opal and Fe3O4 NPs [40,52]. Considering the calculated bandgap energy values, the bare SiO2 opal film did not show a photocatalytic effect even though 59% of MB was eliminated at λ = 410 nm. When bare Fe3O4 NPs were illuminated, the LED radiation provided enough energy to generate an e/h+ pair and subsequently form reactive hydroxyl radicals responsible for attacking the dye near the Fe3O4 NP’s surface. However, the Fe3O4 NPs did not achieve complete degradation of the MB (~67% at λ = 410 nm).
According to the SiO2 spheres synthesis method, the concentration of OH groups on its surface is approximately 2–5 × 10¹⁸ OH/m2. This value was almost independent of the synthesis conditions of the SiO2 spheres [53]. The surface OH groups were silanols of the SiO2 domains (Si-OH). MB, as cations, could be easily absorbed by the negatively charged surface of the SiO2 spheres [36,54,55]. That adsorption mechanism has been reported by Zhang et al. [39] and is illustrated in reactions (2) and (3):
- S i O H + O H - - S i O - + H 2 O
- S i O - + M B + - S i - O - M B
In aqueous solutions, hydroxyl moieties (-OH2+, -OH, and -O) are formed on the surface of oxides like the Fe3O4 NPs [56], causing electrostatic interactions between the MB and the charged surface and ion exchange. The hydroxyl groups are formed by dissociative chemisorption of water molecules on the surface of the metal oxide samples [56]. Considering the calculated band gap, e h+ pairs can be generated when the particles are exposed to light. Then, the h+-positive holes react with adsorbed water, producing a hydroxide radical (•OH) and a proton (H+) at the surface of Fe3O4. Simultaneously, an excited e could be oxidated by an oxygen molecule to form superoxide anion radicals (•O2), which, by protonation, could produce a hydroperoxyl radical (•HO2), as is shown by Taheri-Ledari et al. [57] and Mohd Imran et al. [41]. This radical could be easily combined with trapped electrons to form hydrogen peroxide (H2O2) and be degraded into two hydroxides (•OH) [58]. Nevertheless, because the amount of Fe3O4 NPs is much lower than the SiO2 spheres, the amount of hydroxyl moieties could not increase enough, and the MB’s remotion was not significantly improved.
Composites SC1 to SC5 showed bandgap energy values ranging from 2.87 to 2.44 eV, respectively, and reached higher MB remotion, although they required more energy to generate an e/h+ pair than the bare Fe3O4 NPs. The SiO2 opal matrix could contribute to adsorbing MB, while the Fe3O4 NPs could adsorb and degrade the dye. Fe3O4 NPs under an aqueous medium experience high aggregation due to their magnetic interaction (Figure 2a), collectively decreasing the active surface area and reducing the chemical reactivity [59,60]. However, the occupation of Fe3O4 NPs in the interstitial sites of sample SC3, as depicted in Figure 2d, provided a homogeneous distribution, preventing irreversible agglomeration of NPs [61,62] and then increasing the adsorption capacity [63] while MB was continually degraded. This result was similar to that reported by Carvalho et al. [64], who pointed out that the decisive factor for photocatalytic activity was the number of active centers and not necessarily the surface area of the particles. In the case of composites with a higher concentration of NPs, the efficiency decreased since the opal network could no longer disperse them uniformly, thus forming the NP clusters that resulted in a diminished active surface area (Figure 2f).
Describing the MB remotion rate versus the reaction time was also crucial. After 60 min of reaction, the SiO2 spheres had adsorbed ~40% of the dye, whereas, after 300 min, they had only eliminated ~50% of MB, which suggested surface saturation. The initial high degradation rate was probably due to the abundance of available surface active sites on the SiO2 spheres. The bare Fe3O4 NPs offered similar results caused by surface saturation. However, in the case of the composites, the decreased remotion rate could be produced by a combination of surface saturation and a high extent of MB degradation. A film array could improve the MB remotion rate and efficiency proportional to the number of films present.

4. Conclusions

In this study, we investigated the photocatalytic activity of SiO2 opals-Fe3O4 composites for the degradation of methylene blue (MB) under visible light irradiation. The results demonstrate the potential of these hybrid colloidal crystals as efficient photocatalysts for water purification applications. Several key findings and limitations of the study warrant discussion.
The synthesis and characterization of SiO2 opals-Fe3O4 composites revealed that sample SC3 has a well-dispersed distribution of Fe3O4 nanoparticles within the interstitial spaces of SiO2 opal spheres.
XRD corroborates that the peak located at direction 311 shows the presence of Magnetite, as previously reported [24].
The study of the photocatalytic properties of the composites also showed that MB degradation is possible with visible light-reduced oxygen medium. The optimized composite, SC3, exhibited the highest MB elimination at λ = 410 nm, while SC4 showed superior performance at λ = 575 nm. The composite films showed a bandgap energy range of 2.44 to 2.87 eV, enabling visible light photocatalytic activity. This result shows the tunability of our approach. The combination of systems incorporating opals and advanced NP infiltration techniques provided new approaches to using solar energy, the most abundant and safest energy source, in dye elimination processes.
The photocatalytic degradation of MB on the SiO2 opals-Fe3O4 composites followed a pseudo-second-order kinetic model, indicative of chemisorption and ionic exchange between the catalyst surface and MB molecules. The composites’ enhanced photocatalytic activity is attributed to the synergistic effects of SiO2 opal and Fe3O4 nanoparticles, which offered a higher number of active catalytic sites and increased adsorption capacity compared to bare Fe3O4 nanoparticles.
Furthermore, an interaction mechanism was proposed to explain MB elimination in an aqueous solution. The composite film had many active sites (negative charge) that increased the adsorption capacity. The ionic exchange occurred between H+ of the oxygen-containing functional groups and the MB cations on Fe3O4 NPs, followed by continuous adsorption of MB ions by other remaining surface charges on the films (SiO2 spheres) [65].
However, it is important to recognize certain limitations in our study. First, we focused solely on the photocatalytic degradation of methylene blue and did not explore the effect of other environmental parameters, such as pH and temperature, on the catalytic performance. Future research should address these parameters to better understand the composites’ behavior under varying conditions.
Furthermore, while the composites showed promising results for MB degradation, generalizing these findings to other dye pollutants or contaminants requires caution. The efficiency of the composites may vary depending on the specific chemical and physical properties of different pollutants.
Moreover, the practical implementation of SiO2 opals-Fe3O4 composites in large-scale water purification systems warrants further consideration. The stability, reusability, and scalability of the catalysts need to be thoroughly investigated to assess their viability for real-world applications.
Our scheme presents a trade-off: the higher the wavelength we use, the longer it takes to degrade the MB from the water. Since a degradation rate higher than 99% can be achieved in 2 h using UV light, and sunlight contains wavelengths from UV to IR, the degradation time should vary between 2 and 20 h.
Finally, the environmental and health implications of using nanomaterials for water purification are of paramount importance. Long-term studies on the potential release of nanoparticles into water sources and their impact on human health and the ecosystem are necessary for safe and sustainable implementation.
Despite these limitations, the SiO2 opals-Fe3O4 composites present an exciting avenue for advanced water purification technologies. The combination of nanostructured materials with photocatalytic properties opens up new possibilities for sustainable and efficient water treatment processes. As we move towards a cleaner and safer water supply, the integration of SiO2 opals-Fe3O4 composites as recovered photocatalysts could prove instrumental in addressing the challenges posed by organic dye pollution.
In conclusion, this study highlights the potential of SiO2 opals-Fe3O4 composites as promising photocatalysts for water purification applications. Further research, addressing the mentioned limitations and environmental concerns, will propel us closer to developing innovative and sustainable solutions for cleaner water resources.

Author Contributions

Conceptualization, A.J.C.-C., E.S.M., J.I.P.F., M.D.C.-A., M.A.G.-R., K.M., J.E.L., and M.T.-S.; methodology, A.J.C.-C., E.S.M., J.I.P.F., M.D.C.-A., M.A.G.-R., K.M., J.E.L., and M.T.-S.; formal analysis, A.J.C.-C., J.I.P.F., C.M.-B., M.A.G.-R., M.C.B., K.M., J.E.L., and M.T.-S.; investigation, A.J.C.-C., J.I.P.F., C.M.-B., M.A.G.-R., K.M., J.E.L., and M.T.-S.; resources, A.J.C.-C., J.I.P.F., C.M.-B., M.A.G.-R., M.C.B., K.M., J.E.L., and M.T.-S.; writing—original draft preparation, A.J.C.-C., J.I.P.F., C.M.-B., M.A.G.-R., M.C.B., K.M., J.E.L., and M.T.-S.; writing—review and editing, A.J.C.-C., C.M.-B., M.A.G.-R., M.C.B., K.M., J.E.L., and M.T.-S.; supervision, A.J.C.-C., C.M.-B., M.A.G.-R., M.C.B., K.M., J.E.L., and M.T.-S.; project administration, J.E.L. and M.T.-S. All authors have read and agreed to the published version of the manuscript.

Funding

This work was supported by the CONAHCYT (Cátedras Project 3208) and through Grant A1-S-38743.

Data Availability Statement

All the data presented in this study are contained within the article.

Acknowledgments

The authors thank to Laboratorio Central del Instituto de Física Ing. Luis Rivera Terrazas–BUAP by FT−IR measurements. M.A. Gonzalez-Reyna would like to thank CONAHCYT for her postdoctoral scholarship in the period between October 2022–September 2023.

Conflicts of Interest

The authors declare no conflict of interest.

References

  1. Sohrabnezhad, S. Study of catalytic reduction and photodegradation of methylene blue by heterogeneous catalyst. Spectrochim. Acta Part A Mol. Biomol. Spectrosc. 2011, 81, 228–235. [Google Scholar] [CrossRef]
  2. El-Kemary, M.; Abdel-Moneam, Y.; Madkour, M.; El-Mehasseb, I. Enhanced photocatalytic degradation of Safranin-O by heterogeneous nanoparticles for environmental applications. J. Lumin. 2011, 131, 570–576. [Google Scholar] [CrossRef]
  3. Kamat, P.V.; Huehn, R.; Nicolaescu, R. A “Sense and Shoot” Approach for Photocatalytic Degradation of Organic Contaminants in Water. J. Phys. Chem. B 2002, 106, 788–794. [Google Scholar] [CrossRef]
  4. Yang, J.L.; An, S.J.; Park, W.I.; Yi, G.-C.; Choi, W. Photocatalysis Using ZnO Thin Films and Nanoneedles Grown by Metal-Organic Chemical Vapor Deposition. Adv. Mater. 2004, 16, 1661–1664. [Google Scholar] [CrossRef]
  5. Adel, M.; Ahmed, M.A.; Elabiad, M.A.; Mohamed, A.A. Removal of heavy metals and dyes from wastewater using graphene oxide-based nanomaterials: A critical review. Environ. Nanotechnol. Monit. Manag. 2022, 18, 100719. [Google Scholar] [CrossRef]
  6. Safaei, M.; Foroughi, M.M.; Ebrahimpoor, N.; Jahani, S.; Omidi, A.; Khatami, M. A review on metal-organic frameworks: Synthesis and applications. TrAC Trends Anal. Chem. 2019, 118, 401–425. [Google Scholar] [CrossRef]
  7. Madima, N.; Mishra, S.B.; Inamuddin, I.; Mishra, A.K. Carbon-based nanomaterials for remediation of organic and inorganic pollutants from wastewater. A review. Environ. Chem. Lett. 2020, 18, 1169–1191. [Google Scholar] [CrossRef]
  8. Soleimani, M.; Ghasemi, J.B.; Ziarani, G.M.; Karimi-Maleh, H.; Badiei, A. Photocatalytic degradation of organic pollutants, viral and bacterial pathogens using titania nanoparticles. Inorg. Chem. Commun. 2021, 130, 108688. [Google Scholar] [CrossRef]
  9. Zahoor, M.; Nazir, N.; Iftikhar, M.; Naz, S.; Zekker, I.; Burlakovs, J.; Uddin, F.; Kamran, A.W.; Kallistova, A.; Pimenov, N.; et al. A Review on Silver Nanoparticles: Classification, Various Methods of Synthesis, and Their Potential Roles in Biomedical Applications and Water Treatment. Water 2021, 13, 2216. [Google Scholar] [CrossRef]
  10. Deshpande, B.; Agrawal, P.; Yenkie, M.; Dhoble, S. Prospective of nanotechnology in degradation of waste water: A new challenges. Nano-Struct. Nano-Objects 2020, 22, 100442. [Google Scholar] [CrossRef]
  11. Fei, L.; Bilal, M.; Qamar, S.A.; Imran, H.M.; Riasat, A.; Jahangeer, M.; Ghafoor, M.; Ali, N.; Iqbal, H.M. Nano-remediation technologies for the sustainable mitigation of persistent organic pollutants. Environ. Res. 2022, 211, 113060. [Google Scholar] [CrossRef] [PubMed]
  12. Nan, Y.; Gomez-Maldonado, D.; Whitehead, D.C.; Yang, M.; Peresin, M.S. Comparison between nanocellu-lose-polyethylenimine composites synthesis methods towards multiple water pollutants removal: A review. Int. J. Biol. Macromol. 2023, 232, 123342. [Google Scholar]
  13. Fu, F.; Dionysiou, D.D.; Liu, H. The use of zero-valent iron for groundwater remediation and wastewater treatment: A review. J. Hazard. Mater. 2014, 267, 194–205. [Google Scholar] [CrossRef]
  14. Chang, P.R.; Yu, J.; Ma, X.; Anderson, D.P. Polysaccharides as stabilizers for the synthesis of magnetic nanoparticles. Carbohydr. Polym. 2011, 83, 640–644. [Google Scholar] [CrossRef]
  15. Santhosh, C.; Malathi, A.; Dhaneshvar, E.; Bhatnagar, A.; Grace, A.N.; Madhavan, J. Iron Oxide Nanomaterials for Water Purification. In Micro and Nano Technologies, Nanoscale Materials in Water Purification, 1st ed.; Thomas, S., Pasquini, D., Leu, S.-Y., Gopakumar, D.A., Eds.; Elsevier: Amsterdam, The Netherlands, 2019; pp. 431–446. [Google Scholar]
  16. Shen, Y.F.; Tang, J.; Nie, Z.H.; Wang, Y.D.; Ren, Y.; Zuo, L. Preparation and application of magnetic Fe3O4 nanoparticles for wastewater purification. Sep. Purif. Technol. 2009, 68, 312–319. [Google Scholar] [CrossRef]
  17. Lu, Z.; Chen, F.; He, M.; Song, M.; Ma, Z.; Shi, W.; Yan, Y.; Lan, J.; Li, F.; Xiao, P. Microwave synthesis of a novel magnetic imprinted TiO2 photocatalyst with excellent transparency for selective photodegradation of enrofloxacin hydrochloride residues solution. Chem. Eng. J. 2014, 249, 15–26. [Google Scholar] [CrossRef]
  18. Kabra, K.; Chaudhary, R.; Sawhney, R.L. Treatment of Hazardous Organic and Inorganic Compounds through Aqueous-Phase Photocatalysis: A Review. Ind. Eng. Chem. Res. 2004, 43, 7683–7696. [Google Scholar] [CrossRef]
  19. Cheng, W.; Tang, K.; Qi, Y.; Sheng, J.; Liu, Z. One-step synthesis of superparamagnetic monodisperse porous Fe3O4 hollow and core-shell spheres. J. Mater. Chem. 2010, 20, 1799–1805. [Google Scholar] [CrossRef]
  20. Liu, Z.; Bai, H.; Sun, D.D. Facile fabrication of porous chitosan/TiO2/Fe3O4microspheres with multifunction for water purifications. New J. Chem. 2011, 35, 137–140. [Google Scholar] [CrossRef]
  21. Johnson, B.F.G. Nanoparticles in Catalysis. Top. Catal. 2003, 24, 147–159. [Google Scholar] [CrossRef]
  22. Xiong, L.; Sun, W.; Yang, Y.; Chen, C.; Ni, J. Heterogeneous photocatalysis of methylene blue over titanate nanotubes: Effect of adsorption. J. Colloid Interface Sci. 2011, 356, 211–216. [Google Scholar] [CrossRef] [PubMed]
  23. Rauf, M.A.; Meetani, M.A.; Khaleel, A.; Ahmed, A. Photocatalytic degradation of Methylene Blue using a mixed catalyst and product analysis by LC/MS. Chem. Eng. J. 2010, 157, 373–378. [Google Scholar] [CrossRef]
  24. Carmona-Carmona, A.; Palomino-Ovando, M.; Hernández-Cristobal, O.; Sánchez-Mora, E.; Toledo-Solano, M. Synthesis and characterization of magnetic opal/Fe3O4 colloidal crystal. J. Cryst. Growth 2017, 462, 6–11. [Google Scholar] [CrossRef]
  25. Stöber, W.; Fink, A.; Bohn, E. Controlled growth of monodisperse silica spheres in the micron size range. J. Colloid Interface Sci. 1968, 26, 62–69. [Google Scholar] [CrossRef]
  26. Razo, D.A.S.; Pallavidino, L.; Garrone, E.; Geobaldo, F.; Descrovi, E.; Chiodoni, A.; Giorgis, F. A version of Stöber synthesis enabling the facile prediction of silica nanospheres size for the fabrication of opal photonic crystals. J. Nanopart. Res. 2008, 10, 1225–1229. [Google Scholar] [CrossRef]
  27. Cui, Y.-H.; Li, X.-Y.; Chen, G. Electrochemical degradation of bisphenol A on different anodes. Water Res. 2009, 43, 1968–1976. [Google Scholar] [CrossRef]
  28. Awwad, A.M.; Salem, N.M. A Green and Facile Approach for Synthesis of Magnetite Nanoparticles. Nanosci. Nanotechnol. 2012, 2, 208–213. [Google Scholar] [CrossRef]
  29. Andrade, L.; Fabris, J.D.; Ardisson, J.D.; Valente, M.A.; Ferreira, J.M.F. Effect of Tetramethylammonium Hydroxide on Nucleation, Surface Modification and Growth of Magnetic Nanoparticles. J. Nanomater. 2012, 2012, 454759. [Google Scholar] [CrossRef]
  30. Ruso, J.M.; Gravina, A.N.; D’Elía, N.L.; Messina, P.V. Highly efficient photoluminescence of SiO2 and Ce–SiO2 microfibres and microspheres. Dalton Trans. 2013, 42, 7991–8000. [Google Scholar] [CrossRef] [PubMed]
  31. Bachan, N.; Asha, A.; Jeyarani, W.J.; Kumar, D.A.; Shyla, J.M. A Comparative Investigation on the Structural, Optical and Electrical Properties of SiO2–Fe3O4 Core–Shell Nanostructures with Their Single Components. Acta Met. Sin. Engl. Lett. 2015, 28, 1317–1325. [Google Scholar] [CrossRef]
  32. Yang, S.; He, H.; Wu, D.; Chen, D.; Liang, X.; Qin, Z.; Fan, M.; Zhu, J.; Yuan, P. Decolorization of methylene blue by heterogeneous Fenton reaction using Fe3−xTixO4 (0≤x≤0.78) at neutral pH values. Appl. Catal. B Environ. 2009, 89, 527–535. [Google Scholar] [CrossRef]
  33. Zuo, R.; Du, G.; Zhang, W.; Liu, L.; Liu, Y.; Mei, L.; Li, Z. Photocatalytic Degradation of Methylene Blue Using TiO2 Impregnated Diatomite. Adv. Mater. Sci. Eng. 2014, 2014, 170148. [Google Scholar] [CrossRef]
  34. Luong, N.H.; Phu, N.D.; Hai, N.H.; Thuy, N.T.D. Surface Modification of SiO2-Coated FePt Nanoparticles with Amino Groups. E-J. Surf. Sci. Nanotechnol. 2011, 9, 536–538. [Google Scholar] [CrossRef]
  35. Madima, N.; Kefeni, K.K.; Mishra, S.B.; Mishra, A.K.; Kuvarega, A.T. Fabrication of magnetic recoverable Fe3O4/TiO2 heterostructure for photocatalytic degradation of rhodamine B dye. Inorg. Chem. Commun. 2022, 145, 109966. [Google Scholar] [CrossRef]
  36. Peña-Flores, J.I.; Sánchez-Mora, E.; Gervacio-Arciniega, J.J.; Toledo-Solano, M.; Márquez-Beltrán, C. Effect of light on the wettability properties of films made by the assembly of SiO2 and α−Fe2O3 nanoparticles. J. Adhes. Sci. Technol. 2021, 35, 386–405. [Google Scholar] [CrossRef]
  37. Yuan, Z.-H.; You, W.; Jia, J.-H.; Zhang, L.-D. Optical Absorption Red Shift of Capped ZnFe 2 O 4 Nanoparticle. Chin. Phys. Lett. 1998, 15, 535–536. [Google Scholar] [CrossRef]
  38. Ali, A.M.; Emanuelsson, E.A.; Patterson, D.A. Photocatalysis with nanostructured zinc oxide thin films: The relationship between morphology and photocatalytic activity under oxygen limited and oxygen rich conditions and evidence for a Mars Van Krevelen mechanism. Appl. Catal. B Environ. 2010, 97, 168–181. [Google Scholar] [CrossRef]
  39. Zhang, J.; Li, B.; Yang, W.; Liu, J. Synthesis of Magnetic Fe3O4@hierarchical Hollow Silica Nanospheres for Efficient Removal of Methylene Blue from Aqueous Solutions. Ind. Eng. Chem. Res. 2014, 53, 10629–10636. [Google Scholar] [CrossRef]
  40. Vinothkannan, M.; Karthikeyan, C.; Kumar, G.G.; Kim, A.R.; Yoo, D.J. One-pot green synthesis of reduced graphene oxide (RGO)/Fe3O4 nanocomposites and its catalytic activity toward methylene blue dye degradation. Spectrochim. Acta Part A Mol. Biomol. Spectrosc. 2015, 136, 256–264. [Google Scholar] [CrossRef]
  41. Imran, M.; Alam, M.; Hussain, S.; Ali, M.A.; Shkir, M.; Mohammad, A.; Ahamad, T.; Kaushik, A.; Irshad, K. Highly photocatalytic active r-GO/Fe3O4 nanocomposites development for enhanced photocatalysis application: A facile low-cost preparation and characterization. Ceram. Int. 2021, 47, 31973–31982. [Google Scholar] [CrossRef]
  42. Martin, N.; Leprince-Wang, Y. HPLC-MS and UV–Visible Coupled Analysis of Methylene Blue Photodegradation by Hydrothermally Grown ZnO Nanowires. Phys. Status Solidi (a) 2021, 218, 2100532. [Google Scholar] [CrossRef]
  43. Lagrergen, S. Zur theorie der sogenannten adsorption gelöster stoffe kungliga svenska vetenskapsakademiens. Handlingar 1898, 24, 1–39. [Google Scholar]
  44. Ho, Y.S.; McKay, G. Pseudo-second order model for sorption processes. Process Biochem. 1999, 34, 451–465. [Google Scholar] [CrossRef]
  45. Borhan, A.; Yusup, S.; Lim, J.W.; Show, P.L. Characterization and Modelling Studies of Activated Carbon Produced from Rubber-Seed Shell Using KOH for CO2 Adsorption. Processes 2019, 7, 855. [Google Scholar] [CrossRef]
  46. de Jesús Ruíz-Baltazar, Á.; Reyes-López, S.Y.; Mondragón-Sánchez, M.d.L.; Robles-Cortés, A.I.; Pérez, R. Eco-friendly synthesis of Fe3O4 nanoparticles: Evaluation of their catalytic activity in methylene blue degradation by kinetic adsorption models. Results Phys. 2018, 12, 989–995. [Google Scholar] [CrossRef]
  47. Sanguino, A.; Diaz-Uribe, C.; Duran, F.; Vallejo, W.; Guzman, L.; Ruiz, D.; Puello, E.; Quiñones, C.; Schott, E.; Zarate, X. Photocatalytic Degradation of Methylene Blue under Visible Light Using TiO2 Thin Films Impregnated with Porphyrin and Anderson-Type Polyoxometalates (Cu and Zn). Catalysts 2022, 12, 1169. [Google Scholar] [CrossRef]
  48. Konstantinou, I.K.; Albanis, T.A. TiO2-assisted photocatalytic degradation of azo dyes in aqueous solution: Kinetic and mechanistic investigations: A review. Appl. Catal. B Environ. 2004, 49, 1–14. [Google Scholar] [CrossRef]
  49. Saquib, M.; Muneer, M. TiO2-mediated photocatalytic degradation of a triphenylmethane dye (gentian violet), in aqueous suspensions. Dye. Pigment. 2003, 56, 37–49. [Google Scholar] [CrossRef]
  50. Linsebigler, A.L.; Lu, G.; Yates, J.T. Photocatalysis on TiO2 Surfaces: Principles, Mechanisms, and Selected Results. Chem. Rev. 1995, 95, 735–758. [Google Scholar] [CrossRef]
  51. Augugliaro, V.; Baiocchi, C.; Prevot, A.B.; García-López, E.; Loddo, V.; Malato, S.; Marcí, G.; Palmisano, L.; Pazzi, M.; Pramauro, E. Azo-dyes photocatalytic degradation in aqueous suspension of TiO2 under solar irradiation. Chemosphere 2002, 49, 1223–1230. [Google Scholar] [CrossRef]
  52. Das, A.K.; Layek, R.K.; Kim, N.H.; Jung, D.; Lee, J.H. Reduced graphene oxide (RGO)-supported NiCo2O4nanoparticles: An electrocatalyst for methanol oxidation. Nanoscale 2014, 6, 10657–10665. [Google Scholar] [CrossRef] [PubMed]
  53. Corriu, R.; Leclercq, D.; Lefèvre, P.; Mutin, P.; Vioux, A. Preparation of monolithic gels from silicon halides by a non-hydrolytic sol-gel process. J. Non-Cryst. Solids 1992, 146, 301–303. [Google Scholar] [CrossRef]
  54. Tamura, H.; Mita, K.; Tanaka, A.; Ito, M. Mechanism of Hydroxylation of Metal Oxide Surfaces. J. Colloid Interface Sci. 2001, 243, 202–207. [Google Scholar] [CrossRef]
  55. Kim, T.G.; An, G.S.; Han, J.S.; Hur, J.U.; Park, B.G.; Choi, S.-C. Synthesis of Size Controlled Spherical Silica Nanoparticles via Sol-Gel Process within Hydrophilic Solvent. J. Korean Ceram. Soc. 2017, 54, 49–54. [Google Scholar] [CrossRef]
  56. Sun, D.; Kang, S.; Liu, C.; Lu, Q.; Cui, L.; Hu, B. Effect of Zeta Potential and Particle Size on the Stability of SiO2 Nanospheres as Carrier for Ultrasound Imaging Contrast Agents. Int. J. Electrochem. Sci. 2016, 11, 8520–8529. [Google Scholar] [CrossRef]
  57. Taheri-Ledari, R.; Valadi, K.; Gharibi, S.; Maleki, A. Synergistic photocatalytic effect between green LED light and Fe3O4/ZnO-modified natural pumice: A novel cleaner product for degradation of methylene blue. Mater. Res. Bull. 2020, 130, 110946. [Google Scholar] [CrossRef]
  58. Elshypany, R.; Selim, H.; Zakaria, K.; Moustafa, A.H.; Sadeek, S.A.; Sharaa, S.; Raynaud, P.; Nada, A.A. Elaboration of Fe3O4/ZnO nanocomposite with highly performance photocatalytic activity for degradation methylene blue under visible light irradiation. Environ. Technol. Innov. 2021, 23, 101710. [Google Scholar] [CrossRef]
  59. Alamo-Nole, L.; Bailon-Ruiz, S.; Luna-Pineda, T.; Perales-Perez, O.; Roman, F.R. Photocatalytic activity of quantum dot–magnetite nanocomposites to degrade organic dyes in the aqueous phase. J. Mater. Chem. A 2013, 1, 5509. [Google Scholar] [CrossRef]
  60. Khan, B.; Nawaz, M.; Waseem, M.; Hussain, R.; Arif, S.; Price, G.J.; Haq, S.; Rehman, W. Adsorption of methylene blue onto size controlled magnetite nanoparticles. Mater. Res. Express 2019, 6, 095511. [Google Scholar] [CrossRef]
  61. Roque-Malherbe, R. The Physical Chemistry of Materials: Energy and Environmental Applications, 1st ed.; CRC Press: Boca Raton, FL, USA, 2016; Chapter 2; pp. 64–65. [Google Scholar]
  62. Pierre, V.C.; Allen, M.J. (Eds.) Contrast Agents for MRI: Experimental Methods; The Royal Society of Chemistry: London, UK, 2017. [Google Scholar] [CrossRef]
  63. Xing, Z.; Tian, J.; Asiri, A.M.; Qusti, A.H.; Al-Youbi, A.O.; Sun, X. Two-dimensional hybrid mesoporous Fe2O3–graphene nanostructures: A highly active and reusable peroxidase mimetic toward rapid, highly sensitive optical detection of glucose. Biosens. Bioelectron. 2014, 52, 452–457. [Google Scholar] [CrossRef]
  64. Carvalho, H.W.; Hammer, P.; Pulcinelli, S.H.; Santilli, C.V.; Molina, E.F. Improvement of the photocatalytic activity of magnetite by Mn-incorporation. Mater. Sci. Eng. B Solid-State Mater. Adv. Technol. 2014, 181, 64–69. [Google Scholar] [CrossRef]
  65. Chang, S.; Lin, K.-Y.A.; Lu, C. Efficient adsorptive removal of Tetramethylammonium hydroxide (TMAH) from water using graphene oxide. Sep. Purif. Technol. 2014, 133, 99–107. [Google Scholar] [CrossRef]
Figure 1. (a) Schematic illustration of the fabrication process of SiO2-Fe3O4 composites, (b) experimental arrangement for the evaluation of the change in the concentration of MB as a function of the exposure time to the LED light sources, (c) photograph of the films of the composites inside the cell and the MB solution.
Photochem 03 00024 g001
Figure 2. SEM micrographs of (a) Fe3O4 NPs, (b) SiO2 opals, and the composites (c) SC2, (d) SC3, (e) SC4, (f) SC5. The size distribution of Fe3O4 NPs and SiO2 spheres is also shown. Panels (cf) show the surface of the SC2, SC3, SC4, and SC5 composites with the distribution of Fe3O4 NPs grown inside the SiO2 opal. The insets show the histograms of the particle size distributions of Fe3O4 NPs and spheres SiO2, respectively.
Photochem 03 00024 g002
Figure 3. XRD diffractograms of SiO2 opal, Fe3O4 NPs, and composites (SC1 to SC5) from 20° to 80°.
Photochem 03 00024 g003
Figure 4. FT−IR spectra of SiO2 opal, Fe3O4 NPs, and composites samples (SC1 to SC5).
Photochem 03 00024 g004
Figure 5. A typical Tauc plot of [F(R)hν]2 as a function of the photon energy (hν) obtained from diffuse reflectance spectra measurements for SiO2 opal, Fe3O4 NPs, and corresponding composites (SC1 to SC5).
Photochem 03 00024 g005
Figure 6. UV-vis UV–vis absorption spectra of the photocatalytic reduction of MB at an initial concentration of 12 ppm using composites SC3 (a) and SC4 (b) irradiated at λ = 410 nm and λ = 575 nm, respectively. MB time degradation curves taken from UV–vis absorption spectra at λ = 410 nm (c) and λ = 575 nm (d) of all catalysts used.
Photochem 03 00024 g006
Figure 7. HPLC chromatograms of the photocatalytic reduction of MB using SC3 (a) and SC4 (b) composites irradiated at λ = 410 nm and λ = 575 nm, respectively. Figures in the boxes share the same units. MB time degradation curves taken from HPLC chromatograms of all catalysts used at λ = 410 nm (c) and λ = 575 nm (d).
Photochem 03 00024 g007
Figure 8. MB adsorption profiles using SiO2, Fe3O4, and opal–magnetite composite films. (a,b) Zero order model, (c,d) pseudo-first-order model, and (e,f) pseudo-second-order model.
Photochem 03 00024 g008
Table 1. Volume and mass of Fe3O4 NPs in the SiO2-Fe3O4 composites (wt% was obtained by magnetic measurements [24]).
SampleVolume of Fe3O4 (mL)Mass of Fe3O4 (g)Weight of Fe3O4 (wt%)
SiO20.000.00000.000
Fe3O430.00.4004100.00
SC10.500.00671.402
SC20.750.00991.680
SC31.000.01332.030
SC41.500.01997.728
SC52.000.026624.400
Table 2. Kinetic constants and correlation coefficients for SiO2 microspheres, Fe3O4 NPs, and the composite in the MB photocatalytic degradation under visible irradiation (λ = 410 nm and λ = 575 nm).
Kinetic Parameters at λ = 410 nm
Zero Order Kinetics
[C] = [C0] − k1t
First Order Kinetics
ln[C] = ln[C0] − k2t
Second Order Kinetics
1/[C] = 1/[C0] + k3t
Catalystsk1R2k2R2k3R2
SiO2−0.00105 ± 2.255 × 10−40.76−0.00135 ± 2.6295 × 10−40.790.00176 ± 3.11295 × 10−40.82
SC1−0.0021 ± 3.5195 × 10−40.84−0.00397 ± 3.8081 × 10−40.940.00823 ± 2.67124 × 10−40.99
SC2−0.00216 ± 3.456 × 10−40.85−0.00387 ± 3.9465 × 10−40.930.00752 ± 3.81192 × 10−40.98
SC3−0.00214 ± 3.780 × 10−40.82−0.00403 ± 4.1775 × 10−40.930.00835 ± 3.58456 × 10−40.99
SC4−0.00218 ± 3.171 × 10−40.87−0.00401 ± 3.307 × 10−40.950.00804 ± 2.20321 × 10−40.99
SC5−0.00217 ± 2.648 × 10−40.91−0.00382 ± 2.39 × 10−40.970.00731 ± 2.50768 × 10−40.99
Fe3O4−0.00104 ± 2.232 × 10−40.76−0.00135 ± 2.537 × 10−40.800.00176 ± 2.89849 × 10−40.84
Kinetic Parameters at λ = 575 nm
Zero Order Kinetics
[C] = [C0] − k1t
First Order Kinetics
ln[C] = ln[C0] − k2t
Second Order Kinetics
1/[C] = 1/[C0] + k3t
Catalystsk1R2k2R2k3R2
SiO2−8.5180 × 10⁻⁴ ± 2.81 × 10−40.57−0.0010 ± 3.34582 × 10−40.600.0014 ± 4.02627 × 10−40.63
SC1−0.0018 ± 2.5831 × 10−40.88−0.0029 ± 2.69812 × 10−40.950.00496 ± 2.49154 × 10−40.98
SC2−0.0018 ± 3.1983 × 10−40.83−0.0030 ± 3.65326 × 10−40.910.00541 ± 3.92235 × 10−40.96
SC3−0.0019 ± 3.371 × 10−40.83−0.0033 ± 3.73482 × 10−40.920.00617 ± 3.49054 × 10−40.98
SC4−0.0019 ± 2.7962 × 10−40.88−0.0033 ± 3.05304 × 10−40.940.00584 ± 3.00699 × 10−40.98
SC5−0.002 ± 2.3981 × 10−40.91−0.0032 ± 2.33959 × 10−40.960.00561 ± 1.68955 × 10−40.99
Fe3O4−0.0010 ± 2.1253 × 10−40.78−0.0013 ± 2.40785 × 10−40.820.00176 ± 2.73892 × 10−40.86
Disclaimer/Publisher’s Note: The statements, opinions and data contained in all publications are solely those of the individual author(s) and contributor(s) and not of MDPI and/or the editor(s). MDPI and/or the editor(s) disclaim responsibility for any injury to people or property resulting from any ideas, methods, instructions or products referred to in the content.

