1. Introduction
Between 1963 and 1992, around 14% of the 733 underground nuclear tests conducted by the United States at the Nevada National Security Site (NNSS) had measured radioactive gases at the ground surface [
1]. The observations were either rapid (0–2 days) as the result of containment failure or operation releases, or the result of later time seepage (>2 days). While containment was intended for these tests, detailed analysis of historical data from Ref. [
2] suggested that there is no guarantee for achieving complete containment based on depth of burial and that the quantity of released radioactive gases was almost independent of depth [
3]. Since the detection of releases following a potential explosion would provide verification of a nuclear test, the apparent difficulty of containment provides a way to detect underground nuclear explosions (UNEs) as part of enforcing compliance compliance with the Comprehensive Nuclear Test-Ban Treaty.
Accurately predicting the arrival times of radioactive gases is difficult because of both the limited knowledge of rock hydraulic properties prior to an explosion and alteration of these properties during an explosion. Gases emplaced in the rock surrounding a UNE are driven to the surface according to both short and long timescale processes. On short timescales, the gases preferentially move through high permeability fractures driven by high initial cavity pressures following the UNE [
4]. Once high pressures have fallen in the cavity as the temperature falls, gas can still be driven to the surface at longer timescales (weeks to months) by barometric pumping [
1,
4,
5,
6]. Barometric pumping is a process where changes in atmospheric pressure cause air to flow into and out of the unsaturated zone, resulting in the net movement of the gases towards the surface.
Even if initial cavity overburden pressure and atmospheric conditions for a test with a given depth and yield are known, there is the additionally difficult task of constraining the mechanical and hydraulic properties of the test site. These properties include fracture properties (both naturally occurring and explosion induced), rock properties, the existence of faults, gas transport properties, and water content [
1,
4,
5,
7,
8,
9]. In particular, Refs. [
5,
6,
7], showed that in both a simplified single fracture model and a sequentially coupled hydrodynamic rock damage/gas transport model, simulations were found to be particularly sensitive to the maximum fracture aperture prescribed in the simulation, with different behavior recorded for different rock types. This highlights the importance of understanding fracture systems around a UNE test site.
Although fractures have been deemed an important control on the transport of gas to the surface following a UNE, prior work only accounts for fractures created as a result of the explosion [
5]. However, fractures exist in the domain prior to the explosion. In addition to new fractures being created, the existing fractures will interact with the shockwave during the blast, altering the damage field considerably. Therefore, it is possible that a considerable amount of variability in the simulated damage field would result from the properties of the underlying fracture network. For example, one potential pathway for gas to the surface is via connected fracture networks. While a connected network may not naturally exist in the location of an event, there is the potential that given a certain fracture network an explosion could create such a pathway to the surface. While we do not expect all fracture systems to result in connected pathways to the surface, we do expect that for explosions with different fracture orientations and densities, pathways can be created that are favorable for both early time and late time seepage.
While the intent of this work is to gain insight into gas transport following a UNE, chemical explosives provide a useful analog model for understanding the behavior of UNEs. In September 1993, a 1.1 kT chemical explosive was detonated at a depth of 389 m at the Nevada Test Site for the Non-Proliferation Experiment [
10]. One intention behind this experiment was to draw connections between the behavior of underground chemical and nuclear explosions. Analysis showed that the waveforms produced by equally energetic chemical and nuclear explosions were very similar. It was noted that a 1 kT chemical explosion is roughly equivalent to a 1 kT to 2 kT nuclear explosion, with variance depending on factors such as the properties being compared, and the emplacement medium [
10]. This indicates that chemical explosives are a useful analog for understanding the rock damage following an underground nuclear explosion [
11]. Modeling and experiments have been used in recent years to better understand seismic wave generation [
12,
13,
14] gas transport [
15], and rock damage [
16,
17,
18], following underground chemical explosions. Because there are considerable differences between a nuclear and chemical explosive source, there are expected differences in the behavior of gas transport. For example, chemical explosives create a large quantity of non-compressible gas, whereas UNEs typically do not [
4]. As a result, chemical explosives have persistent high pressure in the subsurface, while the cavity pressure falls off rapidly following a UNE. Differences in other factors such as rock damage, which will affect the gas transport, are not as well understood. This is an active area of research, and both new experiments and coupled physics based models are needed to improve understanding of different types of underground explosions.
In this study, for the first time, we develop a novel framework to simulate rock damage and subsequent gas transport from a chemical explosive in a subsurface domain that includes complex fracture networks. The coupling of the existing fractures with the damage processes allows for investigation of uncertainty stemming from the initial state of the system prior to the explosion. Using this framework, we explore the effects of fracture networks on the transport of gas following an underground chemical explosion, which is a useful analog for understanding UNEs. When fracture networks are incorporated into the domain prior to running damage simulations, we find the following:
Resulting rock damage is highly variable depending on fracture network realization;
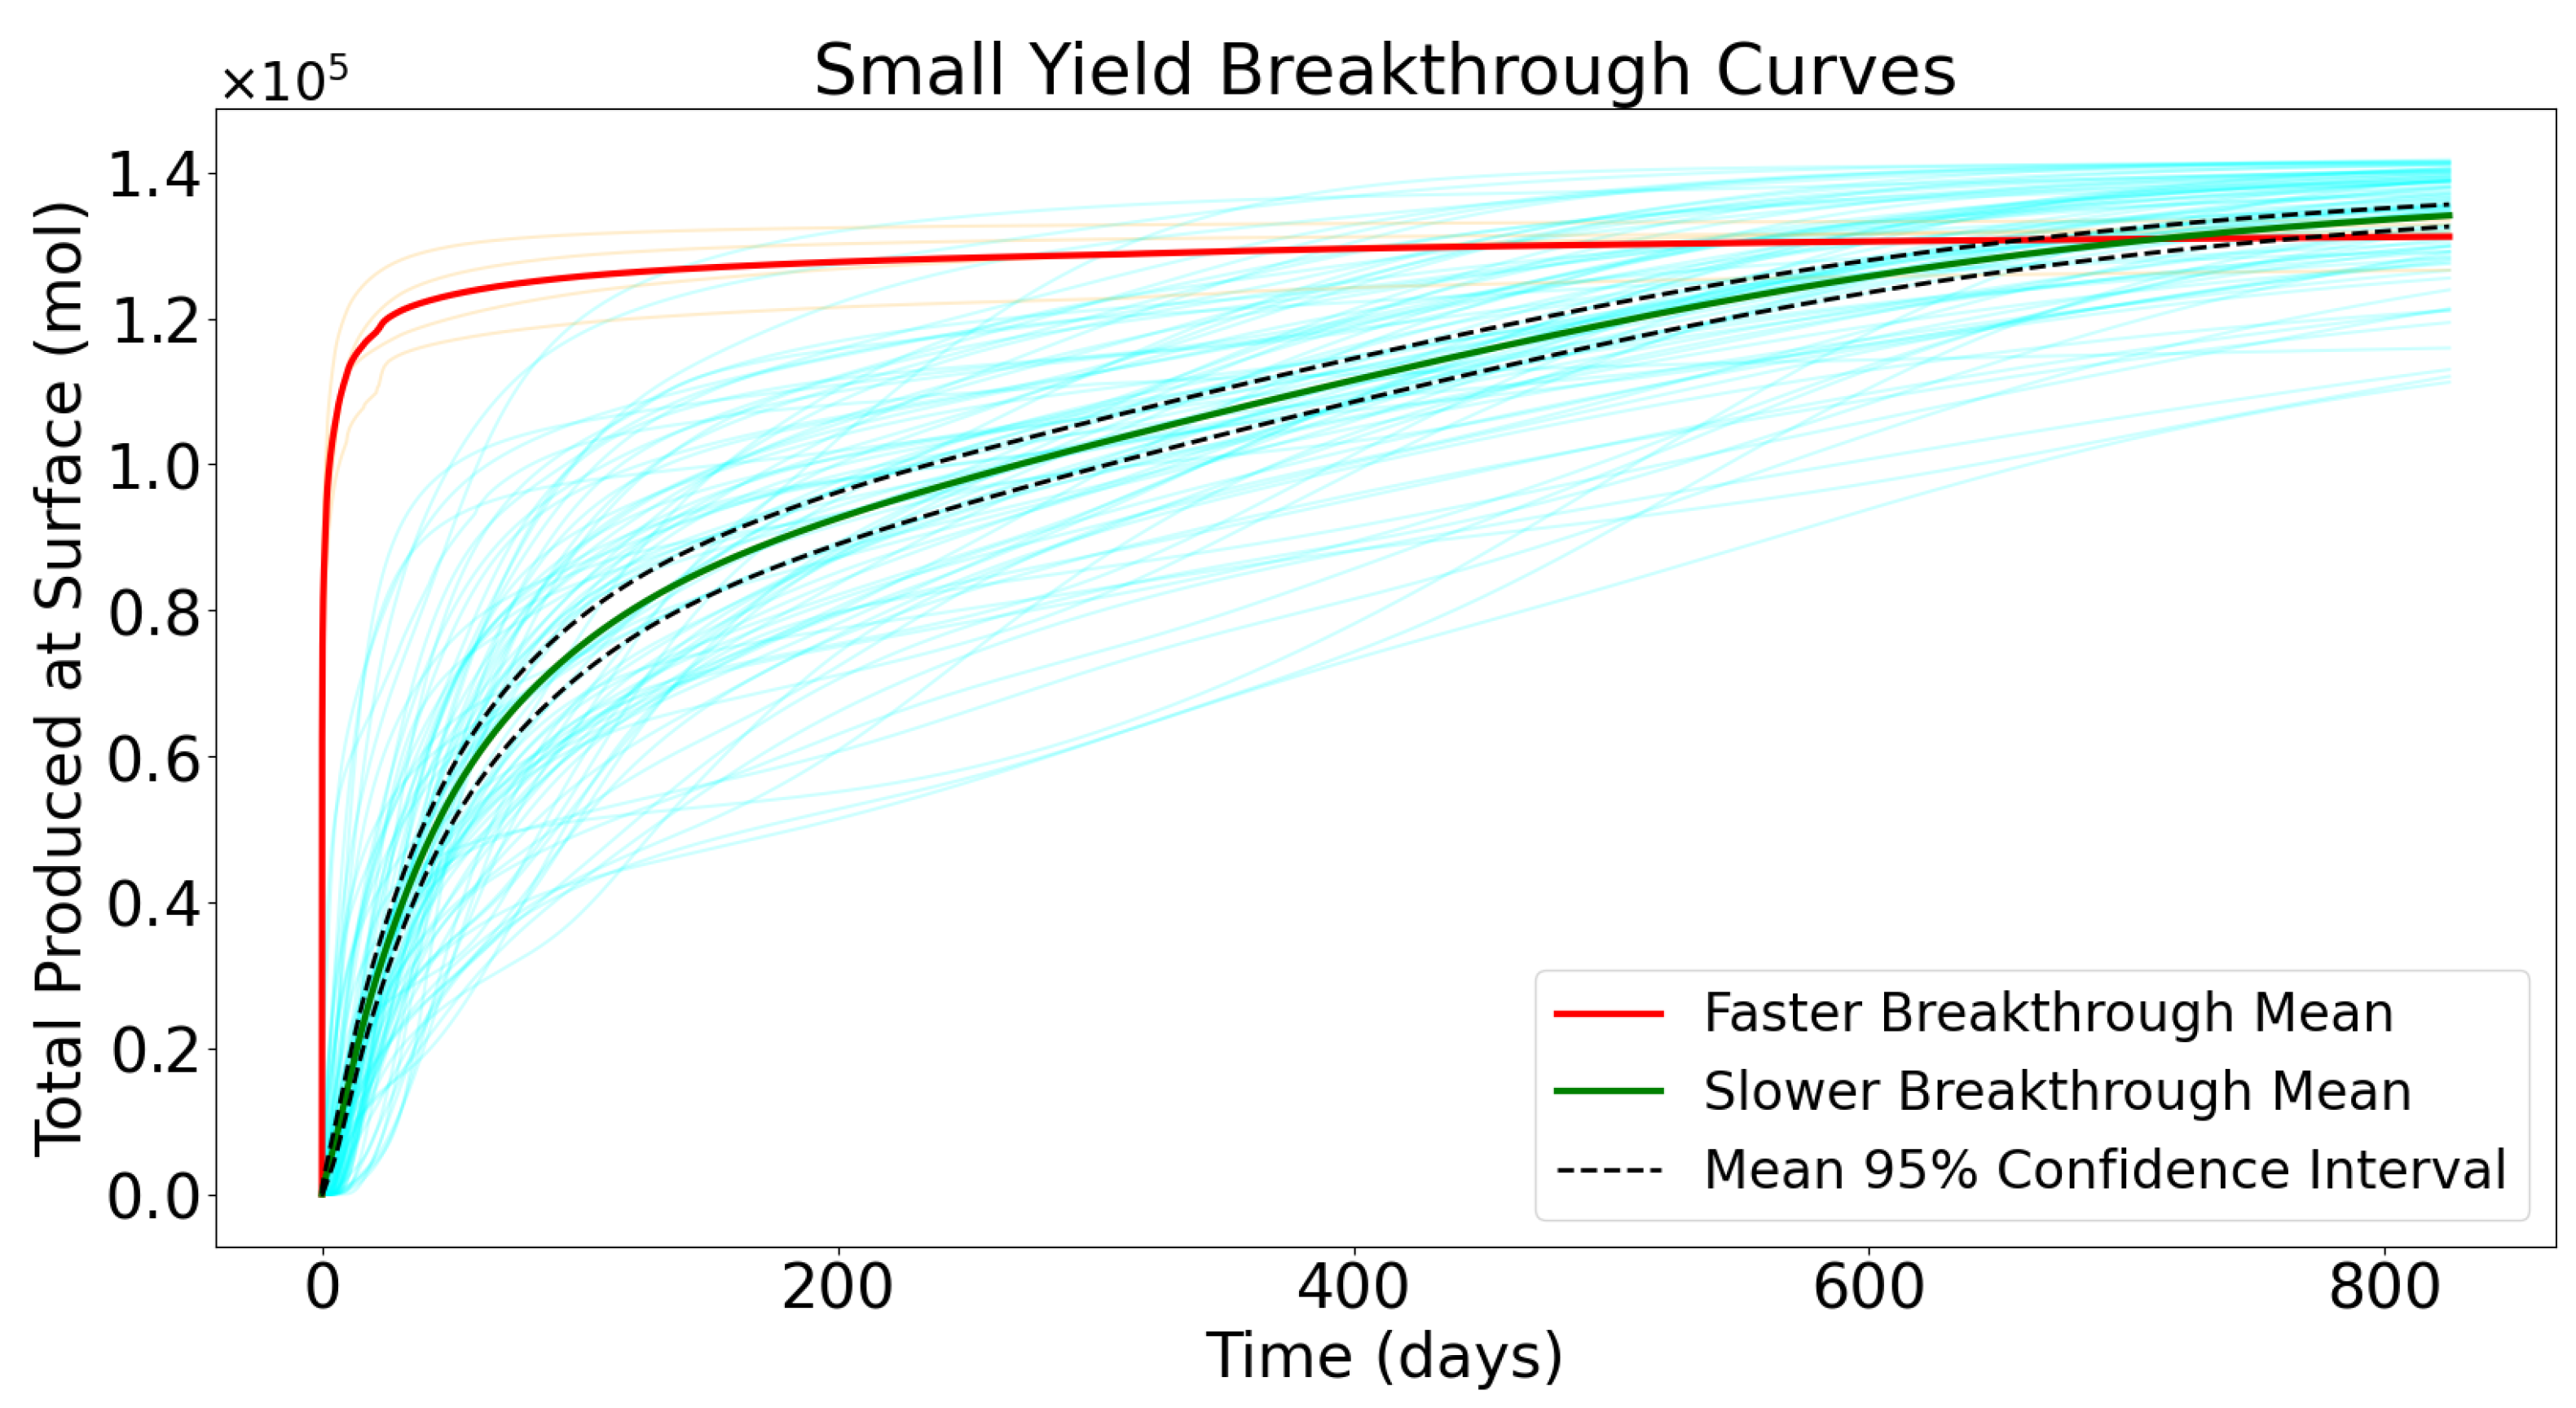
Approximately 30% of simulations have fast breakthrough dropping to approximately 5% of simulations when the explosive yield is halved, indicating a considerable reduction, but not elimination, of the probability of early time breakthrough with a much smaller explosive yield;
Simulations that do not have early time breakthrough have highly variable amounts of mass produced at the surface;
There is no strong relationship between the fracture intensity (; defined in the following section) and whether the simulation exhibits early time breakthrough or not.
2. Materials and Methods
To model the effects of fracture networks on rock damage and gas transport following a UNE, we sequentially couple several different modeling softwares that capture different aspects of the problem.
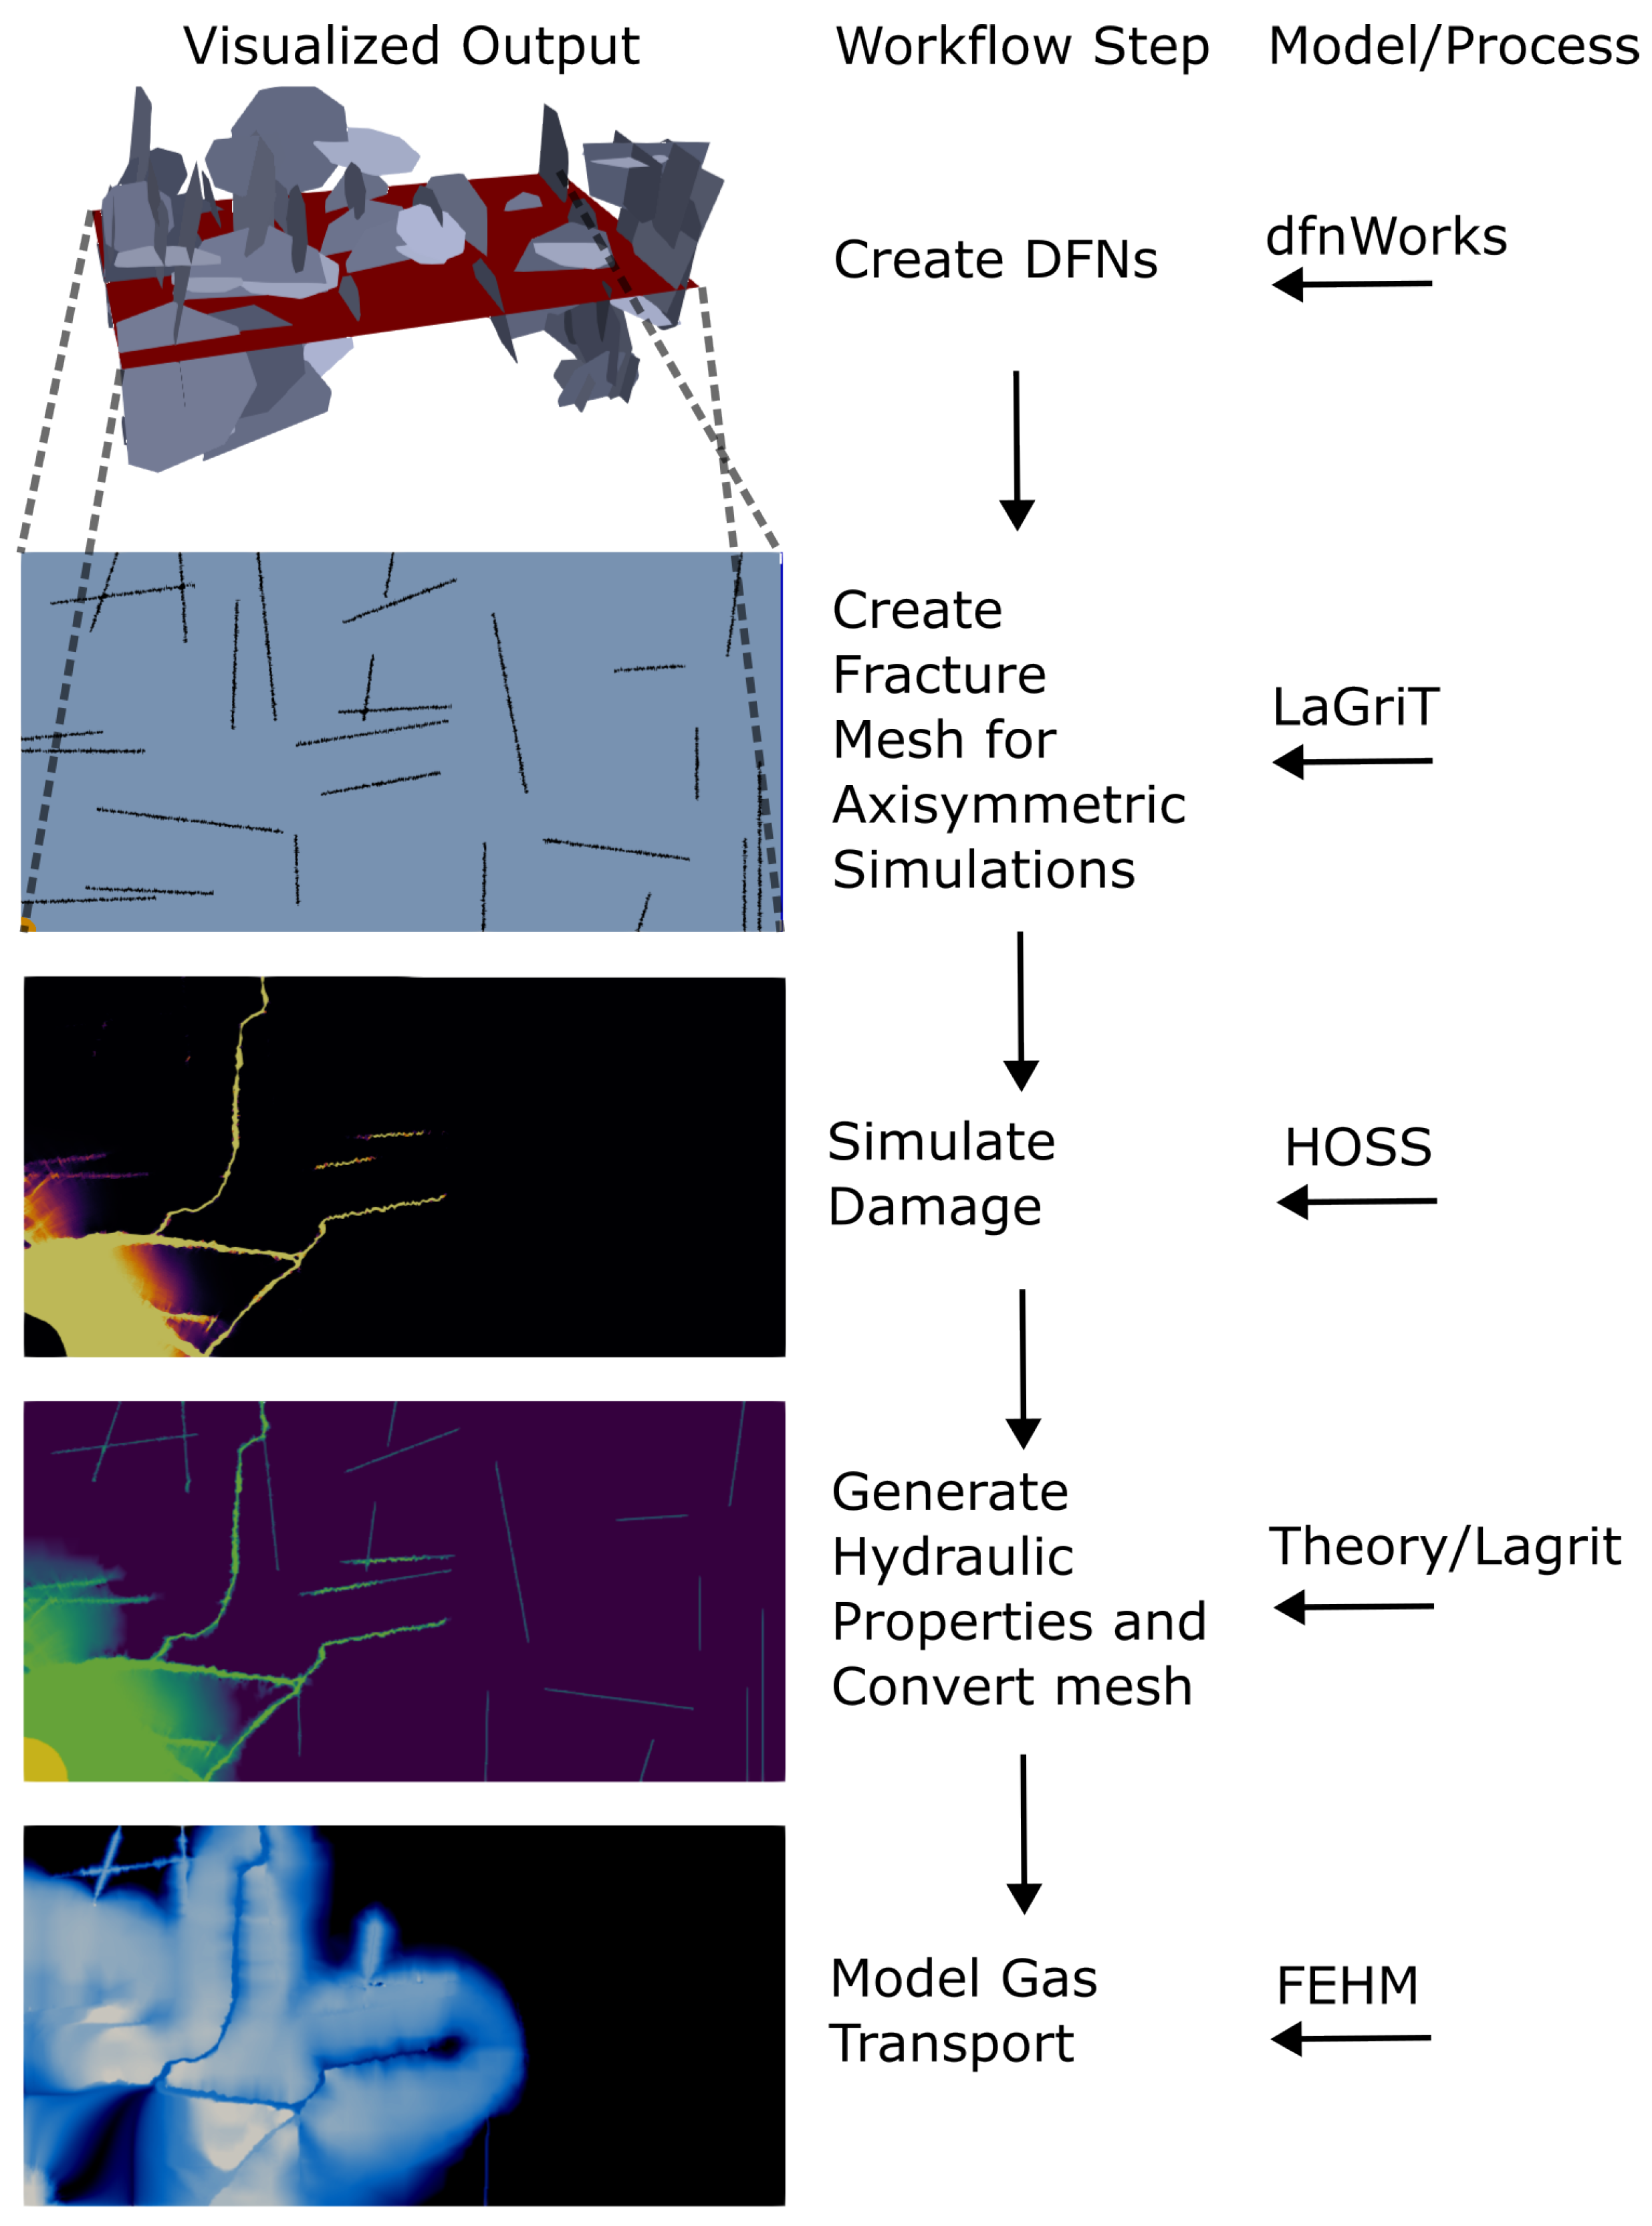
Figure 1 highlights the capabilities and workflow for the model from start to finish.
We use dfnWorks [
19] to generate fracture networks, which are then converted to 2D fracture networks using meshing software LaGriT [
20]. We simulate damage using an axi-symmetric continuum damage model in Hybrid Optimization Software Suite (HOSS) [
21]. The output damage is then converted to hydraulic properties for input into the Finite Element Heat and Mass Transfer code (FEHM) [
22] to simulate gas transport through the upscaled fracture network. The models used at each stage of the workflow are indicated in
Figure 1.
This modeling framework has several advantages. One is that the axi-symmetric simulations are relatively fast to run. This allows us to generate many realizations of the subsurface quickly and get better estimates of the uncertainty in the problem. Since the subsurface is opaque and localized measurements of rock properties and fracture intensity may be the only available information, this allows us to generate a large enough sample of different subsurface realizations to make predictions about the general behavior of this type of system. Additionally, prior work has made use of axi-symmetric models (e.g., Refs. [
4,
5]).
Another advantage of this framework is the ability to simulate both the explosion and the subsequent gas transport. Prior work in gas transport following underground explosions assumes that there is a singular damage field [
5] and that uncertainty in other model parameters is explored. Since there is also uncertainty in the damage field, the new framework allows us to investigate uncertainty stemming from the damage side of the problem.
2.1. Discrete Fracture Network and Mesh Generation
dfnWorks is used to stochastically generate a 3D discrete fracture network. For each randomly seeded fracture network, we assume that the network contains three orthogonal elliptical fracture families, each with the same
value.
is defined as the total surface area of a fracture family divided by the total volume of the domain, which gives a measure of the fracture intensity for the fracture family. The fracture radii (
r) follow a truncated-power law probability density function
with a minimum radius (
) of 10 m, a maximum radius (
) of 30 m. The equation parameter
of 1.8 is consistent with observed field values presented in Ref. [
23]. We generate the fractures in a 300 × 100 × 100 m domain. The upper limit on the fracture radii reflects that we want fractures in the domain to be only a fraction of the domain width. To create a 2D mesh that conforms to the 1D fractures and their intersections, we use a modification of the FRAM algorithm presented in dfnWorks [
19]. The algorithm is as follows: We insert into the 3D fracture domain a rectangular fracture that is normal to the z-axis and centered at the origin of the domain. Points on the intersection of this plane with the discrete fracture network (DFN) are tagged. We then use the meshing software LAGRIT to create a conforming 2D discrete fracture matrix (DFM) mesh using the tagged fracture points with a vertical domain length of 100 m and a horizontal domain length of 300 m. This allows us to incorporate fractures in a rock matrix, and cells that lie along the fracture are tagged as part of the fracture. This is a streamlined and theoretically rigorous method using the feature rejection algorithm for meshing (FRAM) used in dfnWorks [
19]. The horizontal domain length was chosen so that only a small amount of gas reaches the edge of the domain at the end of the gas transport simulations.
Conversion of the mesh does not preserve the
value of the original DFN. The new mesh is used in axi-symmetric models, meaning that there is radial symmetry around the vertical axis on the left side of the domain as pictured in
Figure 1. This results in fractures that are conic sections instead of planar features. We recalculate the
values for this geometry and find that from a singular
value for DFN generation, we end up with a distribution of
values with a mean that is slightly less than the original
value used for generation. The samples generated for this experiment were generated with DFN
values of 0.05, 0.1, and 0.2, resulting in a range of final
values between 0.046 and 0.300.
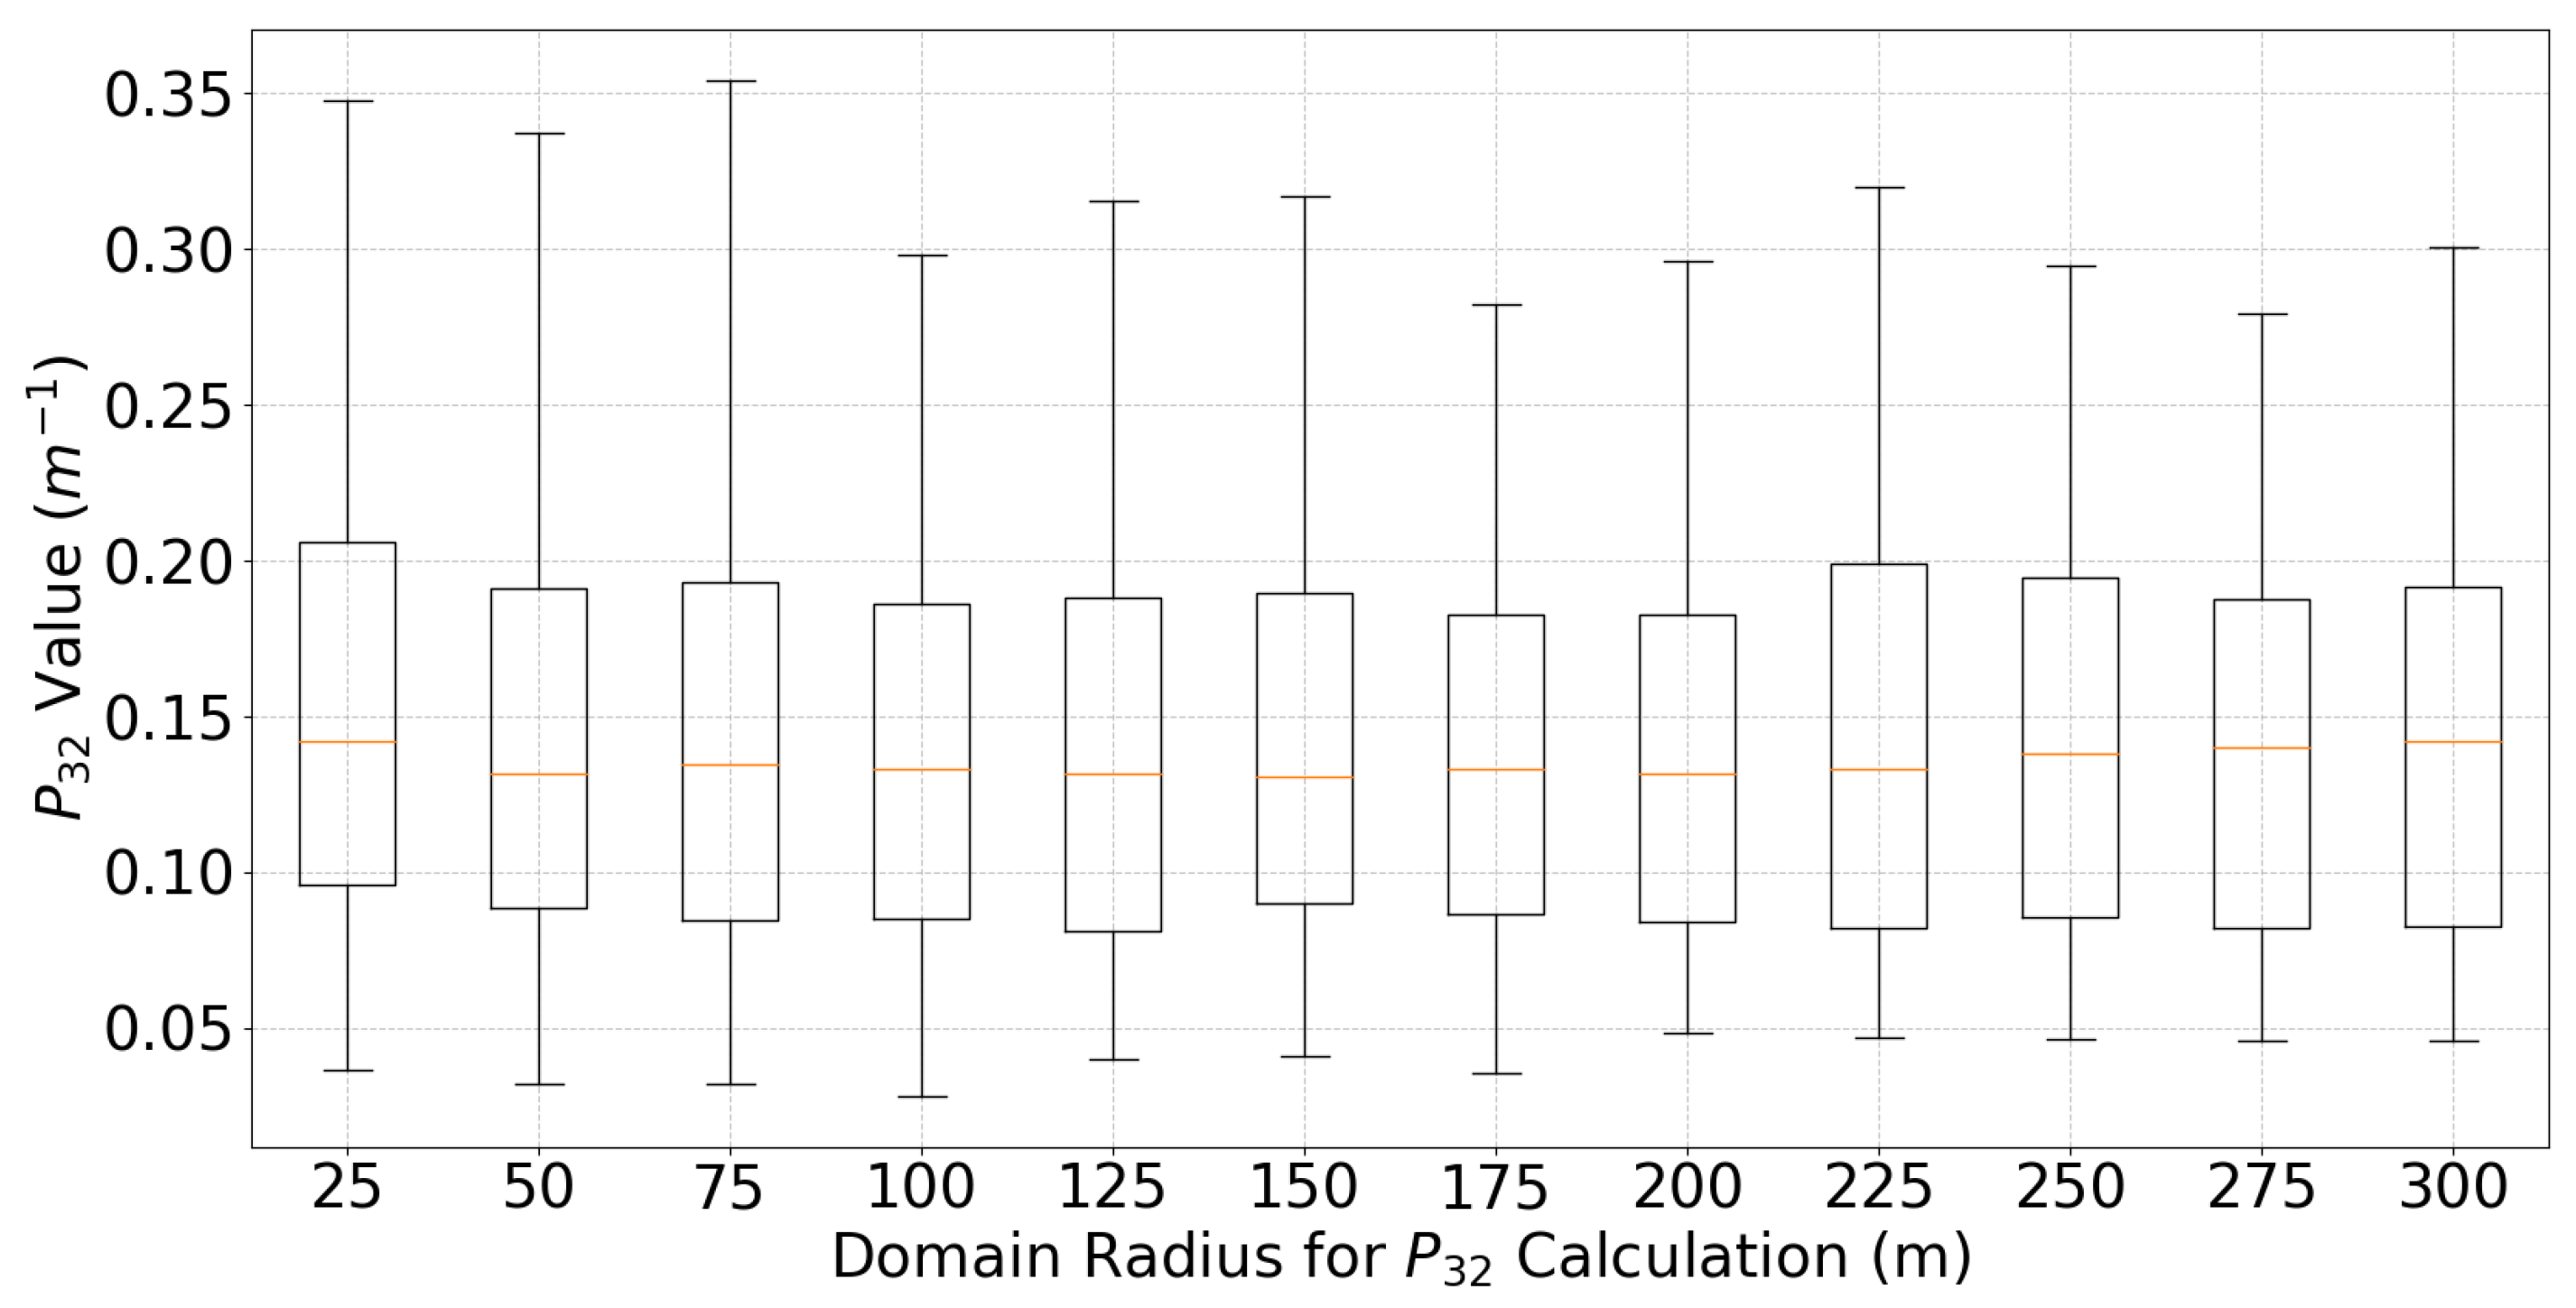
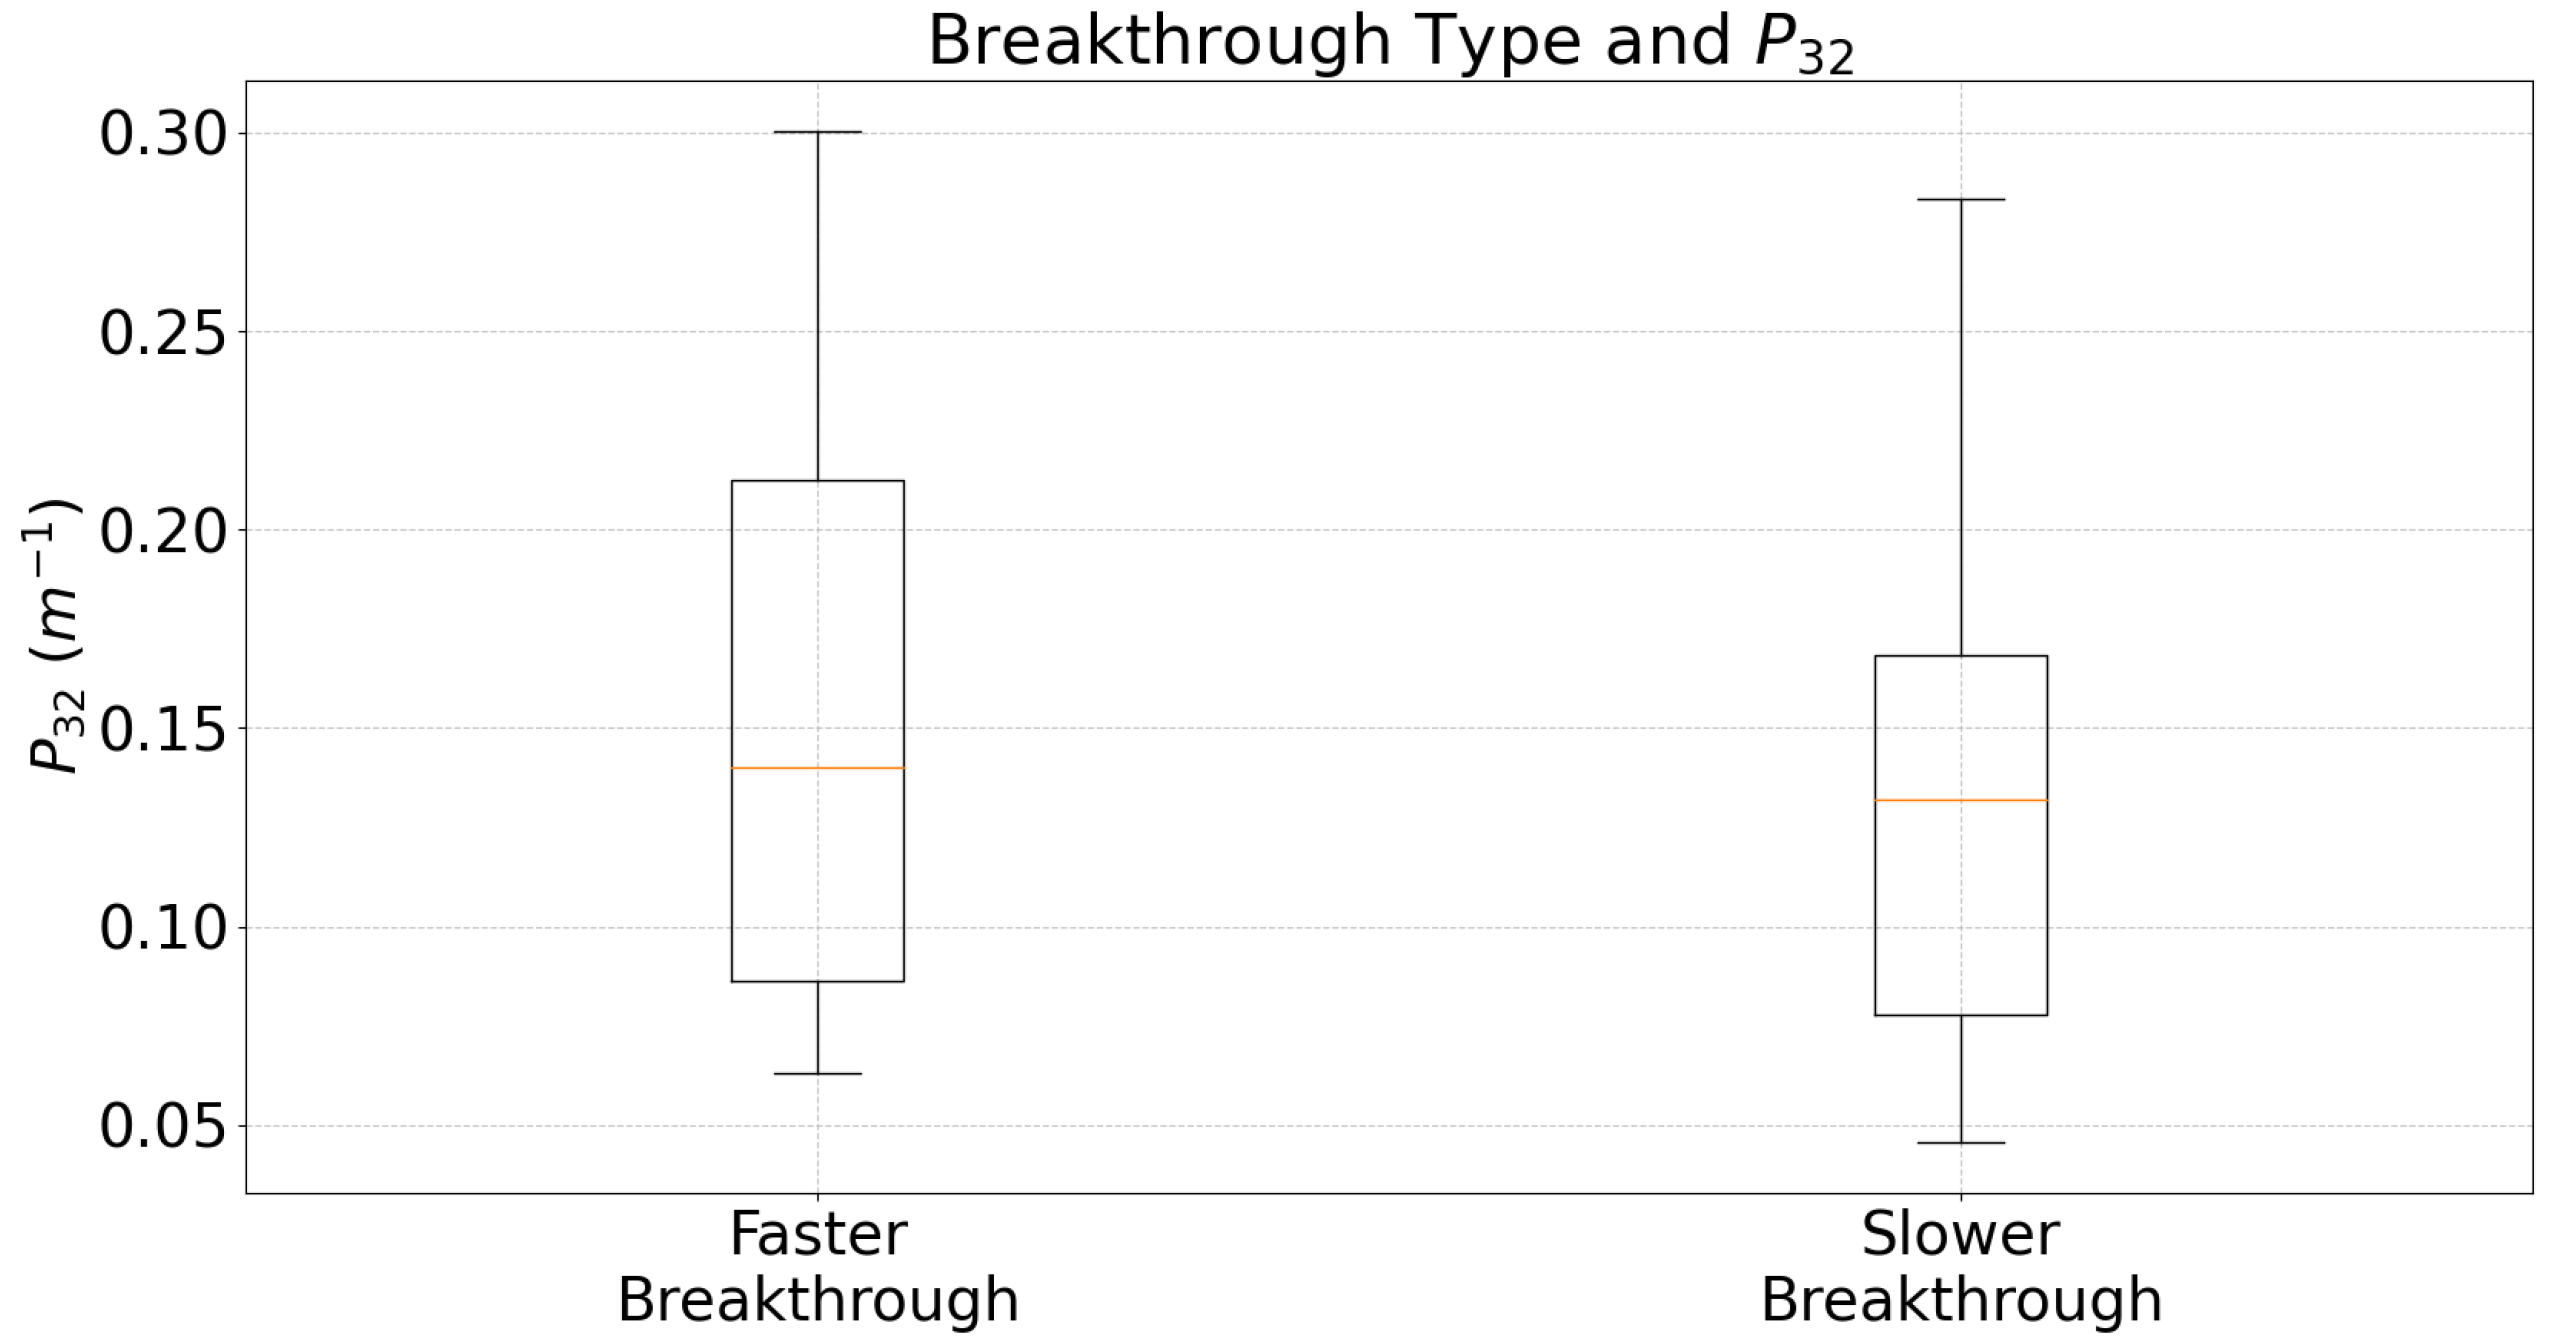
As mentioned before, the axi-symmetric model implies the fractures inserted into the domain are conic sections. One potential issue is that the fractures farther from the axis of symmetry are significantly larger than closer fractures. This means that fractures farther from the explosive source contribute more to the
calculation than those near the source. To ensure that our
calculations are not skewed significantly by this fact, we compute the
values for each sample assuming different domain widths on 25 m intervals from 25 m to 300 m. The results of these calculations are shown in boxplots in
Figure 2, and we can see that the distribution of
values for the samples do not change considerably between different domain widths. With this in mind we think the calculated
values for the full domain are justified and the choice of the domain width will not impact the results considerably.
2.2. Simulating Damage
This work uses an elastoplastic material model [
24] in HOSS to simulate how rocks change shape and size when exposed to explosive loadings. The model considers both the shape change (deviatoric response) and the size change (volumetric response) of the rocks. The deviatoric response is computed using a hyperelastic constitutive law [
24] that can handle large deformations and high strain rates in rocks. The constitutive law decomposes an infinitesimal material element into seven different physically independent stress bearing mechanisms that can resist stress in different ways [
24]. Each mechanism defines a function that connects its internal moment to a corresponding shear strain component. The seventh mechanism relates its volume stress to its volume strain. In this model, the shear strength for each mechanism can be defined as a function of temperature, strain rate, effective plastic strain, and volumetric stress. However, we assume isotropic rock and isotropic strength that depends only on effective plastic strain and volumetric stress in this work. When the material yields, we use a return mapping algorithm to correct the internal moments and the Cauchy stresses [
24]. The volumetric response is modeled via a crushable equation of state (EOS). The EOS allows for elastic volumetric stress until high pressures cause pore space to collapse and reduce the volume permanently. When no pore space remains, the material cannot change its volume anymore. Therefore, we apply a nonlinear relation between volumetric strain and volumetric stress. The model parameters are based on data from a limestone with 2.15% porosity. Other properties of the rock include a Bulk Modulus of 26.8 GPa, a shear modulus of 16.8 GPa, and a density of 2424 kg ·
.
In order to incorporate the fractures into the model, cells tagged in the mesh as part of the fractures are represented as a weaker material with 10% of the strength of the surrounding rock. This results in much more deformable material, which better approximates the movement that would be expected along a real fracture. This choice was made to reflect the fact that fractures have considerably less strength than surrounding rock, but likely still have some amount of cohesiveness. New fractures are assumed to be part of damaged cells within the model where the resistance to deformation is reduced. The damage criterion is defined as , where z is the shear strength factor. The shear strength factor is in turn a function of the effective plastic strain. Damage is a value between zero and one with a value of zero indicating the material’s maximum resistance to deformation, and a value of one indicating its minimum resistance to deformation.
We chose an explosive yield of 0.327 kiloton of TNT equivalent (kT) as the forcing for the model. This yield was chosen to be below its estimated containment depth at 100 m. To estimate the containment depth in meters, the scaled shot depth relationship
was used, where
Y is the yield in kT [
25]. However, since this equation is intended for a UNE and 1 kT chemical explosion is roughly equivalent to a 1 kT to 2 kT nuclear explosion [
10] we additionally run scenarios with a halved explosive yield of 0.164 kT to cover the possible range of equivalencies. Additionally, the range of yield sizes provides information about the changes in the types and timing of breakthrough as the explosive yield decreases in size.
The explosive is represented by a group of cells centered at 100 m depth along the axis of symmetry within the radius of the initial cavity, which is determined by the explosive yield. The explosive is modeled using the Jones–Wilkins–Lee (JWL) equation of state formulation as described in Ref. [
26]. When the explosive is detonated, a large energy density is present within the cavity, which causes an outward pressure on the cavity walls. This results in a shockwave that propagates away from the source, as well as growth of the cavity from the considerable deformation of the rock around the cavity. The left boundary is fixed in the horizontal direction, and the bottom boundary is fixed in the vertical direction in order to represent the symmetry of the explosion and to prevent deformation of the mesh in these directions. The right-hand boundary is non-reflecting, which allows for the transmission of waves into the rock outside of the domain. The initial stress state of the domain is zero so we could focus on the specific interactions between the explosion and the fractures without adding additional model complexity. Simulations were run for 0.1 s to give adequate time for the damage pattern to finish developing.
2.3. Mesh Conversion and Assigning Hydraulic Properties
The output of the damage model is converted to hydraulic parameters for gas transport simulations using FEHM. The domain contains damaged rock, undamaged rock, and preexisting fractures. We use LaGriT to convert the mesh for FEHM runs, refining the mesh resolution around damaged regions and preexisting fractures. Undamaged rock is assigned background properties with permeability of and porosity of 2.15%. The background porosity is consistent with the porosity of the limestone used in the damage model. The background permeability was chosen to be for a low permeability limestone for consistency with the rock type used to calibrate the damage model.
In damaged regions (including damaged preexisting fractures), we assume that there is a power-law relationship between damage and permeability. We invert the parameters in the power-law using the measured permeability from the Hardhat test [
27] in combination with numerical modeling of rock damage following the Hardhat test. There are many possible parameters that give a reasonable match between the model and the data, but for this study we chose a coefficient of 687, an exponent of 1.73, and set a lower bound of
for the relationship. We note that this type relationship is likely limited in scope and potentially overly simplistic, but has some precedent in experimental data [
28,
29].
In order to get the porosity of damaged regions we use a simplified version of the upscaling relationship from Ref. [
30] to calculate the porosity given the permeability. We assume that the fracture passes through each cell it intersects either vertically or horizontally, which introduces a small error based on the true orientation of the fracture. The simplified upscaling relationship is
where
is the permeability of a cell,
is the porosity of the cell,
is the background permeability (
),
b is the fracture aperture, and
is the width of the cell. The permeability of the cell is given by the power law relationship, and we then solve this system of equations to get the cell porosity. The undamaged fractures in the system are also modeled using Equations (1) and (2), however, we instead assume a constant fracture aperture of
m, and then directly calculate the permeability and porosity of the cell. We acknowledge that in a realistic setting the undamaged fracture apertures would be variable, but since this paper is not focused on the sensitivity of background hydraulic properties we believe a constant value is appropriate.
2.4. Gas Transport
Gas transport is simulated using FEHM. FEHM has been applied to a variety of subsurface flow problems [
8,
31,
32,
33]. We initially add a mass of gas equivalent to the mass of the chemical explosive to the cavity produced by the explosion, resulting in a high initial cavity pressure. We assume for simplicity that 1 mol of an inert tracer is produced for each kg of explosive. To further simplify the model, we assume atmospheric pressure is constant, and that the gas transport occurs in dry rock so only single phase flow and transport equations are needed. No flow boundary conditions are set on the left and bottom boundaries of the domain, and the top and right boundaries have a fixed pressure boundary condition of one atmosphere. The simulations are run for 825 days. This amount of time allows for the majority of the tracer to reach the surface in all simulations, and also ends the simulation before a considerable amount of the tracer is lost through the far side of the domain.
4. Discussion
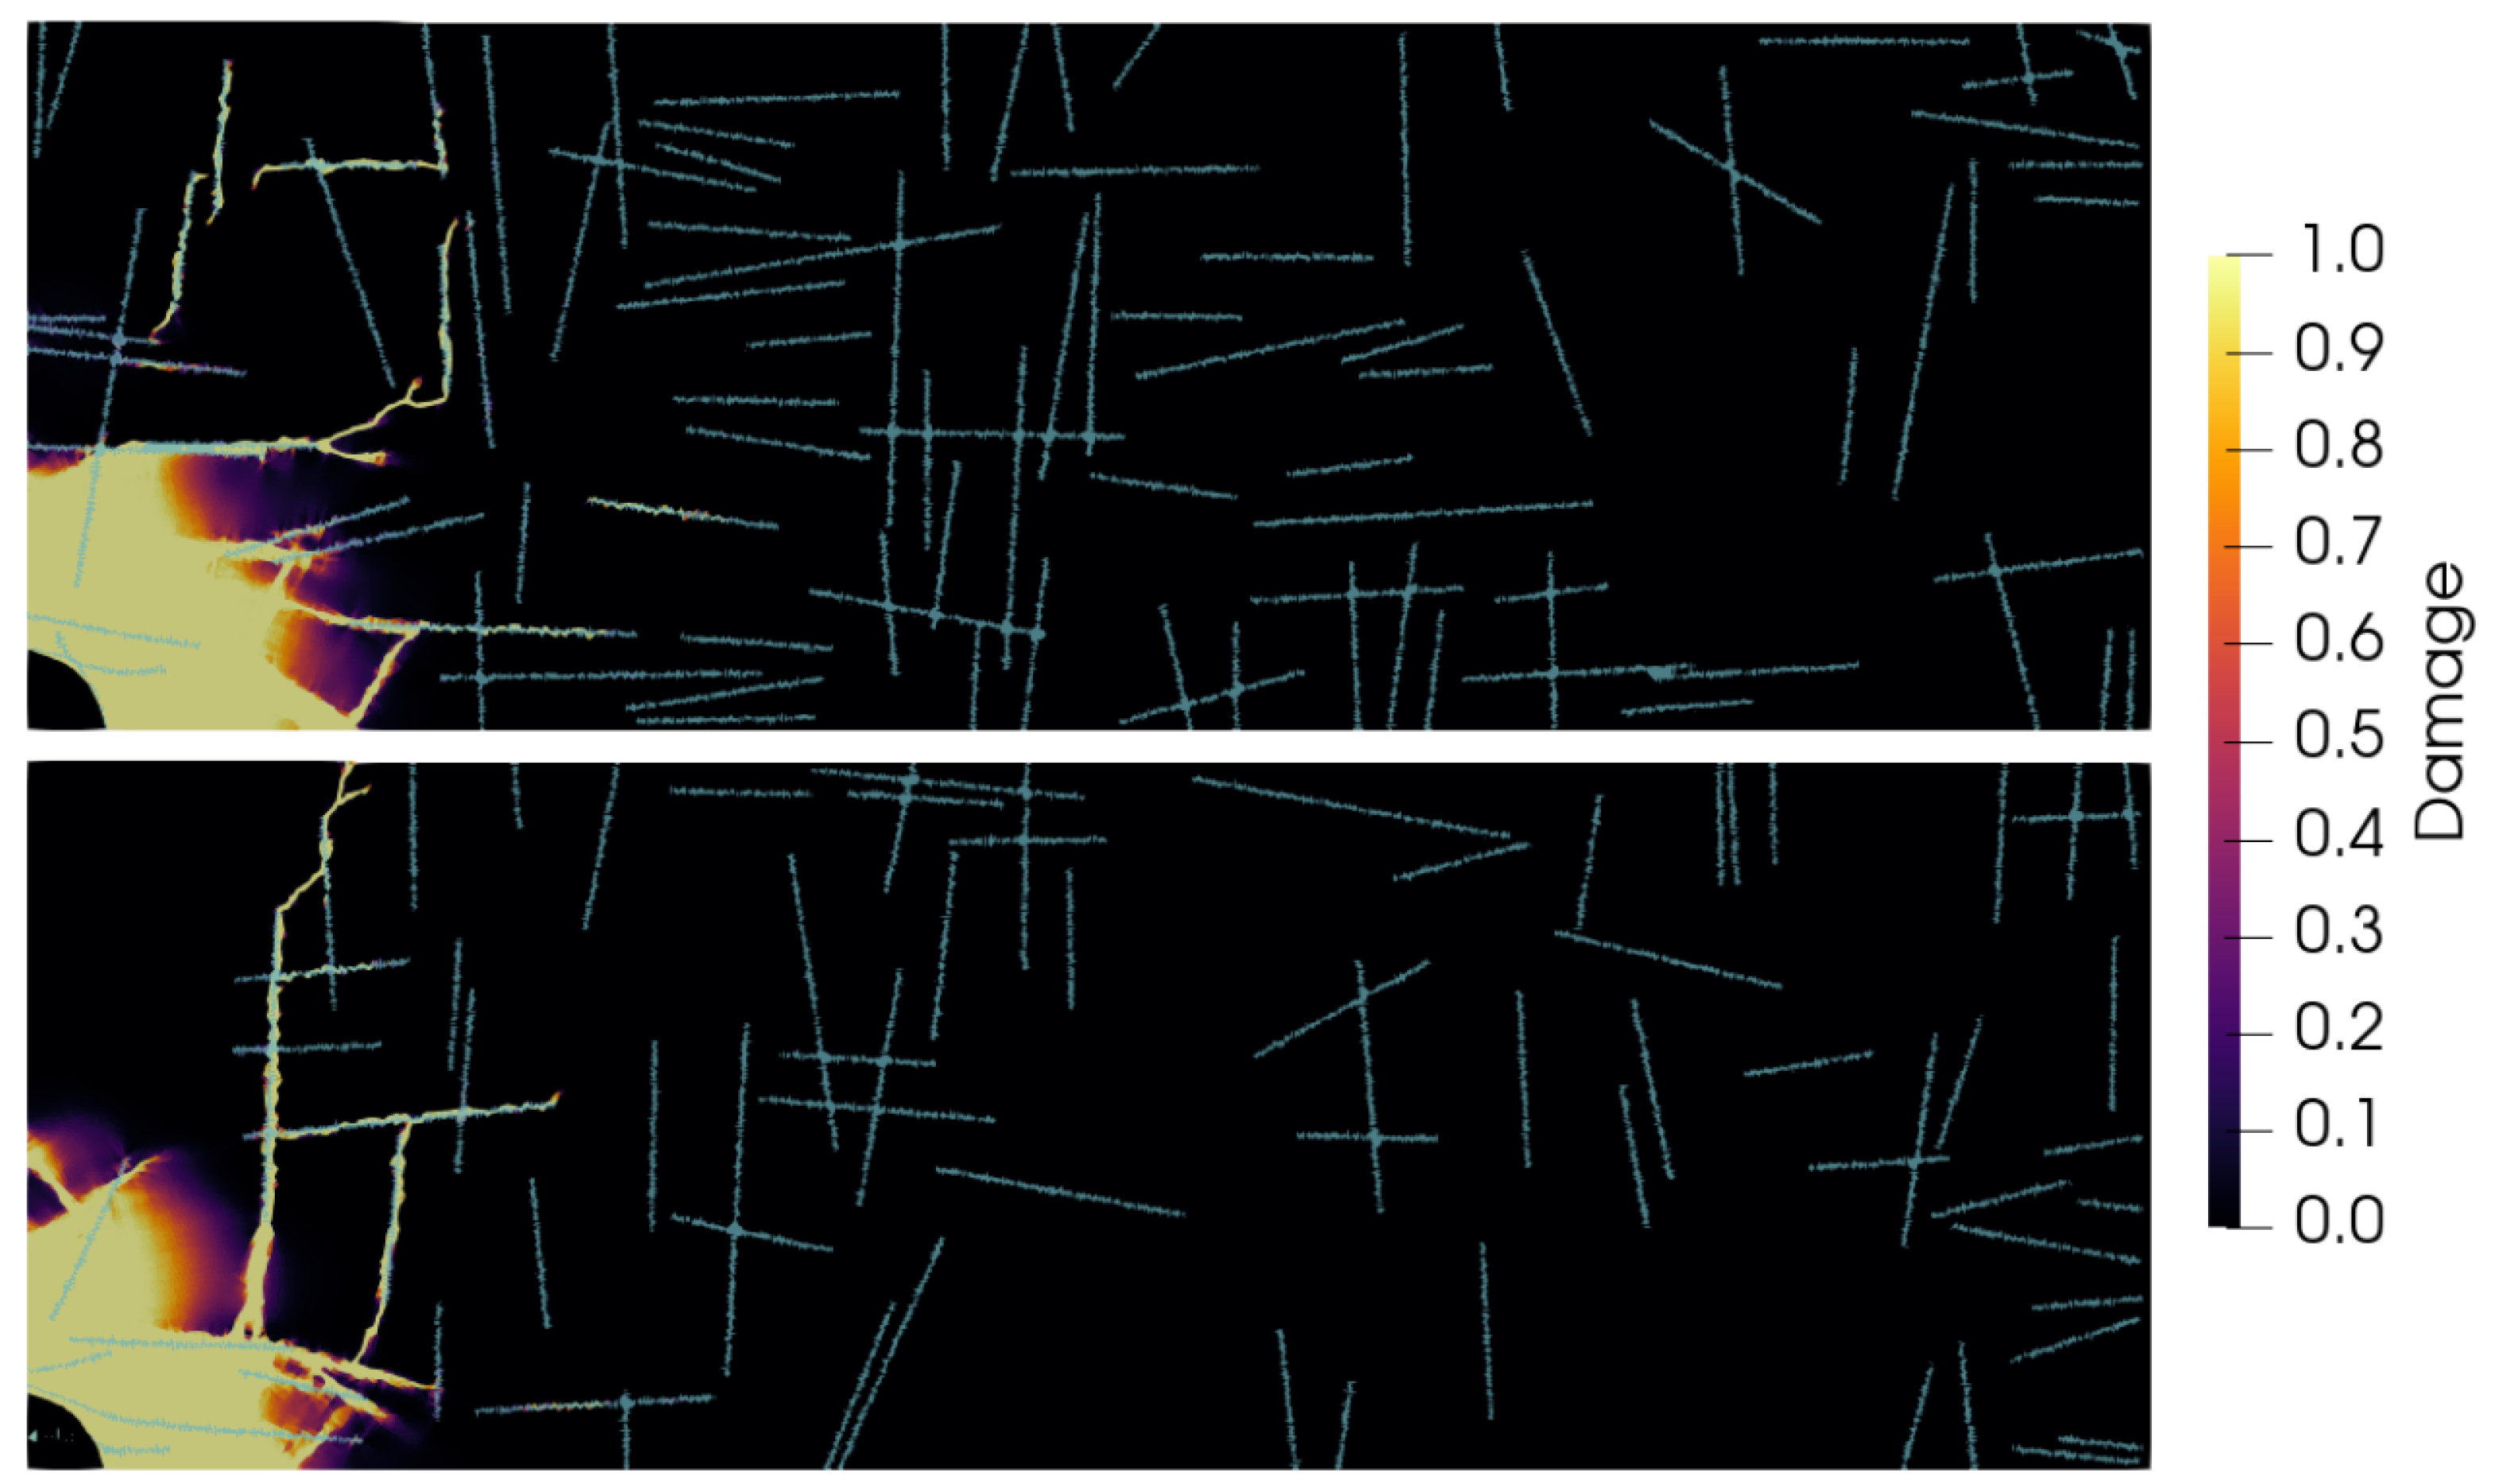
Depending on the fracture network sample, there is a wide variety of damage patterns. Damage patterns generally follow fractures due to their lower strength, but the specifics of which fractures are damaged and which ones are not is not always obvious a priori. The strong dependence of damage behavior on existing fractures has been shown in a variety of subsurface problems such as hydraulic fracturing [
34] and excavation [
35]. In meter scale small explosive problems, jointing has been shown to strongly influence the modeled damage pattern [
36]. However, there has been a lack of emphasis on the addition of fracture networks into underground explosive test problems overall. Since the damage pattern strongly influences the hydraulic properties around a test site, this sensitivity of the damage to the fracture network sample indicates that ignoring underlying fracture networks results in a large underestimation of the uncertainty in the gas transport following an underground explosion.
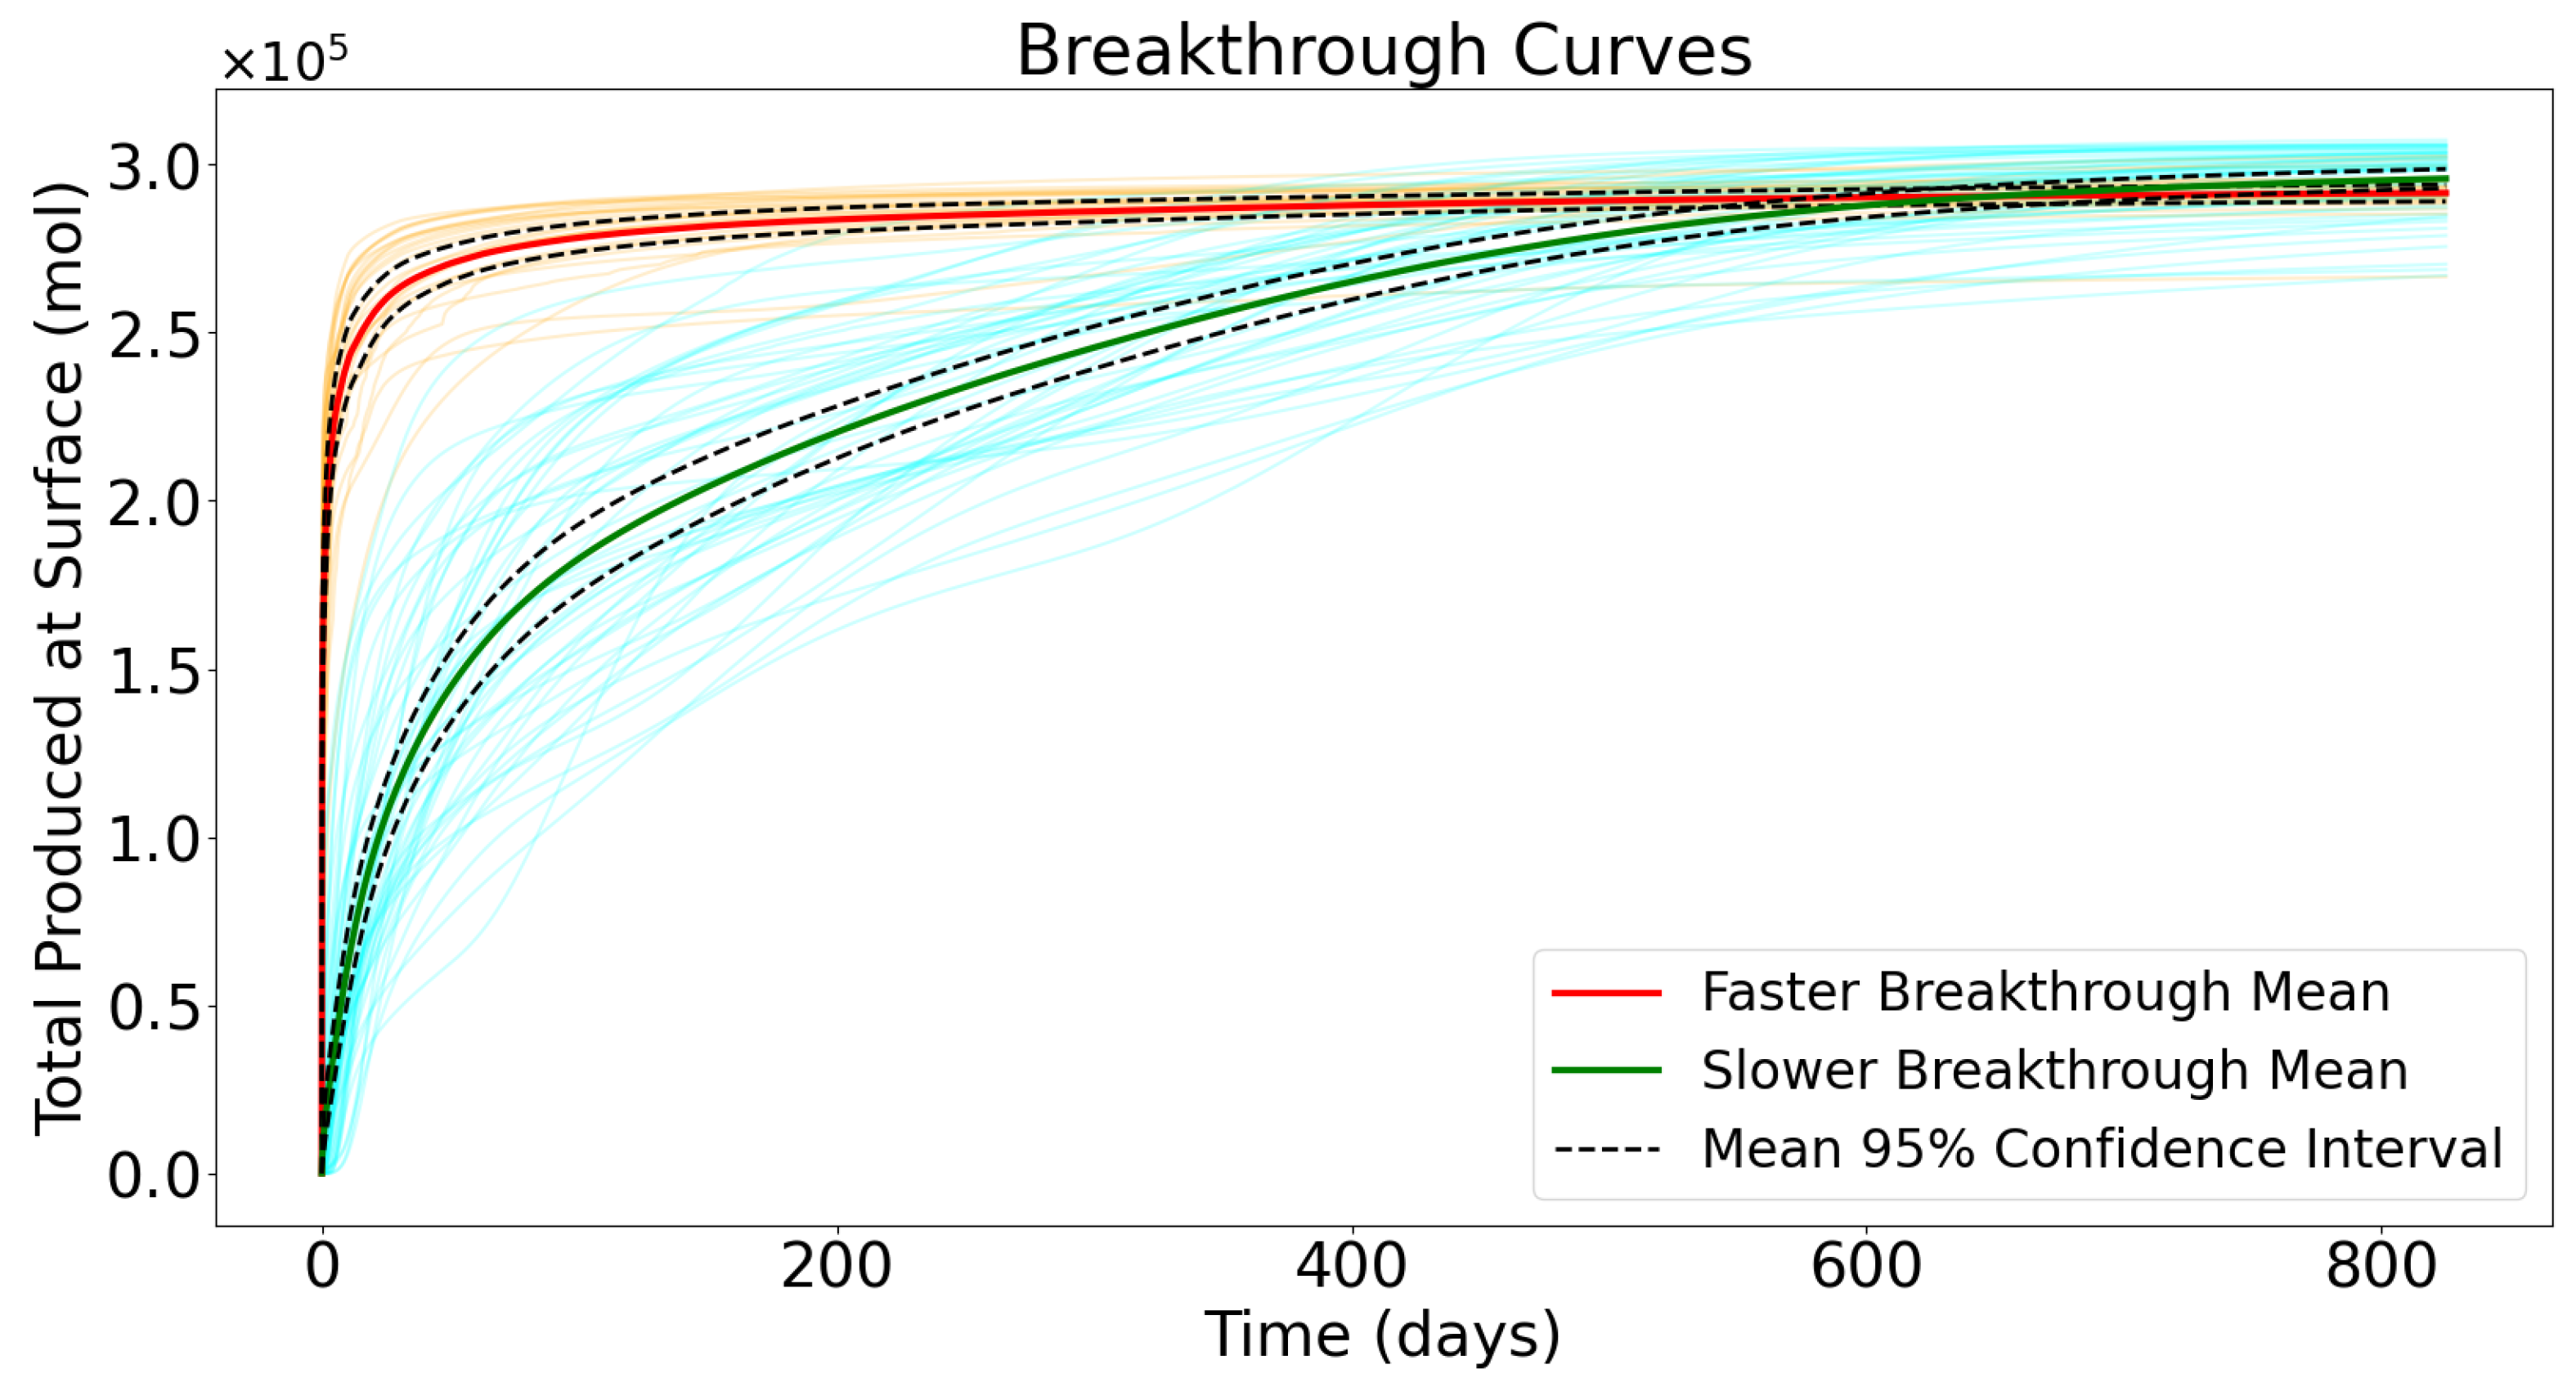
We see two distinct sets of breakthrough curves following an underground explosion when a fracture network is present. When the explosion creates a connected pathway between fractures to the surface, gas can reach the surface with only a small delay following the underground explosion. If a pathway to the surface is not created, gas transport is slower and highly variable with the timing reflecting the specific configuration of damage in the subsurface. The partitioning of results has a few implications for containment and detection. First, the existence of early time breakthrough curves indicates a potential way that containment could fail for an explosive buried below the estimated containment depth. Since fractures are weak planes in the surface, stresses are accommodated in more complicated ways when they are present in simulations. This allows for damaged areas to form at much larger distances from the source than would be possible if fractures were not present.
When the yield is halved in size, we see a considerable decrease in the number of early time breakthrough simulations. With the reduction in energy of the source, the shockwave is not as strong at farther distances from the cavity. This means that most fracture configurations that produced a damage pathway to the surface with a higher yield do not do so when the yield is reduced. However, there are still some simulations that create a damage pathway to the surface even with the considerable reduction in the yield. This indicates that reducing the yield at a given depth only reduces the probability of containment failure.
The late time breakthrough set would be candidates for later detection, but the high variability indicates that precise detection window estimates will likely be difficult. As mentioned before, the simulated breakthrough curves are for a chemical explosive that will have persistent high gas pressure in the subsurface due to the creation of non compressible gases, and a UNE would have a rapidly decaying cavity pressure, with late time seepage being driven by barometric pumping. While the processes driving the tracer to the surface on longer timescales are different, both are heavily influenced by the characteristics of the subsurface. The simulations indicate that there is a large variability in the subsurface characteristics after an underground explosion, which will have a considerable effect on the movement of gases regardless of whether the gas movement is driven primarily by barometric pumping or high pressures in the subsurface. Prior work into late time seepage [
5,
8] has provided estimates of detection windows accounting for sensitivity to hydraulic properties and atmospheric forcing. While this work does not account for those uncertainties, and the prior work does not account for fracture network uncertainty, in practice these uncertainties will be compounded. Since it is likely that most test sites include some amount of preexisting fractured rock, the addition of fracture networks to models are essential for accurate results, but model improvements and better constraints on existing fracture networks will be needed to provide precise predictions.
The fact that there is no clear relationship between fracture intensity ( value) and the type of breakthrough that occurs is surprising. One might have expected that more fractures would mean more chances for the shockwave to create a linked pathway to the surface. The fact that this does not occur indicates that interactions between the shock wave and the fractures are complicated, and a more detailed analysis of the individual networks will be required to determine if other factors such as orientation and proximity have more influence on the damage and subsequent type of breakthrough. In terms of making actual predictions, this apparent insensitivity could be useful. If the breakthrough type has limited sensitivity to the fracture intensity, then predictions could use an arbitrary value if the information is not known. Since sparser fracture networks are considerably faster to generate and mesh in our workflow, this could improve modeling efficiency as well. However, further modeling will be required to determine if this feature is unique to our set of fracture networks, or if this is true in general.
Model Limitations
There are several disadvantages of the approach that should be considered. First, the simulation is axi-symmetric. While this approach accurately represents the explosion and has inherent run time advantages, it does not preserve the geometry of fractures. A fracture in an axi-symmetric simulation is a conic surface section instead of a planar feature, and is not a physically realistic representation in most settings [
19,
23]. Ref. [
5] simulated damage using an axi-symmetric model in a medium with stochastic material strength. This produced axi-symmetric fractures in the domain that were considered a reasonable approximation of fracturing in 3D. A model using a 3D domain [
8] used a generalized dual continuum model to represent fractures in the domain at a low resolution. This model only simulated flow and transport through the domain, and damaged rock in the domain was prescribed to fixed simplified regions. Neither of these works discuss how fractures could be incorporated into the domain prior to the damage simulation. Our work makes an attempt at addressing this issue, and while the interpretation of the results are limited due to the geometry of the preexisting fractures in the domain, this approach is the best way to incorporate important physics into axi-symmetric models currently. This will likely be the case until 3D models with the capability of modeling both rock damage and gas flow are developed and studies can be done to better map between a 3D domain with planar fractures and axi-symmetric models. However, in 3D, planar fractures are not immune to the damage behavior shown in this study. In a true 3D modeling framework there will be differences in the exact geometry of the damage pathways that are created, but they will still be variable depending on the specific fracture network and will likely still propagate to the surface in specific cases. Ultimately, the significant variability exhibited in the breakthrough curves from the set of geometries that are represented in axi-symmetric models suggests that incorporation of fractures into high-fidelity models is important for quantifying uncertainty.
Second, we do not account for many other relevant processes covered in other publications such as detailed chemistry [
37,
38], multiphase flow [
4,
39], thermal effects [
4,
40], and atmospheric conditions [
4,
7]. These processes are needed to make accurate predictions of breakthroughs following underground explosions, are available within the described modeling framework, and will be included in the future. However, since the focus of this work is on the interaction of fractures with the explosive and the subsequent gas transport, the addition of these processes amount to assumptions about the system that are not likely to provide additional insight into the specific process that we are interested in.
5. Conclusions
We have developed a sequentially coupled model to explore the effects of fracture networks on gas transport following the detonation of an underground chemical explosive. The model framework is simple enough to allow for testing multiple fracture configurations quickly, while still accounting for many of the key processes associated with rock damage and fast pressure driven gas flow.
Damage patterns and subsequent gas transport were found to be very sensitive to the fracture network sample, and a breakthrough could be partitioned into two distinct sets based on whether the breakthrough occurred quickly after the detonation, or if gases moved slower through the subsurface. When the explosive yield is halved, we observed a considerable reduction in the number of early time breakthrough cases, but specific fracture configurations still allowed for early time breakthrough. Gas transport in simulations with slower gas transport are highly variable. These results indicate that fracture networks are a key component of models for accurately predicting breakthrough times following underground explosions. The type of release following the explosion is not clearly related to fracture intensity () in our simulations, indicating that modeling efforts could be simplified in some cases.
With a simplified modeling framework, there are many improvements that could be made in further work. First, modeling in a non axi-symmetric 3D framework is required to improve the representation of fractures in the subsurface, which in turn would improve estimates of gas transport through the subsurface. Second, a more detailed analysis of the fracture systems in relation to the breakthrough curves is required to understand what makes certain fracture networks more favorable to different types of breakthrough. Third, considerably more work can be done to characterize changes in breakthrough curves with respect to fracture network probability distributions for features such as fracture sizes and orientations.


 ,
, 


