Advancing TBM Performance: Integrating Shield Friction Analysis and Machine Learning in Geotechnical Engineering


Abstract
:1. Introduction
2. Determination of the Friction Force
- -
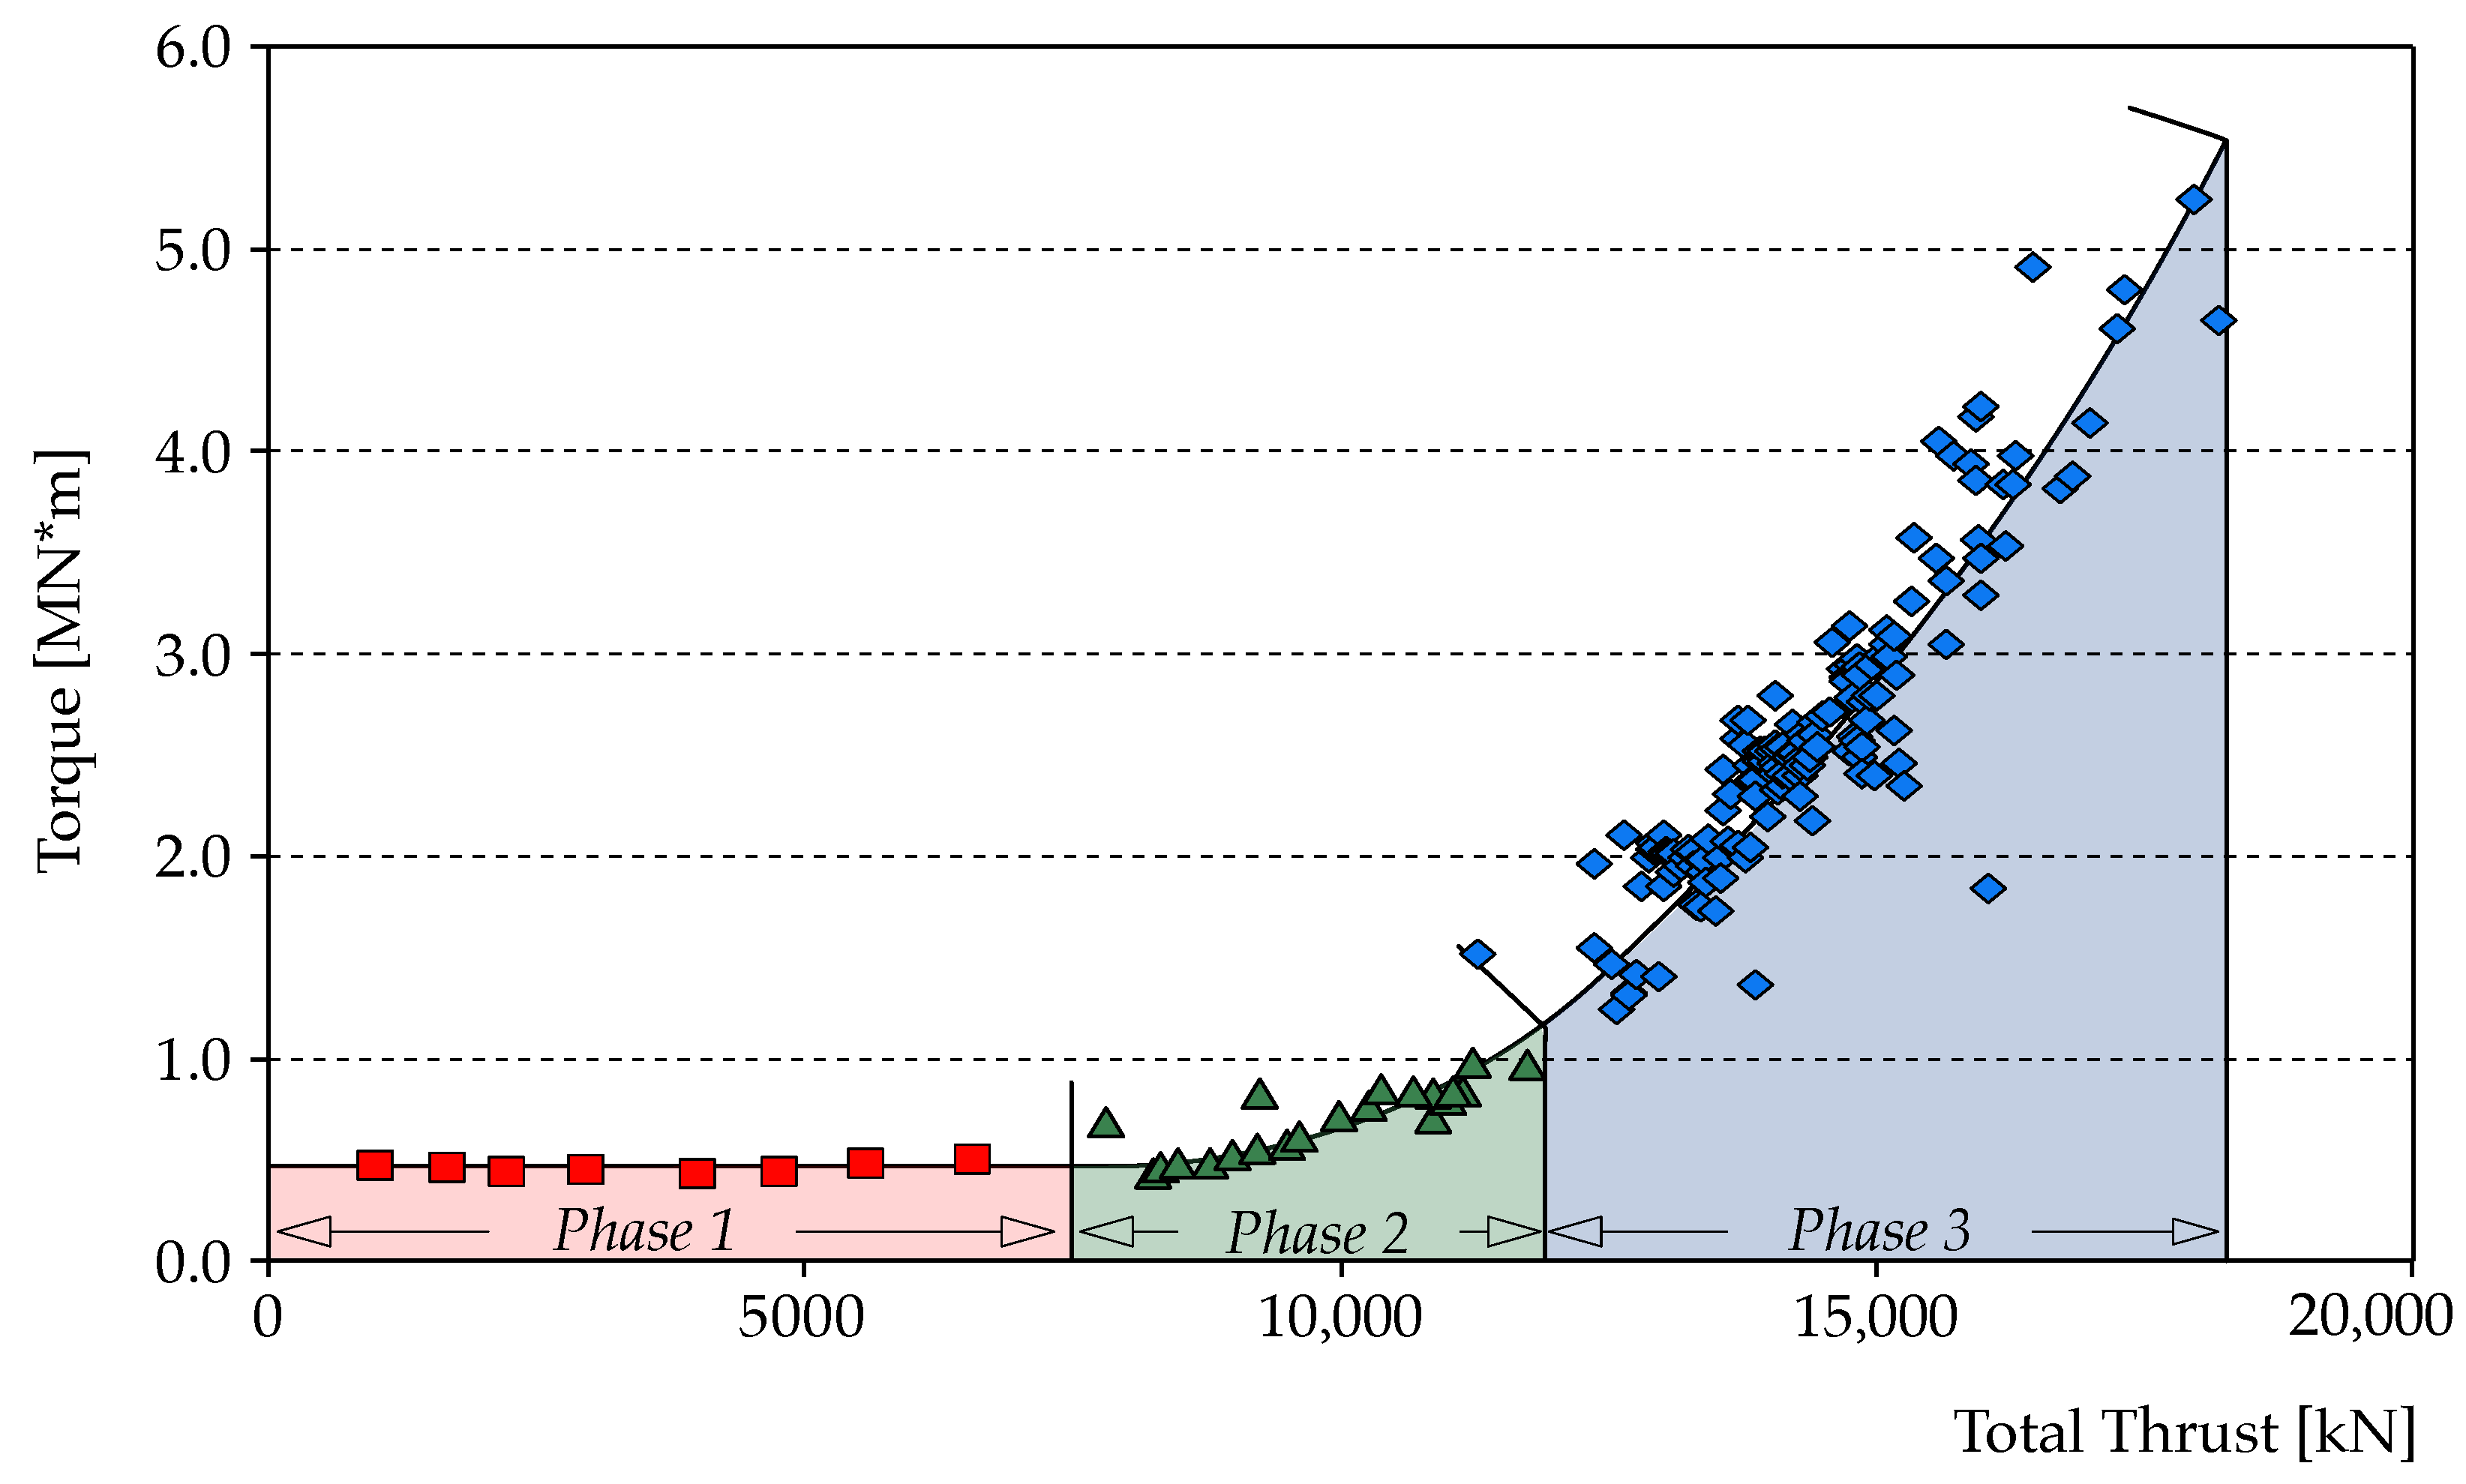
- Within a certain range, the torque remains constant, denoted by a red marker in the Figure.
- -
- A sharp increase in torque is observed beyond a specific threshold.
- -
- Up to a torque level of approximately 1 MN×m, this increase is largely linear, indicated by a green marker.
- -
- Beyond this point, the rate of increase intensifies, reaching a steeper gradient until an upper limit is attained as marked in blue.
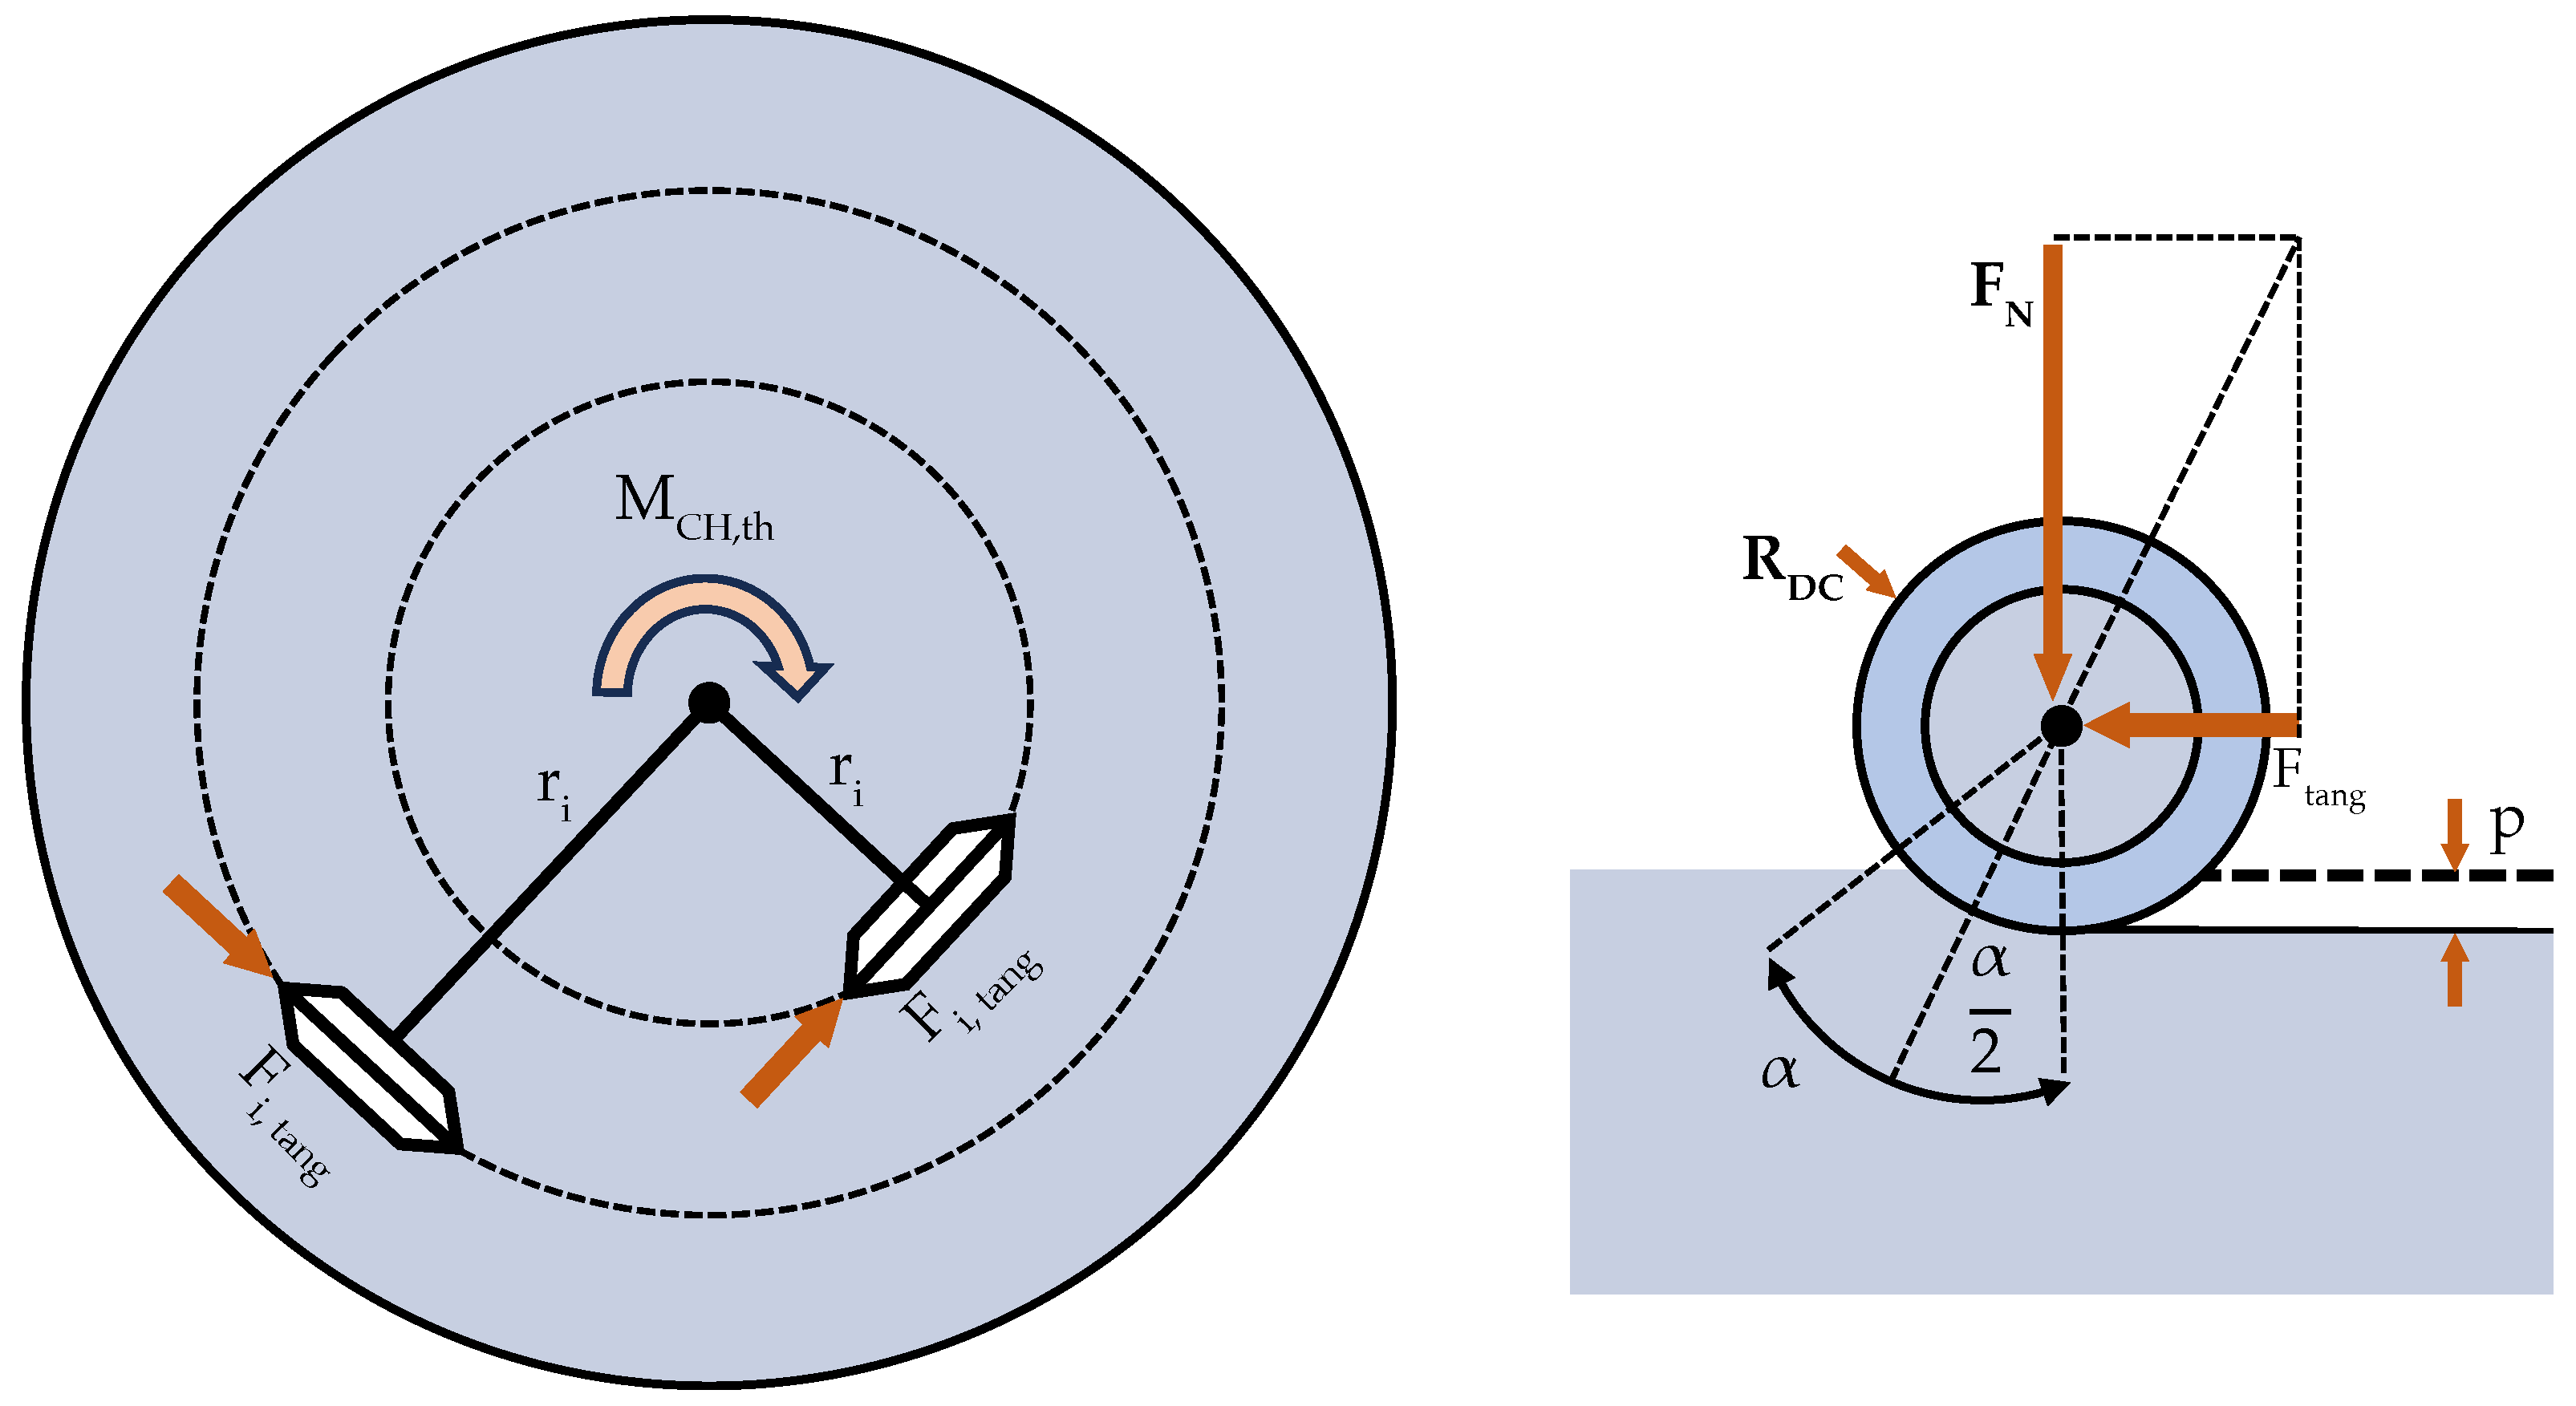
- : Tangential force, also known as rolling force.
- T: Measured torque at the cutterhead.
- : Additional torque.
- : Number of cutters.
- : Distance to the center of the cutterhead.

- : Cutting angle;
- : Radius of the cutter;
- p: Penetration depth.
- : Normal force.
- : Theoretical advance force.

3. The Ylvie Model
3.1. TBM Data Recording and Pre-Processing
- TBM Station Position [m];
- Date and Time of Recording [yyyy:mm:dd] and [hh:mm:ss];
- Stroke Number [-];
- Penetration Rate [mm/rev];
- Measured Thrust Force (TF) [kN];
- Torque at the Drilling Head [MN×m];
- Drilling Head Speed [rpm].
3.2. Computational Methodology for Friction Loss Analysis
- Idle Torque Calculation: Aligning with Wild’s approach to the TPG, the Ylvie model segments each TBM stroke, starting with analyzing the idle torque phase. This process focuses on identifying phases where the torque levels remain constant despite increasing TF, indicative of the idle stroke. The period where the cutter head is not engaged in an active operation relates to the baseline torque [13]. The Ylvie model employs advanced machine learning algorithms to precisely identify these phases, even in conditions of poor data quality. This process utilizes a sophisticated, iterative approach similar to curve-fitting algorithms. The model effectively identifies the idle torque phase as follows:
- (a)
- The model begins with a data cleaning phase, initially excluding all instances where either the penetration value or the TF is zero, indicating machine inactivity. It further refines the dataset by eliminating outliers, employing z-scores for outlier detection, given the data’s normal distribution. Data points with z-scores above three are removed, ensuring the analysis focuses solely on meaningful instances with positive TF, thereby enhancing the results’ accuracy and relevance.
- (b)
- For a series of strokes denoted by j, the model defines an iterative process for each stroke with iterations indexed by i, setting the step interval i to a constant value of five. In each iteration i for stroke j, an initial TF threshold is determined from the maximum value in the TF vector . The dataset is then iteratively analyzed from down to 0, reducing the threshold in predefined step sizes. In every iteration i and stroke j, the dataset is segmented into subsets based on the TF range . A linear relationship between TF (x) and torque (y) is assumed within each subset , modeled by , where and represent the slope and intercept, respectively. This methodical approach facilitates a thorough analysis across all strokes, identifying linear relationships within each segmented TF data subset.
- (c)
- In the curve fitting phase, parameters c and d are optimized within defined, physically based constraints to ensure the derived values are feasible and applicable. The parameter d is restricted to positive values but capped below the maximum allowable torque for a stroke, represented as , mirroring the system’s physical constraints. This ensures d signifies a baseline torque within the system’s operational limits. The parameter c, defining the slope between TF and torque, is confined to a range that eliminates negative values and includes an upper limit to mitigate excessive torque sensitivity to TF changes, with . These constraints ensure the curve fitting yields realistic and actionable insights aligned with the system’s physical properties and operational conditions.
- (d)
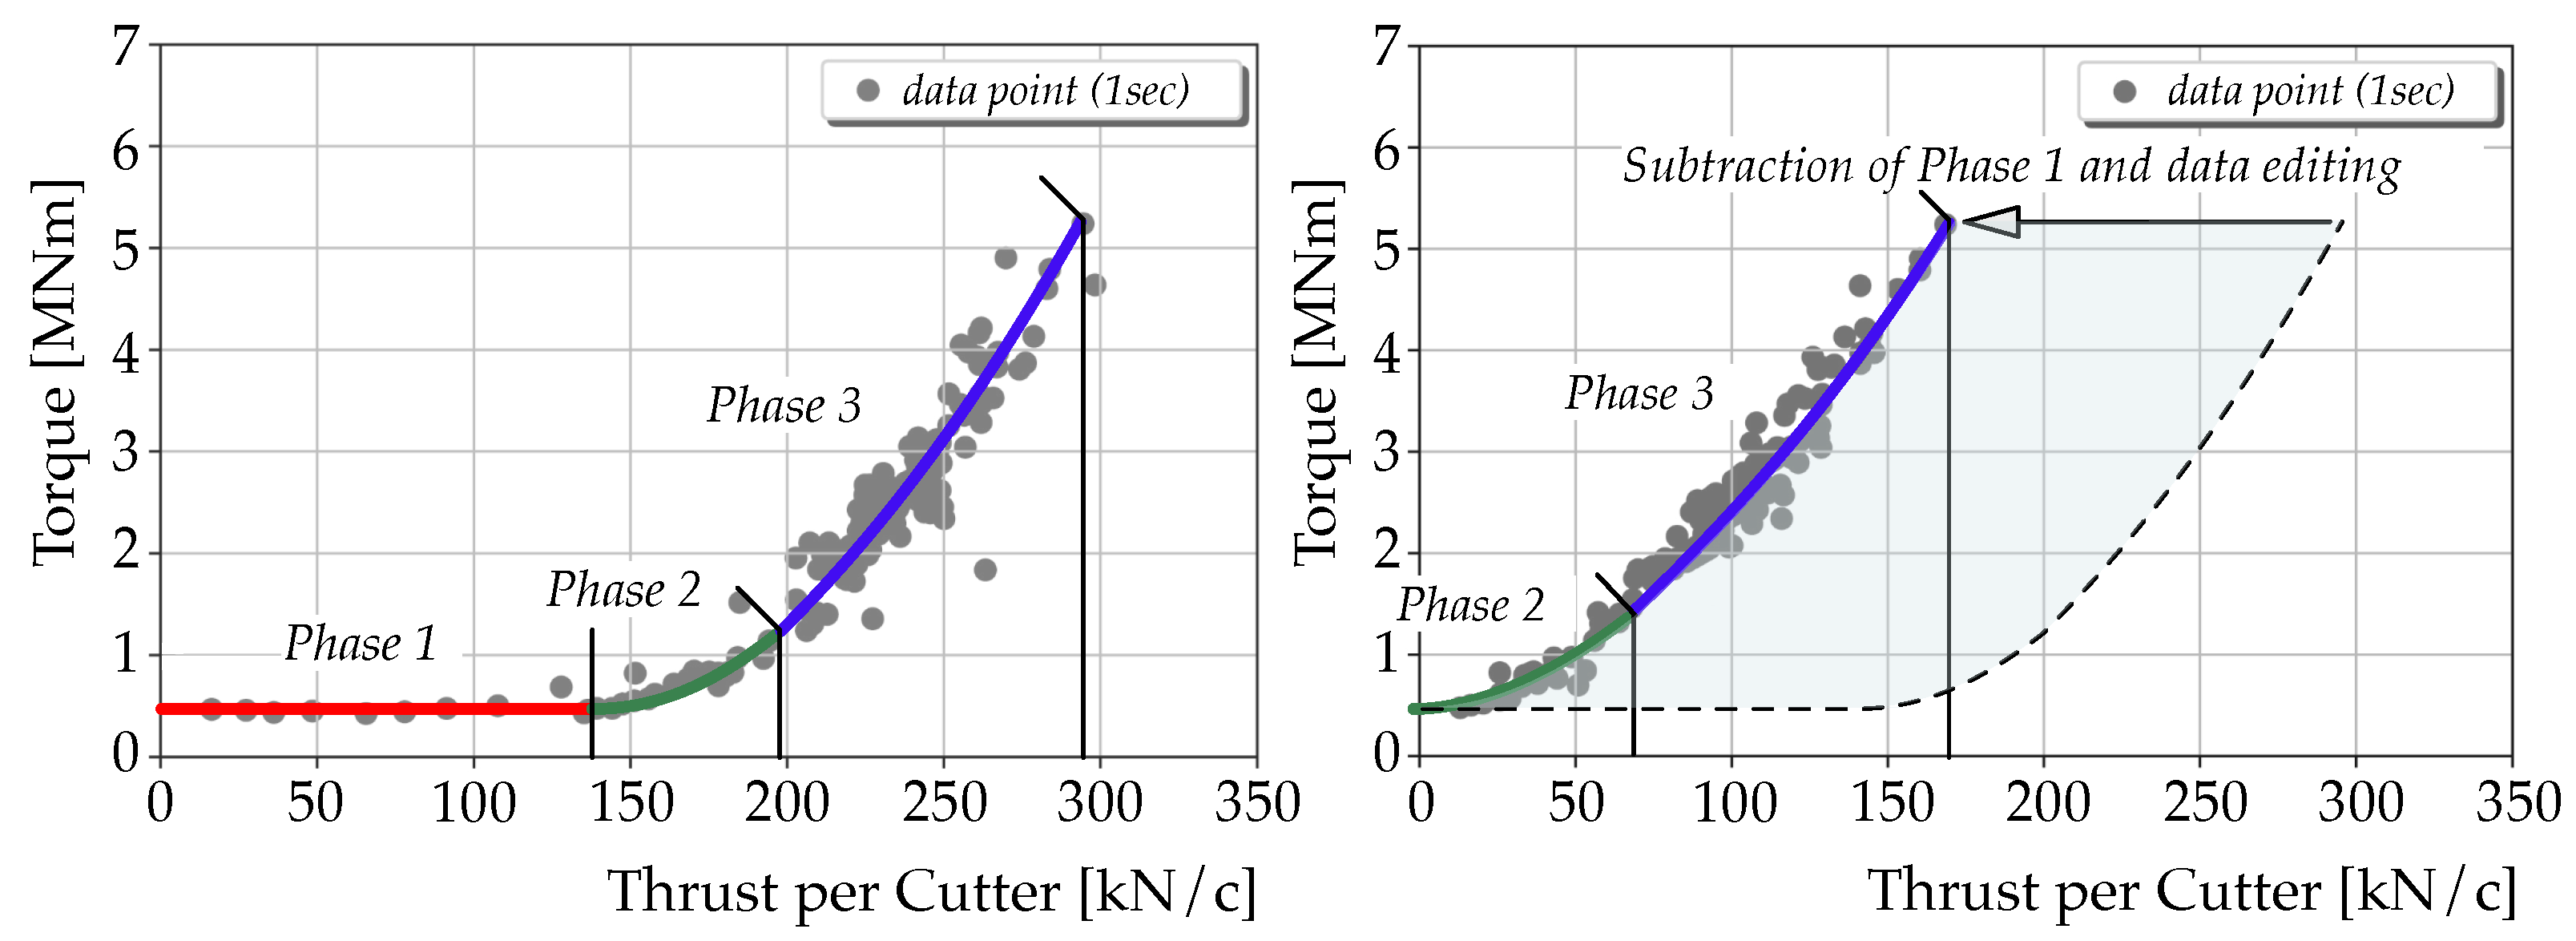
- The threshold is dynamically adjusted contingent upon the slope c’s sign and the adequacy of data points under the current threshold. Should c manifest as positive or the dataset beneath the current threshold be deemed sufficient, is diminished to enhance the granularity of the analysis. In contrast, if c turns negative or the dataset becomes scant, is incremented. This iterative calibration continues until a stable mean torque value, denoted as , is determined, epitomizing the idle torque characteristic of the TBM stroke. This corresponds to “Phase 1” as depicted in Figure 4, representing the initial phase of the TBM operation where the cutterhead is not engaged in excavation.
- (e)
- Upon the completion of the analysis, for strokes identified with data of insufficient quality that hinder accurate idle torque estimation, the model adopts interpolation techniques. It draws on idle torque readings from adjacent strokes, whether preceding or following. This approach ensures the maintenance of continuity and consistency in the idle torque dataset, thereby strengthening the overall robustness of the friction loss analysis.
By adjusting to variations in data quality and employing interpolation when necessary, the Ylvie model ensures that its analysis remains robust and reflective of actual operational conditions, even in the face of data inconsistencies. - Frictional Force Calculation: The analysis progresses by approximating the active boring phase, denoted as “Phase 2” in Figure 4, subsequent to determining the idle torque . This phase is characterized by a non-linear relationship between TF and torque, indicating engagement with the material. Data redistribution is an important step in the analysis, designed to neutralize the impact of the time factor. This is essential because “Phase 1” and “Phase 2” of the TBM operation are notably brief compared to “Phase 3” (compare Figure 4). The latter phase typically generates a disproportionately larger number of data points, which could potentially skew the approximation of “Phase 2”. To address this, the dataset is segmented based on TF intervals, initiated at and incremented by a fixed interval length . For each interval, the mean torque value is calculated, thus redistributing the data to achieve a more balanced representation that accurately reflects the behavior during the active boring phase. This process selectively excludes data points where torque is below . A quadratic function is subsequently fitted to this refined dataset to encapsulate the nonlinear increase in torque as a function of TF, characteristic of “Phase 2”. The FF, , is then calculated by solving the equation . This equation seeks the TF value at which the active boring phase’s torque () equals the previously established idle torque ().
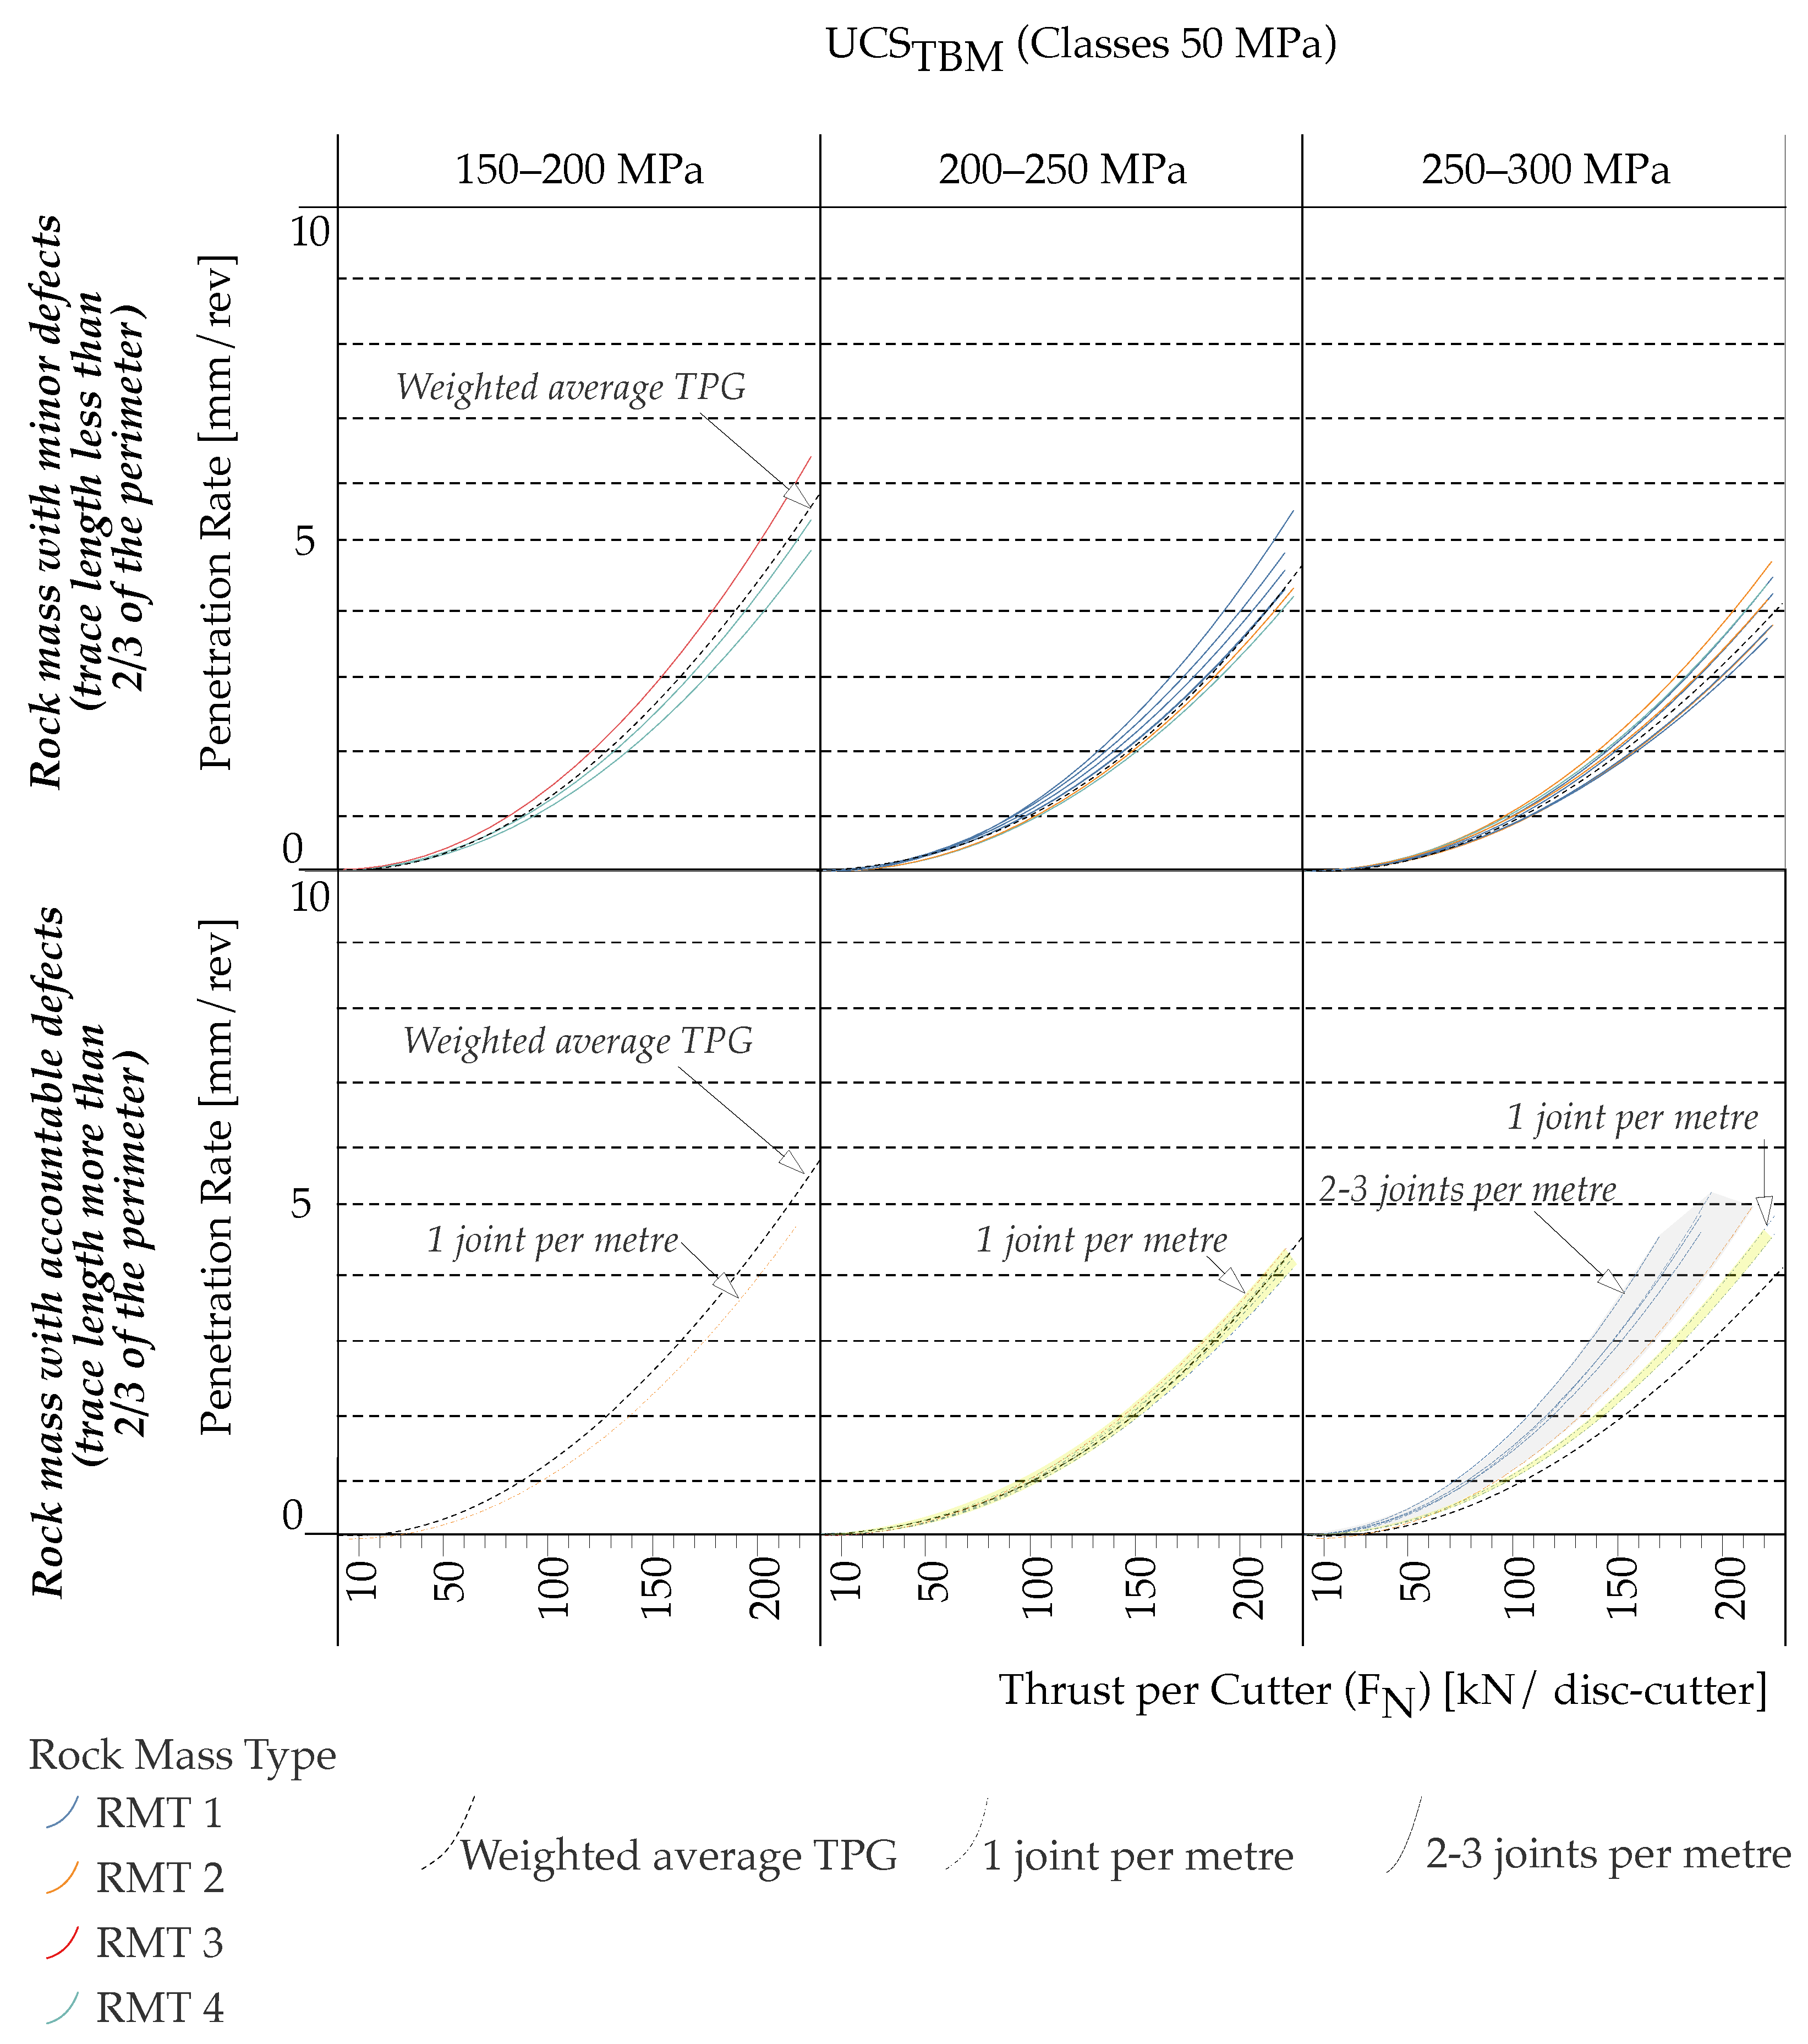
- TPG generation: For the construction of the matrix illustrated in Section 4.2 and Figure 5, characterizing strokes based on TPGs, the original stroke data are adjusted by subtracting the calculated FF. This shift from torque to penetration analysis essentially aims at approximating “Phase 3”, facilitating the generation of TPGs (compare Figure 4). To achieve an optimal fit to the equation , a second round of data redistribution is performed, similar to the procedure described earlier. This step ensures a balanced dataset, crucial for accurately approximating the data points corresponding to this phase.
4. Applications
4.1. Torque Factor
| = normal force; | |
| = measured thrust force; | |
| 3500 | = friction force measured with push tests; |
| 77 | = number of cutters. |
| = tangential force. |
| = theoretical cutterhead torque; | |
| = torque caused by inner friction. |
| = measured cutterhead torque. |
4.2. Enhanced TPG Matrix Analysis through the Ylvie Model

5. Model Validation and Comparative Analysis
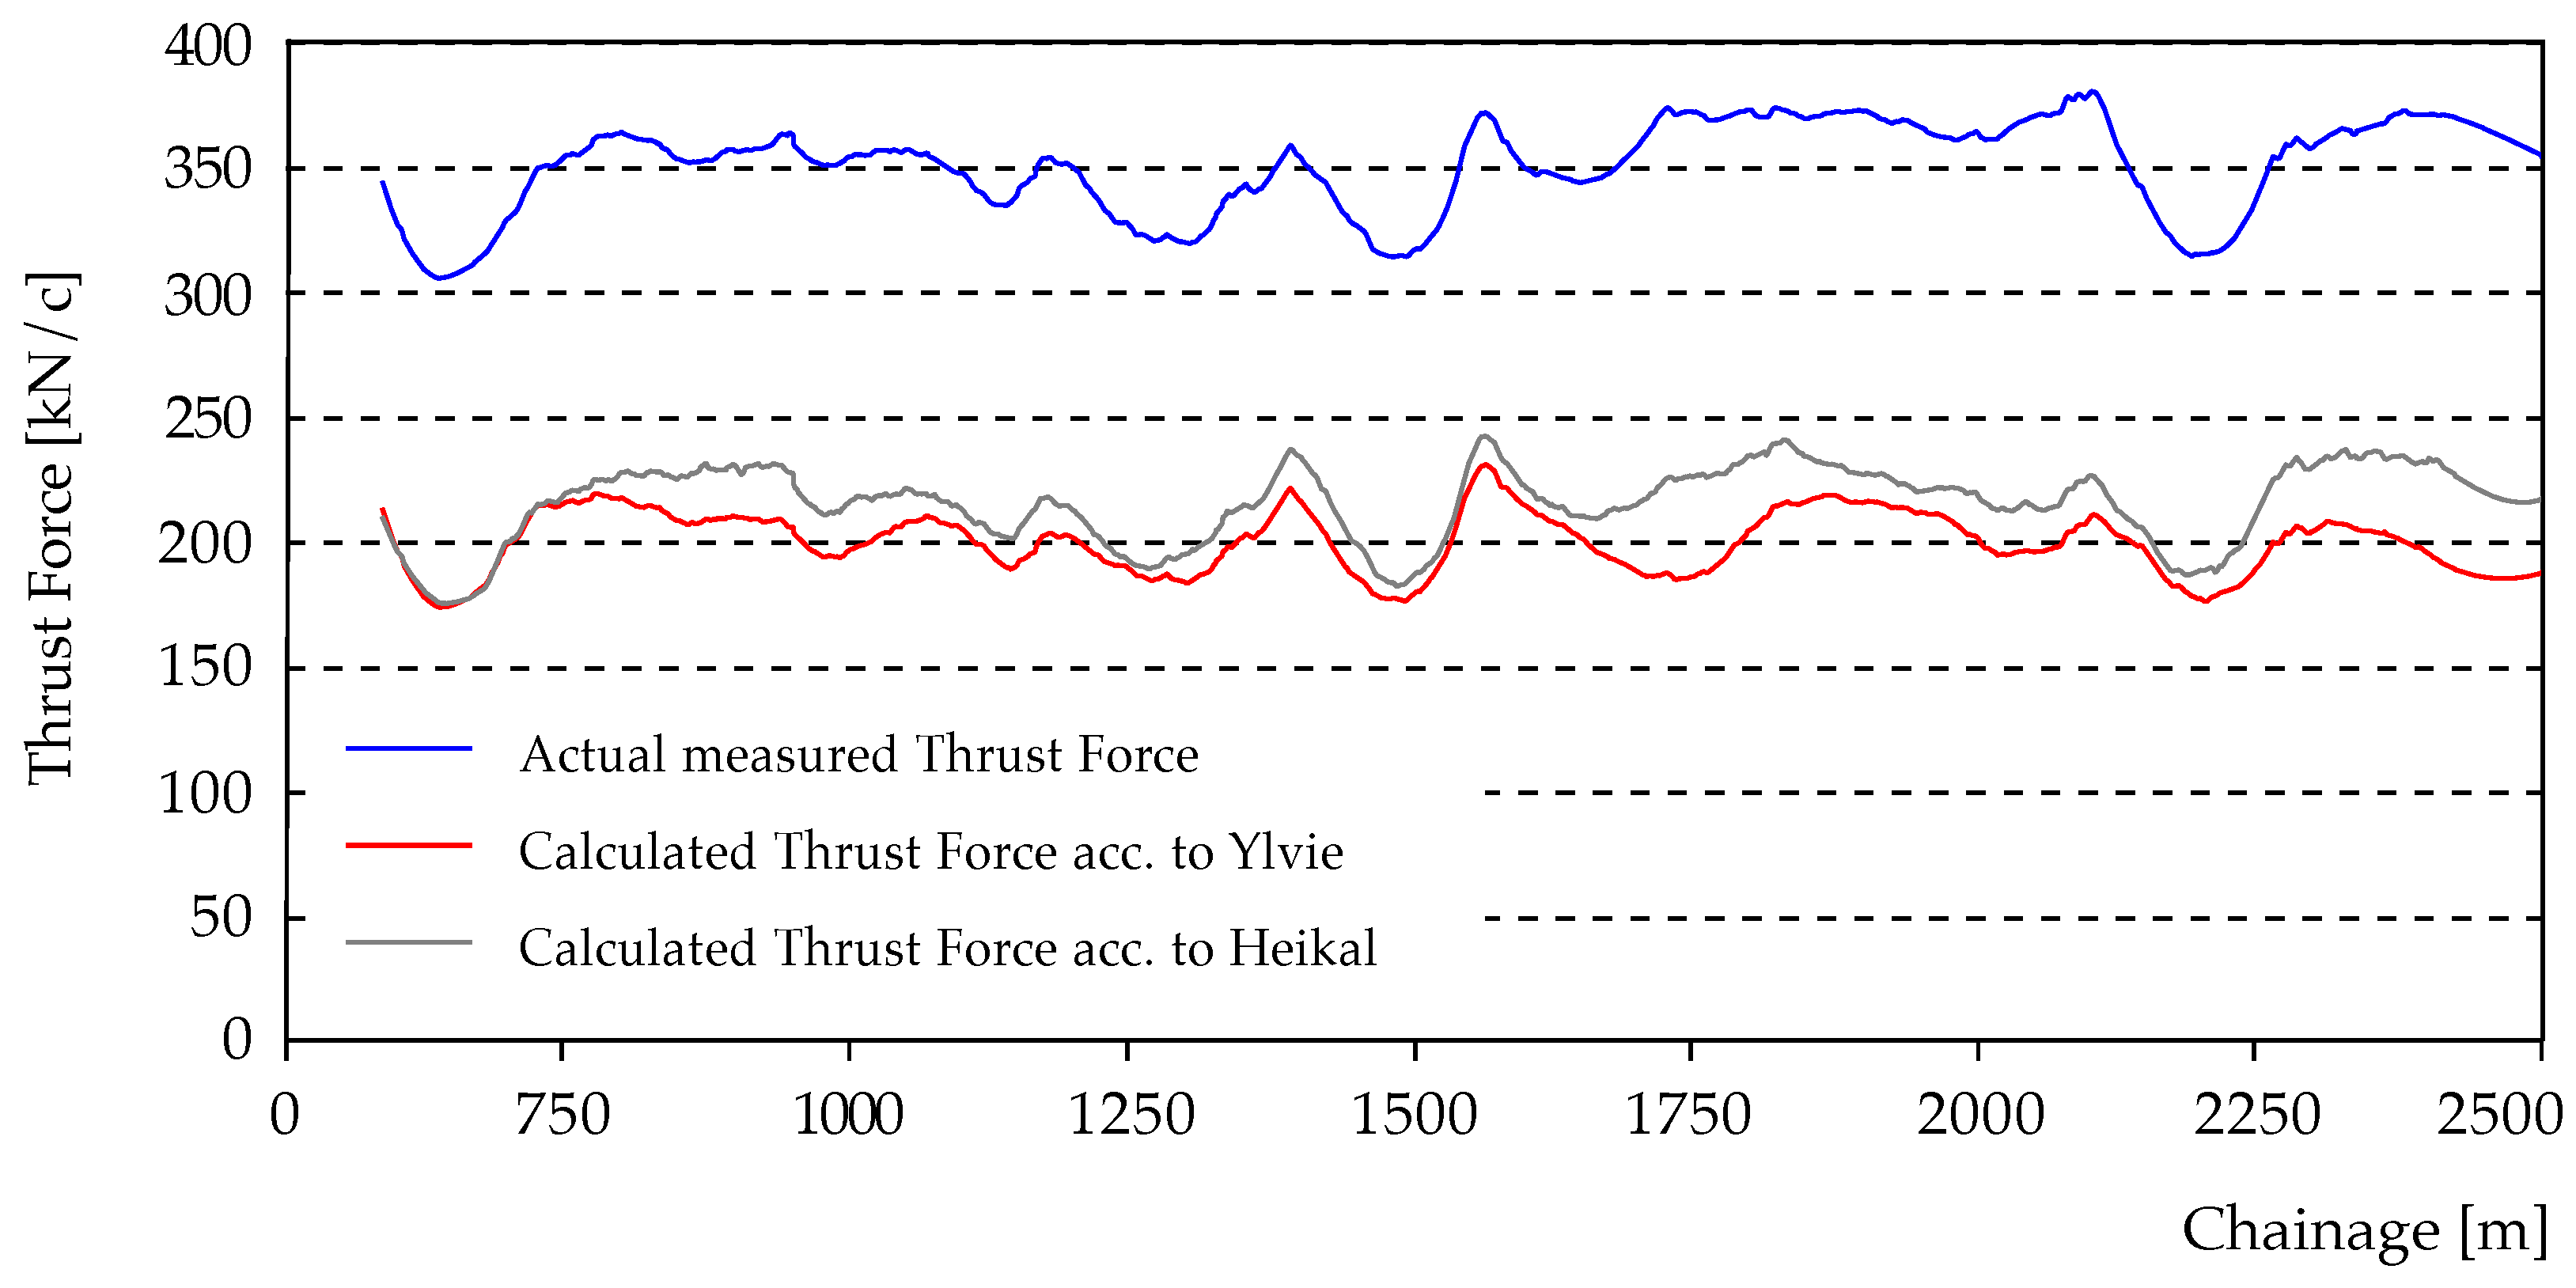
5.1. Friction Force
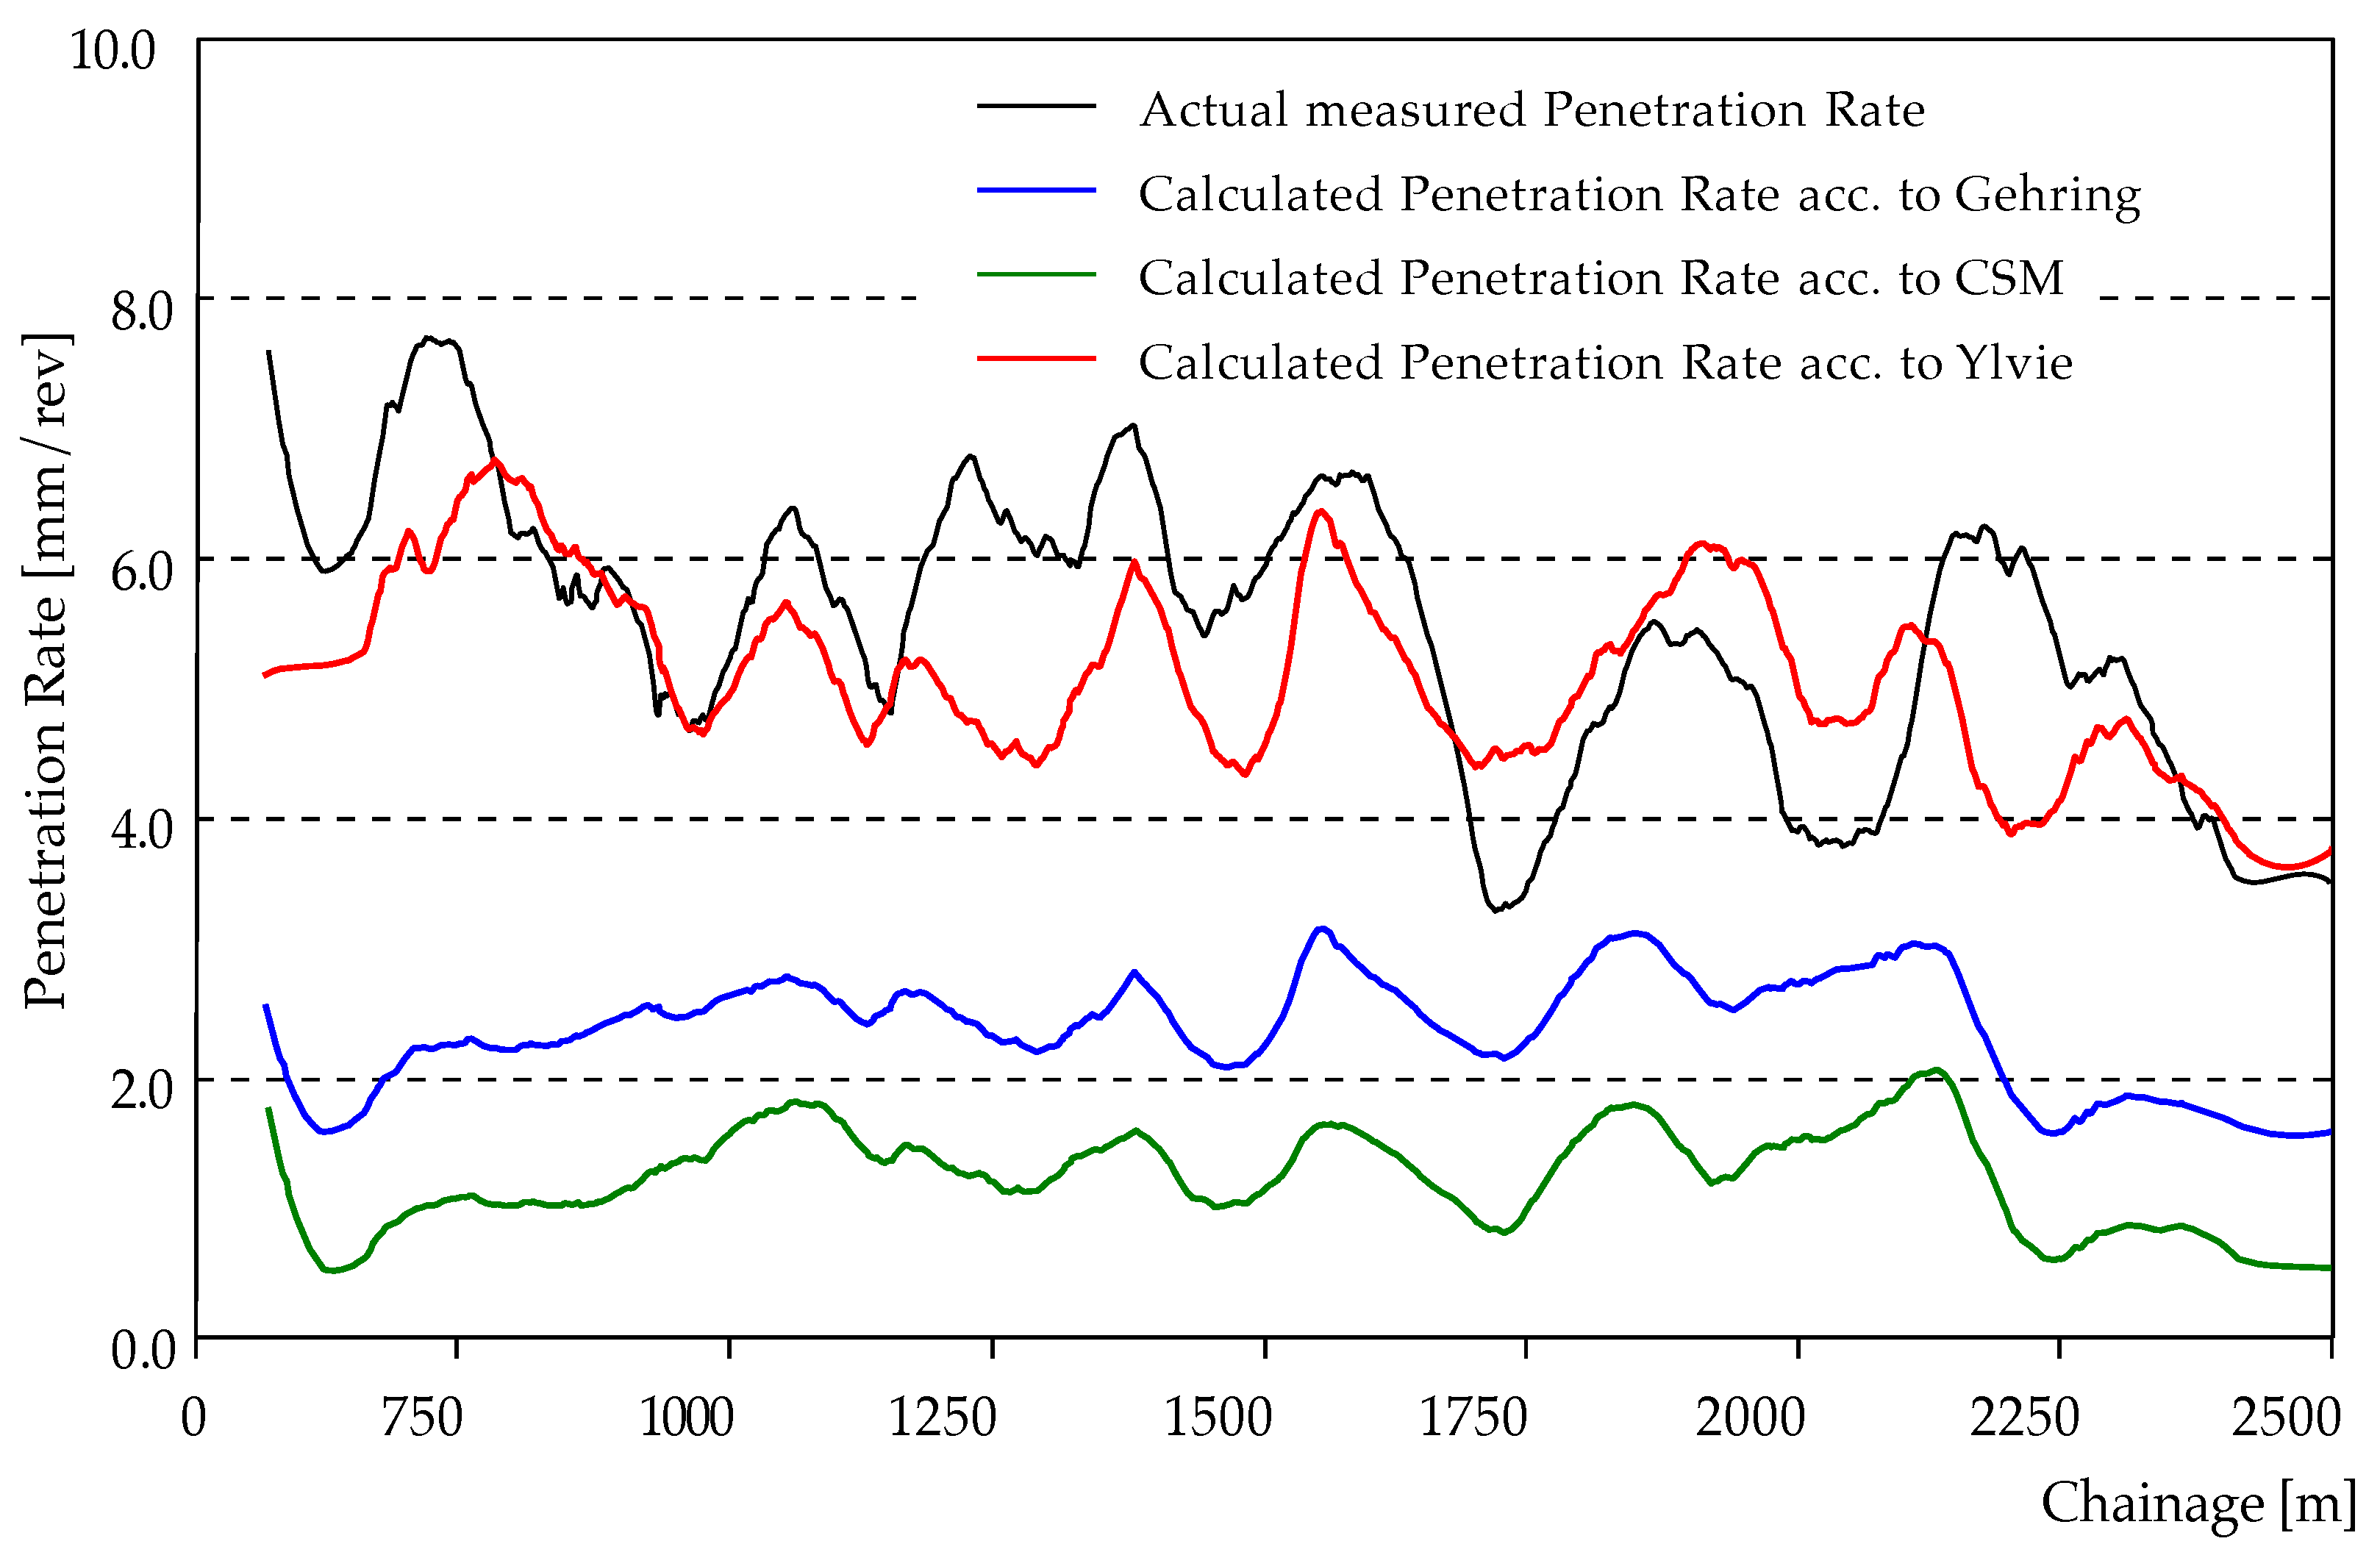
5.2. Penetration Prediction

6. Discussion
6.1. Limitations
6.2. Future Research
Author Contributions
Funding
Data Availability Statement
Conflicts of Interest
Abbreviations
| AI | Artificial Intelligence |
| CSM | Colorado School of Mines |
| FF | Frictional Force |
| RMT | Rock Mass Type |
| TBM | Tunnel Boring Machine |
| TF | Thrust Force |
| TPG | Thrust Penetration Gradient |
| UCS | Uniaxial Compressive Strength |
References
- Macias, F.J. Hard Rock Tunnel Boring: Performance Predictions and Cutter Life Assessments. Ph.D. Thesis, Norwegian University of Science and Technology (NTNU), Trondheim, Norway, 2016. [Google Scholar]
- Rostami, J. Development of a Force Estimation Model for Rock Fragmentation with Disccutters through Theoretical Modeling and Physical Measurement of Crushed Zone Pressure. Ph.D. Thesis, Colorado School of Mines, Golden, CO, USA, 1997. [Google Scholar]
- Gehring, K. Leistungs- und Verschleissprognosen im maschinellen Tunnelbau. Felsbau 1995, 13, 439–448. [Google Scholar]
- Bruland, A. Hard Rock Tunnel Boring. Ph.D. Thesis, Norwegian University of Science and Technology (NTNU), Trondheim, Norway, 1998. [Google Scholar]
- Bergmeister, K.; Reinhold, C. Learning and optimization from the exploratory tunnel—Brenner Base Tunnel. Geomech. Tunn. 2017, 10, 467–476. [Google Scholar] [CrossRef]
- Reinhold, C.; Cordes, T.; Bergmeister, K. Geotechnical rock mass characterisation and classification at the Brenner Base Tunnel project—Methodology and solutions. Geomech. Tunn. 2019, 12, 564–574. [Google Scholar] [CrossRef]
- Radoncic, N.; Hein, M.; Moritz, B. Determination of the system behaviour based on data analysis of a hard rock shield TBM/Analyse der Maschinenparameter zur Erfassung des Systemverhaltens beim Hartgesteins-Schildvortrieb. Geomech. Tunn. 2014, 7, 565–576. [Google Scholar] [CrossRef]
- Erharter, G.; Goliasch, R.; Marcher, T. On the Effect of Shield Friction in Hard Rock TBM Excavation. Rock Mech. Rock Eng. 2023, 56, 3077–3092. [Google Scholar] [CrossRef]
- Ramoni, M.; Anagnostou, G. TBM drives in squeezing ground—Shield-rock interaction. In Building Underground for the Future, Proceedings of the AFTES International Congress, Monte Carlo, Monaco, 6 November 2008; Edition Specifique Limonest; IOP Sciences: Bristol, UK, 2008; pp. 163–172. [Google Scholar]
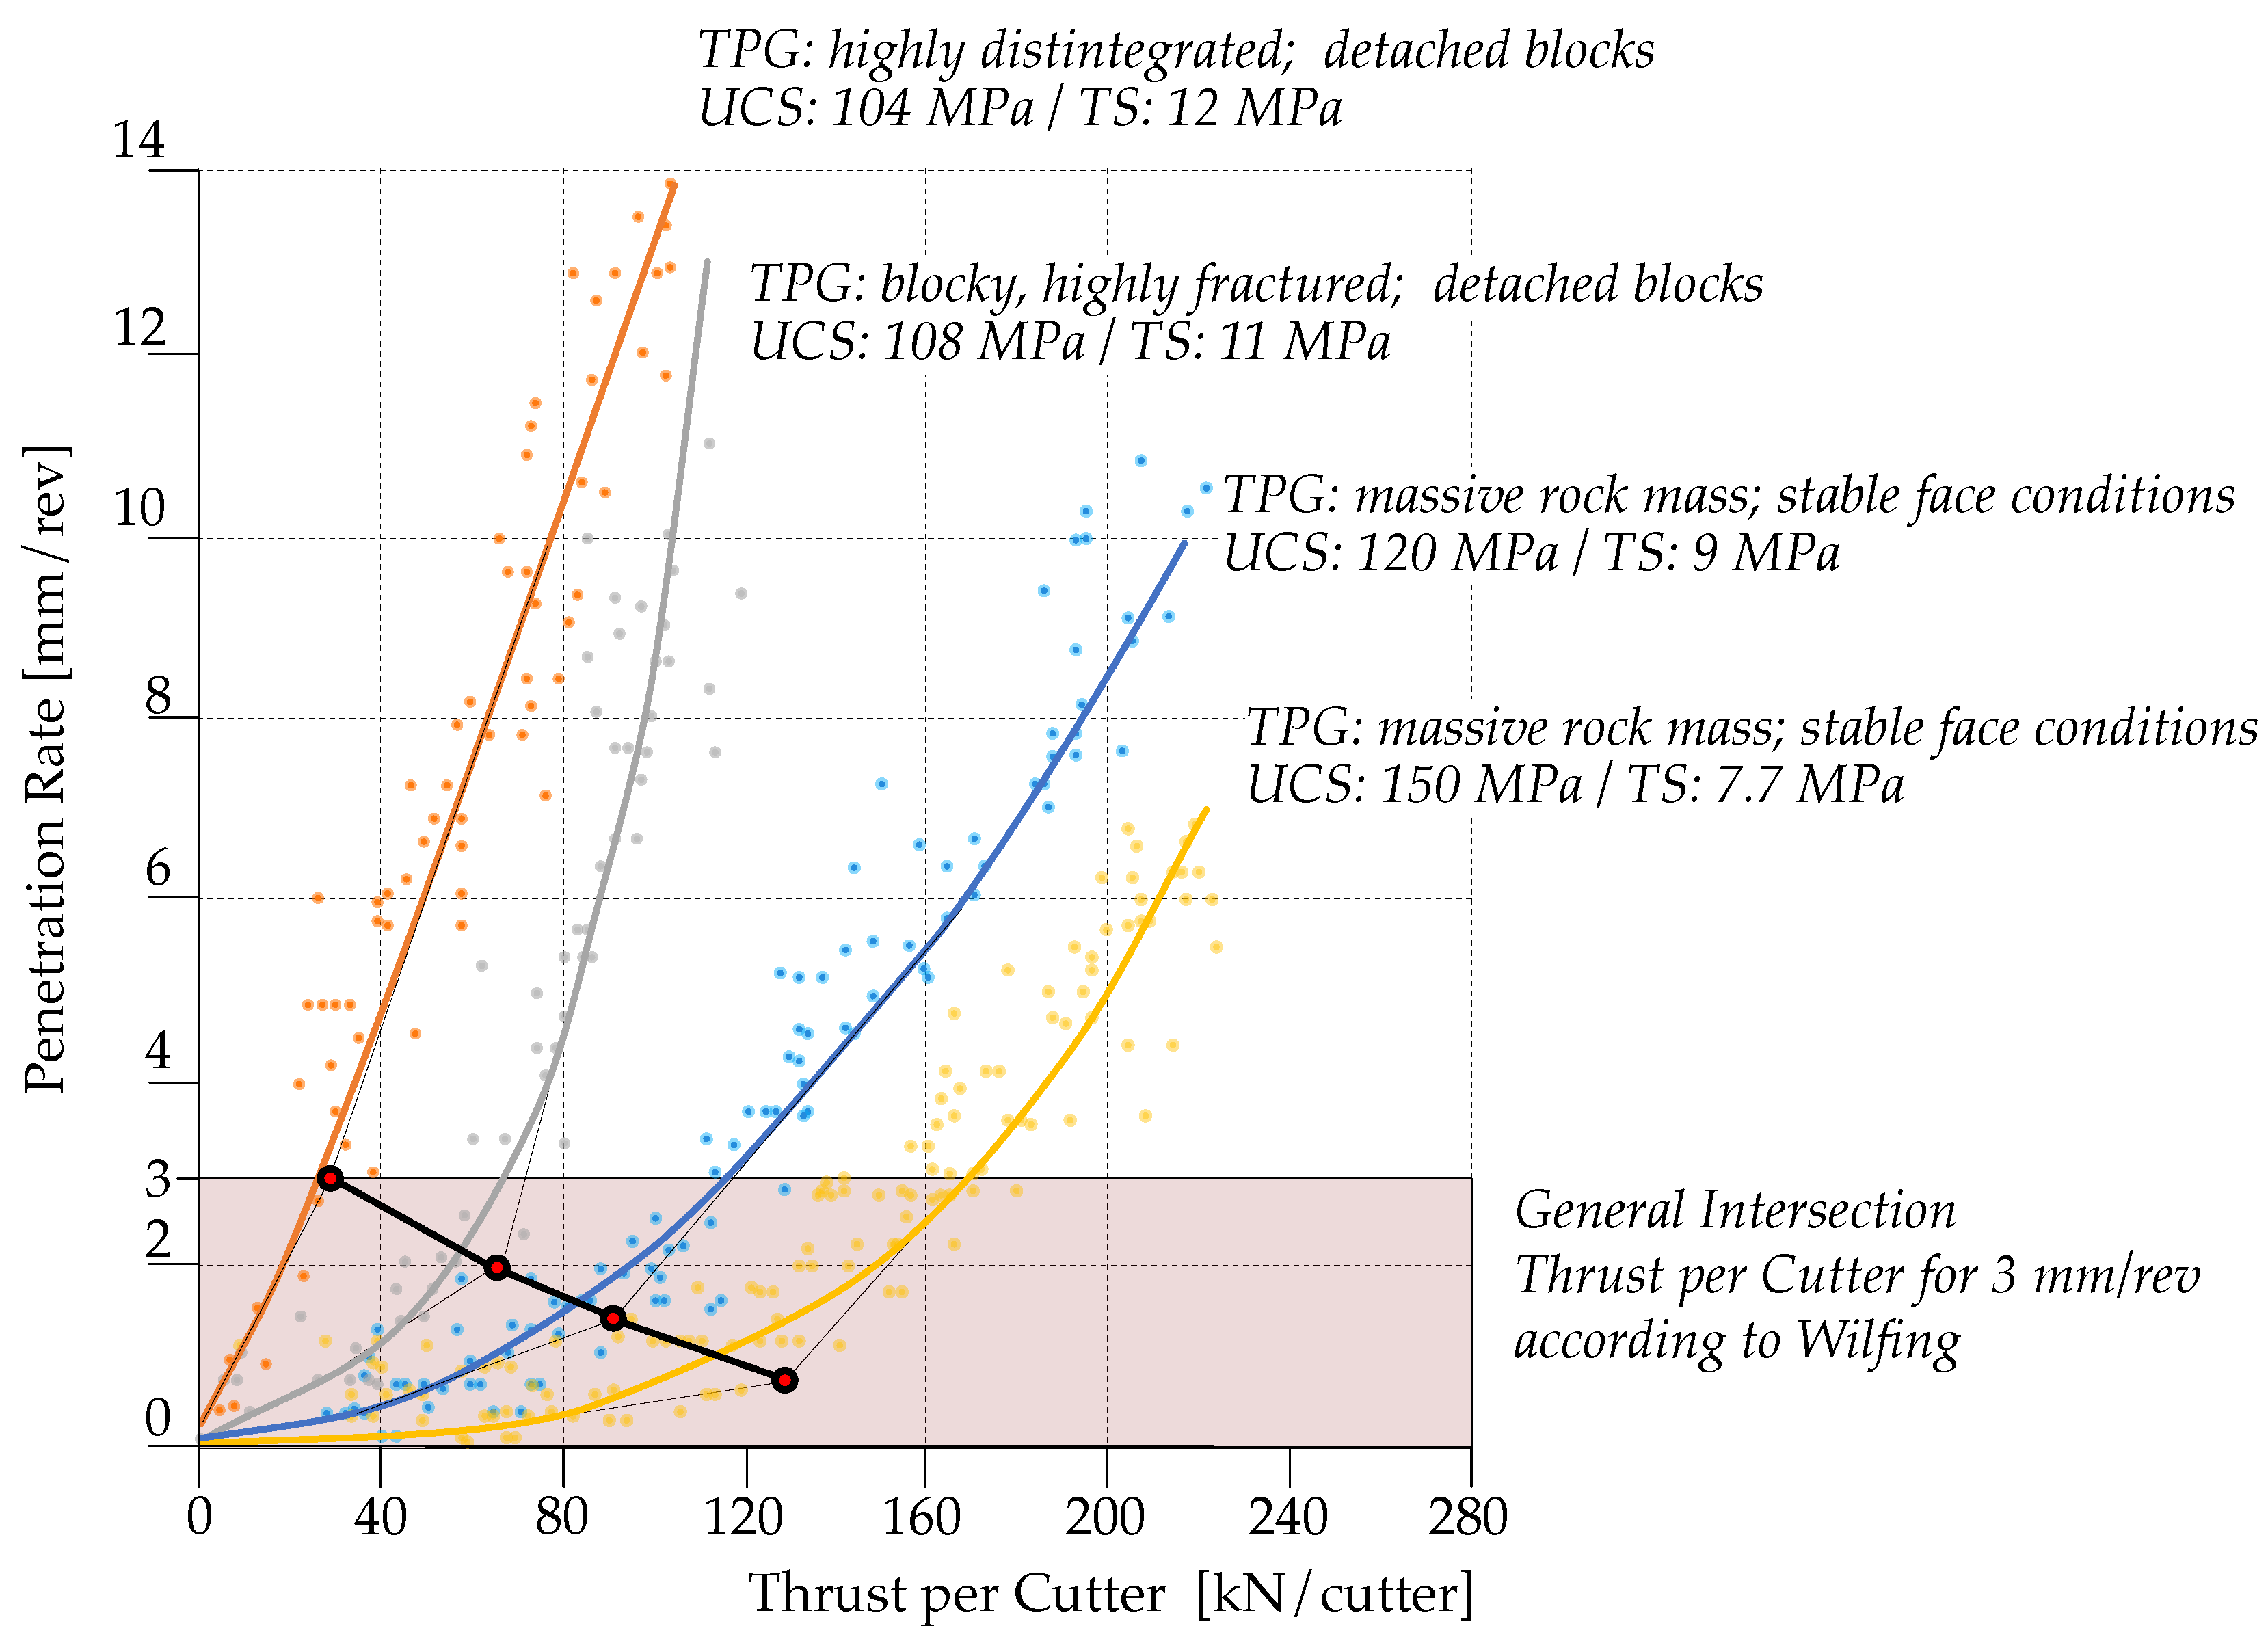
- Wilfing, L.S.F. The Influence of Geotechnical Parameters on Penetration Prediction in TBM Tunneling in Hard Rock. Ph.D. Thesis, Technical University of Munich, Munich, Germany, 2016. [Google Scholar]
- Weh, M.; Amann, F.; Wannenmacher, H. Der Einfluss von Gebirgsparametern auf die Penetration—Anwendungsbeispiel aus der Praxis; ETH Zürich: Zürich, Switzerland, 2012. [Google Scholar]
- Wannenmacher, H. The Influence of Rock and Rock Mass Properties towards Prediction of TBM Penetration Rates. Ph.D. Thesis, RWTH Aachen, Aachen, Germany, 2023. [Google Scholar]
- Wild, K. The Influence of Rock Mass Characteristics on TBM Penetration—A Case Study in the Nant de Drance Access Tunnel. Master’s Thesis, ETH Zürich, Zürich, Switzerland, 2012. [Google Scholar]
- Frenzel, C.; Galler, R.; Kaesling, H.; Villeneuve, M. Penetration tests for TBMs and their practical application Penetrationstests für Tunnelbohrmaschinen und deren Anwendung in der Praxis. Geomech. Tunnelbau 2012, 2012, 557–566. [Google Scholar] [CrossRef]
- Villeneuve, M. Hard rock tunnel boring machine penetration test as an indicator of chipping process efficiency. J. Rock Mech. Geotech. Eng. 2017, 9, 611–622. [Google Scholar] [CrossRef]
- Gong, Q.; Zhao, J.; Jiang, Y. In situ TBM penetration tests and rock mass boreability analysis in hard rock tunnels. Tunn. Undergr. Space Technol. 2007, 22, 303–316. [Google Scholar] [CrossRef]
- Gong, Q. Development of a rock mass characteristics model for TBM penetration rate prediction. Ph.D. Thesis, Nanyang Technological University, Nanyang, China, 2006. [Google Scholar]
- Türtscher, M. Analyse von Penetration und Vortriebsgeschwindigkeit Bei Maschinellen Vortrieben im Festgestein; Bauwirtschaft und Projektmanagement; Innsbruck University Press: Innsbruck, Austria, 2012; Volume 21. [Google Scholar]
- Festa, D.; Broere, W.; Bosch, J. An investigation into the forces acting on a TBM during driving—Mining the TBM logged data. Tunn. Undergr. Space Technol. 2012, 32, 143–157. [Google Scholar] [CrossRef]
- Heikal, G.; Erharter, G.; Marcher, T. A new parameter for TBM data analysis based on the experience of the Brenner Base Tunnel excavation. IOP Conf. Ser. Earth Environ. Sci. 2021, 833, 012158. [Google Scholar] [CrossRef]
- Schlicke, M. Entwicklung eines Modells zur Leistungsprognose von Tunnelbohrmaschinen in Hartgestein unter Einsatz künstlicher Intelligenz. Master’s Thesis, Technical University of Munich, Munich, Germany, 2022. [Google Scholar]
- Sharma, K.; Marjit, U.; Biswas, U. Efficiently Processing and Storing Library Linked Data using Apache Spark and Parquet. Inf. Technol. Libr. 2018, 37, 29. [Google Scholar] [CrossRef]
- ÖNORM B 2203-2; Untertagearbeiten—Werkvertragsnorm. Austrian Standards: Vienna, Austria, 2021.
- Chakraborty, S.; Bisai, R.; Palaniappan, S. Failure Modes of Rocks under Uniaxial Compression Tests: An Experimental Approach. J. Adv. Geotech. Eng. 2019, 2, 8. [Google Scholar] [CrossRef]
- Hoek, E.; Brown, E. The Hoek–Brown failure criterion and GSI—2018 edition. J. Rock Mech. Geotech. Eng. 2019, 11, 445–463. [Google Scholar] [CrossRef]
- Wannenmacher, H.; Hamdi, P.; Amann, F.; Marcher, T.; Frühwirt, T. The assessment of intact rock strength for penetration. In Expanding Underground—Knowledge and Passion to Make a Positive Impact on the World; CRC Press: Boca Raton, FL, USA, 2023; pp. 1494–1501. [Google Scholar] [CrossRef]


Disclaimer/Publisher’s Note: The statements, opinions and data contained in all publications are solely those of the individual author(s) and contributor(s) and not of MDPI and/or the editor(s). MDPI and/or the editor(s) disclaim responsibility for any injury to people or property resulting from any ideas, methods, instructions or products referred to in the content. |
© 2024 by the authors. Licensee MDPI, Basel, Switzerland. This article is an open access article distributed under the terms and conditions of the Creative Commons Attribution (CC BY) license (https://creativecommons.org/licenses/by/4.0/).
Share and Cite
Schlicke, M.; Wannenmacher, H.; Nübel, K. Advancing TBM Performance: Integrating Shield Friction Analysis and Machine Learning in Geotechnical Engineering. Geotechnics 2024, 4, 194-208. https://doi.org/10.3390/geotechnics4010010
Schlicke M, Wannenmacher H, Nübel K. Advancing TBM Performance: Integrating Shield Friction Analysis and Machine Learning in Geotechnical Engineering. Geotechnics. 2024; 4(1):194-208. https://doi.org/10.3390/geotechnics4010010
Chicago/Turabian StyleSchlicke, Marcel, Helmut Wannenmacher, and Konrad Nübel. 2024. "Advancing TBM Performance: Integrating Shield Friction Analysis and Machine Learning in Geotechnical Engineering" Geotechnics 4, no. 1: 194-208. https://doi.org/10.3390/geotechnics4010010